
Submitted:
25 October 2024
Posted:
28 October 2024
You are already at the latest version
Abstract
Mzuzu city is Malawi’s fastest growing city but this has brought with it degradation of its urban green infrastructure (UGI) which has contributed to the city’s increased vulnerability to climate change-related hazards such as flooding. Mzuzu’s major UGI, the Lunyangwa River basin (LR) and the Mzuzu Botanic Gardens (MBG), are particularly affected. Nature-based solutions (NBS), interventions that improve the flow of ecosystem services (ES) to enhance and strengthen urban resilience and sustainability at multiple scales, contribute to the restoration, protection and management of ecosystems to address ecological degradation. This study maps land use land cover changes (LULC) to explore the role of NBS interventions in addressing the city’s climate change adaptation and mitigation challenges. The study used remote sensing data obtained from satellite imagery to map spatio-temporal changes in LULC in Mzuzu city in general and the LR basin and MBG ecosystems in particular, over a period of 34 years from 1986 to 2020. The study found that the LR basin and MBG have undergone both formal and informal urban encroachment in some sections and that in these areas urban communities are more affected by flood-related disasters than in those where there has been little or no encroachment. The study concludes that mapping and quantifying urbanisation-driven LULC provides a spatial framework for identifying and targeting NBS interventions which involve urban green infrastructure restoration and protection to address the city’s vulnerability to climate change impacts such as flooding and mudslides.
Keywords:
nature-based solutions
; green infrastructure
; ecosystems
; land use land cover change
; urban encroachment
; urban resilience
; urban sustainability
; adaptation
; mitigation
; climate change
1. Introduction
Urbanisation has been associated with adverse environmental and ecological impacts which have had deleterious consequences on both urban nature and human well-being [1,2]. Globally, urban areas have been experiencing sustained land use land cover changes (LULC) which have given rise to the replacement of vegetated areas with impervious surfaces [1,3] and led to the degradation and loss of urban nature, with serious environmental and ecological consequences [4,5]. The rapid conversion of green spaces into built up areas and hard surfaces has resulted in a progressive fragmentation of green spaces and an irreversible change in urban morphology [6], leading to the degradation of nature both within and without cities [2,7,8,9], with undesirable consequences on urban ecosystems. Urban ecosystems play a crucial role in sustaining the welfare of urban communities through the provision of multiple ecosystem services (ES), some of which protect communities against flood risks, purify the air, regulate urban water and sequester carbon [10,11,12]. The loss and degradation of urban ecosystems has far reaching consequences on both urban nature and human lives, and has had significant implications on urban resilience and sustainability [13]. Sub-Saharan Africa (SSA) is currently the most rapidly urbanising regional in the world [14]. Poor regulation of urban development, dysfunctional urban governance, failure to adequately industrialise, and growing urban poverty, have combined to exacerbate the environmental impacts of urbanisation in SSA [15,16,17,18,19]. Rising urban informality and inequity in access to land, a distinct feature of urban expansion in SSA cities, have forced poor urban migrants to encroach on ecologically sensitive areas, such as wetlands, floodplains and riparian corridors, leading to increased vulnerability to hydrometeorological hazards [20,21]. This has given rise to calls for ecosystem-based planning approaches that integrate macro-scale landscape design principles that “foreground nature” [22] in the strategic planning of cities [23,24,25]. Urban green infrastructure (UGI) and nature-based solutions (NBS) have the potential to address the sustainability and urban resilience challenges that SSA cities are facing [5,20,26,28,29]. Mapping LULC changes using satellite imagery can provide a spatial framework for quantifying spatio-temporal changes in urban land use (including encroachment of ecologically sensitive areas), and for determining the right interventions to restore degraded ecosystems for urban resilience and sustainability purposes [30]. Nature-based solutions (NBS) and urban green infrastructure (UGI) play a significant role in addressing the challenges of environmental and ecological degradation arising from the urbanisation process [7,11,30]. Both NBS and UGI are interventions which utilize nature’s ecological functions to enhance urban resilience and advance urban sustainability and biodiversity goals [31].
Mzuzu City, located in Malawi’s northern region, is the fastest growing city in the country. The city’s rapid growth has brought with it a number of environmental challenges which have led to escalating degradation of its UGI, a key factor which, exacerbated by climate change, has contributed to its increased vulnerability to climate change-related hazards, such as flooding [32,33]. Specifically, the city’s major UGI – the Lunyangwa River (LR) basin – and the Mzuzu Botanic Gardens (MBG), are experiencing rapid degradation due to deforestation and encroachment [34]. This study maps land use land cover changes (LULC) in Mzuzu city to explore the role that NBS may play in restoring, protecting and managing the city’s degraded UGI for urban resilience and sustainability benefits. The study uses remote sensing data obtained from satellite imagery to map spatio-temporal changes in LULC in Mzuzu city in general and the LR basin and MBG ecosystems in particular, over a period of 34 years from 1986 to 2020. The objective is to establish a basis for understanding the potential role of UGI and NBS in addressing the city’s resilience challenges.
2. Urbanisation and Environmental Degradation in Malawi
Malawi is urbanising rapidly and its major cities are increasingly facing challenges emanating both from environmental degradation and climate change. One of the consequences of urbanisation in Malawi is the loss and degradation of the natural environment, which in return has resulted in adverse urban climate change impacts, such as the urban heat waves, increased flood risks, among others [33]. According to [33] ( p.3):
“Malawi’s urban centres are experiencing a loss and degradation in the quality of green infrastructure, such as (i) removal of trees and degradation / loss of natural forests due to construction and brick moulding; (ii) degradation of wetlands and water bodies due to sand mining and agriculture-related activities; and (iii) loss of riparian vegetation due to development and agricultural uses.”
The rapid loss and degradation of Malawi’s urban green infrastructure presents a number of challenges to urban ecosystems which provide a range of ecosystem services, including those that regulate climate change impacts. Malawi is one of the countries identified by the United Nations Framework Convention on Climate Change (UNFCC) as “most vulnerable” to climate change globally [35]. As a result of climate change and environmental degradation, Malawi is increasingly becoming prone to hydro-meteorological hazards, which have increased in both frequency and intensity over the past twenty years [35]. Land degradation in Malawi is “widespread and severe” with up to 60 percent of the country’s land mass affected by soil erosion and an annual loss of 29 tonnes of soil per hectare per year [35].
3. Urban Encroachment
The urban encroachment phenomenon has been scientifically studied by different researchers all over the world [20,37,38,39,40]. However, a coherent definition of the term has been elusive. Instead, urban encroachment has been characterised as one of the consequences of unregulated or poorly regulated urban growth, resulting either in expansion into “natural areas” which are unsuitable for settlement, or in the outward growth of a city into surrounding rural hinterlands, invariably resulting in the invasion of peri-urban land which had hitherto been reserved for agricultural or forestry purposes [20,38,39,40]. With the realisation that the degradation of a city’s green and blue spaces poses a considerable threat to ecosystems which are crucial for human welfare, such as urban water management and flood risk mitigation, attention has been drawn to the environmental and ecological impacts of unregulated urban expansion into “natural areas”, especially in SSA cities [20,26,31]. Natural areas are those areas within a city which comprise forests, biodiversity conservation gardens, water bodies and wetlands [20,24]. Encroachment on ecologically sensitive natural areas is said to be a common feature of urbanisation in economically challenged SSA countries where poor urban planning and ineffective governance regimes constrain equitable access to land by the urban poor [22,28,41]. To overcome the sustainability and resilience challenges posed by the consequences of encroachment on ecologically sensitive natural areas, urban ecologists and spatial planners have called for strategic planning approaches that restore, protect and manage such spaces through the agency of UGI and NBS [10,42,43]. This conceptualisation of urban encroachment has informed the current study.
4. Understanding the Synergies Between Urban Green Infrastructure and Nature-Based Solutions
Urban green infrastructure (UGI) and nature-based solutions (NBS) are two interrelated concepts which have advocated the use of nature to address the environmental and ecological consequences of global urbanisation [44,45,46]. The relationship between UGI and NBS is a complex one, but is rooted in the ecological synergies they share in order to enhance the protection, restoration and manage degraded ecosystems to deliver urban sustainability and resilience goals [47]. UGI has proven to be an elusive term whose meaning varies according to the geographical and academic contexts within which it is studied [45]. However, at a basic level, UGI is conceptualised as a network of green and blue spaces in urban areas [7,48]. These comprise urban forests, parks, gardens (green spaces), as well as open surface water bodies such as lakes, rivers, streams, wetlands, canals, ponds, water reserves (blue spaces). These perform various functions (referred to as ecosystem services) which benefit both nature and human beings [7,10,11]. Ecosystem services (ES) are categorized into specific benefits derived from natural ecosystems, which range from provisioning services, cultural services, regulating services, and supporting services [49]. Of particular attention in this paper are the regulating services derived from urban ecosystems. According to the Millennium Ecosystem Assessment [49], regulating ecosystem services are benefits derived from the regulation of ecosystem processes, which include climate change regulation, erosion control and water regulation. Urban vegetation is key to soil retention and prevention of landslides or mudslides, whilst also playing an important role in flood mitigation in contexts where land cover changes driven by urbanisation create vulnerabilities to climate-related hazards. NBS and UGI use nature to restore, protect and manage urban nature to prevent continued degradation and sustain a wide range of ES. Further, UGI is conceptualised as a green asset which provides a spatial framework within which nature-based solutions (NBS) could be implemented at a broader urban landscape scale to address specific urban challenges arising from ecosystems degradation and climate change [5,42,50]. Evidence from urban ecology literature suggests that UGI and NBS complement each other to enhance the provision of urban ecosystem services (ES) which deliver multiple benefits to urban residents, some of which may be crucial for urban climate change mitigation and adaptation [50,51].
Despite the synergies between the two concepts, there are marked differences. Whilst UGI is seen as a strategic planning tool with a focus on the planning of green spaces, NBS are multifunctional interventions which address multiple urban challenges simultaneously, requiring innovative and inclusive planning and governance approaches to ensure their societal impact and sustainability [30,43,44]. Widely seen as an umbrella concept, NBS is the latest addition to previous ecosystem-based concepts, such as green and blue infrastructure, ecosystem-based adaptation (EBA), ES, natural capital, ecosystem-based disaster risk reduction (ECO-DRR), landscape restoration, among others [45,52,53]. It is not surprising that, to some people, the similarities among the concepts are so striking as to cause confusion.
5. Materials and Methods
5.1. Study Site
This study was conducted in Mzuzu City in the northern region of Malawi (Figure 1). The specific sites are and the Lunyangwa River (LR) basin and the Mzuzu Botanic Gardens (MBG) (Figure 2).
Mzuzu City is Malawi’s third largest city with an estimated population of 221,272 people according to the 2018 National Housing and Population Census [54]. From its humble beginnings as a trading centre servicing a tung oil industry established by the British Commonwealth Development Corporation in 1947, the centre was declared a municipality in 1980 and a city in 1985 [55]. Mzuzu’s growth has accelerated from approximately 40,000 people when it was declared as a city in 1985, to an estimated 221,272 people in 2018 [54]. With an annual growth rate of 5.4% per annum [54], Mzuzu is the fastest growing city in Malawi. However, most of the city’s growth has been characterised by informality, with 60% of the population estimated to live in informal settlements characterised by inadequate infrastructural services and high poverty levels [55]. The Draft Mzuzu City State of Environment Report for 2019 points out that environmental degradation in the city is “alarming” and that this is caused by urban encroachment and the city residents’ over-reliance on biomass as a source of energy for domestic purposes [56]. The LR and MBG ecosystems have been chosen as study sites as they have witnessed significant encroachment from formal and informal urbanisation processes.
The Lunyangwa River (LR) has its source in the Kaningína Forest and runs west-ward, thus roughly bisecting the city into two halves. The LR catchment is the source of piped water supply to Mzuzu City. The Gulliver Dam, the city’s major water reservoir operated by the Northern Region Water Board (NRWB), is located on the upper catchment area of the river. Due to urban encroachment and deforestation affecting the Lunyangwa River catchment and the nearby Kaning’ina Forest, the NRWB has been concerned about the decline in water quality and quantity in its major water catchment area for Mzuzu City, and has established a community-based catchment management framework to stem the degradation of this important ecosystem [34]. The MBG is one of the three botanic gardens in Malawi whose main purpose is to conserve Malawi’s biological diversity and protect endangered and rare plant species. It sits on 584 hectares of land and is located to the west of Kaning’ina forest reserve, a large expanse of green space which demarcates the eastern and south-eastern boundaries of Mzuzu City.
Mzuzu City’s boundaries have been extended formally and informally since its declaration as a city in 1985. Within that time, there have been three attempts (in 1989, 1995 and 2014) to prepare urban structure plans to guide the city’s development [57]. However, the 1995 plan remains the only strategic city development plan that has ever been approved and gazetted by the government of Malawi [57]. The 1995 plan expired in 2010 and its draft successor, prepared in 2014, is yet to be gazetted [57]. This provides a context for “quiet encroachment” and “conflicting rationalities” in the city’s development trajectory [57].
Mzuzu city’s topography is varied. To the east and south-east, the topography is largely influenced by the high altitude Viphya highlands, which are defined by mountainous terrain with dissected, deep gorges to the south-east and south-west [57]. Immediately to the west of the highlands, the city descends into undulating, low-lying terrain which culminates in the LR flood plain. The topography rises again as one approaches the west and north-west regions of the city, but not as steeply as in the eastern and south-eastern regions. The city’s dramatic topographic features are illustrated in Figure 3 below.
Although Mzuzu City is informally referred to as “the green city”, its UGI are facing escalating environmental degradation due to rapid urbanisation and poor land management practices [33].
5.2. Research Design
This study uses a quantitative approach to quantify the extent and degree of LULC in the Mzuzu City over a 34-year period. This forms the basis for exploring the role that UGI and NBS may play in addressing the ecological degradation challenges posed by urban encroachment. The study utilised satellite imagery to quantify land use land cover changes (LULC) in the city from 1986 to 2020. Satellite images were analysed using ArcGIS and changes in vegetation cover were sequenced over the 38-year period. Ethical clearance to undertake the study was obtained from the Mzuzu University Ethical Clearance Committee.
5.3. Data Collection Sources, Image Classification and Software Used
The study used Landsat imagery from the United States Geological Survey (USGS) portal (https://earthexplorer.usgs.gov/) for the years 1986, 2000 and 2020 (Table 1). To enhance analysis, additional data for the years 1986 and 2000 were also collected. These datasets included classified maps detailing various land cover types, such as vegetation, water bodies, built-up areas, bare land and crop land.
5.4. Land Cover Classification
The analysis involved classifying high-resolution satellite images into different land cover classes. QGIS version 3.34.9, an open-source Geographic Information System (GIS) software, was used for classification, spatial analysis and visualisation. Five land cover classes were derived from the image classification process: water body, vegetation, built up area, bare land and crop land. A summary description of each of the land cover classes is in Table 2 below. Training areas (representative samples for each land cover class in the digital image) were used for the classification of the images. The image classification software used training samples to identify the land cover classes in the entire image. Training areas were selected from the images using the semi-automatic plugin in QGIS and these were modified/adjusted using the same tool. After the selection of the training samples, supervised classification was carried out using the maximum likelihood algorithm. This was done to obtain better classification results.
5.5. Data Pre-Processing and Land Cover Classification
To maintain data accuracy, the satellite images underwent extensive pre-processing to minimise errors, including atmospheric correction (aimed at removing the effects of atmospheric conditions like clouds, which may affect the reflectance values of the satellite sensors); radiometric correction (normalisation happened to ensure that images taken under different lighting conditions, like time of day or season, are comparable by adjusting the brightness and contrast); and geometric correction (georeferencing the image to actual projection). These steps were essential to minimise distortions and ensure consistency across different time periods. The images were then reprojected to a uniform coordinate system (WGS 84 / UTM zone 36S) for accurate comparison and land cover classification was performed using supervised classification techniques in QGIS 3.34, validated with ground truth data to ensure reliability.
5.6. Change Detection and Calculations
Land cover changes were detected through overlay analysis in QGIS. This involved comparing maps from different years to quantify changes in area and percentage for each land cover class. Key metrics such as Annual Land Change Area (ALCA) and Annual Land Change Rate (ALCR) were calculated to assess the rate and extent of changes over time. These calculations provide details of how the land cover has changed over time. The ALCA represents the average area of land change per year, while the ALCR shows the average percentage change in land cover per year.
The ALCA is calculated using the formula:
ALCA = ΔA / Δt
Annual Land Change Rate (ALCR) is calculated using the formula:
ALCR = ([(ΔA) / (A₀)] / (Δt)) ×100
Where:
ΔA is the change in area, representing the difference between the final and initial areas of a land cover class over a specific time period.
A₀ is the initial area. Initial area is the area of the land cover class at the beginning of the time period.
Δt represents the change in time (number of years). This is the length of the time period being analysed.
The results were visualized through land cover change maps, charts and tables. The spatial-temporal changes observed were interpreted to understand the implications for land management and environmental planning. Anomalies and unexpected results were cross-checked with historical records to ensure accuracy.
5.7. Accuracy Assessment of Image Classification for the Years 1986, 2000 and 2020
Accuracy assessment is used to evaluate the reliability of image classification results and it helps to quantify the degree to which the classification agrees with reference data. The image classification process involved five classes and the kappa coefficient was used as a key metric to measure the accuracy. The kappa coefficient values for the classified images of 1986, 2000 and 2020 were all above 83% (see Table 4, Table 5 and Table 6). This value shows that there is a strong agreement between the classified images and the reference data. The accuracy assessments for the classified images of 1986, 2000 and 2020 demonstrate a strong agreement between the classification results and the reference data, with overall accuracies exceeding 94% and kappa coefficients above 0.83. These results indicate that the classification process was reliable and that the image data for each year were accurately categorised into the five classes used in the analysis.
5.8. Data Analysis
Data analysis involved classifying high-resolution satellite images into different land cover classes. QGIS version 3.34.9, an open-source Geographic Information System (GIS) software, was used for classification, spatial analysis and visualisation. Land cover changes were detected through overlay analysis in QGIS. This involved comparing maps from different years to quantify changes in area and percentage for each land cover class. Key metrics such as Annual Land Change Area (ALCA) and Annual Land Change Rate (ALCR) were calculated to assess the rate and extent of changes over time. The results were visualized through land cover change maps, charts and tables.
6. Results
This study used satellite imagery to map changes in land use and land cover in Mzuzu City for the years 1986, 2000 and 2020. Through the use of QGIS version 3.34.9 software, spatio-temporal changes in land cover and land use have been analysed and interpreted. A long-term change analysis approach was adopted to quantify patterns of urban growth, and ultimately quantify urbanisation-driven impacts, such as environmental degradation and encroachment on ecologically sensitive spaces, since Mzuzu was declared as a city in 1985. Whilst land use land cover changes are consequential to urban growth, sustained encroachment of ecologically sensitive urban zones (which should be protected from degradation) is a cause for concern from an urban resilience and sustainability perspective.
6.1. Land Use Land Cover Classification and Interpretation (Mzuzu City Overall)
The general pattern of LULC changes between 1986 and 2020 has been marked by significant increases in built up areas and decreases in vegetative cover. Figure 4 depicts the detected LULC changes for 1986, 2000 and 2020.
Land cover change quantification for 1986, 2000 and 2020 is summarised in Table 7.
In 1986, Mzuzu City was predominantly covered by cropland (49.37%) and vegetation (45.64%). Built-up areas accounted for only 4.83% of the land, while bare land was minimal at 0.16%. This is barely surprising given that Mzuzu had only been declared as a city the previous year (1985). The urban population at that time was approximately 40,000. Although urban settlement in the area goes back to 1955 when the British colonial authorities relocated their regional administrative offices to Mzuzu following the establishment of a tung oil plantation in the area, urban growth had been slow and the area was largely rural with significant vegetative cover and cropland.
By 2000, there were significant LULC changes. Vegetation decreased to 39.98% and cropland also reduced to 38.10%. In contrast, built-up areas expanded dramatically to 16.16%, reflecting increased urbanisation. Bare land also increased to 5.75%, suggesting land degradation or deforestation. Water bodies were by this time detectable, having previously been obscured by vegetation. This is an indicator of vegetation loss along Mzuzu’s water courses. Water bodies accounted for 0.009% of the land area.
The trend towards vegetaion loss and increase in built up areas continued at a rapid pace in the following years. By 2020, built-up areas further expanded to 31.33% from 16.15% in 2000. Vegetation cover continued to decline to 28.78% from 39.98% in 2000. Cropland slightly decreased to 37.22% from 38.104% in 2000. Water bodies became more visible, again, an indication of continued loss of vegetation along the city’s natural water courses. There was a slightl increase in the visibility of water bodies, from 0.009% in 2000 to 0.015% in 2020.
6.2. Overal Change Detection between 1986 and 2020
Land cover change detection for Mzuzu addresses key questions about where and how much land use has changed between 1986 and 2020. Figure 5 illustrates land cover changes over the 34-year period between 1986 and 2020. Table 8 quantifies land cover conversions to each of the four land cover classifications within the same period.
6.2.1. Water Bodies
The land cover change to water bodies during this period was minimal, with only 0.013 sq.km (0.009%) of the land transitioning to water bodies. This indicates very limited expansion or creation of water bodies in Mzuzu during this period. However, caution must be taken when interpreting this land cover change. Water bodies were not detected in the 1986 satellite imagery due to the relatively rich vegetative cover along the major river courses. Water bodies could only be detected from the 2000 satellite imagery going forward. This further attests to the rapid decline in vegetative cover which happened between 2000 and 2020.
6.2.2. Vegetation
A significant area of 56.70 sq.km (39.98% of Mzuzu City’s land area) was covered by vegetation in 2000, representing a substantial portion of the landscape. However, by 2020, vegetation cover reduced to 40.81 sq.km (28.78% of the land area), showing a sustained decline from the earlier period. This contrasts sharply with built up area, which increased from 16.16% of the land area in 2000 to 31.33% in 2020. The sustained decline in vegetative cover has resulted in significant encroachment on land which was previously under vegetation, especially along the Lunyangwa and Chingámbo river corridors as well as the western and north-western sides of the Mzuzu Botanic Gardens, where there is a noticeable encroachment of bareland and cropland.
6.2.3. Built-Up Areas
The built-up areas increased noticeably, with 22.91 sq.km (16.16%) of land transitioning to urban or developed land by 2000. By 2020, built-up areas experienced substantial growth, with 43.43 sq.km (31.33%) of the land converted to built up area. This indicates significant urban expansion and development in Mzuzu over the 34 years. However, most of the urban expansion has resulted in encroachment on Mzuzu City’s urban green spaces such as the Lunyanga and Chingámbo river corridors and the Mzuzu Botabnic Gardens.
6.2.4. Bare Land
Bare land (exposed open areas) covered 54.04 sq.km (38.10%) by 2000, indicating significant areas of land that were degraded or cleared of vegetation. By 2020, bare land slightly decreased to 52.79 sq.km (37.22%). This slight reduction in 20 years reflects the continued urbanisation growth rates which have exposed previously vegetated land to pressure from urban encroachment. As noted above, the northern and eastern side of the Mzuzu Botanic Gardens experienced most of the conversion to bare land by 2020, a reflection of the increasing incidences of encroachment and land pressures in this area.
6.2.5. Cropland
In 2000, cropland saw a moderate increase, covering 8.16 sq.km (5.75% of the city area). This suggests some expansion of agricultural activities during this period, though less extensive than other land cover changes. However, by 2020, cropland had decreased to 3.77 sq.km (2.66% of the city area), indicating a reduction in agricultural land use over this time. This is due to a shift towards urban development and a decline in amount of land available for urban agriculture.
6.3. Land Use Land Cover Classification and Interpretation–LR Basin and MBG
Satellite imagery for 1986, 2000 and 2020, covering the Lunyangwa River basin and the Mzuzu Botanic Gardens show significant changes in vegetation cover and encroachment by built up areas on these ecosystems. This is evident from Figure 6 and Figure 7 below.
6.3.1. Encroachment on the Lunyangwa River Basin
In 1986, vegetation in the LR basin was the predominant land cover, occupying 27.74% of the area, while bare land was the most extensive category at 58.59%. Built-up areas were relatively limited at 13.23%, and cropland was minimal, covering just 0.44%. This distribution indicated a landscape predominantly characterized by natural and undeveloped land. By 2000, there was a significant transformation in the land cover. Vegetation decreased slightly to 26.66%, while bare land reduced substantially to 28.55%. The most marked change was in the increase of built-up areas, which increased to 36.66%, reflecting considerable urban encroachment. Cropland also saw a rise to 8.12%, indicating an expansion in agricultural activities. In 2020, vegetation decreased to 25.39% and bare land fell further to 22.11%, illustrating ongoing reductions in natural and undeveloped areas. The most significant transition was the increase in built-up areas, which reached 50.18%, indicating ongoing urban encroachment.. Cropland decreased to 2.22%, highlighting a reduction in land used for urban agriculture.
Note that in the land cover analysis, the water body class was not visible in the 1986 and 2000 images due to the river being obscured by vegetation, such as grass or trees. This limitation in visibility meant that any water bodies present along the Lunyangwa River were not clearly identified in those earlier years. However, the 2020 image provided a clearer view, revealing patches of water bodies at 0.09% of the area. This visibility in 2020 suggests that while the river may have existed in 1986 and 2000, it was covered or masked by vegetation in those images. The detection of water bodies in 2020 could indicate changes in vegetation cover and urban encroachment that made the water body more detectable. This reflects a trend toward increased urbanisation and a reduction in natural vegetation and agricultural land, with the new visibility of water bodies highlighting changes in the land that were previously obscured.
6.3.2. Encroachment on the Mzuzu Botanic Gardens
The analysis of LULCC around and within the Botanic Garden in Mzuzu City from 1986 to 2020 reveals important trends that reflect significant shifts. In 1986, the region was predominantly covered by vegetation, accounting for 69.48% of the total area, equivalent to 12.82 km². This indicates that the area was largely natural and well forested. Bare land, which covered 28.31% (5.22 km²), was also significant, likely representing open or undeveloped areas. Built-up areas were minimal, covering only 2.18% (0.40 km²) and cropland was nearly nonexistent, occupying just 0.03% (0.006 km²).

Table 10.
Land cover change quantification along the MBG – 1986, 2000 and 2020.
| Year | Land Cover Class | Percentage | Area (km²) |
|---|---|---|---|
| 1986 | Vegetation | 69.48 | 12.82 |
| Built-up | 2.18 | 0.40 | |
| Bare land | 28.31 | 5.22 | |
| Crop land | 3.01 | 0.006 | |
| 2000 | |||
| Vegetation | 69.05 | 12.739 | |
| Built-up | 5.11 | 0.943 | |
| Bare land | 22.83 | 4.665 | |
| Crop land | 3.01 | 0.555 | |
| 2020 | |||
| Vegetation | 61.38 | 11.325 | |
| Built-up | 6.60 | 1.217 | |
| Bare land | 30.88 | 5.698 | |
| Crop land | 1.14 | 0.210 |
By the year 2000, noticeable changes had occurred in the land cover around and within the Botanic Garden. Vegetation still dominated the area but had slightly decreased to 69.05% (12.739 km²). The reduction, though minimal, suggests the beginning of a shift away from natural land cover and emerging encroachment. Meanwhile, built-up areas increased significantly to 5.11% (0.943 km²), indicating a rise in urban encroachment, some of which was “formal”, arising from demarcation of land by the Mzuzu City Council on land which they claim to belong to them, but was once part of the MBG. Cropland also expanded to 3.01% (0.555 km²), reflecting an increase in peri-uban agriculture on the northern and eastern fringes of the region. Interestingly, bare land decreased to 22.83% (4.665 km²), possibly due to the conversion of open spaces into either built-up areas or cropland.
In 2020, vegetation cover decreased further to 61.38% (11.325 km²), marking a significant reduction from previous years. This points to an increase in urban encroachment at the expense of natural habitats.
Built-up areas around the MBG continued to increase, reaching 6.60% (1.217 km²), signaling continued urban encroachment around the Gardens. Cropland, on the other hand, showed a reduction to 1.14% (0.210 km²), indicating a possible shift away from agriculture, perhaps due to urban expansion. Additionally, bare land increased again to 30.88% (5.698 km²), which may be linked to land degradation or the abandonment of previously utilised land. The fluctuating pattern in cropland and bare land underpins the dynamic nature of land use change in the area.
7. Discussion
Remote sensing data from satellite imagery is an important tool for detecting LULC changes over time [68]. Significant LULC changes have been detected throughout Mzuzu City between 1986, 2000 and 2020. A notable shift towards a decline in the quantity of vegetative cover and other natural areas with a corresponding intensification of built-up areas, has been observed. These findings are consistent with a 2023 study by Nazombe and Nambazo [69] which used satellite imagery to map LULC changes across the four major cities in Malawi - Blantyre, Lilongwe, Mzuzu and Zomba. The study found that all four cities had experienced a significant fragmentation and decrease in green spaces between 1986 and 2021 due to rapid urbanisation and a failure to prioritise the protection of green spaces by urban authorities. The decline in vegetative cover and increase in urban encroachment has been particularly notable within the ecologically sensitive areas along the LR basin and the MBG. This validates previous studies which have pointed out the growing problem of ecological degradation in Malawi’s cities, including Mzuzu City [27,33,34,35]
The loss and degradation of vegetation in the LR basin has been significant. In 1986, vegetation in the LR basin was the predominant land cover, occupying 69.48% of the LR basin. Built-up areas were relatively limited at 2.18%. However, by 2000, vegetation had decreased slightly to 69.05% before decreasing further to 61.38% in 2020. Built-up areas in 2000 occupied 5.11% of the basin area and increased to 6.60% in 2020, representing a 203% increase in built area within the ecologically sensitive rea in 34 years from 1986 to 2020. This represents significant encroachment on the LR basin. The continued loss of vegetation within the upper catchment area of the LR basin poses questions on the effectiveness of the catchment co-management framework which was established by the NRWB to work collaboratively with local communities to reduce degradation within the catchment [36]. This study shows continued encroachment and degradation within the LR basin.
The results show that the amount of vegetation within and around the MBG has been declining though not at as rapid a pace as that experienced along the LR basin. There is increased urban encroachment and land use conversion to bare land despite efforts by the MBG management to conserve the ecosystem. The amount of vegetation cover in the MBG has decreased over the years. Whilst 69.48% of the land was covered in vegetation in 1986, this decreased to 69.05% and 61.38% in 2000 and 2020, respectively. However, the built-up area increased from 0.40% of the land in 1986, to 0.94% and 1.27% in 2000 and 2020, respectively. Encroachment on the MBG and the resultant significant decline in vegetation cover and sustained increase in built-up areas has far-reaching ecological consequences on Mzuzu City. The MBG ecosystem plays an important role in the provision of ES which are crucial for air quality, retention of rain water, erosion control, food provisioning, urban water supply, among others. The MBG is the source of four streams which flow into Chingámbo River, an important tributary to the LR. The four streams – named Mganthira, Mtawa, Kathethekapsya and Kamsikiza – are perennial streams (preserved by the vegetation) which significantly contribute to the supply of potable water to Mzuzu City by the NRWB, though they are less well known to the urban community. Continued encroachment and degradation of the MBG poses a significant threat to urban water supply and the other ES that the MBG avails to the city residents.
It is evident that rapid urbanisation is exerting pressure on land and the city authorities are struggling to accommodate the rising population on formally planned settlements, hence the ever-increasing levels of encroachment on ecologically sensitive land. The city’s population had more than doubled in twenty years, from 1998 to 2018. The city’s population grew from 110, 628 people in 1998, to 133,968 people and 221,272 in 2008 and 2018, respectively [54]. The 2008 to 2018 intercensal period registered the fastest intercensal population change since the city was established (Table 11). This confirms the city’s status as the most rapidly urbanising city in Malawi.
The degradation of UGI in Mzuzu City poses sustainability and resilience challenges for the city. There is evidence that the city is becoming increasingly susceptible to climate-change related hazards which have in return increased incidences and severity of natural disasters such as flooding [34,35]. Urban encroachment along the ecologically sensitive LR basin has exposed the poor communities who established informal housing settlements along the LR basin in settlements such as Ching’ambo, Zolozolo West, Chiputula, Chibanja and Salisburyline, to increased vulnerability to climate change related hazards such as floods. In April 2016, the city experienced its worst floods in recent history when 15 settlements were inundated by flood waters, resulting in 19,000 people being displaced and 7 people killed [34]. Recently in 2023, heavy tropical rains caused severe flooding in the city whose damage to life and property is yet to be quantified but is consistent with the severity and extent of what has now become an annual pattern of destructive floods which have affected the city. Although Mzuzu is often informally referred to as the “green city”, rapid deforestation, poor land management practices and destruction of ecosystems are factors which have rendered it susceptible to shocks caused by severe flooding [35].
Rapid population growth and poor land governance structures in SSA cities have fueled environmental degradation, calling for strategic planning approaches which address the sustainability and urban resilience challenges posed by the phenomenon [22,26]. There is a growing body of research evidence emanating from the Global North, which suggests that the sustainability and resilience challenges caused by ecological degradation can be effectively addressed through the two interrelated concepts of urban green infrastructure (UGI) and nature-based solutions (NBS). However, the novelty of these concepts in Malawi and other SSA countries means that their efficiency for urban resilience is not well understood and is therefore not prioritised by urban policy makers [9,17]. The two concepts advocate the restoration, protection and management of nature to address the consequences of environmental degradation and deliver urban sustainability and resilience goals [66]. UGI and NBS complement each other in the provision of ecological services (ES) which benefit both nature and human beings [49,53,55]. It is the argument of this paper that sustainably addressing the consequences of environmental degradation and encroachment on the LR basin and the MBG requires harnessing the regulating ecosystem services derived from UGI and NBS approaches.
8. Conclusion
Mapping and quantifying urbanisation-driven LULC provides a spatial framework for identifying and targeting NBS interventions which involve the restoration and protection of urban green infrastructure. In this study, LULC changes in Mzuzu City over a period of 34 years, have been quantified, mapped and analysed using satellite imagery and GIS. The reason for quantifying, analysing and mapping LULC in the city over a long period of time was to understand the impacts of urban expansion on the city’s green infrastructure. The study found that urban expansion has resulted in encroachment on ecologically sensitive areas, such as the Lunyangwa River basin and the Mzuzu Botanic Gardens. These ecosystems play an important role in flood mitigation and water quality management for the city. Encroachment on these ecosystems has negative implications on urban sustainability and resilience. The study suggests that NBS and UGI are important strategic planning tools for sustainably addressing ecological degradation and urban residents’ growing vulnerability to climate change related impacts such as flooding.
Author Contributions
Conceptualization, methodology, software, data analysis and original draft preparation, Loudon Luka; supervision, review of draft and project coordination, Mtafu Manda. Both authors have read and agreed to the published version of the manuscript.
Funding
This research was funded by the German Federal Ministry of Education and Research under the Challenges for Inclusive Urban Development in Africa: Designing Nature Based Solutions and Enhancing Citizenship to Mitigate Hazards and Livelihood Risks (CHIDA) project.
Institutional Review Board Statement
This study received ethical clearance from the Mzuzu University Research Ethics Committee on 7 February 2024 under Ref MZUNIREC/DOR/24/08.
Informed Consent Statement
Informed consent was obtained from all subjects involved in the study in accordance with protocol MZUNIREC/DOR/24/08.
Data Availability Statement
Satellite imagery data used in this study was obtained from the United States Geological Survey (USGS) portal (https://earthexplorer.usgs.gov/).
Conflicts of Interest
The authors declare no conflicts of interest. The funders had no role in the design of the study; in the collection, analyses, or interpretation of data; in the writing of the manuscript; or in the decision to publish the results.
References
- Pedersen Zari, M. Ecosystem services analysis in response to biodiversity loss caused by the built environment. SAPIENS [Online] 2014 URL: http://journals.openedition.org/sapiens/1684.
- Kiunsi, B., Pelling, M., Roberts, D., Selecki, W., Urban areas: In Cliamate Change 2014: Impacts, adaptation and vulnerability, Part A: Global and Sectorial Aspects. Contriution of Working Group II to the Fifth Asssessment Report of the Intergovernmental Panel on Climate Change [Field, C.B., V.R. Baros, D.J. Tokkien, K.J.C Mach, M.D. Mastrandrea, R.C. Genova, B. Girma, .S. Kissel, A.N Levy. S. McCracken, P.R Mastrandrea, and L.L. White (eds). Cambridge University Press, UK and NY, pp. 535 - 612.
- Lu, D., Mansel, P., Brondizio, E., Moran, E. Change detection techniques. International Journal of Remote Sensing 2004 25(12), pp. 2365–2401. doi: 10.1080/0143116031000139863. [CrossRef]
- Cox, D. T., Shanahan, D., Hudson, H., Fuller, R., Gaston, K. The impact of urbanisation on nature dose and the implications for human health. Landscape and Urban Planning 2018, 179, pp. 72–80. doi: 10.1016/j.landurbplan.2018.07.013. [CrossRef]
- Ferreira, L. M., Esteves, L., de Souza, E., dos Santos, C. Impact of the Urbanisation Process in the Availability of Ecosystem Services in a Tropical Ecotone Area. Ecosystems 2019 22(2), pp. 266–282. doi: 10.1007/s10021-018-0270-0. [CrossRef]
- Pauleit, S., Fryd, O., Backhaus, A., Jenson, M, 2013. Green infrastructure to face climate change in an urbanising world. In: Loftness, V., Sustainable Built Environment (e-Book available at https://doi.org/10.1007/978-1-0716-0684-1), pp. 206–234. [CrossRef]
- Elmqvist, T., Redman, C., Berthel, S., Costanza, R. History of urbanisation and the missing ecology. In Elmqvist, T., Fragkias, M., Goodness, J., Gunelrap, B., Eds., 2013 Urbanisation, biodiversity and ecosystem services: Challenges and opportunities - a global assessment (e-Book). Springer, NY. doi: 10.1007/978-94-007-7088-1. [CrossRef]
- Roy, M., Shemdoe, R., Hulme, D., Mwageni, N., Gough, A. Climate change and declining levels of green structures: Life in informal settlements of Dar es Salaam, Tanzania’, Landscape and Urban Planning 2018, pp. 282–293. doi: 10.1016/j.landurbplan.2017.11.011. [CrossRef]
- Pauleit, S., Vasquez, A., Sreetheran, M., Liu, L., Cilliers, S. Urban green infrastructure in the Global South. In: Shackleton, C., Cilliers, S., Davoren, E., du Toit, M., eds. Urban Ecology in the Global South 2021. Springer Nature, Switzerland. https://doi.org/10.1007/978-3-030-67650-6. [CrossRef]
- Haase, D., Integrating ecosystem services, green infrastructure and Nature-based Solutions: New perspectives in sustainable urban management. In Weith, T., Barkman, T., Gaasch, N., Rogga, S., Strauss, C., Zscheichler. Eds., Sustainable Land Management in a European Context: A Co-design Approach. 2021 (e-Book). Springer,Switzerland. https://doi.org/10.1007/978-3-030-50841-8. [CrossRef]
- Pedersen Zari, M. Ecosystem services analysis: Mimicking ecosystem services for regenerative urban design’, International Journal of Sustainable Built Environment 2015 4(1), pp. 145–157. doi: 10.1016/j.ijsbe.2015.02.004. [CrossRef]
- Bolund, P. and Hunhammar, S. Ecosystem services in urban areas. Ecological Economics 1999 29, pp. 293-301.
- Elmqvist, T., Setala, H., Handel, S., van der Ploeg, S., Aronson, J., Blignaut, J., Gomez-Baggethun, E., Nowak, D., Kronenberg, J., de Groot, R. Benefits of restoring ecosystem services in urban areas. Current Opinion in Environmental Sustainability 2015 14, pp. 101–108. doi: 10.1016/j.cosust.2015.05.001. [CrossRef]
- UN-Habitat 2020, World Cities Report, 2020: The value of sustainable development. UN Human Settlements Programme, Nairobi, Kenya.
- Moser, C. and Satterthwaite, D. 2008 Human Settlements Discussion Paper Series Theme : Climate Change and Cities - 3 Towards pro-poor adaptation to climate change in the urban centres of low- and middle-income countries. Available at: http://pubs.iied.org/pdfs/10564IIED.pdf.
- Bauer, S. and Scholz, I. Adaptation to climate change in Southern Africa: New boundaries for sustainable development. Climate and Development 2010, 2(2), pp. 83–93. doi: 10.3763/cdev.2010.0040. [CrossRef]
- du Toit, M., Cilliers, S., Dallimer, M., Goddard, M., Guenet, S., Cornelius, S. Urban green infrastructure and ecosystem services in sub-Saharan Africa’, Landscape and Urban Planning 2018 180(June), pp. 249–261. doi: 10.1016/j.landurbplan.2018.06.001. [CrossRef]
- Kamara, J., Akambi, B., Agho, K., Renzaho, A. Resilience to climate-induced disasters and its overall relationship to well-being in southern africa: A mixed-methods systematic review. International Journal of Environmental Research and Public Health, 2018 15(11). doi: 10.3390/ijerph15112375. [CrossRef]
- Haase, D. et al. (2014) ‘A quantitative review of urban ecosystem service assessments: Concepts, models, and implementation’, Ambio, 43(4), pp. 413–433. doi: 10.1007/s13280-014-0504-0. [CrossRef]
- Andreasen, M. H., Agergaard, J., Koffie, R., Moller-Jensen, L., Otten-Ababio, M. Urban encroachment in ecologically sensitive areas: drivers, impediments and consequences. Buildings and Cities 2022 3(1), pp. 920–938. doi: 10.5334/bc.210. [CrossRef]
- Herslund, L., Backhaus, A., Fryd, O., Jorgensen, G., Jensen, M., Limbumba, T., Liu, L., Mkupasi, M., Workamalehu, L., Yeshitela, K. Conditions and opportunities for green infrastructure – Aiming for green, water-resilient cities in Addis Ababa and Dar es Salaam. Landscape and Urban Planning 2018 180, pp. 319–327. doi: 10.1016/j.landurbplan.2016.10.008. [CrossRef]
- Pineda-Pinto, M., Frantzeskaki, N. and Nygaard, C. A. The potential of nature-based solutions to deliver ecologically just cities: Lessons for research and urban planning from a systematic literature review’, Ambio, 2022 51(1), pp. 167–182. doi: 10.1007/s13280-021-01553-7. [CrossRef]
- Lindley, S., Pauleit, S., Yeshitela, K., Cilliers., S., Shackleton, C. Rethinking urban green infrastructure and ecosystem services from the perspective of sub-Saharan African cities. Landscape and Urban Planning 2018. doi: 10.1016/j.landurbplan.2018.08.016. [CrossRef]
- Connop, S., Vandergert, P., Eisenberg, B., Collier, M., Nash, C., Clough, J., Newport, D. Renaturing cities using a regionally-focused biodiversity-led multifunctional benefits approach to urban green infrastructure. Environmental Science and Policy 2016 62, pp. 99–111. doi: 10.1016/j.envsci.2016.01.013. [CrossRef]
- Albert, C., Schroter, B., Haase, D., Brillinger, M., Henze, J., Herrmann, S., Gottwald, S., Guerrero, P., Noicolas, C., Matzdorf, B. Planning nature-based solutions: Principles, steps, and insights. Ambio 2021 50(8), pp. 1446–1461. doi: 10.1007/s13280-020-01365-1. [CrossRef]
- Ayers, J. and Dodman, D. Climate change adaptation and development: The state of the debate. Progress in Development Studies 2010, 10(2), pp. 161–168. doi: 10.1177/146499340901000205. [CrossRef]
- Titz, A. and Chiotha, S. Pathways for sustainable and inclusive cities in Southern and Eastern Africa through Urban green infrastructure. Sustainability (Switzerland) 2019 11(10). doi: 10.3390/su11102729. [CrossRef]
- Ferreira, C., Kalamantari, Z., Hartmann, T., Pereira, P. eds. Nature-based Solutions for Flood Mitigation: Enviromental and Socio-economic Aspects. Hdb Env Chem 2022 107 (pp.59-78). DOI 10.1007/698_2021_758. [CrossRef]
- Pauleit, S., Hansen, R., Rall, E, Rolf, W. Urban green infrastructure: strategic planning of urban green and blue spaces for multiple benefits. In: Douglas, I., Anderson, P., Goode, D., Houck, M., Maddox, D., Nagendra, H., Puay, Y. (Eds.). The Routledge Handbook of Urban Ecology 2nd ed. 2020 Routledge, London pp. 931-941.
- Jones, L., Anderson, S., Laessoe, J. A typology for urban Green Infrastructure to guide multifunctional planning of nature-based solutions. Nature-Based Solutions 2022 2, p. 100041. doi: 10.1016/j.nbsj.2022.100041. [CrossRef]
- Elmqvist, T., Setala, H., Handel, S., van der Ploeg, S., Aronson, J., Blignaut, J., Gomez-Baggethun, E., Nowak, D., Kronenberg, J., de Groot, R. Benefits of restoring ecosystem services in urban areas. Current Opinion in Environmental Sustainability 2015 14, pp. 101–108. doi: 10.1016/j.cosust.2015.05.001. [CrossRef]
- Kita, S. M. Urban vulnerability, disaster risk reduction and resettlement in Mzuzu city, Malawi. International Journal of Disaster Risk Reduction 2017 22, pp. 158–166. doi: 10.1016/j.ijdrr.2017.03.010. [CrossRef]
- Afionis, S., Mkwambisi, D. D. and Dallimer, M. Lack of Cross-Sector and Cross-Level Policy Coherence and Consistency Limits Urban Green Infrastructure Implementation in Malawi. Frontiers in Environmental Science 2020, doi: 10.3389/fenvs.2020.558619. [CrossRef]
- Wanda, E. M. M., Gulula, L. C. and Kushe, J. An assessment of effectiveness of the Lunyangwa River catchment co-management model in Mzuzu City, Northern Malawi. Physics and Chemistry of the Earth 2010 72, pp. 96–103. doi: 10.1016/j.pce.2014.10.003. [CrossRef]
- World Bank , Malawi Country Environmental Analysis. 2019 doi: 10.1596/31326. [CrossRef]
- Schensul, D., Mkwambisi, D., Zhang, S., Dodman, D., Munthali, T., Matekenya, D. Adapting Urban Settlements to Climate Change: Local Vulnerability and Adaptive Capacity in the Urban Areas of Malawi. The Demography of Adaptation to Climate Change 2013, pp. 115–137.
- Herslund, L. B. et al. (2016) ‘A multi-dimensional assessment of urban vulnerability to climate change in Sub-Saharan Africa’, Natural Hazards, 82, pp. 149–172. doi: 10.1007/s11069-015-1856-x. [CrossRef]
- El-Raay, M., Fouda, Y., Gal, P., GIS for environmental assessment of the impacts of urban encroachment on Rosetta Region, Egypt. Env Mon & Ass 2000 60, pp. 217-233.
- Rayner, L., Ikin, K., Maldwyn J., Evans, M., Gibbons, P., Lindenmayer, D., Manning, A. Avifauna and urban encroachment in time and space. Diversity Distrib. 2015 21 pp. 428-440.
- Tambolini, I., Zambon, I., Rontos, K., Salvati, L. Urban encroachment, land use and demographic change: empirical evidence from Italy. Int. J Ecol. Econ. Stat. 2018 39(4).
- Liu, S., Zhang, J., Geng, Y., Li, J., Wang, Y., Zhang, J., Plausible response of urban encroachment on ecological land to tourism growth and implications for sustainable amangement. Ecological Indicators 2021. 132(108253).
- Guneralp, B., Reba, M., Hales, B., Wentz, E., Seto, K. Trends in urban land expansion, density and land transitions from 1970 to 2010. Environ. Res. Lett. 2020 15 04015.
- Langemeyer, J. and Baró, F. (2021) ‘Nature-based solutions as nodes of green-blue infrastructure networks: A cross-scale, co-creation approach’, Nature-Based Solutions, 1(June), p. 100006. doi: 10.1016/j.nbsj.2021.100006. [CrossRef]
- Lin, T., Cai, J., Geng, H., Zheng, Y., Zeng, Z., Incorporating suburban cropland into urban green infrastructure: A perspective of nature-based solutions in China. Nature-Based Solutions 2024. doi: 10.1016/j.nbsj.2024.100122Lin et al., 2024. [CrossRef]
- Dorst, H., Van der Jagt, A., Raven, R., Runhaar, H. Urban greening through nature-based solutions – Key characteristics of an emerging concept. Sustainable Cities and Society 2019 49(May), p. 101620. doi: 10.1016/j.scs.2019.101620. [CrossRef]
- Matsler, A., Meerow, S., Mell, I., Pavao-Zuckerman, M. A “green” chameleon: Exploring the many disciplinary definitions, goals, and forms of “green infrastructure”. Landscape and Urban Planning, 2021 214, p. 104145. doi: 10.1016/j.landurbplan.2021.104145. [CrossRef]
- Herslund, L., Backhaus, A., Fryd, O., Jorgensen, G., Jensen, M., Limbumba, T., Liu, L., Mkupasi, M., Workamalehu, L., Yeshitela, K. Conditions and opportunities for green infrastructure – Aiming for green, water-resilient cities in Addis Ababa and Dar es Salaam. Landscape and Urban Planning 2018 180, pp. 319–327. doi: 10.1016/j.landurbplan.2016.10.008. [CrossRef]
- McPhearson, T., Kabisch, N. and Frantzeskaki, N. Nature-based solutions for cities 2023. Edward Elgar Publishing Limited.
- Tzoulas, K., Korpela, K., Venn, S., Yli-Pelkonnen, V., Kazmiercczak, A., Niemela, J., James, P. Promoting ecosystem and human health in urban areas using Green Infrastructure: A literature review, Landscape and Urban Planning 2007 81(3), pp. 167–178. doi: 10.1016/j.landurbplan.2007.02.001. [CrossRef]
- Millennium Ecosystem Assessment Board Ecosystems and Human Well-being: A Framework of Assessment 2003. World Resources Institute, Washington, DC.
- Young, R., Zanders, K., Leberknecht, K., Fassmann-Back. A comprehensive typology for mainstreaming urban green infrastructure. Journal of Hydrology 2014. doi: http://dx.doi.org/10.1016/j.jhydrol.2014.05.048. [CrossRef]
- Raymond, C. M., Frantzeskaki, N., Kabisch, N., Berry, P., Breil, M., Nita, M., Geneletti, D., Clafapienta, C. A framework for assessing and implementing the co-benefits of nature-based solutions in urban areas. Environmental Science and Policy 2017 77(July), pp. 15–24. doi: 10.1016/j.envsci.2017.07.008. [CrossRef]
- Chausson, A., Turner, B., Seddon, D., Chabaneix, N., Girardin, C., Kapos, V., Key, I., Roe,.D., Smith, A., Woroniecki, S., Seddon, N. Mapping the effectiveness of nature-based solutions for climate change adaptation. Global Change Biology 2020 26(11), pp. 6134–6155. doi: 10.1111/gcb.15310. [CrossRef]
- National Statistical Office. Malawi Population and Housing Census Report 2018 Main Report 2019. http://www.nsomalawi.mw/images/stories/data_on_line/demography/census_2018/2018 Malawi Population and Housing Census Main Report.pdf.
- UN-Habitat. Mzuzu Urban Profile 2011 Nairobi, Kenya.
- Mzuzu City Council. Draft State of the Environment Report 2019.
- Manda, M. C. Understanding the conext of informality: Urban planning under different land tenure systems in Mzuzu City, Malawi. 2019, PhD Thesis, University of Cape Town.
- Mzuzu City Council. Draft Urban Structure Plan 2014 - 2030 2014.
- Afionis, S., Mkwambisi, D. D. and Dallimer, M. (2020) ‘Lack of Cross-Sector and Cross-Level Policy Coherence and Consistency Limits Urban Green Infrastructure Implementation in Malawi’, Frontiers in Environmental Science, 8(November). doi: 10.3389/fenvs.2020.558619. [CrossRef]
- Nazombe, K., and Nambazo, O. Monitoring and assessment of urban green space loss and fragmentation using remote sensing data in the four cities of Malawi from 1986 to 2021. Scientific African 2023 20 e01639. https://doi.org/10.1016/j.sciaf.2023.e01639. [CrossRef]
Figure 1.
Map of Malawi showing Mzuzu City.
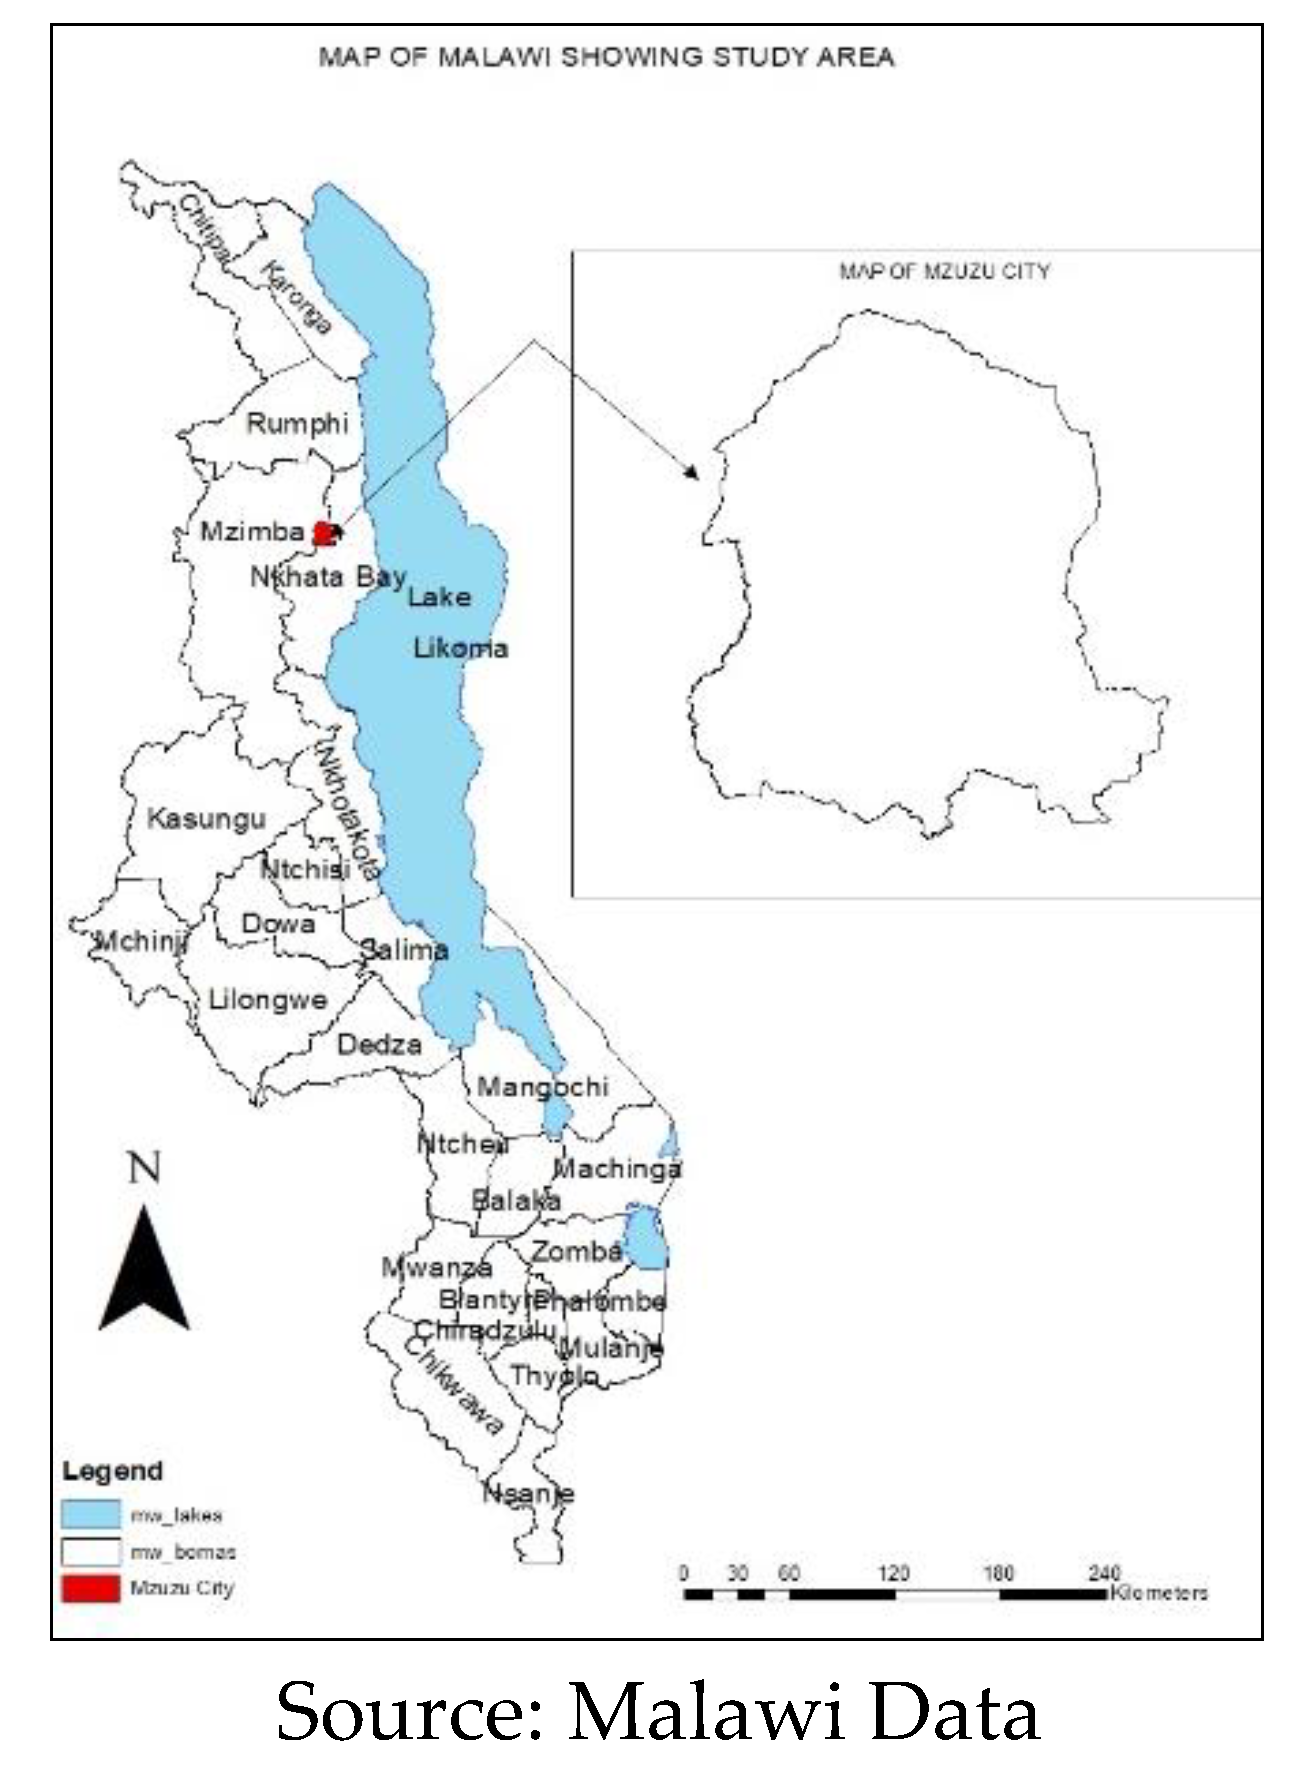
Figure 2.
Map of Mzuzu city showing main UGI – MBG and LR.
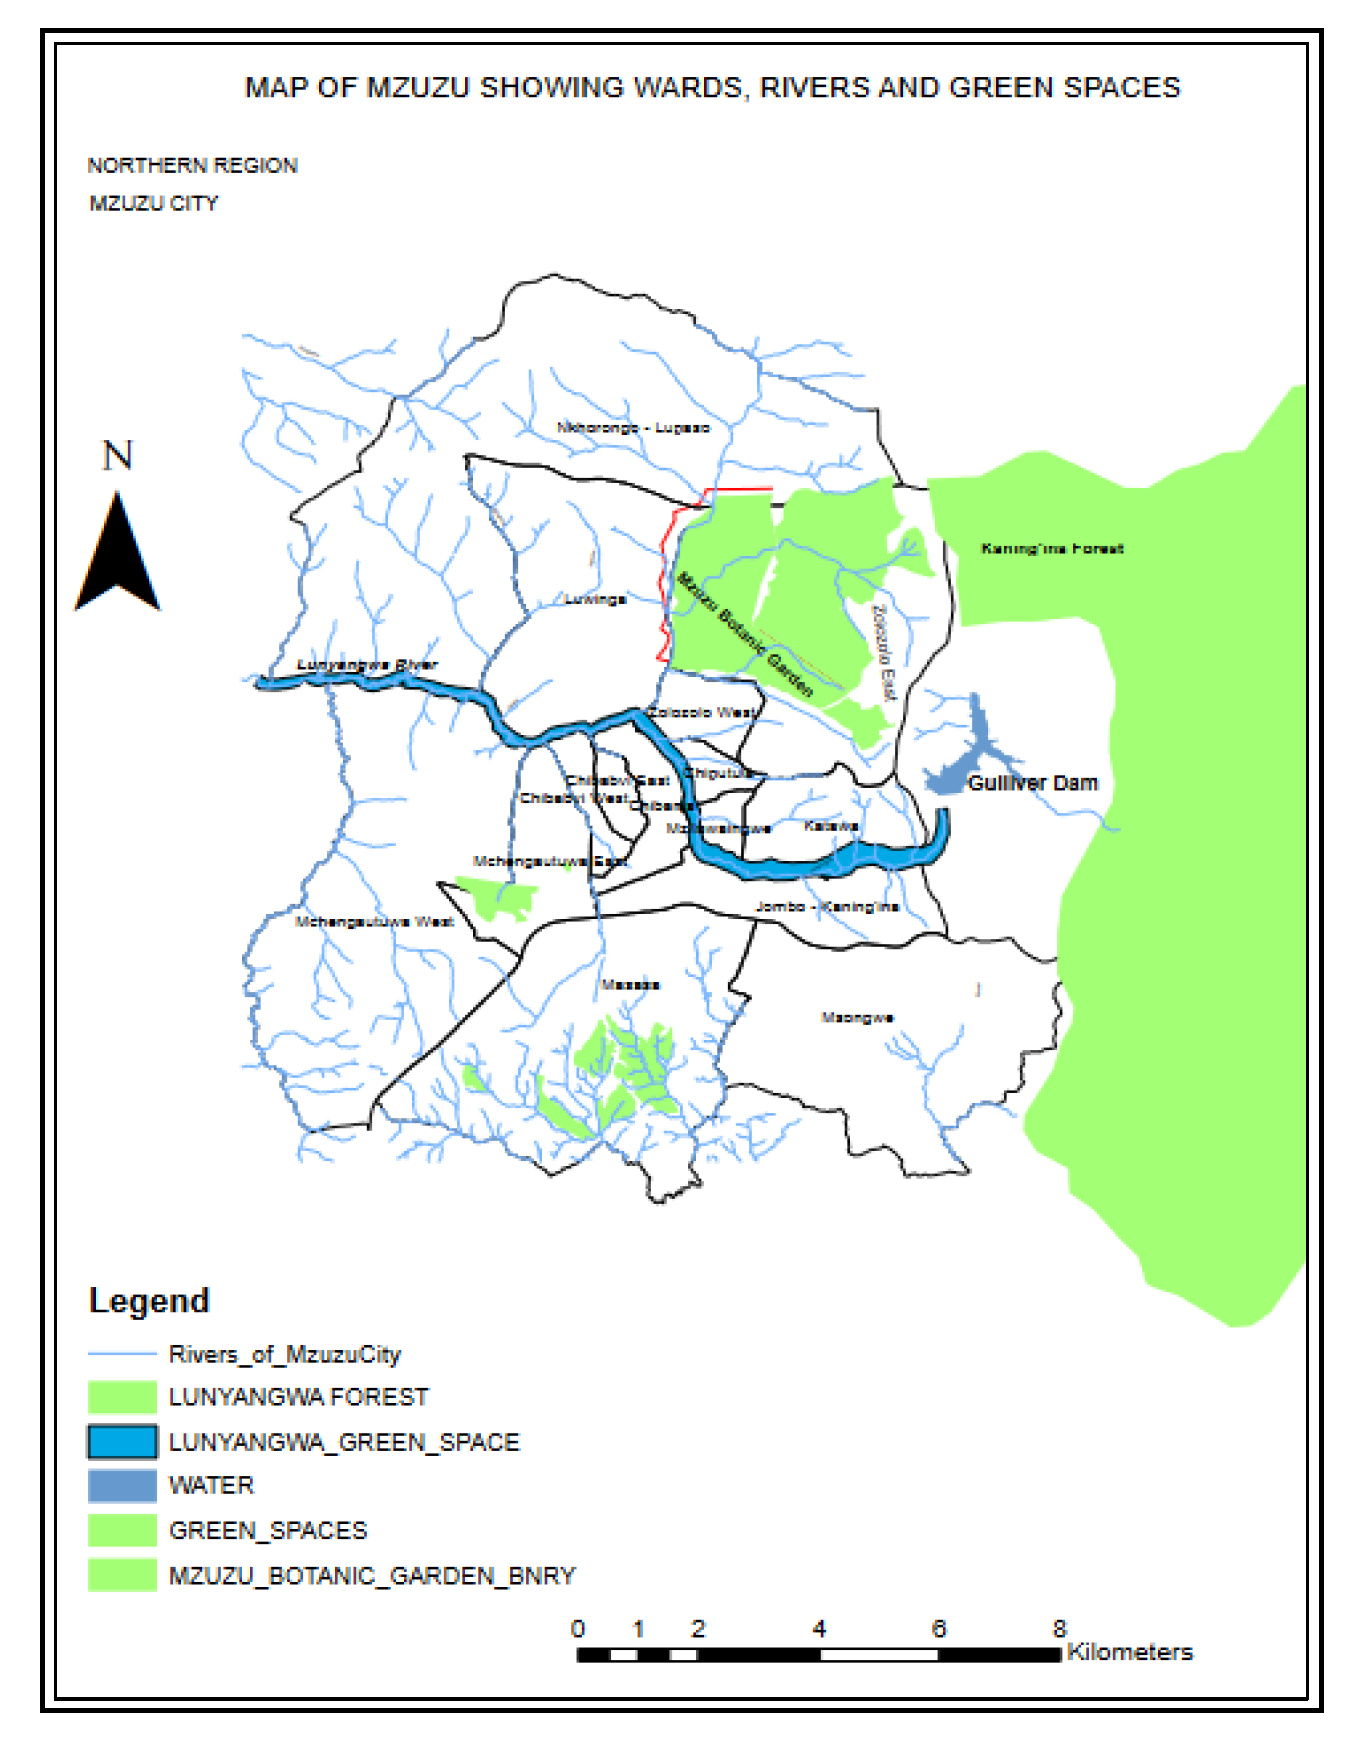
Figure 3.
Topographic map of Mzuzu City.
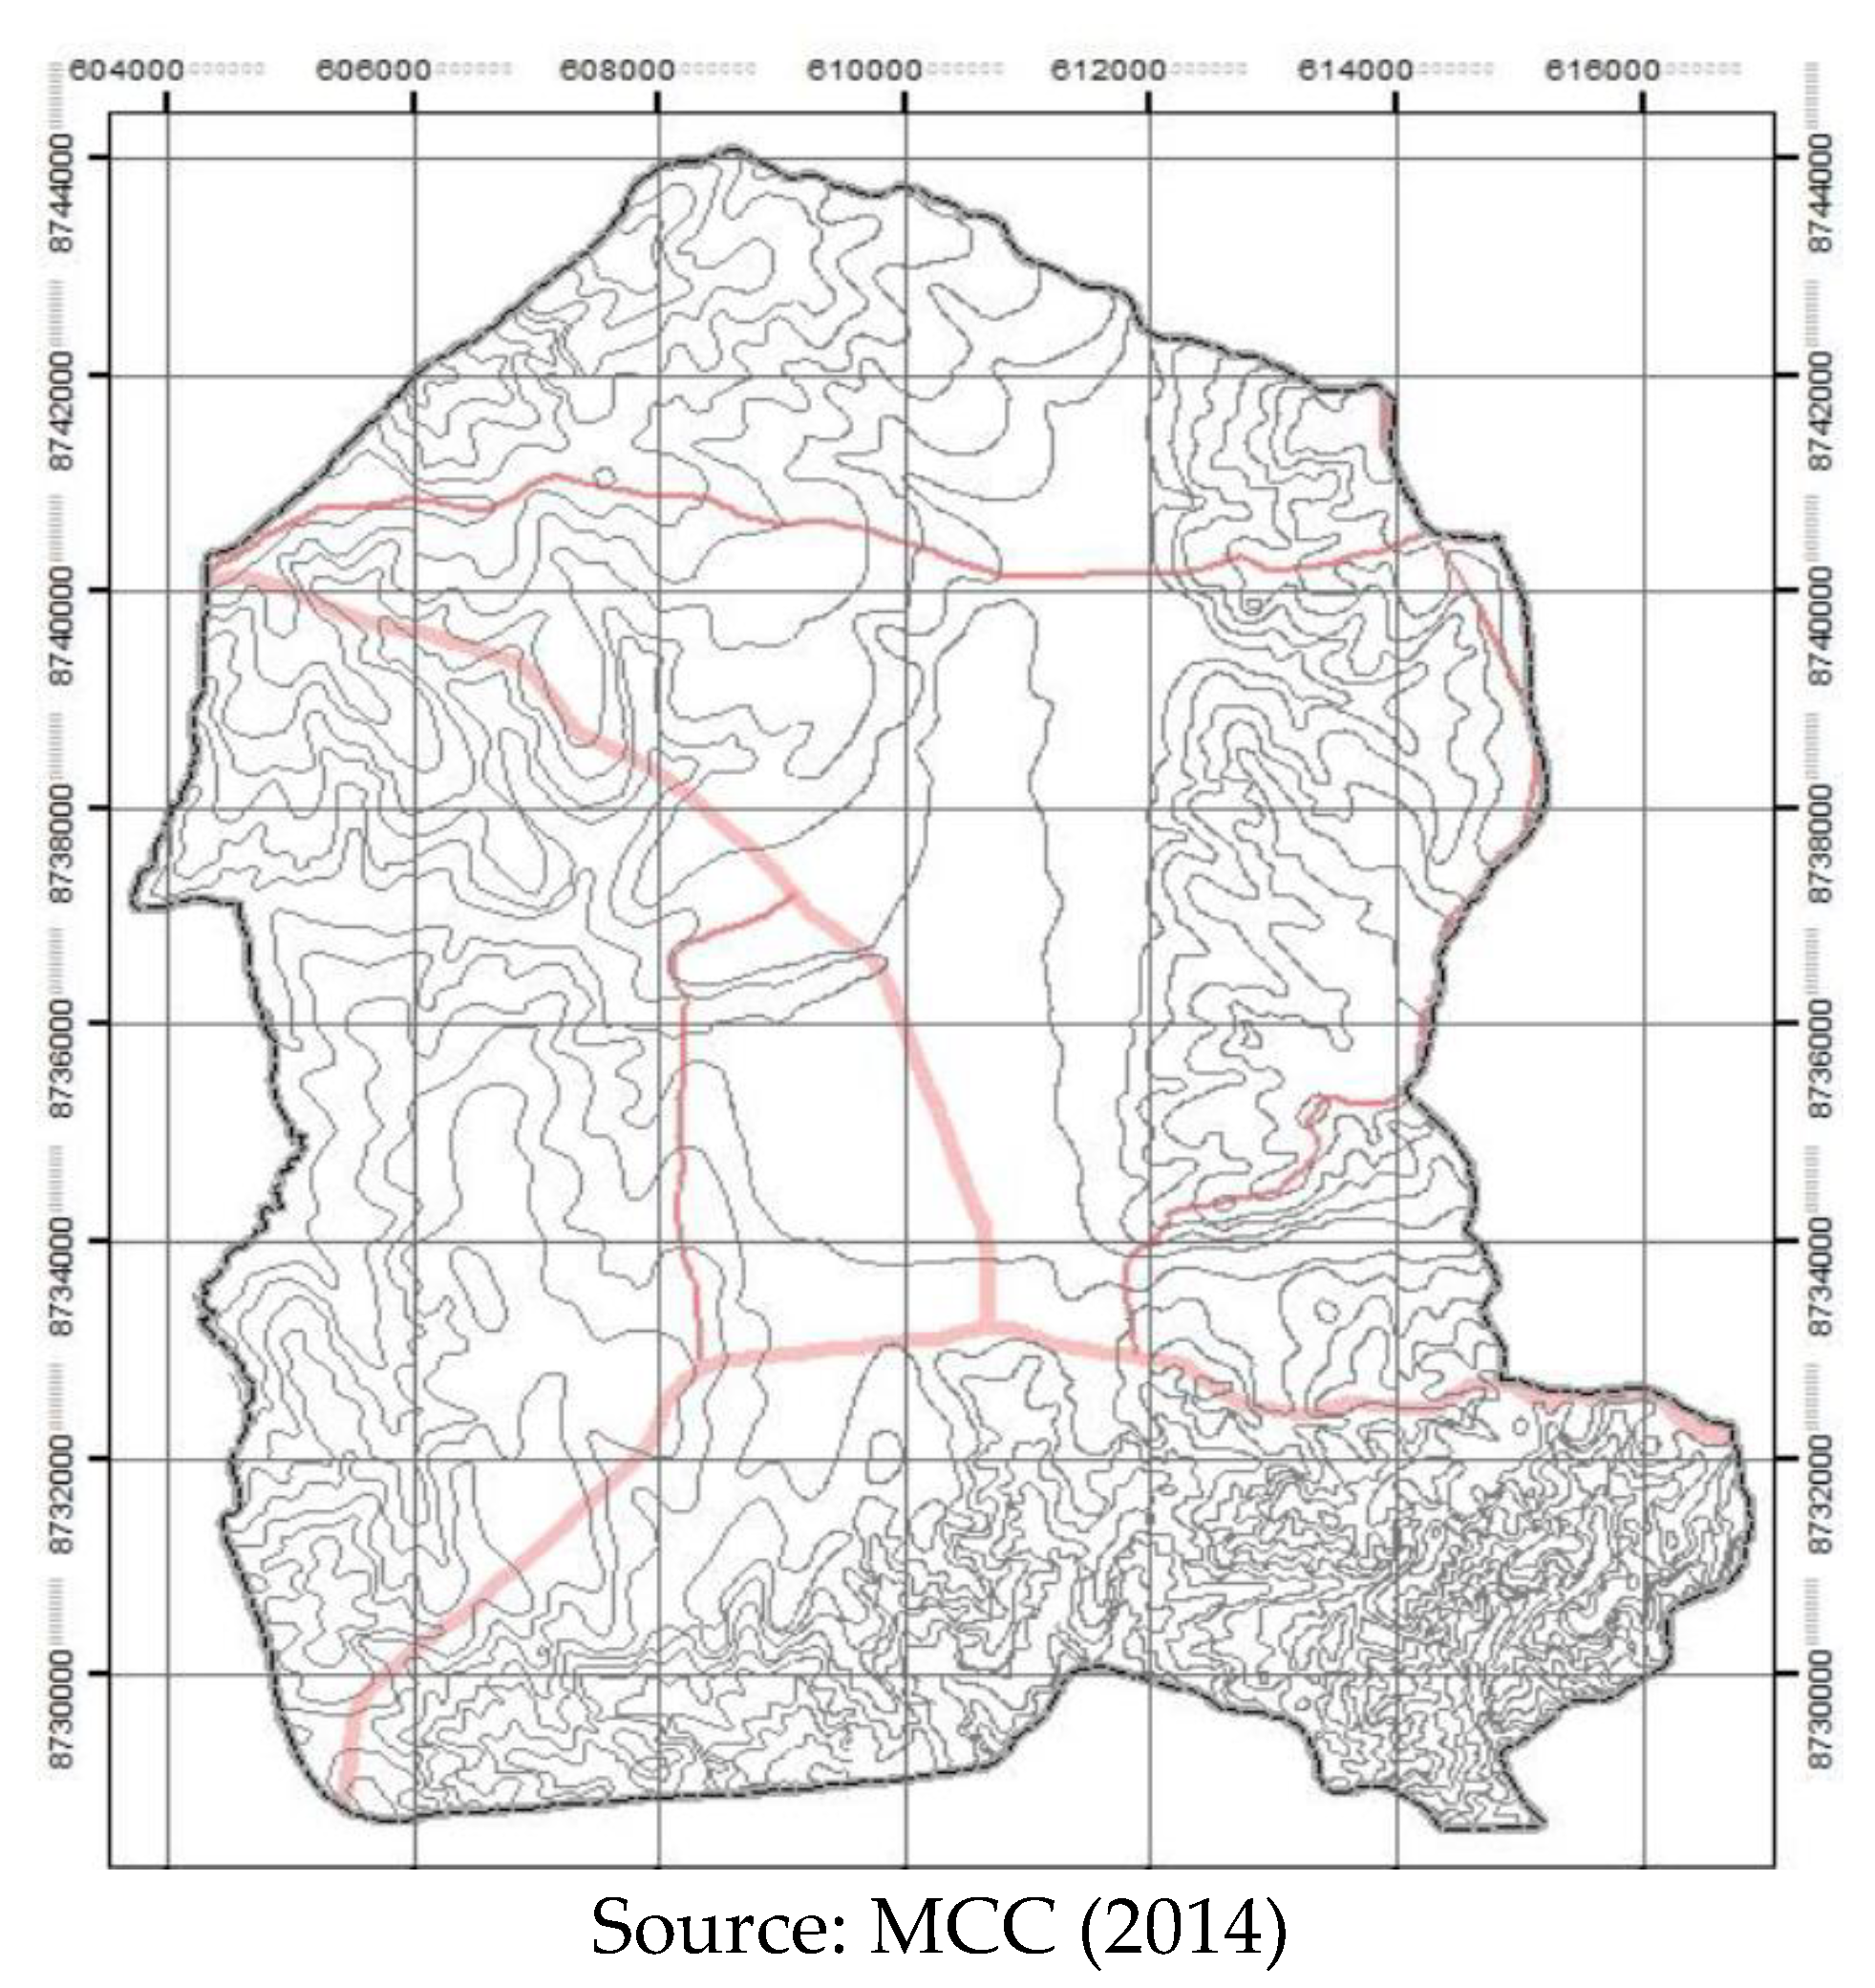
Figure 4.
Land use land cover changes in Mzuzu City: 1986, 2000 and 2020.
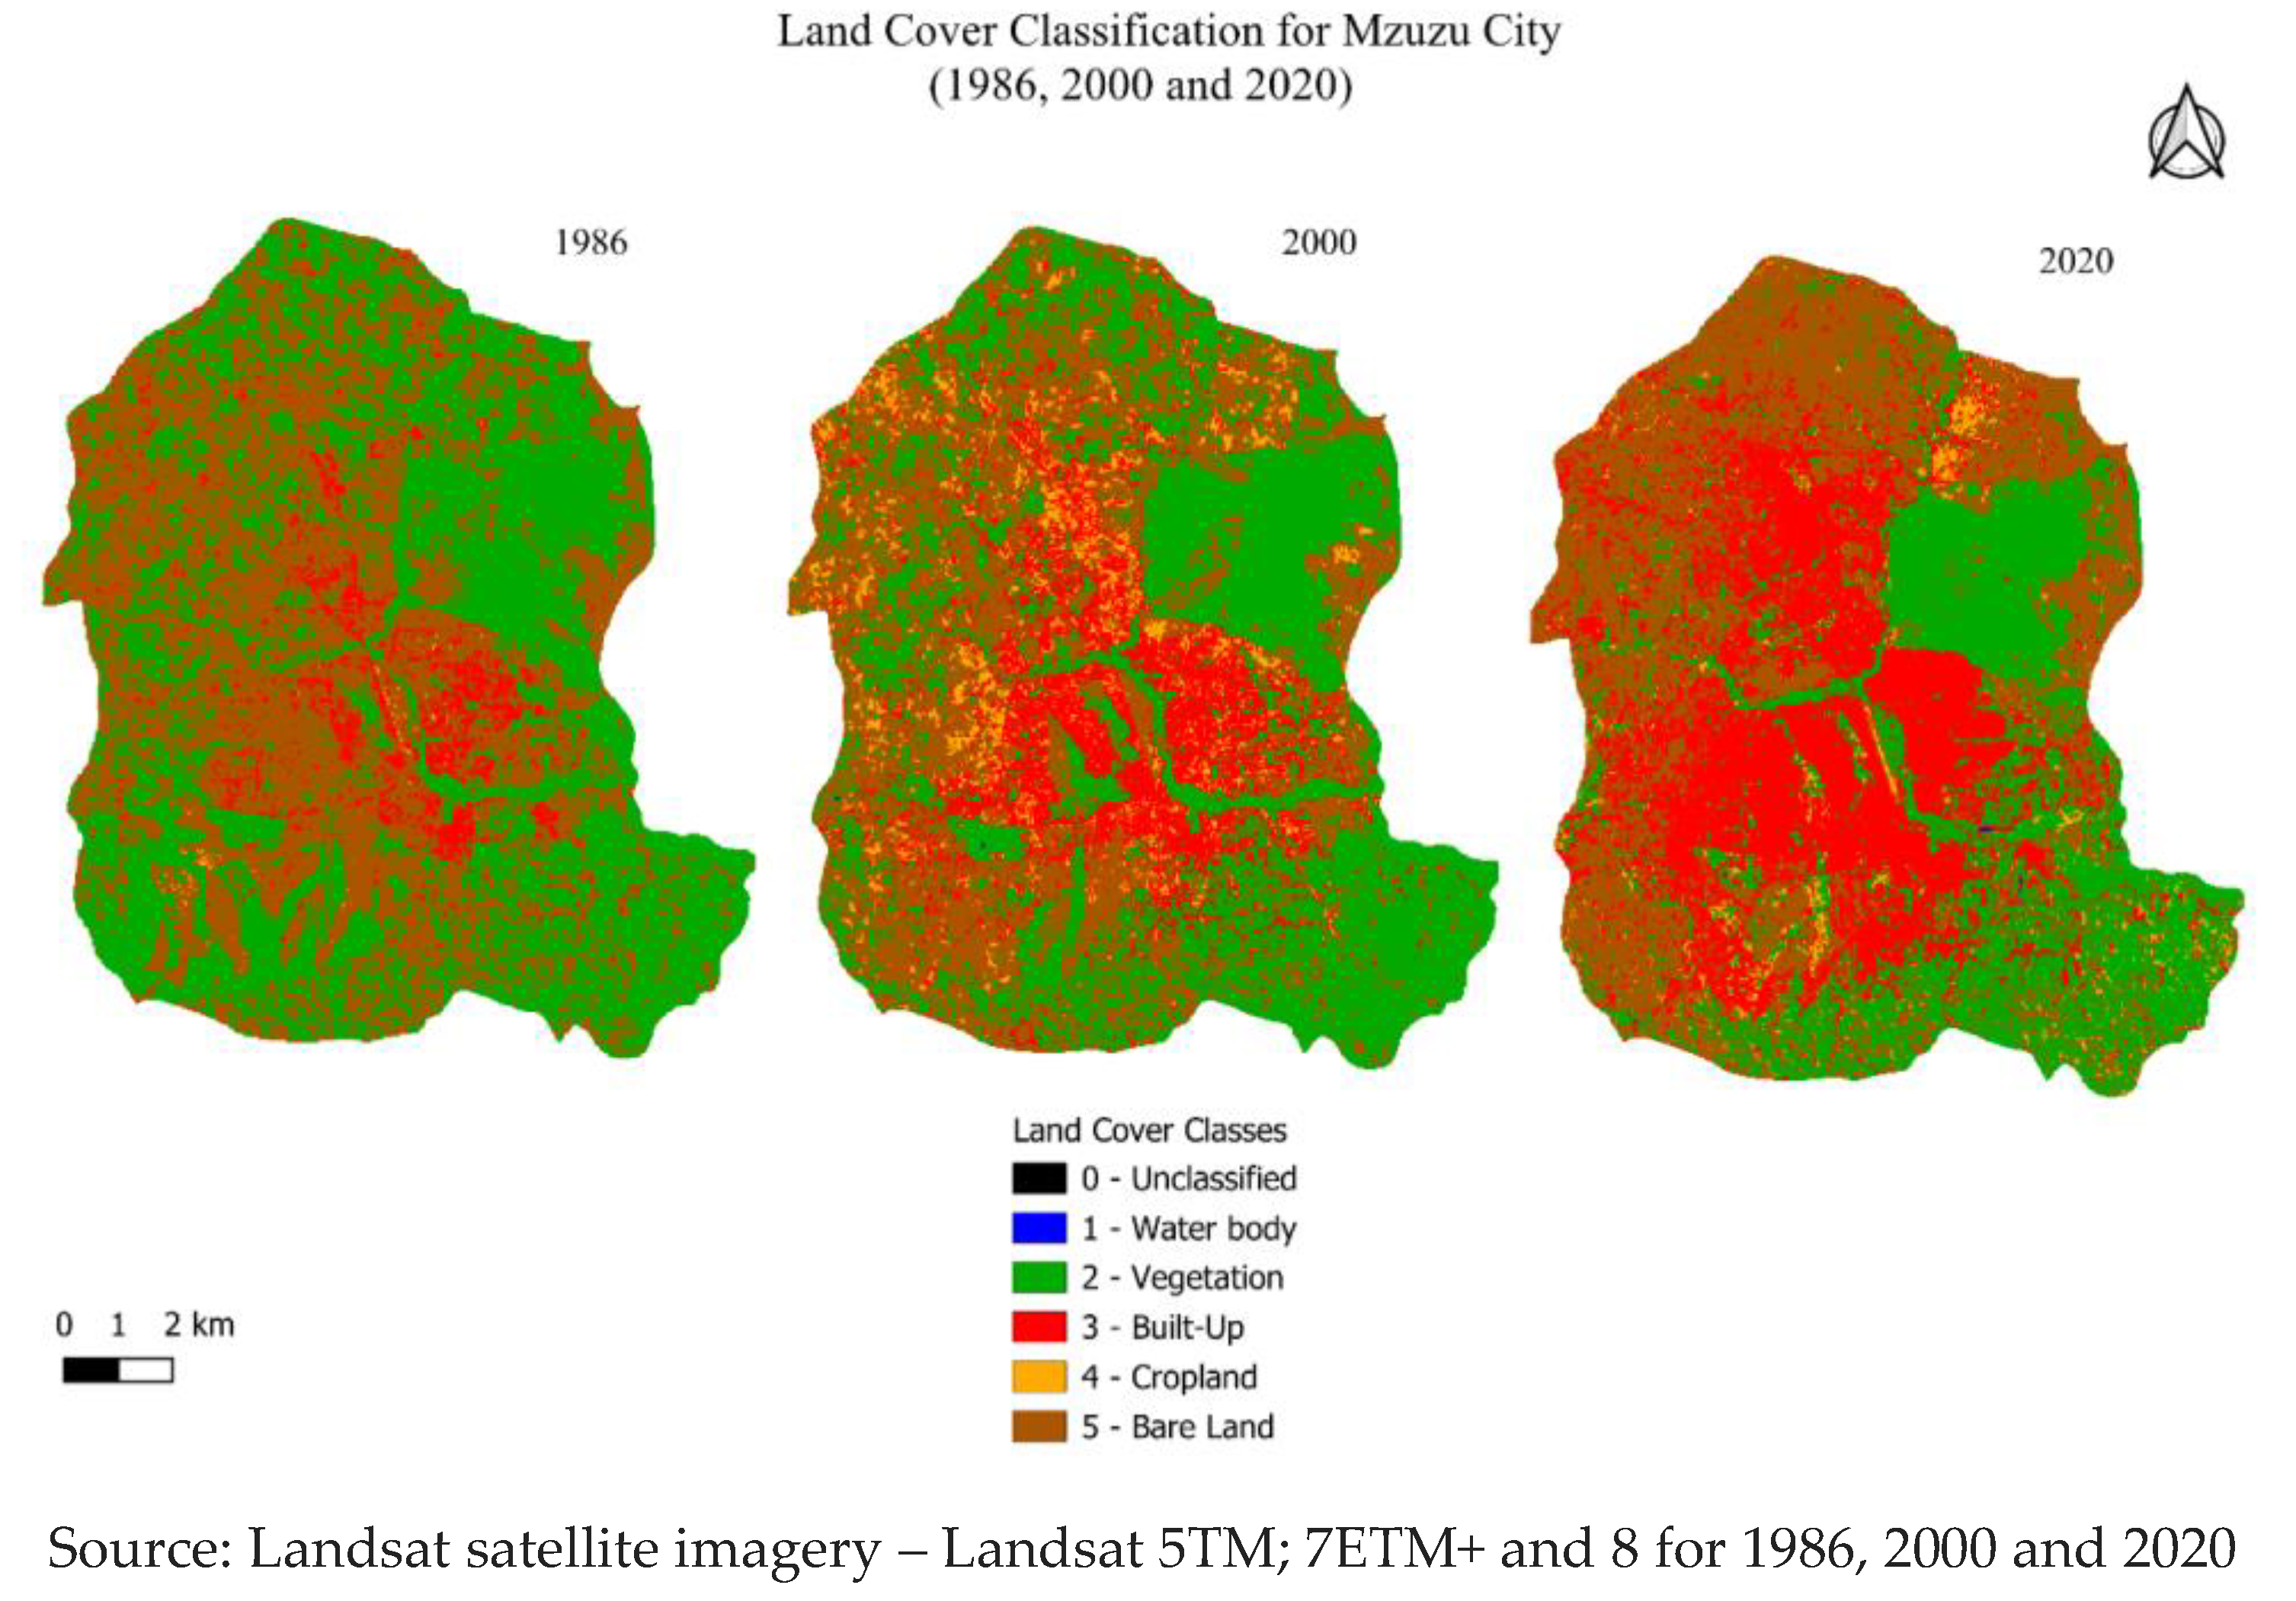
Figure 5.
Overall change detection in Mzuzu City between 1986 and 2020.
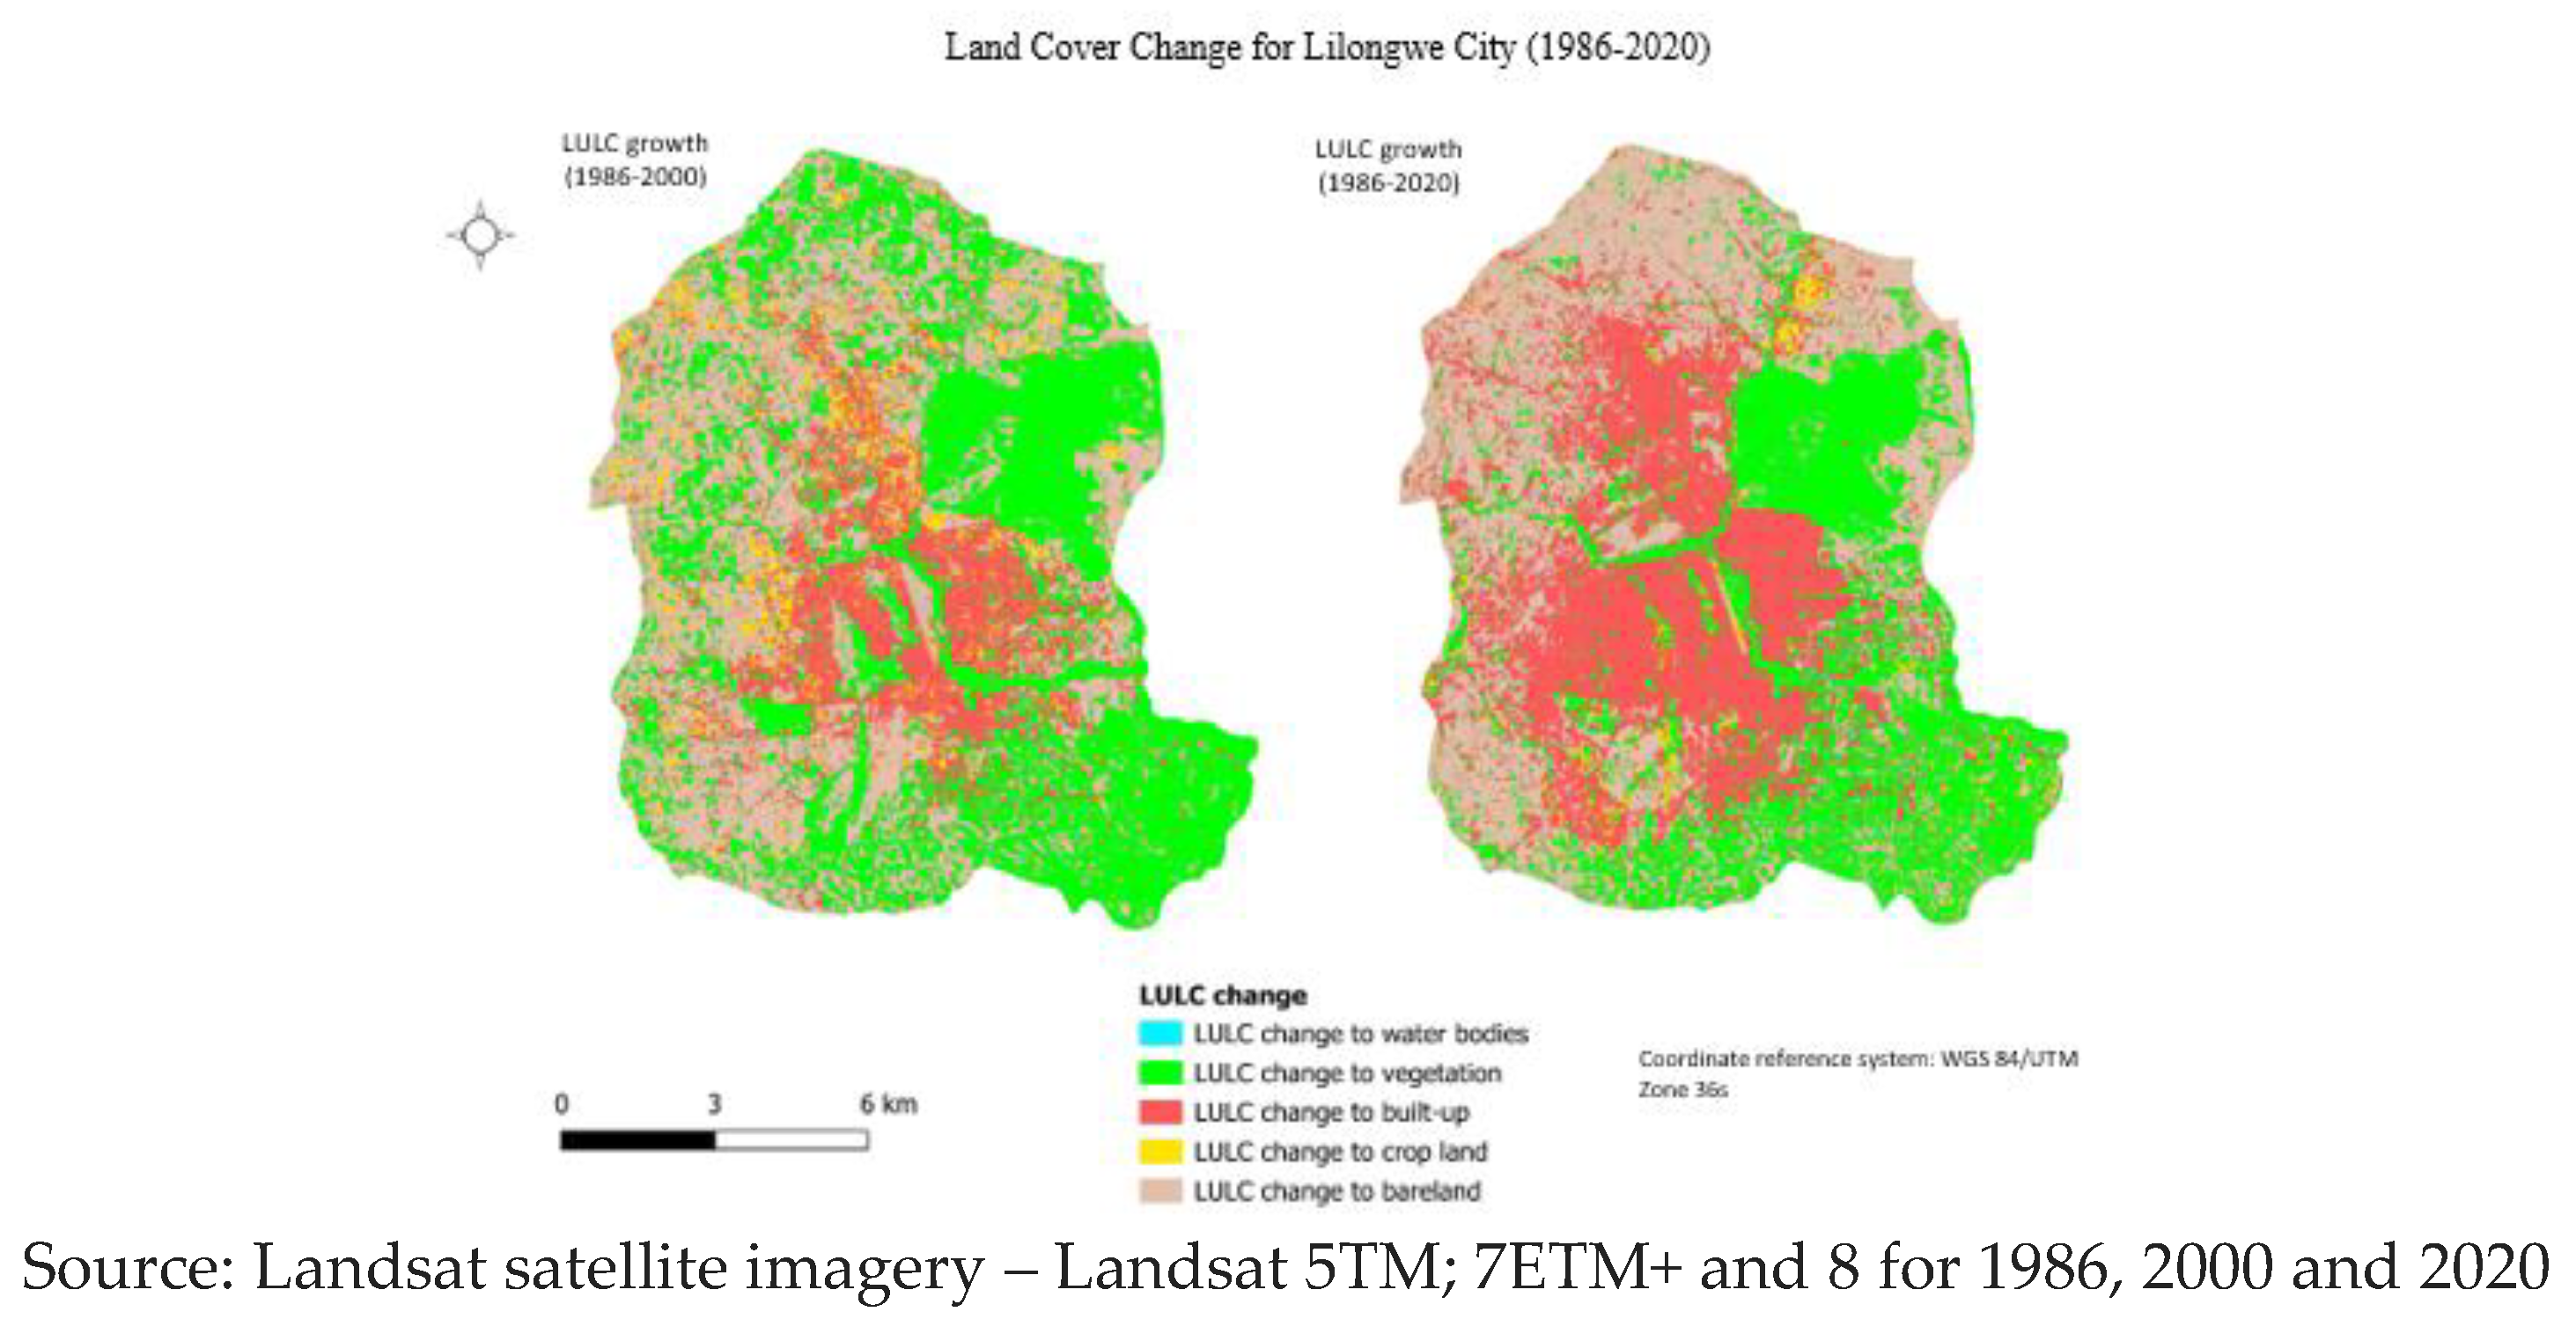
Figure 6.
Landcover classification for the area along the LR Basin – 1986, 2000 and 2020.
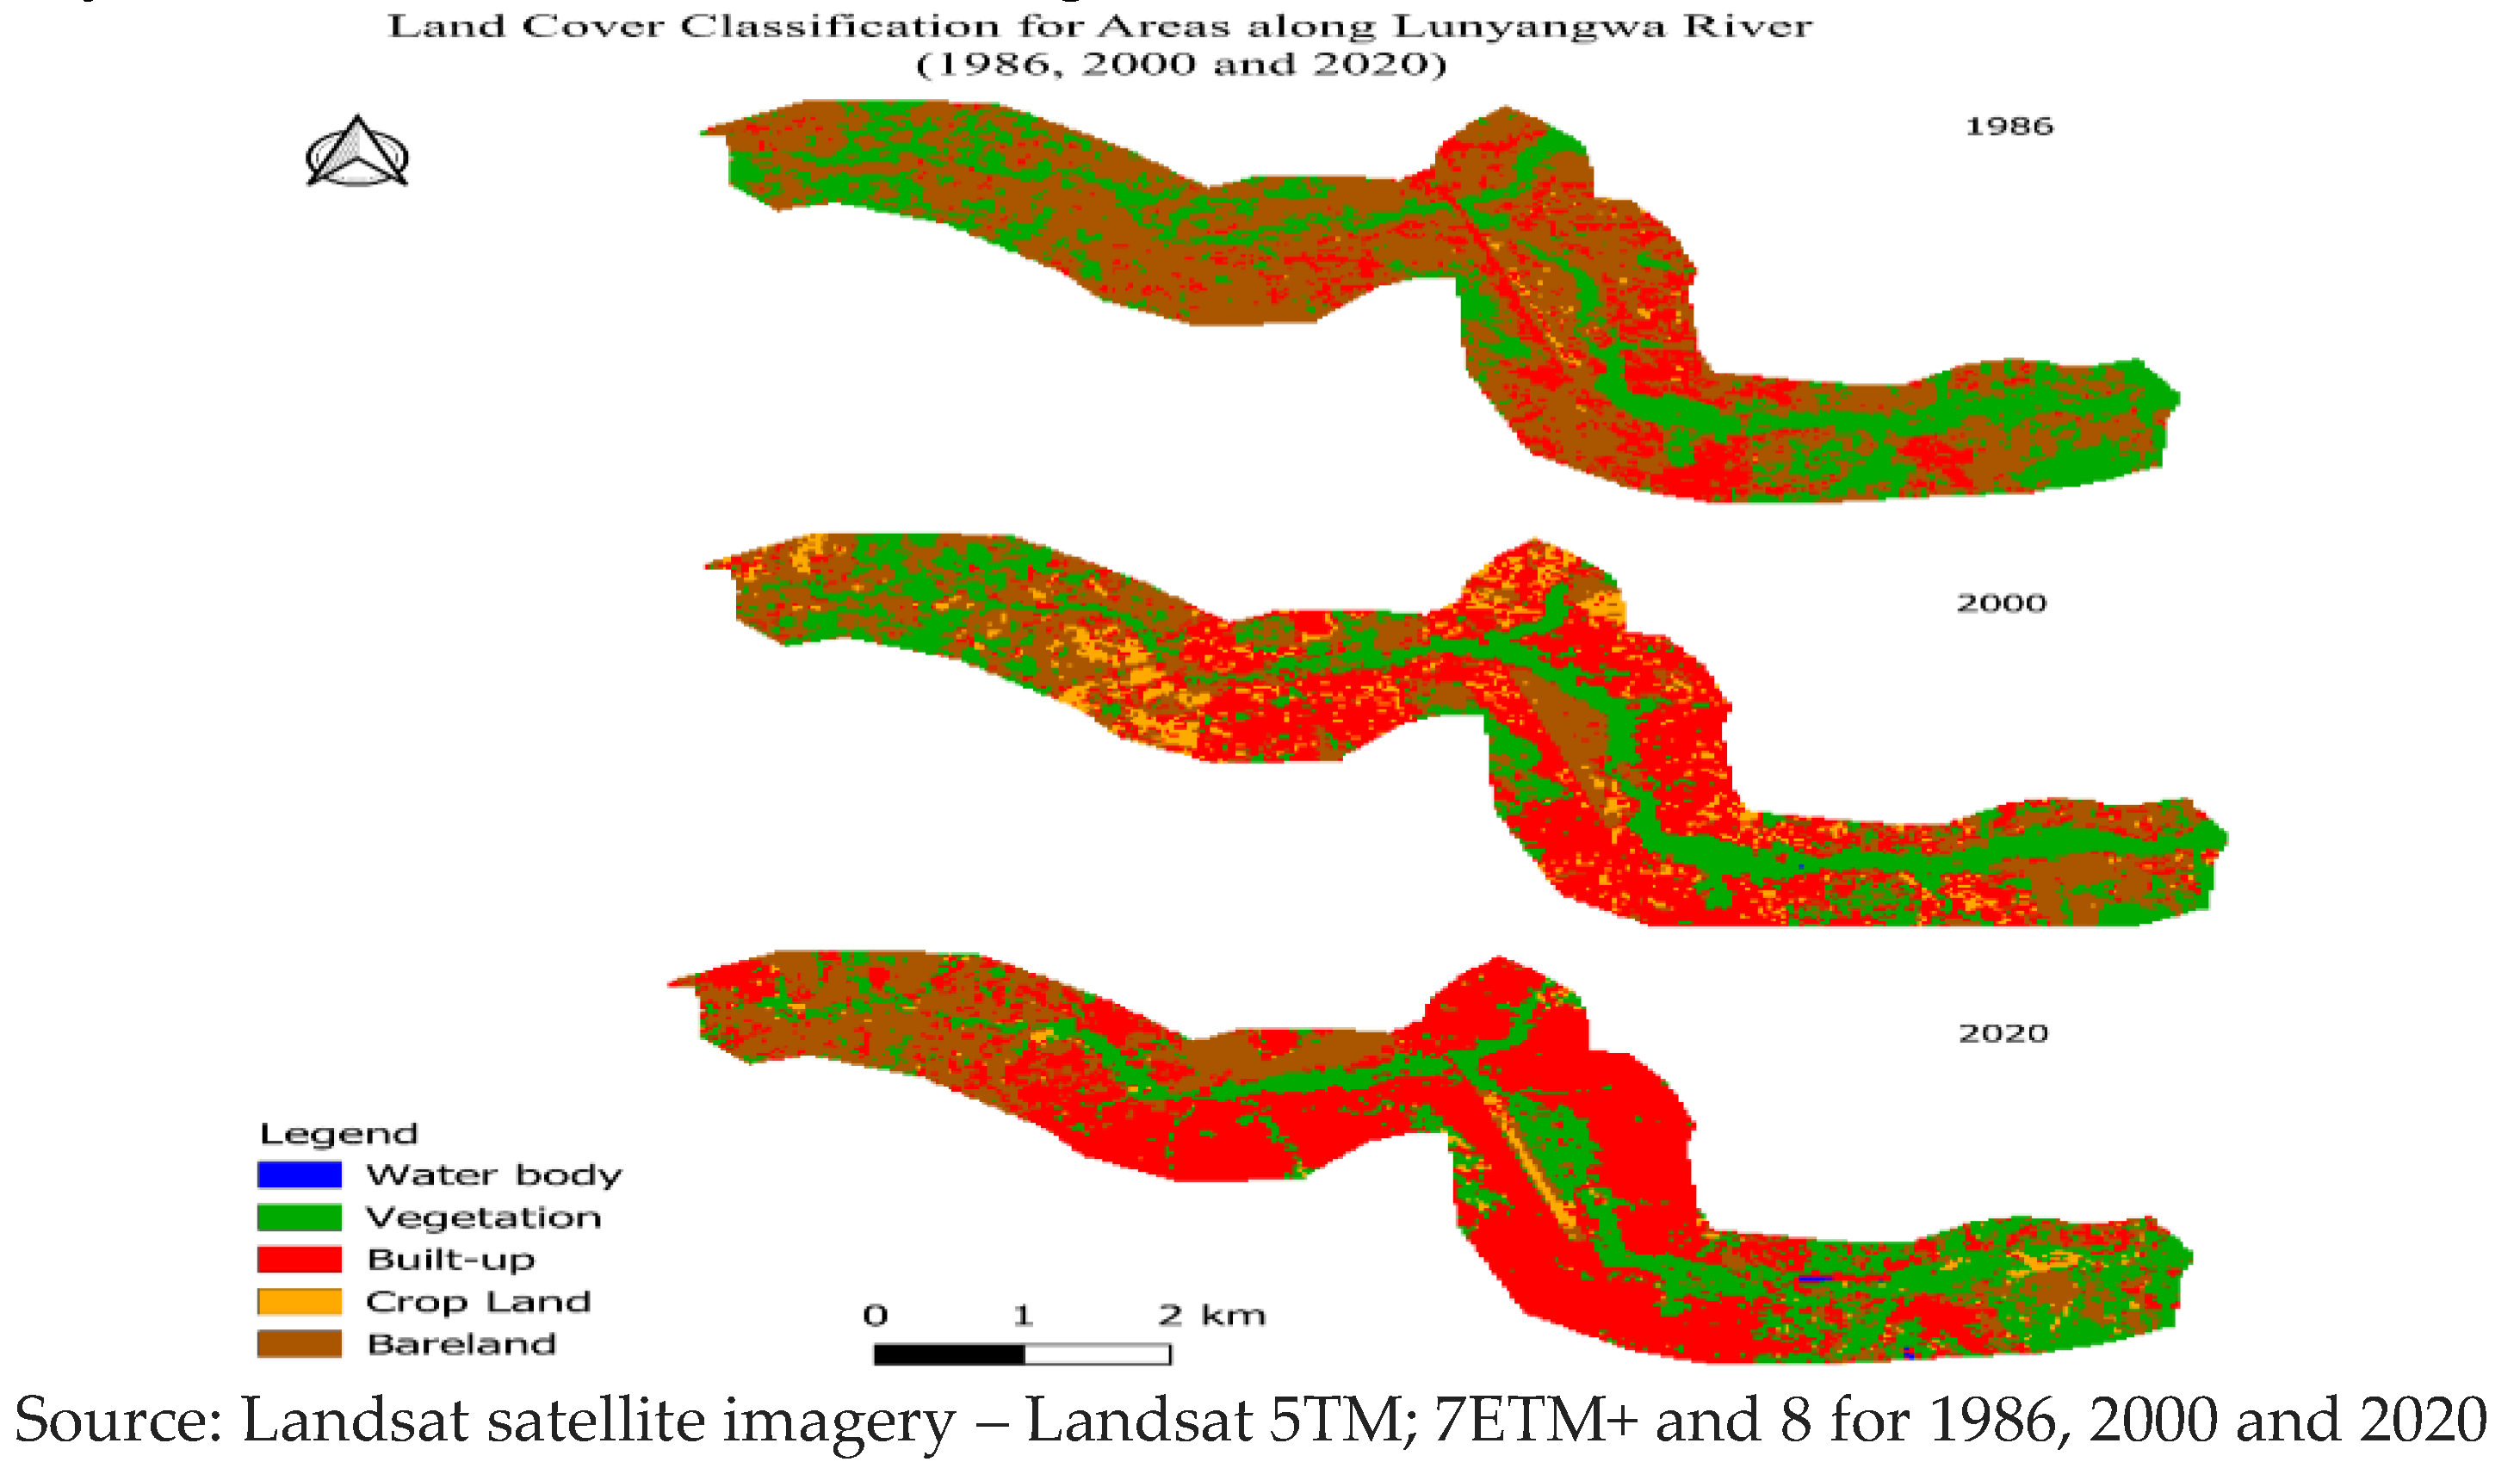
Figure 7.
Landcover classification for the area around the MBG – 1986, 2000 and 2020.
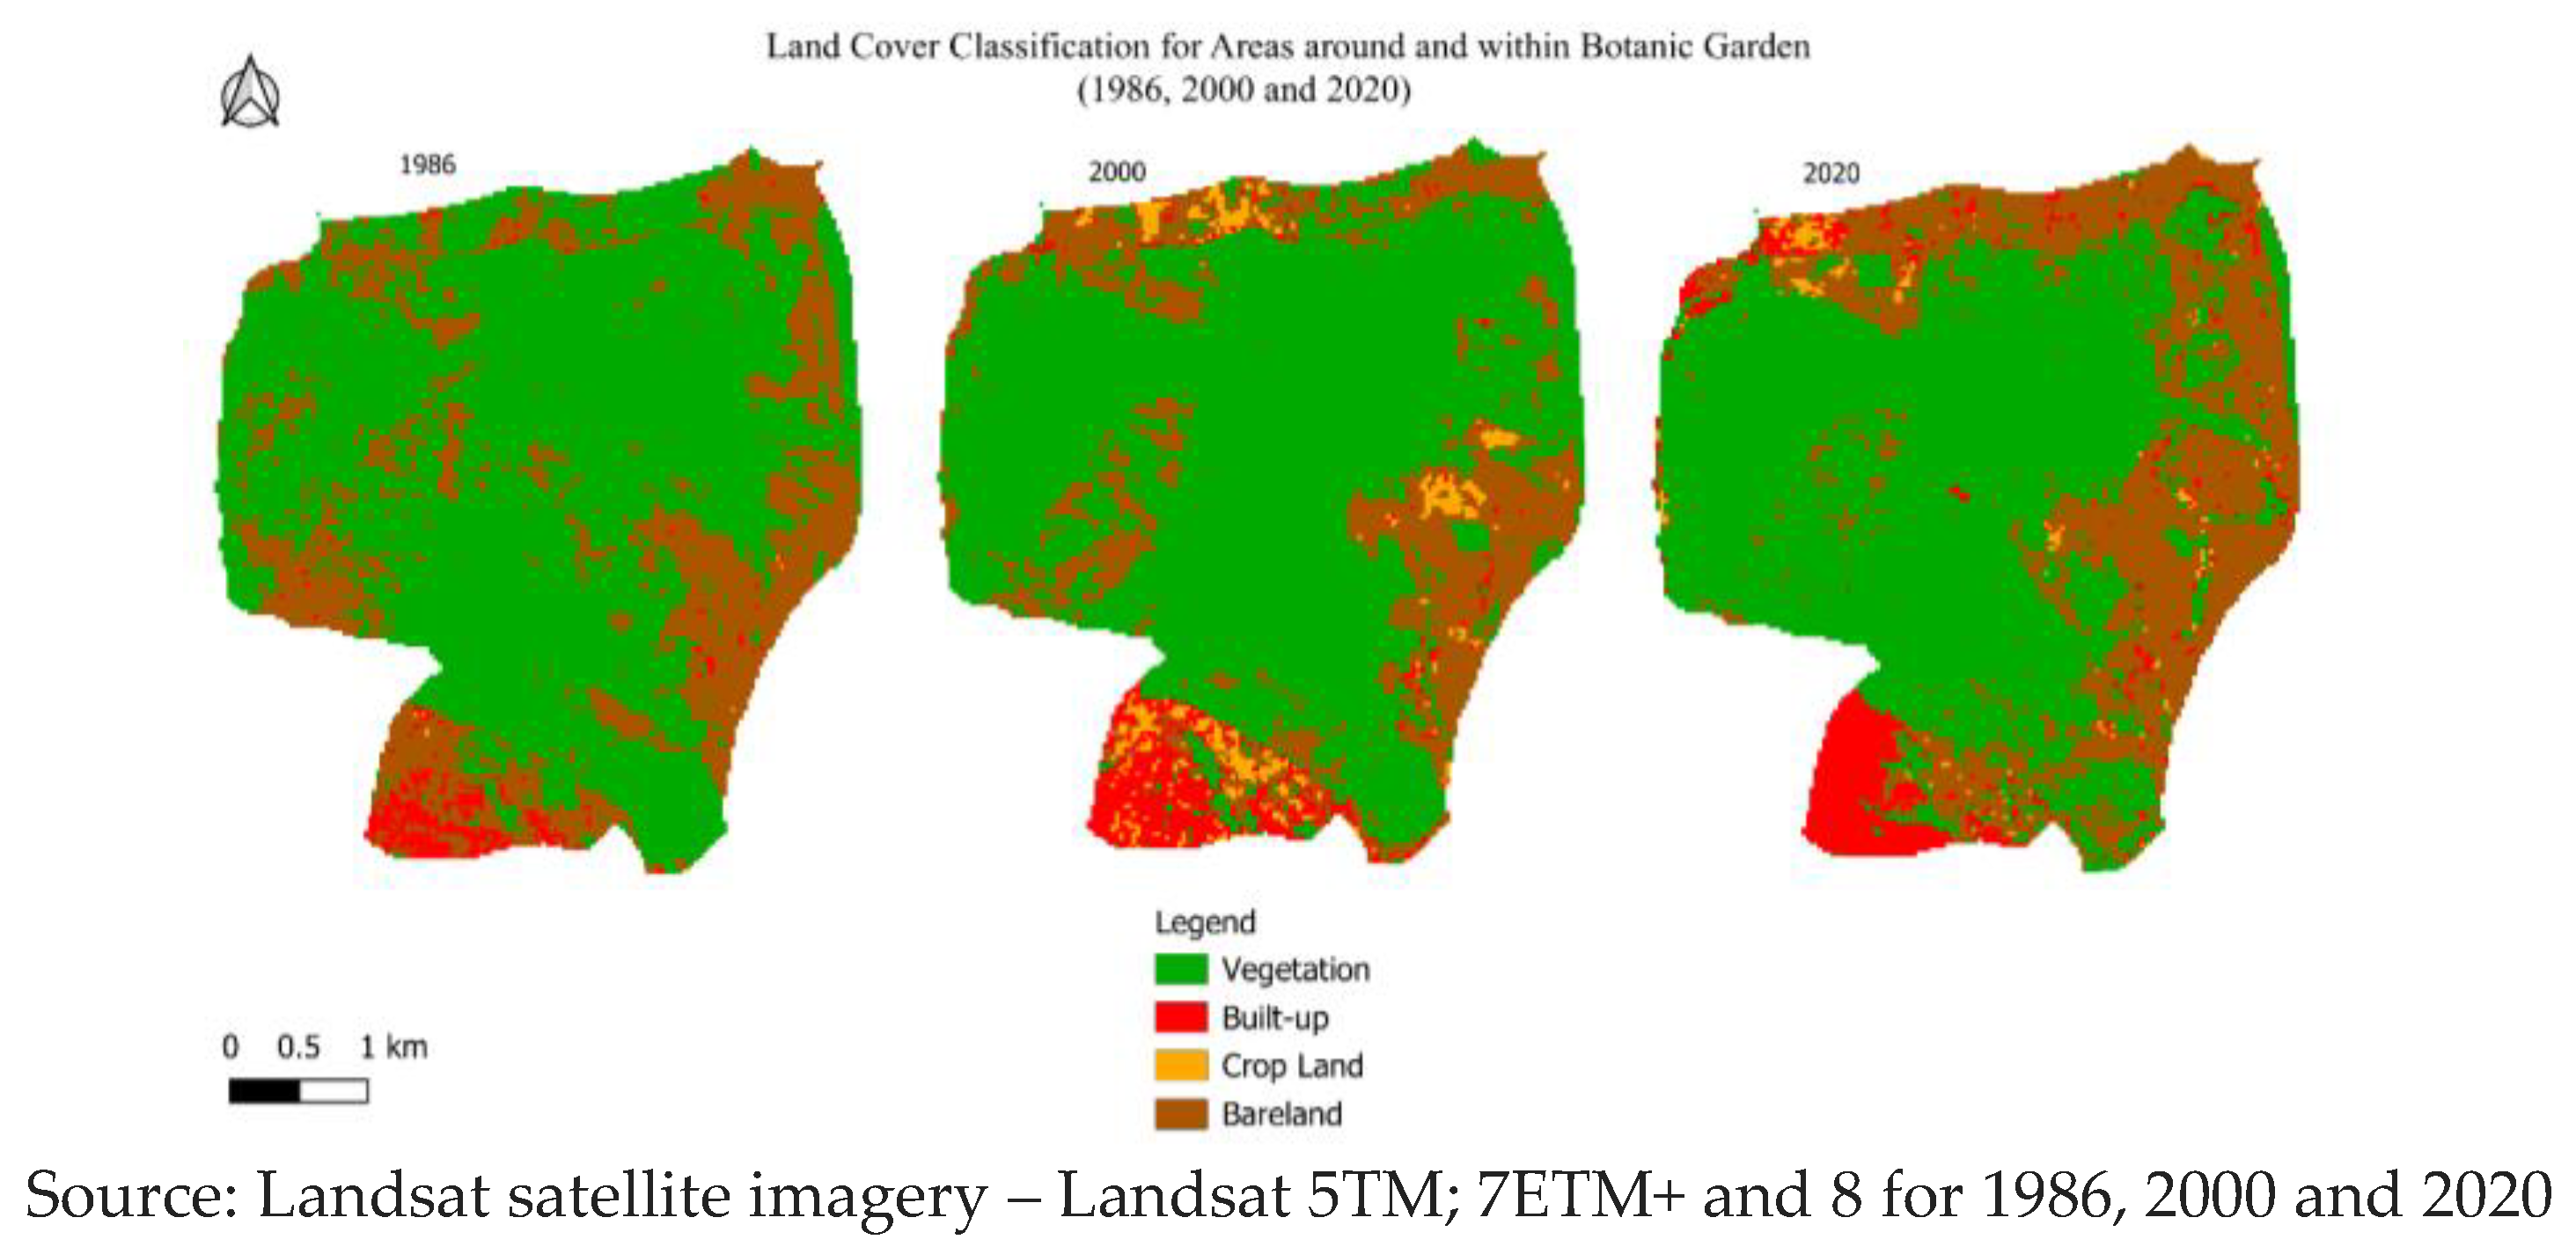
Table 1.
Details of Landsat satellite imagery used in the study.
| Satellite Sensor | Path/Row | Resolution (m) | Acquisition Date |
|---|---|---|---|
| Landsat 5 TM | 169/068 | 30 | 1986-08-08 |
| Landsat 7 ETM+ | 169/068 | 30 | 2000-09-07 |
| LANDSAT 8 | 169/068 | 30 | 2020-08-05 |
Table 2.
Summary description of satellite imagery-derived LULC classes.
| LULC class | Description |
|---|---|
| Water body | Above surface permanent / semi-permanent water bodies including rivers, streams, dams, ponds, etc$ |
| Vegetation | Vegetative cover growing above the natural ground, comprising forests, parks, botanic gardens, tree nurseries, tree reserves, street trees, grassland, and shrubs$ |
| Built up area | Land covered by buildings of all types and descriptions, as well as urban infrastructure appearing as hard surfaces, such as roads, paved paths, car parks, and concrete drainage systems$ |
| Bare land | Land comprising exposed open areas not covered by vegetation, buildings, roads or paved paths. |
| Crop land | Land which is put to urban agriculture use, comprising crop fields, vegetable gardens, and farms. |
Table 4.
Confusion matrix for the 1986 image classification.
| Class | Water Body | Vegetation | Built-up | Cropland | Bare Land |
|---|---|---|---|---|---|
| Water Body | 90 | 5 | 3 | 1 | 1 |
| Vegetation | 4 | 95 | 0 | 0 | 1 |
| Built-up | 2 | 1 | 96 | 0 | 1 |
| Cropland | 0 | 2 | 3 | 94 | 1 |
| Bare Land | 1 | 1 | 0 | 0 | 98 |
Overall Accuracy: 94.6%; Kappa Coefficient: 0.85.
Table 5.
Confusion matrix for the 2000 image classification.
| Class | Water Body | Vegetation | Built-up | Cropland | Bare Land |
|---|---|---|---|---|---|
| Water Body | 92 | 4 | 2 | 1 | 1 |
| Vegetation | 3 | 94 | 2 | 0 | 1 |
| Built-up | 1 | 0 | 97 | 1 | 1 |
| Cropland | 2 | 1 | 1 | 95 | 1 |
| Bare Land | 0 | 2 | 0 | 0 | 98 |
Overall Accuracy: 95.4%; Kappa Coefficient: 0.86.
Table 6.
Confusion matrix for the 2020 image classification.
| Class | Water Body | Vegetation | Built-up | Cropland | Bare Land |
|---|---|---|---|---|---|
| Water Body | 93 | 3 | 1 | 2 | 1 |
| Vegetation | 2 | 96 | 1 | 0 | 1 |
| Built-up | 1 | 1 | 97 | 0 | 1 |
| Cropland | 1 | 1 | 0 | 96 | 2 |
| Bare Land | 0 | 1 | 0 | 2 | 97 |
Overall Accuracy: 95.4%; Kappa Coefficient: 0.87.
Table 7.
Land cover change quantification: 1986, 2000 and 2020.
| Year | Land Cover Class | Area (sq.km) | Percentage (%) |
|---|---|---|---|
| 1986 | Vegetation | 64.73 | 45.64 |
| Built-up | 6.85 | 4.83 | |
| Bare land | 0.22 | 0.16 | |
| Crop land | 70.02 | 49.37 | |
| 2000 | |||
| Water bodies | 0.013 | 0.009 | |
| Vegetation | 56.702 | 39.980 | |
| Built-up | 22.913 | 16.156 | |
| Bare land | 8.157 | 5.751 | |
| Crop land | 54.041 | 38.104 | |
| 2020 | |||
| Water bodies | 0.022 | 0.015 | |
| Vegetation | 40.81 | 28.78 | |
| Built-up | 44.43 | 31.33 | |
| Bare land | 3.77 | 2.66 | |
| Crop land | 52.79 | 37.22 |
Table 8.
Quantification of land cover conversions – 1986-2000; 2000-2020.
| LULC change | 1986-2000 | 1986-2020 | ||
|---|---|---|---|---|
| Area (Sq.km) | Percentage (%) | Area (Sq.km) | Percentage (%) | |
| LULC change to water bodies | 0.013 | 0.009 | 0.02 | 0.02 |
| LULC change to vegetation | 56.70 | 39.98 | 40.81 | 28.78 |
| LULC change to built-up | 22.91 | 16.16 | 43.43 | 31.33 |
| LULC change to bare land | 54.04 | 38.10 | 52.79 | 37.22 |
| LULC change to crop land | 8.16 | 5.75 | 3.77 | 2.66 |
Table 9.
Land cover quantification along the LR basin – 1986, 2000 and 2020.
| Year | Land Cover Class | Area (sq.km) | Percentage (%) |
|---|---|---|---|
| 1986 | Vegetation | 27.74 | 5.433 |
| Built-up | 13.23 | 2.590 | |
| Bare land | 58.59 | 11.476 | |
| Crop land | 0.44 | 0.086 | |
| 2000 | |||
| Water bodies | 0.00 | 0.0009 | |
| Vegetation | 26.66 | 5.222 | |
| Built-up | 36.66 | 7.180 | |
| Bare land | 28.55 | 5.592 | |
| Crop land | 8.12 | 1.591 | |
| 2020 | |||
| Water bodies | 0.09 | 0.018 | |
| Vegetation | 25.39 | 4.974 | |
| Built-up | 50.18 | 9.829 | |
| Bare land | 22.11 | 4.330 | |
| Crop land | 2.22 | 0.435 |
Table 11.
Mzuzu City population growth; 1998 – 2018.
| Year | Population | Intercensal population change (%) |
|---|---|---|
| 1998 | 110,628 | - |
| 2008 | 133,968 | 21 |
| 2018 | 221,272 | 65 |
Source: Adapted from NSO, 2019.
Disclaimer/Publisher’s Note: The statements, opinions and data contained in all publications are solely those of the individual author(s) and contributor(s) and not of MDPI and/or the editor(s). MDPI and/or the editor(s) disclaim responsibility for any injury to people or property resulting from any ideas, methods, instructions or products referred to in the content. |
© 2024 by the authors. Licensee MDPI, Basel, Switzerland. This article is an open access article distributed under the terms and conditions of the Creative Commons Attribution (CC BY) license (http://creativecommons.org/licenses/by/4.0/).
Copyright: This open access article is published under a Creative Commons CC BY 4.0 license, which permit the free download, distribution, and reuse, provided that the author and preprint are cited in any reuse.


