
Submitted:
09 December 2025
Posted:
11 December 2025
You are already at the latest version
Abstract
INTRODUCTION: While the exact cause of Type 1 Diabetes (T1D) remains unclear, it is widely believed that both genetic and environmental factors contribute to the development of the disease. Recent research has explored the potential role of gut microbiota and its metabolites in modulating immune responses and influencing the development of autoimmune diseases like T1D. With this purpose, we designed a study: 1. to compare the levels of different bacterial metabolites in plasma samples of T1D patients and healthy controls (HC). 2. to correlate the levels of these metabolites with different demographic, clinical and analytical variables collected from the T1D patients.
METHODS: A total of 91 T1D patients were recruited. Plasma samples were collected and analyzed with gas chromatography coupled to mass spectrometry for the detection of the metabolites: short-chain fatty acids (SCFA: acetate [AA], propionate [PA], isobutyrate [IBA], butyrate [BA], isovalerate [IVA], valerate [VA] and methyl valerate [MVA]), medium-chain fatty acids (MCFA: hexanoate [HxA] and heptanoate [HpA]) and para-cresol (p-cresol). We also calculated the ratios between the different SCFA with AA.
RESULTS: 1. AA levels were significantly higher in T1D patients than in HC (p=0.0009). PA/AA and IBA/AA ratios were significantly higher in HC (p=0.0004 and p=0.0001, respectively). 2. Glycated haemoglobin (HbA1c) was positively correlated with AA levels (p=0.0001; r=0.406) and a significant negative correlation with a rSpearman< -0.3 was found for PA/AA, IBA/AA and BA/AA ratios. 3. p-cresol correlated with Ferritin levels (p=0.04; r=0.362); besides, p-cresol levels were lower in T1D patients with a normal liver profile (p=0.002) and in T1D patients without hypertension (p=0.005).
CONCLUSIONS: Serum levels of bacterial metabolites were significantly different in T1D patients. AA levels were significantly increased in T1D patients and p-cresol was higher in T1D patients with liver disturbances and hypertension. To develop strategies to restore gut microbiota health and immune balance could be essential for the control of T1D.
Keywords:
acetate
; para-Cresol
; glycated haemoglobin
; short-chain fatty acids
; medium-chain fatty acids
; type 1 diabetes
Introduction
Type 1 diabetes (T1D) is an autoimmune condition where the body's immune system mistakenly attacks and destroys insulin-producing beta cells in the pancreas, leading to little or no insulin production. Insulin is essential for regulating blood sugar levels, and without it, individuals experience hyperglycemia, which can be life-threatening if not managed properly. T1D is typically diagnosed in children and young adults, although it can develop at any age (1). Management of T1D involves lifelong insulin therapy, regular blood glucose monitoring, a balanced diet, and physical activity to prevent complications like cardiovascular disease, neuropathy, and kidney damage (2).
While the exact cause remains unclear, it is widely believed that both genetic and environmental factors contribute to the development of T1D. Genetic predisposition plays a significant role, as certain genes, especially those within the human leukocyte antigen (HLA) region, increase susceptibility (3); in recent years, genome-wide association studies (GWAS) have identified >50 loci that also contribute to the risk for developing T1D (4). However, environmental factors, such as viral infections (e.g., enteroviruses), early diet, and even geographic location, are also thought to trigger the onset of T1D in genetically susceptible individuals (5). Viruses like the Coxsackievirus B and rubella have been implicated in initiating the autoimmune response that leads to the destruction of beta cells (6). Other environmental influences, including exposure to certain chemicals or a lack of vitamin D, may also play a role in modulating immune function and increasing the risk of T1D (7). These findings highlight the complex interaction between genetics and environmental exposures in the pathogenesis of T1D.
Recent research has explored the potential role of gut microbiota and its metabolites in modulating immune responses and influencing the development of autoimmune diseases like T1D (8). Short-chain fatty acids (SCFAs), medium-chain fatty acids (MCFAs) and para-cresol (p-cresol) are some of these metabolites, which are in most cases of exclusive bacterial production. Butyrate (BA), a SCFA, have been shown to have anti-inflammatory effects, potentially helping to regulate the immune system and protect against autoimmune diseases like T1D (9). Studies in faeces have suggested that an altered gut microbiome may be associated with an increased risk of T1D (10). SCFAs may promote the generation of regulatory T cells, which are essential in preventing the immune system from attacking the body’s own tissues, including beta cells (11). As such, modulation of the gut microbiota and its metabolites may offer a potential avenue for preventing or managing T1D in the future.
Thus, we performed the current study with the aim to analyze the levels of circulating SCFAs, MCFAs and p-cresol in a cohort of T1D patients and to compare them with the levels found in a cohort of healthy controls (HC). In addition, based in previous results of our group in other autoimmune disease like multiple sclerosis (12-14), we also analyzed the ratios between AA and the other SCFAs since AA, unlike the others SCFAs, seems to have a pro-inflammatory role (15-17). Furthermore, we also tried to correlate the levels of the SCFAs and their ratios and the levels of MCFAs and p-cresol with different demographic, clinical and analytical variables collected from the T1D patients.
Methods
Study Design
We performed an observational prospective cross-sectional study, including samples from Type 1 Diabetes (T1D) patients and healthy controls (HC). T1D patients were recruited from the Endocrinology Service of the Hospital Clínico San Carlos between 2024 and 2025. A cohort of HC with a similar sex and age distribution were recruited among the volunteered blood donors of Hospital Clínico San Carlos between 2024 and 2025. Demographic and clinical data are shown in Table 1. Categorical and continuous variables collected from T1D patients are shown in Table 2.
Ethics Statement
Informed consent was obtained from all T1D and HC involved in the study. This study was approved by the local Ethic Committee of the Hospital Clínico San Carlos (Comité Ético de Investigación Clínica del Hospital Clínico San Carlos). The study was conducted in accordance with the Declaration of Helsinki.
Sample Collection
Whole blood was obtained by venipuncture from every T1D patient and HC. Blood was located in a Leucosep tube pre-filled with Leucosep separation medium (Greiner Bio-One). PBMCs and plasma were isolated following manufacturer instructions. Plasma was aliquoted in 0.2ml tubes and stored at -80ºC until use.
SCFA, MCFA and p-Cresol Levels Determination
Aliquots of plasma were processed as previously described by CGEM service at IRYCIS (https://www.irycis.org/es/servicios/45/cromatografia-de-gases-acoplada-a-espectrometria-de-masas) (18). Briefly, at least 100 μl of plasma was extracted with 300 μL mixture composed by 299.5 μL ethanol and 0.5 μL of deuterated butyric acid D7 4g/L. After vigorous vortex and pipetting (10 min), the samples were centrifuged for 10 min at 13,000 g. The supernatant was transferred to a new tube with 5 μL of freshly prepared 0.8 M sodium hydroxide. Solvents were evaporated using a vacuum centrifuge to completely dryness (Thermo Fisher SpeedVac™ SPD121P, Dreieich, Germany). The residual salts were redissolved in 100 μL of a mixture of 6:1 ratio of ethyl alcohol and acidified with 0.6 M succinic acid immediately before the analysis. Gas chromatography-mass spectroscopy (GC-MS) analysis was performed using a TRACE 1600/1610 gas chromatograph/ISQ7610 mass selective detector (Thermo Fisher Scientific, Dreieich, Germany) equipped with a TG-WaxMS A GC Column (30 m × 0.25 mm × 0.25 μm, Thermo Fisher Scientific, Dreieich, Germany). The injector, GC-MS transfer line and ion source temperature were set to 200°C, 215°C and 250°C, respectively. The flow rate of the helium carrier gas was set at 1 mL/min. We then introduced 1 μL of the sample by splitless injection. The initial column temperature was set to 55°C and held for 1 min, then raised to 105°C at a rate of 8°C/min where it was held for 2 min. Lastly, the column temperature was raised to 190°C at a rate of 30°C/min and kept at this temperature for 1 min. An extra step was added to delete possible leftovers, the temperature was raised to 210°C at a rate of 20°C/min and held at this temperature for 3 min. The ionisation was performed in the electron impact mode at 70 eV. The MS data were acquired by SIM scan mode, scan spectra were collected at a scan time 0.5 min. The compounds were identified by comparing the obtained MS spectra to the National Institute of Standards and Technology database and confirmed by comparing to the retention times of pure standards. The instrument was operated, and the data acquired and analysed using Chromeleon 7 software. The bacterial metabolites identified and quantified are shown in Table 3.
Statistical Analysis
Categorical variables were expressed as percentages, normal numerical variables as mean ± standard deviation, and non-normal as median (25th, 75th percentile). The association between/among categorical variables was analyzed using the Chi-square χ2 test, or Fisher's exact test when the value of the expected count less than 5 is more than 20%. For the quantitative variables, the means were compared using the Student's t-test or analysis of variance or the Mann-Whitney U test, in case the quantitative variables did not fit a normal distribution. The parametric Pearson coefficient or the nonparametric Spearman coefficient was applied to evaluate the correlation between two continuous quantitative variables. Since a correlation coefficient <0.3 or >−0.3 could be considered as negligible correlation (19), we only considered those above or below these values, respectively. Subjects with missing data were omitted from the corresponding analyses. P-values < 0.05 were referred to as statistically significant in the text. When necessary, the Bonferroni adjustment was carried out. All analyses were conducted using SPSS for Windows (Ver. 21.0) software (SPSS Inc.), and plots were elaborated with Prism version 8.0 (GraphPad Prism, San Diego, CA, USA).
Results
Gut Metabolite Levels and Ratios in T1D Patients and HC
After Bonferroni correction for multiple comparisons, we found that AA levels were significantly higher in T1D patients than in HC (p=0.0009) (Figure 1.A). In relation with the SCFA ratios, PA/AA and IBA/AA ratios were significantly higher in HC than in T1D patients (p=0.0004, p=0.0001, respectively) (Figure 1.B).
Diversity of SCFAs in T1D Patients and HC
While we detected a median of 7/7 different SCFA in HC, only 6/7 SCFA were detected in T1D patients (p=0.004). Thus, BA was only detected in 61/91 (67.4%) T1D patients vs. 52/58 (89.7%) HC (p=0.003); IVA was detected in 70/91 (76.1%) T1D patients vs. 54/58 (93.1%) HC (p=0.02) but difference was not statistical significant after Bonferroni correction.
A significantly higher total amount of SCFAs was found in T1D patients than in HC (median values: 438.0 g/ml vs. 365.6 g/ml, respectively; p=0.003). However, when we excluded the AA, there was not any significant difference between T1D patients and HC (median values: 103.7 g/ml vs. 103.5 g/ml, respectively). Furthermore, as higher is the percentage of AA respecting the whole amount of SCFAs, as lower is the number of the different SCFAs detected: the percentage of AA in HC with ≥6 SCFAs was 70.9% vs. 87.3% in HC with <5 SCFA (p=0.01), and similarly, 76.4% in T1D patients with ≥6 SCFA vs. 83.4% in T1D with <5 SCFA (p=0.04).
Association with Sex and Age of the Gut Metabolite Levels and Ratios in T1D Patients and HC
We found that PA/AA, IB/AA, BA/AA and MV/AA ratios and p-cresol levels were significantly higher in HC women (HCw) than in HC men (HCm) (p=0.009, p=0.03, p=0.04, p=0.03 and p=0.04, respectively), while no differences were found between T1D women (T1Dw) and T1D men (T1Dm) (Table 4). When we compared HCw vs. T1Dw, we found almost the same significant differences than those for the whole population: higher levels of AA (p=0.003) and lower PA/AA, IBA/AA and BA/AA ratios (p=0.00008, p=0.0002 and p=0.041, respectively) in T1Dw than in HCw. T1Dm showed higher levels of p-cresol than HCm (p=0.022) (Table 4). Regarding the age, we did not find any correlation in HC; however, in T1D patients, a positive correlation between p-cresol and age was found (p=0.0001; r=0.401), present in both women (p=0.005; r=0.387) and men (p=0.003; r=0.464).
Gut Metabolite Levels and Ratios in T1D Patients and Their Possible Association with Clinical and Analytical Variables
Glycated haemoglobin (HbA1c) was positively correlated with AA levels (p=0.0001; r=0.406) while a significant negative correlation with a rSpearman<-0.3 was found for PA/AA, IBA/AA and BA/AA ratios as we can see in Figure 2. When we analyzed both sex, while correlations in T1D women where similar to those of the whole population: AA levels (p=0.001; r=0.463), PA/AA (p=0.003; r=-0.419) and IBA/AA (p=0.002; r=-0.451), only AA levels (p=0.04; r=0.334) correlated with HbA1c in T1D men. The ratio between the total amount of SCFA excluding AA and AA levels was inversely correlated with HbA1c in T1D women (p=0.006; r=-0.393).
MV/AA ratio negatively correlated with levels of glucose of T1D patients (p=0.002; r=-0.334). This association was also found in T1D women (p=0.0005; r=-0.473) but not in T1D men. Furthermore, the ratio between the total amount of SCFA excluding AA and AA levels was inversely correlated with glucose levels (p=0.002; r=-0.335); this association was also found in T1D women (p=0.002; r=-0.438) but not in T1D men.
Other significant correlation with continuous variables and a rSpearman<-0.3 or >0.3 was between p-cresol and Ferritin levels (p=0.04; r=0.362).
Regarding the categorical variables, p-cresol levels were lower in T1D patients with a normal liver profile than in T1D patients with a not normal liver profile (7.5 M vs. 13.0 M, respectively; p=0.002), and in T1D patients without high blood pressure than in T1D patients with high blood pressure (6.7 M vs. 10.6 M, respectively; p=0.005).
Discussion
Here we described for the first time, at least to the best of our knowledge, that serological AA levels were significantly increased in T1D patients, mainly in T1D women. Furthermore, a positive correlation between AA and HbA1c is also described, also mainly in woman. HbA1c and T1D were closely related in the management and diagnosis of the disease. HbA1c is a blood test that reflects the average blood glucose levels over the past 2–3 months and it measures the percentage of hemoglobin that is glycated. Therefore, HbA1c is the cornerstone of managing T1D, offering a window into how well blood sugar has been controlled over time. It helps guide treatment adjustments and predict risk for complications.
SCFAs are fatty acids with fewer than six carbon atoms that are primarily produced by the fermentation of dietary fibers by gut microbiota in the colon. In the last years, different articles have been published analyzing SCFA in T1D, but only a few of them have analyzed circulating SCFA in human samples. A previous study in 53 T1D patients and 50 HC analyzing AA, PA and BA in plasma and feces using liquid chromatography-mass spectrometry described that plasma levels of AA and PA were lower in T1D, with similar fecal SCFA results (20). In a recent paper with 198 adults T1D patients, but without HC, serum SCFA levels and blood glucose control were assessed by HbA1c and continuous glucose monitoring metrics, and dietary intake from a 7-day food record; authors found that SCFA levels showed significant sex-specific differences and a sex-specific association between serum propionate levels and blood glucose control in women with T1D (21). SCFA levels have also been measured in urine samples collected from 98 children (40 HC, 40 T1D and 18 obese children): PA, IBA, BA VA levels were higher in T1D patients than HC (22). These contradictory results could be due to the low number of samples analyzed in some of these studies, the different origin of the samples, the different techniques used, the different SCFA analyzed and also the heterogeneous cohorts of T1D patients recruited in these studies. A systematic review and meta-analysis aimed to assess the effect of SCFA interventions on fasting glucose, fasting insulin, and homeostatic model assessment of insulin resistance (HOMA-IR) has been recently published. Authors concluded that those studies with a confirmed increase in SCFAs at the end of intervention also had a significant effect on lowering fasting insulin, and elevated levels of SCFAs, compared with baseline levels, were associated with beneficial effects on HOMA-IR. However, in this meta-analysis they did not differentiate between the different SCFA (23). Therefore, it is difficult to establishes a conclusion comparing our results with those previously published. However, an association between SCFA levels and HbA1c, glucose and/or fasting insulin seem to be plausible. Finally, our study showed differences in SCFA levels in men and women. These sex-specific differences have been found by other authors as we have shown above (21). Furthermore, a previous publication analyzing sex-specific changes in the gut microbiome and host metabolome of T1D mice via 16S rRNA gene sequencing and nuclear magnetic resonance-based metabolomics approach suggests that sex-dependent gut microbiota-host metabolism axis may be implicated in the sexual dimorphism of T1D (24).
In this study, similarly as we have performed in previous studies with multiple sclerosis patients, we have calculated the ratio between AA and the other SCFA. In previous studies, we suggested that AA could have a pro-inflammatory role, while, on the contrary, PA and BA would have an anti-inflammatory one (25). The ratio not only give us information about the potential imbalance between the AA and the other SCFA, but also allow us to correct the individual heterogeneity in SCFA levels due to individual factors like different gut bacterial populations or gut permeability. As in MS, in this study we also found lower ratios in T1D patients, showing that the SCFA imbalance could be a common mechanism in autoimmune diseases, and to restore this equilibrium could be essential for the control of these pathologies.
Furthermore, in our study, a higher proportion of AA was associated with a lower number of SCFA detected. A bidirectional feedback loop exists between inflammation and the gut microbiota, particularly involving bacteria that produce inflammatory metabolites. During inflammation, the gut environment changes favoring the growth of certain bacteria. These bacteria produce pro-inflammatory compounds which can damage the intestinal barrier and activate immune receptors. This immune activation leads to the release of cytokines, further fuelling inflammation. The ongoing inflammatory state promotes dysbiosis. A dysbiotic microbial community, once established, substantially affects both the local mucosal and systemic landscape of immune cells, thereby creating a feedback loop in which the host immune system and its microbiota cross-regulate each other (26). These bacteria, in turn, continue to produce metabolites that worsen inflammation and disrupt gut homeostasis. This self-reinforcing cycle plays a critical role in chronic conditions like inflammatory disorders. Breaking this loop is a key therapeutic goal, often approached through dietary interventions (27), probiotics (28), or fecal microbiota transplantation (29). Understanding this dynamic interplay is essential for developing strategies to restore gut health and immune balance.
The other metabolite that was found in association with different clinical and analytical variables in T1D patients was p-cresol. Furthermore, T1Dm showed higher levels of p-cresol than HCm and a positive correlation between p-cresol and age was found both in T1Dw and T1Dm. p-cresol is a microbial metabolite produced in the gut from the fermentation of aromatic amino acids, primarily tyrosine. It's a phenolic compound with significant implications for host physiology, especially in the context of gut health, liver metabolism, and systemic effects (30). In our study, p-cresol was positively correlated with ferritin levels. Ferritin is a blood protein that stores iron, and its levels are often used to assess iron status in the body. However, ferritin is also an acute-phase reactant, meaning it can be elevated in the presence of inflammation, infection, or liver disease, even when iron stores are normal or low (31). Thus, we found that p-cresol levels were lower in T1D patients with a normal liver profile than in T1D patients with a not normal liver profile (7.5 M vs. 13.0 M, respectively; p=0.002). After production in the gut, p-cresol is absorbed and sulfated or glucuronidated in the liver, forming p-Cresyl sulfate or p-Cresyl glucuronide (pCG). Therefore, higher levels of p-cresol could be associated with disturbances in normal liver function in T1D patients. Since T1Dm showed higher levels of p-cresol than HCm, this metabolite could be associated with sex differences in liver disturbances among individuals with T1D, although this should be deeper analyzed in future studies. Finally, p-cresol levels were lower in T1D patients without high blood pressure than in T1D patients with high blood pressure (6.7 M vs. 10.6 M, respectively; p=0.005). High blood pressure (hypertension) is a common and serious comorbidity in individuals with T1D, significantly increasing the risk of cardiovascular disease, kidney damage, and other diabetes-related complications. The development of hypertension in people with T1D is often linked to diabetic nephropathy, where persistent hyperglycemia leads to kidney damage, further elevating blood pressure and creating a harmful feedback loop (32). Furthermore, there is a significant relationship between liver disturbances, hypertension and T1D, primarily through mechanisms involving insulin resistance, metabolic dysfunction, and systemic inflammation (33), often linked to metabolic syndrome components like obesity/overweight (34). Elevated serum p-cresol levels have been observed in individuals with obesity, indicating a potential link between this metabolite and adiposity. A study involving 373 patients with stable coronary artery disease found significant positive correlations between serum levels of total para-cresylsulfate (a metabolite of p-cresol) and central obesity indices such as waist-to-hip ratio, conicity index, and a body shape index. These associations were particularly pronounced in male patients, suggesting a sex-specific relationship between para-cresylsulfate levels and central obesity (35). Furthermore, a systematic review of metabolomics studies highlighted that obese individuals often exhibit higher concentrations of p-cresol and its sulfate conjugate in urine, indicating increased production of these metabolites (36). Therefore, p-cresol levels could be a biomarker for these comorbidities in T1D patients. Strategies directed to reduce overweight and to control liver disturbances and hypertension could be monitored through the analysis of the p-cresol levels in the serum of the T1D patients. The positive correlation found between p-cresol and age in both, male and female, could be finally associated with the increasing percentage of these comorbidities with the age in T1D patients. Further studies are guaranteed to explain the associations here described for the p-cresol.
However, a limitation of the study could be the lack of information about the diet of patients and controls, since diet can modify the composition of the microbiota, and therefore, the circulating metabolites. Furthermore, although we have not found any association between the duration of T1D and the levels and ratios of the different gut metabolites analyzed, it could be very interesting to analyze these data since the beginning of the disease, and not only in cohort with a well-established disease.
In conclusion, bacterial metabolite levels were altered in T1D patients. AA levels were significantly increased in T1D patients, mainly in T1D women, and AA levels positive correlated with HbA1c, also mainly in woman. PA/AA and BA/AA ratios were lower in T1D patients, showing that the SCFA imbalance could be a common mechanism in autoimmune diseases. Finally, p-cresol levels correlated with ferritin levels and they were higher in T1D patients with liver disturbances and hypertension. To develop strategies to restore gut health and immune balance could be essential for the control of T1D.
Author Contributions
IJV and MCH provided unique reagents, discussed and interpreted findings, revised the manuscript critically. MIDM and SR prepared the samples, made the statistical analysis, discussed and interpreted findings, revised the manuscript critically. MAGM and IPG processed the samples and revised the manuscript critically. AP, AMB and RDC prepared the samples for LC-MSMS analysis and performed such analysis and revised the manuscript critically. RAL contributed to the design of the study, guided the progress of the study and drafted the article. All authors read and approved the final manuscript and have agreed both to be personally accountable for the author's own contributions and to ensure that questions related to the accuracy or integrity of any part of the work, even ones in which the author was not personally involved, are appropriately investigated, resolved, and the resolution documented in the literature.
Informed Consent Statement
Informed consent was obtained from all subjects involved in the study.
Data Availability Statement
The original contributions presented in the study are included in the article. Further inquiries can be directed to the corresponding author.
Acknowledgments
MAGM has a technician contract from “REI: Red de Enfermedades Inflamatorias” (RD24/0007/0017).
Conflicts of Interest
The authors declare no conflict of interest.
References
- Atkinson, MA; Eisenbarth, GS; Michels, AW. Type 1 diabetes. Lancet 2014, 383, 69–82. [Google Scholar] [CrossRef] [PubMed]
- Chiang, JL; Kirkman, MS; Laffel, LM; Peters, AL. Type 1 Diabetes Sourcebook Authors. Type 1 diabetes through the life span: a position statement of the American Diabetes Association. Diabetes Care 2014, 37, 2034–2054. [Google Scholar] [CrossRef]
- Noble, JA; Erlich, HA. Genetics of type 1 diabetes. Cold Spring Harb Perspect Med. 2012, 2, a007732. [Google Scholar] [CrossRef] [PubMed]
- Onengut-Gumuscu, S; Chen, WM; Burren, O; Cooper, NJ; Quinlan, AR; Mychaleckyj, JC; et al. Fine mapping of type 1 diabetes susceptibility loci and evidence for colocalization of causal variants with lymphoid gene enhancers. Nat Genet. 2015, 47, 381–386. [Google Scholar] [CrossRef] [PubMed]
- Lemos, JRN; Hirani, K; von Herrath, M. Immunological and virological triggers of type 1 diabetes: insights and implications. Front Immunol. 2024, 14, 1326711. [Google Scholar] [CrossRef]
- Zorena, K; Michalska, M; Kurpas, M; Jaskulak, M; Murawska, A; Rostami, S. Environmental Factors and the Risk of Developing Type 1 Diabetes-Old Disease and New Data. Biology (Basel) 2022, 11, 608. [Google Scholar] [CrossRef]
- Yang, X; Chai, M; Lin, M. Proportion of vitamin D deficiency in children/adolescents with type 1 diabetes: a systematic review and meta-analysis. BMC Pediatr. 2024, 24, 192. [Google Scholar] [CrossRef]
- Golpour, F; Abbasi-Alaei, M; Babaei, F; Mirzababaei, M; Parvardeh, S; Mohammadi, G; et al. Short chain fatty acids, a possible treatment option for autoimmune diseases. Biomed Pharmacother. 2023, 163, 114763. [Google Scholar] [CrossRef]
- Furusawa, Y; Obata, Y; Fukuda, S; Endo, TA; Nakato, G; Takahashi, D; et al. Commensal microbe-derived butyrate induces the differentiation of colonic regulatory T cells. Nature 2013, 504, 446–450. [Google Scholar] [CrossRef]
- Samuelsson, U; Ludvigsson, J. The concentrations of short-chain fatty acids and other microflora-associated characteristics in faeces from children with newly diagnosed Type 1 diabetes and control children and their family members. Diabet Med. 2004, 21, 64–67. [Google Scholar] [CrossRef]
- Arpaia, N; Campbell, C; Fan, X; Dikiy, S; van der Veeken, J; deRoos, P; et al. Metabolites produced by commensal bacteria promote peripheral regulatory T-cell generation. Nature 2013, 504, 451–455. [Google Scholar] [CrossRef]
- Dominguez-Mozo, MI; Perez-Perez, S; Villarrubia, N; Costa-Frossard, L; Fernandez-Velasco, JI; Ortega-Madueño, I; et al. Herpesvirus Antibodies, Vitamin D and Short-Chain Fatty Acids: Their Correlation with Cell Subsets in Multiple Sclerosis Patients and Healthy Controls. Cells 2021, 10, 119. [Google Scholar] [CrossRef]
- Cuello, JP; Martínez Ginés, ML; García Domínguez, JM; Tejeda-Velarde, A; Lozano Ros, A; Higueras, Y; et al. Short-chain fatty acids during pregnancy in multiple sclerosis: A prospective cohort study. Eur J Neurol. 2022, 29, 895–900. [Google Scholar] [CrossRef]
- Dominguez-Mozo, MI; López-Mecández, D; Villar, LM; Costa-Frossard, L; Villarrubia, N; Aladro, Y; et al. Short-chain fatty acids in multiple sclerosis: Associated with disability, number of T2 lesions, and inflammatory profile. Ann Clin Transl Neurol. 2025, 12, 478–490. [Google Scholar] [CrossRef]
- Qiu, J; Villa, M; Sanin, DE; Buck, MD; O'Sullivan, D; Ching, R; et al. Acetate Promotes T Cell Effector Function during Glucose Restriction. Cell Rep. 2019, 27, 2063–2074.e5. [Google Scholar] [CrossRef]
- Couto, MR; Gonçalves, P; Magro, F; Martel, F. Microbiota-derived butyrate regulates intestinal inflammation: Focus on inflammatory bowel disease. Pharmacol Res. 2020, 159, 104947. [Google Scholar] [CrossRef]
- Duscha, A; Gisevius, B; Hirschberg, S; Yissachar, N; Stangl, GI; Dawin, E; et al. Propionic Acid Shapes the Multiple Sclerosis Disease Course by an Immunomodulatory Mechanism. Cell. 2020, 180, 1067–1080. [Google Scholar] [CrossRef]
- Rohde, JK; Fuh, MM; Evangelakos, I; Pauly, MJ; Schaltenberg, N; Siracusa, F; et al. A Gas Chromatography Mass Spectrometry-Based Method for the Quantification of Short Chain Fatty Acids. Metabolites 2022, 12, 170. [Google Scholar] [CrossRef] [PubMed]
- Hinkle, DE; Wiersma, W; Jurs, SG. Applied Statistics for the Behavioral Sciences, 5th ed.; Houghton Mifflin: Boston, 2003. [Google Scholar]
- de Groot, PF; Belzer, C; Aydin, Ö; Levin, E; Levels, JH; Aalvink, S; et al. Distinct fecal and oral microbiota composition in human type 1 diabetes, an observational study. PLoS ONE 2017, 12, e0188475. [Google Scholar] [CrossRef] [PubMed]
- Abuqwider, J; Salamone, D; Scidà, G; Corrado, A; Costabile, G; Luongo, D; et al. Sex-specific associations of serum short-chain fatty acids with glycaemic control: an Italian cross-sectional study in adults with type 1 diabetes. BMJ Open. 2025, 15, e096994. [Google Scholar] [CrossRef] [PubMed]
- Nobili, A; Pane, M; Skvortsova, M; Ben Salem, M; Morgenthaler, S; Jamieson, E; et al. Innovative Biomarkers for Obesity and Type 1 Diabetes Based on Bifidobacterium and Metabolomic Profiling. Microorganisms 2024, 12, 931. [Google Scholar] [CrossRef] [PubMed]
- Pham, NHT; Joglekar, MV; Wong, WKM; Nassif, NT; Simpson, AM; Hardikar, AA. Short-chain fatty acids and insulin sensitivity: a systematic review and meta-analysis. Nutr Rev. 2024, 82, 193–209. [Google Scholar] [CrossRef]
- Zhang, X; Wang, D; Zheng, Y; Tu, Y; Xu, Q; Jiang, H; et al. Sex-dependent effects on the gut microbiota and host metabolome in type 1 diabetic mice. Biochim Biophys Acta Mol Basis Dis. 2021, 1867, 166266. [Google Scholar] [CrossRef]
- Pérez-Pérez, S; Domínguez-Mozo, MI; Alonso-Gómez, A; Medina, S; Villarrubia, N; Fernández-Velasco, JI; et al. Acetate correlates with disability and immune response in multiple sclerosis. PeerJ 2020, 16, e10220. [Google Scholar] [CrossRef] [PubMed]
- Levy, M; Kolodziejczyk, AA; Thaiss, CA; Elinav, E. Dysbiosis and the immune system. Nat Rev Immunol. 2017, 17, 219–232. [Google Scholar] [CrossRef]
- Neuman, V; Plachy, L; Pruhova, S; Sumnik, Z. Dietary Components in the Pathogenesis and Prevention of Type 1 Diabetes in Children. Horm Res Paediatr. 2024, 5, 1–11. [Google Scholar] [CrossRef]
- Stefanaki, C; Rozou, P; Efthymiou, V; Xinias, I; Mastorakos, G; Bacopoulou, F; et al. Impact of Probiotics on the Glycemic Control of Pediatric and Adolescent Individuals with Type 1 Diabetes: A Systematic Review and Meta-Analysis. Nutrients 2024, 16, 2629. [Google Scholar] [CrossRef]
- Vassallo, GA; Dionisi, T; De Vita, V; Augello, G; Gasbarrini, A; Pitocco, D. The role of fecal microbiota transplantation in diabetes. Acta Diabetol 2025. [Google Scholar] [CrossRef]
- Harrison, K; Kaur, R; Wren, BW; Dawson, LF. Production of p-cresol by decarboxylation of p-HPA by all five lineages of Clostridioides difficile provides a growth advantage. Front Cell Infect Microbiol. 2021, 11, 757599. [Google Scholar] [CrossRef]
- Yu, L; Que, T; Zhou, Y; Liu, Z. Dose-response relationship of serum ferritin and dietary iron intake with metabolic syndrome and non-alcoholic fatty liver disease incidence: a systematic review and meta-analysis. Front Nutr. 2024, 11, 1437681. [Google Scholar] [CrossRef]
- Gross, JL; de Azevedo, MJ; Silveiro, SP; Canani, LH; Caramori, ML; Zelmanovitz, T. Diabetic nephropathy: diagnosis, prevention, and treatment. Diabetes Care 2005, 28, 164–176. [Google Scholar] [CrossRef] [PubMed]
- Stadler, M; Bollow, E; Fritsch, M; Kerner, W; Schuetz-Fuhrmann, I; Krakow, D; et al. Prevalence of elevated liver enzymes in adults with type 1 diabetes: A multicentre analysis of the German/Austrian DPV database. Diabetes Obes Metab. 2017, 19, 1171–1178. [Google Scholar] [CrossRef] [PubMed]
- Gomes, MB; Santos, DC; Drummond, K; Pinheiro, A; Muniz, LH; Leal, F; et al. Prevalence of overweight/obesity and its relationship with metabolic syndrome and fatty liver index in adult patients with type 1 diabetes. A Brazilian multicenter study. Diabetol Metab Syndr. 2023, 15, 28. [Google Scholar] [CrossRef]
- Lee, TL; Hsuan, CF; Hsu, CC; Wei, CT; Wang, CP; Lu, YC; et al. Associations of circulating total p-cresylsulfate and indoxyl sulfate concentrations with central obesity in patients with stable coronary artery disease: sex-specific insights. Int J Obes (Lond) 2024, 48, 1775–1784. [Google Scholar] [CrossRef]
- Rangel-Huerta, OD; Pastor-Villaescusa, B; Gil, A. Are we close to defining a metabolomic signature of human obesity? A systematic review of metabolomics studies. Metabolomics 2019, 15, 93. [Google Scholar] [CrossRef] [PubMed]
Figure 1.
A. Comparisons of gut metabolite concentrations between T1D patients and HC. B. Comparisons of the different SCFA/AA ratios between T1D patients and HC. p-values were calculated using the Student's t-test or the Mann-Whitney U test in case the values of the SCFA or the ratios did not fit a normal distribution. Only significant p-values after Bonferroni correction are shown (p<0.005). n.s.: not significant.
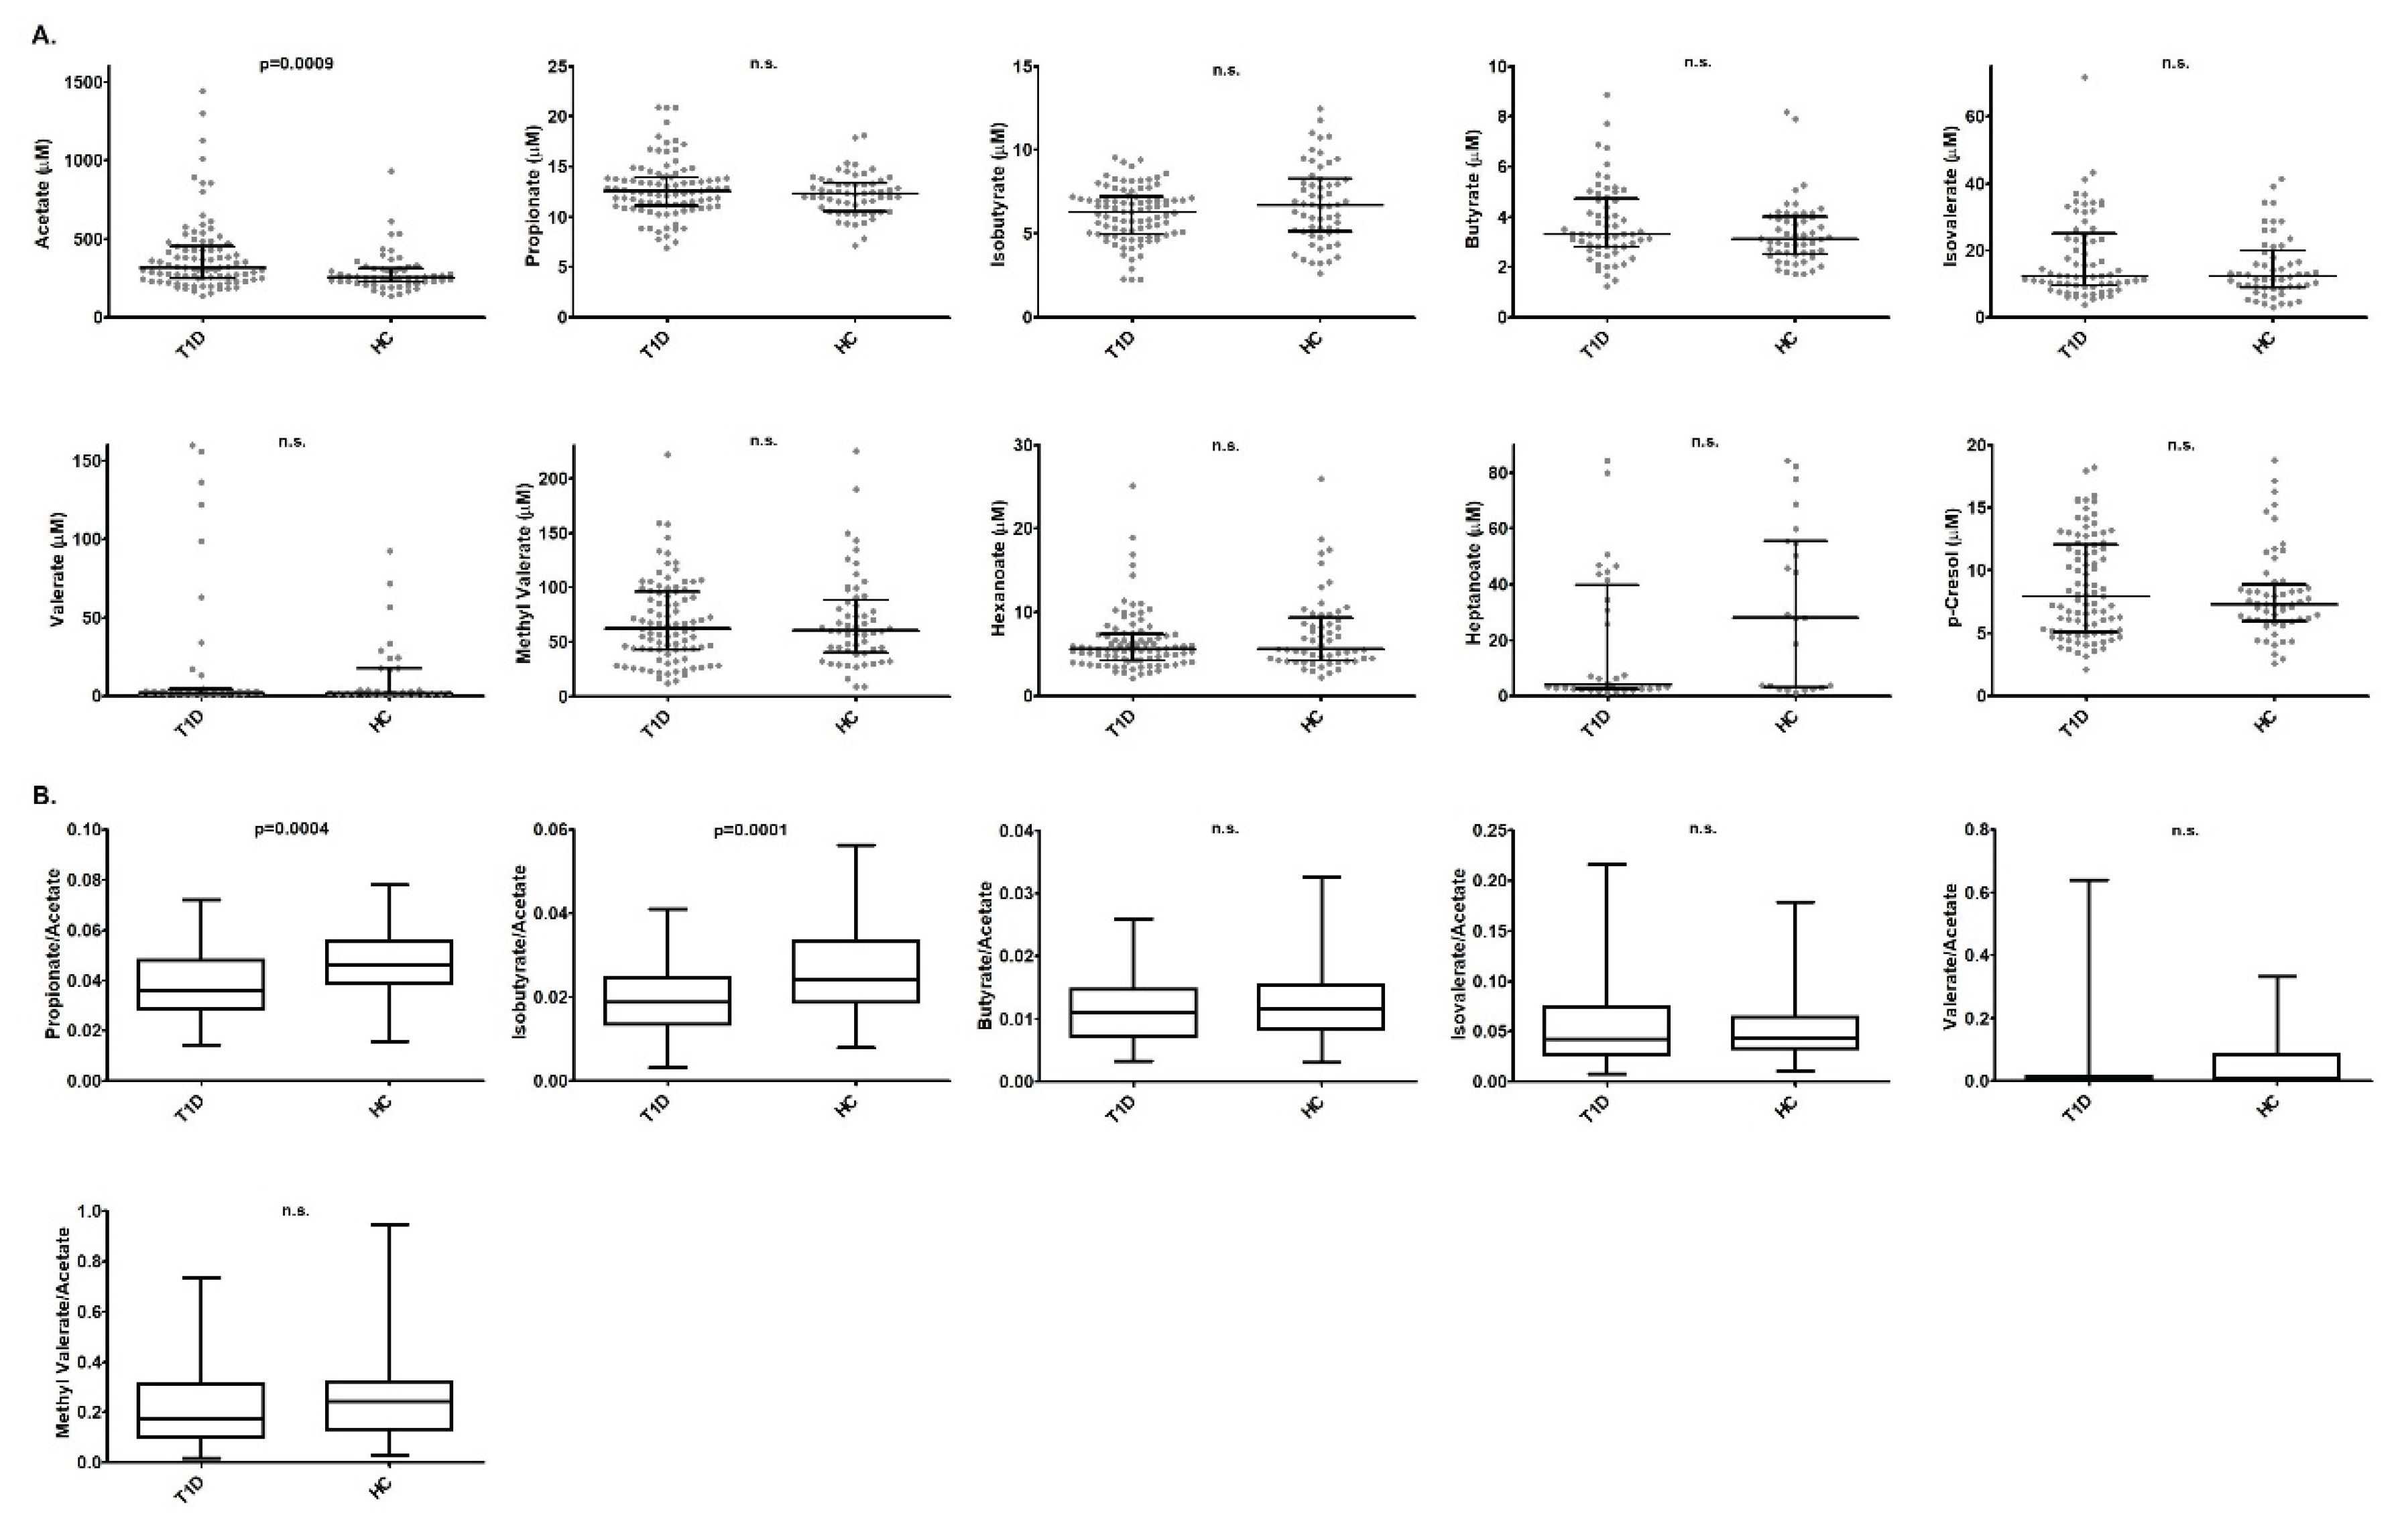
Figure 2.
Correlations between SCFA ratios with the percentage of glycated haemoglobin (HbA1c) in T1D patients. Correlations were assessed by using the Spearman's rank correlation coefficient (r); n.s.: not significant.
Figure 2.
Correlations between SCFA ratios with the percentage of glycated haemoglobin (HbA1c) in T1D patients. Correlations were assessed by using the Spearman's rank correlation coefficient (r); n.s.: not significant.
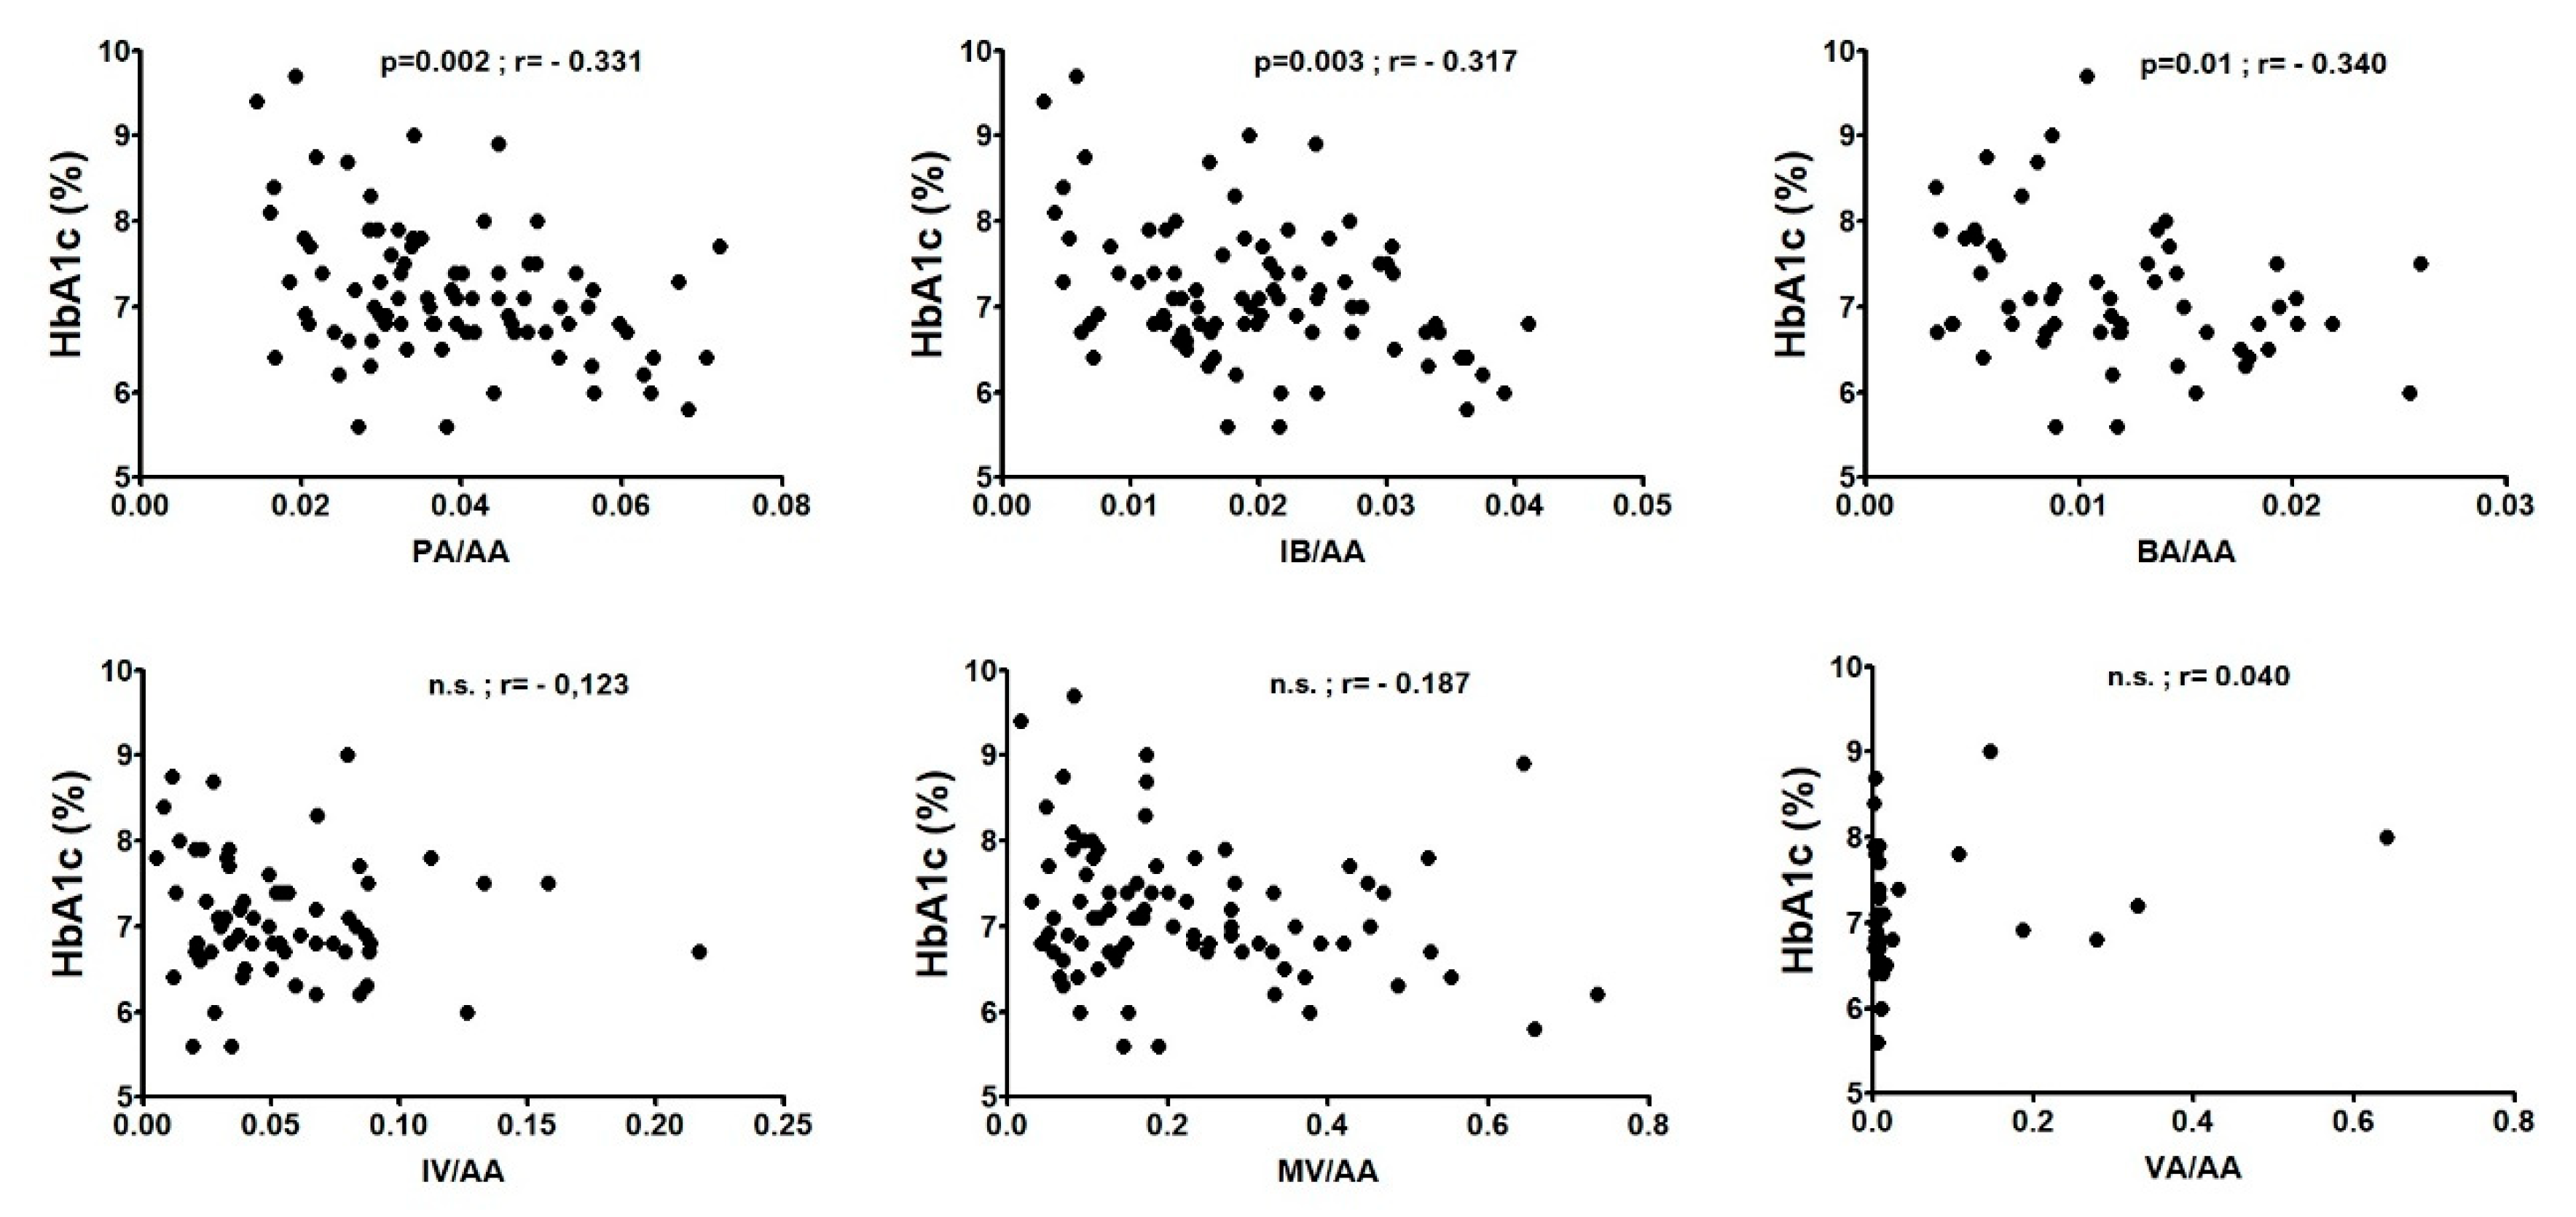

Table 1.
Clinical and demographic data.
| T1D (n=91) | HC (n=58) | p | |
| Sex (female/n) | 51/91 | 31/58 | n.s. |
| Age at sampling (years, m ± SD) | 47.6±13.5 | 46.2±11.8 | n.s. |
| Age at T1D onset (years, m ± SD) | 19.9±12.1 | - | - |
| T1D duration (months, md (P25-P75)) | 354 (206-450) |
- | - |
| % HbA1c at sampling (md (P25-P75)) | 7.1% (6.7%-7.7%) |
- | - |
| % T1D patients with serious complications* | 45/91 (49.5%) |
- | - |
| % T1D patients with other diagnostics** | 16/91 (17.6%) |
- | - |
* As serious complications of T1D were considered: microvascular complications (retinopathy, microalbuminuria, peripheral neuropathy and ischemic heart disease) and acute hypoglycemia episodes. ** Other diagnostics: Celiac Disease, Psoriasis, Rheumatoid Arthritis, Asthma, Vitiligo, Papillary Thyroid Carcinoma, Ovarian Carcinoma, Erosive Gastritis, Chronic Gastritis, Irritable Bowel Syndrome, Addison’s Disease, Grave’s Disease and Epilepsy.
Table 2.
Clinical and analytical variables collected in T1D patients.
| Categorical Variables | Continuous Variables |
| Sex (female; male) | Age |
| Debut | Age at diagnosis |
| Current treatment (CSII; MDI) | Disease duration |
| Hidroferol treatment (yes; no) | Weight |
| Serious complications (yes; no) | Body Mass Index |
| Other diagnostics (yes; no) | % HbA1c |
| High Blood Pressure (yes; no) | Glucose |
| Hypercholesterolemia (yes; no) | Vitamin D |
| Hypothyroidism (yes; no) | Vitamin B12 |
| Liver profile (normal; not normal) | Creatinine |
| Glomerular filtration rate (>90% / <90%) | Albumin |
| Folic Acid | |
| Ferritin | |
| C-Reactive Protein |
Table 3.
Bacterial metabolites analysed by GC-MS.
| NAME | ABBREVIATION | Nº OF CARBONS | |
| Short-chain fatty acids: | Acetate | AA | 2 |
| Propionate | PA | 3 | |
| Butyrate | BA | 4 | |
| Isobutyrate | IBA | 4 | |
| Methyl valerate | MVA | 5 | |
| Isovalerate | IVA | 5 | |
| Valerate | VA | 5 | |
| Medium-chain fatty acids: | Hexanoate or Caproate | HxA | 6 |
| Heptanoate or Enanthate | HpA | 7 | |
| Aromatic compounds: | Para-cresol | p-cresol | 7 |
Table 4.
Levels and ratios of SCFA and levels of MCFA and p-crestol in T1D patients and HC by sex.
| HCw* | HCm* | p** | T1Dw* | T1Dm* | p** |
p* HCw vs. T1Dw |
p* HCm vs. T1Dm |
|
| AA (g/ml) | 249.2 | 296.5 | n.s. | 316.1 | 317.4 | n.s. | 0.003 | n.s. |
| PA (g/ml) | 12.4 | 12.0 | n.s. | 12.8 | 12.5 | n.s. | n.s. | n.s. |
| IBA (g/ml) | 6.8 | 6.1 | n.s. | 6.4 | 6.2 | n.s. | n.s. | n.s. |
| BA (g/ml) | 3.2 | 2.7 | n.s. | 3.3 | 3.2 | n.s. | n.s. | n.s. |
| IVA (g/ml) | 11.5 | 12.9 | n.s. | 12.8 | 12.2 | n.s. | n.s. | n.s. |
| VA (g/ml) | 3.1 | 1.8 | n.s. | 1.9 | 2.7 | n.s. | n.s. | n.s. |
| MVA (g/ml) | 66.2 | 56.4 | n.s. | 69.5 | 53.7 | n.s. | n.s. | n.s. |
| PA/AA | 0.052 | 0.040 | 0.009 | 0.036 | 0.039 | n.s. | 0.00008 | n.s. |
| IBA/AA | 0.029 | 0.022 | 0.026 | 0.019 | 0.019 | n.s. | 0.0002 | n.s. |
| BA/AA | 0.014 | 0.010 | 0.042 | 0.012 | 0.011 | n.s. | 0.041 | n.s. |
| IVA/AA | 0.052 | 0.040 | n.s. | 0.049 | 0.038 | n.s. | n.s. | n.s. |
| VA/AA | 0.016 | 0.007 | n.s. | 0.007 | 0.007 | n.s. | n.s. | n.s. |
| MVA/AA | 0.257 | 0.170 | 0.027 | 0.223 | 0.158 | n.s. | n.s. | n.s. |
| HxA (g/ml) | 5.6 | 6.1 | n.s. | 5.5 | 5.7 | n.s. | n.s. | n.s. |
| HpA (g/ml) | 44.3 | 11.2 | n.s. | 6.5 | 2.5 | n.s. | 0.027 | n.s. |
| p-cresol (g/ml) | 8.1 | 6.2 | 0.039 | 7.3 | 8.5 | n.s. | n.s. | 0.022 |
* median values. ** p-values were calculated using the Student's t-test; n.s.: not significant.
Disclaimer/Publisher’s Note: The statements, opinions and data contained in all publications are solely those of the individual author(s) and contributor(s) and not of MDPI and/or the editor(s). MDPI and/or the editor(s) disclaim responsibility for any injury to people or property resulting from any ideas, methods, instructions or products referred to in the content. |
© 2025 by the authors. Licensee MDPI, Basel, Switzerland. This article is an open access article distributed under the terms and conditions of the Creative Commons Attribution (CC BY) license (http://creativecommons.org/licenses/by/4.0/).
Copyright: This open access article is published under a Creative Commons CC BY 4.0 license, which permit the free download, distribution, and reuse, provided that the author and preprint are cited in any reuse.


