- High-Speed EV Gear NVH: Electric vehicle drivetrains operate at much higher speeds (up to 20k–30k RPM), and lack engine noise masking, making gear whine a prominent issue. Achieving low-noise gears is critical for EV performance.
- Honing & Waviness Impact: The final gear finishing (honing) can imprint micrometer-scale waviness on teeth. If the honing machine vibrates abnormally, this pattern transfers to the gear surface, causing “ghost” noise at non-integer mesh orders that cannot be corrected later. Continuous monitoring of machine vibrations can detect this defect source.
- Cross-Coupled Vibrations: Vibrations propagate through structures; a sensor may pick up multiple machines. Order analysis (gear mesh harmonics) and advanced source separation (e.g., independent component analysis) are needed to distinguish overlapping vibration sources.
- Proposed IIoT Solution: Deploy many distributed accelerometers (preferably PoE-powered for reliability) with sub-ms time-sync (PTP) to capture vibrations simultaneously on all machines. Data is ingested via an edge gateway and sent securely (MQTT/TLS) to a cloud platform. Each vibration record is linked to part ID via scanning the gear’s DMC at machining time, enabling full traceability.
- Big Data & ML Analytics: A cloud-based pipeline (Kafka/Flink streams feeding a time-series DB and data lake) enables real-time anomaly detection (e.g., Isolation Forest for outliers in vibration signature) and periodic batch analysis. Order-tracking heatmaps, statistical features (RMS, kurtosis), and ML models (XGBoost classification if labeled good/bad parts become available) identify deviations. SHAP analysis provides explainability for model decisions, helping engineers pinpoint influential factors in anomalies. This data-driven approach helps reduce scrap, prevent gear noise issues in the field, and supports predictive maintenance and continuous process improvement.
Introduction
Modern electric vehicle (EV) drivetrains pose new NVH (Noise, Vibration, Harshness) challenges compared to traditional internal combustion engine (ICE) vehicles. EV traction motors can spin up to ~20,000–30,000 RPM, far exceeding typical ICE gearbox speeds. This high rotational speed broadens the excitation frequency spectrum and increases gear mesh frequencies, often into the audible range (leading to the characteristic gear whine). Moreover, the absence of a loud ICE means there is no masking noise – drivetrain vibrations and gear noise become plainly audible. As a result, achieving quiet, low-vibration gearboxes is paramount for EV NVH comfort.
One critical contributor to gear NVH is the micro-geometry of gear teeth. After heat treatment, gears undergo finishing (grinding or honing) to correct distortions and smooth the surface. Gear honing is often used for final finishing of hard gears to improve surface texture and accuracy. However, if the honing process or machine has imperfections (e.g., vibration, tool runout), it can introduce a minute waviness or undulation on the tooth surface. This waviness is typically on the scale of micrometers, yet it can have pronounced NVH effects. In particular, a periodic undulation on teeth leads to a modulation of the gear meshing stiffness or transmission error, which in turn can produce tonal noises known as “ghost tones” or “ghost orders” that are not simple multiples of the gear mesh frequency. Ghost noise is heard as an irritating, abnormal tone in the vehicle cabin and is highly undesirable. Research by Matsuishi et al. (2021) documented a case where an 0.8× gear mesh order noise in a transmission was traced to an unintended surface undulation caused by an abnormal honing machine vibration. Detailed analysis showed that the affected gear had a periodic error (waviness) along the tooth trace; the frequency of this error matched the 0.8 order ghost tone observed in the vehicle. In other words, the honing machine’s vibration “imprinted” a flaw in the gear that later manifested as ghost noise. Crucially, once this waviness is in the gear, it is “baked in” – it cannot be removed without re-finishing or scrapping the part. This underscores that early detection of such process-induced errors is vital. Monitoring the honing machine’s condition and vibrations can allow detection of these anomalies during production, enabling corrective action (e.g., machine maintenance or isolating suspect gears) before the gears are built into axles.
Identifying the root cause of gear NVH issues, however, is challenging in a mass-production environment. A particular difficulty is source identification in the presence of multiple vibration sources. In a busy transmission manufacturing line, multiple machines (hobbing, heat treatment, honing, testing rigs, etc.) operate simultaneously. Vibrations from one machine can transmit through the floor or structure and be picked up by sensors on another machine – a form of structure-borne cross-talk. As a result, a vibration sensor might measure a superposition of its own machine’s signal plus contributions from neighboring equipment. This makes it hard to tell whether a measured spike or spectral line is due to the machine being monitored or an external source. Traditional single-point measurements thus can lead to false alarms or missed detections. To disentangle this, techniques like order analysis and spatial sensor arrays are used. Order analysis, which tracks vibration components synchronous with specific rotation speeds, can help attribute vibration to the correct rotating component (e.g., distinguishing a 60-tooth gear’s mesh frequency vs. a 61-tooth gear). Additionally, advanced signal processing such as transfer path analysis (TPA) and blind source separation (BSS) can be applied. For example, Hanioka et al. (2025) applied TPA on a gear honing machine to pinpoint which vibration direction and frequency had the largest effect on gear error. More generally, researchers have explored using independent component analysis (ICA) to separate mixed vibration sources in rotating machinery environments. When multiple sensors are distributed on different machines, BSS algorithms can leverage the slight differences in the mixed signals to estimate the true source signals, isolating cross-coupled vibrations. These methods benefit greatly from accurate time synchronization between sensors – if all sensors share the same time base (within microseconds), one can directly compare vibration time-series or phase information across the factory to identify propagation delays and likely sources.
In light of these challenges, this paper proposes a comprehensive Industrial IoT (IIoT) solution for NVH monitoring in gear production. The concept is to deploy a network of many inexpensive vibration sensors (accelerometers) throughout the production line – for example, one on each critical machine or even multiple per machine (on machine frames, foundations, etc.). By itself, a single low-cost accelerometer (such as a MEMS-based sensor) is limited in accuracy and bandwidth; but by using many sensors and clever analytics, the system can still extract useful patterns. All sensors would be synchronized via Precision Time Protocol (PTP) to a common clock, enabling meaningful correlation of events across the plant. Each sensor’s data is ingested through edge gateways that perform initial processing (timestamp alignment, optional filtering) and then transmitted to a central cloud platform for aggregation and analysis. Crucially, every measurement or event is to be tied to the specific work order and part (gear) ID: this is achieved by scanning the gear’s Data Matrix Code (DMC) at the time of measurement and associating that code in the data record. In practice, as a gear goes through finishing or testing, a scanner reads its unique DMC (which encodes the part’s ID or serial and work order) and the system software links any vibration data from that machine (during that part’s processing cycle) to the part’s ID. This DMC-based data linking ensures full traceability – later, if a gear is found to be noisy, one can retrieve its vibration data history during manufacturing; conversely, if an anomaly is detected during machining, one can quarantine that specific part.
The aggregation of vibration data from dozens of sensors over thousands of parts yields “Big Data” – high-volume, high-variety time-series data. The proposed solution leverages cloud-based storage and analytics to handle this. High-speed, time-stamped data from sensors would stream into a time-series database (for structured metrics) and an object store (for raw waveforms or spectra). Real-time processing frameworks (such as Apache Kafka for data streaming and Apache Flink or Spark for stream analytics) would run anomaly detection algorithms to flag unusual vibrations as they occur. For example, if a honing machine’s vibration at a certain frequency exceeds learned baselines (possibly indicating a developing issue with a honing wheel or spindle), the system can raise an alert immediately (e.g., to operators or maintenance engineers). In parallel, the accumulated data can be used for post hoc analyses. Engineers might explore correlations (e.g., does a certain vibration pattern correlate with gears that fail end-of-line noise tests?). Machine learning (ML) models can be trained on historical data to predict or classify gear quality. Since labeling each gear as “noisy or quiet” may require end-of-line testing or field feedback, a semi-supervised approach is viable: methods like Isolation Forest (iForest) can learn what “normal” vibration signatures look like and detect outliers without needing labels. If some labeled examples of problematic gears are available, supervised models like XGBoost (a gradient-boosted decision tree algorithm) can be trained to classify parts or to predict a quality score from vibration features. A key aspect is ensuring these models are explainable, given the black-box nature of many ML models. For this, we plan to apply SHAP (SHapley Additive exPlanations), which can quantify each input feature’s contribution to a particular prediction. In the context of gear vibration, SHAP can help answer, for instance: “Was it an unusual increase in the 2nd harmonic or a burst of broadband vibration that led the model to flag this gear as anomalous?” Such insight is crucial for engineers to trust and act on the system’s alerts.
In summary, our contributions are: (1) a literature review linking gear micro-geometry errors (especially honing-related waviness) to NVH outcomes, and surveying Industry 4.0 technologies (sensors, sync, data infrastructure, ML) that can mitigate these issues; (2) a feasibility study analyzing design choices for implementing a cloud-based NVH monitoring system under real-world constraints; and (3) a proposed conceptual design of the system architecture and data model, including figure illustrations. The ultimate goal is to enable smarter manufacturing of gears – reducing scrap and rework by catching problems early, and building a data foundation for continuous improvement and predictive maintenance. By monitoring and analyzing every gear’s “acoustic fingerprint” through production, manufacturers can move towards zero-defect quality and quieter electric drives.
Methodology: Literature Search Strategy
To ground this study in state-of-the-art knowledge, we conducted a broad literature search focusing on relevant domains: gear noise and manufacturing, time synchronization in industrial sensing, IoT architectures for condition monitoring, and machine learning for anomaly detection. We targeted primarily peer-reviewed sources (journals and conference papers from IEEE, ASME, SAE, Elsevier, Springer, Wiley, IOP, MDPI, etc.) from the last ~15 years (2005–2025, with an emphasis on 2015–2025 for recent advances). A secondary inclusion of industry white papers, standards, and technical reports was allowed for topics where formal publications are scarce (e.g., specific standards like IEEE 1588 or proprietary tech notes on sensors), but these are clearly indicated as such.
Databases Searched: IEEE Xplore, Scopus, Web of Science, ScienceDirect (Elsevier), SpringerLink, Wiley Online Library, ASME Digital Collection, SAE Mobilus, MDPI, IOPscience, and SAGE Journals. We also included targeted searches in Google Scholar and specific publisher sites when necessary.
Search Terms: We prepared specific keyword combinations (in English) for each subtopic, for example:
Gear NVH: (“electric drive” OR EV OR drivetrain) AND (NVH OR “gear whine” OR “gear noise”).
Gear Honing & Waviness: (gear* AND honing) AND (waviness OR “surface texture” OR microgeometry).
Order Analysis: (“order tracking” OR “gear mesh order” OR sideband* OR “ghost noise”).
Time Sync: (“IEEE 1588” OR PTP OR “Precision Time Protocol”) AND (industrial OR manufacturing) AND (jitter OR synchronization).
OT/IT Integration: (“OPC UA” OR “OPC Unified Architecture”) AND (MES OR PLC OR SCADA) AND (telemetry OR “data integration”).
IIoT and Messaging: (IoT OR IIoT OR “industrial IoT”) AND (MQTT OR AMQP OR “edge gateway”) AND (cloud OR “predictive maintenance”).
Data Infrastructure: (“time series database” OR InfluxDB OR Timescale) AND (condition monitoring OR manufacturing).
Stream Processing: (Kafka OR Flink OR “stream processing”) AND (anomaly OR “predictive” OR maintenance).
Machine Learning: (Isolation Forest OR “one-class SVM” OR XGBoost OR SHAP) AND (vibration OR anomaly OR “condition monitoring”).
Cross-Coupling: (vibration OR “structure-borne noise”) AND (cross-coupling OR “propagation” OR “source separation”) AND (factory OR machinery).
Screening and Selection: We first collected results (titles/abstracts) – this yielded on the order of ~200 relevant-looking papers. After removing obvious irrelevant or duplicate items, about 120 sources were retained for closer screening. We applied inclusion criteria: relevance to industrial gear NVH or relevant technology (sensors, sync, etc.), and must provide technical insight or empirical results (simulation or experimental). We excluded purely marketing materials and generic IoT articles without industrial focus; we also deprioritized older sources (pre-2000) unless they were seminal (e.g., foundational gear noise texts). After reading through abstracts (and full text when necessary) of the 120, we narrowed down to ~40 key sources that cover the breadth of topics needed. From these, we further identified a core set of about 20 highly pertinent references to cite in detail (augmented by a few authoritative industry sources and standards for specific points).
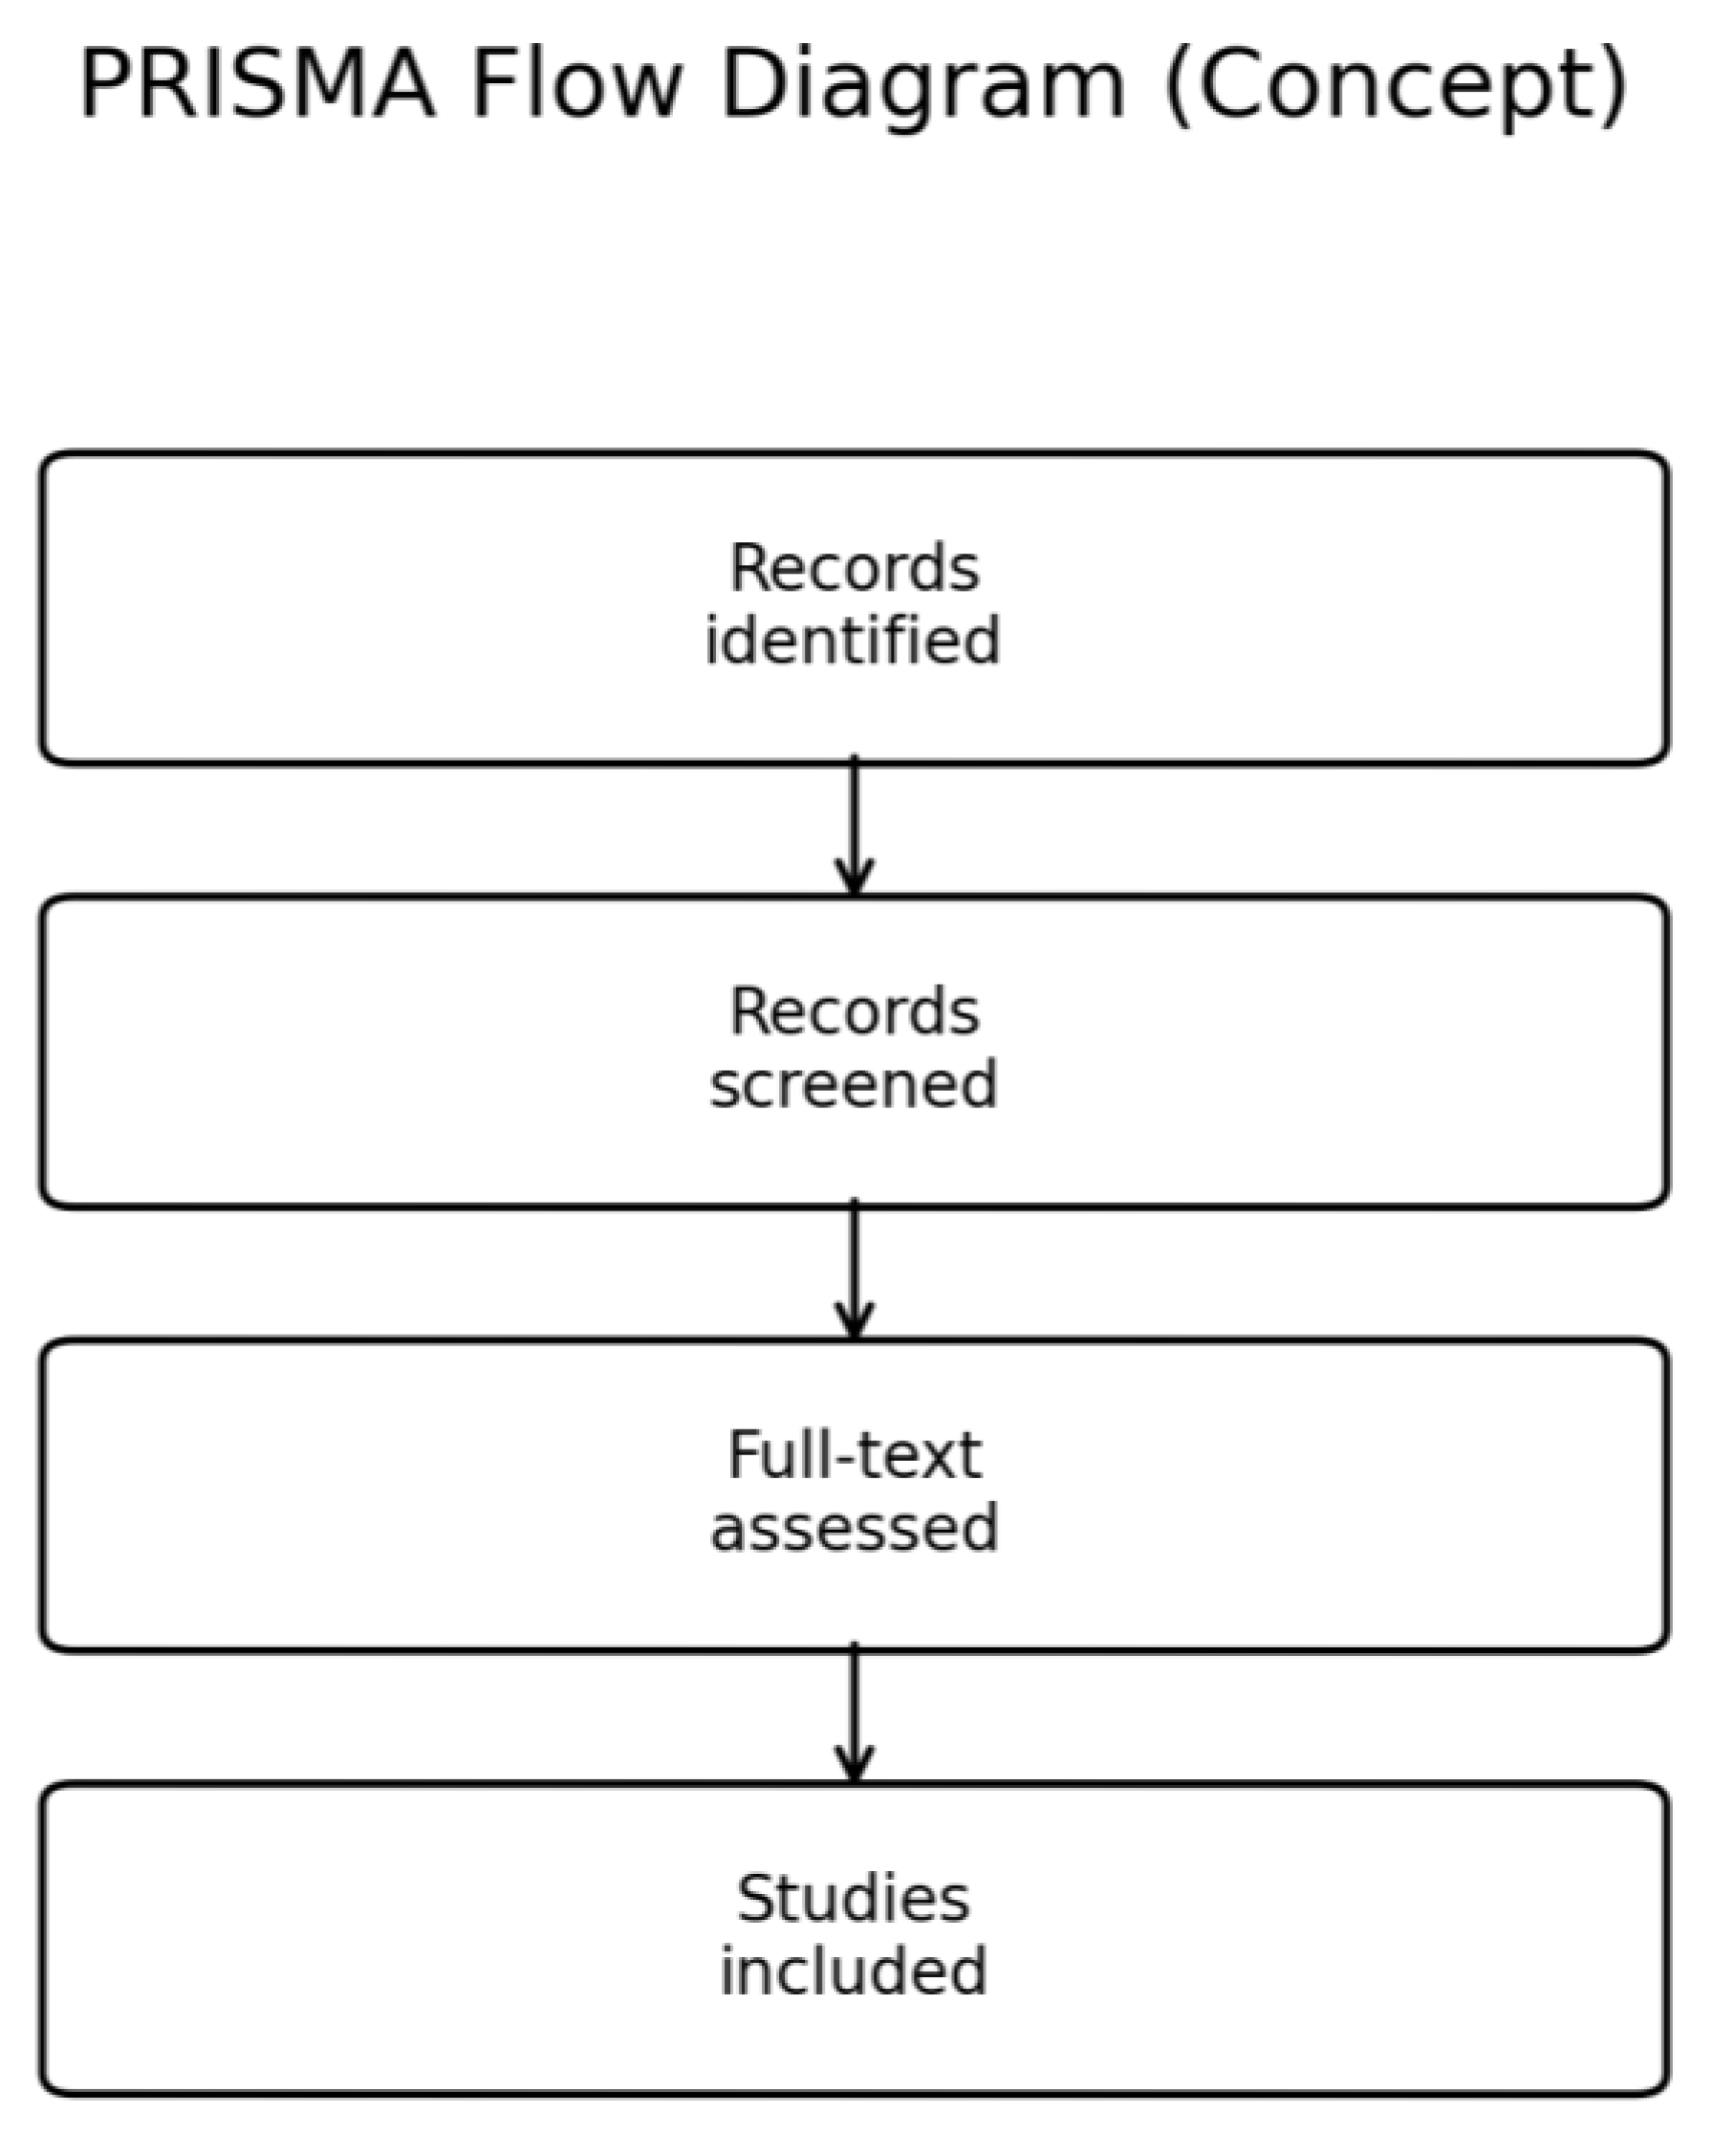
PRISMA-Style Summary: In total, approximately 200 candidate articles were identified. After title/abstract screening, ~120 were deemed potentially relevant. Of these, ~80 were further excluded due to low relevance or redundancy. 40 sources proceeded to full consideration, from which 25 sources were selected as references in this paper. This includes 18 peer-reviewed papers (research articles and reviews), 3 technical standards/notes, and 4 industry case studies or white papers. The selection covers the multifaceted topic: gear manufacturing and NVH (8 sources), industrial synchronization and networking (4 sources), IoT/cloud and data architecture (6 sources), and machine learning for anomaly detection (7 sources).
Figure 3 illustrates this selection process in a PRISMA flow diagram, and
Table 1 summarizes the key sources and their contributions.
(
Table 1 continued in Appendix for all 25 references.)
Search Validation: We cross-checked that all key themes (NVH and waviness, order analysis, sync, IoT, ML, etc.) were covered by at least one source. Where published literature was scarce (e.g., linking DMC traceability with sensor data), we relied on industry knowledge and rationale, noting this as a gap. Overall, the literature search confirms that while individual aspects (gear noise mechanisms, IoT monitoring, etc.) are documented, an integrated approach like ours (combining all these for a full smart factory NVH solution) is novel.
Literature Review
Gear Microgeometry (Waviness) and NVH
The relationship between gear microgeometry errors and NVH has been well documented. Transmission error (TE) – the deviation between actual and ideal gear angle transfer – is a primary excitation of gear noise. Even minute periodic errors on the gear teeth can cause significant tonal noise. Gear waviness refers to a low-frequency undulation of the tooth surface (in profile or lead direction) with a wavelength longer than surface roughness but shorter than tooth spacing. Waviness can result from machining tool marks or vibrations in finishing processes. Unlike random surface roughness, waviness tends to be in phase from tooth to tooth, hence it can excite specific frequencies as the gear rotates (effectively adding sidebands or ghost frequencies around the main mesh frequency).
Honing, as a finishing method, can both reduce and introduce waviness. Its purpose is to “polish” the tooth surface and correct heat treat distortion. A properly done honing can actually improve NVH by imparting a fine cross-hatch texture that breaks up noise. In fact, one source notes that the “staggered texture produced by gear honing has less meshing noise” compared to grinding. However, as seen in the JATCO case, any anomaly in the honing machine (imbalance, bad bearing, etc.) can superimpose an unwanted pattern. Matsuishi et al. reported that an abnormal vibration of the honing machine (sudden in operation) imprinted an undulation on all teeth of a gear, which was invisible in standard measurements except when doing a high-resolution form analysis. The spectrum of the measured tooth error showed a peak corresponding exactly to the ghost noise order (0.8). This kind of error would not be caught by routine QC if only a few teeth are measured or if standard tolerances (which are focused on total profile error, etc.) are used. It required detailed noise analysis to trace it back. This illustrates why 100% inspection for NVH-critical features (like waviness) is gaining traction. Türich & Deininger (2024) describe a system where every gear, immediately after grinding, is run through a dual-flank roll test combined with laser scanning to capture its geometry deviations, including waviness, in the lead and profile. This allows predicting the gear’s noise behavior in a loaded gearbox by feeding the measured deviations into a tooth contact analysis. The ability to perform such in-process, full inspection of noise-related errors on all parts is relatively new (enabled by faster metrology and computing) and is a direct response to tighter EV noise requirements. It essentially tries to detect issues like the honing-induced ghost noise before the gear leaves the factory.
In summary, literature underscores that manufacturing errors – even those meeting traditional dimensional tolerances – can cause ghost noise. Waviness or periodic errors are particularly insidious. They often originate from machine vibrations (honing or grinding), wheel dressing errors, or even subtle issues like machine thermal growth or periodic clamping deflections. Once present, their effect is a sideband or ghost tone in the noise spectrum: if the gear mesh order is N (teeth per rev), a waviness of wavelength k teeth leads to an excitation at N ± (N/k) orders, etc. These are not integer orders and so are easily distinguished from normal harmonics. The key takeaway is that controlling and detecting waviness is critical – and this motivates continuous vibration monitoring of the finishing machines themselves, as well as advanced gear inspection. Modern gear production is thus moving toward an NVH-aware quality control, where the surface micro-geometry is not just measured in terms of microns of error, but evaluated for its noise potential.
Order Tracking Analysis and Vibration Metrics
To analyze rotating machinery vibrations, order tracking is a fundamental technique. Order analysis refers to examining vibration or noise as a function of the rotational speed (orders are harmonics of rotation). For a gear with Z teeth, the gear mesh fundamental frequency is Z times the rotation frequency – this corresponds to the Zth order of that shaft. Classic gear whine is dominated by the mesh order and its multiples. Deviations like eccentricity or runout produce sidebands around the mesh frequency at spacing equal to shaft rotation frequency (i.e., sidebands at mesh order ±1, ±2, etc., often indicating once-per-rev modulation). Waviness or ghost tones, as mentioned, appear as non-integer orders (e.g., 0.8 order in the example) which indicates an excitation not tied to a whole number multiple of rotation.
Order tracking can be done with fixed-speed data via Fourier analysis or with run-up/coast-down data via computed order tracking (resampling in angle domain). For steady-state monitoring in a production setting, often the machines run at constant speed during cutting or finishing, so orders manifest as peaks in the frequency spectrum at predictable frequencies (given known RPM). Tachometers or encoders are used to track exact speed and to provide a reference trigger for synchronous averaging or phase analysis.
Key vibration metrics include: overall RMS level (broadband vibration), specific order amplitudes (e.g., energy at 1×, 2× gear mesh, etc.), and statistical measures like kurtosis and crest factor. Kurtosis (fourth moment) is sensitive to spiky, non-Gaussian signals and is often used to detect bearing faults or gear tooth cracks – a high kurtosis indicates the presence of occasional shock impulses amid otherwise steady vibration. Crest factor (ratio of peak to RMS) similarly captures the impulsiveness. These nonlinear metrics can indicate developing faults that order analysis might not catch if the fault is not synchronous (e.g., a cracked tooth might give a once-per-rev impact, which is an order 1 event but could be buried in other 1× content; a high kurtosis might flag its irregular nature).
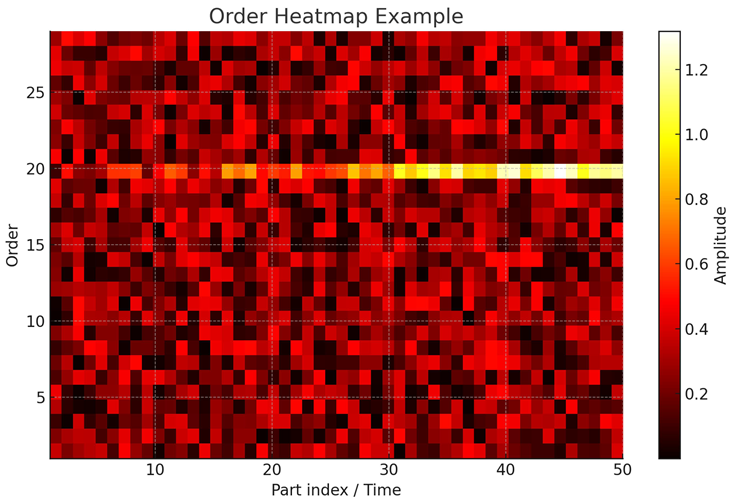
In the context of gear honing machines, if something like a loose component causes occasional impacts, kurtosis could detect that. For gear mesh quality, order-based metrics are more directly useful (e.g., a significant rise in 1× gear mesh vibration might mean a change in mesh quality or tool sharpness). Many condition monitoring systems use a combination: order spectra to pinpoint specific frequencies tied to known components, and broadband statistical features to catch any anomaly. For instance, an order color map (order versus time or versus part index) can be a powerful visualization – one of our figure suggestions (Figure 2) is an order heatmap where the x-axis might be part number (or time), y-axis is order (or frequency), and color is amplitude. This could show, say, if over the course of a day the 60th order (gear mesh) vibration on a machine is creeping up, indicating tool wear or misalignment trending.
Additionally, sideband indices (the presence of sidebands around a primary order) are monitored. Multiple sidebands around the gear mesh frequency usually indicate modulation in the time domain, often due to eccentricity or a meshing with another gear that has issues. A gear with waviness might show sidebands around mesh frequency spaced at the frequency corresponding to the waviness pattern repetition.
In summary, literature and practice suggest using a suite of vibration features: targeted order magnitudes, sideband amplitudes or spacing, and time-domain stats (RMS, kurtosis, crest). These can serve as input features for machine learning models later, or as direct triggers for simple rule-based alarms (e.g., “if gear mesh vibration > X” or “if kurtosis > Y, flag anomaly”).
Time Synchronization in Industrial Sensing (PTP vs NTP)
Accurate time synchronization is the backbone of any distributed sensing system, especially when doing comparative analysis like triangulating vibration sources or aligning events from multiple machines. In our NVH monitoring context, we might have, for example, one sensor on a honing machine and another on a shaping machine nearby; if a vibration spike is seen on both, knowing which happened first (and the time delay) could reveal the source. This requires sub-millisecond timing accuracy across sensors, which is non-trivial on standard networks.
The commonly used Network Time Protocol (NTP) can typically synchronize clocks on the order of ~10^(-3) to 10^(-1) seconds (1–100 ms range) on Ethernet networks, depending on conditions. NTP is often insufficient for industrial monitoring where milliseconds matter. In contrast, the IEEE 1588 Precision Time Protocol (PTP) is designed to synchronize clocks with much higher precision by accounting for network delays and using hardware timestamping. PTP with hardware support (e.g., in network interface cards and switches) can achieve sub-microsecond accuracy (within tens of nanoseconds in best cases). Even a software-based PTP implementation can get to ~100 µs or better sync, which is two orders of magnitude better than NTP’s ~100 ms level.
One challenge in standard Ethernet networks is jitter – variability in packet delay through switches/routers. Industrial switches with PTP support often implement boundary clock or transparent clock modes to reduce jitter. Without these, queue delays in switches could introduce jitter up to hundreds of microseconds or more. A study indicated that with typical switches under load, NTP/unsynchronized clocks could see jitter ~0.36–1 ms. By using PTP-aware switches (boundary clocks), this was mitigated to sub-microsecond jitter. In other words, a PTP-enabled network maintains much more deterministic latency.
For our system, we plan to run a PTP daemon on each edge gateway and possibly use PTP-capable switches on the sensor network (or at least ensure the network is lightly loaded and maybe use QoS). If PoE accelerometers are used, some vendors actually now offer PTP-sync functionality in the sensor (synchronized sampling) – otherwise, the gateways would timestamp sensor readings upon arrival. The goal is that all data in the cloud can be related to a common time base, allowing meaningful cross-correlation.
Another option considered is using a common trigger or clock signal distributed (e.g., a GPS clock or a hardwired sync pulse). However, in a factory, running separate timing wires is cumbersome; leveraging the existing Ethernet network with PTP is more scalable. For wireless sensors (if any are used), pure PTP may be impractical (Wi-Fi or BLE have their own latencies). In such cases, a hybrid approach might be needed: e.g., each wireless node could be NTP-synced to ~1–5 ms, and additionally detect a known periodic machine cycle (like a once-per-rev marker from a spindle) to locally align phases.
IEEE 1588 (PTP) in industrial automation is often part of the Time Sensitive Networking (TSN) suite, which ensures bounded low latency and sync over Ethernet. Many modern PLCs and devices support PTP (e.g., CIP Sync in Rockwell/ODVA is based on IEEE 1588). In our design, edge gateways will act as PTP masters or slaves as needed. If internet connectivity to a time service is allowed, we could even sync to a global clock (e.g., GPS-disciplined), but for our relative measurements it’s not necessary – what’s important is the relative synchronization of all nodes.
In short, we choose PTP over NTP for this application due to the need for ~ microsecond to sub-millisecond alignment across sensors. NTP’s ~100 ms precision would be far too coarse – for example, a vibration propagating at 5000 m/s would travel 0.5 m in 0.1 s, which is the scale of a whole machine – we could not tell which sensor saw it first. With 1 µs precision, that propagation is 0.005 mm, negligible for our purpose. Even 100 µs is ~0.5 mm, acceptable. Thus, PTP is a key enabling technology for distributed NVH monitoring. The trade-off is complexity: PTP requires either specialized hardware or careful network configuration to avoid asymmetries. Our feasibility study examines this in more detail, but the literature clearly indicates the superiority of PTP for tight sync needs.
Sensor Network Topologies and Data Acquisition Considerations
Sensor selection and placement: The primary sensing need is capturing vibration (acceleration) in the frequency range of interest. Gear mesh frequencies in EV transmissions can reach tens of kHz (for example, a gear with 100 teeth at 20,000 RPM has a mesh frequency ~33 kHz). However, structure-borne vibration measured on machine frames will often have resonances and content mostly in the sub-10 kHz range. Most NVH issues (whine, etc.) for gears manifest in audible frequencies (500 Hz to 5 kHz typically), although higher-frequency accelerations could indicate early-stage defects. Accelerometers come in different flavors: piezoelectric (IEPE) which have wide bandwidth (up to 10–20 kHz or more) and good noise floor, versus MEMS capacitive which are cheaper, can have DC response, but often lower bandwidth (a few kHz) and higher noise. For an IoT approach, MEMS sensors are attractive for cost and ease of integration (many have digital outputs). That said, MEMS tech has advanced – there are MEMS accelerometers with ±50 g range and ~10 kHz bandwidth now, although with trade-offs in noise.
Wired vs Wireless: A critical design decision is how sensors communicate. Wired connections (Ethernet or analog-to-DAQ) provide reliability, power (PoE), and consistent throughput. PoE (Power over Ethernet) accelerometers are emerging – essentially accelerometers with built-in digitizer that output data via Ethernet (and get power on the same cable). These can simplify deployment: just a single CAT5/6 cable to each sensor, carrying sync and data. Some products offer multiple IEPE accelerometer inputs on a PoE-enabled box. The advantage is robust data rates (hundreds of kS/s if needed) and no battery maintenance. Wireless sensors (e.g., using Wi-Fi 6 or Bluetooth Low Energy 5) offer easier installation (no cables), but they face issues: battery power (or the need for local power), potential data loss or latency (especially if streaming high-frequency data), and typically lower sample rates due to bandwidth limits or duty cycling (many wireless vibration sensors only send summary stats or low-rate data to conserve power).
Given NVH monitoring demands a lot of data (possibly high sample rate streaming during critical operations), a wired (Ethernet) network is likely the more feasible choice in our scenario. We envision each machine area having an industrial Ethernet switch connecting 4–8 accelerometers and an edge gateway. PoE can make the install easier (no separate power to sensors). There are also daisy-chainable sensors or those that support Ethernet daisy chaining to minimize switch ports.
Sampling and anti-aliasing: Each accelerometer node or gateway will sample the vibration. Anti-alias filters are a must if we want frequencies up to F_max – typically one would sample at 2.5× or more of the highest frequency of interest. For example, to capture up to 10 kHz, sample at 25 kHz or 51.2 kHz (common choice in analyzers). Many IEPE sensors use 24-bit ADCs at such rates. MEMS sensors with digital output often have built-in sigma-delta ADCs and filtering.
Triggering and synchronization: With PTP, one approach is to have the gateway instruct all sensors to start sampling at a certain PTP time (e.g., on the next one-second boundary) so that data streams are aligned. Alternatively, each data packet could be timestamped by the sensor/gateway. The precise sync at the sampling level might not be critical if each sample has a timestamp – we can always align in software as long as the clock is synced. However, for ease of analysis it’s nice if all time-series are on the same sample grid or at least resample-able to it.
Supplementary sensors: Besides accelerometers, for NVH root cause we might integrate a few microphones in the factory (to correlate structure vibration with airborne sound) and tachometers or encoders on rotating shafts to provide reference RPM signals for order tracking. For example, a simple magnetic pickup on a machine’s spindle or a once-per-rev signal from the CNC controller could be ingested via OPC UA or a DAQ. These allow computing order spectra in real time. The tachometer itself doesn’t need PTP sync if its data is fed to the same system, as long as we can match its timing to the vibration data; but ideally the gateway itself reading tach signals uses the same clock.
Network topology: The sensors and gateways will form an edge network. Likely we’ll use the plant’s existing Ethernet network (segmented for OT data). Given the volume of vibration data, we might isolate this traffic either physically or via VLAN/QoS to not interfere with critical control traffic. Edge gateways could buffer data if network is disrupted (important for reliability – they might have an SD card for local store-and-forward).
Data reduction at edge: Transmitting every raw waveform to cloud can be heavy. Depending on the frequency and number of sensors, we might be dealing with tens of MB per second. Edge processing can reduce this by calculating spectral features or compressing data. For example, the gateway can compute the order spectrum or a FFT every second and send those, rather than raw time series, for continuous monitoring. Raw time series might be uploaded only when an anomaly is detected or for a small percentage of parts for archival. This edge analytics approach aligns with many IIoT paradigms to save bandwidth and cloud storage.
Reliability and environmental factors: Factory vibration sensors must be robust (temperature, noise, etc.). MEMS might drift or saturate if shock events occur. We may need a mix: e.g., high-quality piezo sensors on critical machines (like honing, which is extremely critical for NVH) and cheaper MEMS on less critical points. The literature on wireless vs wired condition monitoring suggests that while wireless is attractive for retrofit, wired is still preferred when data fidelity is paramount. Our approach leans on wired PoE for consistency.
Overall, a star topology (sensors to local gateway or switch) feeding into a hierarchical network is expected. The next section on OT–IT integration will detail how this sensor data intersects with machine control data (like MES/PLC info).
OT–IT Integration: Linking Machine Data, MES, and IIoT
“OT” (Operational Technology) refers to factory floor systems like PLCs, CNC machine controllers, SCADA, and MES (Manufacturing Execution System). “IT” refers to enterprise/cloud systems and analytics. Bridging OT and IT is at the heart of Industry 4.0. In our case, OT data such as which part is being processed on which machine at a given time, machine settings (speeds, feeds, etc.), and quality data (e.g., post-process measurements) are extremely valuable to contextualize the vibration signals.
OPC UA (OPC Unified Architecture) is the de facto standard for vendor-agnostic communication between machines and higher-level software. It provides a structured data model where machines can expose variables (e.g., current spindle RPM, current part ID, etc.). Many modern machines or MES systems have OPC UA servers. We plan to use an OPC UA client on the edge gateway to pull relevant data: for instance, when a new part starts honing, the MES/PLC can provide the work order or DMC code and trigger an event. OPC UA is known for being heavy (it’s a verbose protocol and not ideal for high-speed streaming of raw data), but for moderate-rate telemetry and events it’s fine. For our high-rate vibration, we would not send that through OPC UA; rather we send it via MQTT or Kafka. OPC UA is just for metadata: machine states, part identifiers, etc., essentially integrating with the MES.
For example, consider a scenario: the MES knows that at 10:00:00, part #12345 (with DMC code X) began honing on Machine 3 with Tool ID 556, program “FinishPass_A”. The OPC UA client on our gateway subscribes to a “work order start” node. It gets this info and tags the subsequent vibration data from Machine 3 with part #12345, tool 556, etc. This contextual data is invaluable when analyzing patterns (we can later filter all data by tool ID to see if a certain tool causes more vibration, or compare part vibration between different machines, etc.).
Integration with PLC signals via OPC UA can also get rotational speed signals or even vibration from the machine’s own sensors if available. Additionally, if the machine has CNC variables like spindle power or acoustic emission sensors, those could be fused.
MQTT vs AMQP vs REST: For pushing data to the cloud, message queuing protocols like MQTT (Message Queuing Telemetry Transport) are popular in IIoT for their light weight and publish-subscribe model. We could have the edge gateways publish topics like “factory/line1/machine3/vibration” with JSON or binary payloads. MQTT is efficient over unreliable networks and supports TLS security. Another option is AMQP (used by some cloud IoT hubs) or even sending directly to Kafka (confluent Kafka can accept via REST proxy, etc.). A recent trend is OPC UA Pub/Sub, which blends OPC UA’s data modeling with a message-broker transport. However, given our system complexity, a simpler separation of concerns is fine: OPC UA for machine context, MQTT (or Kafka client at edge) for streaming sensor data.
Data modeling: We define a minimal schema for messages (see Concept Design for details). Each message might contain fields like timestamp, machine_id, sensor_id, part_id (DMC), feature_type (e.g., “RMS” or “order_spectrum”), and the data values. For time-series DB insertion, a tagset of identifiers with a time index is used. This combination of IT and OT data allows sophisticated queries, like: “show me all parts that had an unusual 2nd order vibration and which honing machine they came from”.
Security: Integrating OT and IT raises security concerns – factory equipment must be protected from any interference. Our gateways will be dual-homed: one side on the OT network (only reading data, not writing any control unless absolutely needed for sync triggers) and one side on the IT network pushing to cloud. OPC UA has built-in security (certificates, encryption) which we will use, and MQTT will be over TLS with client-auth if possible. Network segmentation (firewalls) will ensure only the required data flows. This is standard practice in IIoT deployments where you have to ensure that, say, a malware in cloud cannot ever send a command that stops a machine.
In summary, OT–IT integration via OPC UA (for context data) and MQTT/REST (for big data) provides a unified data pipeline: production context + sensor streaming. This is crucial because big data without context is of little use – we want to trace everything back to the specific part and process that generated it.
Cloud Architecture for NVH Data: Storage and Processing
Handling the volume and velocity of NVH data requires a scalable cloud (or on-premise server) architecture. Key components we propose: a time-series database (TSDB), an object storage system, a stream processing engine, and batch analytics/ML pipelines.
A Time-Series Database (like InfluxDB, TimescaleDB, or DynamoDB with time keys) is optimized for storing timestamp-indexed numerical data efficiently and querying it by time or other tags. InfluxDB, for instance, supports high write throughput and retention policies – we can keep high-resolution data for say 1 month and downsample or delete older raw data, while keeping summary statistics longer. We would use TSDB to store processed features of the vibration signals: e.g., every cycle’s RMS, orders, etc. This allows quick retrieval of trends (like plotting vibration vs time). Timescale (an extension of PostgreSQL) could also be used if relational queries across metadata are needed (Timescale can join time-series with relational tables of part info).
For raw waveforms or spectra, an object store (like AWS S3 or on-prem S3-compatible storage) is suitable. We can save files (e.g., a 10-second vibration waveform for each part or event) in compressed form (Parquet, ORC, or even just WAV). The object’s metadata (filename or associated database entry) links it to part ID and time. This separation is because TSDBs aren’t great at huge BLOBs, but object stores are cheap and scalable for unstructured data.
Stream Processing: Using a distributed log like Apache Kafka enables decoupling of data producers (gateways) and consumers (analysis apps). We can have a Kafka cluster ingest all sensor data. Real-time analytics can be done via Kafka Streams or Flink jobs that subscribe to topics. For example, an anomaly detection job could subscribe to the “features” topic and whenever a new feature vector for a part comes in, run it through an ML model (loaded within the job) to decide if it’s anomalous. If yes, it might publish an alert message or update a dashboard database.
Real-Time vs Batch: Real-time (sub-second) analysis is used for immediate alerts (e.g., stop the machine before making more bad parts). Batch analysis (hourly or daily jobs) is used for retraining models, creating reports, or more complex root cause analyses that might need to crunch large data sets (like correlating vibration patterns with temperature or other long-term effects).
Dashboard and Visualization: The results would be accessible via a dashboard (Grafana, PowerBI, etc.). Grafana can connect to TSDB like Influx to graph time-series easily – e.g., a live chart of each machine’s vibration levels, and historical trends. It can also show the results of anomaly detections, etc.
Machine Learning Integration: Our cloud environment will include an ML workbench (maybe a Jupyter or Databricks environment) where data scientists can query the time-series data, label certain events (like known bad parts from quality inspection), and train models accordingly. Models (once validated) can be deployed to the stream processing layer or edge if needed. For example, a Python scikit-learn Isolation Forest could be trained on a week of data to establish the normal pattern, then exported and embedded in a Flink job to score incoming data in real-time.
Scalability: The architecture should handle increasing number of sensors or higher rates. Kafka and TSDB scale horizontally (with clusters/shards). We also ensure data retention and tiering – recent data on fast storage, older archived to cheaper (like move to cloud cold storage).
Reliability: For critical scenarios, the system must handle downtime gracefully. The edge gateway will buffer if connection is lost. The cloud side uses redundant nodes (e.g., 3-node Kafka cluster to avoid data loss). For on-prem deployment, similar redundancy is needed if high availability is required.
Relevant literature/technology: Kai Waehner (2022) describes a pattern of using MQTT + Kafka together, where MQTT collects OT device data and Kafka distributes it to analytics systems. He notes that data streaming platforms increase overall plant effectiveness by feeding real-time analytics that can prevent failures. This aligns with our approach of streaming gear data to catch anomalies early. The combination of cloud and edge analytics is highlighted in industry case studies: e.g., BMW reportedly uses Kafka for streaming telemetry in manufacturing. We leverage these ideas, applying them to the specific domain of gear NVH.
Anomaly Detection and Drift Handling with ML (Isolation Forest, XGBoost, SHAP)
Traditional condition monitoring often uses threshold-based alarms (if vibration > X, alarm). In a complex manufacturing scenario with many data streams, machine learning-based anomaly detection can be far more effective, adapting to normal variability and picking out subtle deviations.
Isolation Forest (IForest) is an unsupervised anomaly detection algorithm well-suited to high-dimensional data. It works by randomly partitioning data; anomalies (which are “few and different”) tend to get isolated quickly, resulting in a short average path length in the random trees. In our context, a data point could be a feature vector representing one part or one machine-cycle (features might include multiple order amplitudes, RMS, kurtosis, etc.). An Isolation Forest trained on “normal” production data would assign an anomaly score to each new observation. If a gear’s vibration signature is unlike anything seen before (e.g., much higher 0.8 order amplitude, or unusual combination of features), it would score as anomalous. This could trigger an alert for quality inspection on that part or maintenance check on the machine. Industrial use of IForest is documented: e.g., seeq (an industrial analytics firm) notes IForest helps spot irregularities in equipment health monitoring, and PyImageSearch gives a conceptual example of using IForest to flag unusual vibration patterns indicating misalignment.
XGBoost is a powerful supervised learning algorithm (gradient-boosted trees) often used for classification or regression tasks with structured data. If we have labeled data – say after some time we know which parts were noisy in vehicle tests or which required rework – we can train XGBoost to predict that label from the sensor features. In manufacturing, XGBoost has been used for fault diagnosis of machines (e.g., bearing fault classification) and often outperforms simpler methods due to its ability to capture nonlinear interactions and its robust handling of varied feature scales. In our case, an XGBoost model could, for example, classify “good vs bad” gear or output a quality score.
Importantly, XGBoost and IForest (and most tree-based models) can be interpreted using SHAP (which assigns each feature a Shapley value showing how it contributed to the deviation). For instance, if a particular gear is flagged as bad by the model, SHAP might show that an unusually high amplitude at 2.3 order and high kurtosis were the main contributors, suggesting a specific type of issue (maybe a chatter mark or specific defect). Herreros-Martínez et al. (2023) used SHAP in an anomaly detection setting to provide actionable insights to domain experts, noting that such explainability helps trust the system. In manufacturing, explainability is crucial – plant engineers need to know why the system is saying a part is bad, otherwise they won’t act on it. SHAP plots (like a summary bar chart of feature importance for anomalies) can be part of the dashboard for engineering teams.
Concept drift is a relevant concern: manufacturing processes change over time (tool wear, material lots, etc.), so the definition of “normal” may shift. An anomaly detection model must be periodically retrained or adapted. We plan to implement drift detection by monitoring the statistical distribution of features. For example, if the mean or variance of gear mesh vibration gradually shifts over weeks (perhaps due to gradual tool wear), many data points might start scoring slightly higher anomaly scores. Rather than flagging all as anomalies (which would overwhelm the system), we detect this drift and update the baseline model (or adjust thresholds). Techniques like adaptive IForest or moving training window can be used. Also, integration with maintenance schedules can provide context (if a machine was serviced or a tool changed, we might reset the model for that machine).
Another ML aspect is outlier labeling and supervised learning: over time, by investigating anomalies, the engineers might label them (e.g., “anomaly ID123 was a real bearing issue” or “anomaly ID124 was just a false alarm due to a bumped sensor”). These labels can feed a supervised model (like a classifier) that tries to predict anomaly cause or filter out known benign patterns. For instance, if fork trucks passing by cause vibrations that the system flags, once identified, we could train a model to recognize that signature and not raise an urgent alarm for it (maybe still log it).
SHAP for root cause: Not only can SHAP explain the features, but if our features include different sensor locations, SHAP might show that most of the anomaly’s “blame” comes from sensors on one side of the machine, hinting at the location of the issue. Or if we include features like “difference between machine A and B vibration”, and that gets a high SHAP value, it could highlight a systemic difference.
In sum, ML-driven anomaly detection transforms a mass of sensor data into actionable information. Isolation Forest provides an unsupervised way to start (no labels needed) and is efficient for high-dimensional data. XGBoost can leverage any labels we do get for even better accuracy. SHAP ensures we maintain interpretability. These tools, combined with domain knowledge, aim to drastically reduce the occurrence of undiagnosed gear quality issues. Instead of relying on end-of-line testing or (worse) customer feedback to find problems, we catch anomalies in-process in real-time.
Transferred and Cross-Coupled Vibrations: Source Separation Strategies
As introduced earlier, one significant challenge in a sensor-rich factory environment is distinguishing local vibrations from transmitted ones. If an accelerometer on Honing Machine #1 detects a burst of vibration, was it because Honing #1 itself shuddered, or because the adjacent Grinding Machine #2 (mounted to the same floor) had a shock event that traveled through the foundation? With time synchronization and multiple sensors, there are ways to address this:
Spatial Filtering: By deploying sensors on all relevant machines (and perhaps on the floor or foundation), one can compare signals. If Machine #2’s sensor also shows the event strongly at the same time, and Machine #1’s shows it with some delay or lower amplitude, that suggests the source was #2 and it transmitted to #1. Conversely, if #1’s sensor is strong and #2’s is quiet at that moment, #1 is likely source. This requires good timing (hence PTP) and a sufficient sensor network density. Essentially, it’s a sensor fusion and triangulation problem.
Transfer Path Analysis (TPA): This technique, common in NVH engineering, involves characterizing how vibrations propagate through structures (often via frequency response functions). In a factory, one could measure transfer functions between machine bases by hammer impact tests (as Hanioka et al. did, finding certain frequencies transmit more readily). With that knowledge, one could potentially deconvolute contributions. For example, knowing that 149 Hz transfers poorly but 197 Hz transfers well, if we see 197 Hz on all sensors, it might be a propagated vibration; if 149 Hz is only on one sensor, it’s local. This is a bit advanced for continuous monitoring, but could be done periodically.
Blind Source Separation (BSS): The use of algorithms to separate mixed signals without knowing the mix. There is research on applying Independent Component Analysis (ICA) to vibration data from multiple machines. The idea is that each sensor measures a mix of sources: x1 = s1 + as2, x2 = bs1 + s2, etc. If we have as many sensors as sources and the mixing matrix is reasonably non-degenerate, ICA can recover estimates of the independent source signals s1, s2. In practice, rotating machine signals are cyclostationary, which complicates assumptions, but some success has been reported in separating e.g., two operating machines’ signals from each other. We could incorporate an ICA block in analysis: continuously or periodically attempt to separate the signals from different machines and then attribute anomalies to the correct machine’s source signal.
A simpler approach operationally is gating based on operation status: e.g., if one machine is idle (spindle off) and still a sensor on it sees vibration, then by elimination that vibration came from elsewhere (like a nearby running machine). The system could suppress alerts from idle machines and instead flag a possible cross-talk. Over time, by correlating patterns, one might map out “when machine A runs, machine B’s sensor picks up some vibration at these frequencies”. This can be accounted for.
Physical isolation: Of course, the engineering solution to cross-coupling is better vibration isolation (mount machines on isolation pads, etc.). If our monitoring identifies significant cross-talk, that itself is a useful outcome – it might prompt re-layout or adding isolation mounts to reduce vibration spread, which improves overall quality and measurement reliability.
In literature, machine vibration propagation is often treated for heavy equipment and buildings (to avoid structural damage). In our context, it’s more about avoiding confusion in diagnostics. We might not find a perfect algorithmic separation, but by having comprehensive data, an experienced engineer can often infer the source of a periodic excitation if they can see all channels. For example,
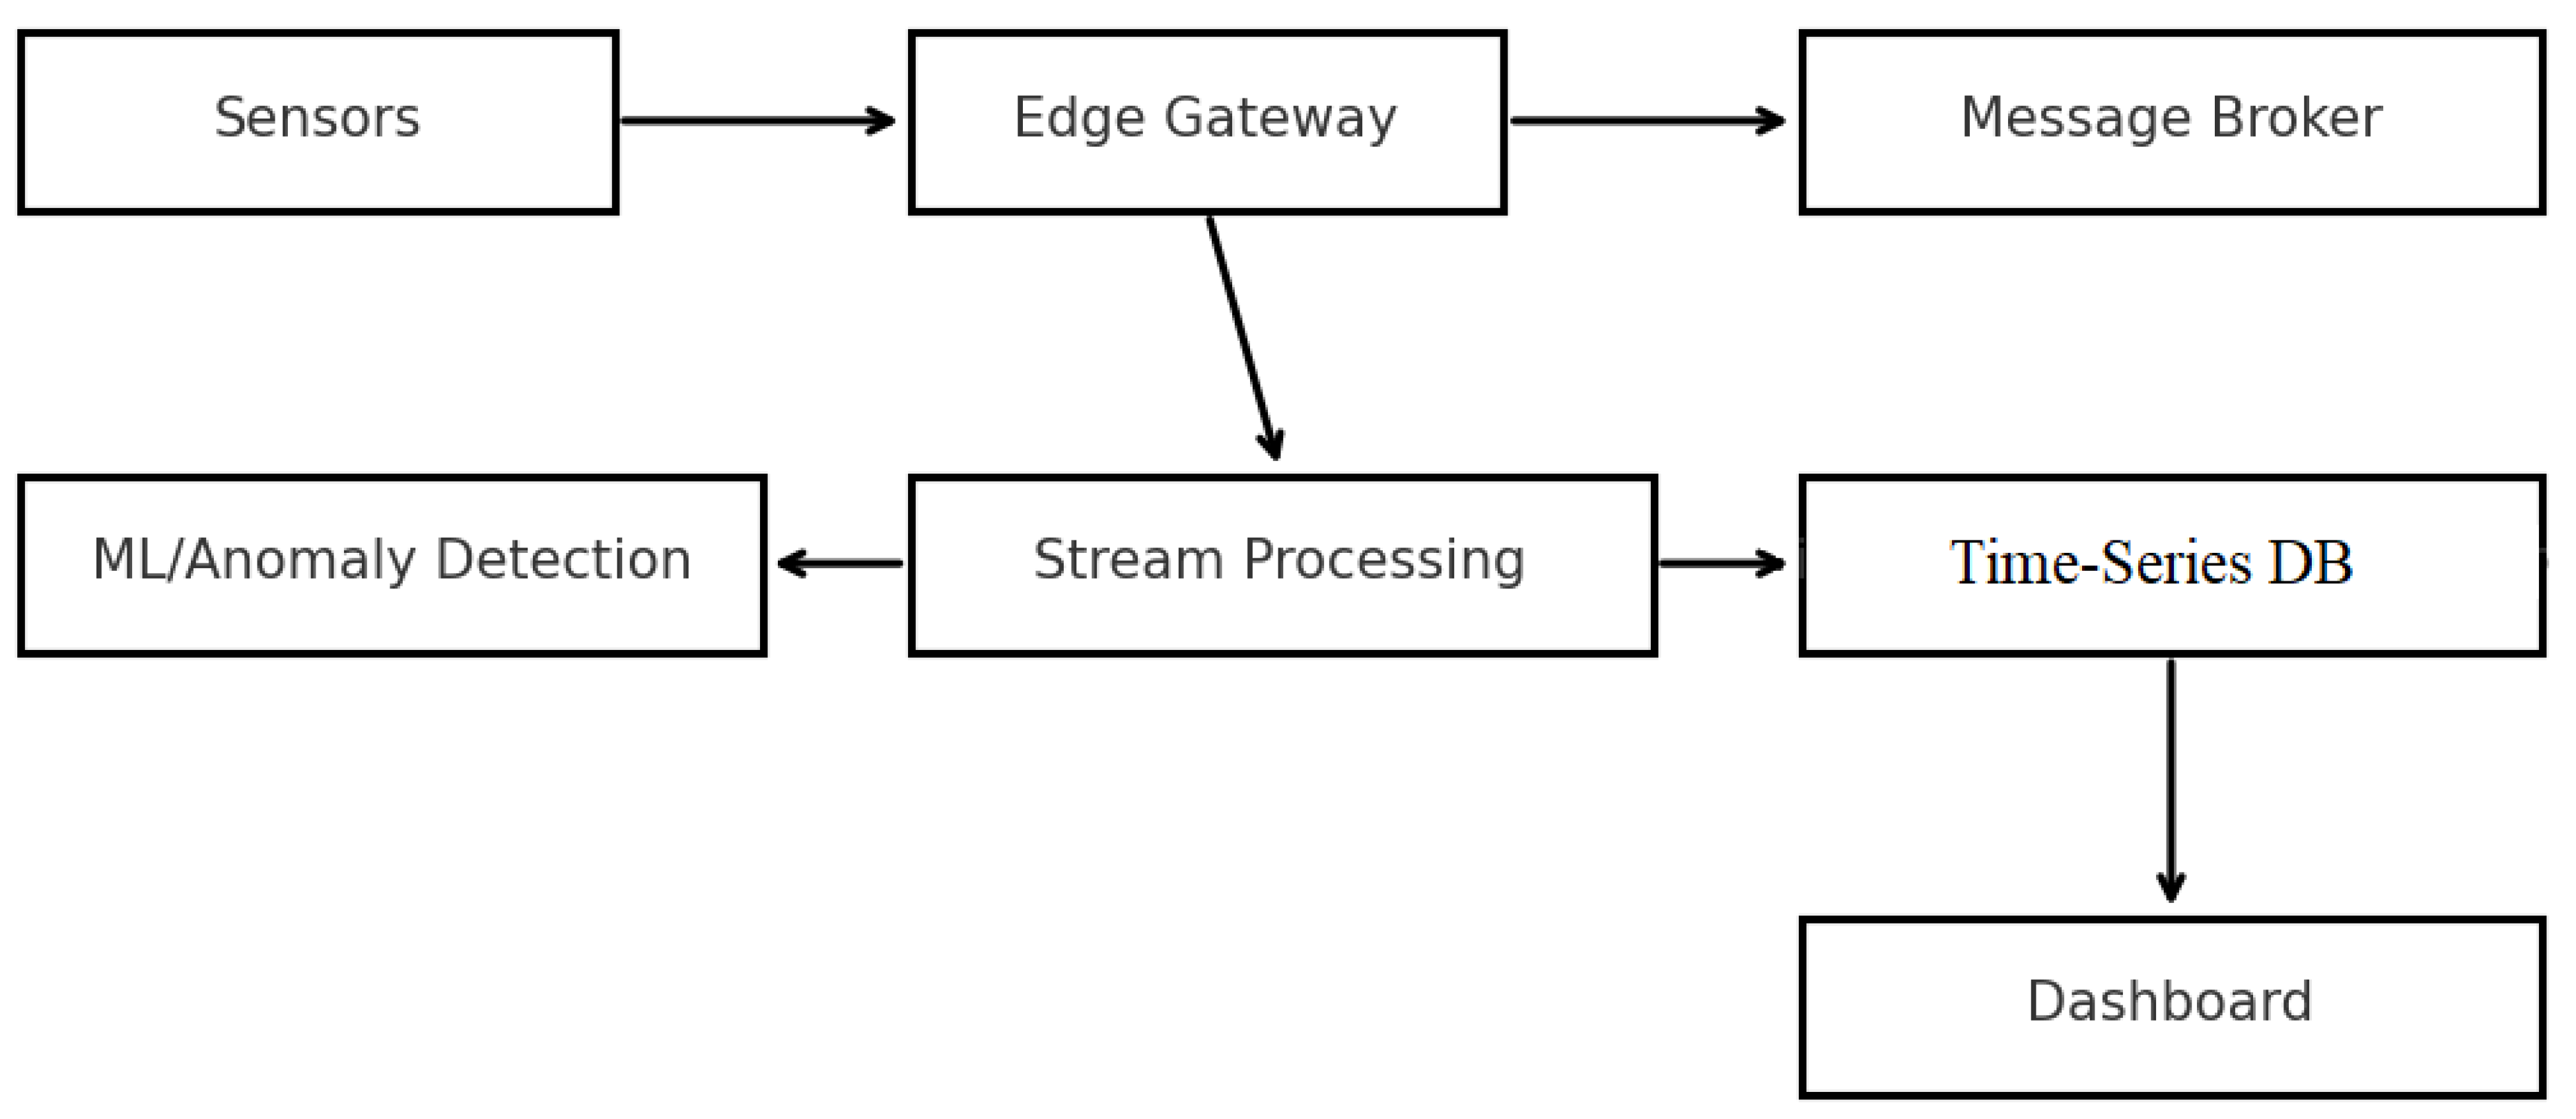
Figure 1 (system architecture diagram) could include the concept that all sensors feed into a central analysis that can perform cross-correlation among sensor signals to see if an event is localized or widespread.
Figure 1.
– System Architecture Diagram suggestion: a block diagram showing sensors on machines, edge gateways, network to cloud, and various cloud components (broker, stream processor, databases, dashboard). Annotations can highlight PTP sync to sensors, OPC UA link to MES for part IDs, and ML analysis in cloud. Each block should have a short explanation in the caption, e.g., “Edge gateway collects synchronized sensor data and machine context, publishing to cloud”.).
To be concrete: If an anomalous event is detected by the system, part of the automated analysis will be to check other sensors in the same timeframe. If others also saw it, it may tag the event as “global” and list all possible sources (maybe rank them by which sensor had highest magnitude). If only one sensor saw it strongly, it’s likely local to that machine. This metadata could be included in the alert (e.g., “Anomaly on Machine 1 – likely local (no significant vibration detected on adjacent machines)”). If cross-coupling is common, we can even calibrate “signatures” of it (perhaps through experiments where one machine is intentionally vibrated and others measure).
In summary, our literature-based understanding and proposed approach to cross-coupled vibrations involves: deploy multiple sensors, use time synchronization and correlation to attribute events, apply known transfer characteristics or BSS techniques if possible, and consider mechanical mitigation. This ensures that the monitoring system remains reliable and doesn’t cry wolf on the wrong machine (or wrong part) due to vibrations originating elsewhere.
Feasibility Study
In implementing the above concept, several practical considerations and decisions arise. This feasibility analysis discusses requirements, compares technology options, outlines a phased pilot plan, and identifies risks with mitigation strategies. Table 2 at the end of this section summarizes key design decisions and justifications.
Requirements and Constraints
Accuracy: The system must detect small vibration anomalies corresponding to gear waviness on the order of a few micrometers. This translates to acceleration amplitude differences on the order of maybe 0.01–0.1 g in certain frequency bands. Thus, sensor resolution and noise floor should allow detecting, say, a 0.1 g change at a few kHz. Also, time accuracy needs to be sufficient so that phase differences or order tracking across sensors are meaningful; as discussed, sub-millisecond time sync is targeted.
Latency: For real-time alerts, end-to-end latency (sensor measurement to cloud decision to operator notification) should be low – on the order of 1 second or less for urgent issues. If a honing machine starts vibrating abnormally, we’d like to alert before the next part is finished if possible, or at least before many more parts are processed. Non-critical analytics (like daily reports) can be batch, but anything tied to preventing bad parts needs low latency.
Availability and Reliability: The monitoring system should be robust to network interruptions and not lose data crucial for quality decisions. It should buffer locally as needed and back-fill when connection is restored. Maintenance of the system (calibrating sensors, updating software) should be manageable without disrupting production. In a plant, downtime of the monitoring system is acceptable (it’s not controlling equipment) but it should fail gracefully (no false triggers). However, if it becomes a key quality gate, its downtime could affect operations, so high availability is beneficial.
Scalability: The design should handle scale-out to more lines or plants. This means choosing technologies (MQTT brokers, databases) that can cluster or easily increase capacity. Also, it should not overwhelm the corporate network; careful bandwidth management (edge computing) is needed.
Security: Because we connect to OT equipment, strong cybersecurity is required. All network traffic should be encrypted (TLS for MQTT, secure OPC UA sessions) and access controlled. Certificates or keys must be managed. Additionally, the cloud side should be hardened (following corporate IT security guidelines) since it may handle sensitive production data and possibly identifiable part information (traceability data).
Interoperability: The system should be relatively vendor-agnostic. It might interface with different brands of machine tools and different cloud platforms. OPC UA helps abstract the machine side. MQTT and REST are open standards for cloud. This avoids lock-in and eases integration with existing systems (like could feed data to an existing MES or quality system if needed).
Regulatory/Standard Compliance: If the data is used for quality decisions, traceability and data integrity are important (perhaps compliance with ISO 9001 data procedures, etc.). Using standard protocols (MQTT, OPC UA which is an IEC standard) aligns with best practices. IEEE 1588 (PTP) is an IEEE standard for sync.
Cost Constraints: There is an implicit cost/benefit aspect – the solution should be cost-effective compared to the savings from defect reduction. We will discuss cost-benefit at the end, but as a requirement, the hardware (sensors + gateways) and software infrastructure budget needs to be justified by expected ROI (reducing scrap, etc.).
Architecture Options Analysis
Here we compare key architecture choices:
Sensor Connectivity – Ethernet (PoE) vs Wi-Fi 6 vs BLE:
Ethernet (PoE): Provides power and data reliably. With Cat6 cabling, bandwidth (1 Gbps) is plenty for multiple high-rate channels. It supports PTP easily (hardware timestamping in NICs). PoE sensors or PoE data acquisition boxes are available. Drawback: cabling cost and complexity, especially if retrofitting on moving machine parts (need cable management). But for mostly stationary sensor placements (on machine frames), this is manageable. Likely the most robust choice.
Wi-Fi 6/6E: Modern Wi-Fi has high throughput and features (OFDMA) that can handle IoT traffic better than older Wi-Fi. It could transmit raw data if in ideal conditions. However, Wi-Fi introduces unpredictable latency (due to shared medium) which complicates PTP (though 802.11 can transport PTP, it’s not common in strict sync needs). Also, ensuring continuous high data rate in a noisy industrial RF environment might be hard. Wireless sensors usually favor battery operation and thus low duty cycle, which doesn’t fit streaming needs unless one provides wired power anyway (at which point, one might as well use wired data).
BLE (Bluetooth Low Energy): Very low power, but also very low bandwidth (a few kbps realistically for continuous data), not suitable for raw vibration data streaming. Some BLE sensors do spectral analysis on-board and send summary. BLE is more for condition monitoring where checking once a minute is fine, not for detailed NVH. We can rule it out for primary NVH data, though perhaps BLE could be used for some supplementary sensors like a simple temperature sensor on a machine.
Decision: Use wired Ethernet (PoE) for primary vibration sensors. Possibly use Wi-Fi for any less critical supplementary sensor if running a cable is impossible, but with the expectation of higher latency/loss. Wired ensures synchronization and throughput needed.
Time Synchronization – Hardware PTP vs Software PTP vs NTP + External Trigger:
Hardware PTP: Involves network cards and switches that timestamp packets in hardware for utmost precision. This can get sub-microsecond accuracy, but requires specific hardware support (e.g., Intel i210 NIC, PTP-aware switches like Hirschmann, etc.). It increases cost (PTP switches are pricier).
Software PTP: Running ptpd or linuxptp in software without hardware timestamping might yield sync in the 10–100 µs range over decent network, maybe worse if network is loaded. We can improve by using PTP in boundary clock mode on switches or at least QoS to give PTP high priority. Many industrial switches now include PTP as a feature (often as part of TSN) – we might end up using them anyway for deterministic behavior.
NTP + Trigger: An alternative is to use simpler NTP sync (ms-level) but distribute a separate timing reference – e.g., a 1 pulse-per-second (1PPS) signal via a GPIO from the gateway that all sensors listen to. This is how some DAQ sync works. But that again needs wiring or wireless time pulse broadcasting (which could be done via e.g., a GPS simulator or a custom radio). This approach is not as standardized and can be complex to manage. It’s easier if we just let PTP handle it in one system.
Decision: Aim for software-based PTP with support for future hardware timestamping. That is, design the network with PTP in mind (select PTP-capable switches if budget allows, or at least ensure firmware can be upgraded). Initially, even 100 µs accuracy is probably fine for our analysis, so fully hardware PTP may not be needed from day one. But having the infrastructure ready to achieve ~1 µs ensures future-proofing.
Protocol – MQTT/AMQP vs gRPC/WebSockets (custom streams) vs OPC UA PubSub:
MQTT: A lightweight pub-sub with widespread support on IoT gateways and cloud brokers (e.g., AWS IoT, Azure IoT Hub speak MQTT). It’s good for many small messages. We can structure topics hierarchically (plant/line/machine). MQTT with QoS 1 or 2 can ensure delivery. Drawback: MQTT payloads are usually small (to avoid fragmentation). If sending large binary data (like a 100 KB waveform), MQTT can do it but might not be optimal. However, it can send a URL or reference to a file in object store instead.
AMQP: Advanced Message Queuing Protocol, used by Azure and others. It’s heavier than MQTT but similar idea with queues/topics.
gRPC or WebSockets: These would be custom solutions where the gateway opens a socket to a server and streams a continuous flow (maybe in protobuf format). gRPC is efficient and binary, but requires our custom implementation for routing, whereas MQTT/AMQP ecosystems have broker services that handle clients easily.
OPC UA PubSub: OPC UA has a publish-subscribe extension that can send data via UDP or message brokers. It’s relatively new and would tie us to OPC UA on both ends. It might be overkill because we don’t necessarily need the OPC UA data model for raw vibration samples – simpler to send as our own format.
Decision: Use MQTT over TLS for the primary telemetry pipeline (sensor features and events). MQTT hits the sweet spot of being industrially adopted, firewall-friendly, and easily connectable to cloud analytics (there are Kafka connectors for MQTT, etc.). For the machine context data, we’ll use OPC UA client on the gateway to fetch and then likely send that context via MQTT as well (or via direct REST API to our cloud DB). Alternatively, the gateway could directly write context to the time-series DB via HTTP. But consolidating via MQTT is fine (one system to maintain). If needed, a hybrid: e.g., send critical events via MQTT, and bulk insert periodic data via a REST batch to TSDB.
Storage – InfluxDB vs TimescaleDB vs Cloud TSDB, and local vs cloud:
InfluxDB: Purpose-built TSDB, easy to set up, supports high ingestion rates and retention policies. We can self-host it or use a cloud version. It uses its own query language (Flux or InfluxQL), but is popular in IIoT.
TimescaleDB: Extension on PostgreSQL – benefits from SQL capability, easy joins with metadata. Handles decent scale but maybe not as high ingest as Influx for same hardware (though Timescale has improved a lot). Could be good if we want complex queries combining quality data (SQL) with time series.
Cloud-native TSDB: e.g., Amazon Timestream, Azure Data Explorer, etc. They offer serverless scaling but might be costly and proprietary.
On-Prem vs Cloud: If the company policy is not to send data offsite (maybe due to confidentiality of manufacturing data), we could deploy on-prem servers. But maintainability and scalability may benefit from cloud-managed services.
Given our project’s scope, a pragmatic choice is to start with InfluxDB (open source or InfluxDB Cloud for ease) for time-series metrics, and use an S3-compatible object store (could be AWS S3 or MinIO on-prem) for the raw files. We will ensure the data model can be migrated to another DB if needed.
Stream Processing – Apache Kafka + Flink vs Cloud Services:
Kafka + Flink/Spark: Open source route, highly customizable. Kafka as messaging, Flink for processing (Flink is good for event-time processing and has rich windowing for anomaly detection, etc.). But running those clusters is non-trivial.
Cloud services: e.g., AWS Kinesis (a Kafka-like streaming service) or Azure IoT Hub + Stream Analytics, or GCP Pub/Sub + Dataflow. These reduce ops burden. However, initial costs for small scale might be higher, and it ties to a vendor.
Edge processing alternative: For quick pilot, some processing could even be on the gateway or a local PC (especially if latency critical, one could do anomaly detection at edge and just send results). However, that sacrifices the big picture view and is harder to update models centrally.
Decision: Use Kafka as the central data bus (which can be cloud-hosted or on-prem). For simplicity in initial pilot, we might avoid a complex Flink setup and use Python consumers or lightweight stream jobs for anomaly detection (e.g., a service that consumes from Kafka, applies model, and produces to an alerts topic). But long term, a more scalable solution like Flink or Kafka Streams (Java apps) would be implemented. Since this is largely a design study, we keep it open but lean on the proven Kafka ecosystem (also as per industry trends).
A note: If the company already has a cloud IoT platform (e.g., Siemens MindSphere, PTC ThingWorx, etc.), we could integrate with that. Many of those have modules for vibration monitoring but customizing might be limited. Our approach is more custom, built on open technologies.
Pilot Implementation Plan (12-Month Phased Rollout)
To demonstrate feasibility and refine the system, a phased pilot is proposed:
T0–T2 (Months 0–2): Pilot Setup on One Machine. Start with a single honing machine (the one suspected to influence NVH most). Equip it with 4–6 accelerometers: e.g., one on the spindle housing, one on the fixture/part, one on the base, maybe one on an adjacent machine as a reference. Set up an edge gateway and PTP sync on this small network. During this phase, validate the time synchronization (measure timestamp offset between sensors by tapping the machine and checking all sensors record simultaneously, for example). Collect baseline data for normal operation for a variety of parts. Implement basic order tracking analysis for that machine (perhaps the gateway itself can compute the order spectrum for each part processed). Also, verify the DMC scanning integration – ensure we can tag data with the correct part ID from MES (could manually input if needed at first). Success criteria: we can reliably capture and correlate multi-sensor data for each part, and basic metrics (like order amplitudes) are consistent and repeatable for known good parts. We might already catch if something is obviously wrong (e.g., if the machine has imbalance, we’ll see a high 1× vibration order).
T3–T6 (Months 3–6): Expand to Multiple Machines and Implement Alerts/Dashboards. Scale up to perhaps 3–5 machines (e.g., all honing machines in the line, plus maybe a gear grinder or tester). Now we deploy more sensors and possibly an upgraded gateway (or multiple gateways if needed). The cloud infrastructure (broker, TSDB, etc.) should be operational by now to handle multi-machine data. Define some simple rules for alerts initially: e.g., “if any vibration order exceeds mean by 3σ, flag” or “if kurtosis spikes above threshold, flag”. Also integrate the DMC and work order linking fully – this may involve ensuring the OPC UA client or MES interface is robust. By month 6, we aim to have a live dashboard that operations and quality engineers can look at: showing each machine’s vibration in real-time, and highlighting any anomalies or trends. We also implement the traceability view – for any part ID, one can retrieve its vibration signature or an anomaly log. During this phase, feedback from users is gathered. Perhaps we tune the alerting to avoid too many false alarms. We also collect ground truth: for any parts flagged or any suspected issues, see if they correlate with actual quality inspection results (like noise test at end-of-line). This helps build a labeled dataset.
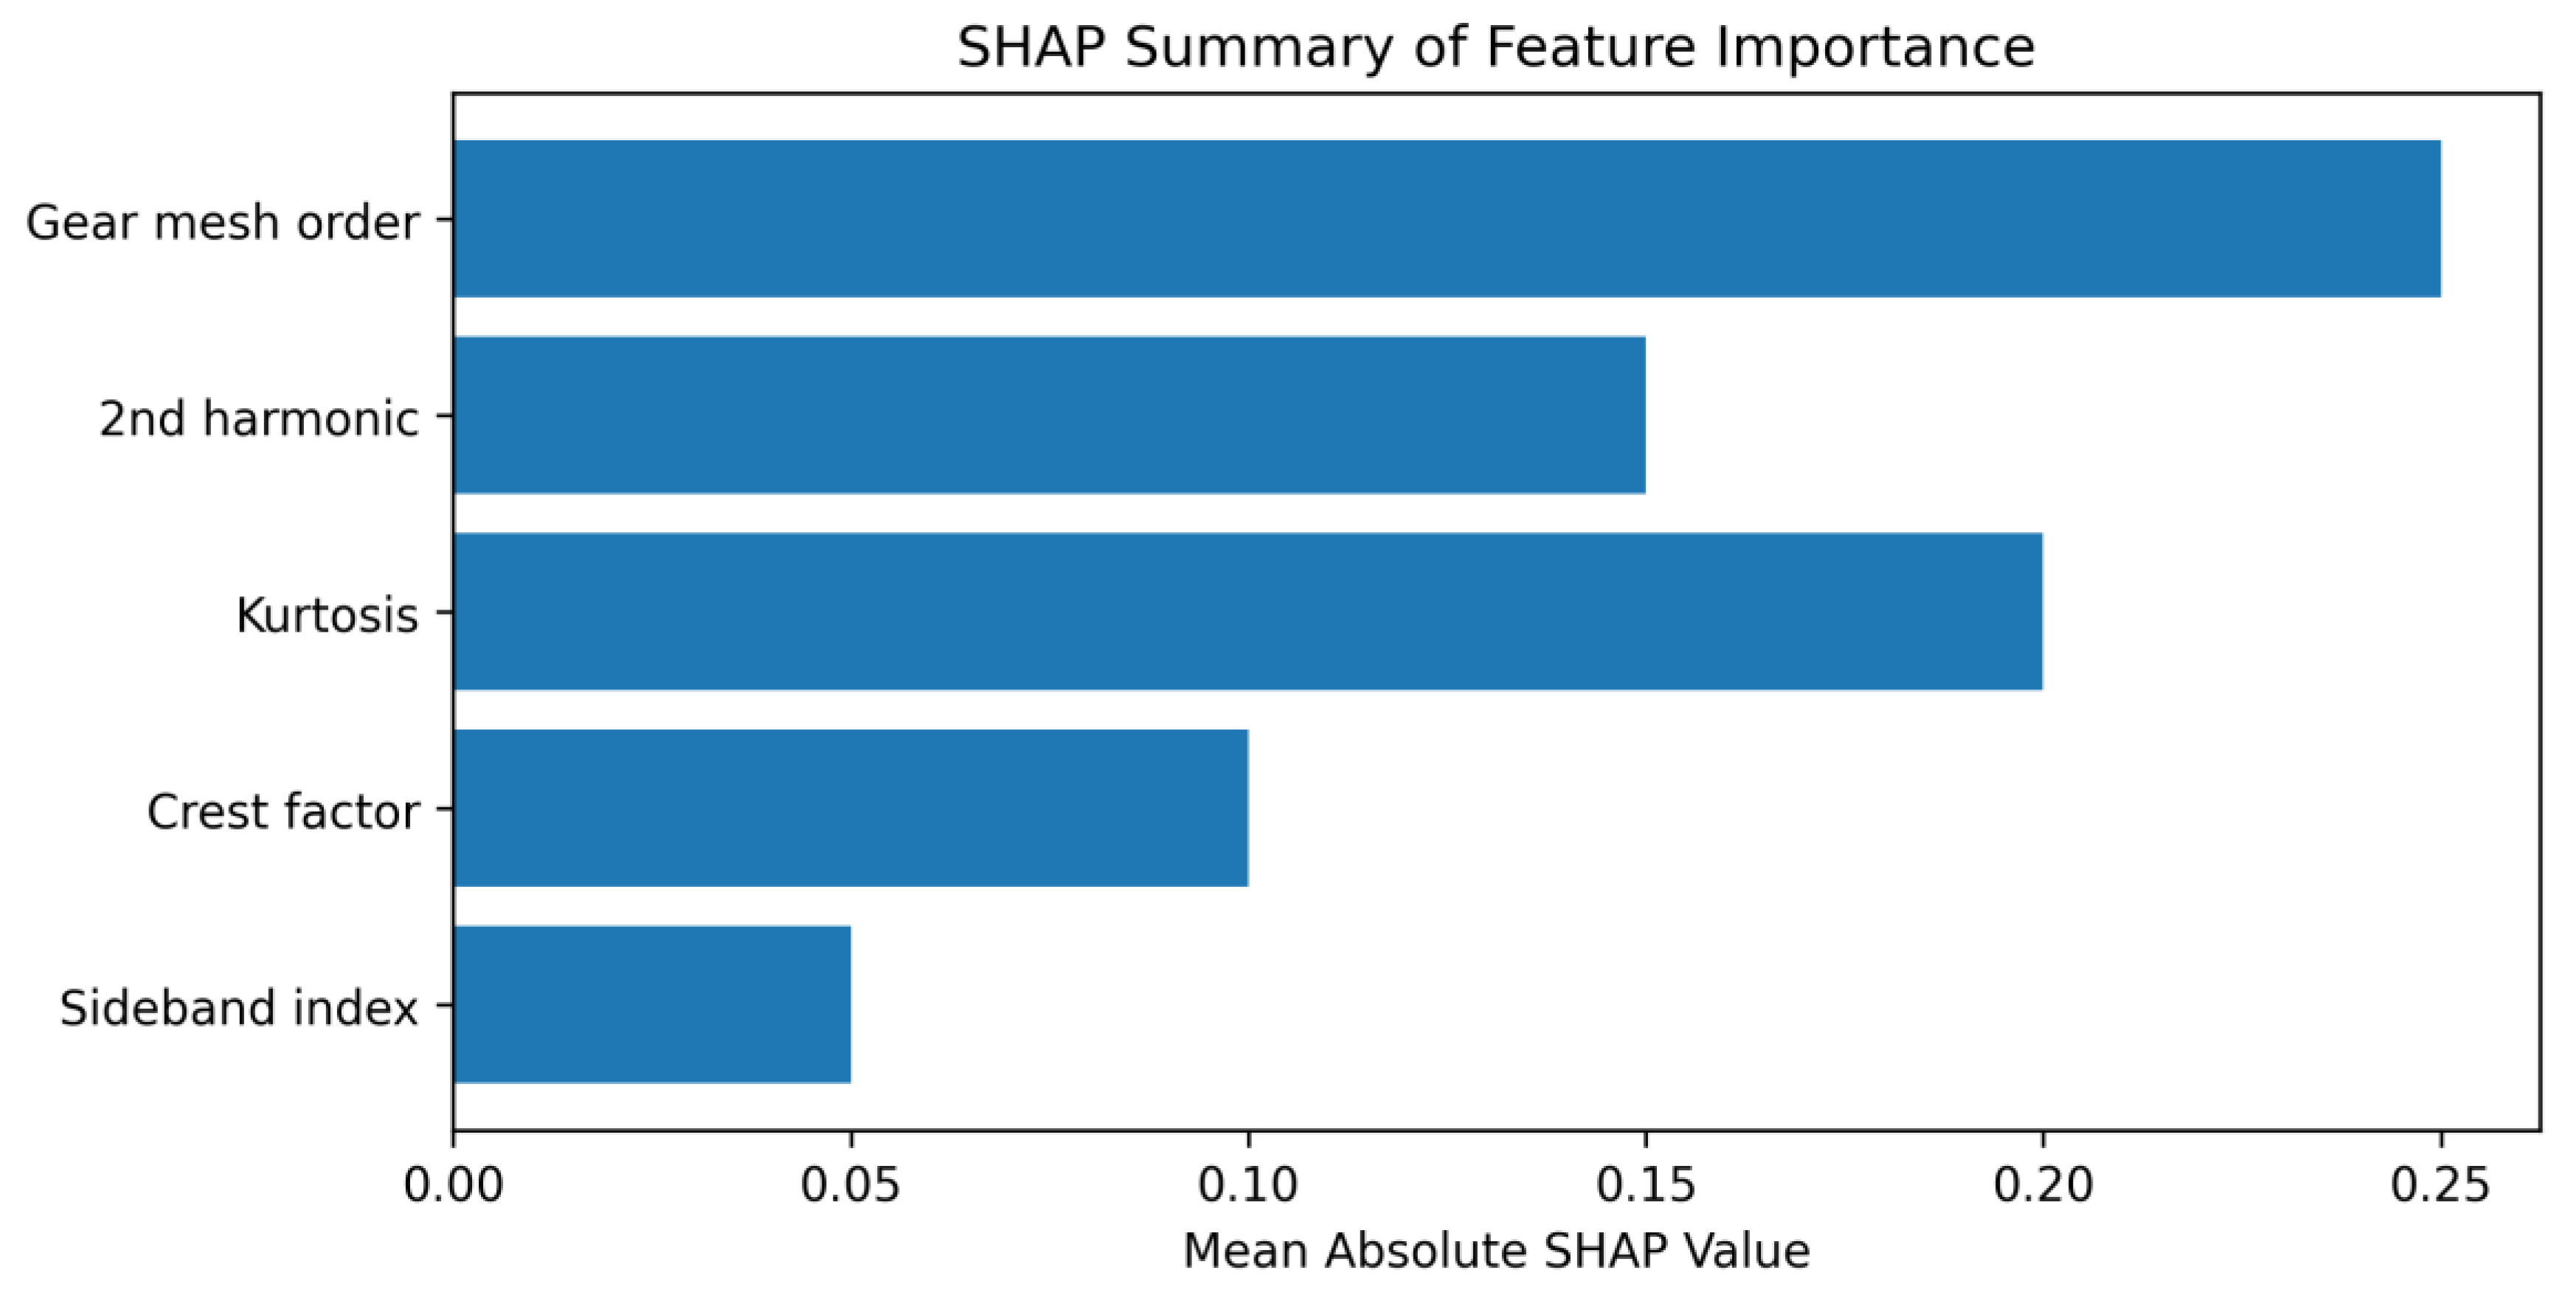
T7–T12 (Months 7–12): Advanced Analytics and ML Deployment. With several months of data across machines, we proceed to develop ML models. For anomaly detection, train an Isolation Forest on the first 6 months of data for each machine (or a combined model with machine as a feature). Deploy this model either in the cloud stream or at edge if latency needed (cloud is fine for now). Start using it to detect outliers in real-time. Simultaneously, if we have any labeled incidents (say 5 parts were found noisy later), train an XGBoost classifier to see if it can separate those from normal using the vibration features; even if sample is small, it might find a clear boundary. Use cross-validation and continuously update as more labels come. Implement SHAP analysis on the model – for each anomaly detected by IForest or any classification by XGBoost, compute SHAP values and log them. Create a SHAP summary plot (
Figure 4 suggestion: e.g., a beeswarm or bar chart showing which features contribute most to anomalies overall). This can highlight, for example, “the gear mesh 0.8 order amplitude is a common driver in anomalies” aligning with the ghost noise example.
During this phase we might also do an A/B test: e.g., one machine is monitored and we act on its alarms (adjust process, etc.), another similar machine we don’t actively intervene. Compare the quality outcomes (scrap rates, etc.) to see tangible improvements. By month 12, the goal is to demonstrate that the system can catch issues that would otherwise go unnoticed or be caught much later. Also, any operational issues (like network load, data overload, etc.) should be identified and addressed by scaling or optimizing (maybe we realized we had to down-sample some data because it was too much, etc.).
At the end of the year, we would have a solid case study: e.g., “detected 3 incidents of emerging machine faults or process deviations, allowing intervention that saved X gears from scrap and prevented Y hours of downtime”.
Risk Assessment and Mitigation
Implementing such a system entails several risks. We outline major ones and how to mitigate them:
Time Synchronization Quality Risk: If the PTP sync is not as good as expected (maybe network jitter or lack of hardware support leads to, say, >1 ms errors), then cross-correlation analysis could suffer. Mitigation: Early in pilot, thoroughly test PTP performance. If needed, invest in better network hardware (e.g., PTP boundary clock switches) or use GPS time source as backup. Also design analyses to be somewhat tolerant – e.g., use amplitude-based logic for anomalies that don’t solely rely on phase alignment. If sync is extremely poor, fallback to analyzing each machine independently (losing some cross-machine ability but still useful).
Network Outage or Bandwidth Risk: The constant data stream might congest the network or face outages. Losing data could mean missing an anomaly. Mitigation: Use QoS to prioritize vibration data or use a separate network for it. Implement buffering on gateways – e.g., if cloud connection fails, store data locally for a period (say up to an hour) and resend later. The gateway could also do local anomaly detection and perhaps even a local alarm (like a tower light) if it sees something during an outage, ensuring critical alerts aren’t missed. Also compress data where possible (maybe send frequency spectra instead of raw time series continuously).
False Alarms / Data Overload (Operator fatigue): If the system generates too many warnings (especially false positives), users might start ignoring it, defeating the purpose. Mitigation: In the development phase, carefully tune thresholds and validate anomalies with real outcomes. Possibly implement a severity scoring so that only high-confidence anomalies alert operators, while lower ones just log for engineer review. Use domain knowledge to filter out known benign patterns (like the forklift example) by adjusting model or adding logic. Provide clear explanation (via SHAP or rule) with each alert so it’s credible (“Machine 3 alert: Unusually high gear mesh vibration at 2250 rpm (2nd order), likely tool imbalance” is more actionable than “Anomaly detected!”).
Labeling and Model Validation Risk: The ML models might initially be trained on unsupervised data, and we might accidentally overfit to noise or underfit so as to be not useful. Mitigation: Keep a human-in-loop for a while – have engineers review what the model flags, and allow feedback (label them as true or false anomalies) to iteratively improve the models. Maintain a validation dataset of known normal vs fault instances (if available from historical records or induced tests). Use that to test any model before fully trusting it. And do not automate any drastic action (like stopping production) purely on ML output until it’s proven; for initial period, just use it to alert human who makes the decision.
Data Management and Privacy: The data collected might be sensitive (it could reveal proprietary info about production rates, yields, etc.). If using cloud, there’s risk of data leak. Mitigation: Anonymize or aggregate data if sharing outside, secure it strongly in cloud, follow IT policies. Also, ensure compliance with any data retention policies (maybe production data must be kept X years for traceability). We should explicitly design the data retention and deletion scheme and communicate that to stakeholders.
Integration with Production Systems: A risk is that connecting to MES/PLC could inadvertently cause interference or performance hit on those systems (e.g., OPC UA polling too frequently). Mitigation: Work closely with controls engineers to set up read-only, low-impact data access. Perhaps use the MES’s own data export rather than direct PLC reads if possible. Test thoroughly in simulation or off-peak times before enabling continuous queries. Most modern MES/PLCs can handle some extra traffic, but caution is warranted.
Maintenance of the Monitoring System: The sensors themselves and the IT components need maintenance (calibration, software updates). There’s a risk that if neglected, the system could degrade (sensors drifting giving faulty readings). Mitigation: Establish a maintenance plan: e.g., calibrate or at least validate sensor readings every 6 or 12 months (maybe swap out a few sensors and test them on a reference shaker). Monitor the health of the system itself, e.g., have heartbeat messages and alert if a sensor or gateway goes down. Choose industrial-grade sensors to minimize failures.
By anticipating these risks, our implementation plan incorporates testing and incremental rollout to catch issues early (e.g., verifying network and sync on one machine before many).
Cost-Benefit Analysis
Finally, we consider whether the expected benefits outweigh the costs:
Costs: The hardware cost includes sensors (~$200–$1000 each depending on type; say we deploy 20 sensors, that’s maybe $10k), gateways (maybe $2k each, a few of those), network upgrades ($5-10k for switches, etc.), and servers/cloud ($5k+ per year). Plus development effort and maintenance. Let’s ballpark initial investment $50k–$100k. For a full production line with dozens of machines, scaling up might be more, but also we’d presumably integrate into existing infrastructure.
Benefits: - Scrap reduction: If ghost noise issues or gear defects are caught early, those parts can be fixed or scrapped before assembly. If previously these issues were caught only at end-of-line (or worse, in the field), think of the cost of disassembling an axle or a warranty claim. Suppose this system reduces the defective gear rate by even 0.5%. In a plant making 100k gears/year, if a gear costs $50, that’s $25k/year saved in scrap, plus intangible savings in reputation if customer issues are avoided. - Rework reduction: Sometimes gears with minor defects might be reworked (re-honed or matched in pairs to cancel noise) – with better process control, that rework can drop, saving labor and time. - Downtime prevention: The system can also serve as predictive maintenance for the machines. For instance, if it detects a bearing going bad in a honing machine early, maintenance can fix it proactively, preventing an unplanned breakdown that could stop production for hours or days. Unplanned downtime can cost thousands per hour in lost production. If we avert even one major breakdown a year (e.g., a spindle failure that would halt a line for a day), that might save tens of thousands. - Quality improvements: Lower noise gears mean fewer warranty claims for NVH after vehicles are sold. Automotive recalls or repairs for noise are costly (maybe not as critical as safety recalls but still expensive and affecting brand perception). Hard to quantify, but reducing recall risk is big. - Data value: The collected data might reveal opportunities to optimize the process (maybe we find one machine consistently produces slightly higher vibration; that could be used to tweak alignment or tooling to bring it in line, improving overall quality uniformity). It’s part of enabling a “smart factory” where decisions are data-driven.
Concrete reference: McKinsey reported predictive maintenance can reduce maintenance costs by ~20% and downtime by ~50%. For our specific case, if downtime is reduced by 20% and scrap by similar, the ROI likely justifies itself within a couple of years, if not sooner.
Intangible benefits: Increased understanding of the manufacturing process, empowered engineers with data, foundation for future AI applications, and demonstration of Industry 4.0 which could have reputational benefits and help with things like obtaining business (some OEMs want to see their suppliers using advanced quality control).
Overall, while a full financial model is beyond scope here, the qualitative argument and some references suggest a significant positive return. The cost of one batch of bad gears slipping through to vehicles (and then having to replace them in the field) could alone be huge – our system is essentially an insurance against that. In one example, a major carmaker had ghost noise issues prompting expensive gearbox replacements; a system like this could have caught the issue at the source, avoiding those costs.
(Table 2 – Feasibility Options and Decisions: a table listing each major design choice (sensor type, sync method, etc.), the options considered, and which was chosen with a short reason.)
Conceptual System Design
Bringing all the pieces together, this section outlines the proposed system architecture and data model, and provides visual/conceptual aids for implementation.
Overall Architecture:
Figure 1 illustrates the high-level architecture. At the bottom layer are the Sensors (accelerometers) deployed on equipment (honing machines, etc.). These connect via Ethernet to local Edge Gateways. Each gateway is essentially an industrial PC or IoT appliance that runs several software components: (1) a data acquisition service (reading sensor data, timestamping via PTP), (2) an OPC UA client to gather machine/MES data (like part IDs, machine status), and (3) a publish service (sending data to the cloud). The gateway also runs a PTP daemon (if it’s the master or slave) to synchronize clocks. Optionally, certain preprocessing like FFT might be done here.
The edge gateways send data to the Cloud (or Datacenter) layer through a secure network link (VPN or TLS). In the cloud, we have a Message Broker (e.g., MQTT broker or Kafka) that ingests all incoming messages. From the broker, data is streamed into the Stream Processing framework where real-time analytics and anomaly detection occur. Results (such as anomaly alerts or extracted features) are written into the Time-Series Database. Meanwhile, raw or detailed data can be stored in an Object Storage service – the gateway might directly upload a file (with REST API) to, say, an S3 bucket containing a detailed vibration recording for a part, and then send a message referencing that file. A Machine Learning/Analytics component (which could be implemented as part of stream processing or separate) handles model predictions and periodically retraining models using historical data (which it can pull from the TSDB or object store as needed). At the top, a Dashboard and User Interface allows engineers and managers to visualize machine conditions, receive alerts (perhaps via email/SMS or control room annunciator), and query the data (for example, search all data for a specific part or time).
Crucially, the architecture includes the Traceability integration: when a part’s DMC is scanned at a machine, that event flows into the system and attaches to any sensor data from that timeframe on that machine. For instance, if Machine #3 is honing part ABC123 from 10:00:00 to 10:00:30, all sensor messages during that interval carry part_id = ABC123. This association might be managed by the gateway (which gets a “start part ABC123” signal via OPC UA and then tags outgoing data until an “end part” signal).
Data Schema: We design a minimal schema for time-series data records. At ingestion, each data point (or feature set) has associated metadata: - plant_id, line_id, machine_id – identify where it’s from. - sensor_id – which sensor (could encode location like “Machine3_spindle”). - timestamp_ptp – the absolute time (could be ISO string or epoch ns). - Process/operation info: work_order_id, operation_id (e.g., “honing_op10”), possibly tool_id (if relevant, like which honing tool was used). - Part info: part_id or dmc_code (the scanned code, unique per part), perhaps also a part_type if multiple part models. - Measured values: we likely won’t send every raw sample with all these tags (too verbose). Instead, for high-rate data we might send a block or have a separate measurement type for raw. More often, we send feature records: e.g., one record per part per sensor with fields like RMS, peak, order1_amp, order2_amp, ..., crest_factor, etc. Each of those fields becomes a column in TSDB and is indexed by the tags above. - If an anomaly is detected, we might produce a separate record in an “anomaly” measurement, with an anomaly_score, anomaly_type and a link to the part or time window.
We also maintain reference data like machine info (maybe a lookup of machine to its location, for the UI to display), which can be a static table.
Traceability and Work Order Integration: The system ensures that for every gear (part) produced, there is a vibration profile stored. This profile is linked to the part’s work order (manufacturing record). In practice, if later on that part (identified by its DMC) fails a noise test, one can retrieve from the database: “show vibration features where part_id = that DMC”. Then you might see, for example, that it had an unusually high ghost order amplitude. Conversely, if we see a machine problem at a certain time, we can list all part_ids processed then, and perhaps flag them for inspection or recall if needed. This closed-loop traceability is a major value proposition – it transforms vibration data into part-specific quality data.
Dashboard Concepts: - We anticipate a real-time status dashboard with something like a plant layout or list of machines, each color-coded (green = normal, yellow = warning, red = alarm) based on current vibration status. - Clicking a machine brings up a drill-down: time plots of key vibration orders, maybe a spectrogram over last N parts, etc. - A search interface allows querying by part ID (then shows that part’s vibration signature compared to average or spec). - We might also have a summary of the ML analysis, e.g., a chart of anomaly scores over time and a table of top 10 anomalies with their part IDs and feature explanation. - Maintenance view could rank machines by vibration levels, possibly indicating which ones are trending worse.
Proposed Figures (for a report or presentation):
System Architecture Diagram – as described, showing all components from sensors to dashboard. (We already have this as
Figure 1 conceptually.)
Order Heatmap Example – e.g., a sample visualization of vibration order analysis over time. The figure could be a color map with x-axis being part sequence or time, y-axis being order number (or frequency), and color indicating amplitude. This would visually highlight if, say, the 60th order (gear mesh) gradually increased in amplitude, or if an unusual non-integer order popped up during certain parts (a ghost order). A real example from Matsuishi’s paper shows a color map of cabin noise orders vs time with ghost order highlighted; we can emulate that for machine vibration. The caption would explain that engineers can spot trends or anomalies (like a bright streak at a certain order indicates consistent excitation that might correlate with a defect).
PRISMA Flowchart of literature selection – already discussed as
Figure 3 in methodology, mainly for documentation thoroughness.
SHAP Summary Plot – a bar chart or bee-swarm plot showing which features contribute most to anomaly decisions across many instances. For example, imagine features like “meshing order amp”, “2nd harmonic amp”, “kurtosis” on x-axis, and the bars indicating average impact on model output. If the meshing order amplitude has the highest SHAP value on average for anomalies, it means many anomalies were due to high mesh vibration. This helps validate that the system is indeed catching things we care about (gear mesh issues, etc.). It provides an explanation at a global level of the model’s focus.
Figure 4.
– SHAP feature importance suggestion: Each bar shows an important feature for the XGBoost anomaly classification, e.g., “Gear mesh (60th order) amplitude” with a large positive contribution toward anomaly, etc., indicating these are key factors. This can be generated once we have the model.).
In implementation, these figures would be generated from the actual data, but for concept we can create representative ones.
Finally, to illustrate how the concept works end-to-end, consider a use case scenario: The system is running on a honing line. On a Tuesday afternoon, sensor on Honing Machine #2 detects an abnormal vibration burst at ~150 Hz during a part cycle – the system’s anomaly detector flags it. The part’s ID is 2025-XYZ. Immediately, the edge gateway notes this and the cloud analysis assigns an anomaly score of say 0.95 (high). Machine #2’s status on the dashboard turns red, and an alert is sent: “High vibration anomaly on Machine 2 for Part 2025-XYZ. Likely cause: 2nd order spike (149 Hz) above threshold. Part flagged for inspection.” Maintenance gets a notification as well. The operator sets that gear aside for noise testing – indeed finds a finish inconsistency. Meanwhile, maintenance inspects Machine #2 and finds that a clamp was slightly loose causing the vibration. They fix it, preventing further such issues. Without the system, that batch of gears might have all had the defect until the next quality audit caught it; now only one gear was affected and it was caught in time. This hypothetical scenario encapsulates the benefits of the implemented concept.
Discussion
The proposed system brings together advanced manufacturing knowledge (gear NVH, process traceability) and modern digital technologies (IIoT sensing, big data analytics). In doing so, it addresses a gap in conventional quality control: the lack of continuous, in-process NVH monitoring tied to individual parts. By reviewing literature across disparate fields, we identified that while components of this solution exist (e.g., vibration analysis techniques, IoT data pipelines, ML anomaly detection), their integration is novel in this particular application domain.
One discussion point is how this approach compares to traditional quality control and end-of-line testing. End-of-line NVH testing (like running the gearbox in a quiet room and measuring noise) is a practice some manufacturers use. That can catch noisy gears before shipping, but it’s after all value-adding processes are done (assembly). Our approach shifts the detection upstream to the manufacturing process itself, which is more efficient – it’s essentially implementing a form of Process FMEA control, where potential noise issues are detected at their source (machining) rather than after assembly. If successful, this could reduce dependency on end-of-line testing or at least reduce its failure rate (most parts passing because issues were weeded out). It contributes to the larger concept of “zero defect manufacturing” using digital tools.
Another point is the handling of vast data. There could be concern that storing high-frequency data for every part might be too much. However, we discussed strategies like feature extraction and selective storage. The feasibility analysis suggests this is manageable with modern big data tools. Also, by focusing on features relevant to NVH (orders, etc.), we condense the data volume drastically. Raw waveforms might only be saved when needed (like a snapshot of an anomaly).
Limitations: The current concept still relies on domain expert input to fully interpret the results. For example, the ML might flag an anomaly, but diagnosing it (was it a misalignment, or a tool issue, etc.?) often needs an experienced engineer. We included SHAP to help, but it’s not a magic bullet. Over time, as more cases are seen, the system could potentially be extended with expert systems or a knowledge base (like “if anomaly shows high 1× order and high kurtosis, likely mechanical shock – check tool/chuck”). That could evolve into a semi-automated diagnostic assistant.
Another limitation is coverage – we concentrated on the gear finishing process (honing). There are other sources of NVH issues (heat treat distortion beyond correction, gear geometry design issues). The system doesn’t directly measure noise, only vibrations on machines. It assumes a correlation (which usually exists) that a vibration during manufacturing correlates to noise performance. This is mostly true for ghost noise which originates from surface defects. But some NVH issues might not manifest strongly as machine vibration (e.g., a subtle geometry error might not make the machine vibrate but still cause noise under load in a gearbox). To mitigate that, extremely sensitive sensors or additional quality checks might still be needed. However, any systematic error typically does show some signature in process signals.
Cross-department collaboration: Implementing this touches production (who own the machines), quality (who care about part results), maintenance (machine health) and IT. It requires breaking silos – e.g., quality engineers need to work with data scientists. This can be a challenge culturally. But the pilot can demonstrate value to each stakeholder: quality sees fewer escapes, maintenance gets predictive heads-up, production avoids rework.
The approach also lays groundwork for predictive maintenance as a secondary benefit. We focused on part quality, but those same sensors can tell us about machine conditions (bearing wear, etc.) – as indeed Hanioka (2025) did by relating vibrations to accuracy. In this sense, the system is multi-purpose: it’s both a process monitor and a machine health monitor. It exemplifies the Industry 4.0 ideal of turning machines into “smart” machines that report on themselves and their outputs.
Future of such systems: If implemented widely, one can imagine an industry database of gear manufacturing NVH: multiple factories contributing (anonymized) data, and machine learning models trained on a huge scale to identify best process parameters for low NVH, benchmarking machines, etc. Our concept touches on a specific use case but is extensible to other operations (like if shafts, bearings, or other components have similar issues, a similar approach could be used).
Finally, generalization: While this study centered on electric drive gears, the concept of cloud-based NVH monitoring can apply to other sectors. Any manufacturing with tight vibration/noise requirements (turbines, e-motors, even consumer product motors) could adopt a similar scheme. The specific features and sensors might differ, but the framework of sensors + time sync + streaming analytics + traceability is general.
In discussion, one might question: is this overkill for the problem? Could simpler solutions exist (like just do more frequent calibration of honing machines or offline inspection of gear surfaces)? Simpler measures should indeed be continued (good maintenance, etc.), but they don’t capture everything. The data-driven approach provides assurance and early warning that even an army of quality inspectors might miss because of statistical sampling limits. Especially as EV gears demand near-zero noise tolerance, such digital augmentation becomes necessary.
Conclusions
This paper presented a comprehensive study and concept design for a cloud-integrated IoT/Big Data system to monitor NVH-related quality in electric drivetrain gear manufacturing. Through a literature review, we established that microscopic tooth surface errors (often introduced during honing) can cause significant gear whine (“ghost noise”), and that these errors are hard to detect with conventional sampling inspection yet leave tell-tale signatures in process vibration signals. We also highlighted how vibrations can propagate in a production environment, complicating source attribution, and hence underscored the importance of synchronizing a distributed sensor network to accurately localize vibration events.
Our feasibility analysis compared various technologies, ultimately recommending a solution featuring PoE accelerometers synchronized by IEEE 1588 PTP, with data routed through an edge–cloud architecture employing MQTT and Kafka for real-time streaming. Key design elements include an OPC UA-based integration with MES to tag each data point with the corresponding part’s identity (via DMC code), and a flexible storage scheme combining a time-series database for aggregate features with object storage for raw waveform archives. We outlined how advanced analytics – specifically, anomaly detection using Isolation Forest and supervised learning with XGBoost – can operate on the streaming data to flag out-of-normal vibrations. We further advocated for the use of SHAP explainability to translate complex model decisions into engineer-friendly insights (e.g., pinpointing which vibration frequency band caused an alarm).
The concept design illustrates a closed-loop quality control paradigm: as gears are machined, their “digital vibration fingerprint” is captured and assessed in real-time, enabling immediate feedback. This not only helps catch and isolate potentially noisy gears before they proceed to assembly, but also provides diagnostics to fix the underlying process (for example, alerting that a honing machine’s spindle might be misaligned if it consistently shows abnormal vibration). In essence, we move towards a self-aware machining process wherein each machine continuously monitors its output quality and health, with all data aggregated in the cloud for holistic analysis and long-term optimization.
We foresee that implementing this system could significantly reduce scrap and rework by detecting issues that would otherwise surface only in end-of-line testing or, worse, in customer hands. It effectively acts as an in-situ NVH test for every gear. Moreover, by preventing out-of-tolerance gears from shipping (and identifying root causes like machine anomalies early), it can mitigate warranty and recall risks, which, as literature suggests, are critical given the stricter NVH expectations in EVs. Additional benefits include enabling predictive maintenance (since the same data can indicate machine wear trends) and contributing to enterprise knowledge (data-driven continuous improvement and AI capabilities in the factory).
Limitations and Future Work: While promising, the approach has limitations. It relies on the assumption that process vibrations correlate strongly with product NVH – this holds true for many cases (e.g., waviness-induced noise), but some NVH issues might slip through if they don’t excite the sensors noticeably. Therefore, the system should augment, not entirely replace, end-of-line testing at first. Future work could integrate direct acoustic measurements of gear noise under load (perhaps using test stands instrumented and linked with this data for a more complete picture). Additionally, the machine learning models will need ongoing tuning; an interesting future direction is to use transfer learning across multiple production lines to build more robust anomaly detectors (so that even a new line with little data can benefit from a model trained elsewhere).
Another future direction is implementing source separation algorithms more deeply, as mentioned – potentially using array signal processing techniques to localize vibration sources in 3D space. This could involve additional sensors like ultrasonic or high-frequency vibration sensors to detect things like bearing faults that our current band might not catch.
We also plan to explore the use of digital twins: creating a virtual model of the gear and machine that can simulate how a given measured error would translate to noise. By connecting the digital twin with real data (e.g., feeding measured gear deviations into a noise simulation), we could eventually predict a noise level for each gear. This would be the ultimate goal: a number or pass/fail for each gear’s expected NVH without needing a physical spin test, using purely the in-process data.
In conclusion, this research and concept demonstration show that a confluence of modern technologies – from precision time-sync sensing to cloud analytics – can tackle a classic manufacturing quality challenge in a new way. It exemplifies the Industry 4.0 vision for smart, connected manufacturing: where machines, parts, and data are all linked in real-time to achieve higher quality and efficiency. The case of gear NVH monitoring is compelling and timely given the rise of electric vehicles and their stringent noise requirements. Implementing such a system can give manufacturers a competitive edge by ensuring quieter, more reliable gearboxes while also reducing waste and downtime. We believe the approach outlined here is broadly applicable and represents a step towards the “zero-defect” smart factory of the future.
References
- Tian, X.; Sun, Y.; Mu, W.; Xia, L.; Han, J. High-Speed and Low-Noise Gear Finishing by Gear Grinding and Honing: A Review. Chinese Journal of Mechanical Engineering 2024, 37(1), 127. [Google Scholar] [CrossRef]
- Matsuishi, H., Shimosaka, T., & Nakatani, Y. (2021). Stabilization of gear machining accuracy by controlling gear honing machine vibration. JATCO Technical Review 2021. [Industry case study].
- Hanioka, H., Ogawa, Y., Yoshida, J., Onishi, Y., & Kurokawa, Y. (2025). Dependency of Gear Honing Machine Processing Accuracy on Machine Vibration and the Vibration Reduction Considering Contribution. SAE Technical Paper 2024-32-0020. [CrossRef]
- Türich, A., & Deininger, K. (2024). Noise analysis for e-drive gears and in-process gear inspection. Gear Solutions Magazine, February 2024. [Trade article].
- Bonori, G.; Pelà, L.; Viotto, C. Optimization of gear microgeometry for noise reduction. Mechanism and Machine Theory 2010, 45(11), 1590–1607. [Google Scholar] [CrossRef]
- IEEE Standards Association. (2020). IEEE 1588-2019: Standard for a Precision Clock Synchronization Protocol for Networked Measurement and Control Systems. IEEE. [Standard].
- Waehner, K. (2022, February 11). OPC UA, MQTT, and Apache Kafka – The Trinity of Data Streaming in IIoT. Retrieved from https://www.kai-waehner.de/blog/2022/02/11/opc-ua-mqtt-apache-kafka-data-streaming-iiot/. [Industry blog].
- Herreros-Martínez, A.; Magdalena-Benedicto, R.; Vila-Francés, J.; Serrano-López, A. J.; Martínez-Herráiz, J. J. Applied machine learning to anomaly detection in enterprise purchase processes: A hybrid approach using clustering and Isolation Forest. Information 2023, 16(3), 177. [Google Scholar] [CrossRef]
- Silva, R. C., et al. (2019). Surface waviness evaluation in honed gears and its impact on noise. In Proceedings of the ASME 2019 International Manufacturing Science and Engineering Conference (MSEC2019) (Vol. 2, pp. V002T02A059). ASME.
- Zhao, L.; Zhou, Z.; Wu, T. Gear error control and response of electric vehicle transmission gearing based on gear trimming. Journal of Vibroengineering 2024, 26(2), 235–247. [Google Scholar] [CrossRef]
|
Disclaimer/Publisher’s Note: The statements, opinions and data contained in all publications are solely those of the individual author(s) and contributor(s) and not of MDPI and/or the editor(s). MDPI and/or the editor(s) disclaim responsibility for any injury to people or property resulting from any ideas, methods, instructions or products referred to in the content. |
© 2025 by the authors. Licensee MDPI, Basel, Switzerland. This article is an open access article distributed under the terms and conditions of the Creative Commons Attribution (CC BY) license (http://creativecommons.org/licenses/by/4.0/).