Submitted:
08 December 2025
Posted:
09 December 2025
Read the latest preprint version here
Abstract
This study presents the Structural–Typological–Value Sensitivity Model (STVSM), a multi-dimensional framework for evaluating vulnerability in historic buildings where fragility cannot be explained by structural indicators alone. Existing models prioritise load-bearing behaviour but overlook typological discontinuity, spatial fragmentation and erosion of cultural or architectural value. STVSM addresses this through three weighted sub-indices—structural vulnerability (SV), typological degradation (TV) and heritage value (HV)—each calibrated using expert-derived micro–macro coefficients. Field-based deterioration scores (0–1) are multiplied by these final weights to produce SV, TV and HV values, then merged into a Conservation Priority Index (CPI).The model is applied to twenty-five buildings in three heritage contexts: Cumalıkızık traditional houses, vernacular dwellings in Balıkesir–Karesi and nineteenth-century Greek Orthodox churches in Bursa. The churches yield the highest CPI values due to roof loss, wall deformation and spatial discontinuity, reinforced by cultural significance. Vernacular houses show moderate structural deterioration but marked typological distortion linked to later additions and façade alterations. Cumalıkızık houses present heterogeneous conditions, combining preserved structures with material decay.By quantifying structural behaviour, typological integrity and heritage value within a single analytical system, STVSM offers a transparent and repeatable basis for conservation prioritisation across diverse historic building stocks.
Keywords:
structural vulnerability
; typological integrity
; heritage value assessment
; multi-criteria evaluation
; conservation prioritization
; historic building diagnostics
1. Introductıon
This study examines the multilayered nature of heritage environments by arguing that conservation extends far beyond physical intervention, requiring the simultaneous consideration of spatial, semantic, and socio-cultural dimensions.
1.1. The Multilayered Nature of Cultural Heritage and the Problem of Fragility
Contemporary heritage scholarship frames cultural heritage as a multilayered domain shaped not only by material preservation but also by identity, memory, and social negotiation. Smith’s (2006) notion of authorized heritage discourse highlights heritage as an active field of meaning-making rather than a fixed set of objects. Similarly, Graham, Ashworth, and Tunbridge (2000) conceptualize heritage as a cultural resource continually redefined through economic and political dynamics, leading different communities to assign different priorities to heritage places.
International conservation documents reinforce this perspective. UNESCO (1972) and ICOMOS charters emphasize authenticity, integrity, continuity of use, and collective attachment as determinants equal in importance to physical conservation. The Nara Document on Authenticity (1994) further expands authenticity beyond form and material to include function, tradition, ritual, spatial experience, and local knowledge.
Within this framework, fragility cannot be treated as a purely technical issue. Structural weaknesses correspond to structural fragility; distortions in plan, elevation, and spatial organization shape typological fragility; and representational capacity, rarity, and mnemonic value define value-based fragility. These dimensions are interdependent, and in areas containing numerous historic buildings, the fragmentation of existing assessment methods across disciplines makes prioritization difficult.
1.2. Structural Fragility Models: A Robust but One-Dimensional Literature
Research on seismic performance and structural risk assessment of historic buildings constitutes a strong international body of literature. Among the most influential approaches is the Vulnerability Index Method (VIM) developed by Benedetti and Petrini (1984), which evaluates masonry building fragility through semi-empirical scoring based on material strength, wall texture, opening ratios, connection details, and maintenance conditions. Widely applied across European cities, VIM has been adapted to different regions through macroseismic observations. Lagomarsino and Giovinazzi’s post-2006 models advance this framework by integrating EMS-98 damage grades, mechanical parameters, and behavior types into a coherent analytical system, now considered an international reference for historic building stock assessments.
Other studies have focused on fragility curves, performance levels, and probabilistic damage distributions. Scacco, Ghiassi, Milani, and Lourenço (2020) introduced a rapid nonlinear modeling approach that significantly improves the evaluation of out-of-plane behavior in unreinforced or FRCM-strengthened masonry walls. Boukri and Bensaïbi (2008) likewise proposed a relative fragility scale for traditional Algerian masonry houses based on opening ratios, wall arrangement, and maintenance conditions.
Despite the strength of this literature, a clear limitation persists: fragility is almost entirely reduced to structural behavior. Yet conservation requires an integrated perspective that incorporates spatial organization, elevation character, typological continuity, material integrity, and cultural value. Most structural indices are therefore insufficient for prioritization in heritage contexts because they exclude typological degradation, spatial discontinuity, and representational or cultural factors from their computational frameworks.
Recent approaches (e.g., Huang, Mat Sulaiman & Harun, 2025) attempt to quantify conservation value using multi-criteria decision-making methods such as AHP; however, these models tend to remain perceptual or engineering-centric and do not integrate typology, spatial integrity, and cultural layering into a unified structural-typological-value assessment.
1.3. The Absence of Integrated Models for Typological Integrity, Cultural Value, and Multi-Criteria Assessment
Although structural fragility research offers a mature theoretical foundation, the typological integrity and cultural or aesthetic value of historic buildings are still addressed largely in qualitative terms. Morphological perspectives such as those of Caniggia and Maffei (2001) and spatial transformation analyses developed by Kropf (2014) clarify the role of plan configuration, volumetric structure, and façade rhythm in shaping architectural identity, yet they do not translate these typological parameters into quantitative fragility measures. Likewise, the Conzenian tradition provides fine-grained analyses of building–parcel–urban fabric relations but offers no numerical framework through which these relations can be incorporated into conservation prioritization.
Debates on the value dimension of heritage explore identity, collective memory, and representational capacity in depth, but these domains are not mathematically related to structural or typological deterioration. As a result, buildings with high cultural or aesthetic significance do not generate systematically increased risk levels in existing models.
In response to this gap, multi-criteria decision-making (MCDM) approaches have recently been applied to heritage contexts. Studies by Ruiz-Jaramillo et al. (2020), Kösem (2025), Ravan et al. (2023), and Naziris (2022) evaluate multiple indicators such as physical condition, environmental hazards, and management capacity within shared analytical frameworks. Yet these models do not provide a building-scale index structure in which typological integrity or cultural/architectural value is computed on the same plane as structural data.
A common limitation therefore persists across the literature:
No existing approach calculates structural fragility (SV), typological integrity (TV), and cultural/architectural value (HV) as distinct sub-indices and integrates them within a unified mathematical system.
Consequently:
- structural models focus solely on the load-bearing system,
- typological analyses remain qualitative,
- value-based discussions stay within symbolic and representational domains,
- MCDM applications prioritize environmental or contextual hazards rather than building-scale complexity.
This study, through the STVSM model, aims precisely to fill this gap by transforming the diverse deterioration dynamics of different building types into a weighted, repeatable, and building-scale SV–TV–HV fragility index.
1.4. Contribution of This Study: The Integrated Logic of the STVSM Model
In the existing literature, structural integrity (SV), typological continuity (TV), and cultural or architectural value (HV) are examined within largely separate research domains. Structural models focus on load-bearing behavior, typological studies address plan morphology and spatial organization, and value-oriented approaches emphasize representation, identity, and collective memory. The absence of a unified computational structure that brings these three domains together makes conservation prioritization particularly difficult in areas with large numbers of historic buildings.
Although multi-criteria decision-making (MCDM) methods have recently been applied to heritage studies, these models typically concentrate on specific risk categories and do not achieve a building-scale integration of SV–TV–HV. A repeatable model capable of simultaneously measuring the relative influence of structural, typological, and cultural components is still lacking.
To address this gap, the present study proposes the STVSM (Structural–Typological–Value Sensitivity Model), an integrated vulnerability assessment system. The model defines indicator sets for each subcomponent, calibrates them through expert-based weighting, and converts observed deterioration or integrity levels into standardized 0–1 sub-indices. These sub-indices are then combined into a single composite fragility value.
The model’s distinctive contribution lies in incorporating cultural and architectural value (HV) as a quantitative factor that directly amplifies fragility outcomes. As a result, buildings with high representational capacity, rarity, or aesthetic coherence systematically receive higher conservation priority. The output of the model, the Conservation Priority Index (CPI), offers decision-makers a repeatable and scalable tool for evaluating large ensembles of heritage structures.
This article outlines the theoretical foundations of STVSM, presents its indicator sets, weighting procedure, and computational logic, and demonstrates its application through case studies from Bursa and Balıkesir. In doing so, it fills a clear methodological gap and provides a holistic evaluation tool for conservation practice.
2. Methodology
This section outlines the conceptual basis and procedural steps of the multi-dimensional fragility model employed in the study.
2.1. Methodological Approach: A Multi-Dimensional Fragility Framework
Evaluating the vulnerability of historic buildings requires the integration of structurally, typologically, and culturally distinct indicators within a single analytical system. To meet this need, the study adopts the STVSM (Structural–Typological–Value Sensitivity Model), a building-scale, multi-dimensional assessment framework.
The model draws upon indicator-based analysis and multi-criteria decision-making (MCDM) methods, now widely used in heritage studies. Indicator systems enhance consistency and comparability in risk assessment (Foster et al. 2013), while categorical scoring schemes have been shown to improve expert agreement in field evaluations (Illescas et al. 2020; Lagomarsino & Giovinazzi 2006).
Accordingly, STVSM employs a 0–1 standardized scale to classify deterioration and integrity levels, based on widely accepted thresholds (D’Ayala & Fodde 2008; Lagomarsino & Giovinazzi 2006; FEMA 2012; EMS-98):
- Minor Degradation: 0.25
- Moderate Degradation: 0.50
- Severe Degradation: 0.75
- Critical Failure / Near-Collapse: 1.00
These thresholds strengthen objectivity and align with the model’s normalization and computational logic.
Because the indicators do not carry equal importance, a multi-criteria structure is essential. Expert-based weighting is implemented through the Analytic Hierarchy Process (AHP), which calculates consistent weight coefficients via pairwise comparison (Saaty 1987). MCDM techniques also offer robustness under conditions of uncertainty (Opricovic & Tzeng 2004).
Within this framework, separate indicator sets are defined for SV, TV, and HV; each is calibrated with expert-derived weights and evaluated using standardized 0–1 field-based deterioration scores. Every building receives distinct sub-indices and a composite fragility score generated from their weighted combination.
In doing so, STVSM departs from single-dimensional assessment models by integrating structural behavior, typological integrity, and cultural value within a unified computational system, enabling comparable and repeatable evaluations across heterogeneous historic building stocks.
2.2. Development of the Indicator Sets (SV–TV–HV)
The indicators employed in the STVSM model were defined through an iterative process combining an extensive literature review, international conservation guidelines, and expert-panel feedback. Three criteria guided indicator selection: measurability, field applicability, and inter-expert consistency. This aligns with the increasingly standardized use of multi-indicator systems in heritage assessment. Clear indicator definitions improve reliability in risk evaluation (Foster et al. 2013), while graded damage scales enhance agreement among experts (Illescas et al. 2020).
Accordingly, SV–TV–HV indicators were structured into three groups representing the technical, typological, and heritage-value dimensions of historic buildings.
2.2.1. Structural Indicators (SV)
The SV set is derived from deterioration patterns commonly identified in the structural behavior of masonry and traditional buildings. D’Ayala & Fodde (2008) highlight losses in wall integrity, cracking, and connection weakness as key vulnerability determinants; Lourenço & Mendes (2012) emphasize diaphragm discontinuities, material decay, and opening deformation. Integrating these findings with expert evaluations, eight structural indicators were defined:
- SV1 – Degradation of loadbearing walls
- SV2 – Vertical structural element deterioration
- SV3 – Horizontal structural element deterioration
- SV4 – Roof system damage
- SV5 – Plaster/finishing loss
- SV6 – Opening deterioration
- SV7 – Eave/projection deterioration
- SV8 – Circulation element degradation
All SV indicators are scored on the standardized 0–1 scale, where higher values correspond to greater structural fragility.
2.2.2. Typological Indicators (TV)
Typological indicators capture deterioration affecting architectural character, including spatial organization, volumetric coherence, façade rhythm, and typological continuity. Cavallo et al. (2017) emphasize spatial and volumetric relations in defining typological integrity; Pereira et al. (2019) highlight plan continuity, façade proportions, and volumetric organization as core components of morphological assessment. Combining these frameworks with expert input, a six-item TV set was established:
- TV1 – Spatial integrity loss
- TV2 – Volumetric integrity deterioration
- TV3 – Window–door ratio/rhythm alteration
- TV4 – Façade composition loss
- TV5 – Roof-form / typological continuity loss
- TV6 – Loss of original typological elements
Each indicator is scored 0–1, with higher values indicating higher typological fragility.
2.2.3. Value Indicators (HV)
The HV set quantifies the cultural and architectural significance of historic buildings, drawing from multidimensional value-assessment literature. Revez et al. (2022) identify aesthetic integrity, identity attachment, rarity, and representational capacity as core heritage values; Jato-Espino et al. (2014) argue that cultural and aesthetic criteria must operate as independent decision dimensions. Translating these approaches to the building scale, six heritage-value indicators were defined:
- HV1 – Historical value
- HV2 – Architectural/design value
- HV3 – Artistic/aesthetic value
- HV4 – Contextual value
- HV5 – Authenticity/integrity
- HV6 – Rarity/representational value
HV indicators are scored on the same 0–1 scale but function as a multiplier in the model, ensuring that buildings with higher cultural or architectural significance exert proportionally greater influence on the final vulnerability and conservation-priority outputs.
2.3. Indicator Scoring
All indicators are scored using a standardized five-level scale (0–1) to ensure comparability across field applications. The scale is adapted from established damage-classification systems for heritage structures (D’Ayala & Fodde 2008; Lagomarsino & Giovinazzi 2006; FEMA 2012; EMS-98):
- 0.00 – No degradation
- 0.25 – Minor degradation
- 0.50 – Moderate degradation
- 0.75 – Severe degradation
- 1.00 – Critical degradation
Threshold-based ordinal scales of this type increase inter-expert agreement and facilitate standardized field assessment (Illescas et al. 2020).
2.4. Expert Elicitation and Weighting Procedure
The relative importance of the SV–TV–HV indicators was determined through expert elicitation within a multi-criteria framework. Consistent with AHP principles, this approach is suitable for managing uncertainty and multi-layered evaluation in heritage contexts (D’Ayala & Fodde 2008; Jato-Espino et al. 2014). Pairwise comparisons provided by the experts were used to compute the final weight coefficients, which were subsequently integrated into the STVSM scoring matrix.
2.5. Expert Profile and Selection Criteria
Experts were selected according to three criteria:
A. Domain expertise: at least 10 years of experience in architectural conservation, structural engineering, seismic performance, material deterioration, typology–morphology analysis, or heritage planning.
B. Academic/professional credentials: university appointment, authorship of restoration projects, or institutional experience with cultural heritage.
C. Analytical competence: demonstrated ability to interpret structural, typological, and heritage-value parameters during field assessment.
These criteria align with methodological recommendations for expert selection in multi-indicator heritage evaluations (Cavallo et al. 2017; Pereira et al. 2019).
The panel consisted of eight specialists from architecture and engineering, combining long-term academic work with extensive field experience. To preserve confidentiality, experts are coded as Expert 1–8. Their combined profile includes:
- a structural engineering professor specializing in seismic behavior of historic masonry;
- a restoration architect with dual academic and field-based experience;
- a professor of architecture with over 40 years in conservation practice;
- two associate professors working on conservation theory and architectural typology;
- a senior architect with decades of advisory experience on monumental structures;
- an Italy-trained architect-engineer focusing on seismic performance;
- a conservation architect with 40 years of field practice and part-time academic work.
This composition ensures that the SV–TV–HV dimensions are evaluated through a genuinely interdisciplinary lens.
All experts assessed each indicator independently, and all scores were incorporated with equal weight. This anonymized, equal-weight procedure adheres to recommended practice in expert-based MCDM applications (Saaty 2008; Cavallo et al. 2017). The raw scoring table is provided in Table 1, ensuring full transparency and reproducibility.
2.6. Data Collection: Indicator Assessment Forms
Experts completed a structured STVSM Expert Assessment Form designed to quantify the relative importance of each indicator. The form follows established indicator-based evaluation frameworks in heritage studies (Foster et al. 2013; Illescas et al. 2020).
Experts provided three types of assessments:
- the individual importance of each indicator;
- pairwise comparisons for AHP-based weighting;
- the relative priority of the SV–TV–HV dimensions.
All responses were compiled to generate the final weight distribution for the model (Table 1).
2.7. Weighting: AHP-Based Pairwise Comparison
Indicator weights were derived using Saaty’s Analytic Hierarchy Process (AHP) (Saaty 1987). Experts evaluated each indicator on the 1–9 Saaty scale, and individual pairwise comparison matrices were aggregated using the geometric mean method (Opricovic & Tzeng 2004). This is a widely adopted approach for systematically determining the relative importance of multiple criteria.
2.8. Consistency Ratio (CR)
A consistency threshold of CR ≤ 0.10 was required for all AHP matrices. All expert assessments met this criterion, indicating that the panel’s judgments satisfied methodological consistency requirements.
2.9. Normalization of Weights
Weights assigned to the SV–TV–HV groups were normalized so that the total weight within each sub-index equals 1. This ensured methodological balance across indicator categories (Jato-Espino et al. 2014).
2.10. Assignment of Observation-Based Scores and Sensitivity Analysis
Scores on the 0–1 scale for SV–TV–HV indicators were assigned based on field observations, measured drawings, and condition documentation. This process draws directly on the author’s long-term academic research and hands-on conservation experience with the studied building stock. The structural deterioration patterns identified in the surveyed buildings are consistent with the damage typologies documented in recent post-earthquake field studies in Türkiye, particularly the Elazığ–Sivrice earthquake assessments reported by Caglar et al. (2023), which describe comparable mechanisms of cracking, wall discontinuity and load-bearing deformation.
The scoring follows the threshold-based classification frameworks commonly used in heritage deterioration and condition assessment models (Begić & Krstić 2024; Rodrigues et al. 2019; Zuraidi et al. 2018). As in other risk and fragility models in cultural heritage, expert-informed parameters play a central role (Ramalhinho & Macedo 2019; Waller 2003).
To test robustness, a sensitivity analysis was conducted by varying all indicator scores by ±0.25. STVSM composite scores changed by no more than ±0.03, and the conservation-priority ranking remained stable. This confirms the model’s resilience to uncertainty.
Furthermore, studies on multi-layered settlements highlight the applicability of expert-based hybrid qualitative–quantitative assessment frameworks to heritage contexts (Binan 2013; Binan & Binan 2005; Paç & Binan 2019).
3. STVSM Computation Model and Sub-Index Generation
In this stage, the STVSM model integrates expert-derived weights with field-based deterioration scores to generate the SV–TV–HV sub-indices and their combined conservation-priority output.
3.1. Sub-Index Calculation (SV, TV, HV)
Field observations were scored on a 0–1 four-level scale (0.00–1.00). Each indicator’s deterioration score (sᵢ) was multiplied by its corresponding weight (wᵢ) to compute the sub-indices:
SV = Σ(wᵢ × sᵢ)
TV = Σ(wᵢ × sᵢ)
HV = Σ(wᵢ × sᵢ)
This structure normalizes all components to a 0–1 range, enabling direct comparison between sub-indices.
3.2. Value Multiplier Derived from HV
To express the amplifying effect of cultural/architectural value on conservation priority, a value multiplier (M) is derived from the normalized HV index:
M = 1 + HV_normalized
Thus:
- HV = 0.00; M = 1.00
- HV = 0.25; M = 1.25
- HV = 0.50; M = 1.50
- HV = 0.75; M = 1.75
- HV = 1.00; M = 2.00
This approach aligns with studies that numerically model the risk-amplifying impact of heritage value (Revez et al. 2022; Pereira et al. 2019).
3.3. Combined Physical Deterioration Index (B Index)
Structural (SV) and typological (TV) fragility values are merged into a normalized physical deterioration index:
B = (SV + TV) / 2
The B index captures the overall physical integrity of each building on a 0–1 continuum.
3.4. Final Conservation Priority Index (CPI)
STVSM integrates the physical deterioration index (B) with the cultural-value multiplier (M) to generate the final conservation priority score:
CPI = B × M
This formulation ensures:
- Buildings with higher physical deterioration (high B) yield higher CPI values.
- Among buildings with similar deterioration levels, those with higher heritage value (high M) are assigned higher conservation priority.
Priority thresholds (0–2 scale):
- 0.00 ≤ CPI < 0.50; Low priority
- 0.50 ≤ CPI < 1.00; Medium priority
- 1.00 ≤ CPI < 1.50; High priority
- 1.50 ≤ CPI ≤ 2.00; Critical priority
These thresholds reflect risk-tiering schemes used in integrated deterioration–value models (Cavallo et al. 2017; Revez et al. 2022).
3.5. Computational Workflow
A. Indicator scoring (sᵢ)
Each indicator is assigned a score using the four-level 0–1 scale:
- 0.00 = No deterioration
- 0.25 = Minor
- 0.50 = Moderate
- 0.75 = Severe
- 1.00 = Critical
B. Weight application
SV = Σ(wᵢ × sᵢ)
TV = Σ(wᵢ × sᵢ)
HV = Σ(wᵢ × sᵢ)
C. Sub-indices remain normalized within 0–1.
D. Physical deterioration index (B)
B = (SV + TV) / 2
E. Value multiplier (M)
M = 1 + HV
F. Conservation Priority Index (CPI)
CPI = B × M
This workflow ensures that STVSM remains computationally transparent, field-applicable, and consistent with established heritage-risk methodologies.
4. Case Studıes and Documentatıon-Based Analysıs
The STVSM model is applied here as an integrated framework that evaluates not only structural deterioration but also typological continuity, spatial integrity, façade character, and material authenticity. Accurate scoring depends on systematic, comparable documentation of each building’s existing condition.
Accordingly, three groups of historic buildings were subjected to multi-layered architectural documentation:
- Traditional houses in Cumalıkızık,
- Vernacular residential buildings in Balıkesir–Karesi,
- Nineteenth-century Greek Orthodox churches in Bursa and its surroundings.
Plans, elevations, spatial configurations, distinctions between original and later alterations, material-fabric readings, and deterioration mappings constitute the analytical dataset. This dataset directly supports:
- assignment of 0–1 deterioration scores for all SV–TV–HV indicators,
- computation of weighted sub-indices, and
- calculation of the final fragility and priority values (B and CPI).
A total of 26 buildings were documented. Their plans, elevations, interior photographs, and deterioration diagrams demonstrate how the documentation base shapes STVSM scoring.
4.1. Example Calculation: Application of STVSM to a Single Building
To illustrate the model’s operation, one Cumalıkızık house (coded C1) is presented as an example (Figure 1). Field observations were converted into standardized 0–1 severity values (Severityᵢ), and these were multiplied by the final indicator weights (wᵢ) from Table 6.2 to compute weighted scores.
Selected SV indicators for building C1:
A. SV1 – Cracking in load-bearing walls
- Severity_SV1 = 0.6429
- Weight w_SV1 = 0.0582
- Weighted Score WS_SV1 = 0.6429 × 0.0582 ≈ 0.0374
B. SV2 – Wall discontinuities and losses
- Severity_SV2 = 0.45
- Weight w_SV2 = 0.0619
- WS_SV2 = 0.45 × 0.0619 ≈ 0.0279
C. SV3 – Material deterioration (stone, brick, mortar)
- Severity_SV3 = 0.50
- Weight w_SV3 = 0.0582
- WS_SV3 = 0.50 × 0.0582 ≈ 0.0291
The same procedure is applied to all SV, TV, and HV indicators. For instance:
Selected TV and HV weighted scores:
- WS_TV2 = 0.25 × 0.0539 ≈ 0.0135
- WS_TV3 = 0.30 × 0.0440 ≈ 0.0132
- WS_TV4 = 0.70 × 0.0384 ≈ 0.0269
- WS_HV2 = 0.30 × 0.0602 ≈ 0.0181
- WS_HV1 = 0.20 × 0.0574 ≈ 0.0115
- WS_HV6 = 0.15 × 0.0585 ≈ 0.0090
The sum of all weighted scores across SV, TV, and HV constitutes the building’s complete STVSM profile. For the C1 example, the resulting value is:
STVSM(C1) = [SV total] + [TV total] + [HV total]
(Numerical total is inserted from Table 6.3.)
This example clarifies how documentation data, severity classification, and expert-derived weights combine to produce reproducible building-level fragility and conservation-priority outcomes.
STVSM_C1 = Σ WS_i ≈ 0.37
This value corresponds to a mid–high fragility level within the 0–1 scale defined by the model. The C1 building therefore exhibits a comparatively higher conservation priority, as its structural, typological, and value-related indicators collectively reveal accumulated deterioration across multiple components.
This example demonstrates, in a transparent and traceable manner, how field-based severity scores (Severityᵢ) and expert-derived weight coefficients (wᵢ) interact to produce a single, composite fragility score for each building.
4.2. Descriptions and Documentation Features of the Examined Buildings
This subsection outlines the typological and structural characteristics of the Cumalıkızık traditional houses based on measured surveys and on-site documentation.
4.2.1. Traditional Houses of Cumalıkızık
The buildings in this group typically consist of rubble-stone ground floors and timber/bağdadi upper floors. Many exhibit alterations, façade extensions, and changes in use that partially compromise their original typology. Documentation focused on separating original and added components, identifying deterioration in the load-bearing system, and assessing the material and architectural character.
A. 2816 Block / Plot 3
Three-storey structure with significant transformations, including the conversion of ground-floor stone stables into living spaces. Irregular upper-floor openings and added balconies reduce typological authenticity. Timber elements show decay, overhanging supports are weakened, and plaster detachment is widespread. An original courtyard oven is preserved.
B. 2816 Block / Plot 4
A rare example featuring an open-sofa plan type. Ground-floor stables largely preserve their original character, while the upper floor maintains typological continuity with its simple façade composition and hatıllı stone walls. Moisture-induced deterioration and section loss in roof timbers are the primary issues.
C. 2816 Block / Plot 5
One-storey plus ground-floor structure with partial loss of its original façade due to later interventions. The closed taşlık, bağdadi upper floor, and stone ground floor reflect typical local construction. Deformation in timber elements, settlement in floor structures, and irregular stonework exposed beneath plaster constitute the main deterioration patterns.
D. 2816 Block / Plot 10
A twin-unit building under a single roof, characterized by its projecting upper floor and stone ground level. Severe decay in eaves-zone timbers, sagging floor structures, and mortar loss in stone walls are evident. Typological features survive, but both structural and material intervention needs are high.
E. 2816 Block / Plot 6
Exhibits the canonical Cumalıkızık typology: stone stables/storage on the ground floor, and two-storey bağdadi timber construction above. Irregular taşlık and service rooms transition to upper-floor living spaces arranged around a sofa. Deterioration includes timber-section loss, ceiling sagging, mortar loss, and plaster detachment. Despite retaining overall integrity, the building requires extensive structural and material conservation.
F. 2816 Block / Plot 22
A mixed-type example with large ground-floor stone stables and upper-floor living spaces. High moisture, stone-masonry disintegration, severe timber deformation, ceiling collapses, and extensive plaster loss are documented. Although the stone-and-bağdadi typology is legible, deterioration of projecting supports places the building in a structurally vulnerable state.
G. 2816 Block / Plot 23
The sloped parcel produces an asymmetric plan, with stone storage and service rooms below and living spaces above. Heavy masonry deterioration, bağdadi detachment, joinery loss, moisture damage, and risks of ceiling and floor collapse are observed. The plan-facade integrity is significantly compromised, and the structure is in critical condition.
H. 2799 Block / Plots 1–2
A combined block adapted to an irregular parcel, with broken-plan geometry and strongly projecting bağdadi upper floors. Documentation reveals stone stables below and subdivided living spaces above. Deterioration includes timber decay in overhang supports, plaster loss, masonry disintegration, window-frame deterioration, and widespread interior humidity. Although original features remain legible, the structure requires major typological and structural intervention (Figure 1).
4.1.2. Civil Architecture Examples from the Karesi District of Balıkesir
This subsection summarizes the documented condition, typological characteristics, and material deterioration patterns of selected civilian architecture examples in the Karesi district of Balıkesir.
A. Parcel 8486 / 1
The building consists of a basement, ground, and first floor, forming a typical masonry urban house with a small southern garden. Service spaces occupy the basement, where beam deterioration is evident. The ground floor contains the kitchen, toilet, and two rooms, with a pronounced contrast between the wider southern openings and the narrow northern windows; several original timber frames are missing. On the first floor, the removal of interior partitions has weakened the structural system. Extensive plaster loss and material decay on the façades indicate a need for comprehensive intervention.
B. Parcel 8486 / 5
This four-level structure (basement, ground, first floor, and attic) displays a distinguished façade composition characterized by cantilevers, timber-framed windows, and balcony elements. The basement contains storage areas and a kitchen; access to the ground floor is provided via a staircase retaining its original terrazzo steps. Most of the first-floor rooms and oriels survive with moderate deterioration in timber and plaster. The attic includes a small room and terrace. Despite evident material degradation, the overall compositional integrity is preserved.
C. Parcel 8490 / 3
A representative late Ottoman house with a central hall (sofa) plan. Entry is through a quarter-turn stair leading to the ground floor, which includes the taşlık, kitchen, and rooms. The first floor retains its original stair and a clear rectangular plan around the central hall. The basement provides stone-walled storage and access to the courtyard. Persistent humidity, floor deformations, joinery losses, and plaster detachment severely affect the interior. Although the plan remains legible, the structure requires major intervention.
D. Parcel 8490 / 4
Initially rectangular in plan, the house acquired an L-shaped configuration following the addition of a kitchen block. It consists of a basement, ground floor, and first floor. The ground-floor hall has been subdivided, disrupting the original layout; on the first floor, several interior walls have been removed, though spatial traces remain identifiable. The structural system comprises a stone-walled ground floor and timber-frame upper levels with earthen infill. Widespread plaster loss, timber decay, and deformation of Bağdadi walls indicate the need for a holistic conservation approach.
E. Parcel 8458 / 5
A three-story timber-frame house reflecting Balıkesir’s late 19th to early 20th-century domestic typology, with cantilevers, timber-framed windows, and plastered façades. The ground floor includes entrance and service rooms; the first floor contains a hall and two rooms; the second-floor plan is organized around a hall with four rooms. Original interior elements such as the staircase, ceiling panels, and built-in cupboards survive, but later partitions and rear additions compromise the integrity. Timber deterioration and façade material losses require structural and material-level repairs.
F. Parcel 8498 / 6
A two-story house characterized by cantilevers, rhythmic window composition, broad eaves, and original joinery. Service spaces occupy the ground floor, with living areas arranged around a hall on the upper floor. Interior ceiling panels, stair, and built-in cupboards remain intact. Rear extensions and roof repairs are the main alterations. Despite maintaining massing and plan integrity, the house shows material deterioration requiring maintenance.
G. Parcel 8498 / 7
Facing Kor Street, this two-story structure retains its period character with a stone-base ground floor, plastered Bağdadi upper level, orderly window rhythm, and slight cantilever. Minor rear additions and roof alterations are present. Interior wooden ceilings, joinery, cupboards, and stair elements are preserved. The plan arrangement follows the standard Balıkesir type: service rooms on the ground floor and hall-based living spaces above. Typological integrity is high, while material fabric requires renewal.
H. Parcel 8499 / 3
A three-story Bağdadi–timber-frame house with a recessed entrance, stone steps, timber arch, and original wrought-iron details. The ground floor contains the kitchen and service rooms; the first floor features hall-oriented rooms; the second floor includes broader rooms and later bathroom–terrace additions. Original ceilings, joinery, and wall fabric remain, while PVC replacements and added units constitute the main intrusive elements. The structure preserves plan and façade coherence but requires extensive maintenance due to material deterioration and incompatible additions (Figure 2).
4.1.3. Nineteenth-Century Greek Orthodox Churches in Urban and Rural Bursa
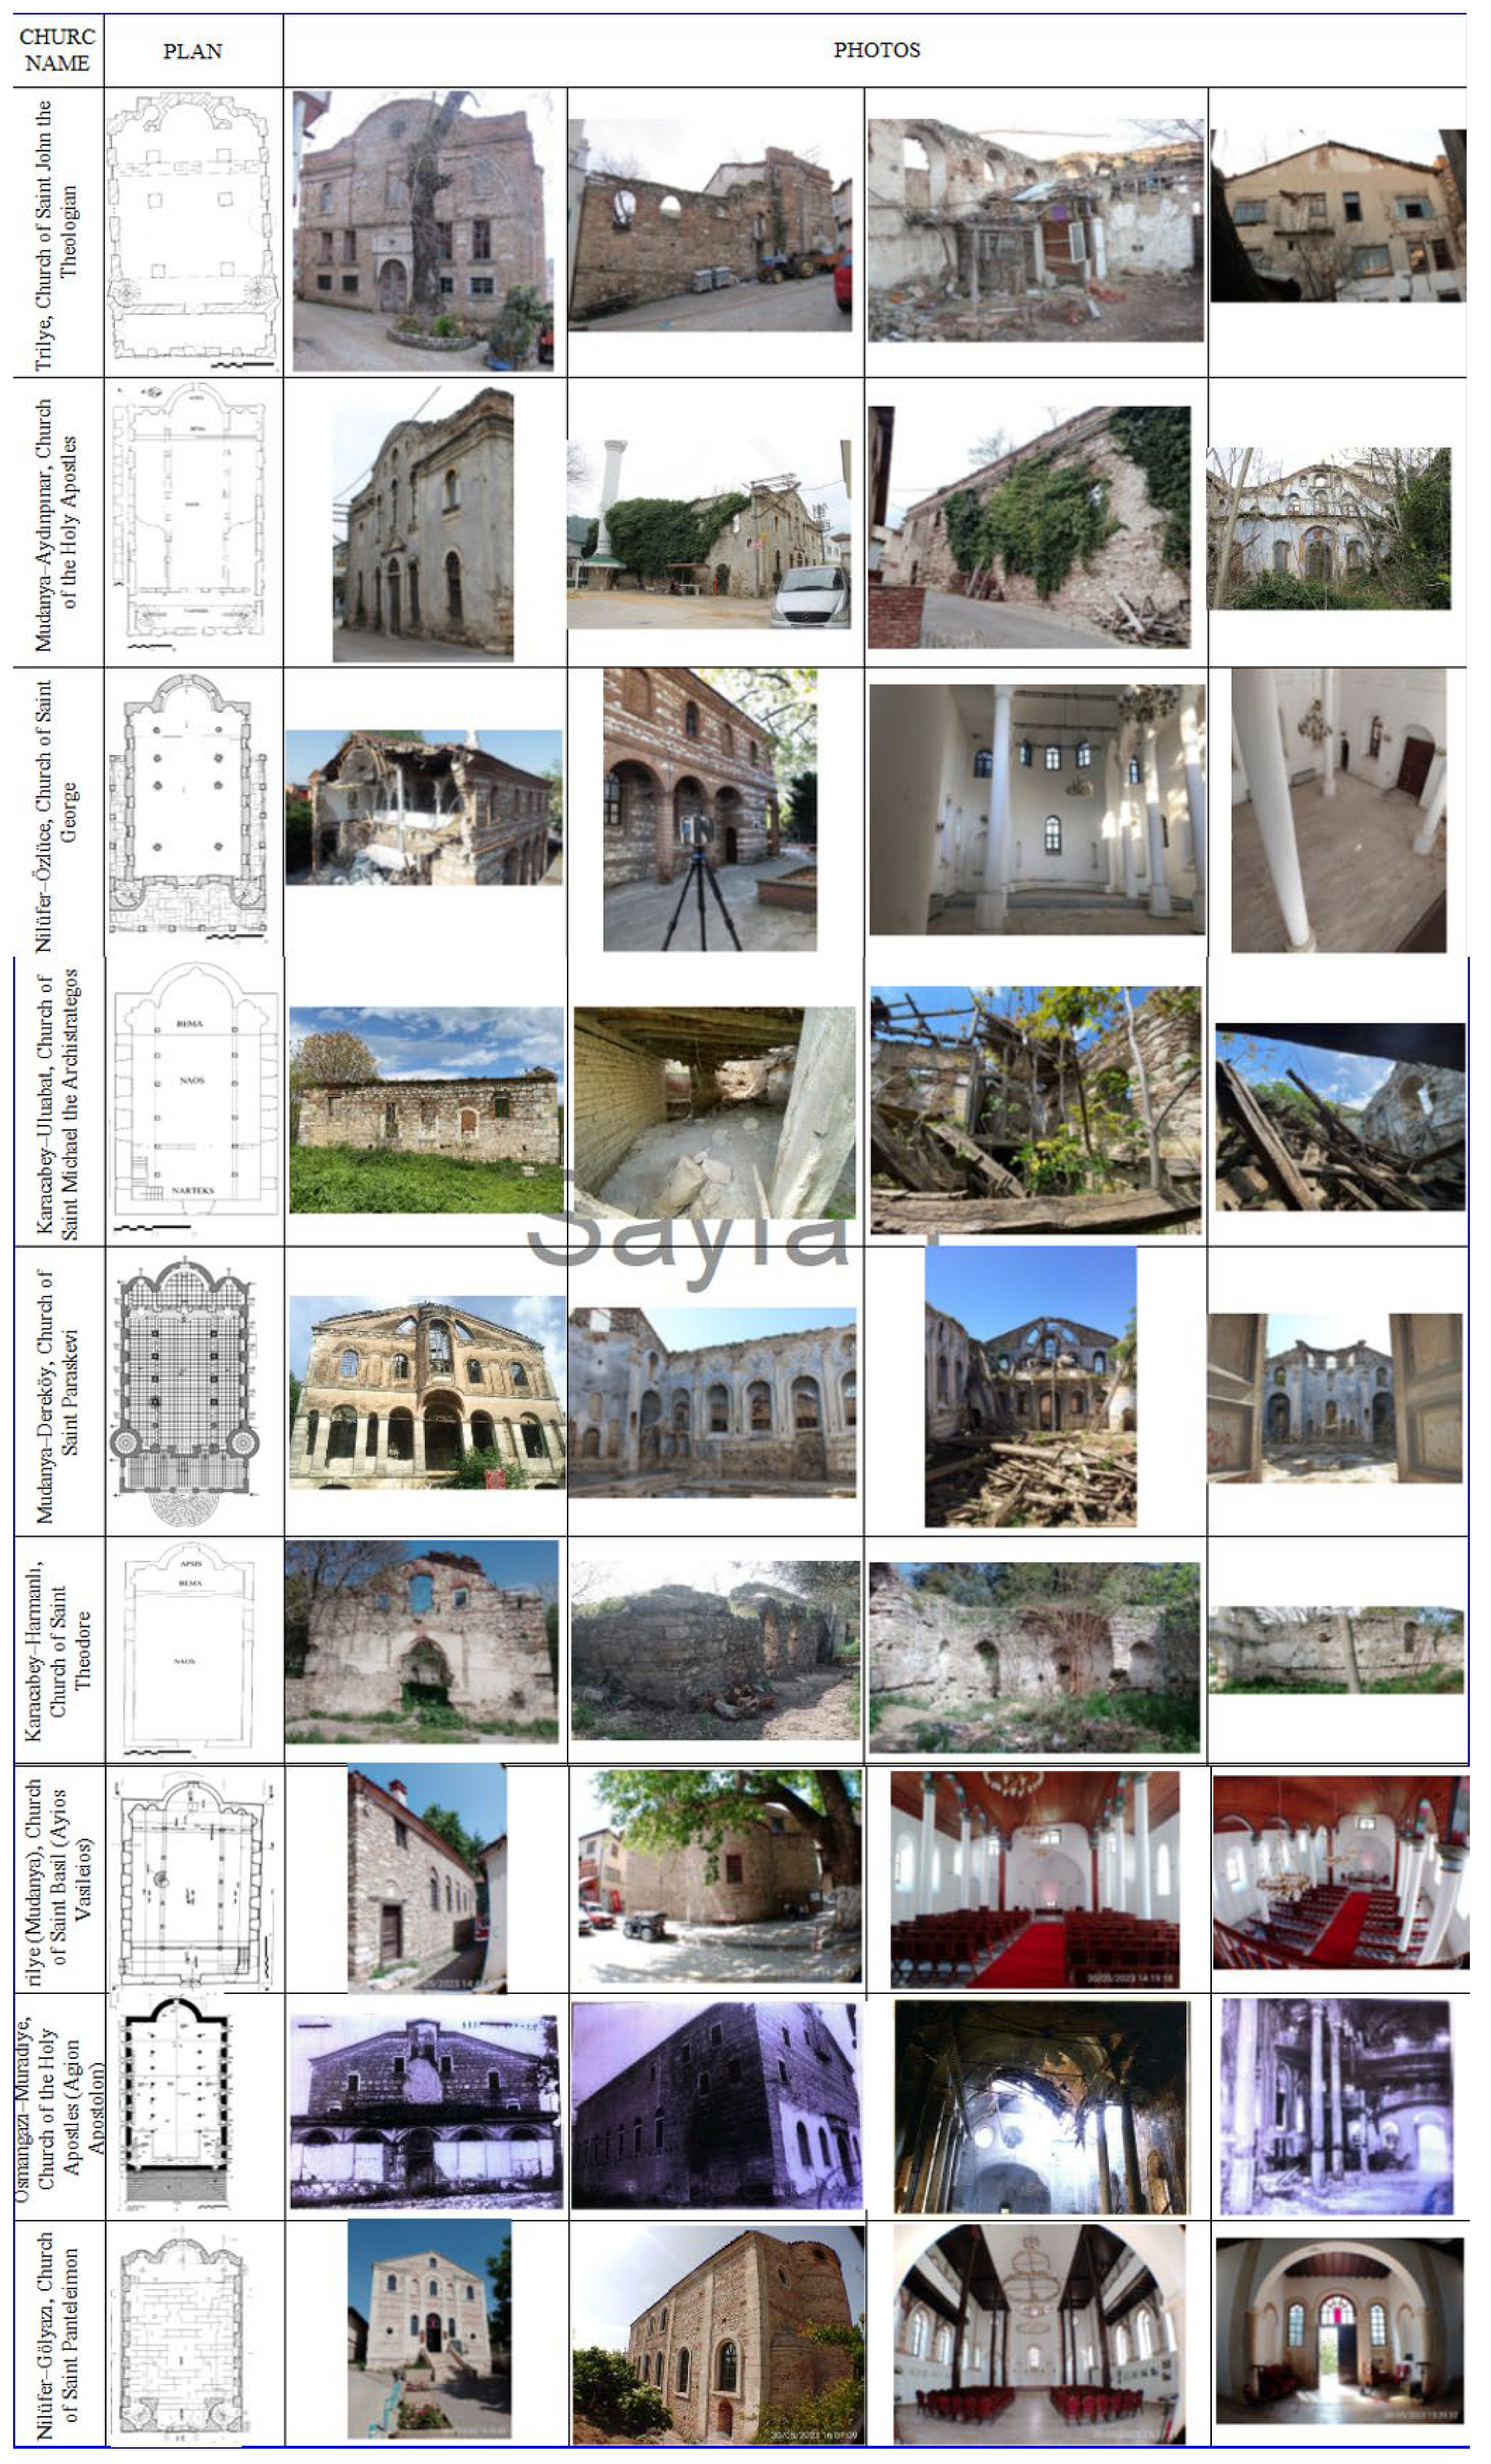
This subsection summarizes the typological, spatial, and material characteristics of nine nineteenth-century Greek Orthodox churches located in Bursa and its rural surroundings, based on architectural documentation and condition surveys.
A. H. Ioannes Theologos Church (Mudanya, Tirilye)
Originally a three-story Greek-cross church, the building survives in a severely ruined state. The naos, narthex, and apse have lost their original configuration; the ground floor has been converted into vaulted storage/animal rooms, and upper floors contain improvised partitions and domestic traces. Mixed masonry walls exhibit joint loss, partial collapses, and opening deformation; the roof is entirely missing. All floors, joinery, and interior finishes have disappeared. The building falls into the “ruinous” category with highly compromised typological legibility.
B. H. Apostoloi Church (Mudanya, Aydınpınar)
A late nineteenth-century three-aisled basilica, now surviving mainly as perimeter walls. Column rows separating the aisles partially remain, though the entire roof has vanished. The semi-circular apse retains its form, with evidence of mixed masonry and spolia. Remnants of the gallery’s timber consoles are visible. Later mosque-use led to window blocking and loss of liturgical elements. Due to roof loss, column damage, and extensive plaster deterioration, the building is in a ruinous condition.
C. Aya Yorgi Church (Nilüfer, Özlüce)
A late nineteenth-century basilica with three aisles, a narthex, and galleries. The nave system, carried by timber columns, and the Bağdadi vaulting define its original character. The semi-circular apse, gallery access routes, and interior spatial order remain legible. Stone–brick façades with arched openings survive with partial plaster loss and moisture staining. Despite deterioration, the church largely preserves its structural and typological integrity.
D. Michael Archestrategos Church (Karacabey, Uluabat)
Dated by an 1843 inscription, this single-nave church with a narthex is among the region’s earliest examples. The façades retain rubble–brick mixed masonry, arched window rows, and marble frames; the apse and main opening proportions remain readable. Interior traces of the narthex–naos division and gallery level survive. Complete roof loss, wall deformation, biological decay, and late additions mark advanced deterioration, though basic plan legibility persists.
E. Ayia Paraskevi Church (Mudanya, Dereköy)
A three-aisled basilica (1857) set on sloped terrain with a semi-circular apse, regular window rhythm, and a strong arcade separating the aisles. Capitals and bases of Corinthian-style columns survive, but the entire roof and upper elements are lost. Narthex components and gallery parapet traces are partially discernible. Wall bulging, cracks near arches, plaster loss, and biological growth are widespread. Despite heavy deterioration, the nave rhythm, apse form, and façade composition remain sufficiently intact to serve as a significant typological reference.
F. H. Theodoros Church (Karacabey, Harmanlı)
This 1833 three-aisled basilica exhibits typical rural Greek Orthodox features: rubble masonry walls, brick arches, and semi-circular window rows. Portions of the apse and western narthex survive, though all roofing is gone. Column traces indicate the original nave separation. Cracks, plaster loss, vegetation growth, and collapse effects are prominent. Nevertheless, apse proportions, window order, and structural rhythm support continued typological readability.
G. Ayios Vasileios Church (Mudanya, Tirilye)
A well-preserved basilica with three aisles, a gallery over the narthex, timber column–arch sequences, and sloped side-aisle ceilings contrasted with a vaulted central nave. Façades retain rubble–brick masonry and arched window compositions. Interior gallery access, posts, and openings remain visible; limited joinery interventions exist. Currently used for cultural activities, the church preserves its structural and typological integrity, representing a low–moderate vulnerability case within the STVSM framework.
H. Agion Apostolon Church (Kayabaşı, Osmangazi)
Located within dense urban fabric, the basilica retains four columns that define the nave rhythm. The apse geometry, brickwork traces, and stone lintels remain clear. Gallery level indicators—stair traces, arch springs—are intelligible. Although the roof has completely collapsed and the interior structure is heavily damaged, the basilica plan, apse orientation, and axial layout remain legible, providing valuable typological reference despite severe deterioration.
I. Saint Panteleimon Church (Nilüfer, Gölyazı)
An imposing 23×15 m three-aisled basilica distinguished by strong massing, projecting apse, double-stair narthex, and pronounced column–arch sequences. The gallery spans east–west with arched openings, complementing the window rhythm of the nave. Façades retain rubble–brick mixed masonry with localized plaster and brick deterioration. Apart from partial roof repairs and minor additions, the plan, structural scheme, and façade composition are well preserved. Ongoing cultural use supports its structural continuity, making it one of the strongest typological examples in the region (Figfure 3).
Figure 3.
Measured Drawings and Current Condition Photographs of Selected Nineteenth-Century Greek Orthodox Churches in Bursa and Its Rural Settlement.
Figure 3.
Measured Drawings and Current Condition Photographs of Selected Nineteenth-Century Greek Orthodox Churches in Bursa and Its Rural Settlement.
5. Fındıngs: STVSM Calculatıons Based on Expert Judgments
The STVSM model provides a multi-layered assessment framework that integrates structural risk, typological continuity, spatial integrity, and cultural value within a single computational system. Rather than prioritizing either collapse risk or architectural significance in isolation, the model produces a composite vulnerability measure that reflects the interaction of these domains.
Scores collected from eight experts formed the basis of the weighting structure. Their diverse backgrounds in conservation, structural behavior, material deterioration, typology, and field implementation prevented the model from being shaped by a single disciplinary bias. All indicators were first scored on a 1–9 importance scale, averaged to reduce outlier effects, and normalized within each major component (SV, TV, HV). Field-based deterioration levels were then assigned using a four-step 0–1 scale and multiplied by the corresponding weights to generate the sub-indices.
This section presents (1) the distribution of expert-derived weights, (2) the computational logic of the STVSM model, and (3) the final vulnerability and conservation-priority scores for 26 buildings across three regions. The results demonstrate that STVSM captures not only physical deterioration but also typological loss and cultural significance, offering a broader evaluative capacity than single-axis damage indices.
5.1. Statistical Analysis of Expert Judgments
Determining the weighting coefficients is the most critical phase of the model, as the STVSM scores depend directly on these values. The eight expert panels evaluated a total of 20 indicators across the SV, TV, and HV domains.
Individual scores were averaged to minimize extreme deviations and then normalized within each component to obtain relative importance weights. These normalized values form the micro-level weighting structure and constitute the indicator-specific multipliers used in later computations.
The table below presents the expert scores, averages, and normalized coefficients for each indicator.
5.2. Derivation of Normalized Final Weights
While normalized indicator-level weights define the micro structure of the model, the three major components (SV, TV, HV) each contribute differently to the overall vulnerability calculation. For this reason, macro-weights were calculated by comparing the aggregated mean scores of the three domains.
This two-tier weighting logic ensures that the model does not collapse into a purely structural or purely value-driven assessment. Instead, physical deterioration, typological integrity, and cultural–architectural significance are represented in a balanced and empirically derived ratio.
The aggregated scores provided by the experts yielded the following group totals:
- SV total: 49.88
- TV total: 40.13
- HV total: 47.13
The macro-weights of the three components were calculated using:
W_group = Group Total / (SV + TV + HV)
Accordingly:
- W(SV) = 49.88 / 137.14 = 0.364
- W(TV) = 40.13 / 137.14 = 0.293
- W(HV) = 47.13 / 137.14 = 0.344
Total sum: 49.88 + 40.13 + 47.13 = 137.14.
This distribution shows that STVSM assigns nearly equal importance to
- structural vulnerability (36.4%),
- typological/spatial degradation (29.3%), and
- cultural/architectural value (34.4%).
Such a balance prevents the model from collapsing into a purely physical-damage index or a purely value-driven assessment, ensuring a decision mechanism that integrates both dimensions.
The table below presents the final normalized weights, obtained by multiplying the macro-weights (W_group) with the micro-level indicator weights (wᵢ). These final coefficients constitute the complete weighting structure used for the STVSM scoring process (Table 2).
5.2.1. Structural Vulnerability Indicators (SV)
This group covers deterioration types that directly affect the load-bearing performance and constitutes the most technically weighted component of STVSM. Expert ratings clearly show that crack density, wall discontinuities, material loss and deformation of structural elements are the most decisive factors influencing vulnerability. Scores collected for the eight indicators were averaged and then normalized against the total SV score. This procedure clarifies which aspects of structural risk dominate within the model and ensures that the SV component derives its weighting structure from empirically grounded distributions.
(For detailed averages and normalized coefficients, see Table 2, SV rows.)
5.2.2. Typological and Spatial Degradation Indicators (TV)
TV indicators assess the extent to which a building maintains its original spatial organization, typological coherence and façade rhythm. Because this group evaluates architectural identity beyond physical damage, it represents the cultural and morphological dimension of the STVSM framework. Expert assessments reveal three clear tendencies:
A. Spatial integrity and volumetric continuity (TV1–TV2) are the strongest determinants of typological degradation.
B. Loss of opening rhythm (TV3) emerges as a rapid catalyst of typological deformation, especially in buildings that have undergone functional change.
C. Roof-form alterations and the loss of characteristic typological elements (TV5–TV6) are the most influential drivers of character erosion in both houses and churches.
All indicator averages were computed and normalized using the total TV score of 40.13, allowing the model to parameterize the contribution of typological degradation through micro-level weights (Table 2)
5.2.3. Value Indicators (HV)
HV represents the epistemic departure point of STVSM from damage-oriented vulnerability indices. This group measures a building’s historical, aesthetic and architectural value, its contextual integration, and its degree of authenticity and integrity. It therefore accounts not only for physical degradation but also for the preservation of cultural identity.
Expert evaluations highlight three dominant tendencies:
- Historical, aesthetic and architectural design value (HV1–HV3) received consistently high scores, confirming the decisive role of cultural significance in perceived vulnerability.
- Contextual value (HV4) emerged as a critical factor, especially for structures embedded within historic settlement fabrics.
- Authenticity/integrity (HV5) and rarity/representativeness (HV6) were regarded as key indicators for determining whether the architectural identity of a building has been preserved.
Averages for the six indicators were calculated and normalized using the HV total of 47.13, defining the multiplier effect of cultural and architectural value within the STVSM scoring system. (For indicator averages and normalized coefficients, see Table 2, HV rows.)
5.3. Final Formula of the STVSM Model (Refined Version)
The micro-weights derived from expert evaluations were combined with the macro-weights of the SV–TV–HV groups to generate a unified weighting structure. For each indicator, the final weight wi,final is defined as the product of its normalized micro-weight and the macro-weight of its parent group. This establishes a formulation that integrates both expert-driven sensitivity and the relative influence of the structural (SV), typological (TV), and heritage-value (HV) components within the overall fragility score.
For each building, field observations yielded a normalized deterioration value between 0 and 1 for every indicator. These values represent standardized readings of cracking severity, typological discontinuity, loss of authenticity, material decay, or erosion of cultural value. Here:
- vi,j denotes the observed deterioration level of indicator i for building j.
- wi,final denotes the final STVSM weight assigned to indicator i.
The contribution of each indicator to the fragility score of building j is obtained by multiplying its deterioration level by its final weight. The total STVSM score is calculated by summing all weighted indicator contributions:
STVSMj = Σ (wi,final × vi,j)
All final indicator weights used in the STVSM model (wᵢ,final) were derived by combining the macro- and micro-weighting structures. The complete set of final coefficients is presented below.

Table 3.
Final Indicator Weights (wi,final) Derived from the Integration of Macro and Micro Components in the STVSM Model.
Table 3.
Final Indicator Weights (wi,final) Derived from the Integration of Macro and Micro Components in the STVSM Model.
| Main Group | Group Weight (W_group) | Indicator | Normalized Indicator Weight (Wi) | Final Weight (W_group × Wi) |
| SV | 0,364 | SV1 | 0,16 | 0,0582 |
| SV2 | 0,17 | 0,0619 | ||
| SV3 | 0,16 | 0,0582 | ||
| SV4 | 0,145 | 0,0528 | ||
| SV5 | 0,08 | 0,0291 | ||
| SV6 | 0,085 | 0,0309 | ||
| SV7 | 0,075 | 0,0273 | ||
| SV8 | 0,123 | 0,0448 | ||
| TV | 0,293 | TV1 | 0,184 | 0,0539 |
| TV2 | 0,202 | 0,0592 | ||
| TV3 | 0,15 | 0,044 | ||
| TV4 | 0,131 | 0,0384 | ||
| TV5 | 0,165 | 0,0483 | ||
| TV6 | 0,168 | 0,0492 | ||
| HV | 0,344 | HV1 | 0,167 | 0,0574 |
| HV2 | 0,175 | 0,0602 | ||
| HV3 | 0,167 | 0,0574 | ||
| HV4 | 0,156 | 0,0537 | ||
| HV5 | 0,164 | 0,0564 | ||
| HV6 | 0,17 | 0,0585 |
The model consists of three sub-indices:
SV (Structural Vulnerability Index)
SV_j = Σ (w_i × v_i,j)
TV (Typological/Spatial Vulnerability Index)
TV_j = Σ (w_i × v_i,j)
HV (Heritage Value Index)
HV_j = Σ (w_i × v_i,j)
While the SV and TV components directly reflect structural and typological degradation, the HV component functions as a value amplifier, increasing the final priority score for culturally significant buildings. This distinction aligns with models that emphasize the multiplier effect of heritage value on risk and prioritization (Revez et al., 2022; Pereira et al., 2019).
1) Degradation Index (B) – Physical Vulnerability Level
The SV and TV scores are combined to calculate the physical–degradation level of each building:
B_j = (SV_j + TV_j) / 2
The B value ranges between 0 and 1, representing the degree of typological and structural integrity loss.
2) Cultural Value Multiplier (M)
The HV score increases the final index through a direct multiplier effect:
M_j = 1 + HV_j
A high HV score raises the priority of a building even if physical degradation is moderate; conversely, low-value buildings do not dominate the final vulnerability assessment.
3) Final Conservation Priority Index – CPI (STVSM Final Score)
In the revised model, the integrated vulnerability and priority score for each building is calculated as follows:
CPI_j = B_j × M_j
The CPI value ranges between 0 and 2.
Interpretation Ranges
- 0 – 0.50; Low priority
- 0.50 – 1.00; Medium priority
- 1.00 – 1.50; High priority
- 1.50 – 2.00; Critical priority
These intervals provide an integrated conservation decision–support output by combining structural, typological, and heritage-value indicators within a single analytical framework.
Minor Degradation: 0.25;
Moderate Degradation: 0.50;
Severe Degradation: 0.75;
Critical Failure / Near-Collapse: 1.00
(D’Ayala & Fodde 2008; Lagomarsino & Giovinazzi 2006; FEMA 2012; EMS-98).
These values together generate an integrated conservation decision–support output by combining structural, typological, and heritage-value indicators within a single analytical framework. Minor Degradation: 0.25; Moderate Degradation: 0.50; Severe Degradation: 0.75; Critical Failure / Near-Collapse: 1.00 (D’Ayala & Fodde 2008; Lagomarsino & Giovinazzi 2006; FEMA 2012; EMS-98). Each degradation indicator is assigned a severity level (Severityᵢ) based on field observations, which is then multiplied by the final weight coefficient (wᵢ) derived from the STVSM model. The resulting term, Weighted Score (Severityᵢ × wᵢ), expresses the proportional contribution of each indicator to the composite vulnerability score of the building.
5.4. STVSM Scores of the Buildings and Comparative Analysis
Using the final indicator weights defined in the STVSM model, structural vulnerability (SV), typological/spatial degradation (TV), and value-based vulnerability (HV) sub-indices were calculated for twenty-five buildings selected from the three study areas. Field-based degradation indicators were normalized between 0 and 1, then multiplied by the expert-derived weights defined in Section 3 to generate the weighted values for each indicator. This procedure makes both the intra-group influence of each indicator and its contribution to the overall model quantitatively explicit.
In the first stage, SV sub-indices were produced for eight Cumalıkızık houses, eight Balıkesir urban houses, and nine Greek Orthodox churches. These indices represent a weighted aggregation of structural degradation indicators such as wall discontinuities, crack density, opening-to-wall ratios, material loss, roof–floor integrity, and overall deformation.
In the second stage, the TV and HV sub-indices were computed using the typological and value indicators defined in Section 3. This step incorporates plan deformation, massing discontinuity, façade-rhythm disturbances, degrees of authenticity/integrity, and cultural–historical representativeness into the model.
Finally, the three sub-indices were combined to obtain a unified STVSM score for each building. To illustrate how this composite structure varies across the three building groups, a radar diagram comparing the mean SV, TV, and HV values was generated (Figure 4).
The detailed calculation matrices for Cumalıkızık houses, Balıkesir houses and Greek Orthodox churches are presented in Table 4, Table 5 and Table 6, respectively. These tables display all intermediate computations based on the product of each indicator’s weight coefficient and its normalized degradation level, thereby making the derivation of the sub-index values fully transparent.
On the basis of the summary values derived from these matrices, STVSM scores were calculated in the 0–1 range and rounded to two decimal places for ease of interpretation. A higher STVSM score indicates greater vulnerability and a more urgent need for intervention across structural, typological and value components, whereas a lower score reflects a more balanced relationship between degradation level and architectural/historical value. To illustrate how this vulnerability distribution differs across the three building groups, a scatter plot was prepared that compares the SV–TV relationship and the relative influence of the HV component (Figure 5).
A comparative reading reveals distinct patterns across the three study areas. In the Greek Orthodox churches, the loss of roofing systems, collapse at upper wall levels, and fragmentation of interior spatial continuity result in consistently high SV and TV components. At the same time, their substantial architectural, historical and symbolic value significantly elevates the HV component, thereby increasing overall conservation priority.
In the Cumalıkızık and Balıkesir vernacular architecture samples, late-period alterations, added floors and façade-disrupting interventions intensify typological degradation; however, in several cases, partial preservation of the original structural system and material character moderates the total vulnerability score.
These findings demonstrate that the STVSM model does more than measure structural risk: it renders visible the combined effects of typological discontinuity, spatial fragmentation, and the loss of cultural/historical value on conservation prioritization. This makes comparative evaluation across different building groups and geographic contexts possible, grounding conservation decisions in more objective parameters.
The following summary table presents the SV–TV–HV sub-indexes and composite STVSM scores for the three building groups (Table 7). To more clearly illustrate the vulnerability patterns produced by these sub-indexes, a heatmap comparing the relative intensity of the SV–TV–HV components was generated (Figure 6).
This heatmap visually highlights which vulnerability components dominate within each group, demonstrating how the STVSM model captures structural, typological and heritage-value patterns that guide conservation prioritization.
5.5. Priority Ranking of the Buildings and Discussion
The STVSM scores presented in Table 4, Table 5 and Table 6 generate a comparative conservation-priority profile for the twenty-five buildings examined across the three study areas. Because the model integrates structural decline (SV), typological/morphological degradation (TV), and heritage-value loss (HV), it captures both physical deterioration and architectural–cultural erosion within a single analytical structure. The weighting system, derived from expert judgments, allows qualitative parameters such as plan-typology distortion, loss of spatial hierarchy, façade-rhythm deformation, and diminished material authenticity to be expressed numerically. In this sense, STVSM offers a holistic vulnerability metric rather than a single-axis damage index.
Rural Orthodox Churches: High SV + High TV + High HV; Critical Priority
Among all building groups, the Orthodox churches consistently yield the highest vulnerability scores. Three factors drive this outcome:
- Structural integrity loss (SV): Collapse of the roof, degradation of upper wall sections, and deformation of arches substantially increase structural vulnerability.
- Typological deformation (TV): Liturgical spatial sequences, iconostasis traces, floor-level organization, and façade composition are heavily disrupted.
- High cultural–historical value (HV): As key representatives of regional Christian heritage and late Ottoman rural architecture, these buildings receive high value multipliers.
Consequently, near-ruinous conditions do not merely elevate SV; the high HV component further amplifies the final STVSM score. This group clearly forms the top-priority intervention category.
Cumalıkızık Houses: Low SV + High TV + Medium–High HV
In the Cumalıkızık houses, structural deterioration is generally limited; however, typological degradation is pronounced. The primary drivers are:
- late-period vertical extensions,
- PVC window replacements,
- external metal staircases,
- fragmentation of the sofa layout,
- alterations obscuring the timber-frame logic.
These interventions degrade typological continuity, pushing TV values upward. HV scores remain moderate to high due to the site’s UNESCO context and the integrity of the broader settlement. The resulting priority level suggests that interventions should focus on typological rehabilitation rather than structural rescue.
Balıkesir City-Center Houses: Medium SV + High TV + Medium HV
The Balıkesir examples display more variable structural conditions but consistently high typological degradation. Key causes include:
- pressures of commercial adaptation,
- loss of internal circulation logic,
- façade fragmentation,
- erasure of original plan schemas,
- incompatible extensions.
Thus, TV again becomes the dominant component, while HV remains moderate.
Synthesis: The Vulnerability Logic of the Three Groups
- Rural churches:
Very high SV + high TV + high HV = critical conservation priority
- B.
- Cumalıkızık houses:
Low SV + high TV + medium/high HV = medium–high priority
- C.
- Balıkesir houses:
Medium SV + high TV + medium HV = medium priority
This three-tier pattern demonstrates that STVSM captures not only physical deterioration but also architectural identity erosion, spatial discontinuity, and representational value loss. The model thus enables measurable, consistent, and defensible priority ranking across diverse building types and contexts.
Integrated Interpretation of STVSM Scores
Each building group displays a distinct vulnerability logic:
- Rural churches; multi-dimensional vulnerability amplified by high value multipliers
- Cumalıkızık houses; typology-centered degradation
- Balıkesir houses; intervention-driven and spatially induced degradation
Altogether, STVSM demonstrates its capacity to move beyond engineering-based risk models by incorporating architectural continuity, aesthetic integrity, and cultural representativeness into conservation decision-making.
6. Dıscussıon
This study set out to develop a shared vulnerability metric for civil and religious buildings by subjecting twenty-five structures with markedly different conservation problems and typological characteristics to a comparative analytical process. The Structural–Typological–Value Scoring Model (STVSM) constitutes a methodological contribution in that it integrates parameters that are usually examined separately in the literature, including structural damage, typological continuity, spatial organization, façade identity, material authenticity, and contextual/representational value, within a single computational matrix.
The model’s most critical contribution lies in the analytical calibration of its three component groups through expert weighting. Expert evaluations revealed a clear pattern: indicators related to typological integrity and spatial organization consistently received high importance coefficients. This is empirically reflected in the Cumalıkızık and Balıkesir houses, where the TV component emerges as the primary driver of the total STVSM score. Conversely, the rural Greek Orthodox churches exhibit a dual vulnerability pattern shaped by severe physical deterioration (SV) alongside high historical and symbolic value (HV). The overlap of these two dimensions confirms that vulnerability cannot be understood solely through quantitative damage metrics; it must also account for losses in architectural meaning, spatial identity, and cultural representation.
The comparative analysis highlights three distinct vulnerability logics across the building groups. In the churches, concurrent increases in SV and TV produce an unequivocal need for urgent intervention. In the Cumalıkızık and Balıkesir houses, however, vulnerability is primarily shaped by typological and spatial fragmentation rather than structural instability. These findings underscore the inadequacy of conservation policies that rely exclusively on structural-risk assessments. Instead, they point to the necessity of a holistic methodology capable of simultaneously integrating value, typology, and structural behaviour.
The model’s outputs also delineate differentiated intervention strategies. In the Cumalıkızık houses, priority actions include the removal of late-period additions, the restoration of the sofa layout, and targeted repairs to the timber-frame system. In Balıkesir, where typological erosion is more strongly driven by commercial adaptation, inappropriate extensions, and façade deformation, intervention must focus on reversing or mitigating transformation-related damages. For the rural churches, an integrated approach is required, simultaneously addressing structural stabilization and the safeguarding of cultural and representational significance.
In summary, STVSM provides a practical decision-support framework both at the scale of individual buildings and for broader regional conservation planning. Its flexible structure, capable of being fed by field-based evidence and expert judgment, enables rescaling across different geographies and building types. Its compatibility with multi-criteria decision-making techniques positions the model as a strong methodological basis for developing risk maps, establishing intervention priorities, and designing long-term monitoring strategies.
7. Conclusıons
The STVSM model offers an integrated assessment framework that renders the multi-dimensional nature of deterioration in historic buildings measurable. By combining structural vulnerability (SV), typological integrity (TV), and cultural/architectural value (HV) within a single matrix, the model unifies risk and value parameters that are commonly addressed in a fragmented manner in existing literature. This approach reduces the dominance of single indicators and renders the interaction between different types of deterioration visible, thereby placing conservation prioritization on a more objective and comparable foundation.
The findings demonstrate that rural Greek Orthodox churches require urgent intervention due to the combined effect of high SV and TV values, whereas in the Cumalıkızık and Balıkesir cases, vulnerability is primarily driven by typological and spatial discontinuity. This confirms that conservation strategies must give equal weight not only to physical damage but also to plan-typology continuity, spatial organization, and cultural representation.
At the same time, the model’s limitations signal opportunities for future refinement. Integrating quantitative deterioration data such as laser scanning, material testing, and deformation measurements; expanding the expert pool to recalibrate weight coefficients for different cultural contexts; and linking the model to GIS-based risk mapping would enhance accuracy and scalability.
Overall, STVSM provides a multi-layered, transparent, and reproducible methodological contribution to both theoretical and applied conservation practice. Its ability to compare different building types within a common evaluative language demonstrates its potential as a powerful tool for decision-makers and as a robust analytical framework for academic research.
References
- Begić, H., & Krstić, H. (2024). Condition assessment models for heritage masonry structures: An integrated indicator-based approach. Forthcoming / In press.
- Benedetti, D., & Petrini, V. (1984). On the seismic vulnerability of masonry buildings: Proposal of an evaluation procedure. L’Industria delle Costruzioni, 18(1), 66–74.
- Binan, D. U. (2013). Türkiye’de çok katmanlı yerleşimlerde tanımlama-koruma yaklaşımı ve öneriler: Bergama örneği. Tasarım+Kuram, 9(16), 1–26.
- Binan, D. U., & Binan, C. S. (2005). An approach for defining, assessment and documentation of cultural heritage in multi-layered cities: The case of Bergama (Pergamon), Turkey. Proceedings of the International Conference on Urban Heritage.
- Boukri, M., & Bensaïbi, M. (2008). Contribution to the evaluation of the vulnerability of old masonry houses in Algeria. Journal of Materials and Engineering Structures, 15, 47–56.
- Caniggia, G., & Maffei, G. L. (2001). Architectural composition and building typology: Interpreting basic building. Alinea Editrice.
- Cavallo, R., Komossa, S., Marzot, N., Berghauser Pont, M., & Kuijper, J. (Eds.). (2017). Back to the sense of the city: A matter of densities. TU Delft Open.
- Conzen, M. R. G. (1960). Alnwick, Northumberland: A study in town-plan analysis. Institute of British Geographers. [CrossRef]
- Caglar, N., Vural, I., Kirtel, O., Saribiyik, A., & Sumer, Y. (2023). Structural damages observed in buildings after the January 24, 2020 Elazığ-Sivrice earthquake in Türkiye. Case Studies in Construction Materials, 18, e01886. [CrossRef]
- D’Ayala, D., & Fodde, E. (2008). Structural vulnerability of historic buildings in seismic areas: A methodological approach. Journal of Architectural Conservation, 14(2), 63–82. [CrossRef]
- EMS-98. (1998). European Macroseismic Scale 1998. Cahiers du Centre Européen de Géodynamique et de Séismologie, 15.
- FEMA. (2012). Rapid visual screening of buildings for potential seismic hazards: A handbook (FEMA P-154). Federal Emergency Management Agency.
- Foster, G., Bruneau, M., & Williams, T. (2013). Indicator-based resilience assessment for the built environment. Earthquake Spectra, 29(3), 1161–1182.
- Graham, B., Ashworth, G. J., & Tunbridge, J. E. (2000). A geography of heritage: Power, culture and economy. Arnold.
- Huang, X., Mat Sulaiman, S., & Harun, S. N. (2025). A multi-criteria decision-making model for cultural heritage conservation prioritization. Forthcoming / In press.
- ICOMOS. (1994). The Nara Document on Authenticity. International Council on Monuments and Sites.
- Illescas, J., Núñez, M., & Moreno, S. (2020). Standardized damage classification to improve expert agreement in post-earthquake assessments. International Journal of Disaster Risk Reduction, 50, 101713. [CrossRef]
- Jato-Espino, D., Castillo-Lopez, E., Rodriguez-Hernandez, J., & Canteras-Jordana, J. C. (2014). A review of application of multi-criteria decision making methods in construction. Automation in Construction, 45, 151–162. [CrossRef]
- Kösem, B. (2025). Multi-criteria evaluation of heritage conservation risks in historic settlements. Forthcoming / In press.
- Kropf, K. (2014). The handbook of urban morphology. Wiley-Blackwell.
- Lagomarsino, S., & Giovinazzi, S. (2006). Macroseismic and mechanical models for the vulnerability assessment of masonry buildings. In Proceedings of the First European Conference on Earthquake Engineering and Seismology (ECEES). Geneva.
- Lourenço, P. B., & Mendes, N. (2012). Seismic assessment of masonry buildings: Review and applications. In P. B. Lourenço & N. Mendes (Eds.), Building pathology, durability and service life (pp. 17–30). CRC Press.
- Naziri, D. (2022). A multi-criteria approach for evaluating vulnerability and conservation needs of historic buildings. Heritage Science, 10(1), 1–16. [CrossRef]
- Opricovic, S., & Tzeng, G.-H. (2004). Compromise solution by MCDM methods: A comparative analysis of VIKOR and TOPSIS. European Journal of Operational Research, 156(2), 445–455. [CrossRef]
- Paç, D. G. A., & Binan, D. U. (2019). Geleneksel konut dokusunun korunmasına yönelik yaklaşım önerisi. Mimarlık ve Yaşam, 4(2), 283–308.
- Pereira, R., Silva, R., & Pereira, C. (2019). Typo-morphological approaches in heritage studies. Urban Morphology, 23(1), 37–52.
- Ramalhinho, H., & Macedo, M. (2019). Expert-based parameter weighting in heritage vulnerability assessment models. Forthcoming / In press.
- Ravan, S., Rezaei, M., & Khalilzadeh, V. (2023). Multi-hazard vulnerability assessment of historic urban fabric. International Journal of Architectural Heritage, 17(4), 512–532.
- Revez, M. J., Mateus, J., & Pereira, A. (2022). Heritage values and conservation decision-making. Heritage Science, 10, 95.
- Rodrigues, H., Varum, H., & Costa, A. (2019). A framework for condition assessment of vernacular masonry buildings. Journal of Building Engineering, 26, 100886.
- Ruiz-Jaramillo, J., González, M., & Romero, F. (2020). Integrated assessment models for heritage risk and conservation planning. Sustainability, 12(17), 6874.
- Saaty, T. L. (1987). The analytic hierarchy process—What it is and how it is used. Mathematical Modelling, 9(3–5), 161–176.
- Saaty, T. L. (2008). Decision making with the analytic hierarchy process. International Journal of Services Sciences, 1(1), 83–98.
- Scacco, J., Ghiassi, B., Milani, G., & Lourenço, P. B. (2020). Rapid nonlinear modelling of masonry walls subjected to out-of-plane loading. Engineering Structures, 211, 110488.
- Smith, L. (2006). Uses of heritage. Routledge.
- UNESCO. (1972). Convention concerning the protection of the world cultural and natural heritage. UNESCO.
- Waller, R. (2003). Cultural property risk analysis model. Göteborg Studies in Conservation, 13.
- Zuraidi, M. S., Ibrahim, A., & Rahman, N. A. (2018). Condition assessment and deterioration mapping of traditional timber heritage buildings. Journal of Building Pathology and Rehabilitation, 3(1), 1–12.
Figure 1.
Measured Drawings and Current Condition Photographs of Selected Houses in the Cumalıkızık Study Area.
Figure 1.
Measured Drawings and Current Condition Photographs of Selected Houses in the Cumalıkızık Study Area.
Figure 2.
Measured Drawings and Current Condition Photographs of Selected Houses in the Karesi District of Balıkesir.
Figure 2.
Measured Drawings and Current Condition Photographs of Selected Houses in the Karesi District of Balıkesir.
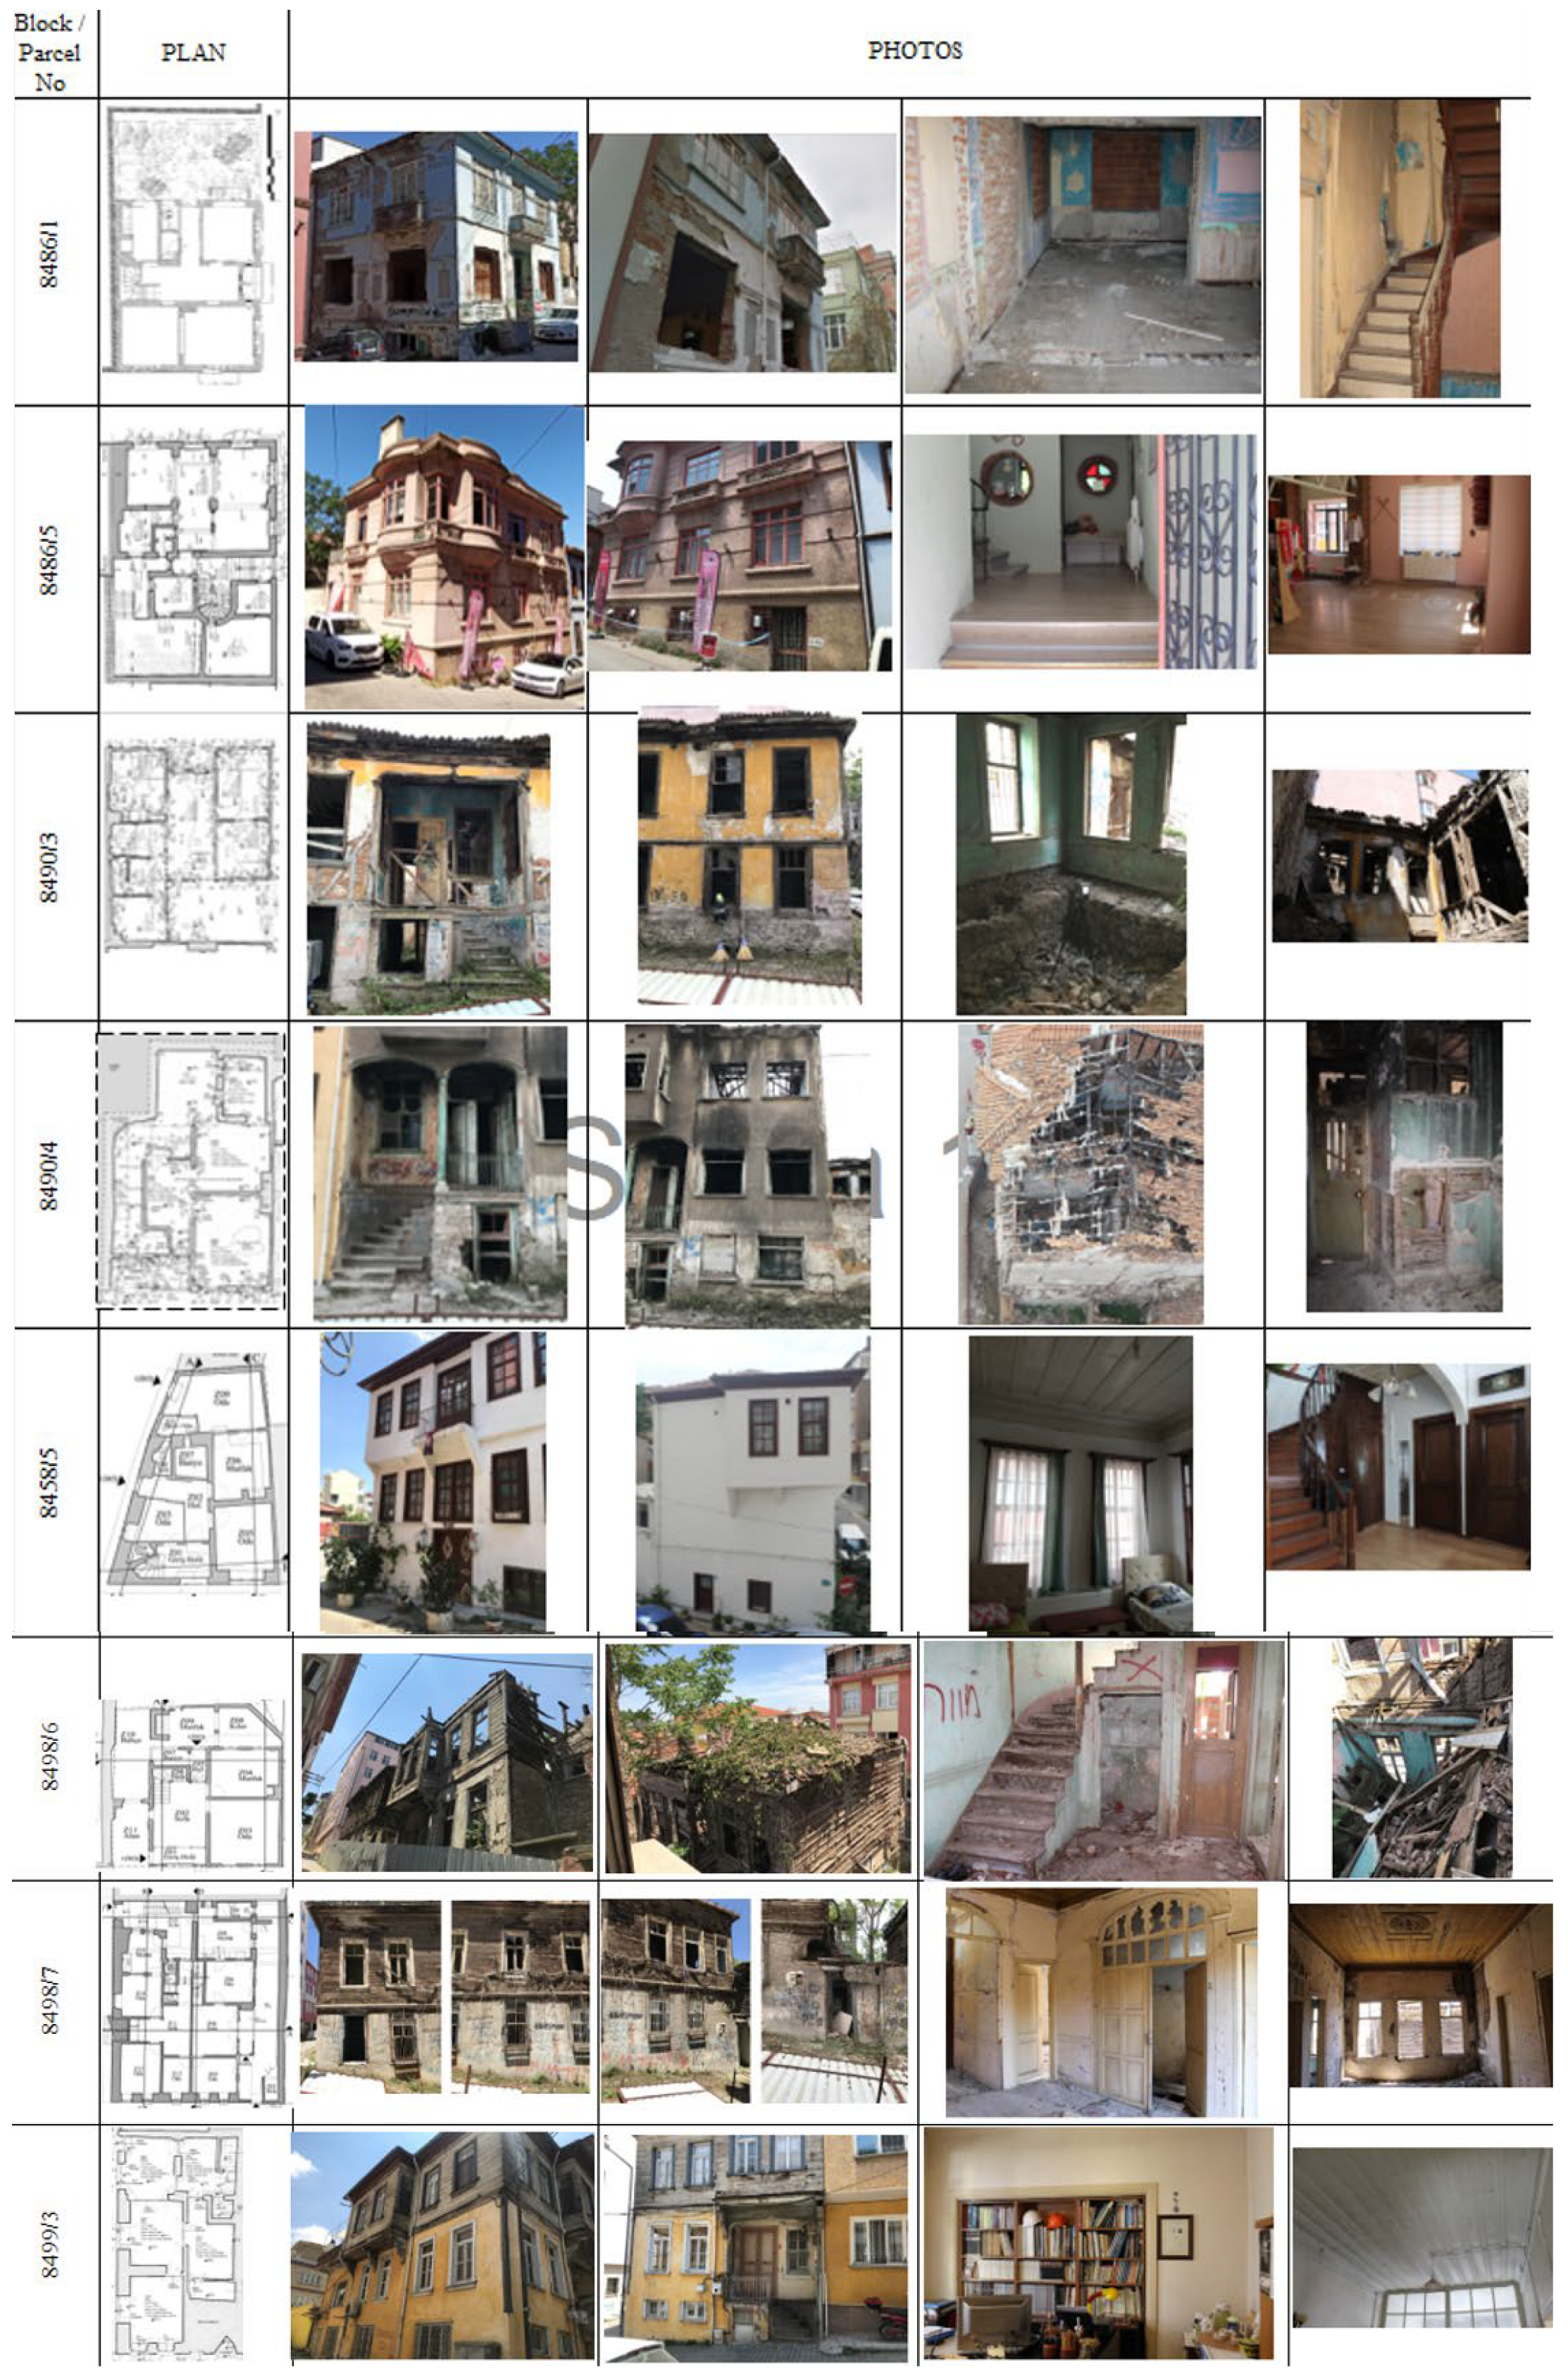
Figure 4.
Mean SV–TV–HV Sub-index Profiles by Building Group (Radar Diagram).
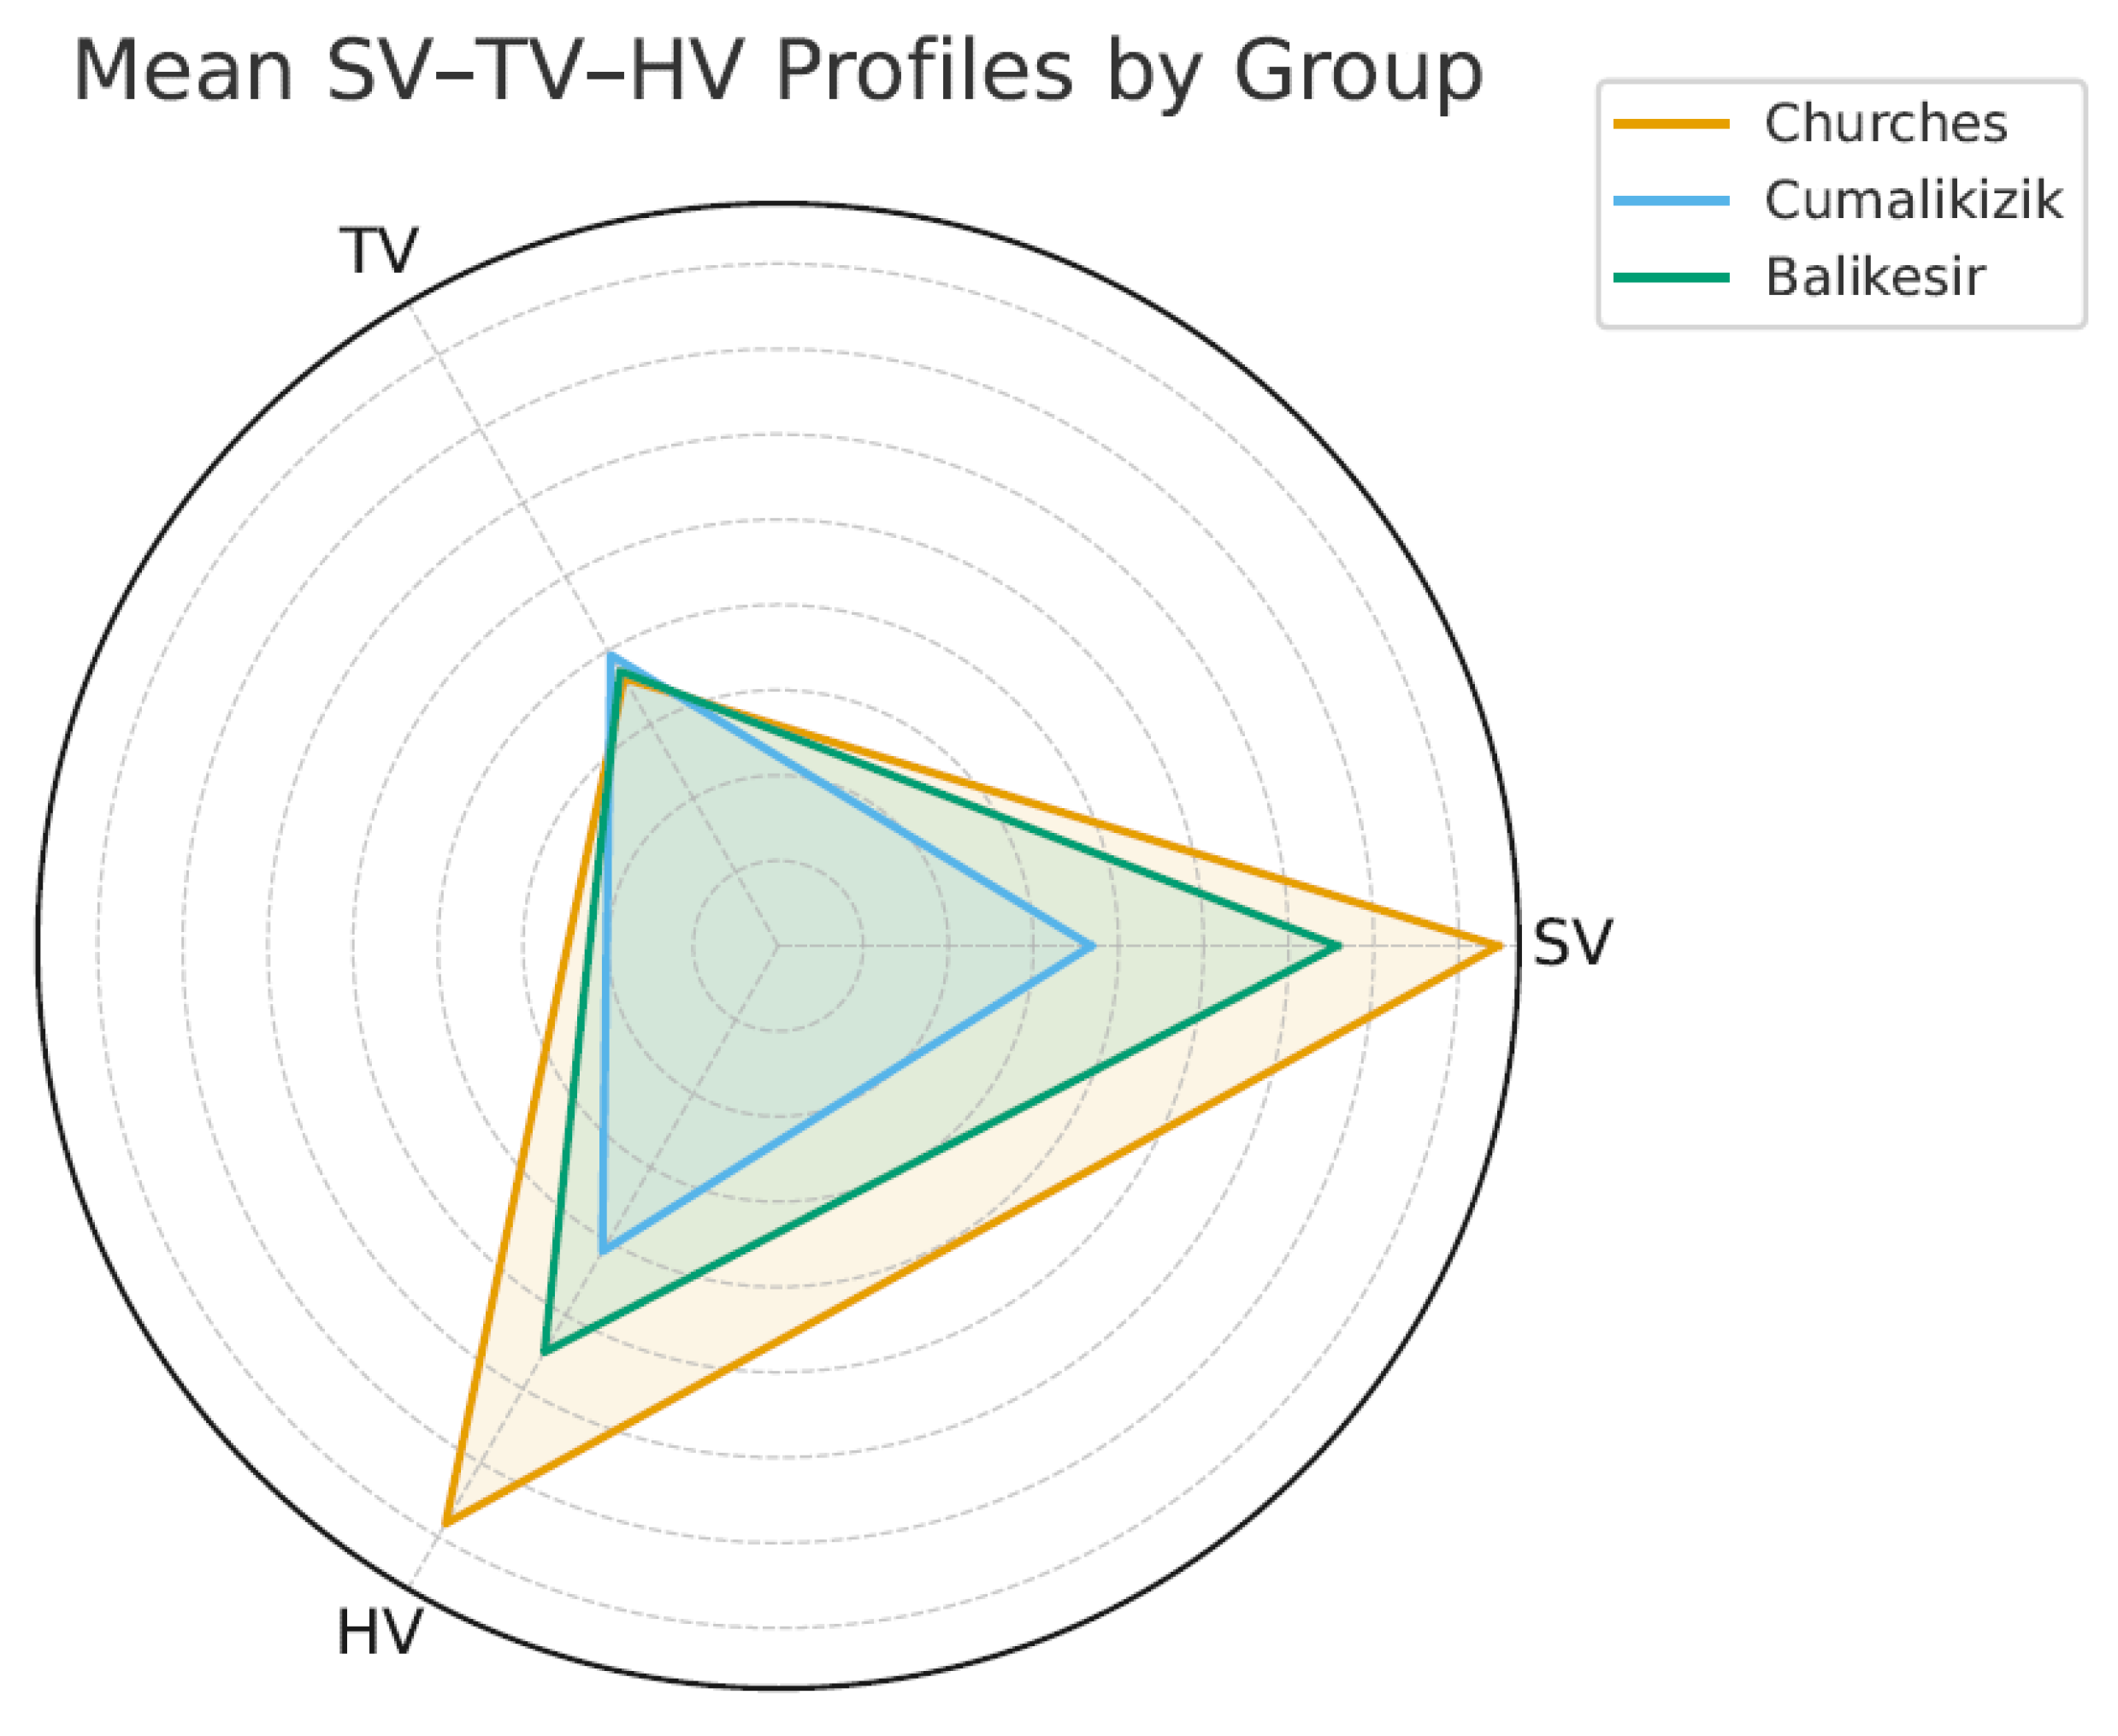
Figure 5.
SV–TV Distribution by Building Group and the Relative Influence of the HV Component.
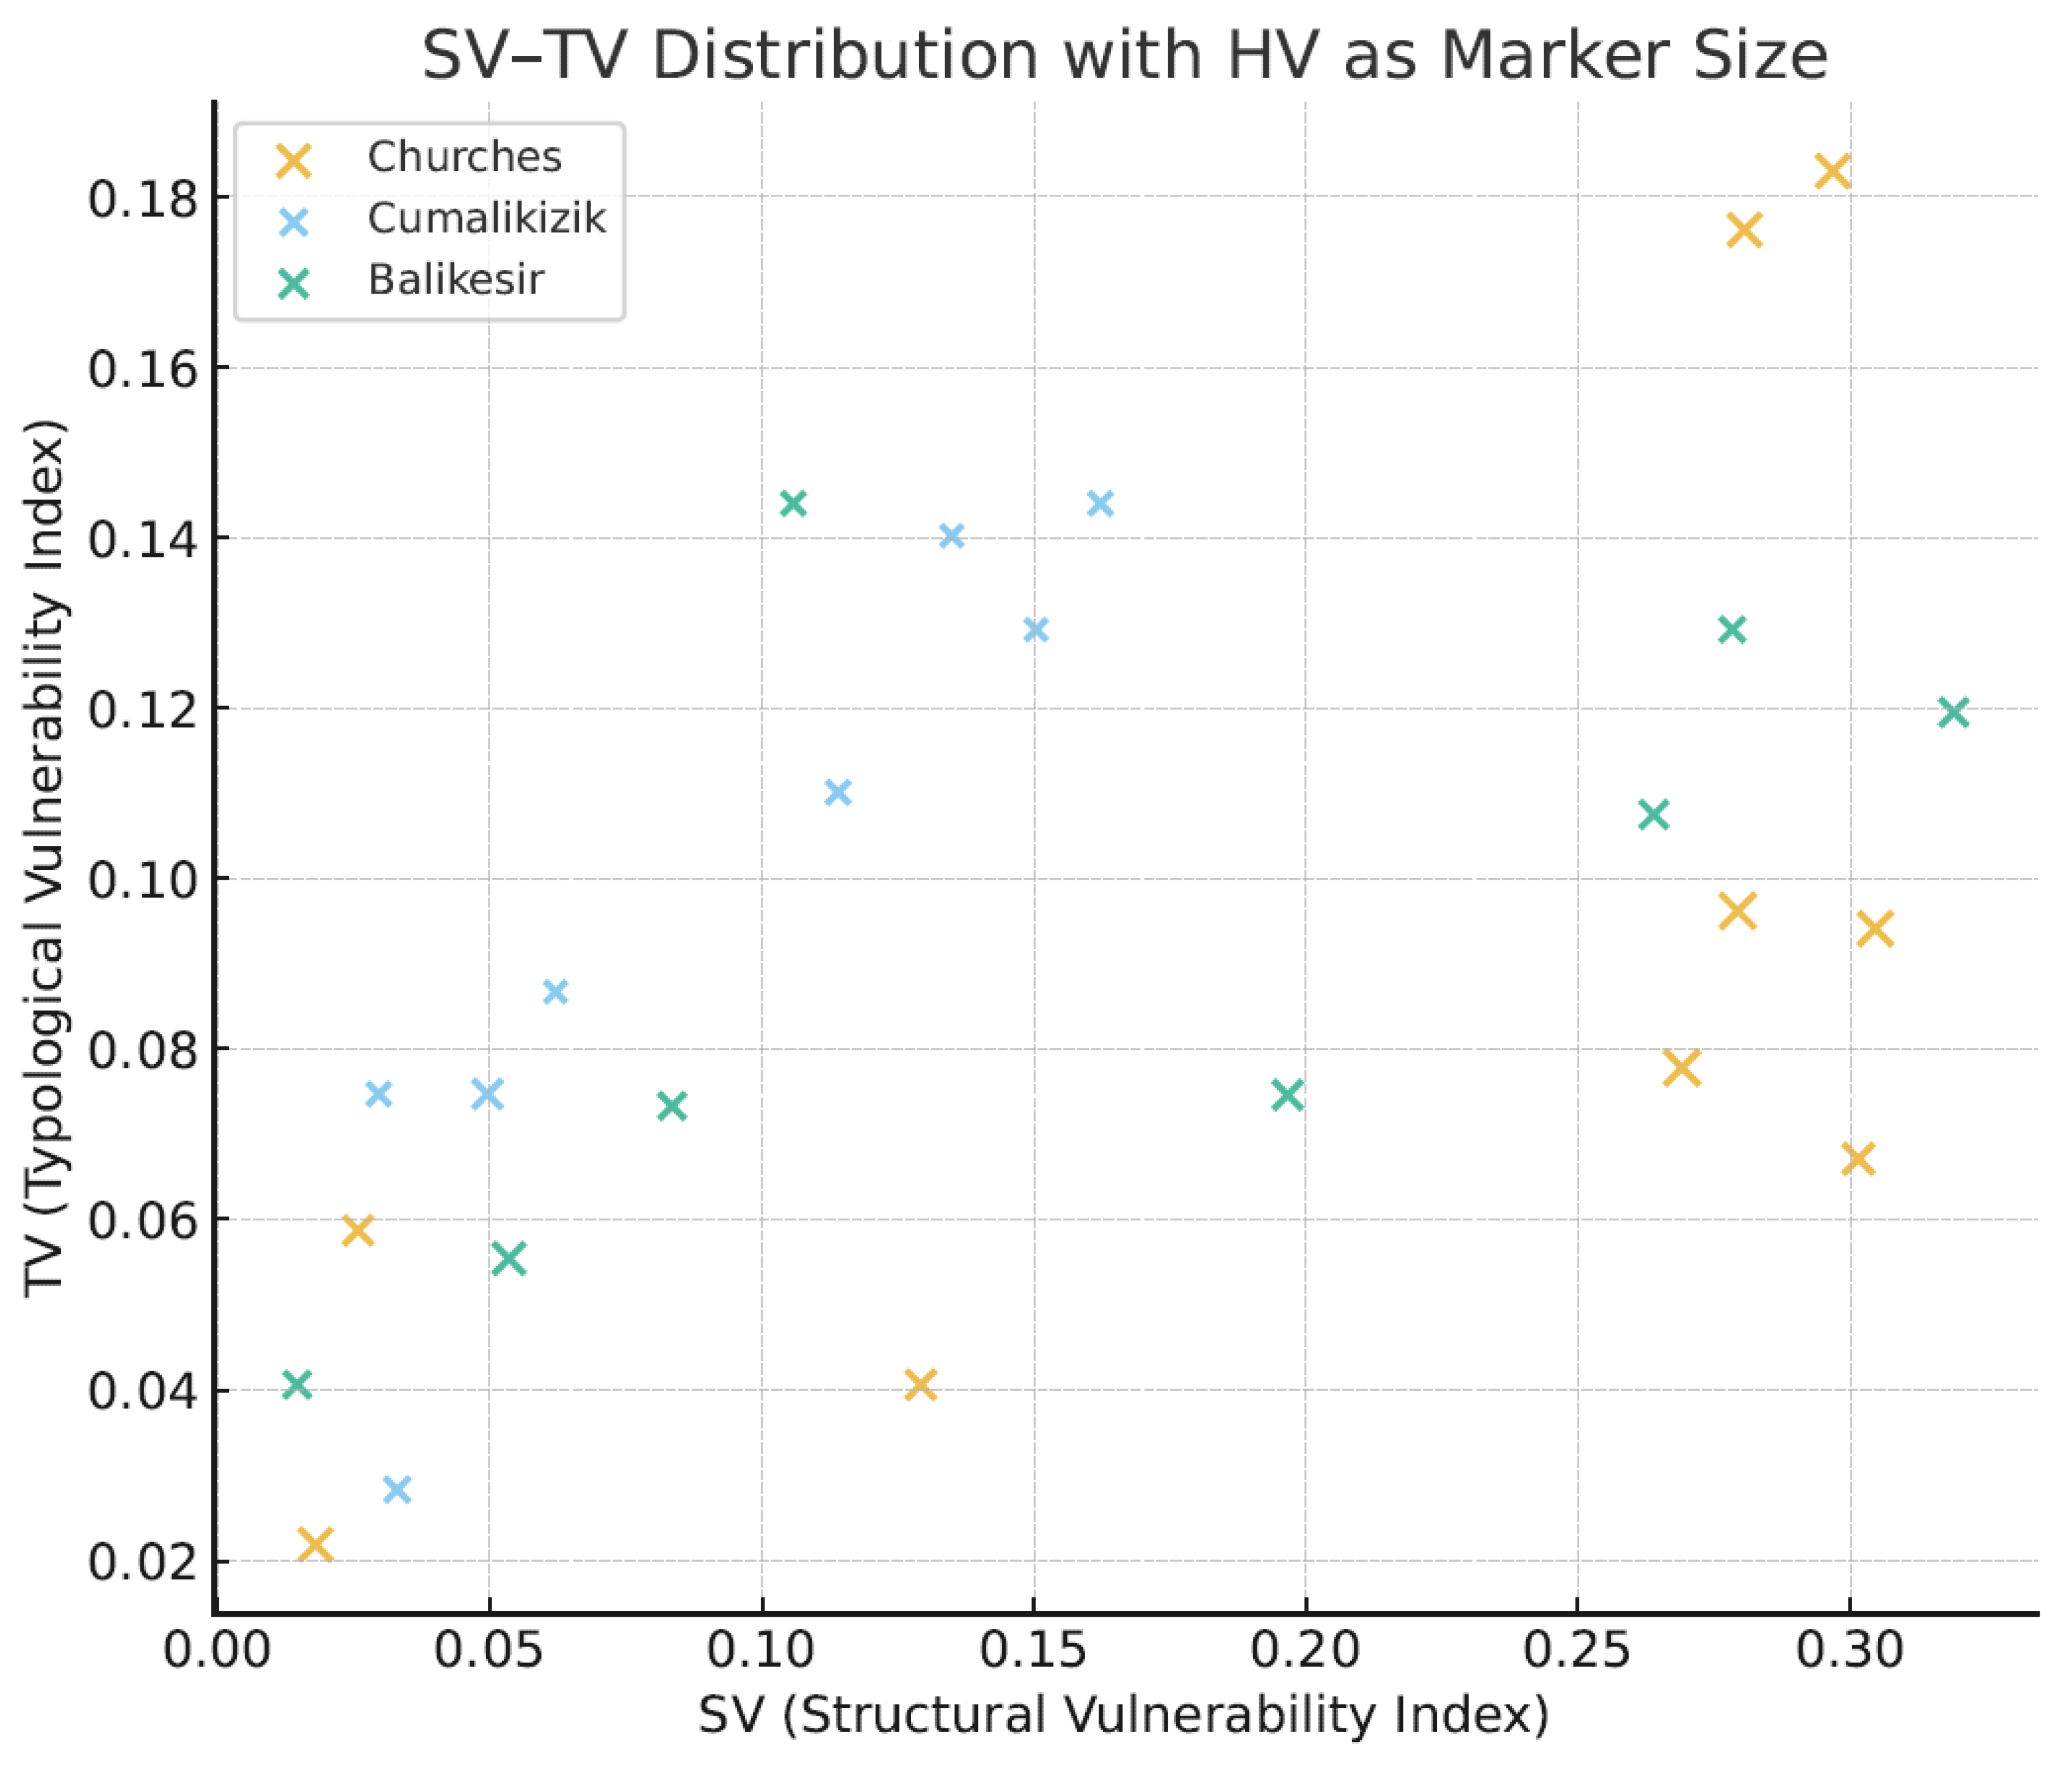
Figure 6.
Comparative Density Distribution of SV–TV–HV Sub-Indices Across the Three Building Groups (Heatmap).
Figure 6.
Comparative Density Distribution of SV–TV–HV Sub-Indices Across the Three Building Groups (Heatmap).
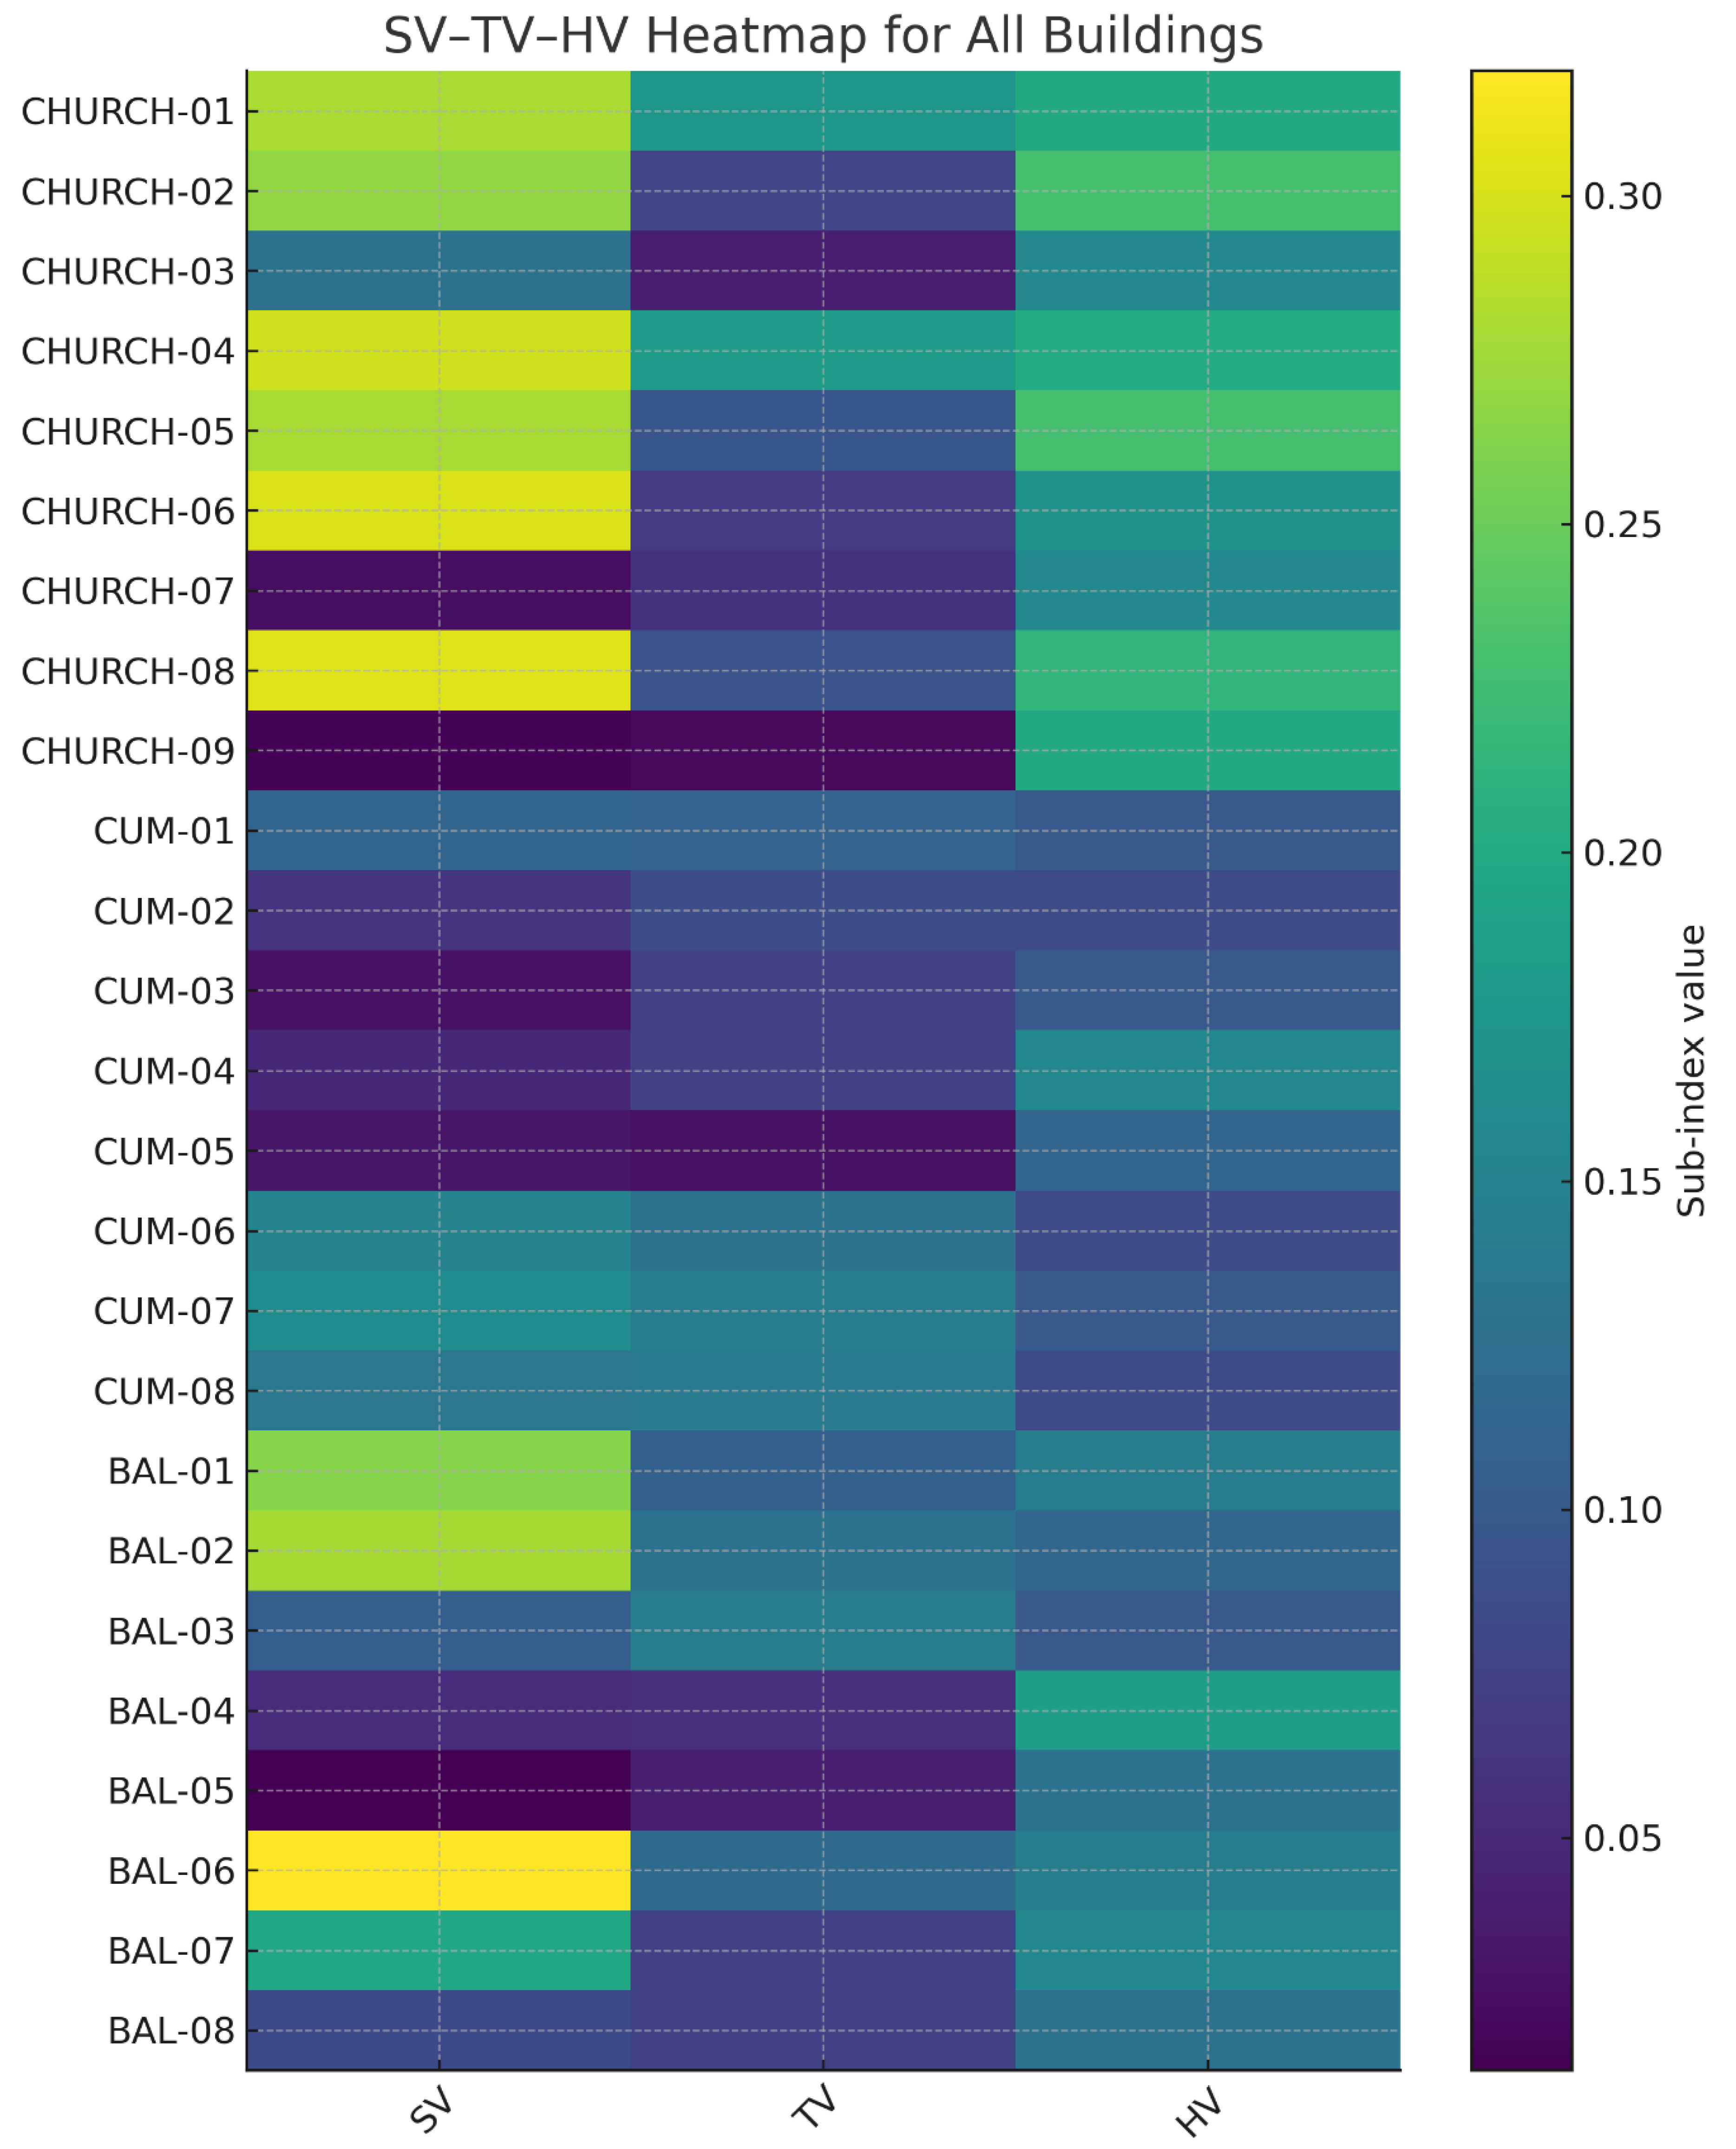
Table 1.
Results of the STVSM Expert Assessment Form: Indicator-Specific Importance Scores.
| Indicator | Expert 1 | Expert 2 | Expert 3 | Expert 4 | Expert 5 | Expert 6 | Expert 7 | Expert 8 | Mean |
| SV1 | 5 | 9 | 9 | 9 | 7 | 7 | 9 | 9 | 8 |
| SV2 | 9 | 9 | 9 | 9 | 8 | 7 | 8 | 9 | 8,5 |
| SV3 | 7 | 8 | 8 | 8 | 8 | 8 | 8 | 9 | 8 |
| SV4 | 5 | 6 | 9 | 7 | 6 | 9 | 7 | 9 | 7,25 |
| SV5 | 3 | 5 | 5 | 2 | 2 | 3 | 7 | 5 | 4 |
| SV6 | 3 | 6 | 4 | 4 | 3 | 3 | 6 | 5 | 4,25 |
| SV7 | 2 | 6 | 5 | 2 | 3 | 2 | 5 | 5 | 3,75 |
| SV8 | 6 | 7 | 7 | 7 | 7 | 5 | 5 | 5 | 6,13 |
| TV1 | 7 | 9 | 8 | 7 | 6 | 7 | 8 | 7 | 7,38 |
| TV2 | 9 | 8 | 9 | 8 | 7 | 6 | 9 | 9 | 8,13 |
| TV3 | 5 | 7 | 7 | 6 | 3 | 6 | 7 | 7 | 6 |
| TV4 | 5 | 6 | 7 | 5 | 4 | 4 | 6 | 5 | 5,25 |
| TV5 | 6 | 7 | 9 | 6 | 4 | 7 | 7 | 7 | 6,63 |
| TV6 | 8 | 7 | 6 | 6 | 6 | 6 | 8 | 7 | 6,75 |
| HV1 | 8 | 9 | 8 | 8 | 9 | 6 | 8 | 7 | 7,88 |
| HV2 | 9 | 8 | 9 | 9 | 8 | 7 | 9 | 7 | 8,25 |
| HV3 | 7 | 8 | 7 | 9 | 9 | 8 | 8 | 7 | 7,88 |
| HV4 | 7 | 8 | 6 | 8 | 8 | 6 | 9 | 7 | 7,38 |
| HV5 | 9 | 9 | 9 | 8 | 7 | 6 | 7 | 7 | 7,75 |
| HV6 | 8 | 8 | 9 | 9 | 9 | 7 | 9 | 5 | 8 |
Table 2.
Expert Mean Scores and Normalized Micro-Weights (wᵢ) for the SV–TV–HV Indicator Sets.
| Main Group | Code | Indicator (shortened) | Mean Score | Normalized Weight (wᵢ) |
| SV | SV1 | Masonry wall deterioration | 8 | 0,160 |
| SV2 | Vertical load-bearing elements | 8,5 | 0,170 | |
| SV3 | Horizontal structural elements | 8 | 0,160 | |
| SV4 | Roof covering damage | 7,25 | 0,145 | |
| SV5 | Plaster/render deterioration | 4 | 0,080 | |
| SV6 | Openings (doors/windows) deterioration | 4,25 | 0,085 | |
| SV7 | Projections/eaves deterioration | 3,75 | 0,075 | |
| SV8 | Circulation elements (stairs, landings) | 6,13 | 0,123 | |
| TV | TV1 | Loss of spatial integrity | 7,38 | 0,184 |
| TV2 | Loss of volumetric/mass integrity | 8,13 | 0,202 | |
| TV3 | Opening ratio/rhythm distortion | 6 | 0,150 | |
| TV4 | Façade composition loss | 5,25 | 0,131 | |
| TV5 | Roof-form / typological continuity loss | 6,63 | 0,165 | |
| TV6 | Loss of original typological elements | 6,75 | 0,168 | |
| HV | HV1 | Historical value | 7,88 | 0,167 |
| HV2 | Architectural–design value | 8,25 | 0,175 | |
| HV3 | Artistic/aesthetic value | 7,88 | 0,167 | |
| HV4 | Contextual value | 7,38 | 0,156 | |
| HV5 | Authenticity/integrity | 7,75 | 0,164 | |
| HV6 | Rarity/representational value | 8 | 0,170 |
Table 4.
Computation of Weighted Indicator Scores (Severityᵢ × wᵢ) for Vernacular Dwellings in Central Balıkesir.
Table 4.
Computation of Weighted Indicator Scores (Severityᵢ × wᵢ) for Vernacular Dwellings in Central Balıkesir.
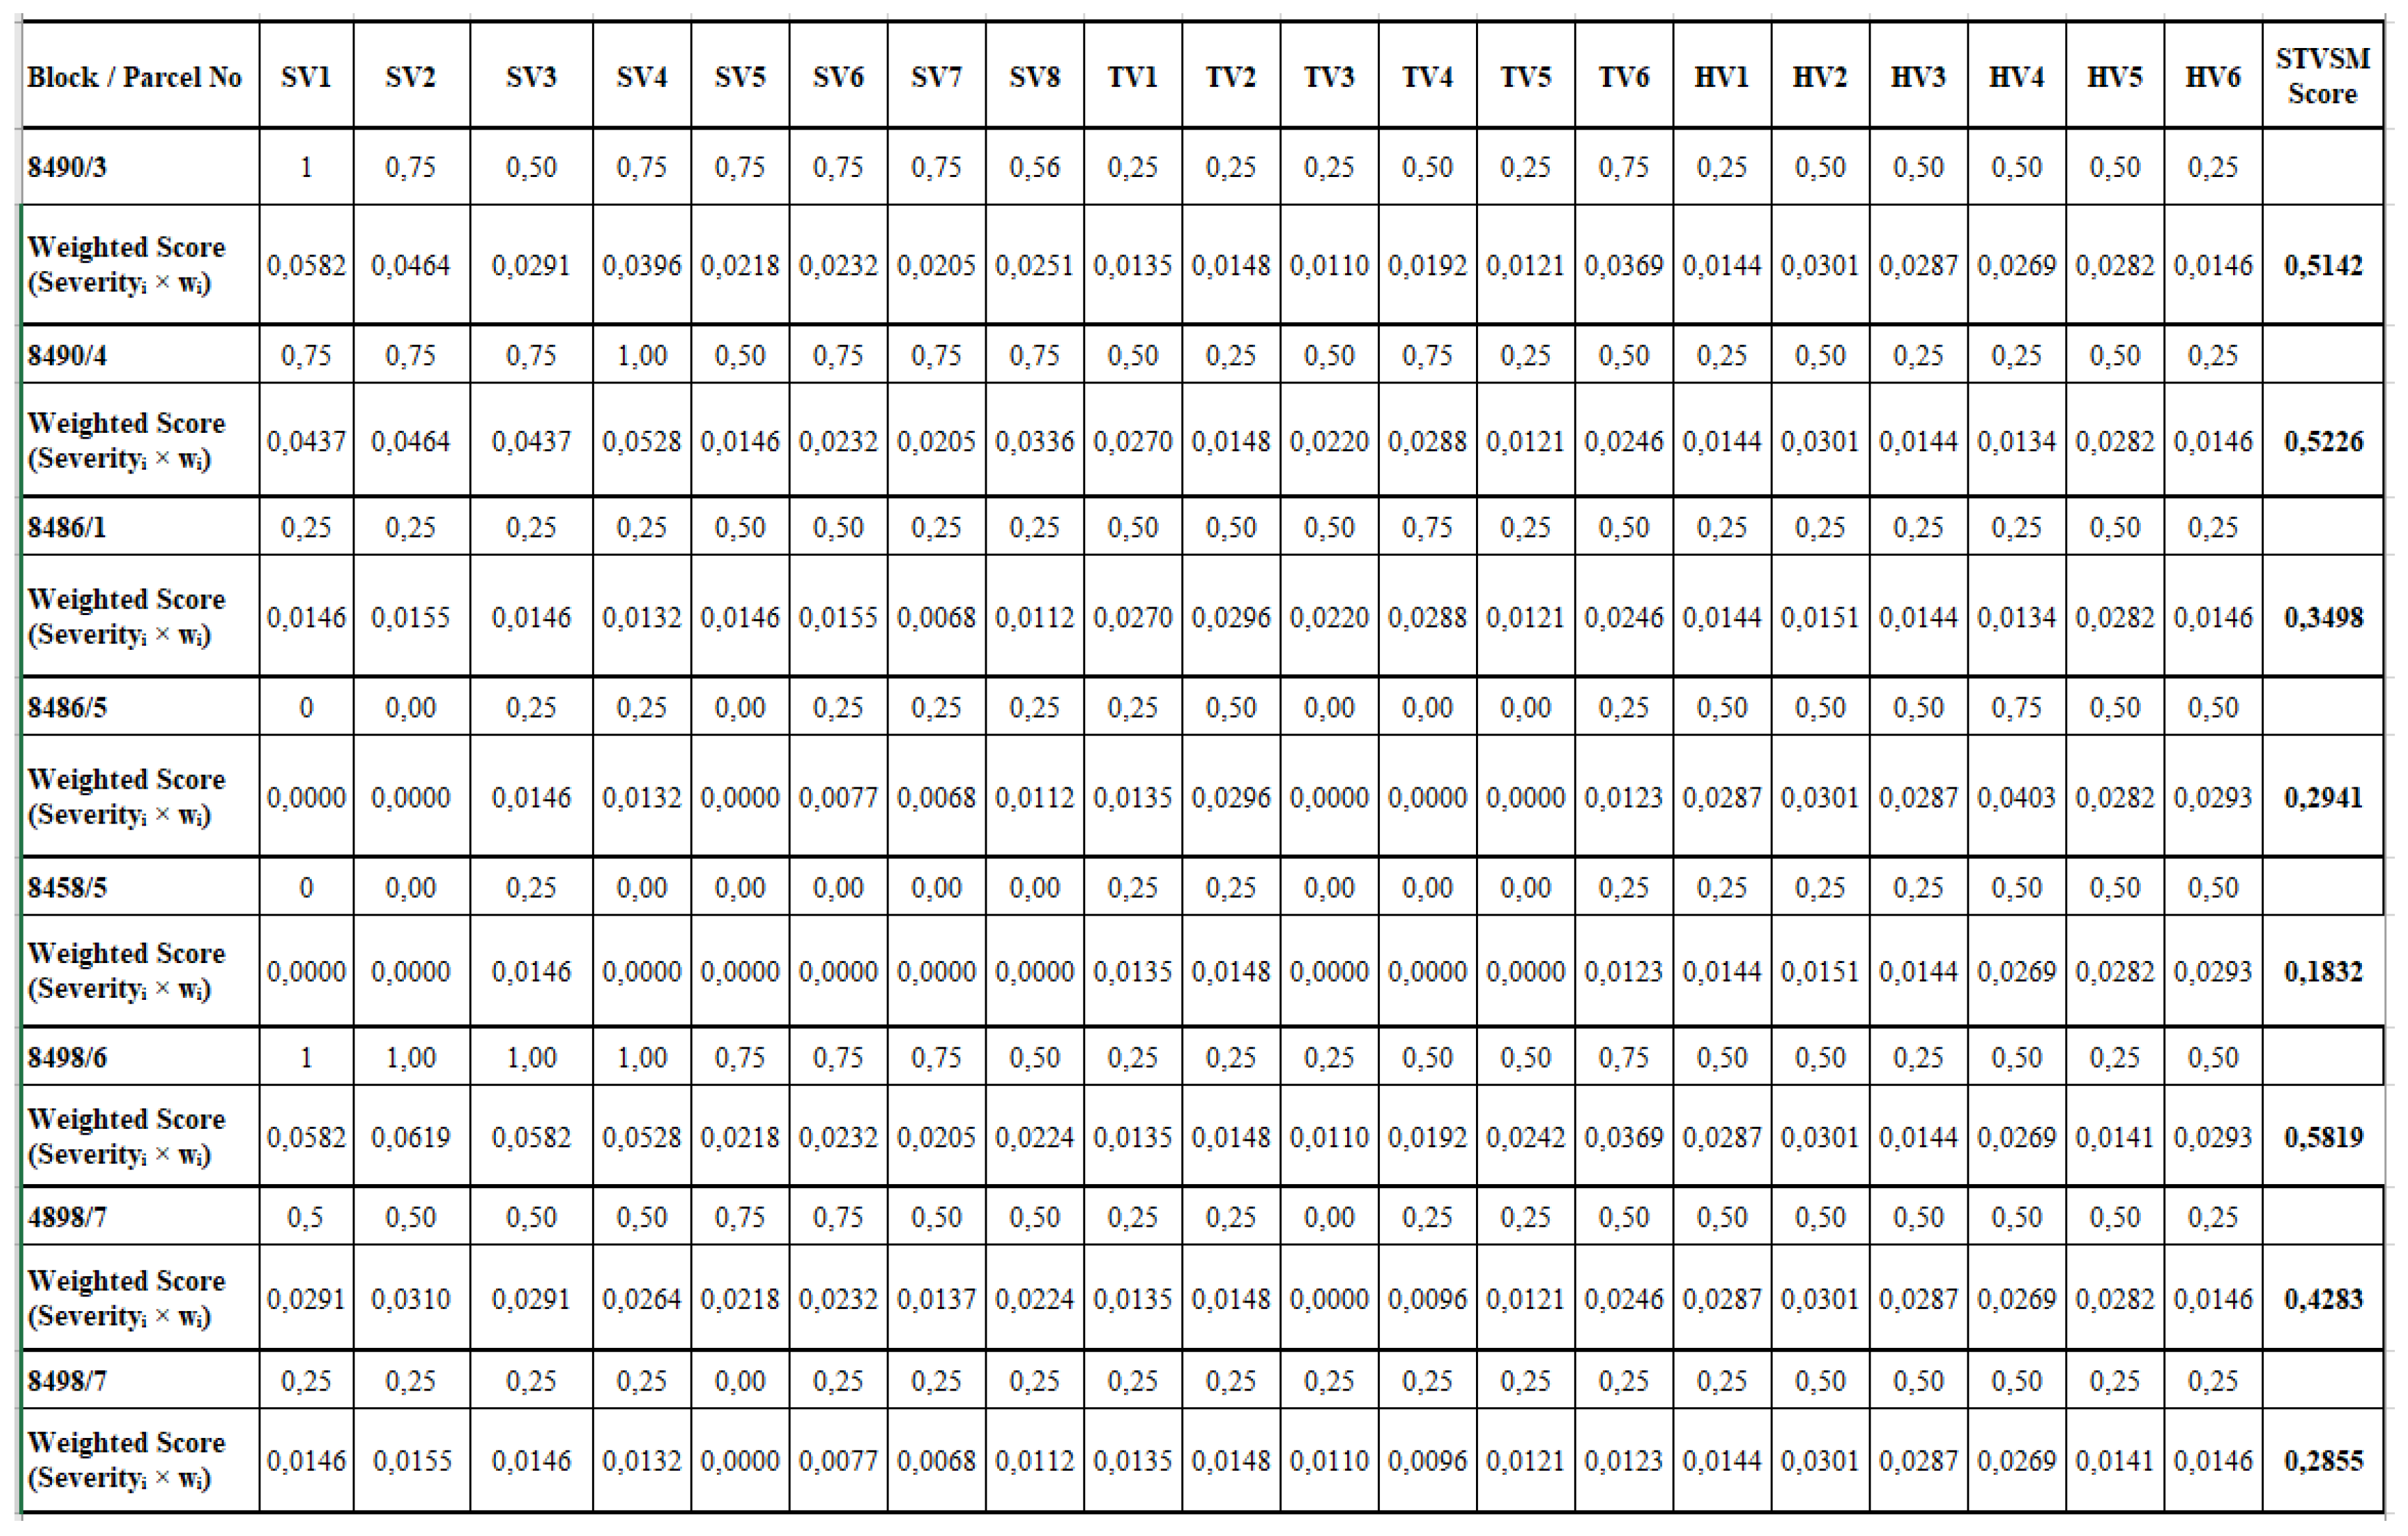 |
Table 5.
Indicator-Based Weighted Score Calculation Matrix (Severityᵢ × wᵢ) for the Traditional Houses of Cumalıkızık Village.
Table 5.
Indicator-Based Weighted Score Calculation Matrix (Severityᵢ × wᵢ) for the Traditional Houses of Cumalıkızık Village.
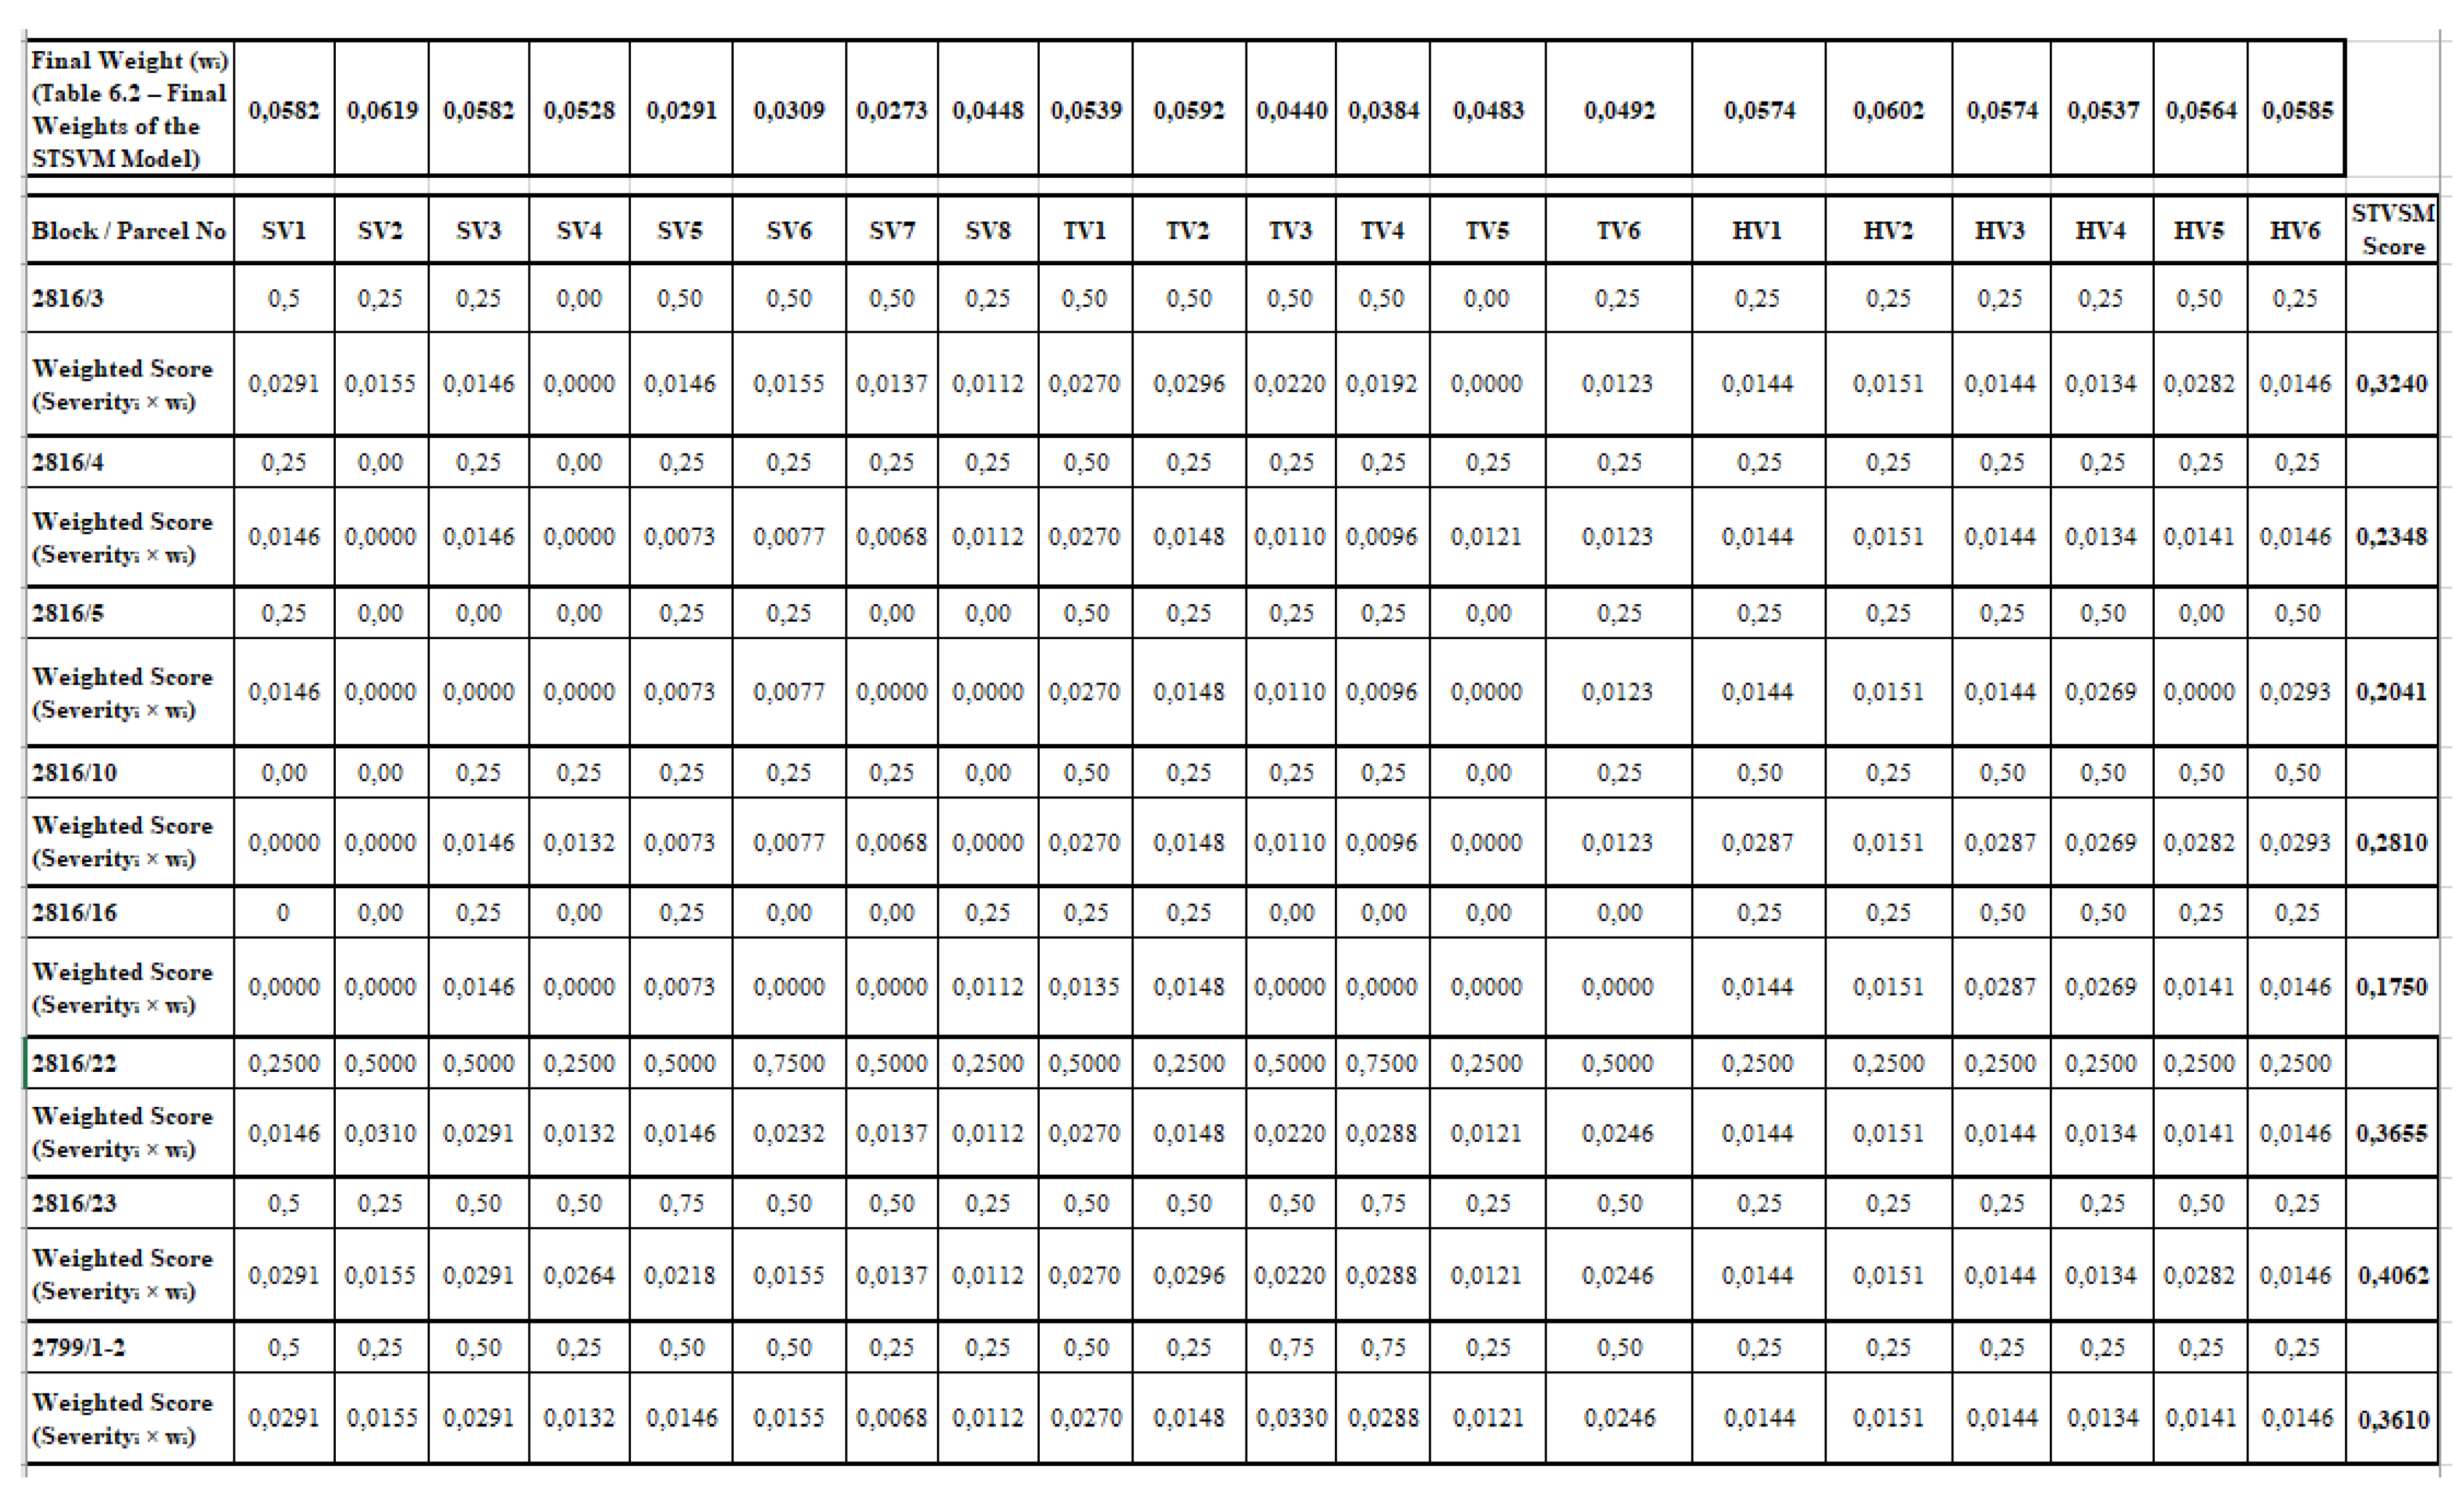 |
Table 6.
Indicator-Based Weighted Score Calculation Matrix (Severityᵢ × wᵢ) for Nineteenth-Century Greek Orthodox Churches in Bursa and Its Rural Territories.
Table 6.
Indicator-Based Weighted Score Calculation Matrix (Severityᵢ × wᵢ) for Nineteenth-Century Greek Orthodox Churches in Bursa and Its Rural Territories.
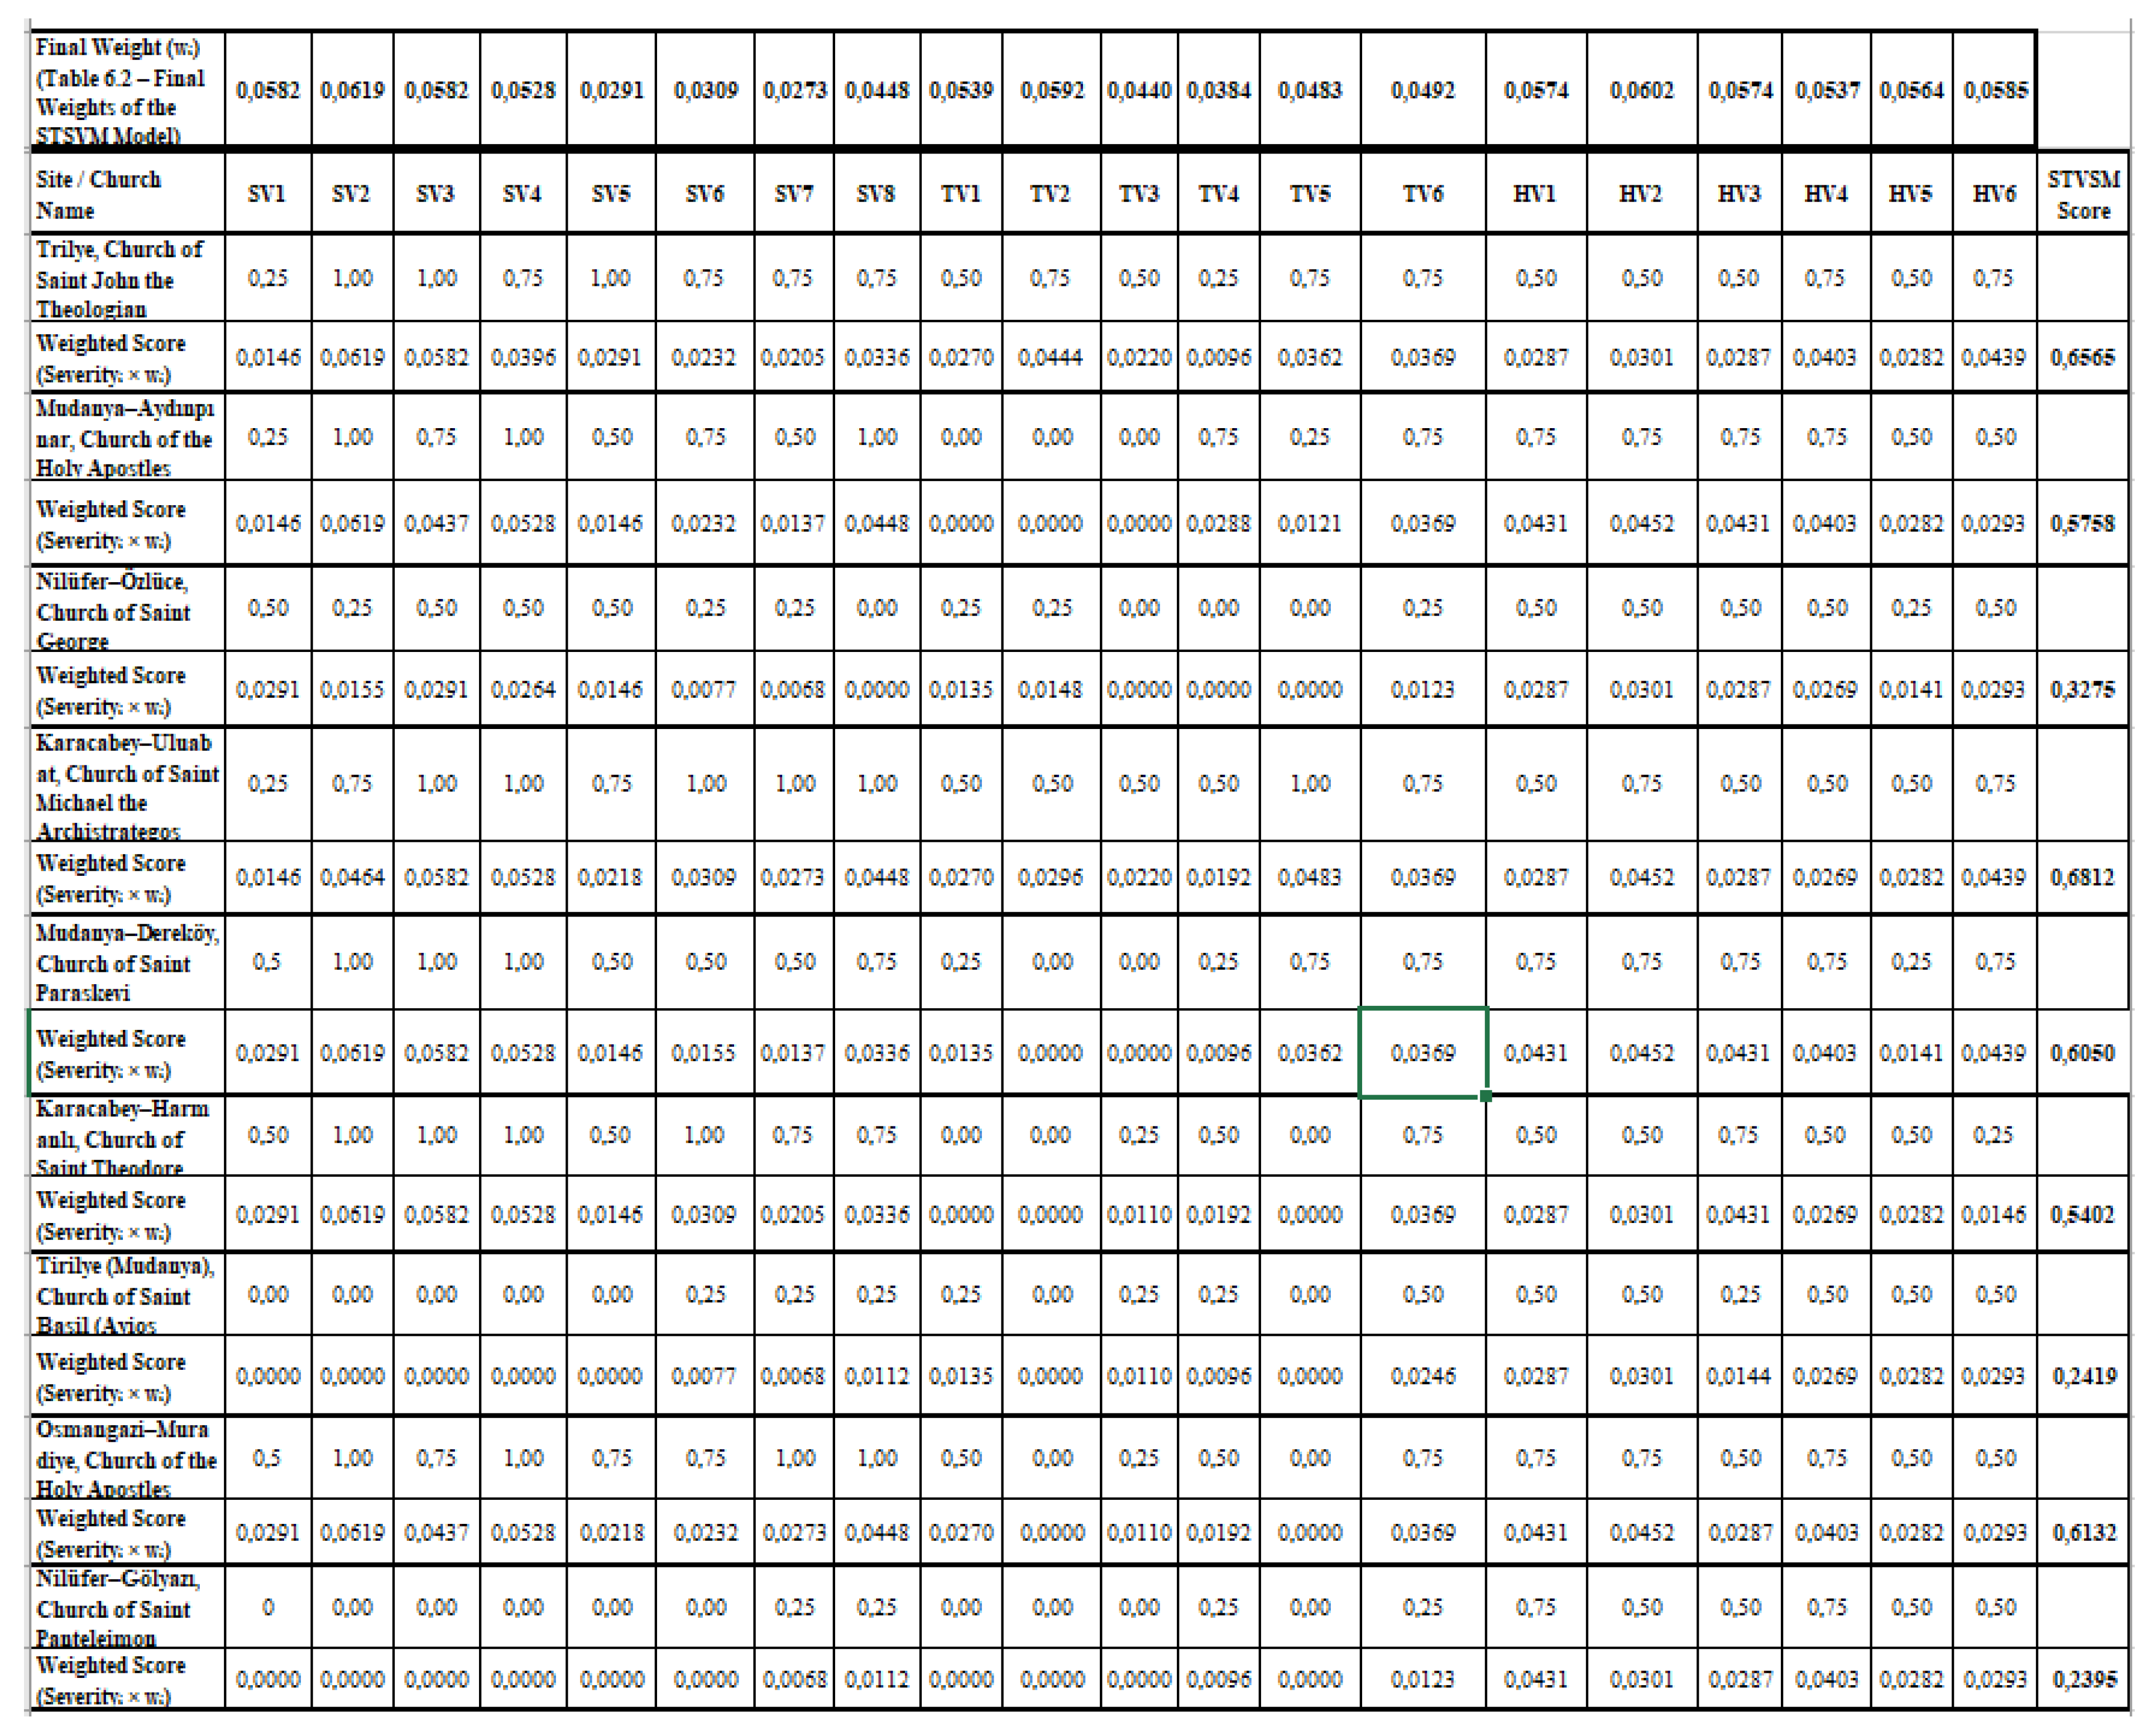 |
Table 7.
SV–TV–HV Sub-Indices and Composite STVSM Scores for the Three Study Areas. The table presents the calculated SV, TV and HV sub-indices together with the final STVSM scores for all buildings, enabling a clear numerical comparison of vulnerability levels across the three building groups.
Table 7.
SV–TV–HV Sub-Indices and Composite STVSM Scores for the Three Study Areas. The table presents the calculated SV, TV and HV sub-indices together with the final STVSM scores for all buildings, enabling a clear numerical comparison of vulnerability levels across the three building groups.
| Code | Building Name / Group | SV | TV | HV | STVSM (Total) |
| CHURCH-01 | Trilye, Church of Saint John the Theologian | 0.2806 | 0.1761 | 0.1999 | 0.6565 |
| CHURCH -02 | Mudanya–Aydınpınar, Church of the Holy Apostles | 0.2691 | 0.0778 | 0.2290 | 0.5758 |
| CHURCH -03 | Nilüfer–Özlüce, Church of Saint George | 0.1292 | 0.0406 | 0.1577 | 0.3275 |
| CHURCH -04 | Karacabey–Uluabat, Church of Saint Michael the Archistrategos | 0.2968 | 0.1830 | 0.2015 | 0.6812 |
| CHURCH -05 | Mudanya–Dereköy, Church of Saint Paraskevi | 0.2793 | 0.0962 | 0.2295 | 0.6050 |
| CHURCH -06 | Karacabey–Harmanlı, Church of Saint Theodore | 0.3015 | 0.0671 | 0.1715 | 0.5402 |
| CHURCH -07 | Tirilye (Mudanya), Church of Saint Basil (Ayios Vasileios) | 0.0258 | 0.0587 | 0.1575 | 0.2419 |
| CHURCH -08 | Osmangazi–Muradiye, Church of the Holy Apostles (Agion Apostolon) | 0.3046 | 0.0941 | 0.2146 | 0.6132 |
| CHURC -09 | Nilüfer–Gölyazı, Church of Saint Panteleimon | 0.0180 | 0.0219 | 0.1996 | 0.2395 |
| CUM-01 | 2816/3 | 0.1140 | 0.1101 | 0.1000 | 0.3240 |
| CUM-02 | 2816/4 | 0.0621 | 0.0867 | 0.0859 | 0.2348 |
| CUM-03 | 2816/5 | 0.0296 | 0.0747 | 0.0999 | 0.2041 |
| CUM-04 | 2816/10 | 0.0496 | 0.0747 | 0.1568 | 0.2810 |
| CUM-05 | 2816/16 | 0.0330 | 0.0283 | 0.1137 | 0.1750 |
| CUM-06 | 2816/22 | 0.1504 | 0.1292 | 0.0859 | 0.3655 |
| CUM-07 | 2816/23 | 0.1622 | 0.1440 | 0.1000 | 0.4062 |
| CUM-08 | 2.01.2799 | 0.1349 | 0.1402 | 0.0859 | 0.3610 |
| BAL-01 | 8490/3 | 0.2639 | 0.1075 | 0.1428 | 0.5142 |
| BAL-02 | 8490/4 | 0.2783 | 0.1292 | 0.1151 | 0.5226 |
| BAL-03 | 8486/1 | 0.1058 | 0.1440 | 0.1000 | 0.3498 |
| BAL-04 | 8486/5 | 0.0535 | 0.0554 | 0.1852 | 0.2941 |
| BAL-05 | 8458/5 | 0.0146 | 0.0406 | 0.1281 | 0.1832 |
| BAL-06 | 8498/6 | 0.3190 | 0.1195 | 0.1434 | 0.5819 |
| BAL-07 | 4898/7 | 0.1966 | 0.0746 | 0.1572 | 0.4283 |
| BAL-08 | 8498/7 | 0.0835 | 0.0733 | 0.1287 | 0.2855 |
Disclaimer/Publisher’s Note: The statements, opinions and data contained in all publications are solely those of the individual author(s) and contributor(s) and not of MDPI and/or the editor(s). MDPI and/or the editor(s) disclaim responsibility for any injury to people or property resulting from any ideas, methods, instructions or products referred to in the content. |
© 2025 by the authors. Licensee MDPI, Basel, Switzerland. This article is an open access article distributed under the terms and conditions of the Creative Commons Attribution (CC BY) license (http://creativecommons.org/licenses/by/4.0/).
Copyright: This open access article is published under a Creative Commons CC BY 4.0 license, which permit the free download, distribution, and reuse, provided that the author and preprint are cited in any reuse.


