Submitted:
08 December 2025
Posted:
09 December 2025
You are already at the latest version
Abstract
This paper presents a comprehensive linear dynamic analysis of a four-degree-of-freedom (4-DOF) lumped mass shear building model, numerically implemented within the OpenSeesPy framework. The numerical model parameters, including mass distribution, stiffness, and damping characteristics, are derived directly from prior experimental testing of physical frame models. The study evaluates the structural response under a statistically significant suite of 50 earthquake ground motion records, carefully selected and scaled to match the Eurocode 8 target spectrum for Soil C and a peak ground acceleration of 0.1 g, reflecting the specific seismic hazard conditions of Osijek, Croatia. Time-history analyses utilizing the Newmark-Beta integration scheme reveal critical insights into the dynamic behaviour, specifically the influence of base flexibility on fundamental period elongation and the distinct response characteristics across different storeys. Statistical processing of the results, visualized through response spectra fractiles and correlation profiles, demonstrates that while lateral displacements exhibit stable first-mode dominance, floor accelerations display high dispersion and significant higher-mode amplification, known as the whipping effect, particularly at the roof level. The findings underscore the limitations of deterministic analyses and highlight the necessity of probabilistic frameworks for accurately assessing seismic demand in low-to-mid-rise structures.
Keywords:
linear time-history analysis
; 4-DOF lumped mass model OpenSeesPy
; seismic response spectrum
; Eurocode 8
; statistical response assessment
1. Introduction
The analysis of building structures subjected to earthquake excitations represents one of the most critical challenges in structural engineering and earthquake engineering. Understanding the dynamic behaviour of buildings to seismic loading is essential for ensuring public safety, minimising economic losses, and developing effective design and retrofit strategies. The four-degree-of-freedom (4-DOF) building model serves as a fundamental analytical tool that bridges the gap between simplified single-degree-of-freedom (SDOF) systems and complex three-dimensional finite element models, making it particularly valuable for educational purposes and preliminary design assessments [1,2,3,4].
The 4-DOF lumped mass model typically represents a low-to-mid-rise building structure with four primary lateral degrees of freedom corresponding to the horizontal displacements at each floor level. This simplified yet physically meaningful representation allows engineers to capture the essential dynamic characteristics of building behaviour while maintaining computational efficiency and analytical tractability. The linear dynamic analysis of such systems under earthquake excitations involves the integration of multiple interconnected concepts: the theoretical formulation of multi-degree-of-freedom systems, the selection and application of appropriate analysis methods, the characterisation of earthquake ground motions, and the interpretation of structural response parameters.
This literature review synthesises current knowledge across these four critical areas to provide a comprehensive foundation for understanding linear dynamic analysis of 4-DOF building models under seismic loading. The review emphasises the theoretical underpinnings, practical methodologies, and contemporary research findings that collectively inform modern earthquake engineering practice.
This paper represents an extension and numerical validation of the experimental studies conducted within the framework of the graduate master thesis by Grgić [1]. The parameters derived from those physical experiments form the basis of the numerical models presented herein.
2. Theoretical Formulation of Multi-Degree-of-Freedom Systems
2.1. Lumped Mass Models and System Idealisation
The lumped mass model represents a fundamental approach in structural dynamics for idealising continuous building structures as discrete systems with a finite number of degrees of freedom. This idealisation is particularly appropriate for frame structures where the mass is concentrated at floor levels and the lateral stiffness is provided by columns and bracing elements [1,2,3,5]. The lumped mass approach assumes that the building mass is concentrated at specific locations (typically at floor levels), while the structural elements connecting these masses provide the lateral stiffness and damping characteristics.
For a 4-DOF building model, the structure is idealised with four concentrated masses representing the mass at each floor level, connected by lateral stiffness elements that represent the combined stiffness of all vertical load-bearing elements at that storey level. This representation is particularly effective for shear-beam type structures where the lateral deformation is dominated by shear deformation in the columns rather than bending of the floor slabs [5,6]. The lumped mass model has been extensively validated through comparison with experimental results and more detailed finite element analyses, demonstrating its effectiveness in capturing the essential dynamic characteristics of building structures [7].
The selection of lumped mass locations and the determination of equivalent stiffness values are critical steps in the development of an accurate 4-DOF model. The masses should include not only the structural mass but also the permanent loads and a portion of the live loads, typically taken as a percentage of the design live load. The lateral stiffness at each storey level can be determined from the properties of the vertical load-bearing elements, considering their geometric and material characteristics [1,8].
2.2. Equations of Motion for MDOF Systems
The dynamic behaviour of a multi-degree-of-freedom system is governed by the equation of motion, which represents the application of Newton’s second law to each degree of freedom. Following the notation established by Chopra [9], for a 4-DOF building model subjected to earthquake ground motion, the equation of motion can be expressed in matrix form as:
where is the mass matrix, is the damping matrix, is the stiffness matrix, is the vector of relative displacements with respect to the ground (replacing the generic to align with standard structural dynamics notation), is the ground acceleration time history, and is the influence vector (representing the displacements of the masses resulting from a static unit ground displacement).
For the specific case of a 4-DOF shear building, these matrices are expanded as follows. The mass matrix is diagonal, representing the lumped masses () at each floor level:
The stiffness matrix for a shear-beam model is tridiagonal, where represents the lateral stiffness of the j-th storey:
The damping matrix represents the energy dissipation mechanisms in the structure, which may include material damping, friction at connections, and other sources of energy dissipation [8]. The formulation of the damping matrix is a subject of ongoing research and practical consideration in structural dynamics. Classical damping models, such as Rayleigh damping, assume that the damping matrix can be expressed as a linear combination of the mass and stiffness matrices:
where and are constants determined from specified damping ratios at two reference frequencies [8,10]. This approach ensures that the damping matrix has the same eigenvectors as the mass and stiffness matrices, which simplifies the modal analysis of the system.
2.3. Modal Properties and Natural Frequencies
The dynamic characteristics of a 4-DOF building model are fundamentally defined by its modal properties, which include natural frequencies, mode shapes, and modal damping ratios. These properties are determined by solving the eigenvalue problem associated with the undamped system:
where represents the natural circular frequency of the n-th mode and is the corresponding mode shape vector [2]. For a 4-DOF system (), this eigenvalue problem yields four natural frequencies and four corresponding mode shapes.
The natural frequencies and mode shapes provide critical information about the dynamic behaviour of the structure. The fundamental (first) mode typically dominates the response of low-to-mid-rise buildings to earthquake excitations, particularly for structures with relatively uniform mass and stiffness distributions. Higher modes become increasingly important for structures with significant irregularities or for response parameters that are sensitive to higher-mode contributions [11].
The modal damping ratio for each mode is typically assumed to be constant across all modes, though this assumption may not accurately represent the actual damping characteristics of real structures. The modal damping ratio is often specified as a percentage of critical damping, with typical values ranging from 2% to 5% for reinforced concrete structures and 1% to 3% for steel structures [1,8].
3. Linear Dynamic Analysis Methods
3.1. Time-History Analysis
Time-history analysis, also known as direct integration analysis, represents the most comprehensive and accurate method for determining the dynamic response of structures to earthquake excitations. This method involves the numerical integration of the equations of motion over the duration of the earthquake ground motion record, computing the structural response at each time step [1,5,12].
The time-history analysis method is particularly valuable for 4-DOF building models because it captures the complete dynamic response without the approximations inherent in other methods. The method directly accounts for the nonlinear characteristics of the ground motion (though applied here to a linear system), the frequency-dependent nature of structural response, and the coupling between different modes of vibration. For linear systems, time-history analysis provides exact results (within the limits of numerical precision) and serves as the benchmark against which other analysis methods are evaluated [5].
The application of time-history analysis requires the selection of appropriate earthquake ground motion records, which is discussed in detail in Section 4. The analysis produces time histories of displacement, velocity, and acceleration at each degree of freedom, from which response parameters such as maximum interstory drift, maximum floor acceleration, and maximum base shear can be extracted [1,12].
3.2. Modal Superposition Method
The modal superposition method, also known as the mode superposition method, represents an efficient approach for linear dynamic analysis that exploits the orthogonality properties of the mode shapes with respect to the mass and stiffness matrices. This method transforms the coupled equations of motion in physical coordinates into a set of uncoupled equations in modal coordinates, which can be solved independently and then superposed to obtain the total response [5,10].
The modal superposition method begins with the transformation of the displacement vector from physical coordinates to modal coordinates:
where represents the modal coordinate (or generalised coordinate) for the n-th mode. Substituting this transformation into the equation of motion and utilising the orthogonality properties of the mode shapes yields a set of uncoupled equations for each mode n:
where is the damping ratio for the n-th mode. The term is the modal participation factor, defined as , where and is the generalised mass [10].
Each of these uncoupled equations represents the response of a single-degree-of-freedom system to the earthquake ground motion, which can be solved using standard SDOF analysis techniques. The total response is then obtained by superposing the contributions from all modes. For linear systems, the modal superposition method provides results identical to time-history analysis but with significantly reduced computational effort, particularly when only a limited number of modes contribute significantly to the response [1,5].
The modal superposition method is particularly effective for 4-DOF building models because the response is typically dominated by the first one or two modes, allowing for accurate results using only a small subset of the available modes. However, for response parameters that are sensitive to higher-mode contributions, such as floor accelerations or local element forces, a larger number of modes may be required for accurate results [1,11].
3.3. Direct Integration Methods: Newmark- Method
Direct integration methods represent a class of numerical techniques for solving the equations of motion by directly integrating the differential equations without transforming to modal coordinates. The Newmark- method is one of the most widely used direct integration methods in structural dynamics and earthquake engineering [5,13].
The Newmark- method is based on the following recurrence relations for displacement and velocity (adapted for the displacement vector ):
where subscripts i and denote time steps t and , while and are parameters that control the accuracy and stability characteristics of the method [13].
The Newmark- method is unconditionally stable when and . The most commonly used variant is the average acceleration method (also known as the trapezoidal rule), which corresponds to and . This variant provides second-order accuracy and is unconditionally stable, making it particularly suitable for earthquake response analysis where the time step is typically determined by the frequency content of the ground motion rather than stability considerations [13].
The Newmark- method is particularly valuable for 4-DOF building models because it can handle both linear and nonlinear systems with equal facility, making it suitable for preliminary linear analysis as well as more advanced nonlinear analyses. The method requires the solution of a system of linear equations at each time step, which is computationally efficient for small systems such as the 4-DOF model [5].
4. Earthquake Ground Motion Selection and Characterisation
4.1. Importance of Ground Motion Selection
The selection of appropriate earthquake ground motion records is a critical factor in the accuracy and reliability of seismic response analysis. The characteristics of the ground motion, including its amplitude, frequency content, and duration, have profound effects on the structural response and must be carefully considered in the analysis process [1,14,15].
The ground motion selection process involves multiple considerations, including the seismic hazard at the site, the characteristics of potential earthquake sources, the propagation path from the source to the site, and the local soil conditions. Different ground motion records, even when normalised to the same peak ground acceleration (PGA), can produce significantly different structural responses due to variations in their frequency content and temporal characteristics [14].
The importance of ground motion selection has been recognised in modern seismic design codes and standards, which typically require the use of multiple ground motion records to account for the variability in earthquake characteristics. The use of a suite of ground motion records, rather than a single record, provides a more robust assessment of structural response and reduces the likelihood of underestimating or overestimating the seismic demand on the structure [14,15].
4.2. Ground Motion Scaling and Normalisation
Ground motion scaling represents a common practice in seismic response analysis, where recorded earthquake accelerograms are scaled to match specified intensity measures such as peak ground acceleration (PGA), spectral acceleration at the fundamental period of the structure, or other parameters. The scaling of ground motion records allows engineers to assess the response of structures to earthquakes of different magnitudes and distances while utilising the frequency content characteristics of recorded earthquakes [14].
However, the scaling of ground motion records introduces important considerations regarding the preservation of the frequency content and the appropriateness of the scaled record for the structure being analysed. Uncontrolled scaling of ground motion records, particularly when scaling factors are large, can distort the frequency content of the record and produce unrealistic structural responses. The scaling of ground motion records should be performed with careful consideration of the target intensity measure and the characteristics of the structure being analysed [14].
Spectral matching represents an advanced ground motion scaling technique in which recorded earthquake accelerograms are modified to match a target response spectrum over a specified frequency range. This approach allows engineers to utilise the recorded characteristics of real earthquakes while ensuring that the frequency content of the ground motion is appropriate for the structure being analysed. However, spectral matching can introduce artificial high-frequency content that may not be representative of real earthquakes [16].
4.3. Frequency Content and Spectral Characteristics
The frequency content of earthquake ground motions is a critical factor in determining the structural response. Structures with natural frequencies in the range where the ground motion has significant energy will experience larger responses than structures with natural frequencies in ranges where the ground motion energy is limited. The response spectrum, which plots the maximum response of SDOF systems with different natural frequencies to a given ground motion, provides a convenient representation of the frequency-dependent characteristics of earthquake ground motions [14].
The frequency content of earthquake ground motions is influenced by multiple factors, including the magnitude and mechanism of the earthquake, the distance from the epicentre, the propagation path through the crust, and the local soil conditions at the site. Near-field ground motions, recorded close to the epicentre, typically contain significant energy at longer periods and may exhibit pulse-like characteristics that are not present in far-field ground motions. The frequency content of ground motions recorded on soft soil sites is typically shifted toward longer periods compared to ground motions recorded on rock sites [12].
The characterisation of ground motion frequency content is essential for understanding the appropriateness of a given ground motion record for a particular structure. For a 4-DOF building model with natural periods typically in the range of 0.5 to 2.0 seconds, ground motions with significant energy in this frequency range will produce larger structural responses. The use of ground motion records with frequency content that is not well-matched to the structure’s natural frequencies may result in either overestimation or underestimation of the seismic demand [1,14].
4.4. Real versus Synthetic Ground Motion Records
The use of recorded earthquake accelerograms (real ground motion records) versus synthetically generated ground motions represents an important consideration in seismic response analysis. Real ground motion records have the advantage of representing the actual characteristics of earthquakes, including the frequency content, temporal characteristics, and nonstationary behaviour that are observed in actual earthquakes. However, the availability of recorded ground motions for specific site conditions and earthquake scenarios may be limited, particularly for rare but potentially damaging earthquakes [1,15].
Synthetic ground motion records are generated using mathematical models that simulate the characteristics of earthquakes based on seismological parameters such as magnitude, distance, and site conditions. Synthetic ground motions allow engineers to assess the response of structures to a wide range of earthquake scenarios, including those for which recorded ground motions are not available. However, synthetic ground motions may not capture all of the complex characteristics of real earthquakes, and their use requires careful validation against recorded ground motions [15].
The generation of synthetic ground motion records typically involves the specification of a target response spectrum and the use of mathematical models to generate time histories that are consistent with the target spectrum. The pseudoexcitation method and other advanced techniques have been developed to generate synthetic ground motions that are consistent with specified spectral characteristics and that exhibit the nonstationary behaviour observed in real earthquakes [15].
The selection between real and synthetic ground motion records depends on the specific requirements of the analysis and the availability of appropriate recorded ground motions. For preliminary design and educational purposes, the use of a limited number of well-characterised recorded ground motions is often appropriate. For more comprehensive seismic risk assessments, the use of a suite of ground motion records that includes both recorded and synthetically generated motions may be necessary to adequately represent the range of possible earthquake scenarios [15].
5. Response of Low-to-Mid-Rise Buildings under Seismic Loading
5.1. Characteristics of Low-to-Mid-Rise Building Response
Low-to-mid-rise buildings, typically defined as structures with heights up to approximately 10-15 stories, exhibit dynamic characteristics that are well-suited to analysis using simplified models such as the 4-DOF lumped mass system. These structures typically have fundamental periods in the range of 0.5 to 2.0 seconds, which places them in a frequency range where earthquake ground motions typically have significant energy [5,8].
The response of low-to-mid-rise buildings to earthquake excitations is typically dominated by the fundamental mode of vibration, with higher modes contributing relatively small amounts to the overall response. This characteristic makes these structures particularly suitable for analysis using simplified models and modal superposition methods that include only the first few modes. However, for response parameters such as floor accelerations and local element forces, higher-mode contributions may be more significant and must be considered in the analysis [11].
The interstory drift, defined as the relative displacement between adjacent floors, is a critical response parameter for low-to-mid-rise buildings. Interstory drift is often used as a measure of structural damage and is limited by building codes to ensure that structural and nonstructural damage is minimised. For low-to-mid-rise buildings, the interstory drift typically increases with height, with the maximum interstory drift often occurring at the lower stories where the lateral stiffness is greatest [1,17].
5.2. Previous Studies on 4-DOF and Similar Systems
Numerous studies have investigated the response of multi-degree-of-freedom systems similar to the 4-DOF building model under earthquake excitations. These studies have employed various analysis methods, including time-history analysis, modal superposition, and direct integration methods, to assess the structural response and validate analytical procedures [1,2,3,4].
Research on adjacent building pounding has extensively utilised lumped mass MDOF models to represent building structures, demonstrating the effectiveness of this idealisation for capturing the essential dynamic characteristics of building response. Studies by Anagnostopoulos and Spiliopoulos have employed discrete multi-degree-of-freedom lumped mass models to analyse earthquake-induced pounding of structures, validating the approach through comparison with experimental results and more detailed finite element analyses [1,18,19].
The application of lumped mass MDOF models to bridge structures has also provided valuable insights into the dynamic response of structures to earthquake excitations. Studies on bridge pounding and seismic response have utilised lumped mass models to represent the bridge superstructure, demonstrating the effectiveness of this approach for capturing the essential dynamic characteristics of bridge response [20,21].
Experimental validation of lumped mass MDOF models has been performed through shake table tests and field measurements. Studies comparing shake table test results with theoretical predictions based on lumped mass models have demonstrated good agreement, validating the effectiveness of this idealisation for representing the dynamic characteristics of structures [7,22].
5.3. Modal Characteristics and Frequency Response
The modal characteristics of low-to-mid-rise buildings, including natural frequencies and mode shapes, have been extensively studied through both theoretical analysis and experimental investigation. For a 4-DOF shear building model with uniform mass and stiffness distribution, the natural frequencies and mode shapes can be determined analytically, providing a benchmark for validating numerical analysis procedures [2].
The fundamental period of low-to-mid-rise buildings is a critical parameter that influences the structural response to earthquake excitations. Empirical formulas for estimating the fundamental period of buildings have been developed based on the analysis of numerous structures and have been incorporated into building codes and design standards. For reinforced concrete frame buildings, the fundamental period is typically estimated as seconds, where N is the number of stories, though this formula provides only a rough estimate and should be validated through more detailed analysis [1,23].
The frequency response of low-to-mid-rise buildings is characterised by the response spectrum, which plots the maximum response of SDOF systems with different natural frequencies to a given ground motion. The response spectrum provides a convenient representation of the frequency-dependent characteristics of earthquake ground motions and is widely used in seismic design practice. For low-to-mid-rise buildings with fundamental periods in the range of 0.5 to 2.0 seconds, the response spectrum typically exhibits significant amplification in this frequency range, indicating that these structures are particularly vulnerable to earthquake excitations [14].
5.4. Damping Effects and Energy Dissipation
Damping represents a critical factor in the dynamic response of structures to earthquake excitations, as it controls the rate at which energy is dissipated from the structure. The damping ratio, typically expressed as a percentage of critical damping, varies depending on the structural system, materials, and construction details. For reinforced concrete structures, damping ratios typically range from 3% to 5%, while for steel structures, damping ratios are typically in the range of 1% to 3% [8,24,25].
The effect of damping on the seismic response of low-to-mid-rise buildings has been extensively studied, with research demonstrating that damping has a significant effect on the maximum response, particularly for structures with natural frequencies near the peak of the response spectrum. The equivalent viscous damping approach, which represents the actual damping characteristics of structures through an equivalent viscous damping coefficient, has been widely adopted in seismic analysis and design [8,25,26].
The sources of damping in structures include material damping (internal friction in the structural materials), friction at connections and interfaces, and radiation damping (energy radiated away from the structure through the foundation and surrounding soil). For low-to-mid-rise buildings, material damping and friction at connections typically dominate, while radiation damping becomes more significant for structures with flexible foundations or in soft soil conditions [8,15,27,28].
6. Numerical Implementation
6.1. Description of the Numerical Model
To validate the theoretical concepts discussed in previous sections, a numerical analysis was conducted using the OpenSeesPy framework [29]. The subject of the analysis is a four-degree-of-freedom (4-DOF) lumped mass shear building model, schematically represented in Figure 1. The geometric and physical parameters of this model (mass, stiffness, and damping characteristics) were adopted directly from the experimental testing of physical frame models performed by Grgić [1].
The model represents a generic, experimental-scale structure designed to simulate the dynamic behaviour of a low-rise building. The structural system is idealised as a shear frame where the total mass is concentrated at the floor levels, and the columns provide lateral stiffness. The model parameters are defined as follows:
- Mass Distribution: A lumped mass of is assigned to each of the four storeys (Nodes 1 through 4), representing the translational inertia of each floor.
- Lateral Stiffness: The interstorey stiffness is modelled using linear elastic uniaxial materials. The nominal stiffness for the superstructure columns is set to .
- Base Flexibility: To account for realistic boundary conditions, such as soil-structure interaction or the flexibility of a shaking table mechanism (as indicated in Fig. Figure 1), the connection between the foundation (Node 0) and the first structural node involves a stiffness reduction. A representative stiffness of (a 30% reduction compared to the superstructure) was applied to the base element.
The numerical model is constructed in a 1D domain with one degree of freedom per node (horizontal translation). The boundary condition at the base (Node 0) is fully fixed, while the excitation is applied via the MultipleSupport pattern to simulate ground motion propagation. The structural damping is modelled using Rayleigh damping, calibrated to a damping ratio of for the first and fourth modes, which is consistent with the assumptions for steel or composite experimental models.
6.2. Computational Strategy and Solver Settings
The dynamic response was calculated using the Newmark- time-stepping integration method. Specifically, the "Average Acceleration" method was employed, characterised by parameters and . This scheme is unconditionally stable and introduces no numerical damping, ensuring that energy dissipation is governed solely by the specified Rayleigh damping.
The system of equations was solved using the UmfPack solver, a robust general sparse solver suitable for non-symmetric systems. The Reverse Cuthill-McKee (RCM) algorithm was used for Degree of Freedom (DOF) numbering to optimise the bandwidth of the system matrices. The convergence test employed was the NormDispIncr (Norm of the Displacement Increment), with a tolerance of and a maximum of 100 iterations per step, utilising the KrylovNewton algorithm to handle the time-stepping iterations efficiently.
6.3. Ground Motion Selection and Seismic Hazard
A suite of 50 earthquake ground motion records was selected and scaled from the PEER NGA-West2 database [30] (https://ngawest2.berkeley.edu/) to match the specific seismic hazard conditions of the city of Osijek, Croatia. The target spectrum was defined according to Eurocode 8 (EN 1998-1:2004) standards with the following parameters:
- Ground Type: Soil C (Deep deposits of dense or medium-dense sand, gravel or stiff clay).
- Spectrum Type: Type 1 (General high-seismicity spectrum, appropriate for the region).
- Peak Ground Acceleration (): .
- Importance Factor (): 1.0.
- Viscous Damping (): 2%.
The selection matches the specific seismic hazard conditions of the city of Osijek, Croatia, characterized by soft soil deposits. Therefore, the Eurocode 8 Type 1 spectrum for Soil C was chosen as the target, considering a peak ground acceleration of g, which is relevant for the design seismicity of the region.
Figure 2 illustrates the acceleration response spectra of the 50 individual scaled records (grey lines) alongside their statistical aggregations. The median spectrum (red line) and the 16% and 84% fractiles (blue and magenta lines, respectively) demonstrate an excellent match with the target Eurocode 8 elastic spectrum (black dashed line) within the period range of interest (). The vertical lines indicate the first four natural periods of the 4-DOF model (, , , ), confirming that the selected ground motions possess sufficient energy content to excite all significant modes of the structure.
6.4. Analysis of Dynamic Response
The results of the linear time-history analyses provide a comprehensive view of the structural performance. Figure 3 presents the probability density functions (PDF) and histograms of the maximum relative displacements for each floor. A clear trend of amplification is visible as we move from the 1st floor to the roof. The roof (4th floor) exhibits a mean maximum displacement of , nearly double that of the 1st floor (). The Kernel Density Estimation (KDE) curves show that the response distribution approximates a log-normal distribution, which is typical for seismic response parameters.
The dispersion of the response is further analysed in Figure 4 using box-plot diagrams. While the interquartile range (the box width) remains relatively compact for displacements, indicating predictable deformation patterns, the accelerations (bottom panel) show significantly higher variance, particularly at the roof level. This "whipping effect" at the top of the structure results in occasional extreme acceleration spikes, which are critical for the design of non-structural components.
Figure 5 summarises the vertical profiles of the response. The displacement profile (left) shows a predominantly first-mode shear deformation shape. The velocity and acceleration profiles (centre and right) exhibit a more linear increase with height but with widening confidence intervals ( Standard Deviation), suggesting that higher modes introduce more uncertainty into the kinetic variables than the kinematic ones.
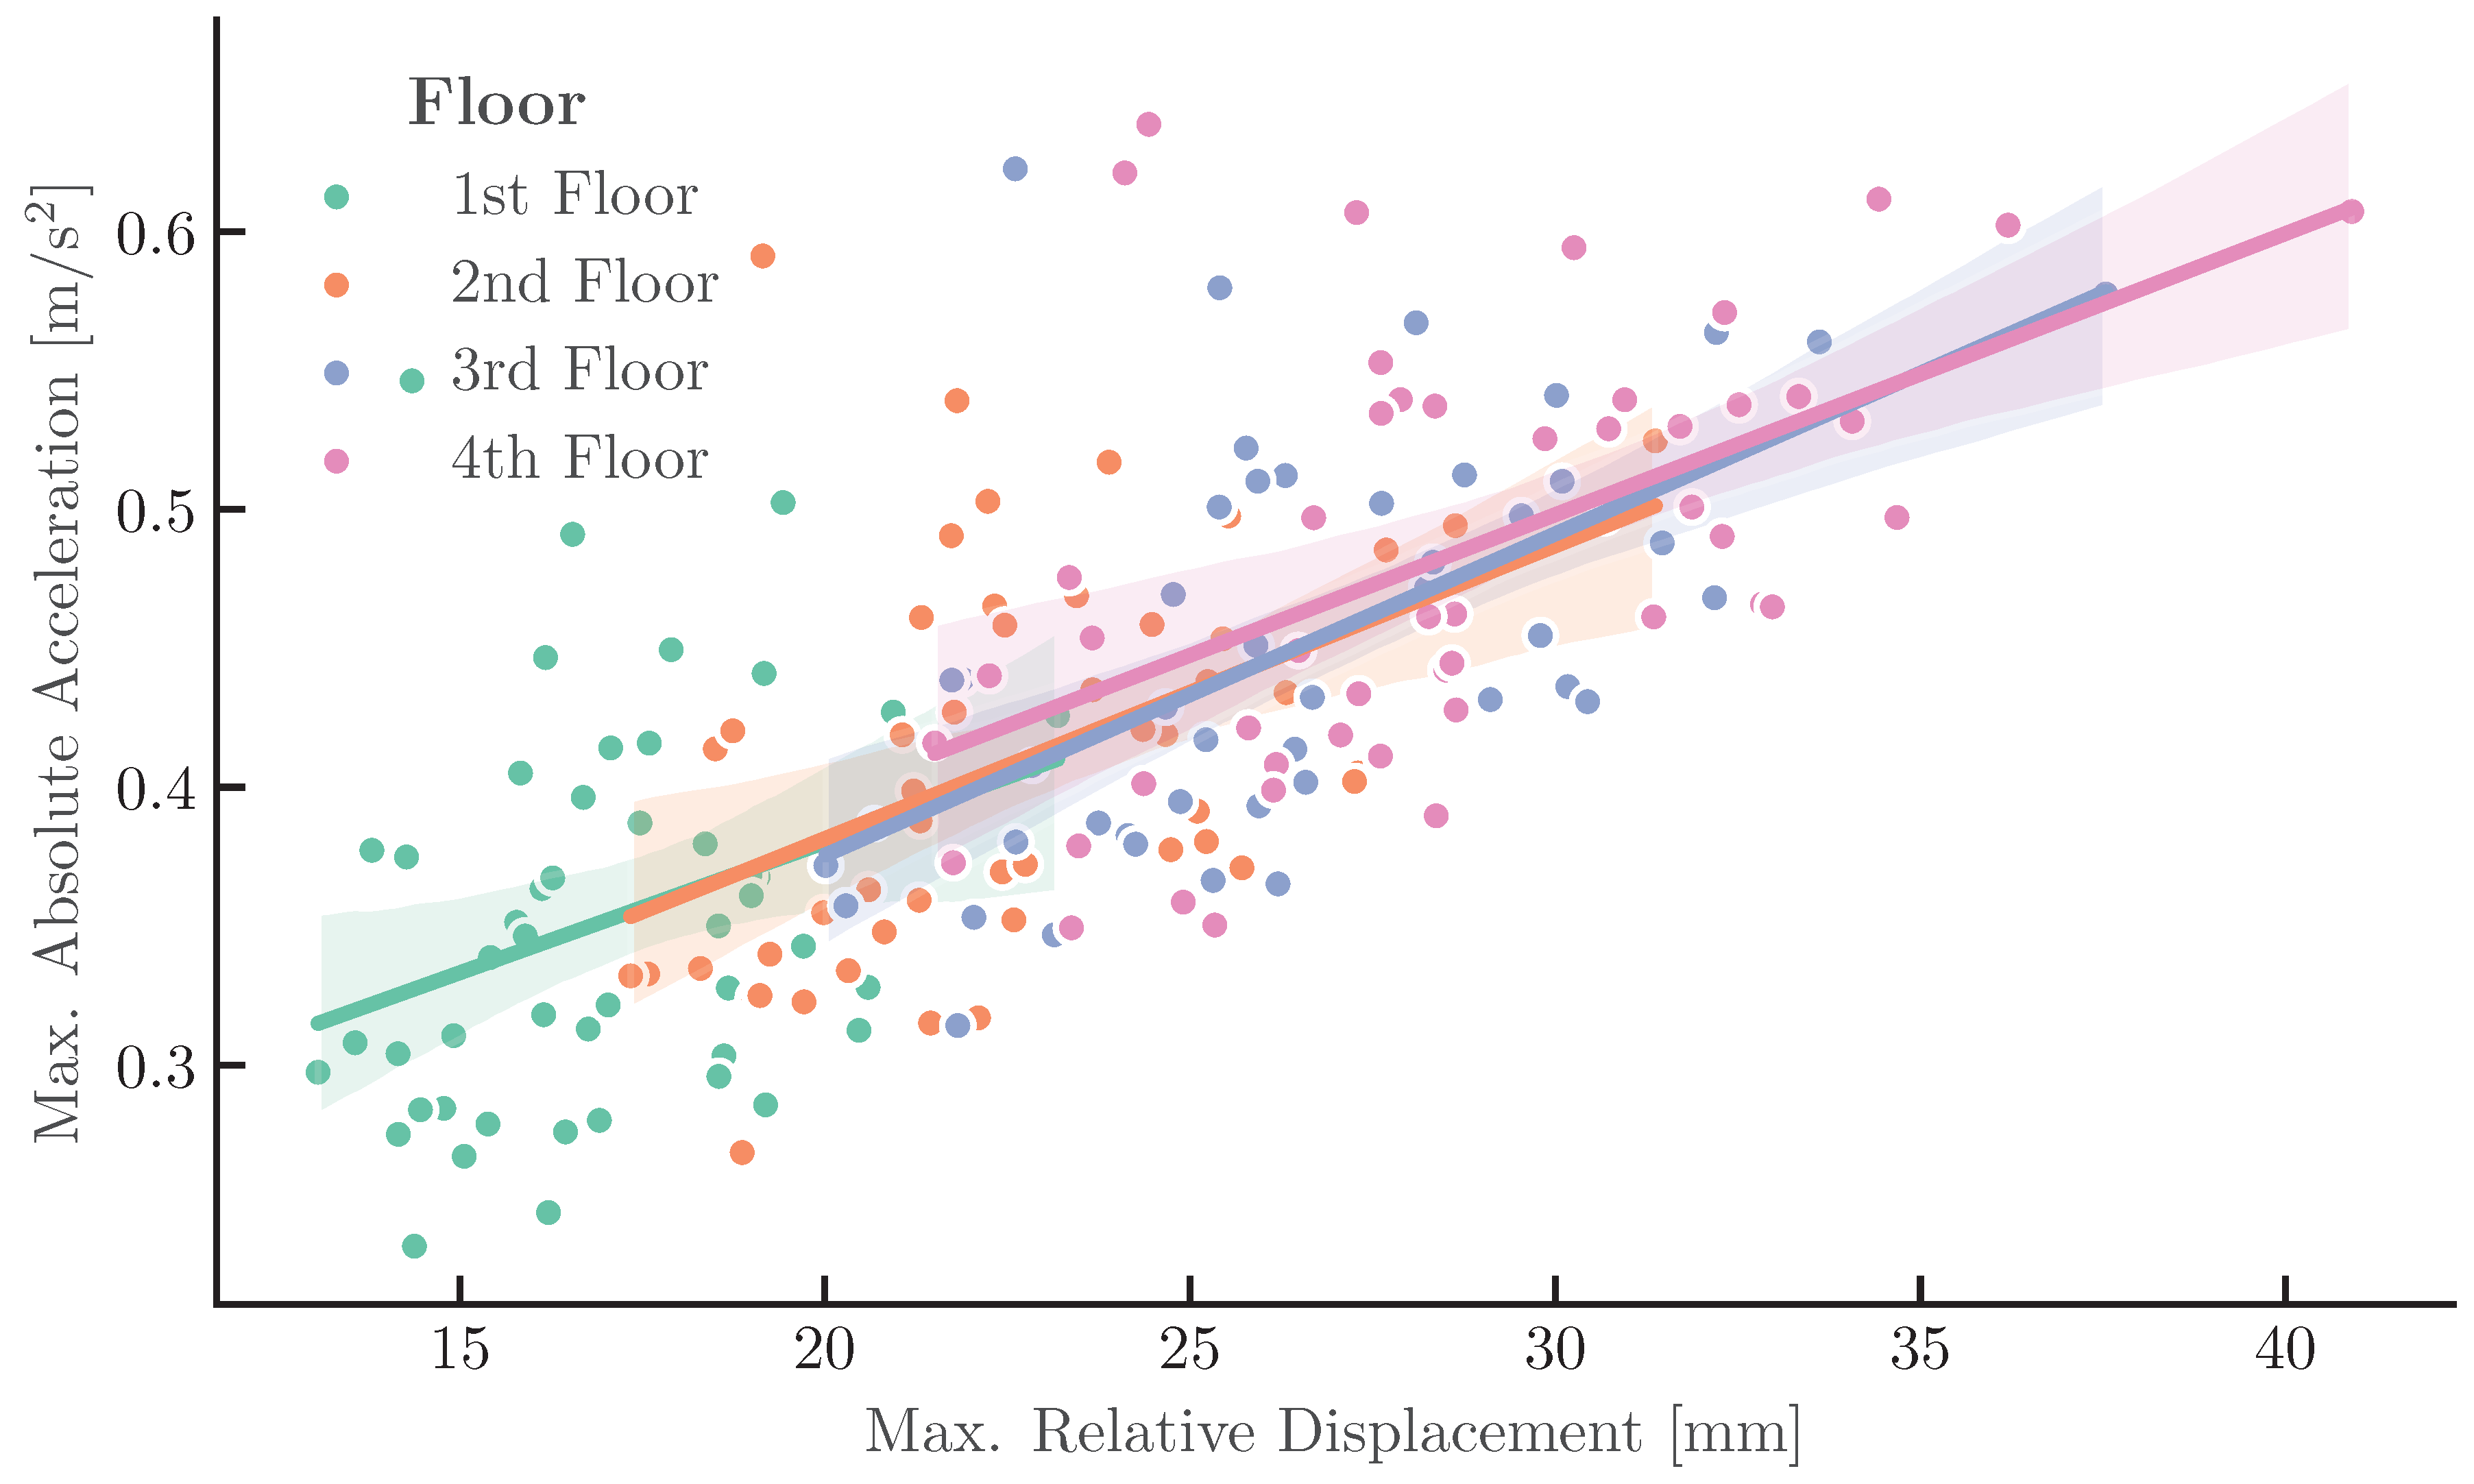
Finally, the correlation between maximum relative displacement and maximum absolute acceleration is depicted in Figure 6. The distinct clustering of data points by floor level confirms the stiffness characteristics of the model. The regression lines for each floor are nearly parallel, indicating that the incremental stiffness remains consistent across the height of the structure, a direct consequence of the linear elastic assumption and the regular mass-stiffness distribution.
7. Conclusion
This study presented a rigorous linear dynamic analysis of a 4-DOF lumped mass shear-dominated building model, representative of low-to-mid-rise structures, under a statistically significant suite of 50 earthquake excitations tailored to the seismic conditions of Osijek, Croatia (Type 1, Soil C, g, , ).
The numerical implementation in OpenSeesPy, utilising the Newmark- integration scheme, successfully captured the dynamic amplification inherent in multi-storey structures. Key conclusions drawn from the results include:
- Structural Amplification: The structure exhibits a classical shear-beam behaviour with significant amplification of displacements towards the roof. The mean roof displacement is approximately 1.7 times larger than the first-storey displacement, highlighting the flexibility of the chosen structural system.
- Base Flexibility Influence: The explicit modelling of base flexibility ( of the superstructure stiffness) contributed to the elongation of the fundamental period (), pushing the structure into the constant-velocity region of the response spectrum. This emphasizes the importance of accurately modelling boundary conditions, as rigid-base assumptions could underestimate the fundamental period and potentially overestimate base shear forces.
- Response Variability: The analysis of 50 ground motions reveals that while displacements are relatively stable (low coefficient of variation), floor accelerations exhibit high dispersion. The 84% fractile of the response spectra significantly exceeds the mean, suggesting that deterministic analyses using only a few records may fail to capture peak demand scenarios necessary for safety-critical designs.
- Mode Participation: The vertical profiles and spectral analysis confirm that the first mode dominates the displacement response. However, the scatter observed in the acceleration correlation plots (Figure 6) suggests that higher-mode effects are non-negligible for force-related quantities, even in regular, linear structures.
Future research should extend this probabilistic framework to nonlinear systems, incorporating hysteretic damping and degradation to assess the collapse margin of such structures under rare, high-intensity seismic events.
References
- Grgić, F. Dinamičko ispitivanje i numerička analiza seizmičkog odziva varijantnih modela okvirnih konstrukcija. Diplomski rad, Sveučilište Josipa Jurja Strossmayera u Osijeku, Građevinski i arhitektonski fakultet Osijek, 2024. [Google Scholar]
- Mardhiyah, R.; Walujodjati, E.; Gutama, R.M.S. Application of Modal Analysis of Earthquake Force and Natural Frequency Tanjung Baru Bridge. IOP Conference Series: Earth and Environmental Science 2023, 1244, 012004. [Google Scholar] [CrossRef]
- Yang, Y.; Li, Q. Development of a Refined Analysis Method for Earthquake-Induced Pounding between Adjacent RC Frame Structures. Sustainability 2019, 11, 4928. [Google Scholar] [CrossRef]
- Patel, C.C. Seismic Response Control of Similar Adjacent Structures Connected by Maxwell Dampers. Proceedings of the ASPS Conference Proceedings 2022, Vol. 1, 693–698. [Google Scholar] [CrossRef]
- Abad, M.S.A.; Shooshtari, A.; Esfahani, A.R.M. Novel Technique for Dynamic Analysis of Shear-Frames Based on Energy Balance Equations. Scientia Iranica 2018, 25, 1–12. [Google Scholar] [CrossRef]
- Ahmad, S.; Moin, K. Stability Analysis of Monument: A Case Study–Safdarjung Tomb. Advanced Materials Research 2010, 133-134, 403–408. [Google Scholar] [CrossRef]
- Azeloğlu, C.O.; Sağırlı, A.; Edipbek, A. Investigation of Seismic Behavior of Container Crane Structures by Shake Table Tests and Mathematical Modeling. Shock and Vibration 2014, 2014, 682647. [Google Scholar] [CrossRef]
- Hamed, A.; Davenne, L. Effect of the viscous damping on the seismic response of Low-rise RC frame building. Revista Facultad de Ingeniería Universidad de Antioquia 2020, 9–20. [Google Scholar] [CrossRef]
- Chopra, A.K. Dynamics of Structures: Theory and Applications to Earthquake Engineering . In Fifth Edition in SI Units, 5 ed.; Pearson: Harlow, Essex, 2017. [Google Scholar]
- Chang, T.S.; Singh, M.P. Seismic analysis of structures with a fractional derivative model of viscoelastic dampers. Earthquake Engineering and Engineering Vibration 2002, 1, 51–60. [Google Scholar] [CrossRef]
- Vamvatsikos, D.; Cornell, C.A. Direct Estimation of Seismic Demand and Capacity of Multidegree-of-Freedom Systems through Incremental Dynamic Analysis of Single Degree of Freedom Approximation. Journal of Structural Engineering 2005, 131, 589–599. [Google Scholar] [CrossRef]
- Rezvan, M.; Zhang, Y. Near-fault ground motion effect on self-centering modular bracing panels considering soil-structure interaction. Advances in Structural Engineering 2023, 26, 2755–2774. [Google Scholar] [CrossRef]
- Roth, C. Evaluation of the seismic response of a reinforced concrete footing with stub column to increasing peak ground acceleration using pseudo-dynamic experimentation. Journal of the South African Institution of Civil Engineering 2022, 64, 1–12. [Google Scholar] [CrossRef]
- Aquib, S.M.; Arafah, H.S.S.; Al-Osta, M.A.A. Analysis of Ground Motion Intensity Measures and Selection Techniques for Estimating Building Response. Applied Sciences 2022, 12, 12089. [Google Scholar] [CrossRef]
- Rezaeian, S.; Der Kiureghian, A. Simulation of orthogonal horizontal ground motion components for specified earthquake and site characteristics. Earthquake Engineering & Structural Dynamics 2011, 40, 1415–1435. [Google Scholar] [CrossRef]
- Goulet, C.A.; Haselton, C.B.; Mitrani-Reiser, J.; Beck, J.L.; Deierlein, G.G.; Porter, K.A.; Stewart, J.P. Assessment of Ground Motion Selection and Modification (GMSM) Methods for Non-Linear Dynamic Analyses of Structures. In Proceedings of the Proceedings of the 14th World Conference on Earthquake Engineering, Beijing, China, 2008. [Google Scholar]
- Ruiz-García, J.; Miranda, E. Evaluation of residual drift demands in regular multi-storey frames for performance-based seismic assessment. Earthquake Engineering & Structural Dynamics 2006, 35, 709–729. [Google Scholar] [CrossRef]
- Anagnostopoulos, S.A.; Spiliopoulos, K.V. An investigation of earthquake induced pounding between adjacent buildings. Earthquake Engineering & Structural Dynamics 1992, 21, 289–302. [Google Scholar] [CrossRef]
- Jankowski, R. Experimental study on earthquake-induced pounding between structural elements made of different building materials. Earthquake Engineering & Structural Dynamics 2009, 39, 343–354. [Google Scholar] [CrossRef]
- Bi, K.; Hao, H.; Chouw, N. 3D FEM Analysis of Pounding Response of Bridge Structures at a Canyon Site to Spatially Varying Ground Motions. Advances in Structural Engineering 2013, 16, 619–632. [Google Scholar] [CrossRef]
- Mavronicola, E.; Komodromos, P.; Polycarpou, P.C. Spatial seismic modeling of base-isolated buildings pounding against moat walls: effects of ground motion directionality and mass eccentricity. Earthquake Engineering & Structural Dynamics 2016, 45, 1919–1937. [Google Scholar] [CrossRef]
- Sağırlı, A.; Azeloğlu, C.O. Investigation of the Dynamic Behaviors of Cranes under Seismic Effects with Theoretical and Experimental Study. Advanced Materials Research 2012, 445, 1082–1087. [Google Scholar] [CrossRef]
- Cha, Y.J.; Conte, J.P.; Park, H. Field Measurement-Based System Identification and Dynamic Response Prediction of a Unique MIT Building. Sensors 2016, 16, 1016. [Google Scholar] [CrossRef] [PubMed]
- Argenziano, M.; De Bellis, M.L.; Vaiana, N. Optimization of Viscoelastic Tuned Mass Damper Systems Subjected to Coloured Excitations. Earthquake Engineering & Structural Dynamics 2025, 54, 1–20. [Google Scholar] [CrossRef]
- Giaralis, A.; Taflanidis, A.A. Optimal tuned mass-damper-inerter (TMDI) design for seismically excited MDOF structures with model uncertainties based on reliability criteria. Structural Control and Health Monitoring 2017, 24, e2082. [Google Scholar] [CrossRef]
- Caicedo, D.; Lara-Valencia, J.; Valencia-González, Y. Optimal design and performance evaluation of tuned mass damper inerter in building structures. Revista Facultad de Ingeniería Universidad de Antioquia 2021, 9–20. [Google Scholar] [CrossRef]
- Li, C.; Zhai, Z.; Xie, L.L.; Sun, Y. Influence of time-varying frequency content in earthquake ground motions on seismic response of linear elastic systems. Earthquake Engineering & Structural Dynamics 2016, 45, 1623–1642. [Google Scholar] [CrossRef]
- Cavalieri, F.; Correia, D.; Pinho, R. Comparative Assessment of Dynamic Soil-Structure Interaction Models for Fragility Characterisation. In Proceedings of the Proceedings of the 7th International Conference on Computational Methods in Structural Dynamics and Earthquake Engineering (COMPDYN), Crete, Greece, 2019. [Google Scholar]
- McKenna, F.; Fenves, G.L.; Scott, M.H. Open System for Earthquake Engineering Simulation; University of California: Berkeley, 2000. [Google Scholar]
- Ancheta, T.D.; Darragh, R.B.; Stewart, J.P.; Seyhan, E.; Silva, W.J.; Chiou, B.S.; Wooddell, K.E.; Graves, R.W.; Kottke, A.R.; Boore, D.M.; et al. PEER NGA-West2 Database. Technical Report PEER Report 2013/03; Pacific Earthquake Engineering Research Center (PEER): University of California, Berkeley, 2013. [Google Scholar]
Figure 1.
MDOF theoretical shear model, with explicitly defined mass, stiffness and damping values, and additional flexibility of the model base such as imperfection of boundary conditions or shaking table in experimental laboratory conditions.
Figure 1.
MDOF theoretical shear model, with explicitly defined mass, stiffness and damping values, and additional flexibility of the model base such as imperfection of boundary conditions or shaking table in experimental laboratory conditions.
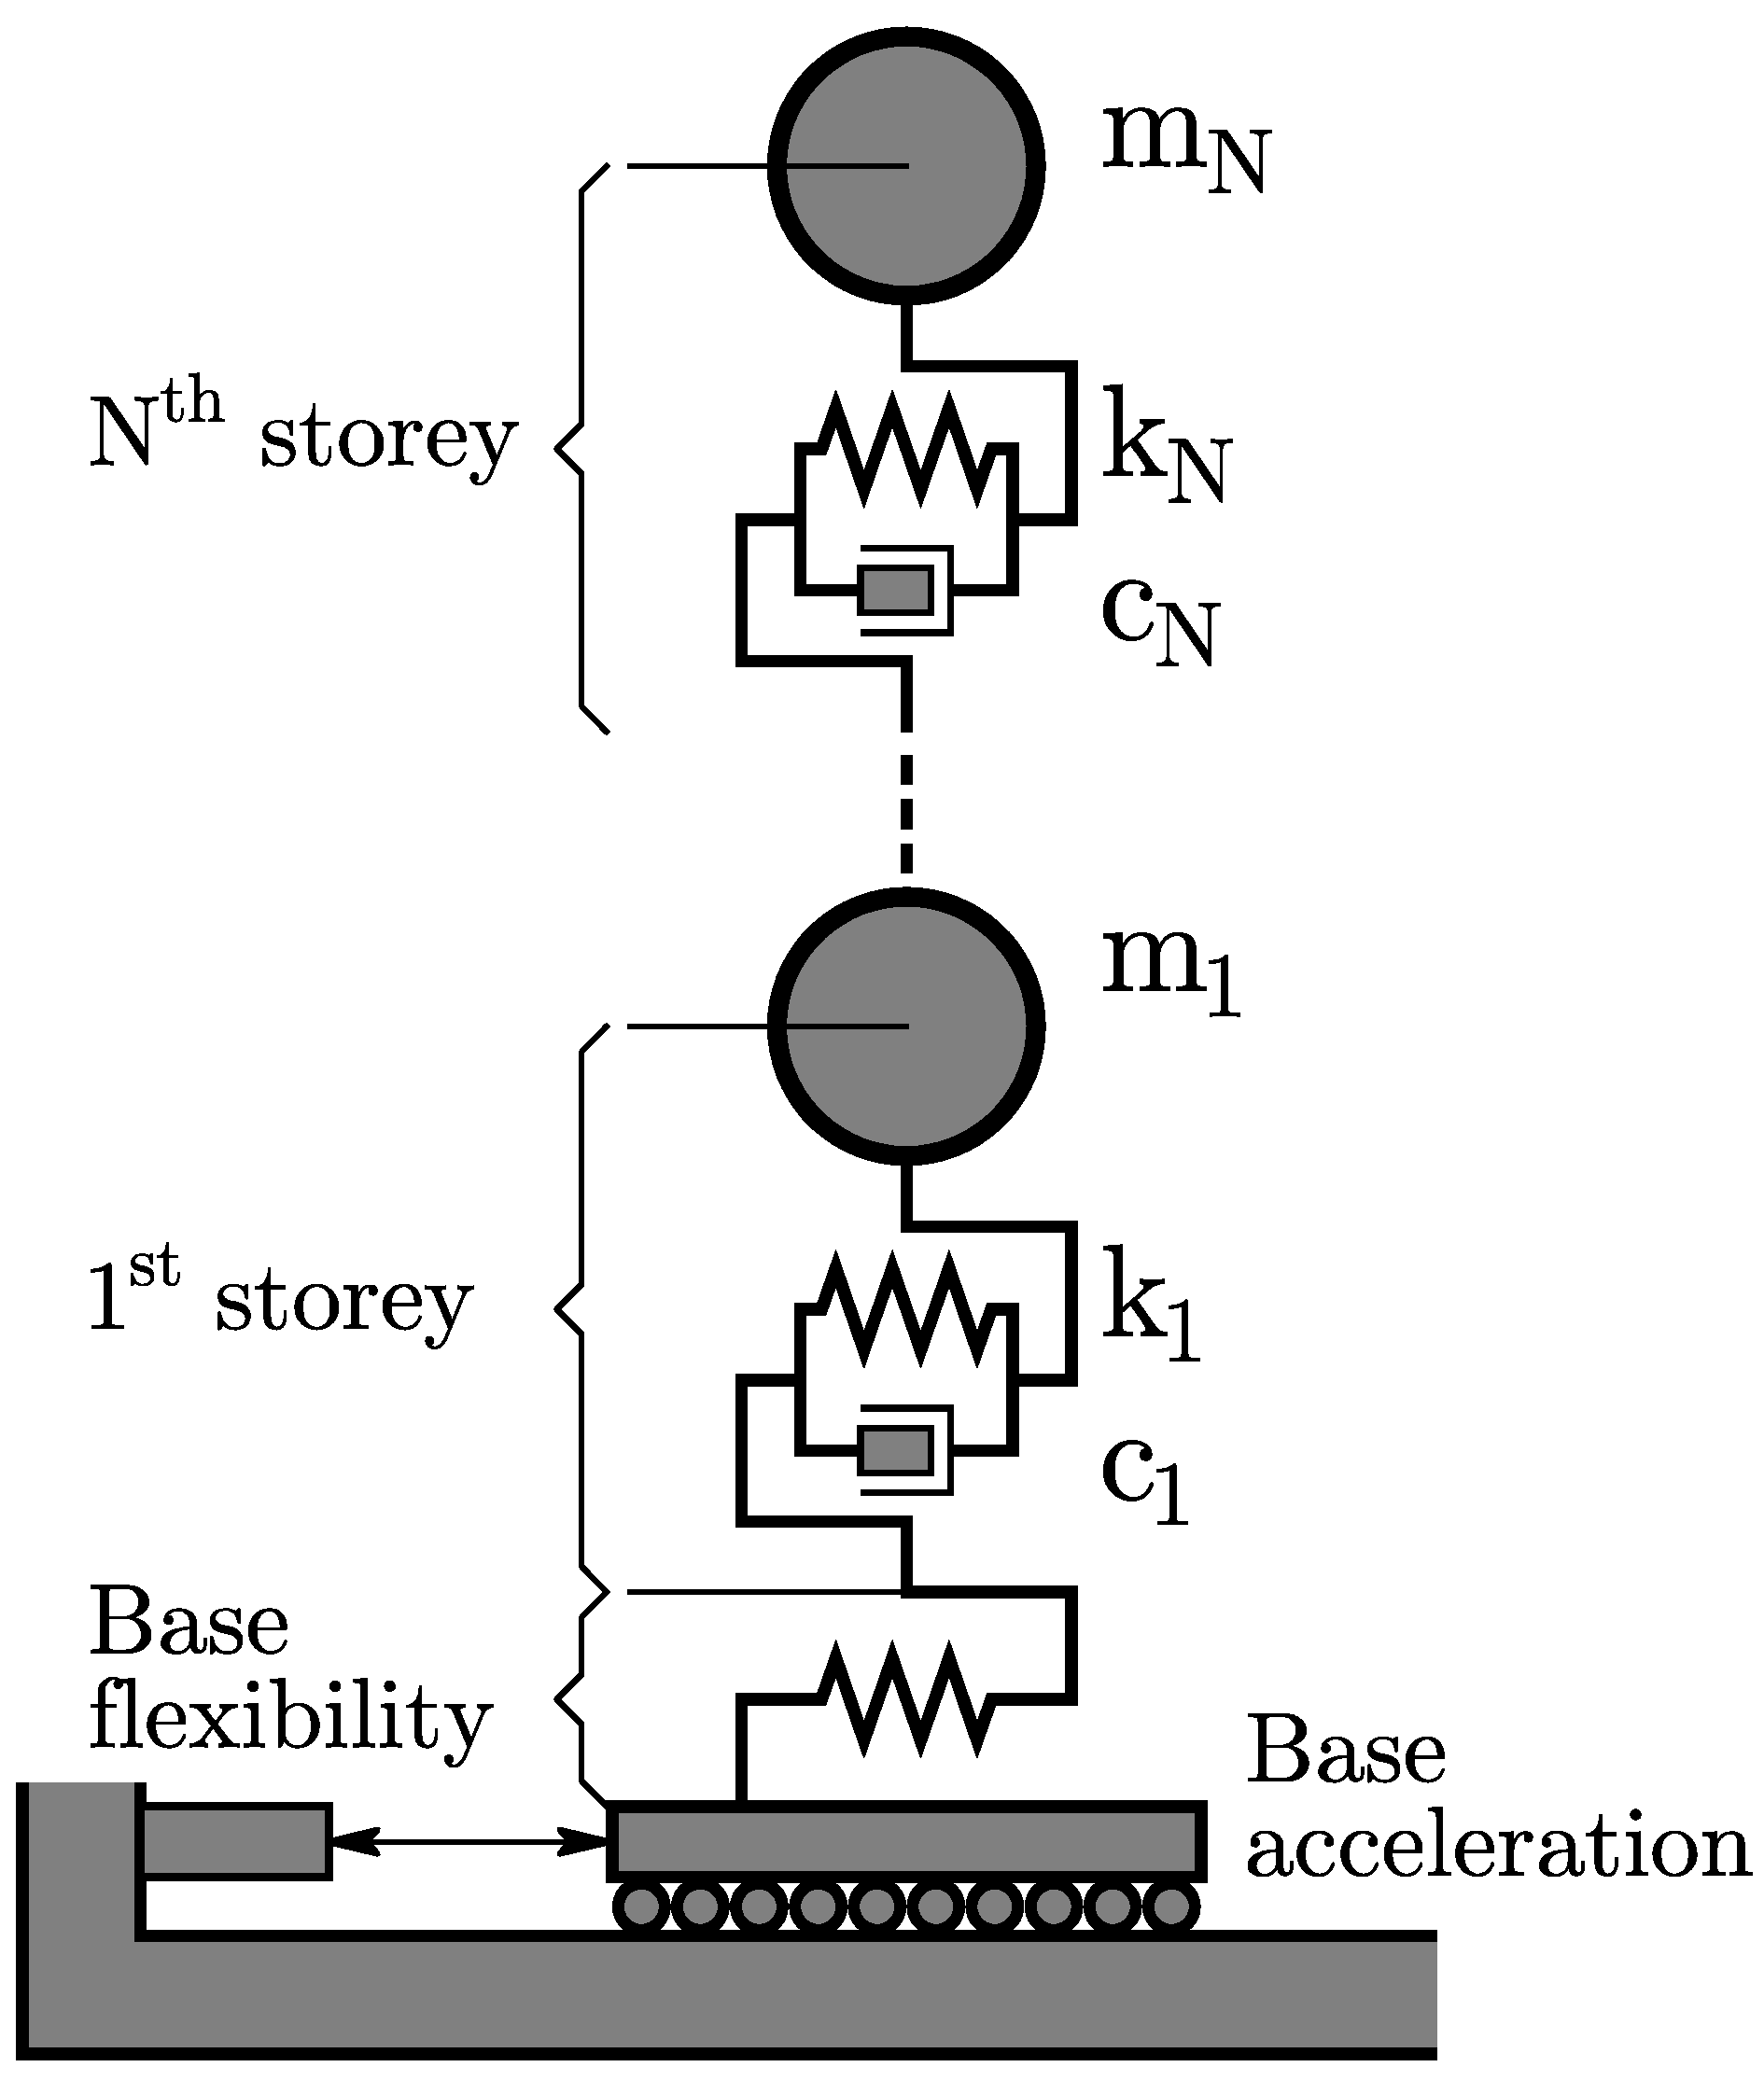
Figure 2.
Acceleration response spectra for 2% viscous damping, for 50 earthquake records compared to the target Eurocode 8 (EN 1998-1:2024) spectrum, Type 1, Soil C, g, , , corresponding to the local conditions of the city of Osijek, Croatia.
Figure 2.
Acceleration response spectra for 2% viscous damping, for 50 earthquake records compared to the target Eurocode 8 (EN 1998-1:2024) spectrum, Type 1, Soil C, g, , , corresponding to the local conditions of the city of Osijek, Croatia.
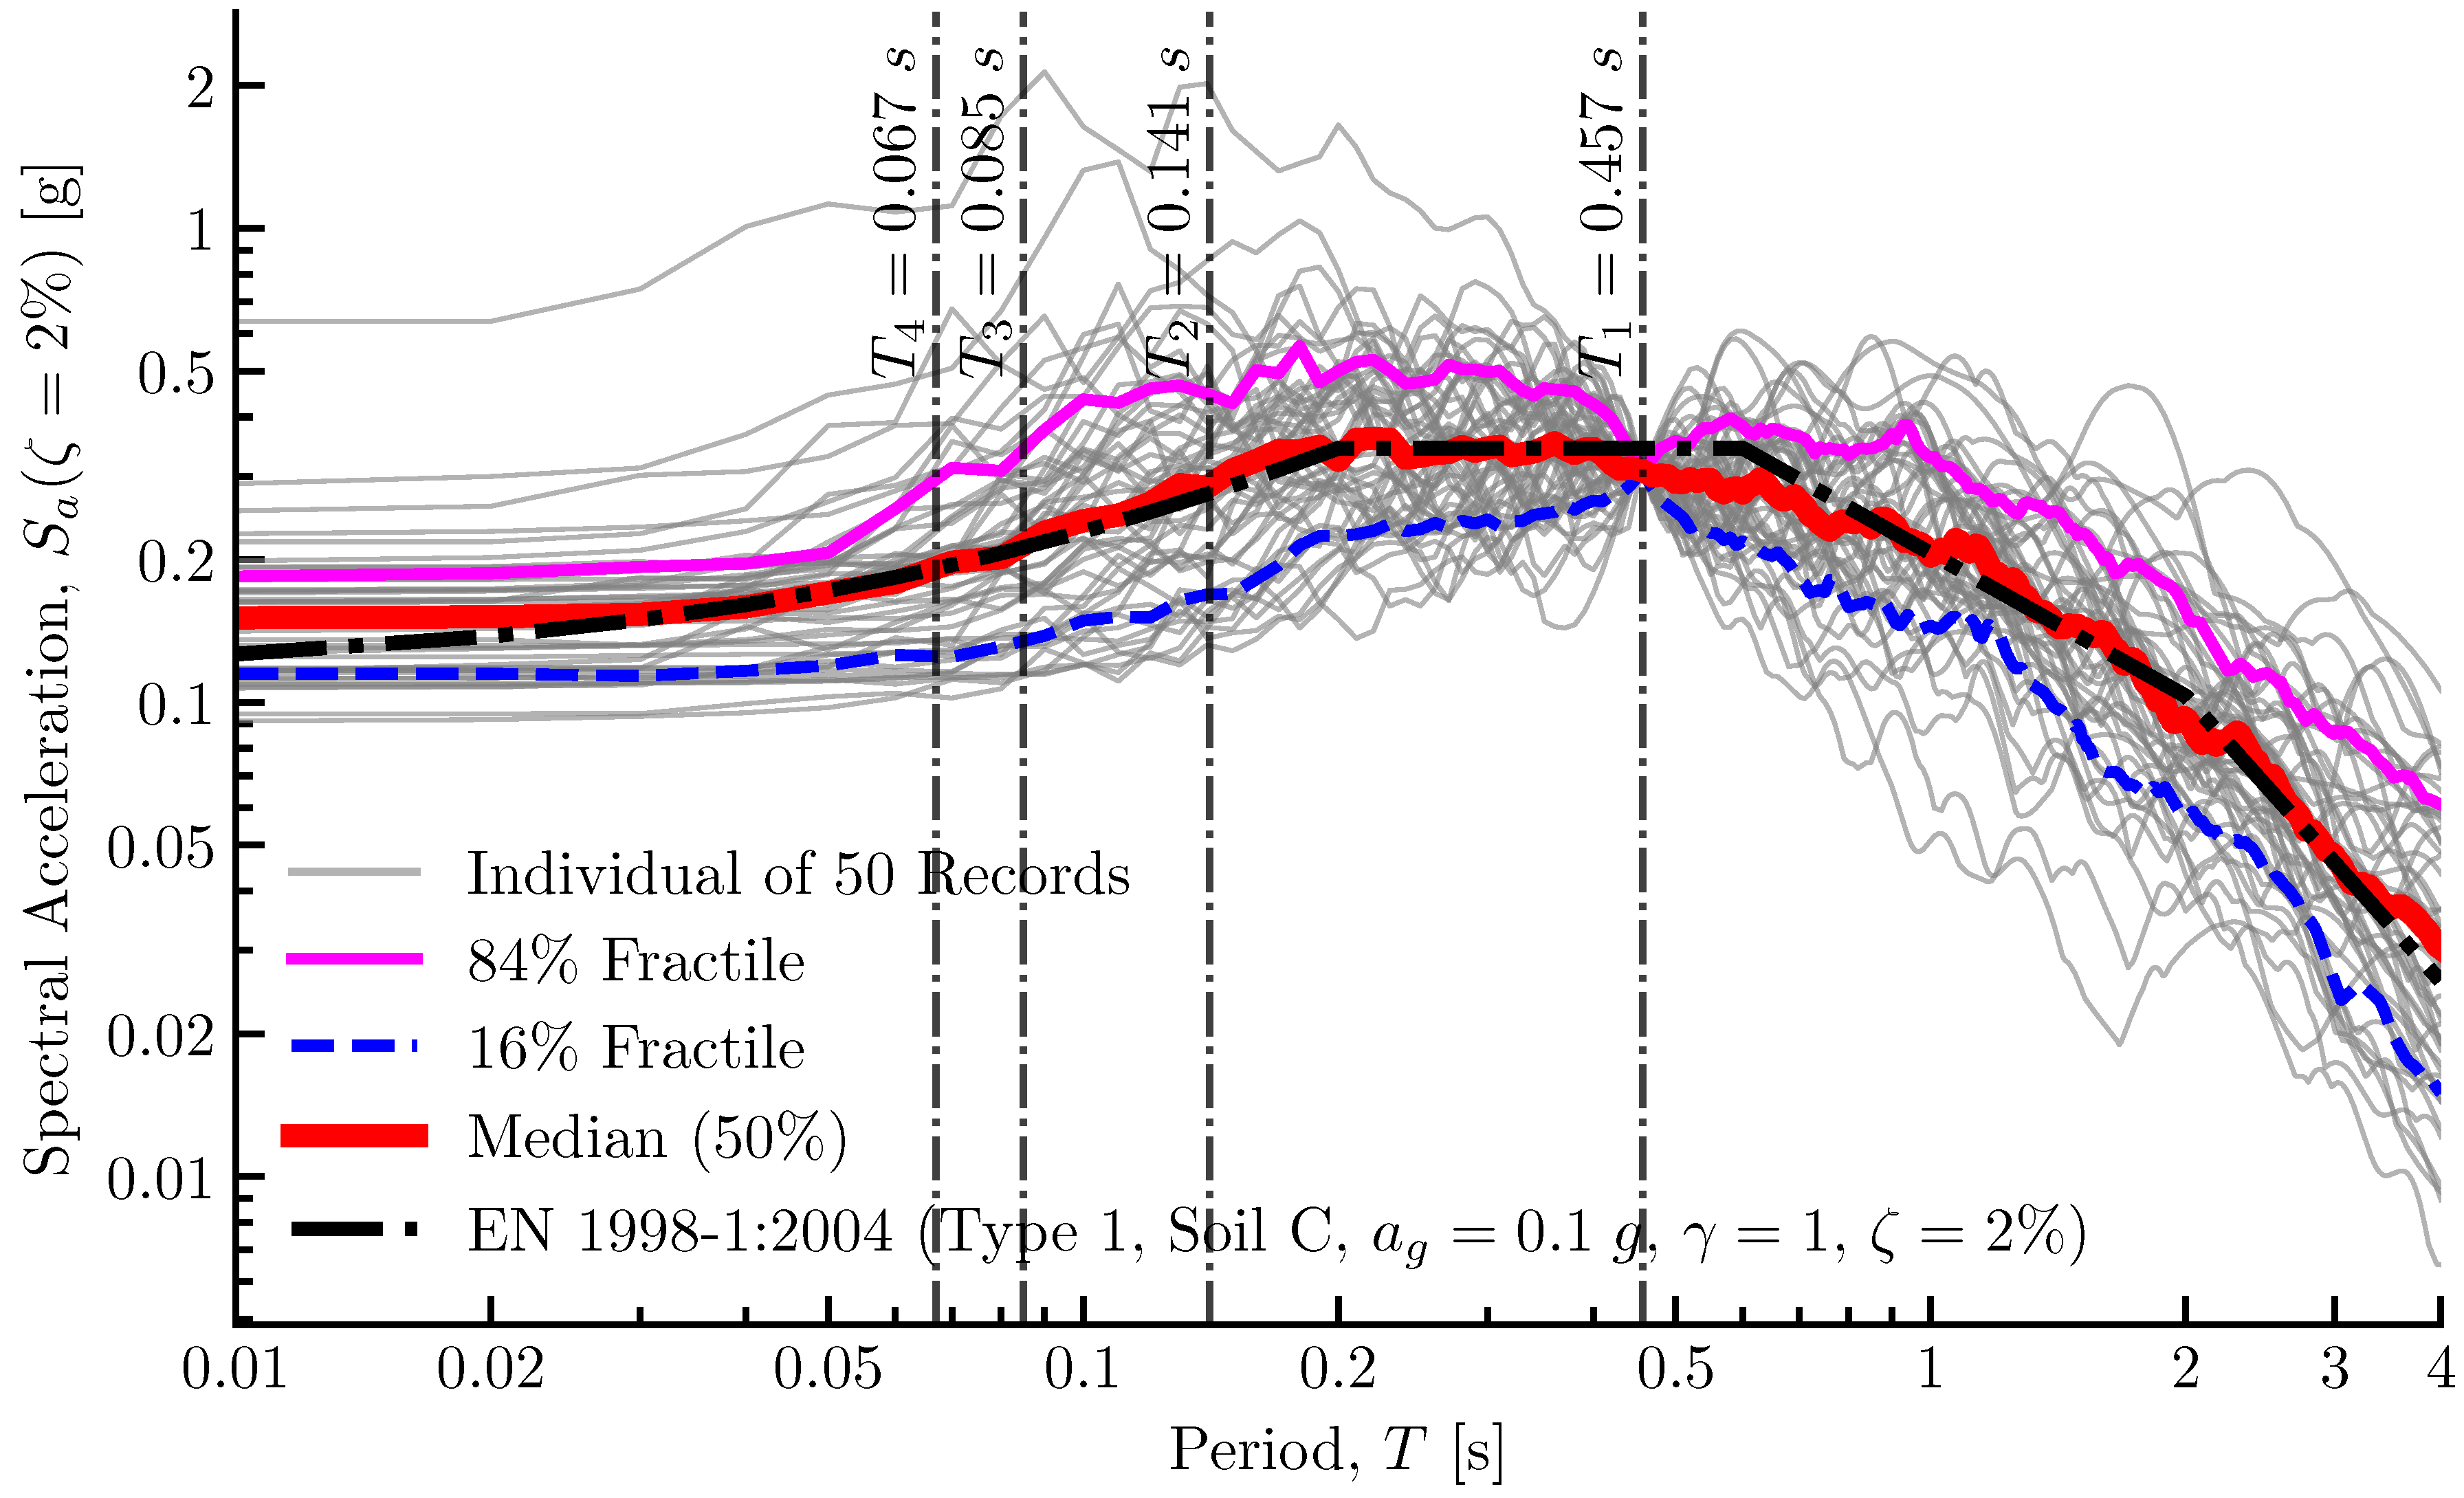
Figure 3.
Histograms of model response in the form of displacements expressed in millimeters, for each floor separately, with their corresponding arithmetic means, median values and Kernel Density Estimation (KDE) curves.
Figure 3.
Histograms of model response in the form of displacements expressed in millimeters, for each floor separately, with their corresponding arithmetic means, median values and Kernel Density Estimation (KDE) curves.
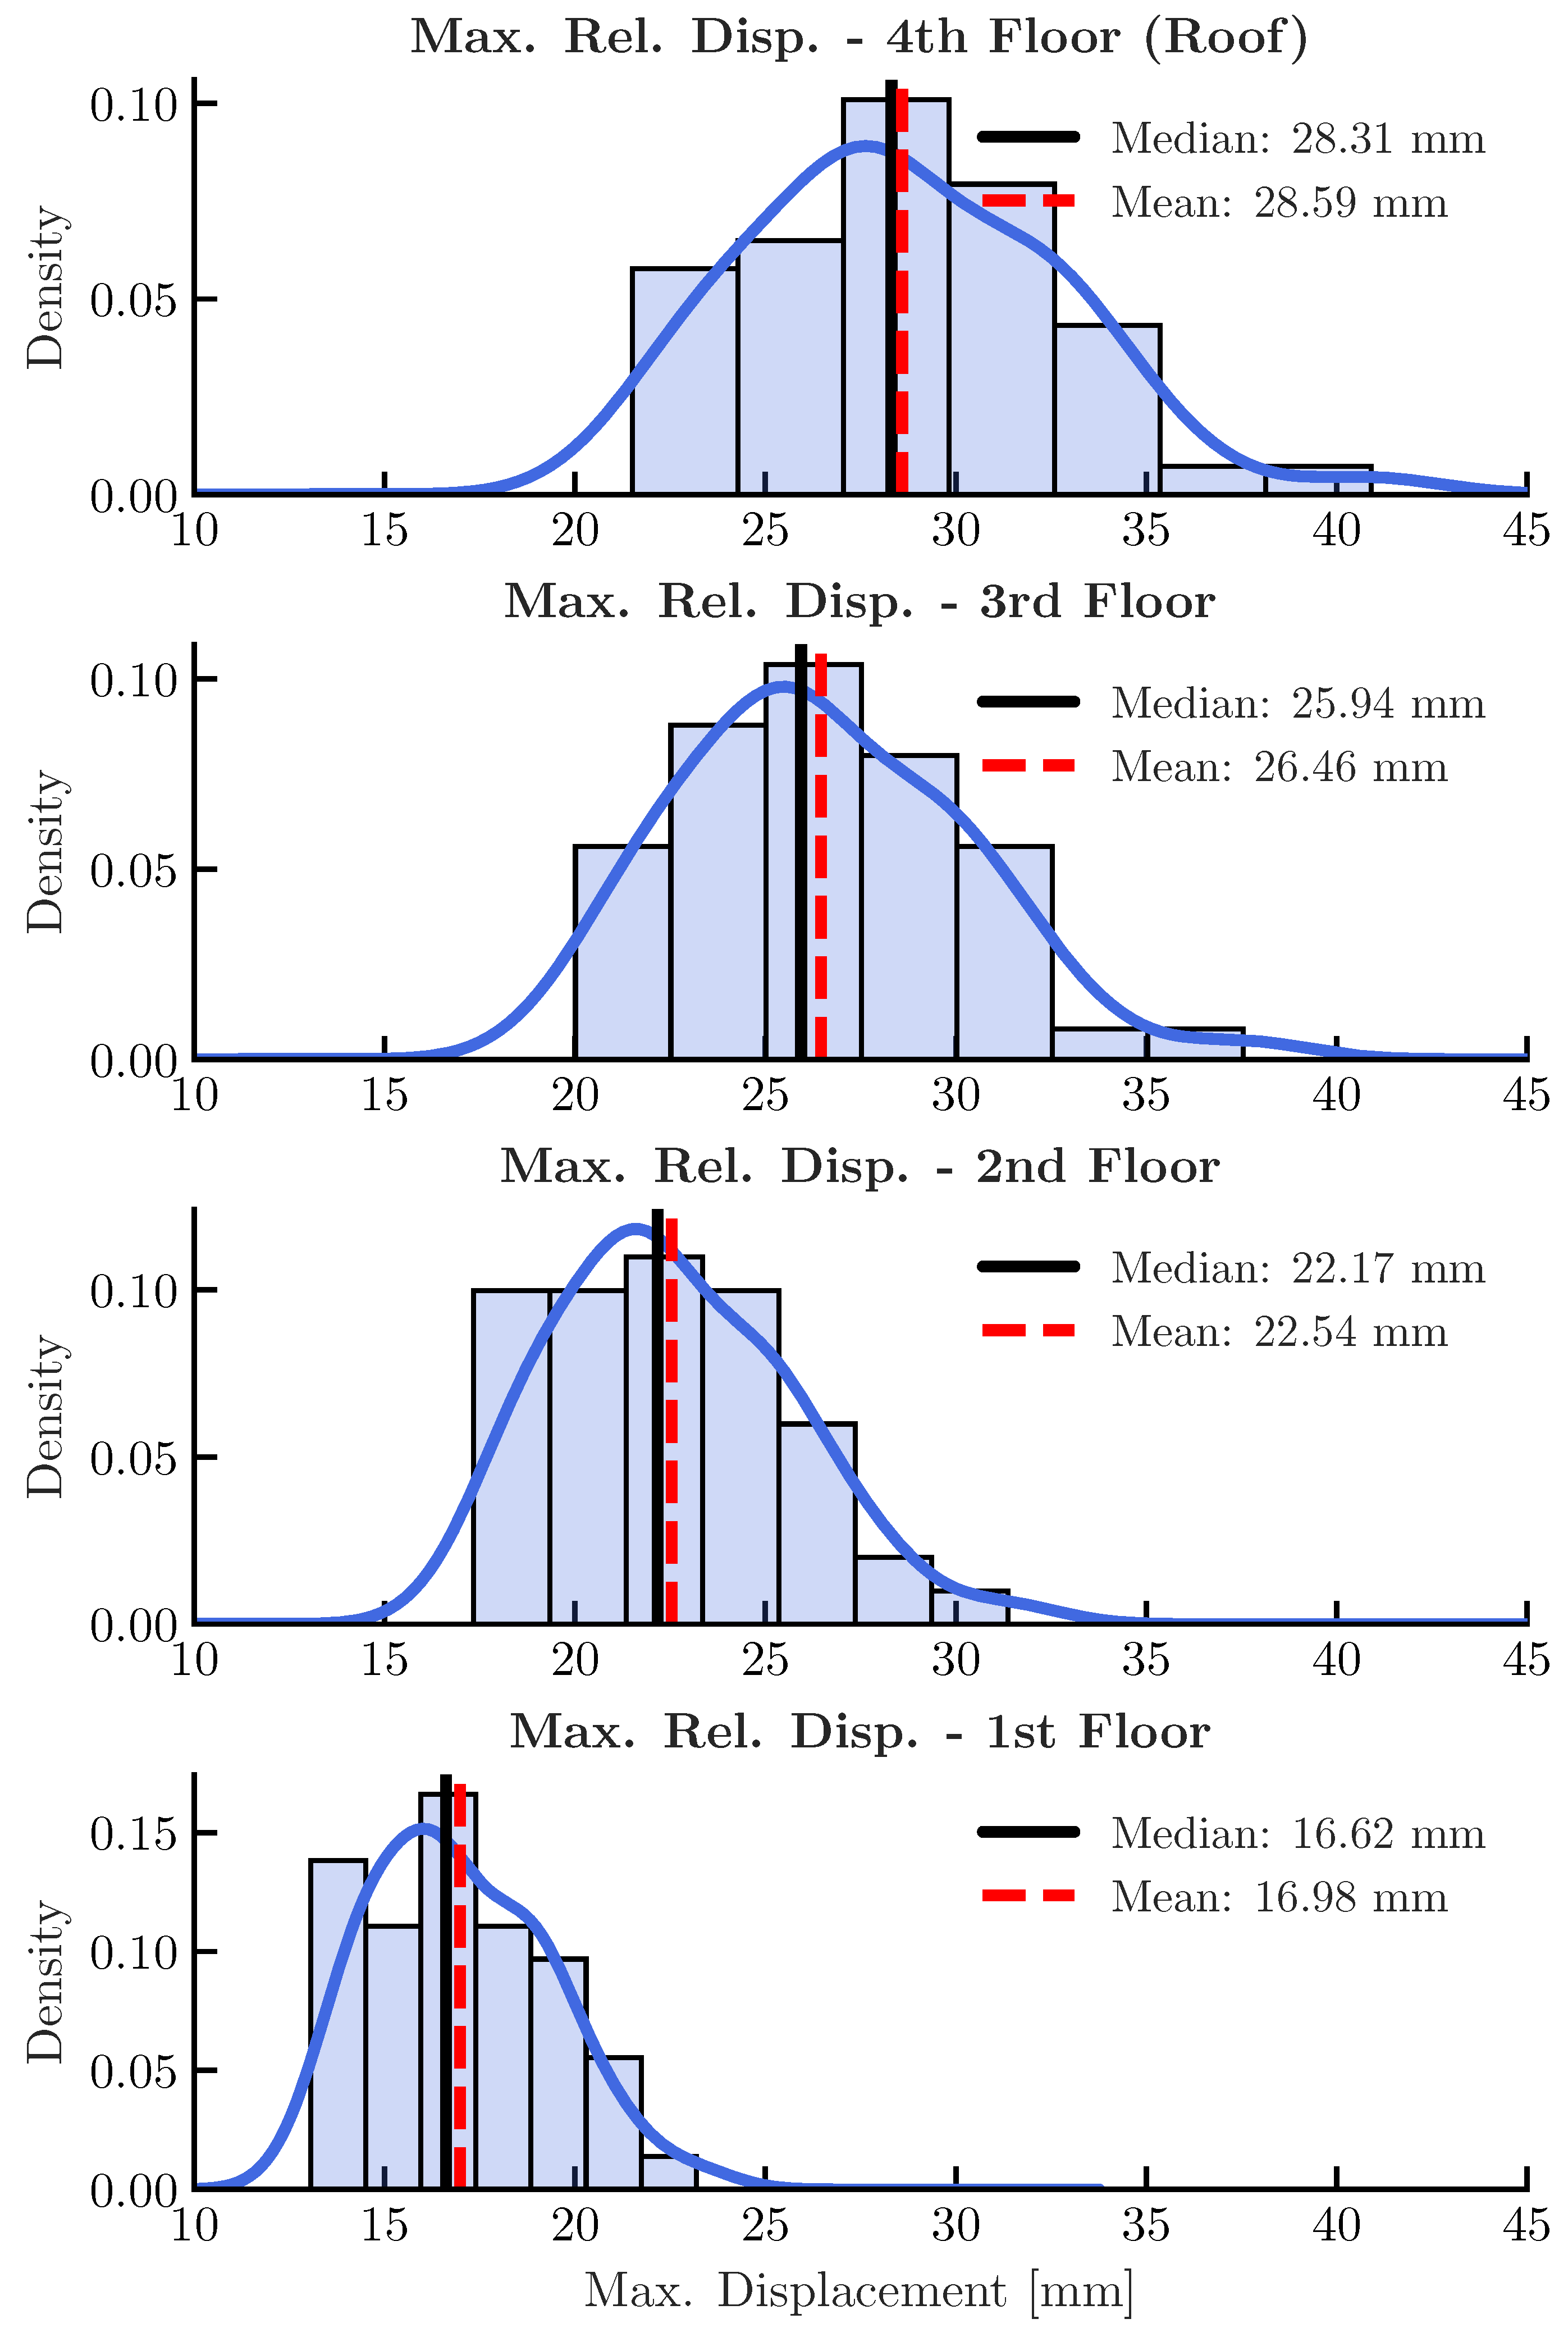
Figure 4.
Box-plot diagrams of the model response for all displacements [mm], velocities [m/s] and accelerations [mm/s2], for each floor separately. Displacements are expressed as maximum absolute values relative to the model base, while velocities and accelerations are expressed as global absolute values. The accelerations (bottom panel) show significantly higher variance, particularly at the roof level. This phenomenon, often referred to as the "whipping effect" in flexible structures, indicates that while displacements are governed by the first mode, floor accelerations are sensitive to higher-mode contributions, resulting in occasional extreme spikes
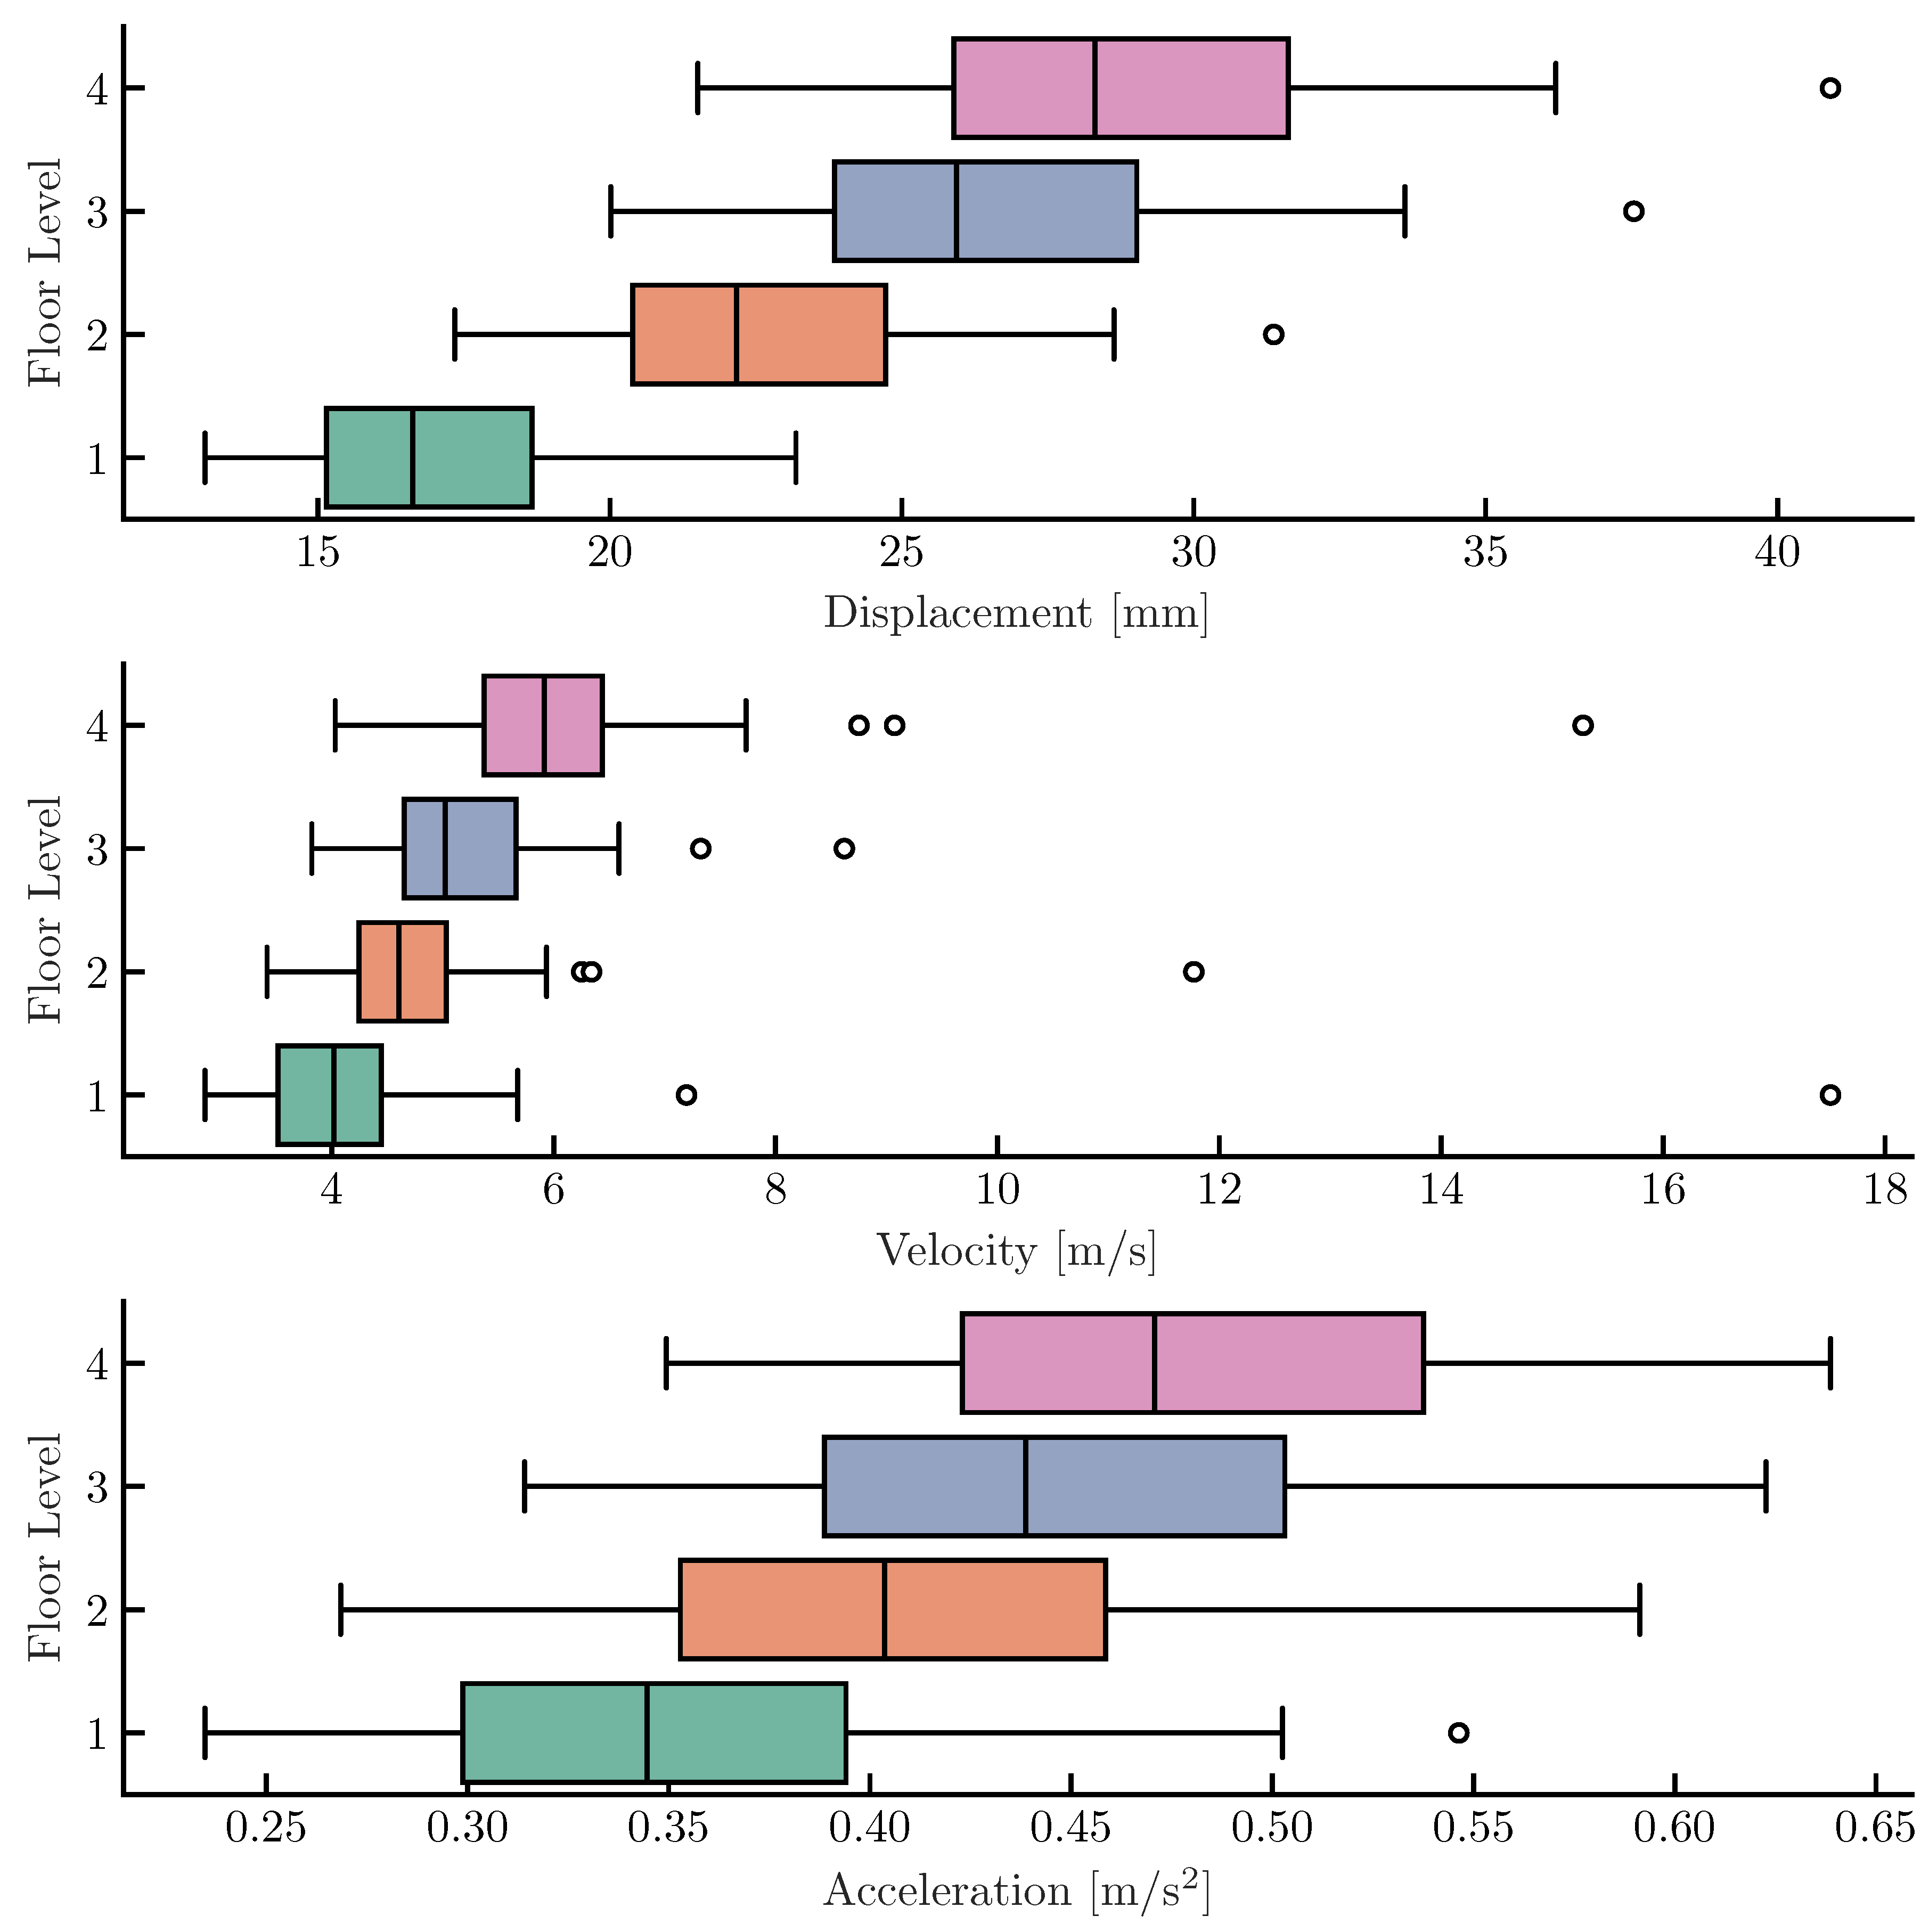
Figure 5.
Vertical profiles of model response dispersions for all displacements [mm], velocities [m/s] and accelerations [mm/s2], for each floor separately by model height.
Figure 5.
Vertical profiles of model response dispersions for all displacements [mm], velocities [m/s] and accelerations [mm/s2], for each floor separately by model height.
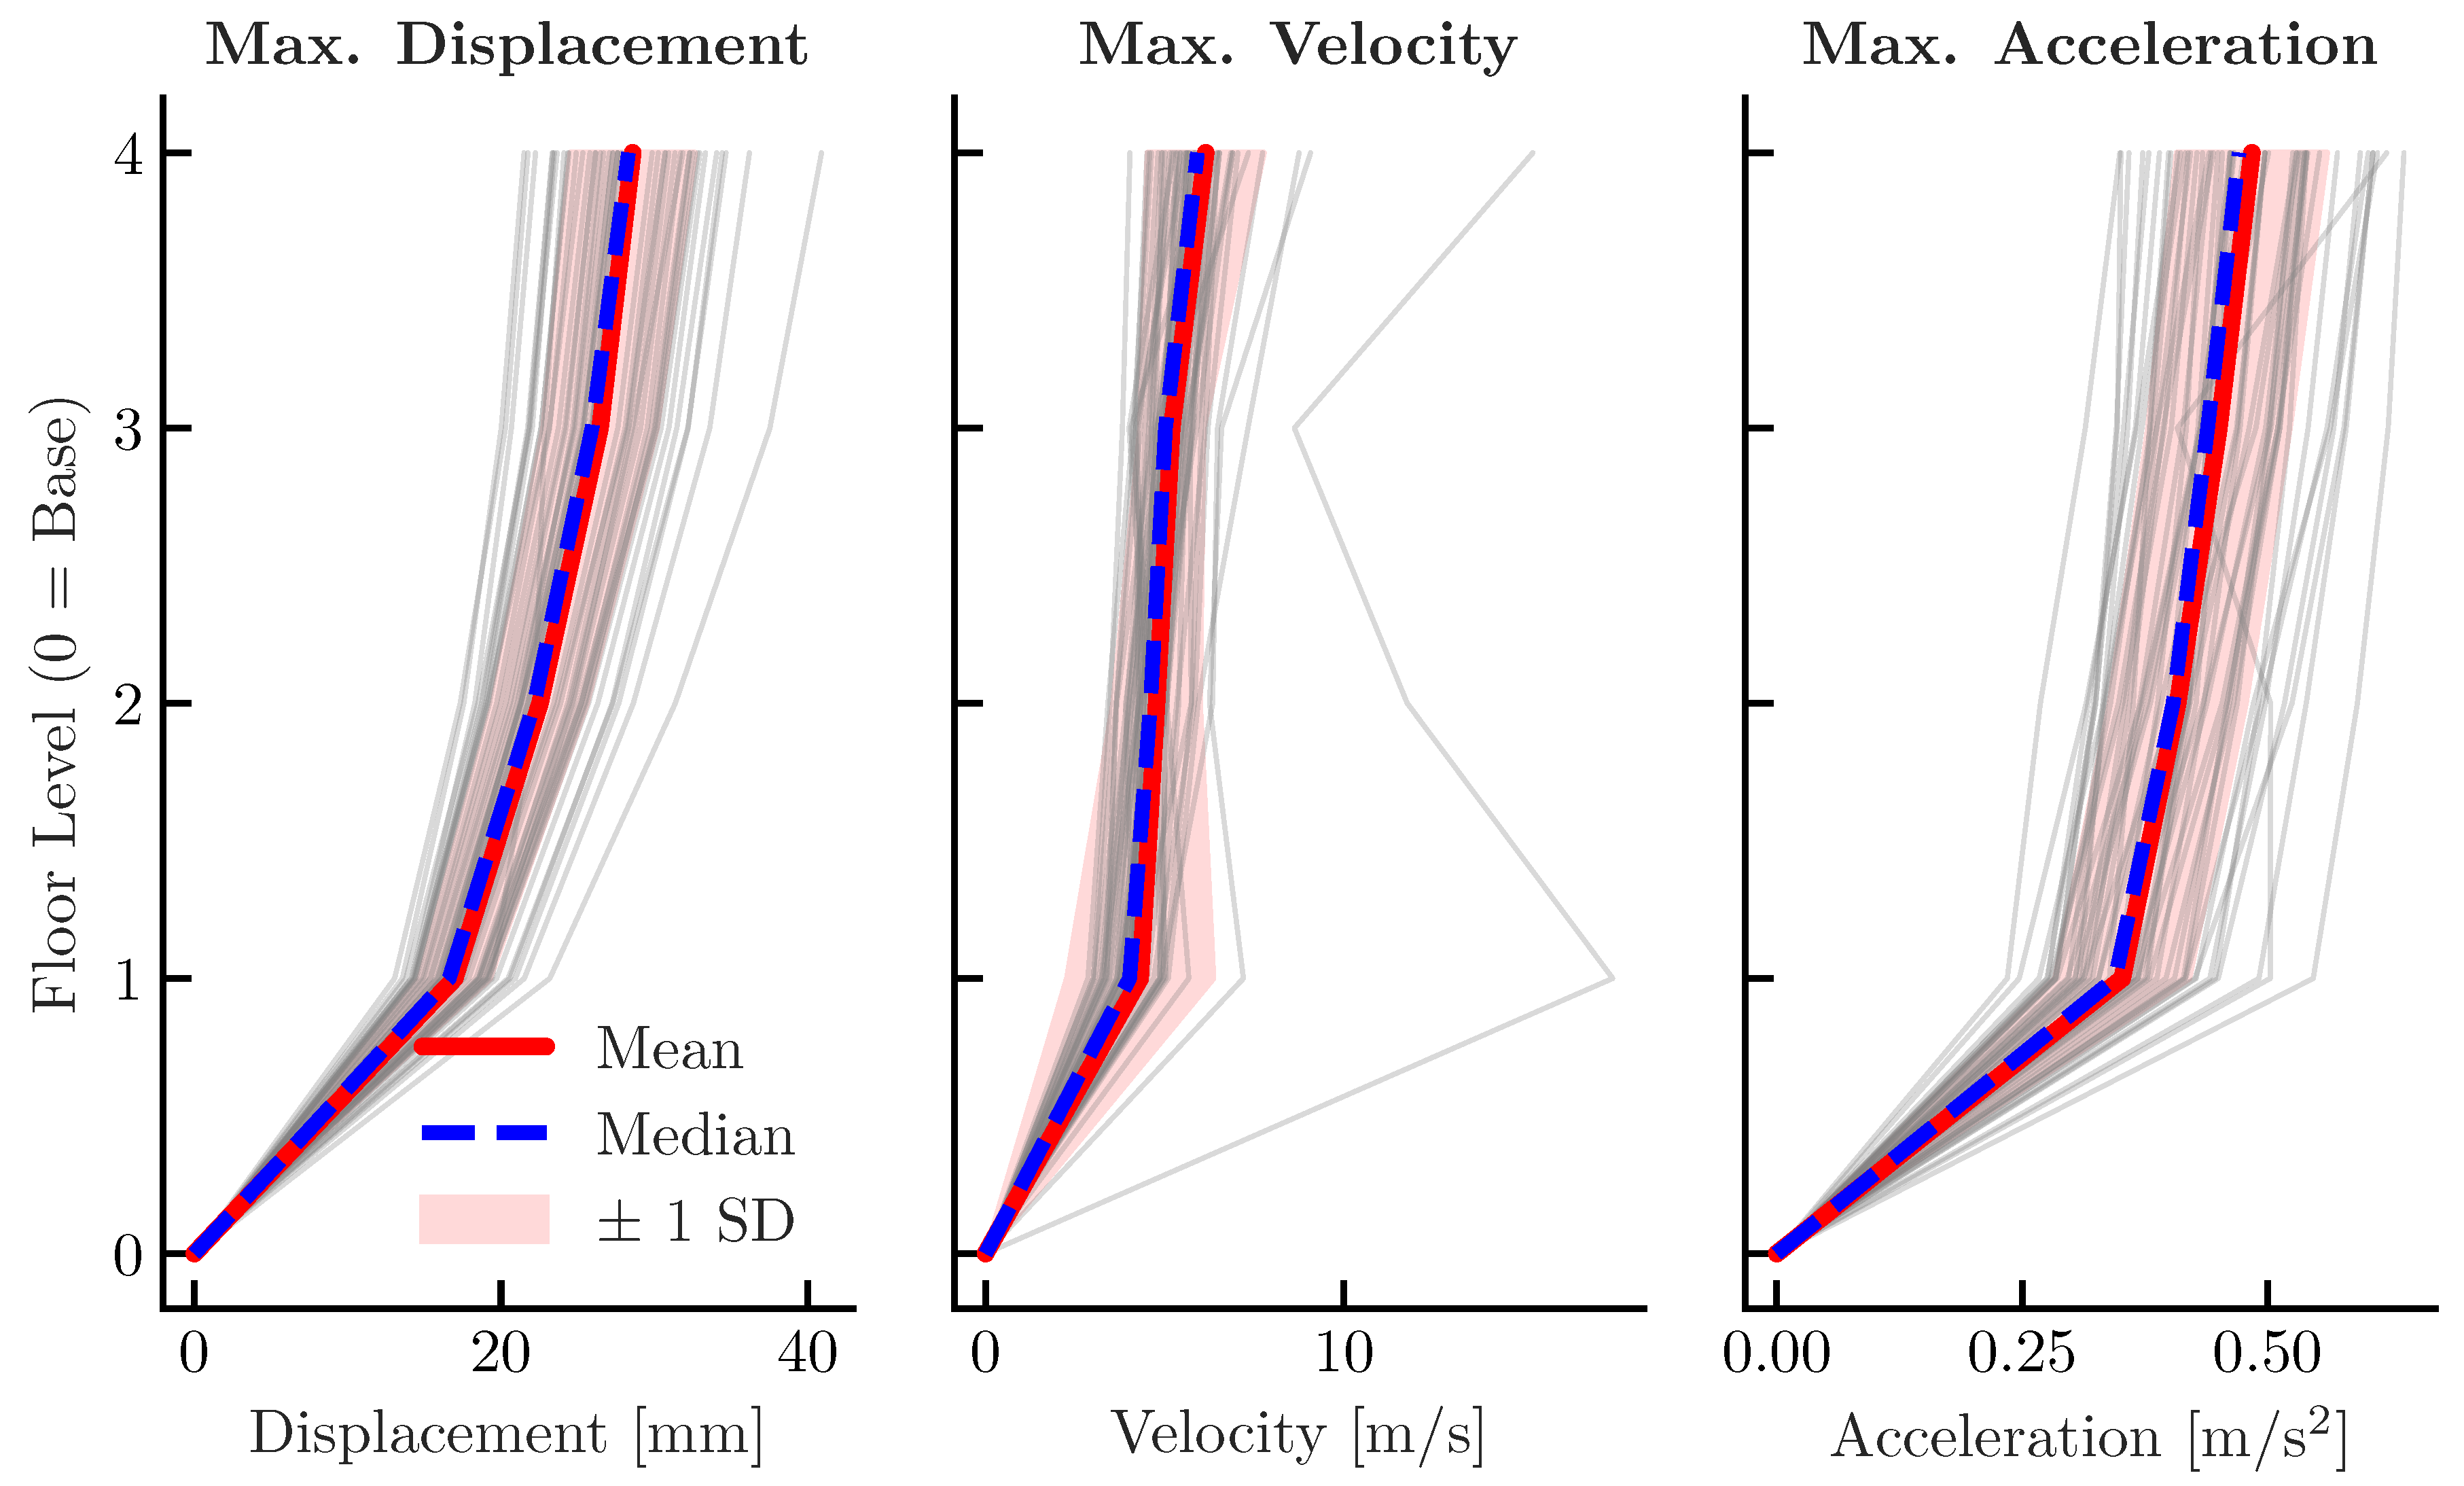
Figure 6.
Correlation plot shown by point cloud and regression lines, which compares the interdependencies of displacement and acceleration for each floor with a separate color.
Figure 6.
Correlation plot shown by point cloud and regression lines, which compares the interdependencies of displacement and acceleration for each floor with a separate color.
Disclaimer/Publisher’s Note: The statements, opinions and data contained in all publications are solely those of the individual author(s) and contributor(s) and not of MDPI and/or the editor(s). MDPI and/or the editor(s) disclaim responsibility for any injury to people or property resulting from any ideas, methods, instructions or products referred to in the content. |
© 2025 by the authors. Licensee MDPI, Basel, Switzerland. This article is an open access article distributed under the terms and conditions of the Creative Commons Attribution (CC BY) license (http://creativecommons.org/licenses/by/4.0/).
Copyright: This open access article is published under a Creative Commons CC BY 4.0 license, which permit the free download, distribution, and reuse, provided that the author and preprint are cited in any reuse.


