
Submitted:
08 December 2025
Posted:
09 December 2025
You are already at the latest version
Abstract
This study aims to establish a comprehensive evaluation framework for assessing project feasibility in logistics operations. The primary focus is on developing a set of criteria and assigning weights to each, ensuring a robust decision-making process. The key criteria include Safety & Asset Integrity, Net Present Value (NPV) Efficiency, Operational Supply, Operational Distribution, and Terminal & New Business Flexibility. The research utilizes the Analytic Hierarchy Process (AHP) method to obtain criteria weights. Data were collected through questionnaires filled out by experts, and the geometric mean (GM) was used to consolidate responses. The priority vector was then calculated to determine the relative importance of each criterion. To ensure the validity and consistency of the pairwise comparisons, consistency checks were performed using maximum eigenvalue (λ_max), Consistency Index (CI), and Consistency Ratio (CR). Only matrices with a CR below 0.1 were considered consistent. The results indicate that "Safety & Asset Integrity" is the most critical criterion, with a weight of 38%, followed by "NPV Efficiency" at 22%. Sub-criteria within each aspect were also weighted, revealing the importance of factors such as "Safety" (35%) and "Supply Options" (42%). Experts reviewed and approved the weighting process and evaluation metrics to ensure they aligned with real-world logistics priorities. In conclusion, the study successfully establishes a weighted rubric for logistics project evaluation, validated by expert feedback. This framework provides a structured and consistent approach for decision-makers to assess logistics projects based on multiple criteria, ensuring an informed and balanced evaluation.
Keywords:
logistics
; analytic hierarchy process (AHP)
; criteria weighting
; geometric mean
; project multi-criteria decision-making
1. Introduction
XYZ Company, one of Indonesia's leading companies in the oil and gas sector, is planning a strategic project to transfer part of the demand from the ITJ Fuel Terminal (FT) to the JIGT Fuel Terminal (FT). This project aims to enhance the efficiency and effectiveness of the company's operations in response to the growing market demand. However, despite revenue analysis indicating that the move might not be immediately profitable, XYZ Company acknowledges the importance of considering other factors in decision-making.
Pure revenue analysis is not sufficient to determine the feasibility of the demand transfer project. Therefore, a comprehensive evaluation rubric is needed to assess this project from various perspectives. By using an evaluation rubric that encompasses several key aspects, it is hoped that the decision regarding the project's feasibility can be made more holistically and objectively.
1.1. Research Objectives
This research aims to:
- Develop a fair and comprehensive evaluation rubric to assess the feasibility of the demand transfer project from FT ITJ to JIGT.
- Calculate weights for each evaluation aspect using the Analytical Hierarchy Process (AHP) method.
- Evaluate the project based on five main aspects to determine whether the project is feasible to proceed, not only from a financial perspective but also from operational and strategic viewpoints.
- Provide recommendations based on the evaluation results to support management's decision regarding the continuation of the project.
In this project, the demand to be transferred from FT ITJ to JIGT will be evaluated based on three different scenarios. Each scenario considers various operational and strategic factors to provide a complete picture of the impact of the transfer.
1.2. Aspects for Evaluation
The evaluation rubric includes five main aspects that are considered crucial for assessing the feasibility of this project. These aspects are:
- Safety and Asset Integrity:
- a.
- Safety: Assessing the level of operational safety to be implemented at the new terminal.
- b.
- Asset Integrity: Evaluating the integrity of existing assets and the potential impact of the transfer on asset condition.
- c.
- Reliability: Examining the operational reliability of the terminal in supporting distribution needs.
- d.
- ESG (Environmental, Social, Governance): Considering the environmental, social, and corporate governance impacts.
- 2.
- NPV Efficiency: Evaluating the efficiency of the Net Present Value (NPV) of the project to ensure that the investment provides optimal added value.
- 3.
- Operational Supply:
- a.
- Supply Options (ships, pipelines, and trucks): Assessing various options for fuel supply, including ships, pipelines, and trucks.
- b.
- Port Capacity: Evaluating the port's capacity to handle the transferred volume.
- c.
- Storage Capacity: Assessing the available storage capacity to meet demand requirements.
- 4.
- Operational Distribution:
- a.
- Weighted Distance to Consumers: Measuring the weighted distance from the terminal to end consumers to assess distribution efficiency.
- b.
- Distribution Options (multi-product single destination capability): Evaluating the terminal's ability to handle various products with a single destination.
- 5.
- Terminal Flexibility & New Business:
- a.
- Flexibility of Utilizing Existing Facilities for Current Fuel (backloading, supporting growth, and SHS): Assessing the terminal's flexibility in utilizing existing facilities for current fuel.
- b.
- New Business (potential new business such as bunkering, SAF, petrochemicals, biofuels): Evaluating the potential for new business development that might arise from this project, including bunkering, Sustainable Aviation Fuel (SAF), petrochemicals, and biofuels.
2. Research Methodology
The methodology of this research aims to develop and apply a comprehensive evaluation rubric using the Analytical Hierarchy Process (AHP) method to assess the feasibility of the demand transfer project from the ITJ Fuel Terminal (TBBM) to the JIGT Fuel Terminal (TBBM). This methodology involves several key steps from data collection to analysis and weight calculation. AHP is a method developed by Saaty to address complex decision-making problems by breaking them down into simpler elements and assigning relative weights to each element based on expert preferences (Saaty, 1980).
AHP is a multi-criteria decision-making method used to solve complex decision problems by breaking them down into a hierarchy of criteria and sub-criteria. This method allows for subjective assessments and pairwise comparisons to determine the relative weights of various criteria. AHP is particularly useful for evaluations involving multiple aspects and objectives that are often difficult to measure directly.
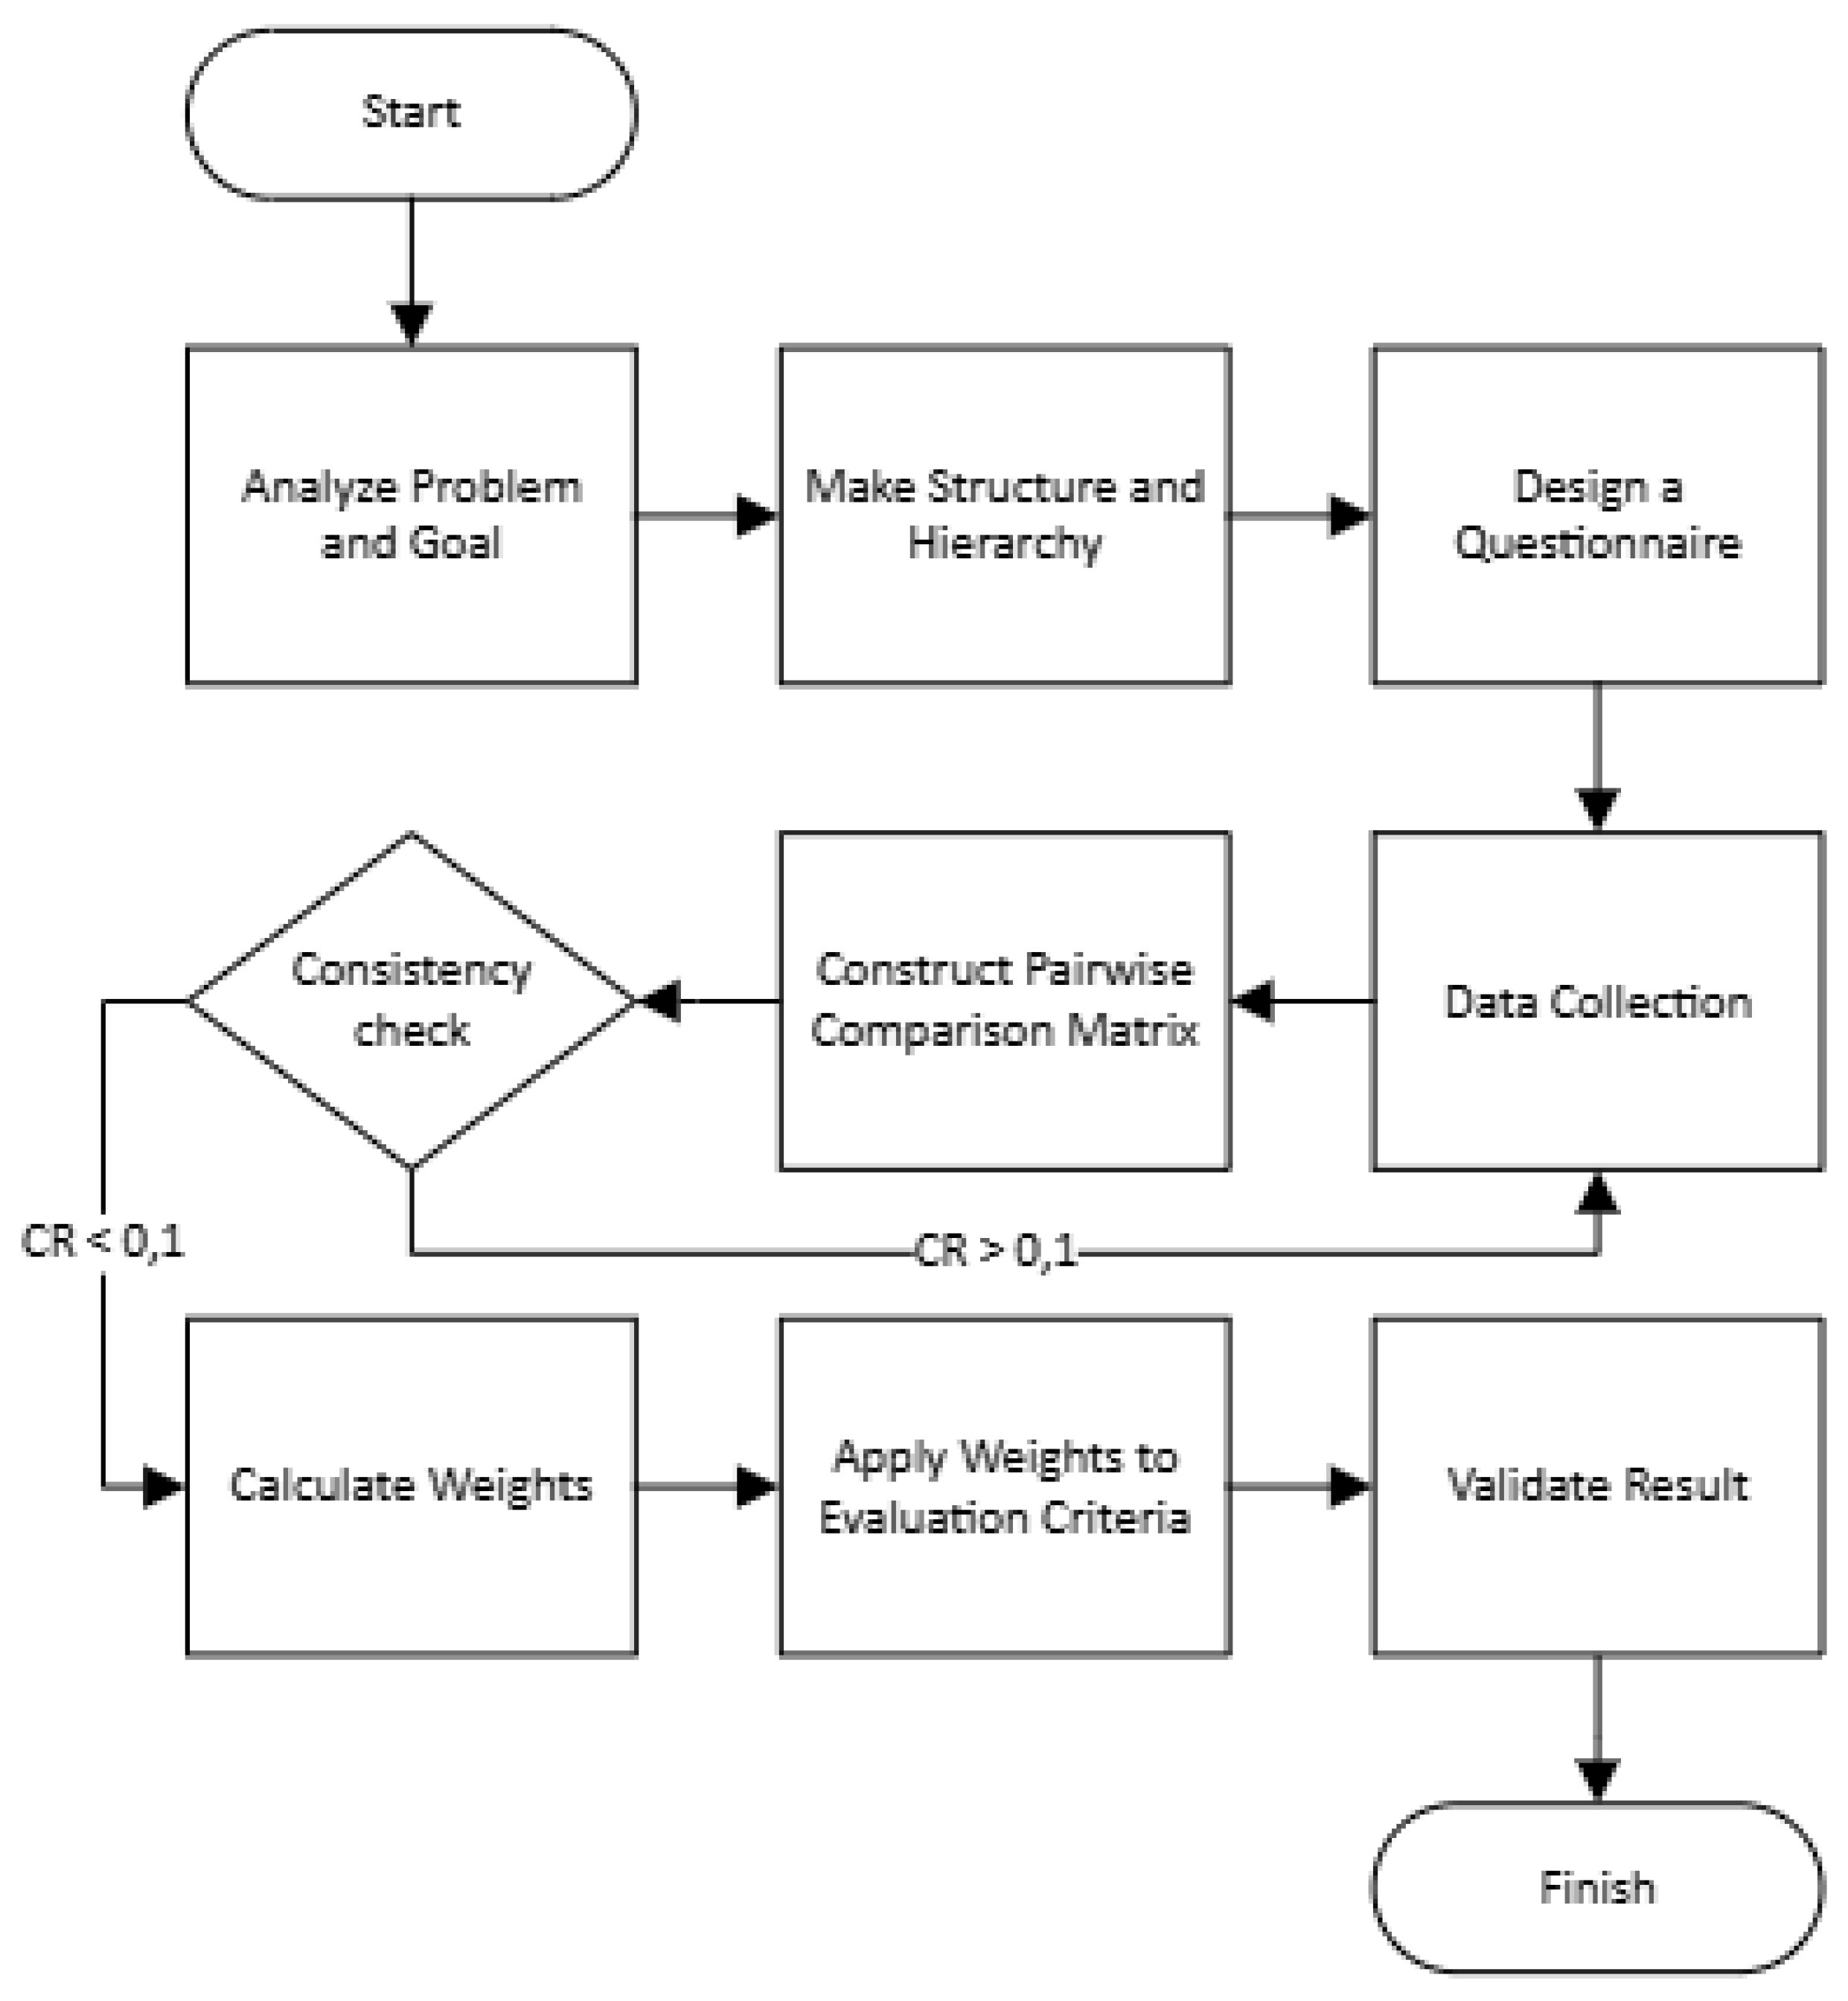
2.1. Flowchart and Research Steps
- Analyze the Problem and Goal: Identify the objectives of this research, which is to evaluate the feasibility of the project based on various aspects.
- Structure the Hierarchy: Organize the hierarchy of relevant criteria and sub-criteria according to the determined aspects.
- Perform Pairwise Comparisons: Conduct pairwise comparisons between criteria and sub-criteria to determine their relative weights.
- Calculate Weights and Consistency: Calculate the relative weights using the comparison matrix and check consistency to ensure the validity of the results.
Figure 1.
Flowchart Research.
2.2. Data Collection
The questionnaire sampling uses proportional random sampling, which considers the proportion of each stakeholder. Since proportional random sampling was used, the number of respondents in the AHP method does not have a fixed formula, but there is a minimum limit of two respondents (Saaty, 1993). According to Melillo & Pecchia (2016), an appropriate sample size for AHP analysis ranges from 19 to 400 respondents. To obtain the necessary data for AHP calculations, 19 top management members at PT XYZ were selected as respondents. They possess in-depth knowledge and experience regarding the project and the evaluated aspects, allowing them to provide accurate and relevant assessments.
The questionnaire was designed to collect data on pairwise comparisons for each criterion and sub-criterion. It included questions requiring respondents to compare the importance of one criterion against another and one sub-criterion against another. Data was collected through questionnaires distributed to top management members, either directly or via online platforms to facilitate participation. After collecting the questionnaires, the data was analyzed to compute weights and check consistency.
2.3. Analysis of AHP
The pairwise comparison matrix was constructed based on data collected from the questionnaires and calculated using the Geometric Mean method. In the context of AHP, the Geometric Mean (GM) is used to consolidate results from pairwise comparisons performed by various experts, effectively integrating different opinions (Saaty & Vargas, 2001). Each element in the matrix represents the relative comparison between two criteria or sub-criteria. The rating scale used for pairwise comparisons follows a scale from 1 to 9, where these values indicate the level of relative preference. Matrix normalization is crucial to ensure that the resulting criterion weights are proportional and can be compared directly (Saaty, 1994). Weights for each criterion and sub-criterion were calculated using the eigenvalue method from the comparison matrix. This process involves computing eigenvalues and eigenvectors to determine the relative weights of each element in the hierarchy.The consistency of the pairwise comparisons was checked by calculating the Consistency Index (CI) and Consistency Ratio (CR). This ensures that the assessments provided by respondents are consistent and acceptable. A Consistency Ratio greater than 0.1 indicates inconsistency that needs to be corrected.
2.4. Evaluation of Weights to Evaluation Criteria
To ensure that the pairwise comparison matrix is consistent, it is necessary to perform a consistency check by calculating the Consistency Index (CI) and Consistency Ratio (CR) (Forman & Gass, 2001). The calculated weights are applied to each aspect and sub-aspect of the evaluation to assess the project's feasibility. Each aspect is evaluated based on the given weights, and the evaluation results are used to determine the project's overall feasibility. The research results will then be validated with feedback from respondents and experts to ensure accuracy and relevance. Data reliability will also be checked by performing consistency analysis and internal validation. Consistent and repeatable results indicate that the collected data and methods used are reliable.
3. Data Processing
After the questionnaire data is collected, the next step is to use the geometric mean (GM) to consolidate the results from the filled questionnaires and calculate the criteria weights more accurately, integrating the results from the pairwise comparisons performed in the AHP process. The formula used to calculate the GM is:
Ex. :
GM = Geometric Mean
= Expert 1
= Expert 2
= Expert n
Table 1 shows the GM results obtained from the calculations using the above formula.
The next step is to arrange the GM results into a weight matrix. This weight matrix is then normalized by dividing each element by the total sum of all elements to obtain the relative weight of each criterion, as shown in Table 2 and Table 3. After normalizing the weight matrix, the subsequent stage is to calculate the consistency of the matrix to ensure that the pairwise comparisons are consistent. This process involves calculating the Maximum Eigenvalue (λ_max), Consistency Index (CI), and Consistency Ratio (CR) using the following formulas:
- Maximum Eigenvalue (λ_max) is calculated using:
Ex. :
= Element of the normalized weight matrix
= Average weight value
= Number of criteria
2. Consistency Index (CI) is calculated using:
Ex. :
= Maximum Eigenvalue
= Number of criteria
3. Consistency Ratio (CR) is calculated using:
Ex. :
= Random Index depending on the number of criteria
Note that if the Consistency Ratio (CR) is less than 0.1, then the pairwise comparison matrix can be considered consistent. Conversely, if CR is greater than 0.1, the comparison matrix needs to be revised to improve consistency.
After normalizing the weight matrix, the results are as follows:
- -
- Maximum Eigenvalue (λ_max) = 5.123
- -
- Consistency Index (CI) = 0.031
- -
- Consistency Ratio (CR) = 0.027
Since the Consistency Ratio (CR) is below 0.1 (or 10%), the pairwise comparison matrix can be considered consistent. Thus, the comparisons used in the decision-making process are acceptable without requiring further revision. The next step is to calculate the priority vector, which aims to determine the weights or relative importance of each criterion used in the analysis. The priority vector is calculated by summing the values in each row of the normalized matrix and then dividing by the total number of rows to obtain the average value for each criterion. These priority weights represent the importance of each criterion in the decision-making context, as shown in Table 4.
3.1. Data Processing in Python
- 1.
- Importing Data
-Use Python libraries such as pandas to import the pairwise comparison matrix and weights calculated in Excel.
Python code:
import pandas as pd
# Load data from Excel
df = pd.read_excel('pairwise_comparison_matrix.xlsx', sheet_name='Sheet1')
- 2.
- Calculation of Eigenvalues and Eigenvectors
-Use NumPy or SciPy libraries to compute the eigenvalues and eigenvectors of the pairwise comparison matrix.
Python code:
import numpy as np
# Convert DataFrame to NumPy array
matrix = df.values
# Calculate eigenvalues and eigenvectors
eigenvalues, eigenvectors = np.linalg.eig(matrix)
-Calculate the Maximum Eigenvalue to determine the priority weights.
Python code:
# Find the maximum eigenvalue
lambda_max = max(eigenvalues)
- 3.
- Consistency Check
-Identify the largest eigenvalue used to calculate the Consistency Index (CI).
Python code:
# Number of criteria
n = len(matrix)
# Calculate Consistency Index
CI = (lambda_max - n) / (n - 1)
-Compare the CI with the Random Consistency Index (RI) to get the CR. RI values are pre-determined based on matrix size.
Python code:
# Random Consistency Index (RI) for a matrix of size n
RI_values = {1: 0.0, 2: 0.0, 3: 0.58, 4: 0.90, 5: 1.12} # Example RI values
RI = RI_values[n]
# Calculate Consistency Ratio
CR = CI / RI
-Ensure that the CR is less than or equal to 0.1. If the CR exceeds this threshold, reassess the pairwise comparisons.
- 4.
- Final Calculation and Reporting
-Gather the final weights and consistency results. Prepare data for reporting and decision-making.
Python code:
# Prepare final results
weights = eigenvectors[:, eigenvalues.argmax()]
weights = weights / weights.sum() # Normalize weights
-Save the results into a file for inclusion in the final report.
Python code:
# Save results to Excel
pd.DataFrame(weights, columns=['Weights']).to_excel('final_weights.xlsx', index=False)
4. Result and Discussion
After obtaining the priority vector, these values are used in evaluating the existing metrics, where each metric will be assessed based on the established criteria weights, as shown in Table 5.
The criteria weights derived from the priority vector highlight the relative importance of each aspect in evaluating the project feasibility. The criterion weights obtained through AHP reflect the relative importance of each aspect in project evaluation, enabling a more comprehensive and data-driven assessment (Triantaphyllou & Khamooshi, 1996). The "Safety & Asset Integrity" aspect holds the highest weight at 38%, indicating its critical importance in the overall evaluation. The "Operational Supply" and "Operational Distribution" sub-aspects also play significant roles, with weights of 15% and 13% respectively, underscoring their relevance in the project's assessment. The "Terminal & New Business Flexibility" aspect, while important, has a comparatively lower weight of 12%, reflecting its lesser impact relative to other criteria.
In the "Safety & Asset Integrity" sub-aspects, "Safety" and "Asset Integrity" have substantial weights of 35% and 34%, respectively, which emphasizes the importance of these factors in ensuring project success. Conversely, "Reliability" and "ESG" have lower weights but still contribute to the overall evaluation, with weights of 20% and 11%. For "Operational Supply," the "Supply Options" sub-aspect is prioritized with a weight of 42%, indicating its primary importance over "Port Capacity" and "Storage Capacity," which have weights of 31% and 28%, respectively.
In the "Operational Distribution" sub-aspects, "Distance" is given a higher weight of 51%, reflecting its critical role in logistics planning, compared to "Distribution Options" with a weight of 49%. Lastly, in the "Terminal & New Business Flexibility" sub-aspects, "New Business Potential" is valued more highly with a weight of 58% compared to "Terminal Flexibility" at 42%, demonstrating the significant role of new business opportunities in evaluating the project's feasibility. Overall, the results underscore the critical factors and their relative importance in evaluating the feasibility of the project, and guiding decision-making processes effectively. AHP has proven to be a valuable tool in project evaluation by providing relative weights for various criteria, thus assisting in more structured and objective decision-making (Kumar & Thakur, 2014)
These points and criteria weights have received feedback from experts and have been approved for use in developing the assessment rubric. The expert validation ensures that the criteria accurately represent the key aspects of the project evaluation, allowing for a more reliable and robust weighting process in the decision-making framework. Expert validation is crucial in the AHP process as it ensures that the criteria and weights set reflect expert consensus and practical relevance in the project context (Ranganathan & Hashemi, 2010). This consensus among experts strengthens the validity of the prioritization and provides a solid foundation for the evaluation process.
References
- Forman, E. H., & Gass, S. I. (2001). The Analytic Hierarchy Process: An Overview of Applications. Applications of Management Science, 1, 1-25. [CrossRef]
- Kumar, S., & Thakur, M. (2014). Application of Analytic Hierarchy Process (AHP) in Evaluating Performance of Companies. International Journal of Business and Management, 9(8), 79-88.
- Ranganathan, C., & Hashemi, H. (2010). Expert Validation of AHP-based Decision Models: A Case Study. Journal of Decision Systems, 19(2), 179-195.
- Saaty, T. L. (1980). The Analytic Hierarchy Process. McGraw-Hill.
- Saaty, T. L. (1994). Fundamentals of Decision Making and Priority Theory with the Analytic Hierarchy Process. RWS Publications.
- Saaty, T. L., & Vargas, L. G. (2001). Models, Methods, Concepts & Applications of the Analytic Hierarchy Process. Springer.
- Triantaphyllou, E., & Khamooshi, H. (1996). Robustness of the Analytic Hierarchy Process: A Comparative Study. Computers & Operations Research, 23(9), 1015-1021.

Table 1.
GM Calculation Results from the AHP Questionnaire.
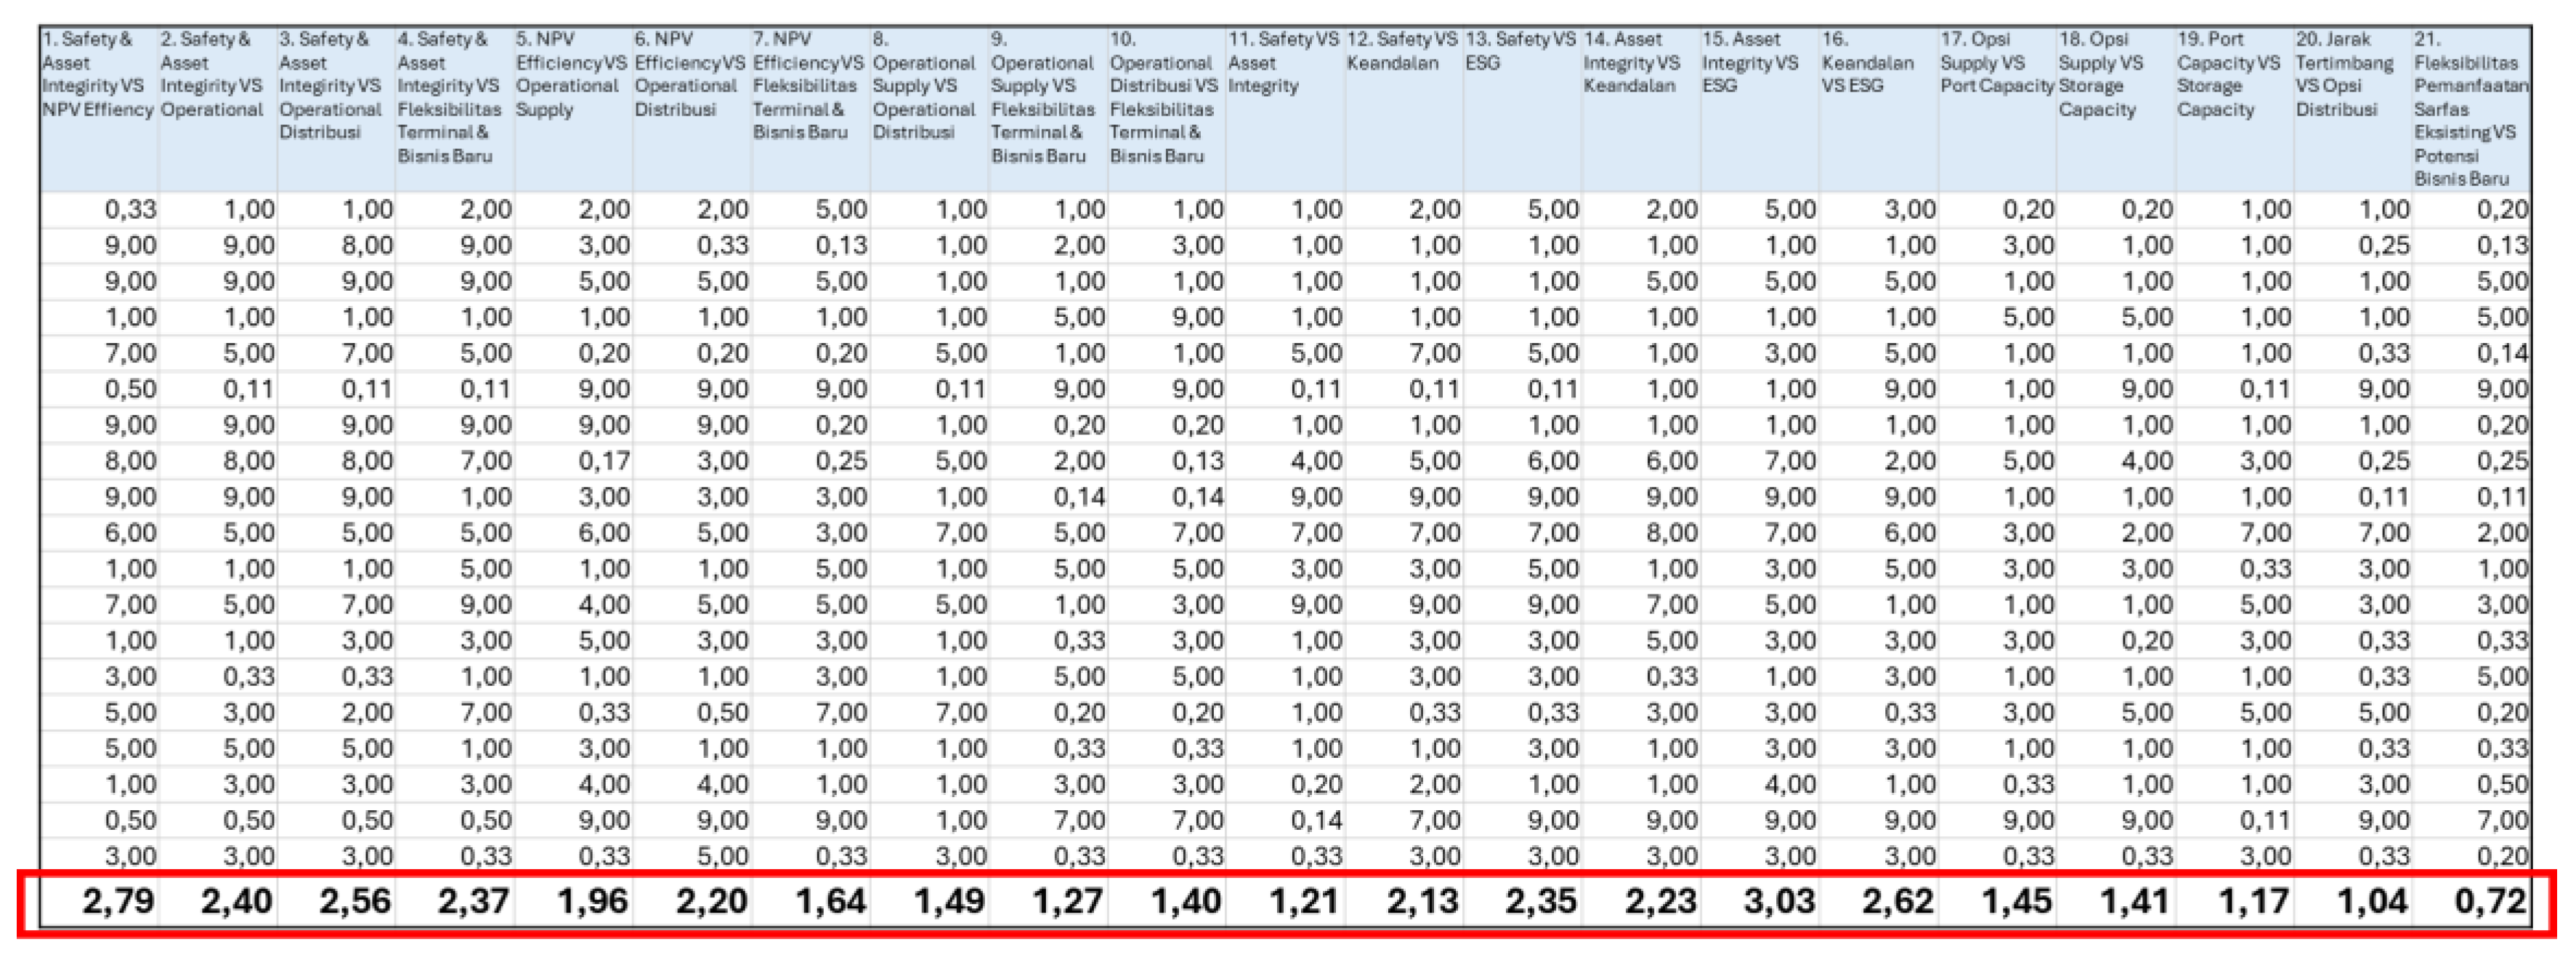
Table 2.
AHP Weight Matrix.
| Safety | NPV | Op Sup | Op Dis | Flex | |
|---|---|---|---|---|---|
| Safety | 1 | 2,79 | 2,4 | 2,56 | 2,37 |
| NPV | 0,36 | 1 | 1,96 | 2,2 | 1,64 |
| Op Sup | 0,42 | 0,51 | 1 | 1,49 | 1,27 |
| Op Dis | 0,39 | 0,45 | 0,67 | 1 | 1,4 |
| Flex | 0,42 | 0,61 | 0,78 | 0,71 | 1 |
Table 3.
Normalized AHP Weight Matrix
| Safety | NPV | Op Sup | Op Dis | Flex | |
|---|---|---|---|---|---|
| Safety | 0,386 | 0,521 | 0,352 | 0,322 | 0,309 |
| NPV | 0,139 | 0,187 | 0,288 | 0,276 | 0,214 |
| Op Sup | 0,163 | 0,095 | 0,147 | 0,187 | 0,165 |
| Op Dis | 0,151 | 0,084 | 0,098 | 0,126 | 0,182 |
| Flex | 0,162 | 0,114 | 0,115 | 0,089 | 0,130 |
Table 4.
AHP Priority Vector Values.
| Safety | NPV | Op Sup | Op Dis | Flex |
| 0,377849 | 0,22066 | 0,151341 | 0,128168 | 0,121982 |
Table 5.
Criteria Weights for the Evaluation Rubric.
| Aspect | Sub-Aspect | Vektor | λ_max | CI | CR | CR % | BOBOT |
|---|---|---|---|---|---|---|---|
| Safety & Asset Integrity | 0,3778 | 5,1226 | 0,0307 | 0,0274 | 2,74% | 38% | |
| NPV Efficiency | 0,2207 | 22% | |||||
| Operational Supply | 0,1513 | 15% | |||||
| Operational Distribution | 0,1282 | 13% | |||||
| Terminal Flexibility & New Business | 0,1220 | 12% | |||||
| Sub-Aspect Safety & Asset Integrity | Safety | 0,3508 | 4,0960 | 0,0320 | 0,0355 | 3,55% | 35% |
| Asset Integrity | 0,3409 | 34% | |||||
| Reliability | 0,0197 | 20% | |||||
| ESG | 0,1113 | 11% | |||||
| Sub-Aspect Operational Supply | Supply Options | 0,4162 | 3,0062 | 0,0031 | 0,0054 | 0,54% | 42% |
| Port Capacity | 0,4381 | 31% | |||||
| Storage Capacity | 0,3939 | 28% | |||||
| Sub-Aspect Operational Distribution | Distance | 0,5100 | 1,9991 | -0,0008 | -∞ | -∞ | 51% |
| Distribution Options | 0,4900 | 49% | |||||
| Sub-Aspect Terminal & New Business Flexibility | Terminal Flexibility | 0,4194 | 1,9968 | -0,0032 | -∞ | -∞ | 42% |
| New Business Potential | 0,5806 | 58% |
Disclaimer/Publisher’s Note: The statements, opinions and data contained in all publications are solely those of the individual author(s) and contributor(s) and not of MDPI and/or the editor(s). MDPI and/or the editor(s) disclaim responsibility for any injury to people or property resulting from any ideas, methods, instructions or products referred to in the content. |
© 2025 by the authors. Licensee MDPI, Basel, Switzerland. This article is an open access article distributed under the terms and conditions of the Creative Commons Attribution (CC BY) license (http://creativecommons.org/licenses/by/4.0/).
Copyright: This open access article is published under a Creative Commons CC BY 4.0 license, which permit the free download, distribution, and reuse, provided that the author and preprint are cited in any reuse.


