Submitted:
08 December 2025
Posted:
09 December 2025
You are already at the latest version
Abstract
Background/Objectives: New approaches using plant-based extracts are increasingly investigated for osteoporosis treatment, including hop extract, which contains potent compounds that affect bone quality favorably. The objective of this research was to evaluate the effect of alendronate, standardized hop extract and their combination on bone tissue quality, hematological and biochemical parameters, and markers of bone turnover in a rat model of osteoporosis. Methods: The study was performed on 6 month-old female Wistar rats. Sham operation was done on 10 animals, and bilateral ovariectomy on 60 animals. Ovariectomized animals were divided into 6 groups, one not treated, and the others treated with a low dose of alendronate, high dose of alendronate, hop extract, or a combination of low/high dose of alendronate and hop extract. Quality of bone was assessed using micro-CT imaging. Hematology and serum biochemistry were analyzed using standardized kits, and bone turnover markers using Western blot. Results: Treatment with high-dose alendronate, hop extract, and a combination of low-dose alendronate and hop extract significantly improved bone quality in ovariectomized animals, but high-dose alendronate combined with hop extract had no favorable effect. Hematological and biochemical parameters were mostly unaffected and within normal range. Changes in markers of bone turnover were modest. Conclusions: For the first time, the effect of combined use of alendronate with hop extract was analyzed. The combination of a low-dose alendronate with hop extract produced effects comparable to those observed with high-dose alendronate or hop extract alone. Standardized hop extract could be a valuable addition to current osteoporosis therapy.
Keywords:
alendronate
; bone
; hop extract
; micro-CT
; osteoporosis
; rat
1. Introduction
Osteoporosis (OP) is a systemic disorder affecting the skeleton, characterized by reduced bone mass and changes in the micro- and macroarchitecture of bones, most commonly caused by reduced estrogen levels [1]. OP can be classified as primary or secondary, with primary OP further divided into postmenopausal and senile types [2]. OP is associated with an increased risk of fractures due to low bone mineral density (BMD). These fractures most often occur at the hip, spine, lower arm, and shoulder. They often heal slowly, and can cause chronic pain, disability, reduced quality of life and sometimes death. [3]. In addition to health effects, OP imposes a significant financial burden on various health systems [4]. Postmenopausal women are at greater risk for OP and OP-related fractures than older men due to the important role of estrogen in bone health [5]. Estrogen reduces bone turnover and resorption, decreases osteoblast apoptosis, and increases osteoclast apoptosis [6]. Although estrogen replacement therapy has been shown to be effective in alleviating OP symptoms, it has largely been abandoned due to an increased risk of breast cancer, stroke, and cardiovascular complications and has also been classified as a known human carcinogen [7,8].
Modern OP therapy includes lifestyle changes and pharmacotherapy, which is roughly divided into anabolic and antiresorptive drugs [9,10]. Anabolic drugs, such as teriparatide and abaloparatide, stimulate bone deposition and increase BMD [9]. Antiresorptive drugs slow down bone resorption and are classified into four major groups, based on their mechanism of action: bisphosphonates, selective estrogen receptor modulators (SERMs), RANKL inhibitors, and sclerostin inhibitors [11]. Bisphosphonates are the oldest class of antiresorptive drugs and are often the first line in OP treatment. These drugs bind to hydroxyapatite sites in the bone matrix, disrupt osteoclast activity in several ways, and promote osteoclast apoptosis [12]. One of the most commonly used bisphosphonates is alendronate [13]. Although still widely prescribed, alendronate has several undesirable side effects, including atypical femoral fractures, jaw osteonecrosis, atrial fibrillation, hypocalcemia, muscle pain, kidney impairment, and irritation of the esophagus and stomach [14,15,16,17].
Alendronate’s effects on bone metabolism are well established and primarily result from its toxic action on osteoclasts, leading to decreased bone resorption [10,16,18]. Estrogen's role in bone homeostasis is multifaceted and not yet fully understood. It is known to directly induce osteoclast apoptosis, reduce RANKL expression in bone-resident T and B lymphocytes, crucial for osteoclast differentiation, and promote the production of osteoprotegerin, which further limits RANKL availability. Estrogen also suppresses cytokines that stimulate bone resorption, including IL-1, IL-6, TNF-α, M-CSF, and prostaglandins. In osteoblasts, estrogen inhibits apoptosis and extends cell lifespan through activation of the Src/Shc/ERK pathway and suppression of the JNK pathway [6,19,20]. Additionally, estrogen acts as an antioxidant and plays a central role in calcium homeostasis; its deficiency leads to negative calcium balance and bone loss in both rats and postmenopausal women [21,22,23].
In addition to classical pharmacotherapies, numerous plant-derived bioactive compounds (e.g. flavonoids, phenolic acids, stilbenes, lignans, terpenoids, alkaloids) are emerging as promising modulators of bone remodeling in osteoporosis treatment [24]. Plant-derived macro- and micronutrients support bone health by enhancing matrix formation and mineralization, with contributions from factors such as acid-base balance, potassium, fiber, calcium, magnesium, and vitamin K [25]. Recent mechanistic reviews demonstrate that some of these phytochemicals can stimulate osteoblast differentiation and/or suppress osteoclastogenesis — acting via pathways such as Wnt/β-catenin, NF-κB, SIRT1/AMPK, and RANKL/OPG [26,27,28]. Clinical and preclinical evidence supports their therapeutic potential: a comprehensive review of dietary polyphenols reports benefits on bone density, inflammation, and oxidative stress [24].
Phytoestrogens are plant-derived chemical compounds, that, due to their structural similarity to estradiol, exert estrogenic effects in the body [29]. The main groups of phytoestrogens are isoflavones, coumestans, lignans, stilbenes and prenylflavonoids [30,31,32]. Major dietary sources of phytoestrogens include fruits, vegetables and nuts, such as soy, garlic, carrot, potato, apple, pomegranate, and others [32]. Recently, phytoestrogens from hops (Humulus lupulus L.) have been increasingly investigated as potential therapies for postmenopausal symptoms, such as hot flushes, and as a promising option for osteoporosis treatment [33,34]. Due to their structural similarity to estrogens, they can activate estrogen receptor α in the bone tissue and to increase BMD in humans and animals [29]. The main prenylflavonoids found in hops are xanthohumol, isoxanthohumol, 6-prenylnaringenin (6PN), and 8-prenylnaringenin (8PN) [35]. Among these, 8PN is the most potent phytoestrogen discovered to date. Although its concentration in hops and hop extracts is low, xanthohumol and isoxanthohumol are metabolized into 8PN in the liver and gut [36].
The mechanisms underlying the positive effect of hop extract on bone quality include promoting the formation and activity of osteoblasts, inhibiting the formation and activity of osteoclasts, promoting osteogenic effects while decreasing pro-osteoclastogenic differentiation of bone marrow progenitor cells, and modulating the gut microbiota [37,38,39,40,41]. To date, possible interactions and potential synergistic effects between conventional OP therapy, such as alendronate, and hop extract have not been investigated. Given the undesirable effects of alendronate therapy, it is important to consider whether using hop extract as an adjunct could reduce the frequency and severity of side effects or allow for adjustments to the regimen or dose of alendronate use in human patients. The aim of this study was to investigate the effects of alendronate, hop extract, and their combination on bone quality using a rat ovariectomy model.
2. Materials and Methods
2.1. Experimental animals and treatment
The research was conducted in accordance with Croatian regulations of animal welfare and protection, and the Guide for the Care and Use of Laboratory Animals, DHHS (NIH) Publ # 86-23 [42]. The approvals of Croatian National Ethical Committee for animals used for scientific research (EP 233/2020) and of the Committee for bioethics and animal welfare of the Faculty of Science, University of Zagreb (Class: 643-02/19-01/3, Reg. No.: 251-58-10617-19-704) were obtained as well as the approval of the Ethical Committee of the Faculty of Medicine Osijek (Class: 602-04/22-08/02 Reg. No.: 2158-61-46-22-16).
A total of 70 female 6-month-old Wistar rats weighing 150 – 250 g, were used in the study. The animals were divided into 7 groups with 10 rats randomly assigned to each group, kept in standard 12-hour light/dark cycles at 24 °C and fed 4 RF 21 standard chow (Mucedola S.R.L., Italy) ad libitum. One group underwent sham surgery and served as the healthy control (C), while the remaining six groups underwent bilateral ovariectomy to induce osteoporosis. Uterine weights were recorded at the end of the experiment to confirm successful ovariectomy. All surgical procedures were performed under intraperitoneal anesthesia using a combination of ketamine (75 mg/kg) and xylazine (10 mg/kg). Postoperative analgesia was provided with ketoprofen (2 – 5 mg/kg, administered intraperitoneally). Animals were maintained in standard conditions for another month to allow the osteoporosis model to develop. After this period, the ovariectomized animals were divided into treatment groups, according to the intragastric (i.g.) therapy they would receive for the next two weeks. The healthy control (C) group and the ovariectomized untreated group (OV) received a daily dose of 1 mL i.g. propylene glycol (used as the hop extract solvent) and water. The other five groups were treated as follows: the ovariectomized group treated with low-dose alendronate (AL) received 1 mg/kg i.g. alendronate once daily; the ovariectomized group treated with high-dose alendronate (AH) received 2 mg/kg i.g. alendronate once daily; the ovariectomized group treated with low-dose alendronate + hop extract (AL-X) received 1 mg/kg i.g. alendronate every other day and 60 mg/kg i.g. hop extract on the days between alendronate doses; the ovariectomized group treated with high-dose alendronate + hop extract (AH-X) received 2 mg/kg i.g. alendronate every other day and 60 mg/kg i.g. hop extract on the days between alendronate doses; the ovariectomized group treated with hop extract (X) received 60 mg/kg i.g. hop extract daily.
Doses and routes were selected based on previous studies in ovariectomized rats using oral alendronate at 1–3 mg/kg and hop extracts or standardized prenylflavonoid preparations in the range of tens to a few hundred mg/kg [33,43,44,45,46]. Hop extract was not soluble in water, whereas alendronate was administered in aqueous solution To avoid potential interactions and ensure accurate dosing in the combination groups (AL-X and AH-X), we alternated their administration on consecutive days. Additionally, alternating treatments minimized stress from repeated gastric administration while maintaining consistent daily handling. The schedule is supported by the long bone retention of alendronate and the expected bioactivity duration of hop extract, ensuring each compound could exert its effects without interference [47,48]. During each dose administration, the animals were briefly anesthetized using sevoflurane. After two weeks of therapy, the animals were euthanized under deep anesthesia (intraperitoneal ketamine 75 mg/kg + xylazine 10 mg/kg). Blood samples were collected for hematological analysis and biochemical serum analysis. Femurs were harvested and stored in 10% neutral buffered formaldehyde solution (NBF, Gram-Mol, Zagreb, Croatia).
The hop extract, XanthoFlav™, was kindly provided by Hopsteiner (New York, NY, USA). High-performance liquid chromatography (HPLC) analysis conducted at the Hopsteiner laboratory indicated the composition of prenylflavonoids as follows: xanthohumol 75%, isoxanthohumol 0.4%, 6PN 1.7%, and 8PN 0.3%. Alendronate was administered using Aledox 70 tablets (Belupo, Koprivnica, Croatia). Sevoflurane was used as the inhalation anesthetic (Sevorane, Abbott Laboratories, Chicago, IL, USA). Ketamine (Narketan®, Vetoquinol S.A., Lure Cedex, France), xylazine (Xylapan®, Vetoquinol S.A.), and ketoprofen (Ketonal®, 50 mg/mL ampoules, Sandoz, Basel, Switzerland) were used for anesthesia and analgesia.
2.2. Micro-CT imaging
Femur samples were stored in 10% NBF until analysis by micro-computed tomography (micro-CT). Scanning of the distal femoral epiphyses was performed using a Neoscan N80 microtomograph (Neoscan, Mechelen, Belgium) at 50 kV, 200 µA, without an energy filter, at a resolution of 10 µm. The rotation step was set to 0.2° over 360°, with averaging set to 3. Virtual cross-sections of femoral epiphyses were reconstructed from sets of 1800 projection images of the samples using Neoscan 80 software (version 2.2.4) (Neoscan, Belgium). The reconstructed images were imported into Dragonfly software (version 2021.1.0.977) (Object Research Systems Inc., Montreal, Canada) for 3D reconstruction and segmentation analysis. Bone scans were denoised using a deep-learning model based on U-net neural network within the Dragonfly software. [49]. Regions of interest (ROIs) were defined using the bone analysis plugin in Dragonfly software. For each femur, a 1-cm longitudinal segment of the distal femur was analyzed, beginning at the first micro-CT slice in which the distal femoral condyles were visible and extending proximally for 10 mm along the femoral axis. This anatomical window includes the epiphysis and the adjacent metaphyseal region, capturing the full transition from subchondral trabeculae to compact cortical bone. Within this 10-mm volume, two primary ROIs were created: a total ROI, corresponding to all voxels within the periosteal boundary of the scanned segment, and a bone tissue ROI, obtained by global thresholding and including all mineralized bone. The bone tissue ROI was further segmented into a trabecular bone ROI, using the method of Buie et al. [50], in which cortical voxels are removed by morphological erosion and subsequent dilation to isolate the internal cancellous compartment, and a cortical bone ROI, defined as the remaining mineralized tissue after trabecular compartment removal. Morphometric bone parameters were then measured following the protocol established by Bouxsein et al. [51]. This approach allows quantification of both cortical and trabecular compartments across the entire distal 1-cm segment, capturing the epiphyseal–metaphyseal continuum. We note that the analyzed portion includes a thin band of primary spongiosa immediately distal to the growth plate, which should be considered when comparing our results to studies using standard metaphyseal ROIs. The following parameters were quantified: bone volume (BV), total volume (TV), bone volume fraction (BV/TV), average marrow area (Ma.Ar), average periosteal perimeter (Ps.Pm), periosteal surface (3D) (Ps.S3D), average endocortical perimeter (Ec.Pm), endocortical surface (3D) (Ec.S3D), average cortical area (Ct.Ar), average total area (Tt.Ar), average cortical area fraction (Ct.Ar/Tt.Ar), average cortical thickness (Ct.Th), average trabecular thickness (Tb.Th), and average trabecular separation (Tb.Sp). Representative 3D reconstructions of distal femora from the Dragonfly software are shown in Figure 1.
2.3. Hematology and biochemical analysis
A portion of the sampled blood was stored in heparinized BD Vacutainer® containers (BD, New Jersey, USA), stored at 4 °C and analyzed the following day using the ABX Micros ESV60 device (Horiba Medical, Kyoto, Japan) according to the standard rat protocol provided by the manufacturer. Standard hematological parameters were measured (the complete list of parameters is provided in the results below). The remaining blood was stored in non-heparinized BD Vacutainer® containers (BD, New Jersey, USA). After coagulation, serum was separated by centrifugation at 3,000 × g for 10 minutes using Eppendorf 5702 centrifuge (Eppendorf, Hamburg, Germany). A portion of the serum (100 µL) was used for biochemical analysis. Biochemical analysis was performed at the Croatian Veterinary Institute in Zagreb using the VetScan VS2 analyzer (Abaxis, Union City, California, USA) along with the appropriate reagents and rotors (VetScan® Comprehensive Diagnostic Profile). Hematology parameters included red blood cell count (RBC, ×10¹²/L), white blood cell count (WBC, ×10⁹/L), platelet count (PLT, ×10⁹/L), hemoglobin (Hb, g/L), hematocrit (Hct, L/L), mean corpuscular volume (MCV, fL), mean corpuscular hemoglobin (MCH, pg), and mean corpuscular hemoglobin concentration (MCHC, g/L). Biochemical parameters included calcium (Ca, mmol/L), phosphorus (P, mmol/L), sodium (Na, mmol/L), potassium (K, mmol/L), glucose (Glc, mmol/L), blood urea nitrogen (BUN, mmol/L), creatinine (CRE, µmol/L), alkaline phosphatase (ALP, U/L), alanine aminotransferase (ALT, U/L), total bilirubin (TBIL, mmol/L), amylase (AMY, U/L), albumin (ALB, g/L), globulins (GLO, g/L), and total protein (TP, g/L).
2.4. CTX1 and P1NP Western blot
Serum markers of bone turnover, Type I collagen cross-linked C-telopeptide (CTX1) and Procollagen 1 N-terminal propeptide (P1NP) were analyzed using Western blot technique. Total serum protein concentrations were obtained during the previously described biochemical analysis. All samples were diluted with phosphate-buffered saline (PBS) to a standardized protein concentration of 1 mg/ml and prepared for electrophoresis in Laemmli buffer. Serum proteins were separated by sodium dodecyl sulfate-polyacrylamide gel electrophoresis (SDS-PAGE) using the Hoefer Mighty Small system (Hoefer, Holliston, Massachusetts, USA). Samples were denatured at 100 °C for 5 min, cooled on ice, and stored until electrophoresis. Discontinuous gels were prepared (stacking gel: 5 % acrylamide; separation gel: 10 % acrylamide, 3 mm thick) incorporating trichloroethanol for stain-free normalization. Five microliters of stained protein electrophoresis standard SeeBlue 2 Plus (Thermo Fisher Scientific, Waltham, Massachusetts, USA) and 14 samples (50 µL, containing 50 µg proteins) were applied on each gel. For each bone turnover marker, five 15-well gels were used. Following electrophoresis, trichloroethanol was UV-activated using the ChemiDoc™ Imaging System (BioRad, Hercules, California, USA). Proteins were then transferred onto polyvinylidene fluoride (PVDF) membranes (pore size 0,45 μm, Thermo Fisher Scientific, Waltham, Massachusetts, USA) using the Hoefer Mighty Small Transfer Tank system (Hoefer, Holliston, Massachusetts, USA) in Towbin transfer buffer. After the transfer, membranes were washed in PBS with 0.1 % Tween 20 (PBS-T) and imaged using the ChemiDoc™ Imaging System using stain-free blot settings. The images were used for sample normalization before the analysis.
Immunodetection was performed using a mouse monoclonal primary antibody for CTX1 (Cat. No. LS-B16343, LSBio. Seattle, Washington, USA) and a rabbit polyclonal primary antibody for P1NP (Cat. No. 141967, USBiological, Salem, Massachusetts, USA), both diluted 1:2000 in blocking buffer (3 % BSA in PBS-T) and incubated overnight at 4 °C. After washing three times for 10 minutes each in PBS-T, biotinylated secondary antibodies (1:20 000) were applied for 2 hours; for CTX1 membranes: goat anti-mouse polyclonal antibody (Cat. No. 115-065-071, Jackson ImmunoResearch, West Grove, Pennsylvania, USA); for P1NP membranes: goat anti-rabbit polyclonal antibody (Cat. No. 111-065-144, Jackson ImmunoResearch, West Grove, Pennsylvania, USA). After the incubation, membranes were washed again (three times for 10 minutes each in PBS-T) and treated with a tertiary complex consisting of streptavidin-horseradish peroxidase polymer (Cat. No. S2438, Sigma-Aldrich, St. Louis, Missouri, USA) diluted 1:1,000 in PBS-T for 1 hour. Membranes were then washed (3×10 min in PBS-T) and imaged using the ChemiDoc™ Imaging System with chemiluminescence settings. Immobilon Forte (Cat. No. WBLUF0500, Merck, Darmstadt, Germany) substrate was used for visualization. Signal intensities were compared to the stained protein standard (140 kDa for CTX1 and 53 kDa for P1NP). Multichannel images were generated and analyzed in Image Lab software (Bio-Rad, Hercules, California, USA). Both stain-free and chemiluminescence images were used for quantitative analysis. The data were normalized and expressed as the ratio of the experimental group sample signal strength to the control group sample signal strength in the same blot. The resulting values were used for statistical analysis.
2.5. Statistical analysis
All statistical analyses were performed using JASP (version 0.95.2) [52]. Normality was tested using the Shapiro-Wilk test. Before statistical analysis of hematology and biochemistry results, data was screened for outliers within each experimental group using Grubbs’ and Dixon’s Q tests. Data points identified as significant outliers (p < 0.05) were excluded from all subsequent related analyses. Differences between groups were assessed using Welch’s ANOVA. This approach was applied to all measured parameters for consistency, as Levene’s test indicated unequal variances for some variables. Post hoc comparisons were performed using the Tukey test. Statistical significance was defined as p < 0.05. Data are presented as box-and-whisker plots (median and interquartile range) to illustrate data distribution and variability for micro-CT and Western blot analyses, and as tables showing mean and standard deviation for biochemistry and hematology analyses. Detailed outputs from the JASP software are available as supplementary data.
3. Results
Uterine weights were measured at the end of the experimental period to confirm successful ovariectomy. Welch ANOVA revealed a significant difference between groups in uterine weight (F(6, 22.47) = 25.55, p < 0.001). Post hoc Tukey tests showed that all ovariectomized groups (OV, AL, AH, AL-X, AH-X, X) had significantly lower uterine weights compared with the sham-operated control group (C) (p < 0.001 for all comparisons). No significant differences in uterine weight were observed among the ovariectomized groups (Figure 2).
3.1. Micro-CT analysis
All measured parameters describing changes within the distal epiphysis of the femur presented below have been categorized into general bone measurements, periosteal and endocortical measurements, cortical bone measurements, and trabecular bone measurements. Examples of bone scans from each group are shown in Figure 3.
The results of general bone measurement analysis are shown in Figure 4. The total volume of the measured part of the femur was consistent across groups. Significant differences between groups were noticed for bone volume (F(6, 26.3) = 19.82911, p < 0.001) and bone volume fraction (F(6, 26.4) = 26.43182, p < 0.001) (Figure 4A and 4C). The bone volume and bone volume fraction were significantly reduced in the OV group compared to the C group as expected from the experimental model. They were also significantly lower compared to the AH, AL-X and X group. Additionally, they were significantly lower in the AH-X group compared to the C, AH and X groups. The AL group had a lower bone volume fraction compared to the X group. For all the mentioned differences in BV and BV/TV, p was < 0.001, except for C vs. AL (BV p = 0.005), AL-X vs AH-X (BV p = 0.003), AL-X vs. X (BV p = 0.03), OV vs. AL (BV/TV p = 0.03) and AL vs. AL-X (BV/TV p = 0.006). Therefore, the highest BV and BV/TV were noted in the C, AH, AL-X and X groups, and the lowest in the OV and AH-X groups. Average marrow area did not differ significantly between the groups. For detailed post-hoc test results and all p-values, please see JASP output in the supplementary material (Table S1).
The results of periosteal and endocortical measurements are shown in Figure 5. Significant differences between groups were noticed for all parameters, however, changes in periosteal measurements were relatively small compared to endocortical (average periosteal perimeter (F(6, 26.3) = 2.59984, p = 0.04), periosteal surface (3D) (F(6, 26.2) = 3.59494 p = 0.01), average endocortical perimeter (F(6, 26.3) = 27.33963, p < 0.001), and endocortical surface (3D) (F(6, 26.5) = 37.49222, p < 0.001)). Subsequent Tukey post hoc comparisons for Ps.Pm identified statistically significant differences only for OV vs. AH (p = 0.04) and OV vs. X (p = 0.005). Ps.S3D was significantly higher in X group than in the OV (p < 0.001), AL (p = 0.03), AL-X (p = 0.01) and AH-X group (p = 0.04). Ec.Pm and Ec.S3D were significantly higher in the X group compared to all other groups (p < 0.001 for all cases except for AH vs. X Ec.Pm, p = 0.02). Furthermore, AH and AL-X had comparable values to the C group, significantly higher than the other three groups. The AL group had slightly higher values than OV group (p = 0.03 (Ec.Pm) and 0.02 (Ec.S3D)), and for AH-X, they were similar to OV group. For detailed post-hoc test results and all p-values, please see JASP output in the supplementary material (Table S1).
The analysis of changes in cortical bone is shown in Figure 6. Significant differences between groups were noticed for average cortical area (F(6, 26.2) = 20.13942, p < 0.001), average cortical area fraction (F(6, 26.4) = 20.36143, p < 0.001) and average cortical thickness (F(6, 25.9) = 6.61544 , p < 0.001) (Figure 6A, 6C and 6D). The average total (cortical + marrow) area did not differ significantly between groups (Figure 6B). Ct.Ar and Ct.Ar/Tt.Ar were significantly higher in the C, AH, AL-X and X groups compared to other groups (almost all cases had p < 0.001). Furthermore, compared to the AH and AL-X groups, the X group exhibited a significantly higher Ct.Ar (p values 0.008, < 0.001, respectively) and Ct.Ar/Tt.Ar (p values 0.04, 0.01, respectively), and it also had a higher Ct.Ar than the C group (p = 0.004). Ct.Th was significantly higher in the X group compared to the OV, AL, AH and AH-X groups (p values 0.02, < 0.001, 0,02, < 0.001, respectively). For detailed post-hoc test results and all p-values, please see JASP output in the supplementary material (Table S1).
Structural differences in the trabecular bone are shown in Figure 7. Significant differences between groups were observed in average trabecular thickness (F(6, 26.5) = 51.20497, p < 0.001, Figure 7A), while average trabecular separation did not differ significantly between the groups (Figure 7B). Tb.Th in the OV group was significantly lower compared to all groups, except for AH-X, and significantly larger in C, AH, AL-X and X than all other groups (all p values < 0.001). For detailed post-hoc test results and all p-values, please see JASP output in the supplementary material (Table S1).
3.2. Hematology and serum biochemistry
To assess the general impact of the tested substances on animals, different parameters from whole blood or serum were analyzed. Table 1 shows the results of hematology tests. Although erythrocyte counts were higher in all groups compared to the control group, only the increase in the AL-X group was statistically significant (p = 0.006) compared to control, as well as to the X group (p = 0.04), values for C and X being very similar. Hematocrit values were also significantly higher in AL-X compared to the C and X group (p value 0.002 and 0.03, respectively). Results for hemoglobin values were slightly different, as the AL and AL-X groups had significantly higher hemoglobin values than controls (p = 0.004 and 0.001, respectively). However, although Welch’s ANOVA found significant difference in the MCH, Tukey’s post hoc test did not yield any significant differences between groups. On the other hand, MCHC was significantly higher in the AH group than in the C and OV groups (p = 0.046 and 0.048, respectively). MCV did not differ significantly among the groups.
Regarding leukocyte counts, Welch’s ANOVA indicated a significant difference among groups (F(6, 22.1) = 4.32, p = 0.005). However, pairwise comparisons using Tukey’s post hoc test did not identify any significant differences between individual groups. Platelet counts were significantly reduced in all groups receiving alendronate, when compared to controls (AL (p = 0.04), and AH, AL-X, and AH-X (p < 0.001)), and high dose of alendronate accounted for lowest values.
Table 2 presents the results of electrolytes, renal & metabolic parameters, while parameters describing liver function, protein metabolism, and enzymes can be found in Table 3. No significant changes were observed in calcium, phosphate, sodium, potassium, glucose, blood urea nitrogen, and creatinine levels.
No significant differences were found for alkaline phosphatase, alanine aminotransferase, total bilirubin, amylase, and globulins. Albumin concentrations were lower across all ovariectomized groups compared to the control, and although Welch’s ANOVA reported significant differences, Tukey’s post hoc test did not show any significant differences between groups except for a borderline value for comparison of the C and OV groups (p = 0.05). Total serum protein concentrations were lower in all ovariectomized groups compared to the control, with statistically significant reductions in the OV and AH-X groups (p = 0.02 and 0.007, respectively).
3.3. CTX1 and P1NP Western blot analysis
The intensity of signals for analyzed serum markers of bone remodeling, CTX1 and P1NP, was quantified from digital photographs of membranes. The obtained intensity was normalized and expressed relative to the C group. The results were analyzed using Welch’s ANOVA test with Tukey post hoc test for group comparisons. The results are shown in Figure 8. No significant differences were observed for CTX1, while some were found for P1NP (CTX1: F(6, 27.1) = 1.720, p = 0.15; P1NP: F(6, 27.2) = 3.872, p = 0.006). In the AH, P1NP levels were significantly higher compared to most groups (C, OV, AL, AL-X). For detailed post-hoc test results and all p-values, please see JASP output in the supplementary material (Table S3). Digital photographs of the membranes are shown in Figure 9.
4. Discussion
This study investigated the effects of low and high doses of alendronate, standardized hop extract, and their combinations on an ovariectomized rat model of osteoporosis.
Previous studies have shown that hop extract exerts effects on trabecular bone comparable to estradiol, and pure 8-prenylnaringenin (8PN) improves BMD [33,34]. In this study, hop extract significantly improved bone volume in the distal femoral epiphysis, comparable to high-dose alendronate. Both treatments restored trabecular bone volume and volume fraction to control levels. Similarly, the combination of low-dose alendronate and hop extract yielded comparable preservation of bone mass. In contrast, the combination of high-dose alendronate and hop extract resulted in reduced bone mass, nearly equivalent to OV animals.
Periosteal and endosteal measurements indicate that hop extract, high-dose alendronate, and the combination of low-dose alendronate with hop extract promote endosteal bone apposition but do not significantly affect bone width. These findings are consistent with prior research showing that estrogen stimulates endosteal apposition without influencing periosteal expansion in female rodents [53]. While some studies found no effect of hop extract on cortical bone thickness or quality [33], we observed increased cortical thickness and surface area compared to ovariectomized controls. Hop extract maintained cortical bone surface similar to that of the control group, matching the outcomes of both high-dose alendronate and the low-dose alendronate–hop extract combination. However, the high-dose combination (AH-X group) did not show benefits, with cortical bone levels similar to the untreated OV group. Hop extract alone was as effective as high-dose alendronate in preserving trabecular thickness, aligning with earlier studies [33], as was the low-dose combination. Again, the AH-X group showed markedly inferior bone quality, comparable to the OV group.
The results in the X group confirm previously described beneficial effects of hop-derived phytoestrogens on bone quality. Notably, hop extract alone produced the same protective effects as high-dose alendronate. This finding warrants further investigation, especially in the context of human use. However, it remains unclear why combining high-dose alendronate and hop extract failed to replicate the positive effects observed with either treatment alone. One hypothesis is that excessive osteoclast suppression might impair osteoblast activation. While alendronate induces osteoclast apoptosis, bone resorption persists to some extent, releasing cytokines and matrix-derived factors (e.g., TGF-β, IGF1, IGF2, BMPs) that promote osteoblast differentiation and activity [6,54]. These molecules, along with juxtacrine and paracrine signals from osteoclasts, are essential for osteoblast function. Estrogen and phytoestrogens binding to ERα on osteoclasts also reduce their activity and differentiation [55,56]. It is possible that hop extract and alendronate affect osteoclasts via distinct mechanisms that combine to excessively suppress osteoclast activity, inadvertently hindering osteoblast signaling and function. Another consideration is that high doses of alendronate increase the number of osteoclasts; although bone resorption is slowed under these conditions, these osteoclasts could still release TRAP and other molecules affecting bone metabolism [57]. Another study reported that alendronate and other nitrogen bisphosphonates can provoke short-term inflammatory responses and increased cytokine expression (IL-6, TNF-α) [58], which could facilitate osteoclastogenesis despite the inhibitory and pro-apoptotic effects of bisphosphonates on osteoclasts. As no negative effects were observed in the AH group, there is clearly a missing link related to hop extract administration. Recent studies and reviews document that flavonoids can act as antioxidants or pro-oxidants depending on dose, the presence of redox-active transition metals (Fe, Cu), and different cellular conditions [59,60,61]. There is no evidence that alendronate directly induces flavonoid pro-oxidation, but alendronate-related changes in inflammation or tissue redox balance could, in principle, modify the microenvironment in ways that influence flavonoid redox behavior; however, this is speculative and should be tested in future studies. Moreover, the substances studied might induce other, yet unidentified, changes in bone metabolism, resulting in complete treatment failure. Although unexpected, the result was consistent across all measured indicators of bone quality and deserves further mechanistic exploration. This might mean that there is an alendronate dosage threshold that should not be exceeded in combination with hop extract. Nevertheless, in the context of osteoporosis therapy, this outcome is likely not concerning, as the high alendronate dose used in the AH and AH-X groups exceeded therapeutic levels. Notably, the combination of low-dose alendronate and hop extract was as effective as high-dose alendronate in improving cortical and trabecular bone quality. This suggests that hop extract could serve as a potential adjuvant in alendronate therapy, and mechanistic studies are necessary to explain the effects observed in the AH-X group.
RBC counts were higher in all ovariectomized groups compared to controls, but this increase reached statistical significance only in the AL-X group. Regardless of significance, RBC counts remained within the reference range for rats, indicating that alendronate, hop extract, or their combination had no clinically relevant effect on erythrocyte numbers. Hematocrit and hemoglobin values showed similar patterns. Estrogen modulates intracellular erythrocyte signaling, which may be relevant in the context of phytoestrogen therapy as selective ERα modulators [62]. Additionally, estrogen is involved in the regulation of the proliferation, self-renewal, and differentiation of hematopoietic cells, suggesting that observed blood changes could reflect potential alterations in the bone marrow [63,64]. Although not observed in this study, alendronate has been reported to increase leukocyte counts (monocytes and neutrophils) in rats [22]. Future studies should investigate the potential effects of the tested compounds on bone marrow hematopoietic cells and assess leukocyte differential counts in addition to total counts.
Platelet counts were reduced in all ovariectomized groups, particularly in alendronate-treated animals (significant in AH, AL-X, and AH-X groups), but values remained within the reference range. This is consistent with findings that platelet counts decline after menopause [65]. Some studies report higher platelet counts in individuals with osteopenia or osteoporosis compared to those with normal BMD [66,67], while others report lower counts with reduced BMD [68]. Platelets and their precursors (megakaryocytes) express estrogen receptors; however, the influence of estrogen on platelet formation and function remains unclear [69]. Although no clinically significant hematologic alterations were observed in this study, future research should examine the long-term effects of these compounds on blood parameters and hematopoietic cells.
Serum biochemical parameters were also analyzed. No significant differences were found in measured electrolytes, although sodium levels were at or slightly below the lower reference limit in all groups, possibly representing an experimental artifact. Serum ALT levels did not differ significantly. Research linking liver enzyme levels to osteoporosis is somewhat conflicting, making these results difficult to interpret in the context of current knowledge [70,71]. Alendronate rarely causes hepatotoxicity [72]. Total bilirubin, as another marker of liver function, showed no significant differences between groups. Urea and creatinine levels were similar across groups, indicating no impairment of renal function during the treatment period, consistent with reports that long-term alendronate does not affect renal function in patients [13]. Increased serum ALP following OVX is a well-known phenomenon, and estrogen therapy does not significantly reduce ALP levels in ovariectomized sheep [73]. Our results were consistent with this trend, although differences were not statistically significant, possibly due to variability within groups. Serum amylase, as a marker of pancreatic exocrine function, showed no significant changes.
Total protein and albumin levels were at the upper reference limit or slightly above in all groups and were lower in all ovariectomized groups compared to controls, though not significantly, except for total protein in the OV and AH-X groups. Globulin levels did not differ significantly. These findings partially align with studies reporting reduced albumin levels in osteoporosis patients [74]. They are also consistent with results from another study that found total protein reduction in the serum of ovariectomized rats [75]. Alendronate and hop extract seem to partly mitigate this effect. Hop extract might have a positive effect due to the protective action of 8PN on liver metabolism, which has already been demonstrated for glucose and lipid metabolism [76,77], but further clarification is needed regarding its effects on protein synthesis and metabolism. Interestingly, one study reported that isoflavone therapy combined with exercise restored protein expression in liver tissues to normal after it was reduced in ovariectomized rats [78]. The effect of alendronate may be indirect, through the reduction of serum inflammatory cytokines [79], or through another pathway, but the actual mechanisms for both substances should be further investigated. Future research should also examine the effects of these compounds on individual plasma protein fractions in more detail.
After the two-week treatment period with alendronate, hop extract, or their combination, no indicators of adverse effects on serum biochemical parameters were observed. However, the long-term impact of these interventions warrants further investigation.
Western blot analysis of bone turnover markers showed significantly elevated P1NP levels in the AH group compared to the C, OV, AL, and AL-X groups, indicating a dose-dependent anabolic effect of alendronate. This is consistent with previous findings demonstrating that high-dose alendronate stimulates osteoblast differentiation via mesenchymal progenitors [80]. CTX1 levels, a marker of bone resorption, did not significantly differ among groups, despite expectations of increased CTX1 in ovariectomized rats. CTX1 levels can be affected by circadian rhythm, feeding state, and other factors [81]. Since samples were collected 30 days post-ovariectomy, when the model was already established, it is plausible that CTX1 levels had peaked earlier and then stabilized. Uniform CTX1 levels across groups thus suggest no additional resorption caused by alendronate, hop extract, or their combinations.
According to Song et al., CTX1 levels stabilize at elevated levels post-ovariectomy, while P1NP levels decline, although their study used mice and ELISA rather than western blot [82]. A high-dose combination of red clover and hop extracts reduced serum CTX1 in one study [83], while soy isoflavones decreased both CTX1 and P1NP in another [84]. However, such effects were not observed here. Future studies should monitor CTX1 and P1NP levels at regular intervals following ovariectomy and during long-term treatment to better understand biomarker dynamics.
As previously noted, numerous phytoestrogens offer protective effects on bone. In vitro and in vivo data on 8PN and hop extract, which contains 8PN and its precursors, support their role in preventing bone loss and enhancing bone formation [33,34,85]. Since hop extract and purified 8PN may have fewer side effects than current osteoporosis drugs, their therapeutic potential is under active investigation [33,34]. However, the long-term safety of hop-derived phytoestrogens remains incompletely understood [86].
Pharmacokinetically, 8PN has higher affinity for ERα than ERβ, classifying it as a SERM. In vitro, its estrogenic activity matches that of endogenous estrogens (e.g., estrone), while its in vivo effect on reproductive tissues is about 20,000 times weaker than estradiol [87]. Although some researchers have reported estrogenic effects of hop extract on reproductive organs, these effects are generally much weaker than those of estrogen and are probably dose- and route- dependent [41,77]. In line with this, our previously published results show that neither of the therapeutics used affected the uterine endometrium [88]. These findings confirm previous reports that 8PN is selective and does not show estrogenic effects on various estrogen-dependent organs, such as uterus, in which estrogenic effects might contribute to malignancies. [33,34].
This study generated valuable data on the effects of high and low doses of alendronate, hop extract, and their combinations on bone quality and remodeling, as well as hematological and biochemical blood indices, using the ovariectomized rat model of osteoporosis. The well-documented beneficial effects of alendronate and hop extract were confirmed. However, for the first time, data waere obtained following the administration of combined high or low doses of alendronate with hop extract. The combination of a low dose of alendronate with hop extract produced effects comparable in magnitude to those observed with high-dose alendronate or hop extract monotherapy. These findings warrant further investigation into the therapeutic potential of lower alendronate doses in combination with hop extract, as this approach may reduce the incidence and severity of adverse effects associated with alendronate therapy.
Hop extract alone demonstrated effects equivalent to, or even slightly superior to, those observed with alendronate on the evaluated bone parameters. This observation for hop extract monotherapy is consistent with pre-clinical and clinical studies that report beneficial effects of hop extract or 8PN in both rodents and humans. Recent in vitro and in vivo research has reported the beneficial effects of hop extract on the osteogenic potential of stem cells, bone microarchitecture, and biomechanical parameters in rats [33,40,41,89,90]. A review of the literature also confirms that 8PN from hop extract prevents osteoporosis by promoting osteoblast differentiation and inhibiting osteoclast activity [39]. This is particularly noteworthy given that 8PN is among the most potent phytoestrogens identified to date. Human studies on hop extract and bone quality are rare, however, a study by Lecomte et al. reported favorable outcomes in BMD in postmenopausal women after 48 weeks of hop extract use [91]. Additionally, a meta-analysis of non-hop isoflavone usage showed beneficial effects on BMD and safe usage in postmenopausal women (primarily genistein and a synthetic isoflavone) [92]. A comprehensive review on the effects of different phytoestrogens on bone health and estrogen metabolism in animals and humans was prepared by Tomczyk-Warunek et al., highlighting the potential of phytoestrogens in osteoporosis prevention [93]. More studies on the effect of hop-extract phytoestrogens in humans are needed. In addition to its possible therapeutic application in osteoporotic patients, 8PN may serve as a promising lead compound for the development of more potent derivatives for therapeutic purposes, analogous to stilbene-based SERMs already approved for clinical use, including raloxifene, toremifene, and tamoxifen, which have demonstrated efficacy in the treatment and prevention of postmenopausal osteoporosis and hormone-receptor positive cancers (e.g. breast cancer) [94]. Nevertheless, some researchers also promote the notion that dietary interventions might be a better approach than a single-compound treatment, as there are multiple bioactive ingredients in plant extracts [29]. For example, recent research shows that bitter acids from hops also have a protective effect against OP, which might be an added value [95]. This suggests there is a potential for developing functional foods for osteoporosis prevention and treatment containing standardized hop and other plant extracts.
There are several important limitations to our experimental design that should be considered. First, the two-week treatment period is relatively short compared to typical ovariectomy studies, so our findings are likely to reflect early rather than sustained effects of the interventions. Nevertheless, prenylflavonoids from hop extract have been shown in rodents to achieve tissue exposure and bone-protective activity within four weeks [96]. Rats’ higher bone turnover compared to humans means that short-term dosing can model some aspects of human postmenopausal bone loss within a condensed timeframe. While longer-term studies are necessary, our data provide initial evidence that hop-derived phytoestrogens alone or in combination with alendronate can rapidly modulate bone remodeling. In terms of translation to humans, 2 weeks in adult rats roughly corresponds to one year, which is consistent with clinical observations of BMD improvement after 48 weeks and menopause-related symptom relief after 12 weeks of hop extract [91,97,98]. Nevertheless, visible changes after just two weeks of treatment provide valuable insight into the effectiveness of the tested treatments. Second, because the study already included seven experimental groups, additional hop-extract dose levels were not feasible, and we acknowledge that future studies should address an expanded hop-extract dose range in combination with alendronate. Third, because our available Dragonfly FreeD academic license does not include BMD/TMD computation, bone mineral density could not be assessed in this study. This limitation may affect direct comparability with studies reporting calibrated density measurements. Fourth, circulating bone turnover markers (CTX and P1NP) were assessed by Western blotting. While this method allows detection of relative changes, it is semi-quantitative and less precise than validated immunoassay platforms such as ELISA, ECLIA, or CLIA. Consequently, we cannot provide standardized bone turnover marker concentrations, and future studies using dedicated immunoassays are warranted to confirm these findings. Fifth, we did not directly assess osteoclast or osteoblast activity and regulation. Consequently, while we analyzed structural changes and biomarkers, the precise contribution of osteoclast inhibition versus osteoblast activation is missing. Future studies incorporating these cellular and molecular endpoints would strengthen mechanistic insights into the observed bone effects.
Well-controlled pre-clinical and clinical combination trials of bisphosphonate and nutraceutical combinations are extremely rare. Most studies either compare isoflavones to alendronate, or test nutraceuticals alone or in combination with other nutraceuticals/exercise. However, a recent paper suggests that combining certain herbal medicines with bisphosphonates is associated with improved BMD in a clinical cohort of primary osteoporosis patients, but the quality of evidence was low due to high risk of bias and significant heterogeneity [99]. Improved spinal fusion with an alendronate and curcumin combination has been reported, as well as prevention of glucocorticoid-induced osteoporosis and enhanced anti-osteoporotic effects of alendronate when combined with quercetin [100,101,102]. An in vitro study demonstrated a synergistic suppression of RANKL-induced osteoclastic differentiation by a combination of alendronate and genistein [103]. Also, a study evaluating combinations of red clover and hop extract suggests positive effects on bone metabolism in OV rats [104]. To our knowledge, our experimental design is the first to assess the combination of bisphosphonate and hop extract, and our findings are consistent with the few available studies on combination therapy, with the novel finding of a negative effect of high-dose alendronate dose with hop extract, as well as noticeable changes after a relatively short treatment period of 2 weeks. This area of research is promising and warrants further investigation to elucidate the underlying molecular mechanisms, as a deeper understanding of these interactions could facilitate the design of future combination therapies, determination of optimal dose ranges, and the development of novel therapeutic strategies for osteoporosis.
Supplementary Materials
The following supporting information can be downloaded at the website of this paper posted on Preprints.org (JASP output HTML files: Micro CT analysis.html; Hematology and biochemistry analysis.html; Western blot analysis.html).
Author Contributions
Conceptualization and design: E.R, N.B., N.O.; methodology: E.R, R.K.,N.B., M.Z., N.O.; experiments: E.R., R.K., M.Z., N.O.; statistical analysis: M.Z., N.B.; interpretation of results: E.R., N.O., N.B.; writing—original draft preparation: E.R., R.G., R.K., N.B..; writing—review and editing: all authors; funding acquisition (micro-CT): R.K. All authors have read and agreed to the published version of the manuscript.
Funding
The micro-CT analysis was supported by funding from the Slovenian Research Agency to »Infrastructural Center Microscopy of Biological Samples« (MRIC UL, I0-0022-0481-08), at Biotechnical Faculty, University of Ljubljana, Slovenia.
Institutional Review Board Statement
This animal study was reviewed and approved by Croatian National Ethical Committee for animals used for scientific research (EP 233/2020), the Committee for bioethics and animal welfare of the Faculty of Science, University of Zagreb (Class: 643-02/19-01/3, Reg. No.: 251-58-10617-19-704), and the Ethical Committee of the Faculty of Medicine Osijek (Class: 602-04/22-08/02 Reg. No.: 2158-61-46-22-16).
Data Availability Statement
The data presented in this study are available on request from the first and corresponding author, as the size of the files is too large for storing in repositories (especially the micro-CT scans).
Acknowledgments
The authors wish to thank the Hopsteiner company for their generous donation of the hop extract XanthoFlavTM and the veterinary station “Veterinarska stanica Osijek d.o.o.” for their help with haematological analysis. We would also like to thank Ivana Ilić, MD, PhD, as well as the members of Department of Animal Physiology at the Faculty of Science Zagreb for their generous help with the laboratory animals, and Nika Srb, MD, for manual editing of the graphs.
Conflicts of Interest
The authors declare no conflicts of interest. The funders had no role in the design of the study; in the collection, analyses, or interpretation of data; in the writing of the manuscript; or in the decision to publish the results.
References
- Rossini, M.; Adami, S.; Bertoldo, F.; Diacinti, D.; Gatti, D.; Giannini, S.; Giusti, A.; Malavolta, N.; Minisola, S.; Osella, G.; et al. Guidelines for the Diagnosis, Prevention and Management of Osteoporosis. Reumatismo 2016, 68, 1–39. [CrossRef]
- Bhatnagar, A.; Kekatpure, A.L. Postmenopausal Osteoporosis: A Literature Review. Cureus 14, e29367. [CrossRef]
- Kanis, J.A.; Norton, N.; Harvey, N.C.; Jacobson, T.; Johansson, H.; Lorentzon, M.; McCloskey, E. V.; Willers, C.; Borgström, F. SCOPE 2021: A New Scorecard for Osteoporosis in Europe. Arch. Osteoporos. 2021, 16, 1–82. [CrossRef]
- Rashki Kemmak, A.; Rezapour, A.; Jahangiri, R.; Nikjoo, S.; Farabi, H.; Soleimanpour, S. Economic Burden of Osteoporosis in the World: A Systematic Review. Med. J. Islam. Repub. Iran 2020, 34, 154. [CrossRef]
- Ji, M.-X.; Yu, Q. Primary Osteoporosis in Postmenopausal Women. Chronic Dis. Transl. Med. 2015, 1, 9–13. [CrossRef]
- Khosla, S.; Oursler, M.J.; Monroe, D.G. Estrogen and the Skeleton. Trends Endocrinol. Metab. 2012, 23, 576–581. [CrossRef]
- Prentice, R.L.; Anderson, G.L. The Women’s Health Initiative: Lessons Learned. Annu. Rev. Public Health 2008, 29, 131–150. [CrossRef]
- Liang, J.; Shang, Y. Estrogen and Cancer. Annu. Rev. Physiol. 2013, 75, 225–240. [CrossRef]
- LeBoff, M.S.; Greenspan, S.L.; Insogna, K.L.; Lewiecki, E.M.; Saag, K.G.; Singer, A.J.; Siris, E.S. The Clinician’s Guide to Prevention and Treatment of Osteoporosis. Osteoporos. Int. J. Establ. Result Coop. Eur. Found. Osteoporos. Natl. Osteoporos. Found. USA 2022, 1–54. [CrossRef]
- Langdahl, B.L. Overview of Treatment Approaches to Osteoporosis. Br. J. Pharmacol. 2021, 178, 1891–1906. [CrossRef]
- Li, H.; Xiao, Z.; Quarles, L.D.; Li, W. Osteoporosis: Mechanism, Molecular Target and Current Status on Drug Development. Curr. Med. Chem. 2021, 28, 1489–1507. [CrossRef]
- Pharmacology of Bisphosphonates - UpToDate Available online: https://www.uptodate.com/contents/pharmacology-of-bisphosphonates (accessed on 15 August 2023).
- Cummings, S.R.; Santora, A.C.; Black, D.M.; Russell, R.G.G. History of Alendronate. Bone 2020, 137, 115411. [CrossRef]
- Bauer, D.C.; Abrahamsen, B. Bisphosphonate Drug Holidays in Primary Care: When and What to Do Next? Curr. Osteoporos. Rep. 2021, 19, 182–188. [CrossRef]
- Park, J.-H.; Ko, H.-J. The Association between Treatment with Bisphosphonates and the Risk of Atrial Fibrillation: A Meta-Analysis of Observational Studies. Korean J. Fam. Med. 2022, 43, 69–76. [CrossRef]
- Drake, M.T.; Clarke, B.L.; Khosla, S. Bisphosphonates: Mechanism of Action and Role in Clinical Practice. Mayo Clin. Proc. 2008, 83, 1032–1045. [CrossRef]
- Aki, S.; Eskiyurt, N.; Akarirmak, U.; Tüzün, F.; Eryavuz, M.; Alper, S.; Arpacioğlu, O.; Atalay, F.; Kavuncu, V.; Kokino, S.; et al. Gastrointestinal Side Effect Profile Due to the Use of Alendronate in the Treatment of Osteoporosis. Yonsei Med. J. 2003, 44, 961–967. [CrossRef]
- Cremers, S.; Drake, M.T.; Ebetino, F.H.; Bilezikian, J.P.; Russell, R.G.G. Pharmacology of Bisphosphonates. Br. J. Clin. Pharmacol. 2019, 85, 1052–1062. [CrossRef]
- Kousteni, S.; Han, L.; Chen, J.-R.; Almeida, M.; Plotkin, L.I.; Bellido, T.; Manolagas, S.C. Kinase-Mediated Regulation of Common Transcription Factors Accounts for the Bone-Protective Effects of Sex Steroids. J. Clin. Invest. 2003, 111, 1651–1664. [CrossRef]
- Kousteni, S.; Bellido, T.; Plotkin, L.I.; O’Brien, C.A.; Bodenner, D.L.; Han, L.; Han, K.; DiGregorio, G.B.; Katzenellenbogen, J.A.; Katzenellenbogen, B.S.; et al. Nongenotropic, Sex-Nonspecific Signaling through the Estrogen or Androgen Receptors. Cell 2001, 104, 719–730. [CrossRef]
- Oršolić, N.; Nemrava, J.; Jeleč, Ž.; Kukolj, M.; Odeh, D.; Terzić, S.; Fureš, R.; Bagatin, T.; Bagatin, D. The Beneficial Effect of Proanthocyanidins and Icariin on Biochemical Markers of Bone Turnover in Rats. Int. J. Mol. Sci. 2018, 19, 2746. [CrossRef]
- Oršolić, N.; Nemrava, J.; Jeleč, Ž.; Kukolj, M.; Odeh, D.; Jakopović, B.; Jazvinšćak Jembrek, M.; Bagatin, T.; Fureš, R.; Bagatin, D. Antioxidative and Anti-Inflammatory Activities of Chrysin and Naringenin in a Drug-Induced Bone Loss Model in Rats. Int. J. Mol. Sci. 2022, 23, 2872. [CrossRef]
- Nie, X.; Jin, H.; Wen, G.; Xu, J.; An, J.; Liu, X.; Xie, R.; Tuo, B. Estrogen Regulates Duodenal Calcium Absorption Through Differential Role of Estrogen Receptor on Calcium Transport Proteins. Dig. Dis. Sci. 2020, 65, 3502–3513. [CrossRef]
- Perrone, P.; De Rosa, C.; D’Angelo, S. Polyphenols and Bone Health: A Comprehensive Review of Their Role in Osteoporosis Prevention and Treatment. Molecules 2025, 30, 4154. [CrossRef]
- Oršolić, N.; Nemrava, J.; Jeleč, Ž.; Kukolj, M.; Odeh, D.; Terzić, S.; Fureš, R.; Bagatin, T.; Bagatin, D. The Beneficial Effect of Proanthocyanidins and Icariin on Biochemical Markers of Bone Turnover in Rats. Int. J. Mol. Sci. 2018, 19, 2746. [CrossRef]
- Roseti, L.; Borciani, G.; Grassi, F.; Desando, G.; Gambari, L.; Grigolo, B. Nutraceuticals in Osteoporosis Prevention. Front. Nutr. 2024, 11. [CrossRef]
- Faienza, M.F.; Giardinelli, S.; Annicchiarico, A.; Chiarito, M.; Barile, B.; Corbo, F.; Brunetti, G. Nutraceuticals and Functional Foods: A Comprehensive Review of Their Role in Bone Health. Int. J. Mol. Sci. 2024, 25, 5873. [CrossRef]
- Li, Y.; Li, L.; Li, X.; Luo, B.; Ye, Q.; Wang, H.; Yang, L.; Zhu, X.; Han, L.; Zhang, R.; et al. A Mechanistic Review of Chinese Medicine Polyphenols on Bone Formation and Resorption. Front. Pharmacol. 2022, 13. [CrossRef]
- Tomczyk-Warunek, A.; Winiarska-Mieczan, A.; Blicharski, T.; Blicharski, R.; Kowal, F.; Pano, I.T.; Tomaszewska, E.; Muszyński, S. Consumption of Phytoestrogens Affects Bone Health by Regulating Estrogen Metabolism. J. Nutr. 2024, 154, 2611–2627. [CrossRef]
- Domínguez-López, I.; Yago-Aragón, M.; Salas-Huetos, A.; Tresserra-Rimbau, A.; Hurtado-Barroso, S. Effects of Dietary Phytoestrogens on Hormones throughout a Human Lifespan: A Review. Nutrients 2020, 12, 2456. [CrossRef]
- Viggiani, M.T.; Polimeno, L.; Di Leo, A.; Barone, M. Phytoestrogens: Dietary Intake, Bioavailability, and Protective Mechanisms against Colorectal Neoproliferative Lesions. Nutrients 2019, 11, 1709. [CrossRef]
- Desmawati, D.; Sulastri, D. Phytoestrogens and Their Health Effect. Open Access Maced. J. Med. Sci. 2019, 7, 495–499. [CrossRef]
- Keiler, A.M.; Helle, J.; Bader, M.I.; Ehrhardt, T.; Nestler, K.; Kretzschmar, G.; Bernhardt, R.; Vollmer, G.; Nikolić, D.; Bolton, J.L.; et al. A Standardized Humulus Lupulus (L.) Ethanol Extract Partially Prevents Ovariectomy-Induced Bone Loss in the Rat without Induction of Adverse Effects in the Uterus. Phytomedicine 2017, 34, 50–58. [CrossRef]
- Hümpel, M.; Isaksson, P.; Schaefer, O.; Kaufmann, U.; Ciana, P.; Maggi, A.; Schleuning, W.-D. Tissue Specificity of 8-Prenylnaringenin: Protection from Ovariectomy Induced Bone Loss with Minimal Trophic Effects on the Uterus. J. Steroid Biochem. Mol. Biol. 2005, 97, 299–305. [CrossRef]
- van Breemen, R.B.; Yuan, Y.; Banuvar, S.; Shulman, L.P.; Qiu, X.; Alvarenga, R.F.R.; Chen, S.-N.; Dietz, B.M.; Bolton, J.L.; Pauli, G.F.; et al. Pharmacokinetics of Prenylated Hop Phenols in Women Following Oral Administration of a Standardized Extract of Hops. Mol. Nutr. Food Res. 2014, 58, 1962–1969. [CrossRef]
- Paraiso, I.L.; Plagmann, L.S.; Yang, L.; Zielke, R.; Gombart, A.F.; Maier, C.S.; Sikora, A.E.; Blakemore, P.R.; Stevens, J.F. Reductive Metabolism of Xanthohumol and 8-Prenylnaringenin by the Intestinal Bacterium Eubacterium Ramulus. Mol. Nutr. Food Res. 2019, 63, e1800923. [CrossRef]
- Effect of a Hop Extract Standardized in 8-Prenylnaringenin on Bone Health and Gut Microbiome in Postmenopausal Women with Osteopenia: A One-Year Randomized, Double-Blind, Placebo-Controlled Trial Available online: https://www.mdpi.com/2072-6643/15/12/2688 (accessed on 6 October 2025).
- Chu, X.; Xing, H.; Chao, M.; Xie, P.; Jiang, L. Gut Microbiota Modulation in Osteoporosis: Probiotics, Prebiotics, and Natural Compounds. Metabolites 2025, 15, 301. [CrossRef]
- Štulíková, K.; Karabín, M.; Nešpor, J.; Dostálek, P. Therapeutic Perspectives of 8-Prenylnaringenin, a Potent Phytoestrogen from Hops. Molecules 2018, 23, 660. [CrossRef]
- Wanionok, N.E.; Colareda, G.A.; Fernandez, J.M. In Vitro Effects and Mechanisms of Humulus Lupulus Extract on Bone Marrow Progenitor Cells and Endothelial Cells. Mol. Cell. Endocrinol. 2024, 592, 112328. [CrossRef]
- Wanionok, N.E.; Colareda, G.A.; Fernandez, J.M. Humulus Lupulus Promoting Osteoblast Activity and Bone Integrity: Effects and Mechanisms. Biology 2025, 14, 582. [CrossRef]
- National Research Council (US) Committee for the Update of the Guide for the Care and Use of Laboratory Animals. Guide for the Care and Use of Laboratory Animals; National Academies Press: Washington, D.C., 2011; ISBN 978-0-309-15400-0.
- Zhang, R.; Yang, M.; Li, Y.; Liu, H.; Ren, M.; Tao, Z.-S. Effect of Alendronate on the Femoral Metaphyseal Defect under Carbamazepine in Ovariectomized Rats. J. Orthop. Surg. 2021, 16, 14. [CrossRef]
- Ban, Y.-H.; Yon, J.-M.; Cha, Y.; Choi, J.; An, E.S.; Guo, H.; Seo, D.W.; Kim, T.-S.; Lee, S.-P.; Kim, J.-C.; et al. A Hop Extract Lifenol® Improves Postmenopausal Overweight, Osteoporosis, and Hot Flash in Ovariectomized Rats. Evid.-Based Complement. Altern. Med. ECAM 2018, 2018, 2929107. [CrossRef]
- Fu, L.; Tang, T.; Hao, Y.; Dai, K. Long-Term Effects of Alendronate on Fracture Healing and Bone Remodeling of Femoral Shaft in Ovariectomized Rats. Acta Pharmacol. Sin. 2013, 34, 387–392. [CrossRef]
- Tokmak Özşahin, E.T.; Çam, B.; Dere, F.; Kürkçü, M.; Evrüke, C.; Soames, R.; Oğuz, Ö. The Effect of Alendronate Sodium on Trabecular Bone Structure in an Osteoporotic Rat Model. Turk. J. Phys. Med. Rehabil. 2017, 63, 165–173. [CrossRef]
- Nowak, B.; Poźniak, B.; Popłoński, J.; Bobak, Ł.; Matuszewska, A.; Kwiatkowska, J.; Dziewiszek, W.; Huszcza, E.; Szeląg, A. Pharmacokinetics of Xanthohumol in Rats of Both Sexes after Oral and Intravenous Administration of Pure Xanthohumol and Prenylflavonoid Extract. Adv. Clin. Exp. Med. Off. Organ Wroclaw Med. Univ. 2020, 29, 1101–1109. [CrossRef]
- Mukai, R.; Hata, N. Tissue Distribution and Pharmacokinetics of Isoxanthohumol from Hops in Rodents. Food Sci. Nutr. 2024, 12, 2210–2219. [CrossRef]
- Ronneberger, O.; Fischer, P.; Brox, T. U-Net: Convolutional Networks for Biomedical Image Segmentation. In Proceedings of the Lecture Notes in Computer Science (including subseries Lecture Notes in Artificial Intelligence and Lecture Notes in Bioinformatics); Springer Verlag, 2015; Vol. 9351, pp. 234–241.
- Buie, H.R.; Campbell, G.M.; Klinck, R.J.; MacNeil, J.A.; Boyd, S.K. Automatic Segmentation of Cortical and Trabecular Compartments Based on a Dual Threshold Technique for in Vivo Micro-CT Bone Analysis. Bone 2007, 41, 505–515. [CrossRef]
- Bouxsein, M.L.; Boyd, S.K.; Christiansen, B.A.; Guldberg, R.E.; Jepsen, K.J.; Müller, R. Guidelines for Assessment of Bone Microstructure in Rodents Using Micro-Computed Tomography. J. Bone Miner. Res. Off. J. Am. Soc. Bone Miner. Res. 2010, 25, 1468–1486. [CrossRef]
- JASP Team JASP (Version 0.95.2) [Computer Software] 2025.
- Callewaert, F.; Sinnesael, M.; Gielen, E.; Boonen, S.; Vanderschueren, D. Skeletal Sexual Dimorphism: Relative Contribution of Sex Steroids, GH–IGF1, and Mechanical Loading. J. Endocrinol. 2010, 207, 127–134. [CrossRef]
- Chen, X.; Wang, Z.; Duan, N.; Zhu, G.; Schwarz, E.M.; Xie, C. Osteoblast–Osteoclast Interactions. Connect. Tissue Res. 2018, 59, 99–107. [CrossRef]
- Luo, D.; Kang, L.; Ma, Y.; Chen, H.; Kuang, H.; Huang, Q.; He, M.; Peng, W. Effects and Mechanisms of 8-Prenylnaringenin on Osteoblast MC3T3-E1 and Osteoclast-like Cells RAW264.7. Food Sci. Nutr. 2014, 2, 341–350. [CrossRef]
- Kim, H.-N.; Ponte, F.; Nookaew, I.; Ucer Ozgurel, S.; Marques-Carvalho, A.; Iyer, S.; Warren, A.; Aykin-Burns, N.; Krager, K.; Sardao, V.A.; et al. Estrogens Decrease Osteoclast Number by Attenuating Mitochondria Oxidative Phosphorylation and ATP Production in Early Osteoclast Precursors. Sci. Rep. 2020, 10, 11933. [CrossRef]
- Weinstein, R.S.; Roberson, P.K.; Manolagas, S.C. Giant Osteoclast Formation and Long-Term Oral Bisphosphonate Therapy. N. Engl. J. Med. 2009, 360, 53–62. [CrossRef]
- Norton, J.T.; Hayashi, T.; Crain, B.; Cho, J.S.; Miller, L.S.; Corr, M.; Carson, D.A. Cutting Edge: Nitrogen Bisphosphonate-Induced Inflammation Is Dependent upon Mast Cells and IL-1. J. Immunol. Baltim. Md 1950 2012, 188, 2977–2980. [CrossRef]
- Oršolić, N.; Jazvinšćak Jembrek, M. Molecular and Cellular Mechanisms of Propolis and Its Polyphenolic Compounds against Cancer. Int. J. Mol. Sci. 2022, 23, 10479. [CrossRef]
- Procházková, D.; Boušová, I.; Wilhelmová, N. Antioxidant and Prooxidant Properties of Flavonoids. Fitoterapia 2011, 82, 513–523. [CrossRef]
- Simunkova, M.; Barbierikova, Z.; Jomova, K.; Hudecova, L.; Lauro, P.; Alwasel, S.H.; Alhazza, I.; Rhodes, C.J.; Valko, M. Antioxidant vs. Prooxidant Properties of the Flavonoid, Kaempferol, in the Presence of Cu(II) Ions: A ROS-Scavenging Activity, Fenton Reaction and DNA Damage Study. Int. J. Mol. Sci. 2021, 22, 1619. [CrossRef]
- Vona, R.; Gambardella, L.; Ortona, E.; Santulli, M.; Malorni, W.; Carè, A.; Pietraforte, D.; Straface, E. Functional Estrogen Receptors of Red Blood Cells. Do They Influence Intracellular Signaling? Cell. Physiol. Biochem. 2019, 53, 186–199. [CrossRef]
- Sánchez-Aguilera, A.; Arranz, L.; Martín-Pérez, D.; García-García, A.; Stavropoulou, V.; Kubovcakova, L.; Isern, J.; Martín-Salamanca, S.; Langa, X.; Skoda, R.C.; et al. Estrogen Signaling Selectively Induces Apoptosis of Hematopoietic Progenitors and Myeloid Neoplasms without Harming Steady-State Hematopoiesis. Cell Stem Cell 2014, 15, 791–804. [CrossRef]
- Roma, A.; Spagnuolo, P.A. Estrogen Receptors Alpha and Beta in Acute Myeloid Leukemia. Cancers 2020, 12, 907. [CrossRef]
- Butkiewicz, A.M.; Kemona, H.; Dymicka-Piekarska, V.; Matowicka-Karna, J. Does Menopause Affect Thrombocytopoiesis and Platelet Activation? Przegl. Lek. 2006, 63, 1291–1293.
- Kim, J.; Kim, H.S.; Lee, H.S.; Kwon, Y.-J. The Relationship between Platelet Count and Bone Mineral Density: Results from Two Independent Population-Based Studies. Arch. Osteoporos. 2020, 15, 43. [CrossRef]
- Kristjansdottir, H.L.; Mellström, D.; Johansson, P.; Karlsson, M.; Vandenput, L.; Lorentzon, M.; Herlitz, H.; Ohlsson, C.; Lerner, U.H.; Lewerin, C. High Platelet Count Is Associated with Low Bone Mineral Density: The MrOS Sweden Cohort. Osteoporos. Int. 2021, 32, 865–871. [CrossRef]
- Kim, H.-L.; Cho, H.Y.; Park, I.Y.; Choi, J.M.; Kim, M.; Jang, H.J.; Hwang, S.-M. The Positive Association between Peripheral Blood Cell Counts and Bone Mineral Density in Postmenopausal Women. Yonsei Med. J. 2011, 52, 739. [CrossRef]
- Dupuis, M.; Severin, S.; Noirrit-Esclassan, E.; Arnal, J.-F.; Payrastre, B.; Valéra, M.-C. Effects of Estrogens on Platelets and Megakaryocytes. Int. J. Mol. Sci. 2019, 20, 3111. [CrossRef]
- Do, H.J.; Shin, J.-S.; Lee, J.; Lee, Y.J.; Kim, M.; Nam, D.; Kim, E.-J.; Park, Y.; Suhr, K.; Ha, I.-H. Association between Liver Enzymes and Bone Mineral Density in Koreans: A Cross-Sectional Study. BMC Musculoskelet. Disord. 2018, 19, 410. [CrossRef]
- Breitling, L.P. Liver Enzymes and Bone Mineral Density in the General Population. J. Clin. Endocrinol. Metab. 2015, 100, 3832–3840. [CrossRef]
- Bisphosphonates; National Institute of Diabetes and Digestive and Kidney Diseases, 2012;
- Turner, A.S.; Alvis, M.; Myers, W.; Stevens, M.L.; Lundy, M.W. Changes in Bone Mineral Density and Bone-Specific Alkaline Phosphatase in Ovariectomized Ewes. Bone 1995, 17, 395–402. [CrossRef]
- Afshinnia, F.; Wong, K.K.; Sundaram, B.; Ackermann, R.J.; Pennathur, S. Hypoalbuminemia and Osteoporosis: Reappraisal of a Controversy. J. Clin. Endocrinol. Metab. 2016, 101, 167–175. [CrossRef]
- El-Kafoury, B.; Mohamed, F.; Bahgat, N.; El Samad, A.A.; Shawky, M.; Abdel-Hady, E.A. Failure of Subcutaneous Lipectomy to Combat Metabolic Dysregulations in Ovariectomy-Induced Obesity in Young Female Rats. Hormones 2022, 21, 421–436. [CrossRef]
- Park, S.; Sim, K.-S.; Hwangbo, Y.; Park, S.-J.; Kim, Y.-J.; Kim, J.-H. Naringenin and Phytoestrogen 8-Prenylnaringenin Protect against Islet Dysfunction and Inhibit Apoptotic Signaling in Insulin-Deficient Diabetic Mice. Molecules 2022, 27, 4227. [CrossRef]
- Pohjanvirta, R.; Nasri, A. The Potent Phytoestrogen 8-Prenylnaringenin: A Friend or a Foe? Int. J. Mol. Sci. 2022, 23, 3168. [CrossRef]
- Yoon, S.; Lee, J.; Lee, S.-M. Combined Treatment of Isoflavone Supplementation and Exercise Restores the Changes in Hepatic Protein Expression in Ovariectomized Rats - a Proteomics Approach. J. Int. Soc. Sports Nutr. 2014, 11, 29. [CrossRef]
- Papadaki, H.A.; Tsatsanis, C.; Christoforidou, A.; Malliaraki, N.; Psyllaki, M.; Pontikoglou, C.; Miliaki, M.; Margioris, A.N.; Eliopoulos, G.D. Alendronate Reduces Serum TNFalpha and IL-1beta, Increases Neutrophil Counts, and Improves Bone Mineral Density and Bone Metabolism Indices in Patients with Chronic Idiopathic Neutropenia (CIN)-Associated Osteopenia/Osteoporosis. J. Bone Miner. Metab. 2004, 22, 577–587. [CrossRef]
- Duque, G.; Rivas, D. Alendronate Has an Anabolic Effect on Bone Through the Differentiation of Mesenchymal Stem Cells. J. Bone Miner. Res. 2007, 22, 1603–1611. [CrossRef]
- Qvist, P.; Christgau, S.; Pedersen, B.J.; Schlemmer, A.; Christiansen, C. Circadian Variation in the Serum Concentration of C-Terminal Telopeptide of Type I Collagen (Serum CTx): Effects of Gender, Age, Menopausal Status, Posture, Daylight, Serum Cortisol, and Fasting. Bone 2002, 31, 57–61. [CrossRef]
- Song, L.; Bi, Y.; Zhang, P.; Yuan, X.; Liu, Y.; Zhang, Y.; Huang, J.; Zhou, K. Optimization of the Time Window of Interest in Ovariectomized Imprinting Control Region Mice for Antiosteoporosis Research. BioMed Res. Int. 2017, 2017, 1–10. [CrossRef]
- Kim, M.R.; Kim, H.J.; Yu, S.H.; Lee, B.S.; Jeon, S.Y.; Lee, J.J.; Lee, Y.C. Combination of Red Clover and Hops Extract Improved Menopause Symptoms in an Ovariectomized Rat Model. Evid. Based Complement. Alternat. Med. 2020, 2020, 1–9. [CrossRef]
- Sathyapalan, T.; Aye, M.; Rigby, A.S.; Fraser, W.D.; Thatcher, N.J.; Kilpatrick, E.S.; Atkin, S.L. Soy Reduces Bone Turnover Markers in Women During Early Menopause: A Randomized Controlled Trial. J. Bone Miner. Res. 2017, 32, 157–164. [CrossRef]
- Ming, L.-G.; Lv, X.; Ma, X.-N.; Ge, B.-F.; Zhen, P.; Song, P.; Zhou, J.; Ma, H.-P.; Xian, C.J.; Chen, K.-M. The Prenyl Group Contributes to Activities of Phytoestrogen 8-Prenynaringenin in Enhancing Bone Formation and Inhibiting Bone Resorption in Vitro. Endocrinology 2013, 154, 1202–1214. [CrossRef]
- Štulíková, K.; Karabín, M.; Nešpor, J.; Dostálek, P. Therapeutic Perspectives of 8-Prenylnaringenin, a Potent Phytoestrogen from Hops. Molecules 2018, 23, 660. [CrossRef]
- Schaefer, O.; Hümpel, M.; Fritzemeier, K.-H.; Bohlmann, R.; Schleuning, W.-D. 8-Prenyl Naringenin Is a Potent ERα Selective Phytoestrogen Present in Hops and Beer. J. Steroid Biochem. Mol. Biol. 2003, 84, 359–360. [CrossRef]
- Rođak, E.; Oršolić, N.; Grgac, R.; Rajc, J.; Bakula, M.; Bijelić, N. Analysis of Uterine Morphology in Ovariectomized Rats Treated With Alendronate and Hop Extract Using Open-Source Software. Image Anal. Stereol. 2022, 41, 193–202. [CrossRef]
- Ts, X.; Ly, L.; Qy, Z.; Yp, J.; Ch, L.; Xy, L.; Lp, Q.; Hl, X. Humulus Lupulus L. Extract Prevents Ovariectomy-Induced Osteoporosis in Mice and Regulates Activities of Osteoblasts and Osteoclasts. Chin. J. Integr. Med. 2021, 27. [CrossRef]
- Nowak, B.; Matuszewska, A.; Popłoński, J.; Nikodem, A.; Filipiak, J.; Tomanik, M.; Dziewiszek, W.; Danielewski, M.; Belowska-Bień, K.; Kłobucki, M.; et al. Prenylflavonoids Counteract Ovariectomy-Induced Disturbances in Rats. J. Funct. Foods 2021, 86, 104742. [CrossRef]
- Lecomte, M.; Tomassi, D.; Rizzoli, R.; Tenon, M.; Berton, T.; Harney, S.; Fança-Berthon, P. Effect of a Hop Extract Standardized in 8-Prenylnaringenin on Bone Health and Gut Microbiome in Postmenopausal Women with Osteopenia: A One-Year Randomized, Double-Blind, Placebo-Controlled Trial. Nutrients 2023, 15, 2688. [CrossRef]
- Sansai, K.; Na Takuathung, M.; Khatsri, R.; Teekachunhatean, S.; Hanprasertpong, N.; Koonrungsesomboon, N. Effects of Isoflavone Interventions on Bone Mineral Density in Postmenopausal Women: A Systematic Review and Meta-Analysis of Randomized Controlled Trials. Osteoporos. Int. J. Establ. Result Coop. Eur. Found. Osteoporos. Natl. Osteoporos. Found. USA 2020, 31, 1853–1864. [CrossRef]
- Tomczyk-Warunek, A.; Winiarska-Mieczan, A.; Blicharski, T.; Blicharski, R.; Kowal, F.; Pano, I.T.; Tomaszewska, E.; Muszyński, S. Consumption of Phytoestrogens Affects Bone Health by Regulating Estrogen Metabolism. J. Nutr. 2024, 154, 2611–2627. [CrossRef]
- Pecyna, P.; Wargula, J.; Murias, M.; Kucinska, M. More Than Resveratrol: New Insights into Stilbene-Based Compounds. Biomolecules 2020, 10, 1111. [CrossRef]
- Xu, S.; Xia, T.; Zhang, J.; Jiang, Y.; Wang, N.; Xin, H. Protective Effects of Bitter Acids from Humulus Lupulus L. against Senile Osteoporosis via Activating Nrf2/HO-1/NQO1 Pathway in D-Galactose Induced Aging Mice. J. Funct. Foods 2022, 94, 105099. [CrossRef]
- Hümpel, M.; Isaksson, P.; Schaefer, O.; Kaufmann, U.; Ciana, P.; Maggi, A.; Schleuning, W.-D. Tissue Specificity of 8-Prenylnaringenin: Protection from Ovariectomy Induced Bone Loss with Minimal Trophic Effects on the Uterus. J. Steroid Biochem. Mol. Biol. 2005, 97, 299–305. [CrossRef]
- Aghamiri, V.; Mirghafourvand, M.; Mohammad-Alizadeh-Charandabi, S.; Nazemiyeh, H. The Effect of Hop (Humulus Lupulus L.) on Early Menopausal Symptoms and Hot Flashes: A Randomized Placebo-Controlled Trial. Complement. Ther. Clin. Pract. 2016, 23, 130–135. [CrossRef]
- Sengupta, P. The Laboratory Rat: Relating Its Age With Human’s. Int. J. Prev. Med. 2013, 4, 624–630.
- Yoo, Y.-S.; Kim, M.-G.; Park, H.-J.; Chae, M.-Y.; Choi, Y.-J.; Oh, C.-K.; Son, C.-G.; Lee, E.-J. Additional Effects of Herbal Medicine Combined with Bisphosphonates for Primary Osteoporosis: A Systematic Review and Meta-Analysis. Front. Pharmacol. 2024, 15, 1413515. [CrossRef]
- Dc, C.; K, R.; Kt, K.; Jk, S. The Therapeutic Effects of Combination Therapy with Curcumin and Alendronate on Spine Fusion Surgery in the Ovariectomized Rats. Korean J. Spine 2017, 14. [CrossRef]
- S, M.; S, V.; F, Z.; A, S.; M, J.; S, S.; D, R.; A, V.; O, A.; M, S.; et al. Quercetin Potentiates the Anti-Osteoporotic Effects of Alendronate through Modulation of Autophagy and Apoptosis Mechanisms in Ovariectomy-Induced Bone Loss Rat Model. Mol. Biol. Rep. 2023, 50. [CrossRef]
- Cho, D.-C.; Ryu, K.; Kim, K.-T.; Sung, J.-K. The Therapeutic Effects of Combination Therapy with Curcumin and Alendronate on Spine Fusion Surgery in the Ovariectomized Rats. Korean J. Spine 2017, 14, 35–40. [CrossRef]
- Yamaguchi, M.; Levy, R.M. Combination of Alendronate and Genistein Synergistically Suppresses Osteoclastic Differentiation of RAW267.4 Cells in Vitro. Exp. Ther. Med. 2017, 14, 1769. [CrossRef]
- Kim, M.R.; Kim, H.J.; Yu, S.H.; Lee, B.S.; Jeon, S.Y.; Lee, J.J.; Lee, Y.C. Combination of Red Clover and Hops Extract Improved Menopause Symptoms in an Ovariectomized Rat Model. Evid.-Based Complement. Altern. Med. ECAM 2020, 2020, 7941391. [CrossRef]
Figure 1.
Representative 3D reconstructions of distal femora from a sham-operated control rat (A and C) and an ovariectomized, untreated rat (B and D). Panels A and B show sagittal section views of the bones, while panels C and D show a 2.5 mm-thick transverse section views of the same metaphyseal region of the bones in panels A and B. Six-month-old rats were ovariectomized or sham-operated. One month later, animals were assigned to treatment groups for two weeks and then euthanized. Femurs were harvested and fixed in 10% neutral buffered formalin, followed by a micro-CT analysis. Notable differences in trabecular architecture are visible in these representative images.
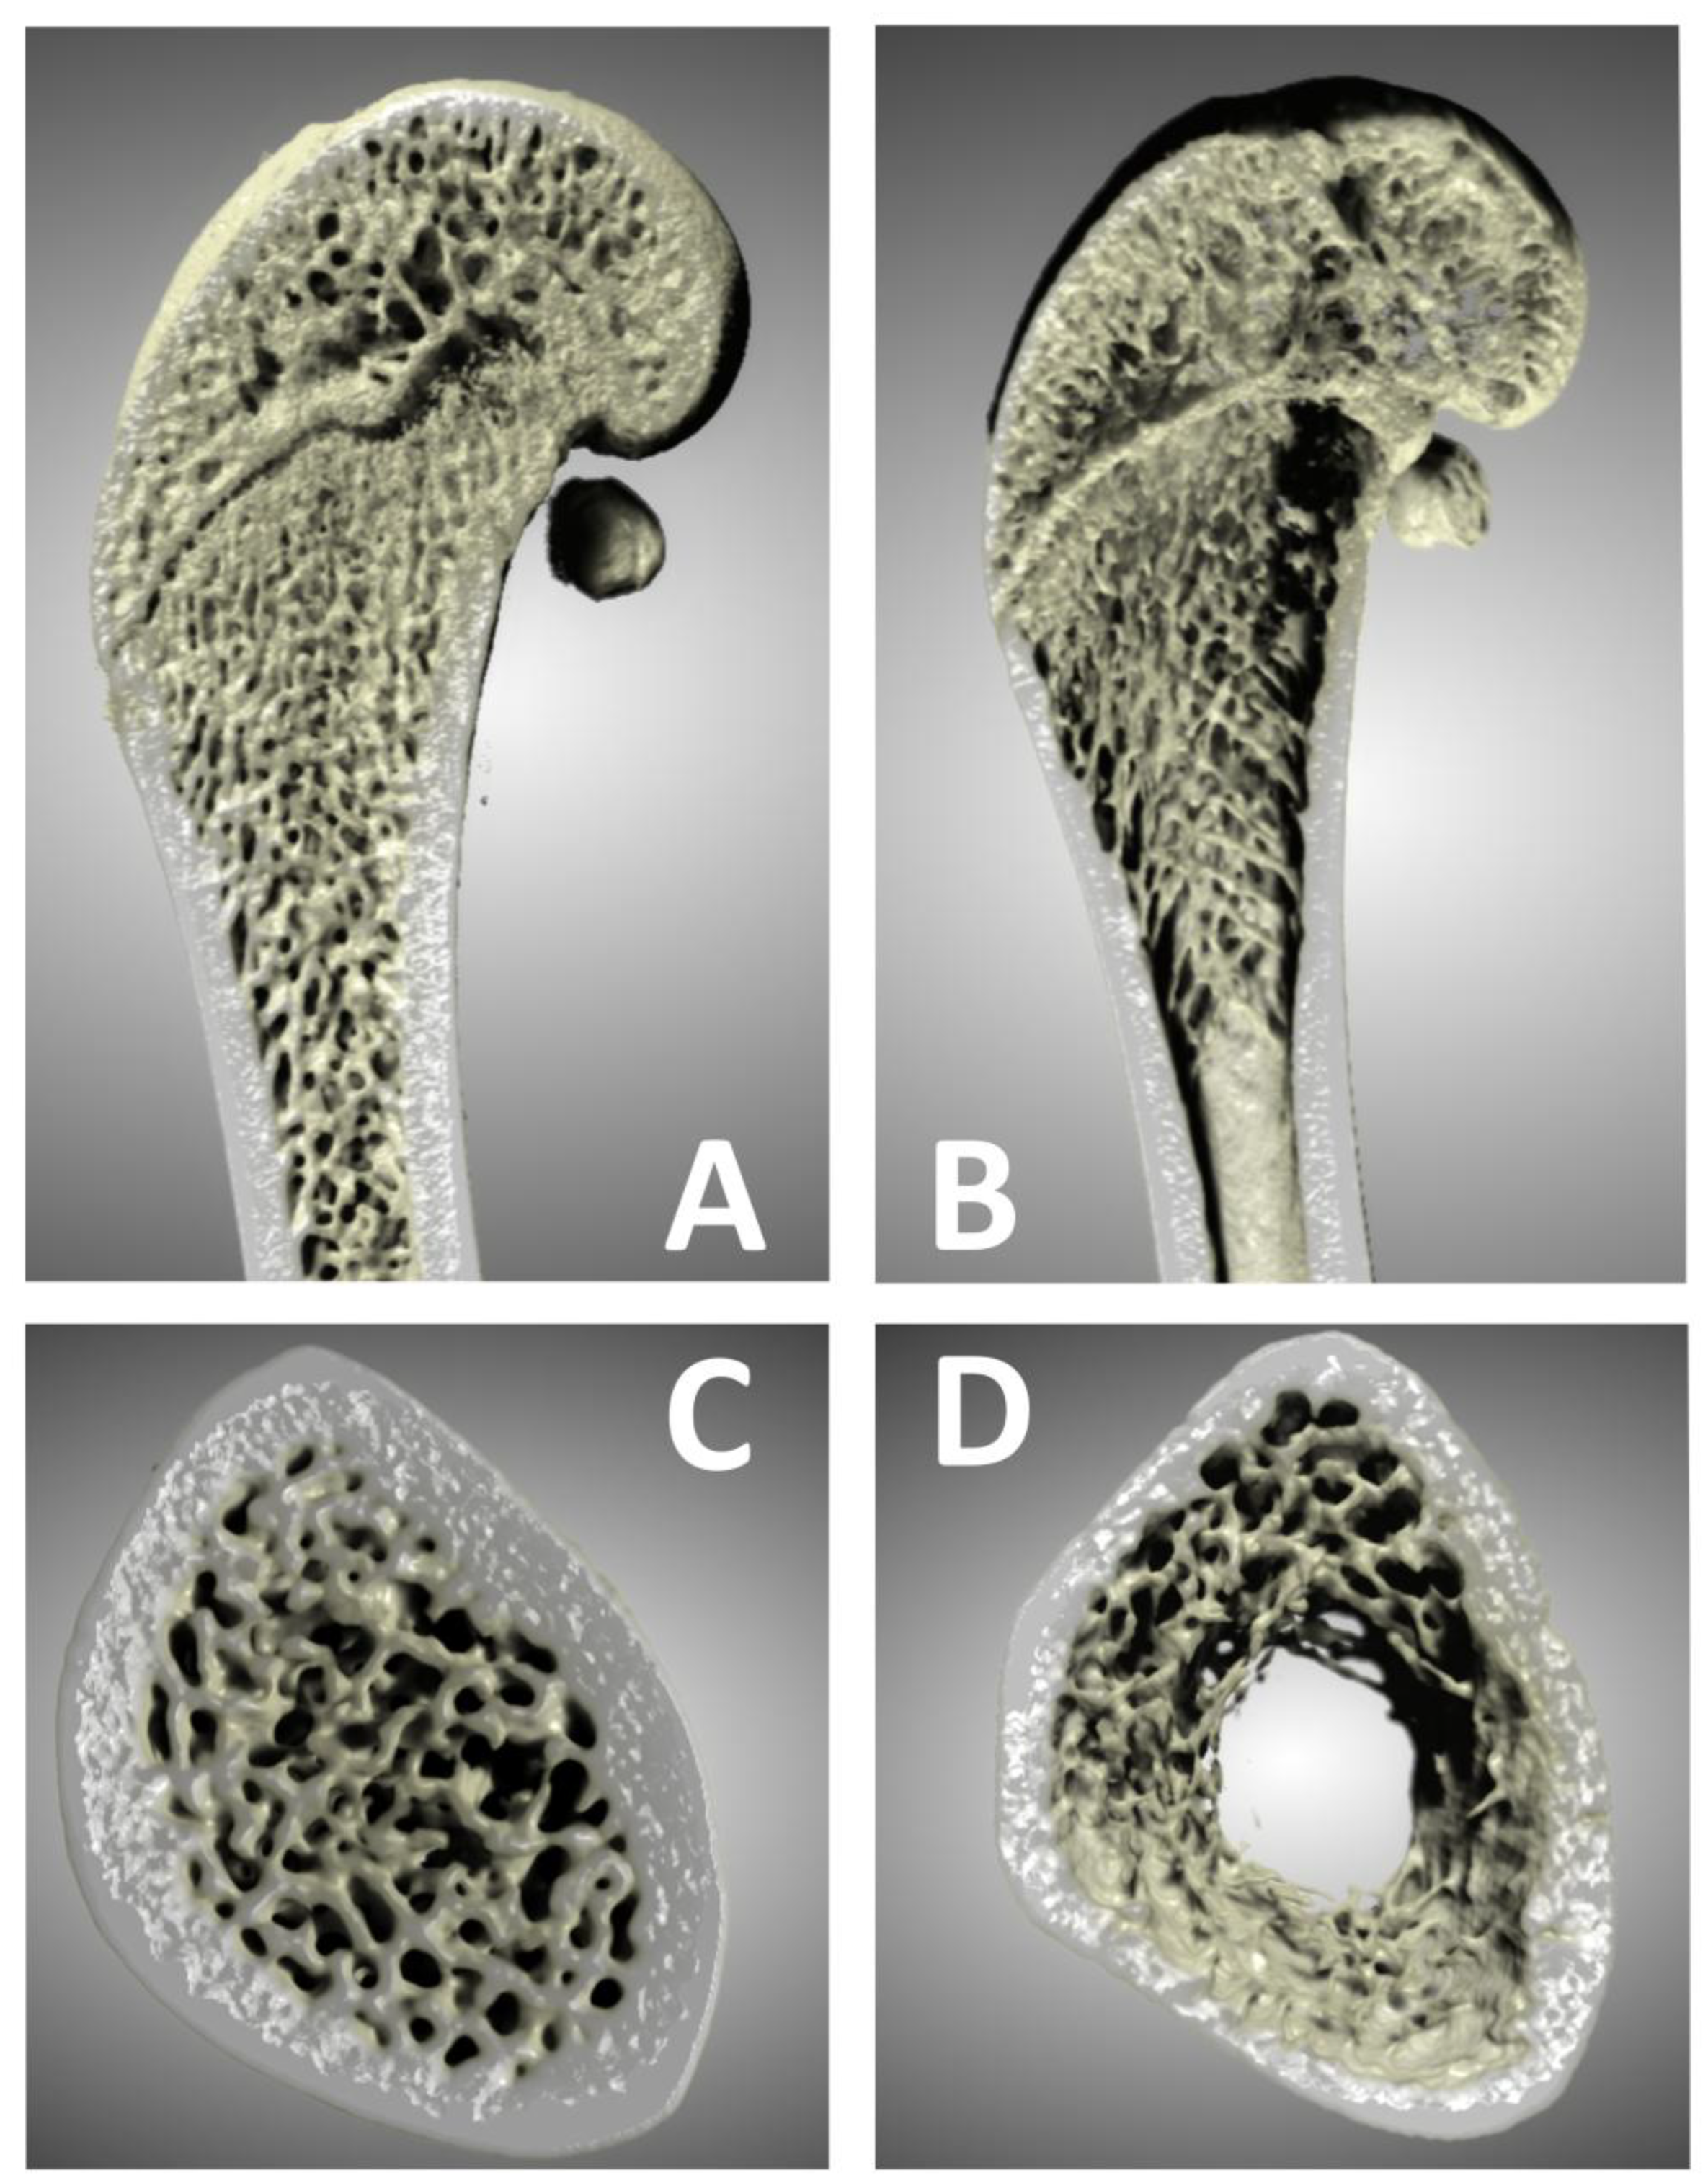
Figure 2.
Uterine weight comparison. Six-month-old rats were ovariectomized (n = 60) or sham-operated (n = 10). One month later, animals were assigned to treatment groups for two weeks and then euthanized. Uteri were harvested and weighed. Groups: C, sham-operated control group; OV, untreated ovariectomized animals; AL, ovariectomized animals, low alendronate dose; AH, ovariectomized animals, high alendronate dose; AL-X, ovariectomized animals, low alendronate dose and hop extract; AH-X, ovariectomized animals, high alendronate dose and hop extract; X, ovariectomized animals, hop extract (n = 8–10 animals per group). Data are shown as box-and-whisker plots (median, interquartile range, and full range). Statistical significance was assessed using Welch’s ANOVA, followed by Tukey post hoc tests. Statistically significant differences are indicated using a compact letter display (p < 0.001), where samples sharing the same letter are not significantly different.
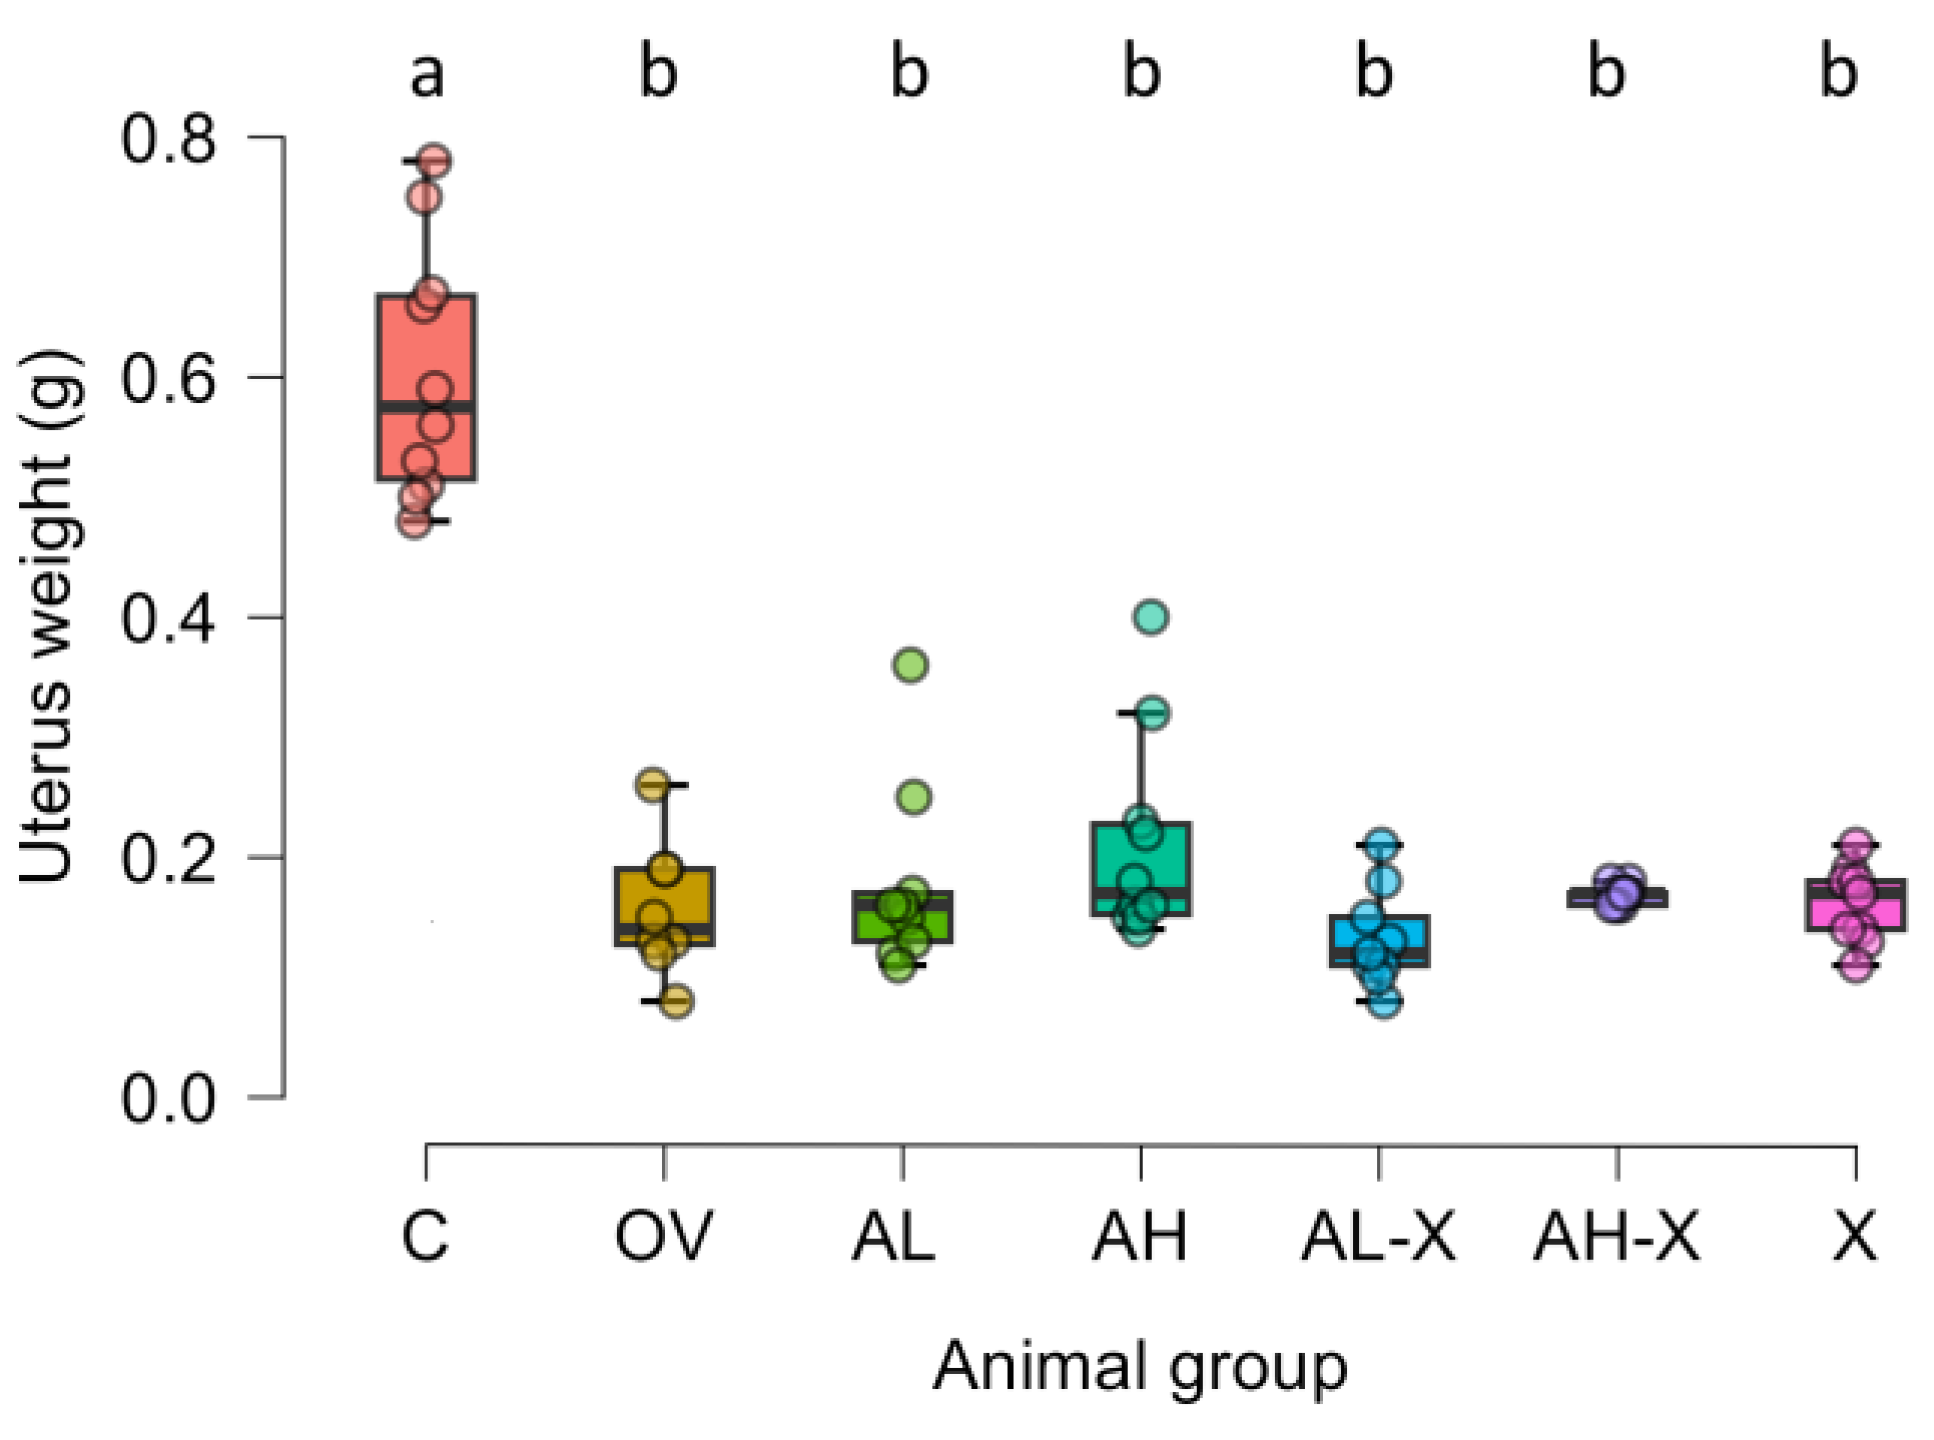
Figure 3.
Representative sagittal scans of distal femora across the groups. Six-month-old rats were ovariectomized (n = 60) or sham-operated (n = 10). One month later, animals were assigned to treatment groups for two weeks and then euthanized. Femurs were harvested and fixed in 10% neutral buffered formalin, followed by a micro-CT analysis. Groups: C, sham-operated control group; OV, untreated ovariectomized animals; AL, ovariectomized animals, low alendronate dose; AH, ovariectomized animals, high alendronate dose; AL-X, ovariectomized animals, low alendronate dose and hop extract; AH-X, ovariectomized animals, high alendronate dose and hop extract; X, ovariectomized animals, hop extract.
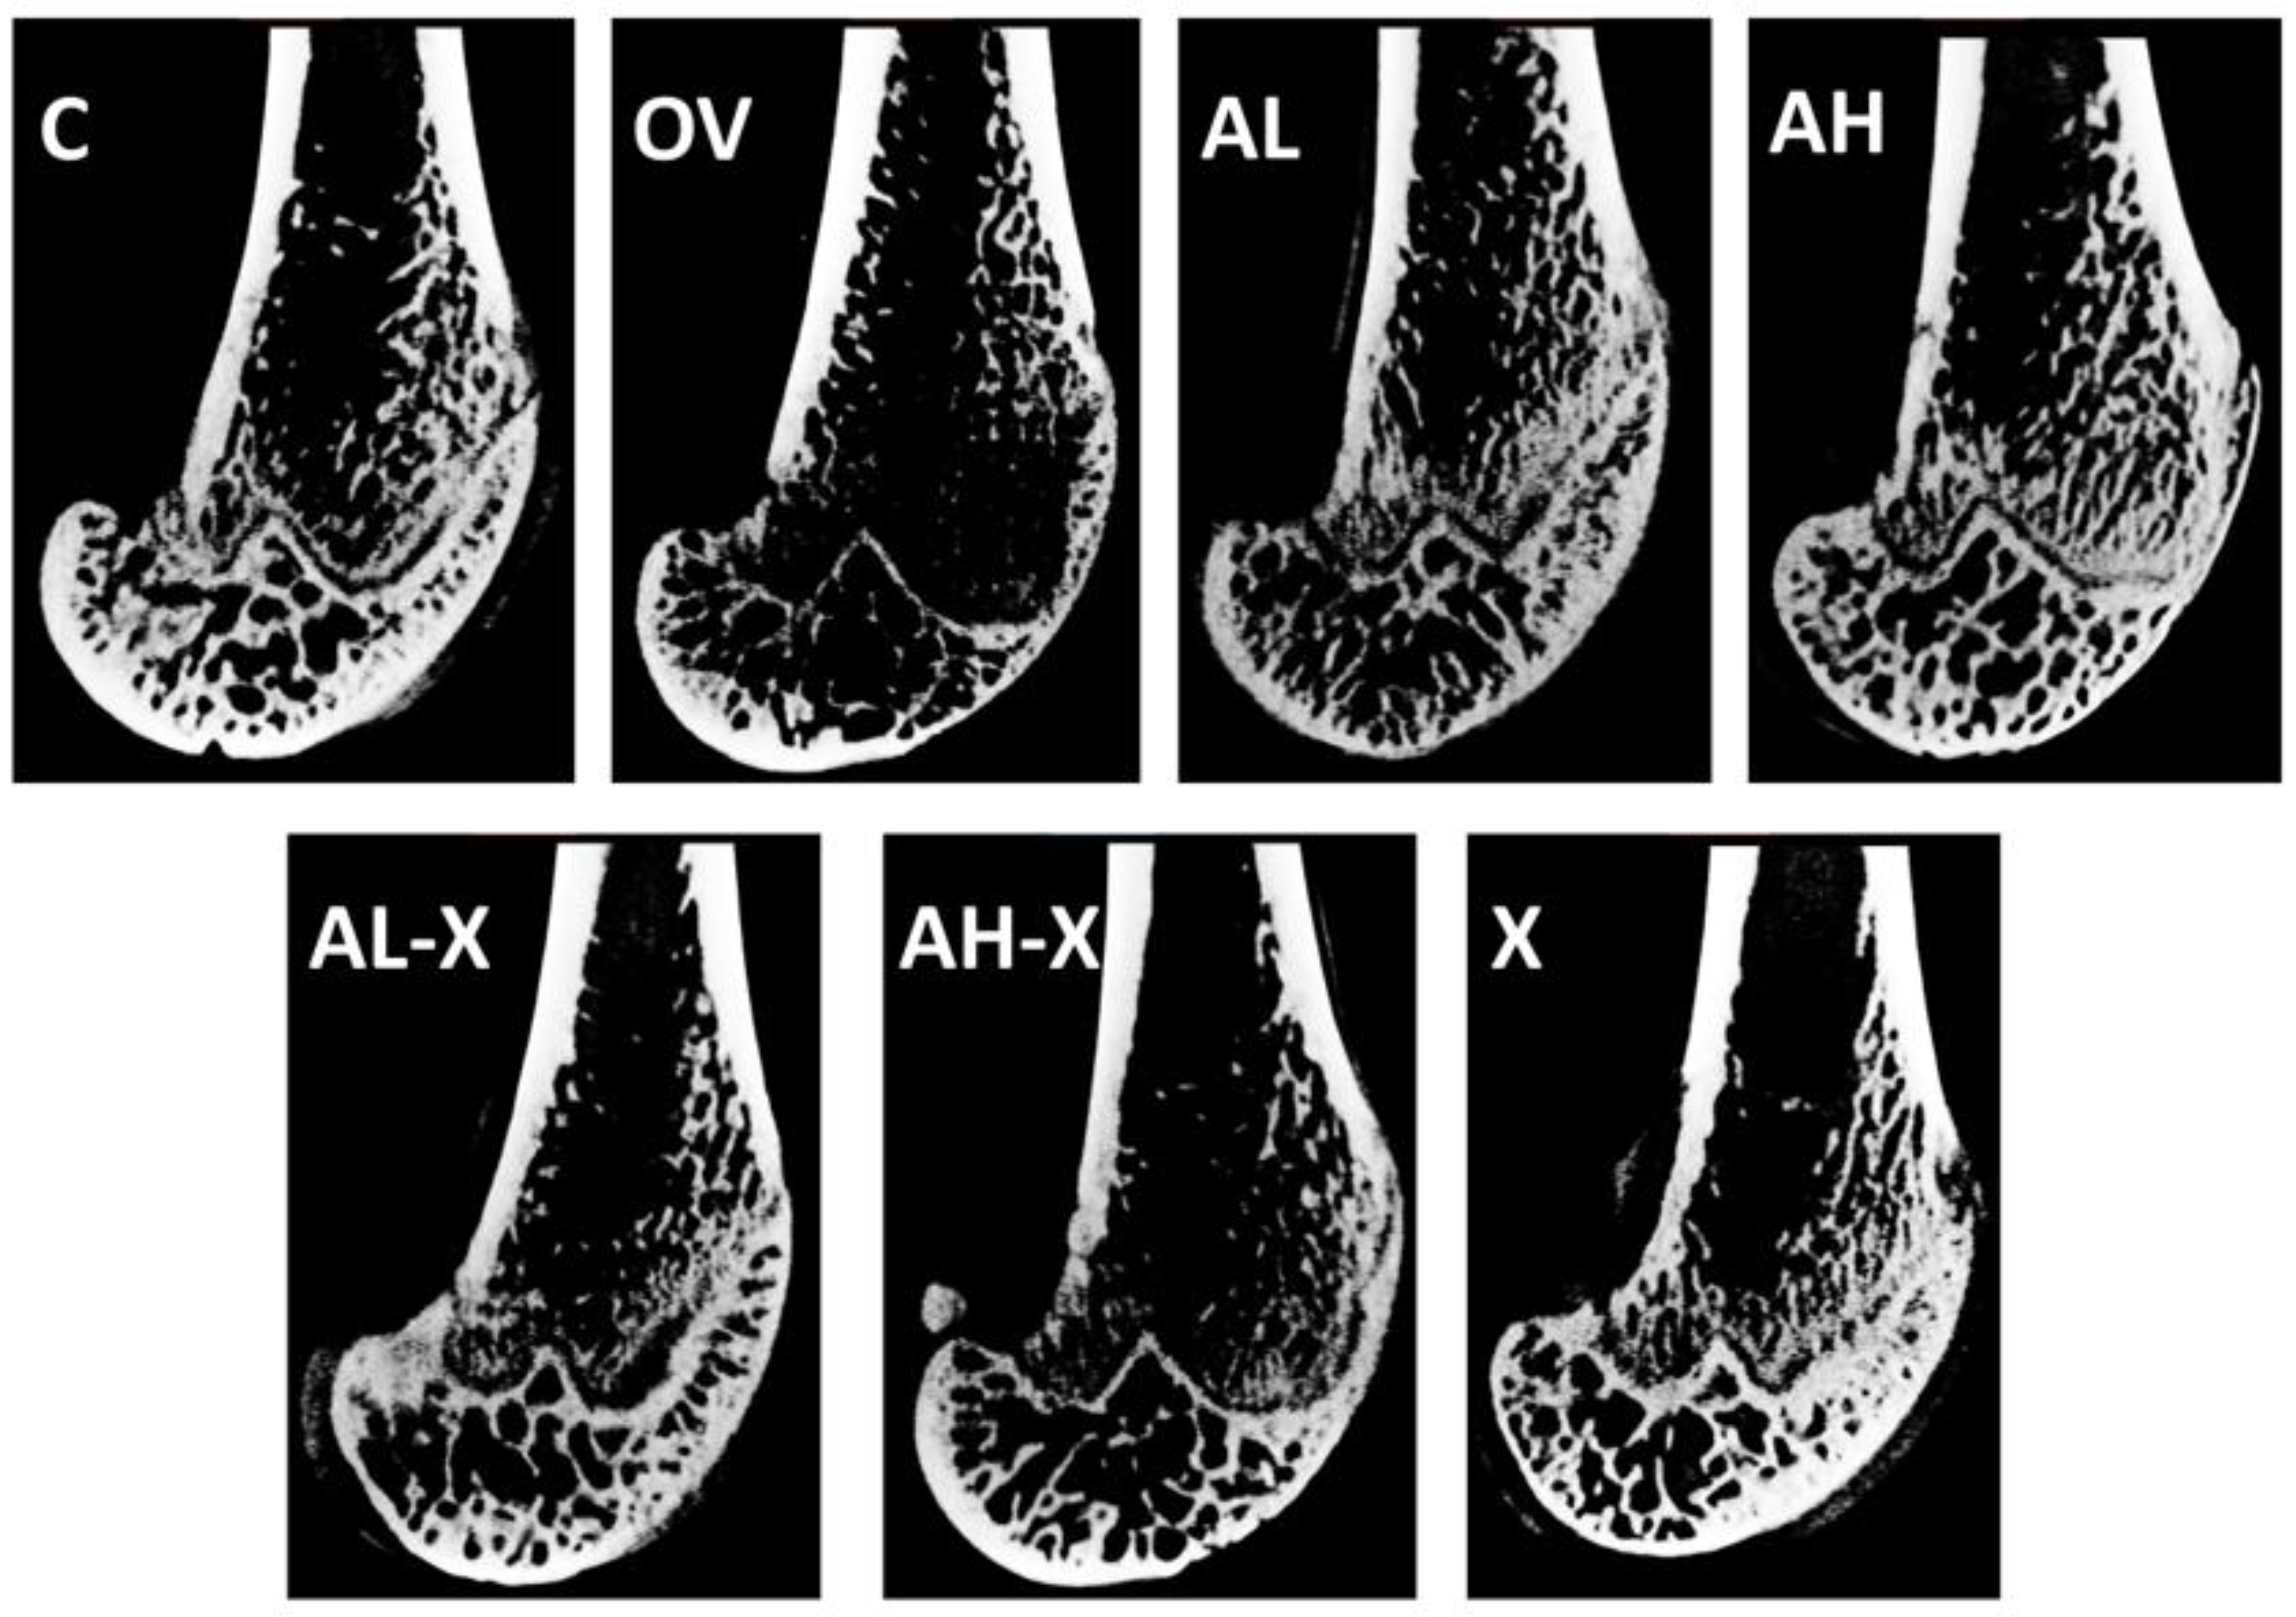
Figure 4.
Results of analyses of general bone tissue measurements. The figure shows bone volume (BV) (A), total volume (TV) (B), bone volume fraction (BV/TV) (C), and average marrow area (Ma.Ar) (D). Six-month-old rats were ovariectomized (n = 60) or sham-operated (n = 10). One month later, animals were assigned to treatment groups for two weeks and then euthanized. Femurs were harvested and fixed in 10% neutral buffered formalin for micro-CT analysis. Groups: C, sham-operated control group; OV, untreated ovariectomized animals; AL, ovariectomized animals, low alendronate dose; AH, ovariectomized animals, high alendronate dose; AL-X, ovariectomized animals, low alendronate dose and hop extract; AH-X, ovariectomized animals, high alendronate dose and hop extract; X, ovariectomized animals, hop extract (n = 9–10 animals per group). Data are shown as box-and-whisker plots (median, interquartile range, and full range). Statistical significance was assessed using Welch’s ANOVA, followed by Tukey post hoc tests. Statistically significant differences are indicated using a compact letter display (p < 0.05), where samples sharing the same letter are not significantly different. Absence of letter annotations indicates no statistically significant differences between groups.
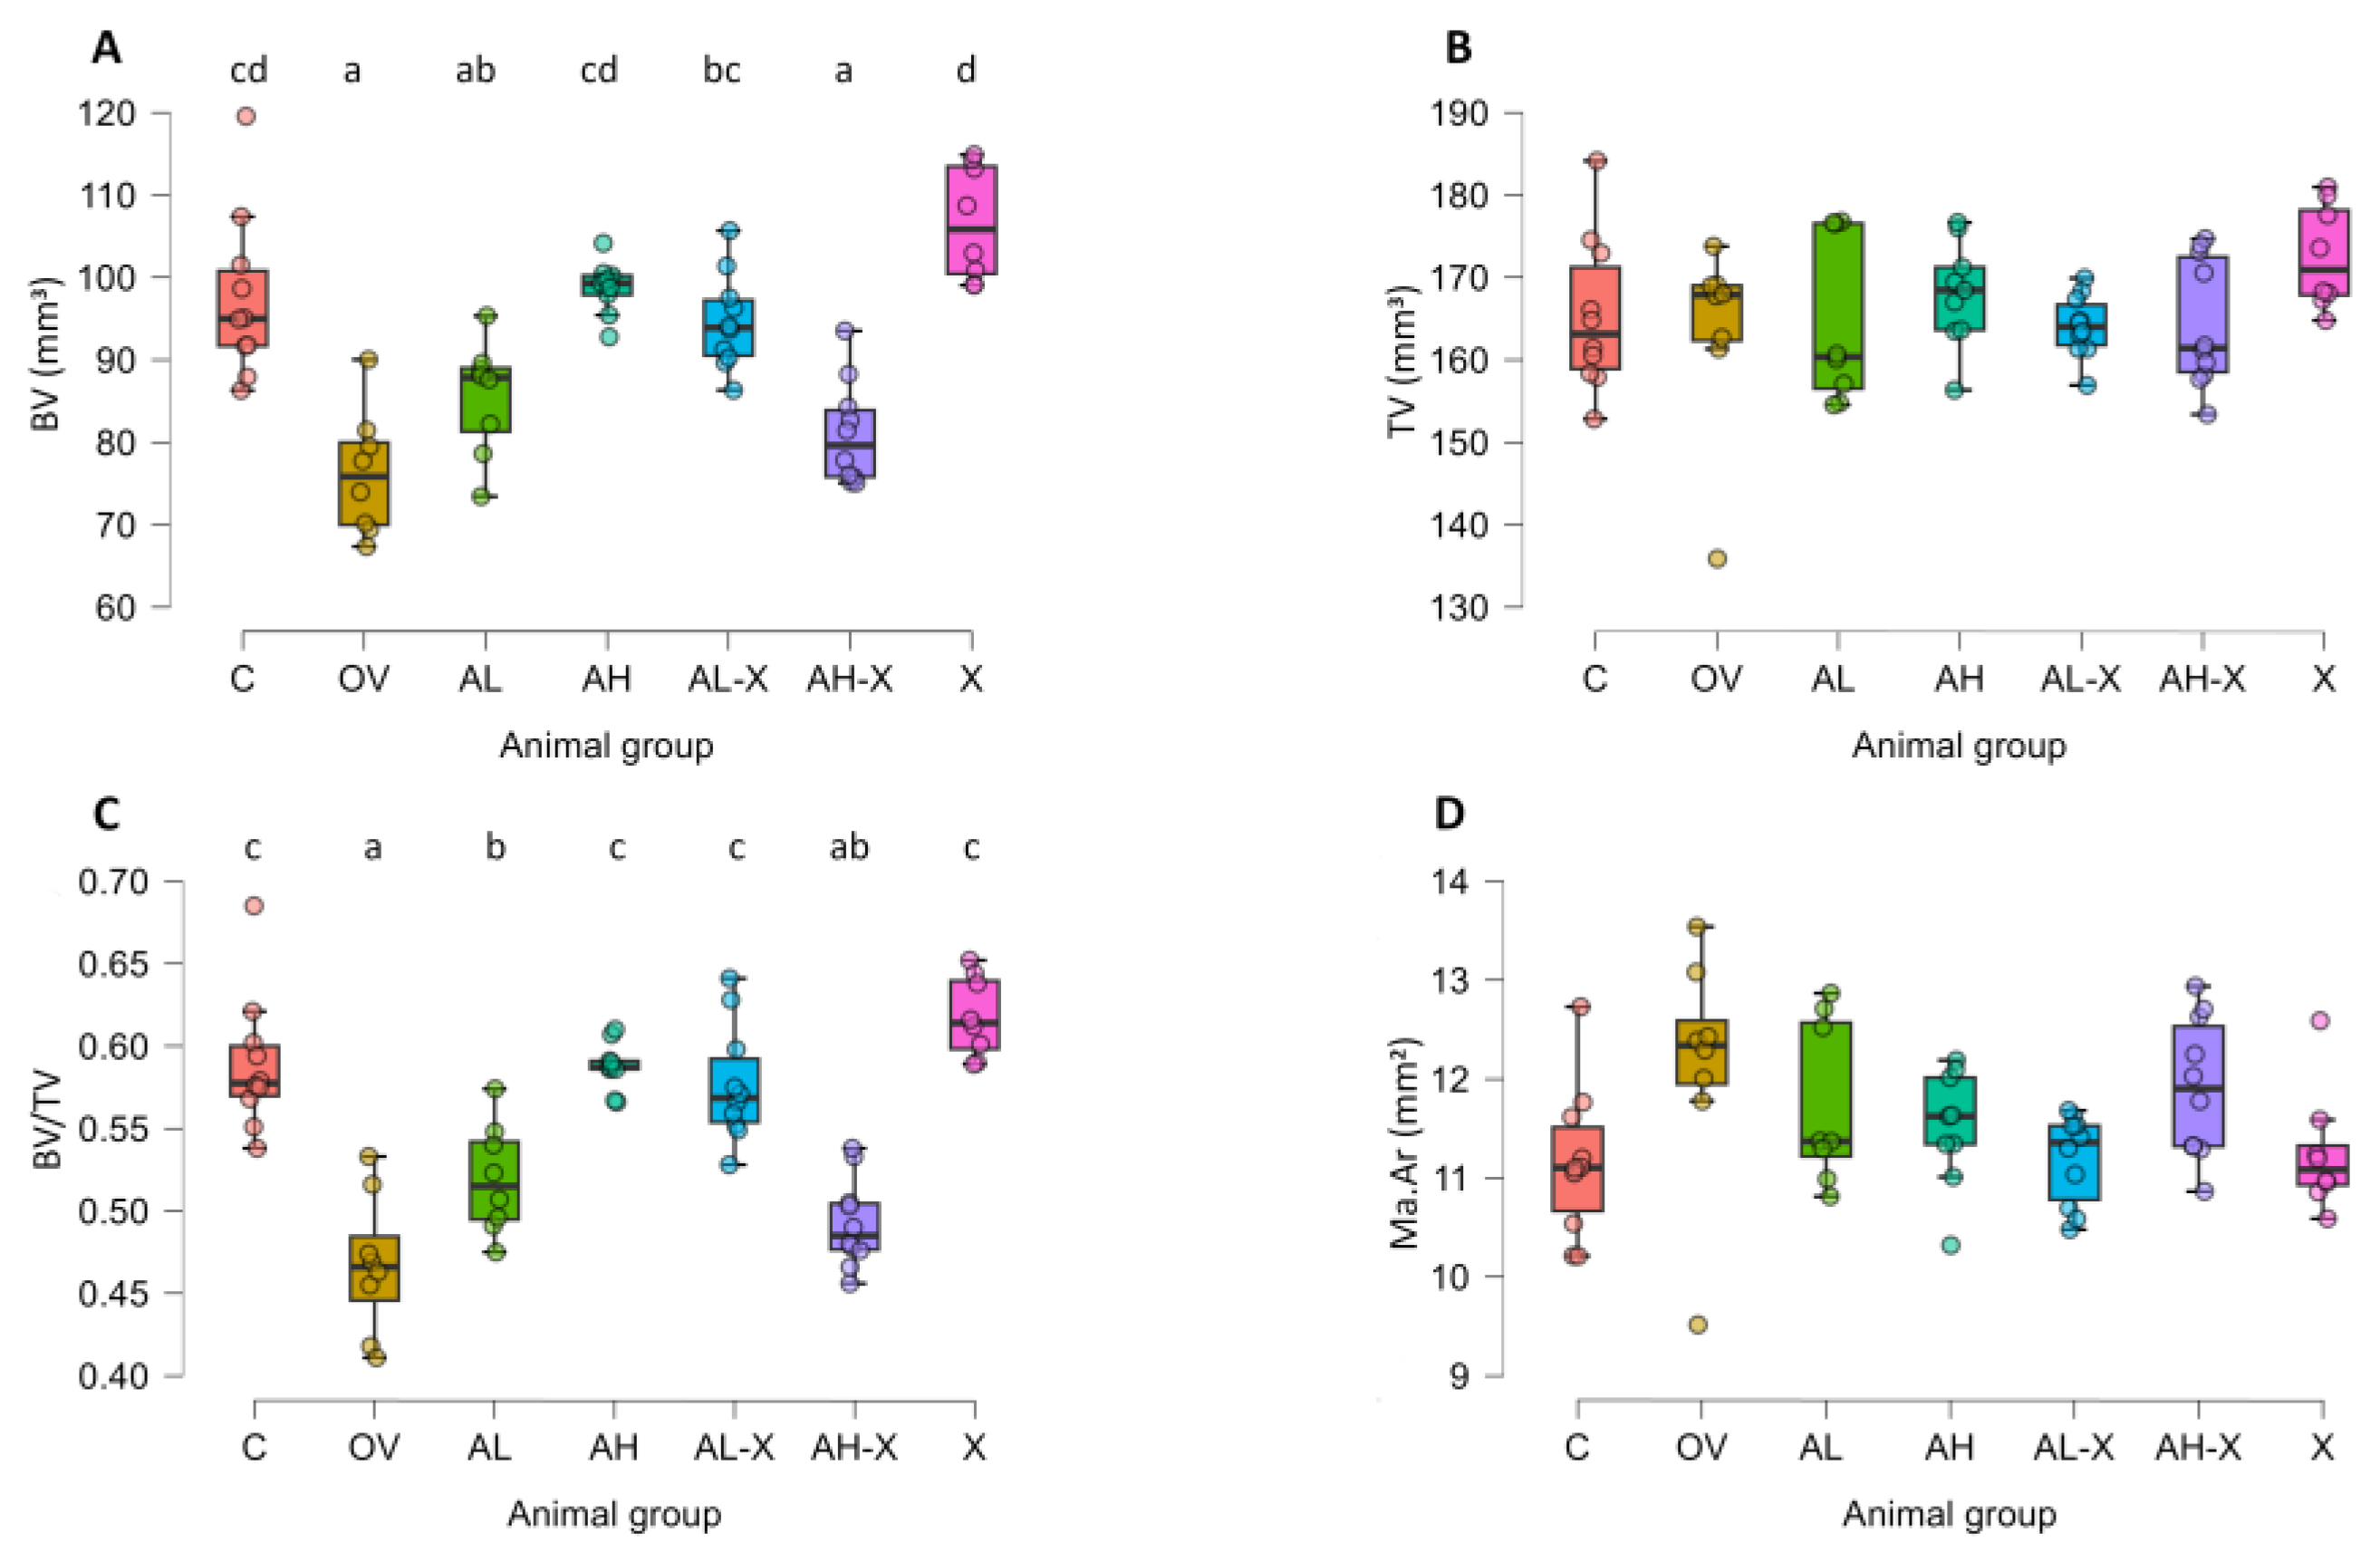
Figure 5.
Results of periosteal and endocortical measurements. The figure shows average periosteal perimeter (Ps.Pm) (A), periosteal surface (3D) (Ps.S3D) (B), average endocortical perimeter (Ec.Pm) (C), and endocortical surface (3D) (Ec.S3D) (D). Six-month-old rats were ovariectomized (n = 60) or sham-operated (n = 10). One month later, animals were assigned to treatment groups for two weeks and then euthanized. Femurs were harvested and fixed in 10% neutral buffered formalin for micro-CT analysis. Groups: Groups: C, sham-operated control group; OV, untreated ovariectomized animals; AL, ovariectomized animals, low alendronate dose; AH, ovariectomized animals, high alendronate dose; AL-X, ovariectomized animals, low alendronate dose and hop extract; AH-X, ovariectomized animals, high alendronate dose and hop extract; X, ovariectomized animals, hop extract (n = 9–10 animals per group). Data are shown as box-and-whisker plots (median, interquartile range, and full range). Statistical significance was assessed using Welch’s ANOVA, followed by Tukey post hoc tests. Statistically significant differences are indicated using a compact letter display (p < 0.05), where samples sharing the same letter are not significantly different. Absence of letter annotations indicates no statistically significant differences between groups.
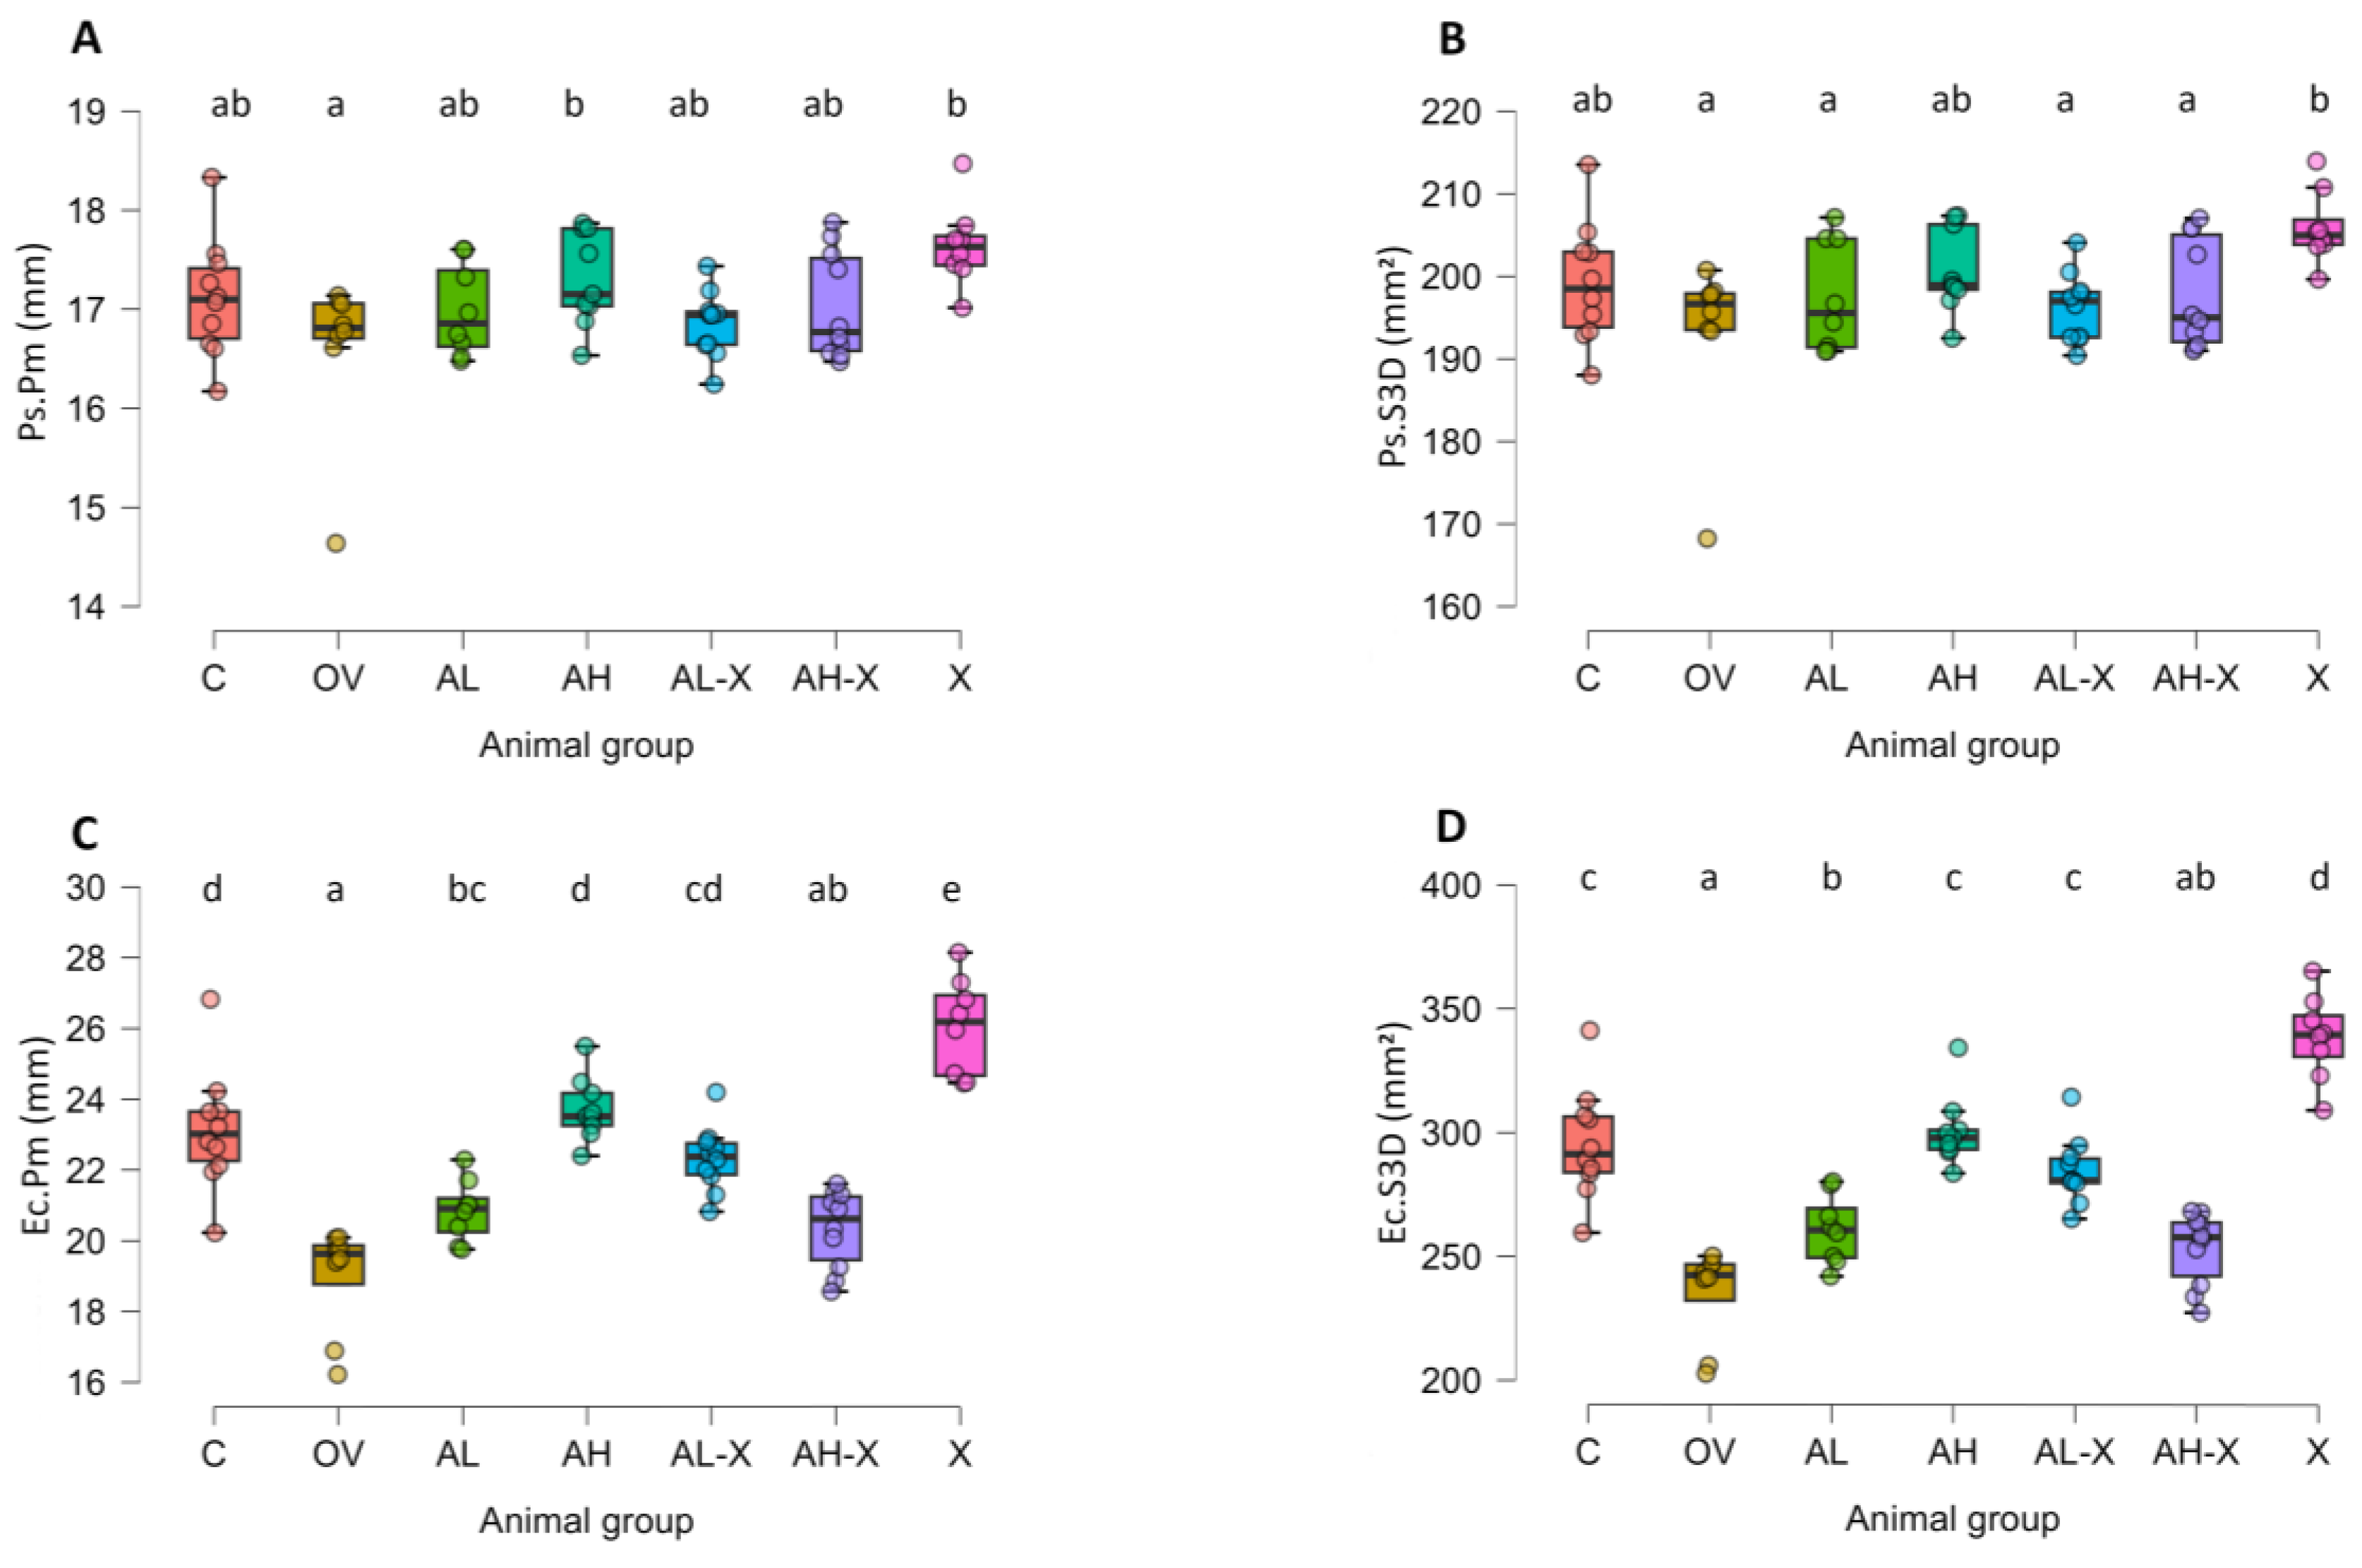
Figure 6.
Results of cortical bone tissue measurements. The figure shows average cortical area (Ct.Ar) (A), average total area (Tt.Ar) (B), average cortical area fraction (Ct.Ar/Tt.Ar) (C), and average cortical thickness (Ct.Th) (D). Six-month-old rats were ovariectomized (n = 60) or sham-operated (n = 10). One month later, animals were assigned to treatment groups for two weeks and then euthanized. Femurs were harvested and fixed in 10% neutral buffered formalin for micro-CT analysis. Groups: C, sham-operated control group; OV, untreated ovariectomized animals; AL, ovariectomized animals, low alendronate dose; AH, ovariectomized animals, high alendronate dose; AL-X, ovariectomized animals, low alendronate dose and hop extract; AH-X, ovariectomized animals, high alendronate dose and hop extract; X, ovariectomized animals, hop extract (n = 9–10 animals per group). Data are shown as box-and-whisker plots (median, interquartile range, and full range). Statistical significance was assessed using Welch’s ANOVA, followed by Tukey post hoc tests. Statistically significant differences are indicated using a compact letter display (p < 0.05), where samples sharing the same letter are not significantly different. Absence of letter annotations indicates no statistically significant differences between groups.
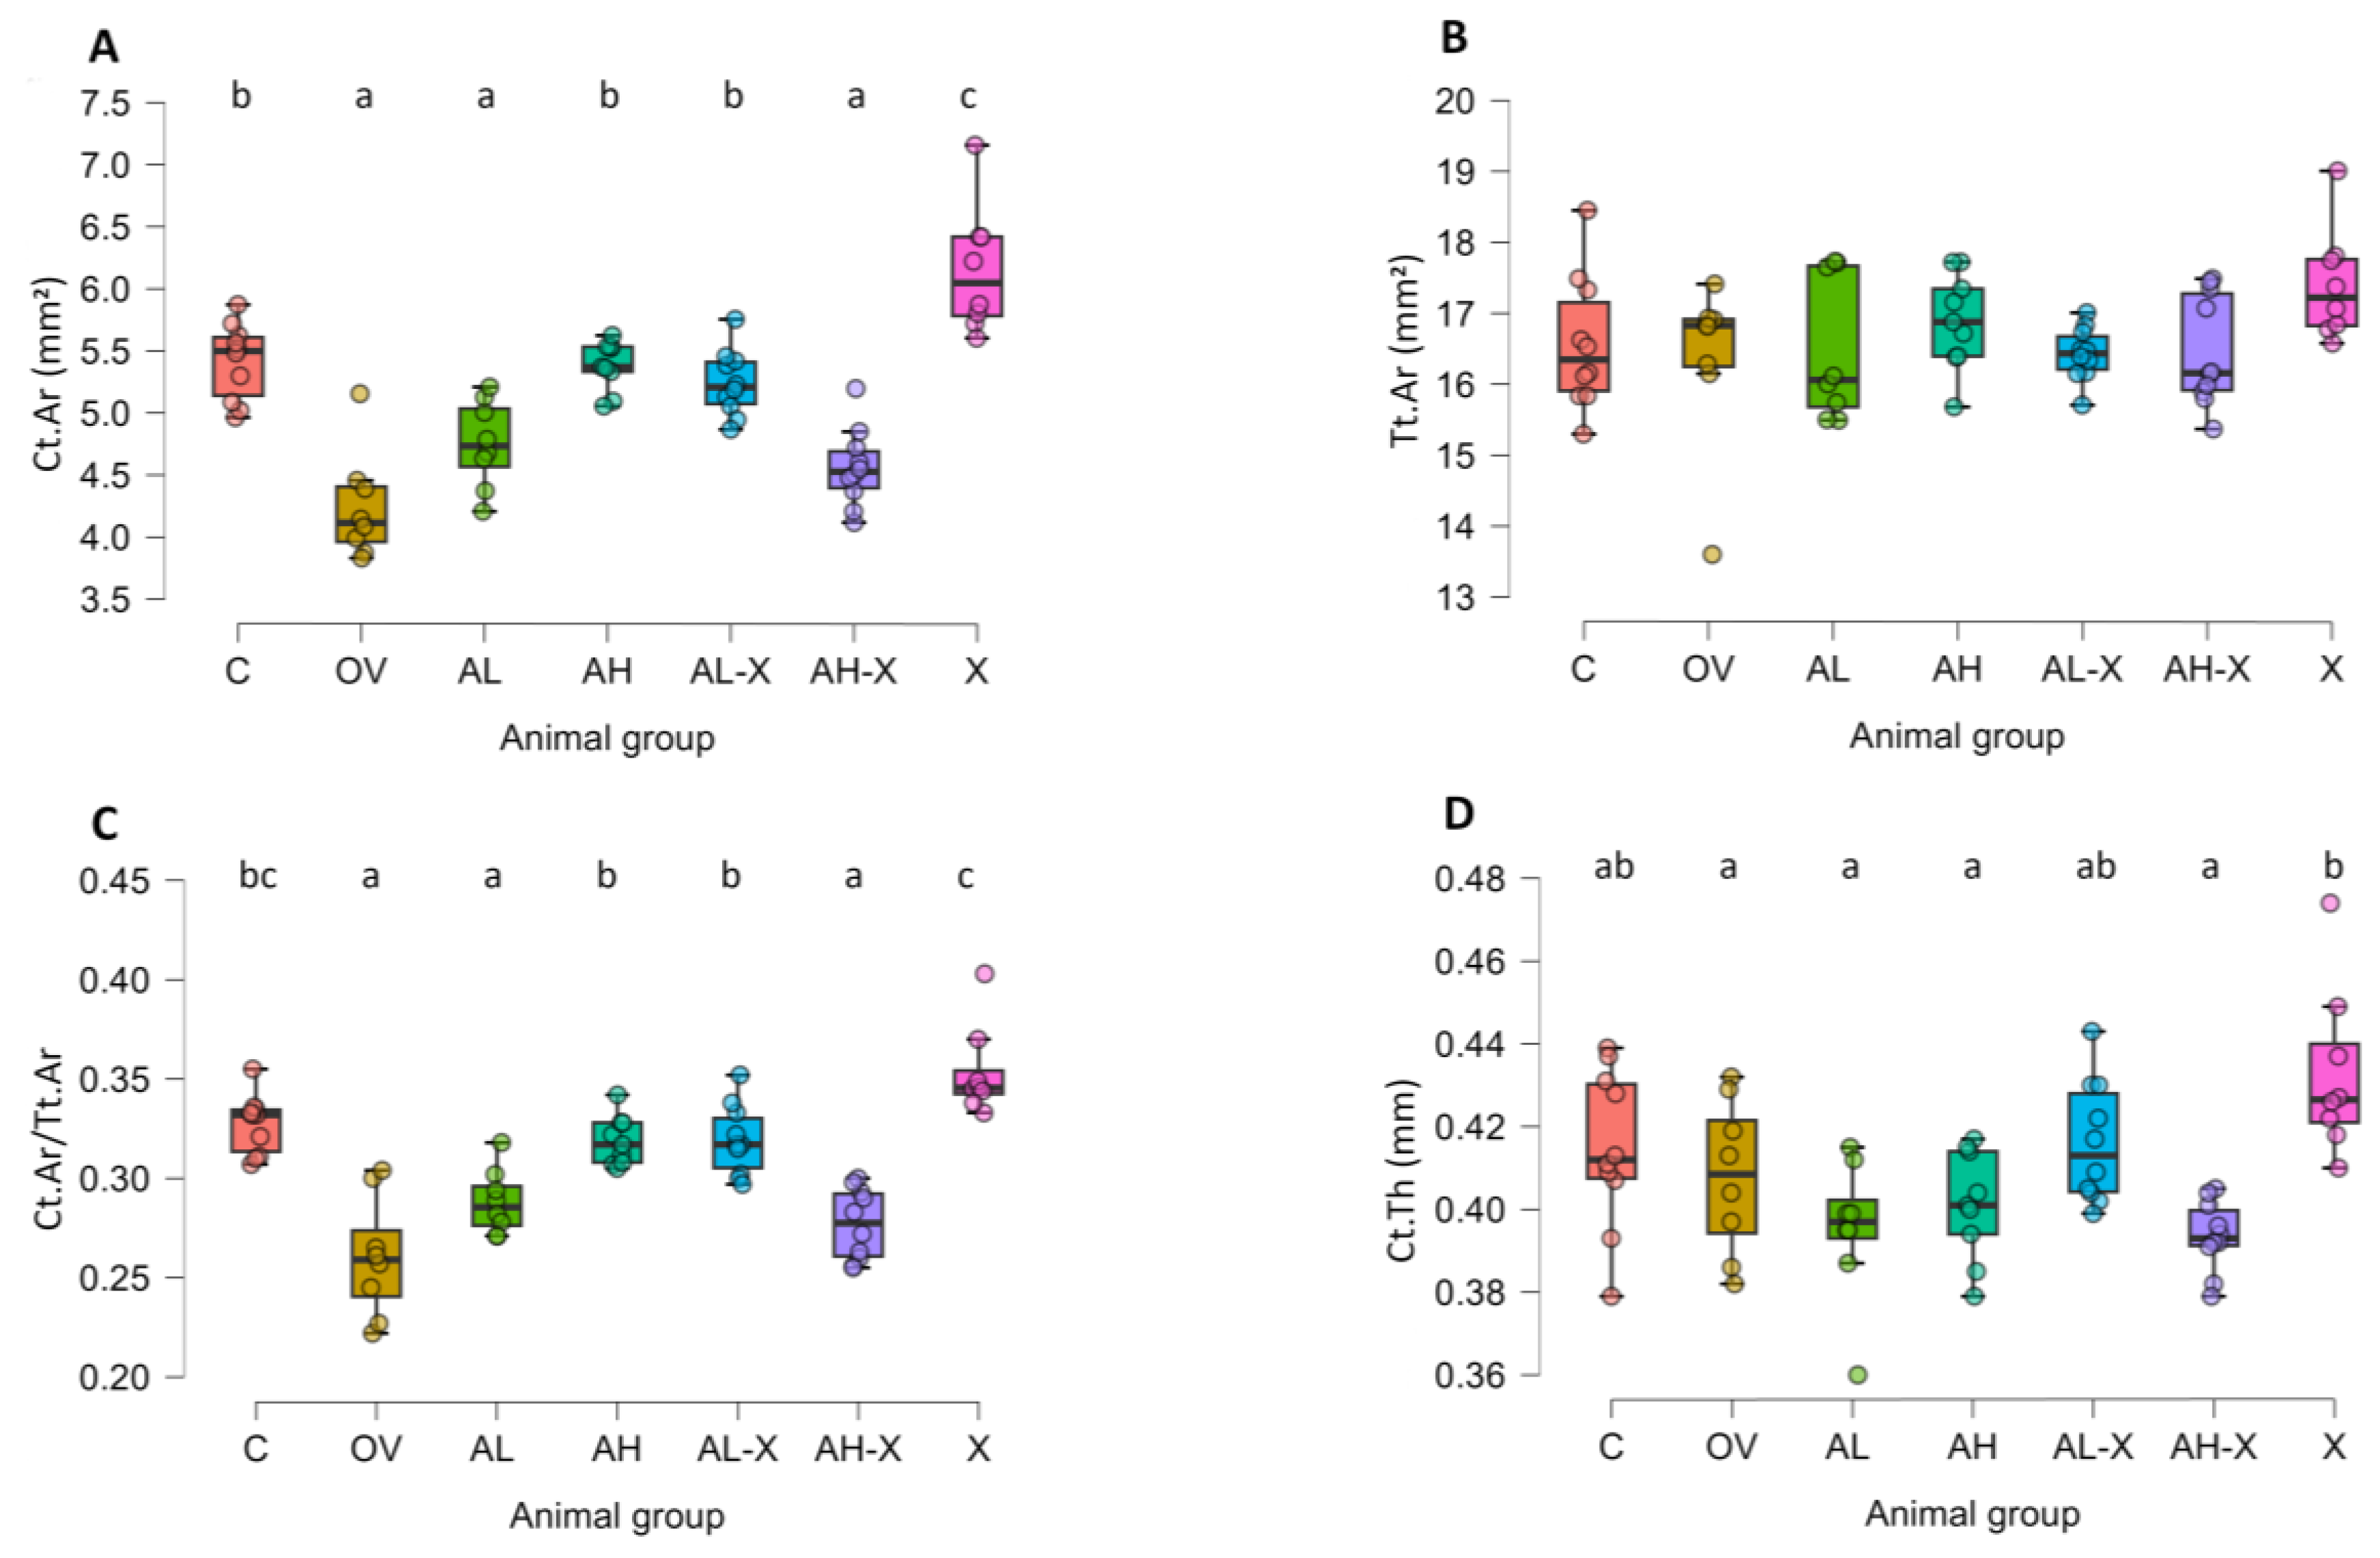
Figure 7.
Results of trabecular bone tissue measurements. The figure shows average trabecular thickness (Tb.Th) (A), and average trabecular separation (Tb.Sp) (B). Six-month-old rats were ovariectomized (n = 60) or sham-operated (n = 10). One month later, animals were assigned to treatment groups for two weeks and then euthanized. Femurs were harvested and fixed in 10% neutral buffered formalin for micro-CT analysis. Groups: C, sham-operated control group; OV, untreated ovariectomized animals; AL, ovariectomized animals, low alendronate dose; AH, ovariectomized animals, high alendronate dose; AL-X, ovariectomized animals, low alendronate dose and hop extract; AH-X, ovariectomized animals, high alendronate dose and hop extract; X, ovariectomized animals, hop extract (n = 9–10 animals per group). Data are shown as box-and-whisker plots (median, interquartile range, and full range). Statistical significance was assessed using Welch’s ANOVA, followed by Tukey post hoc tests. Statistically significant differences are indicated using a compact letter display (p < 0.05), where samples sharing the same letter are not significantly different. Absence of letter annotations indicates no statistically significant differences between groups.
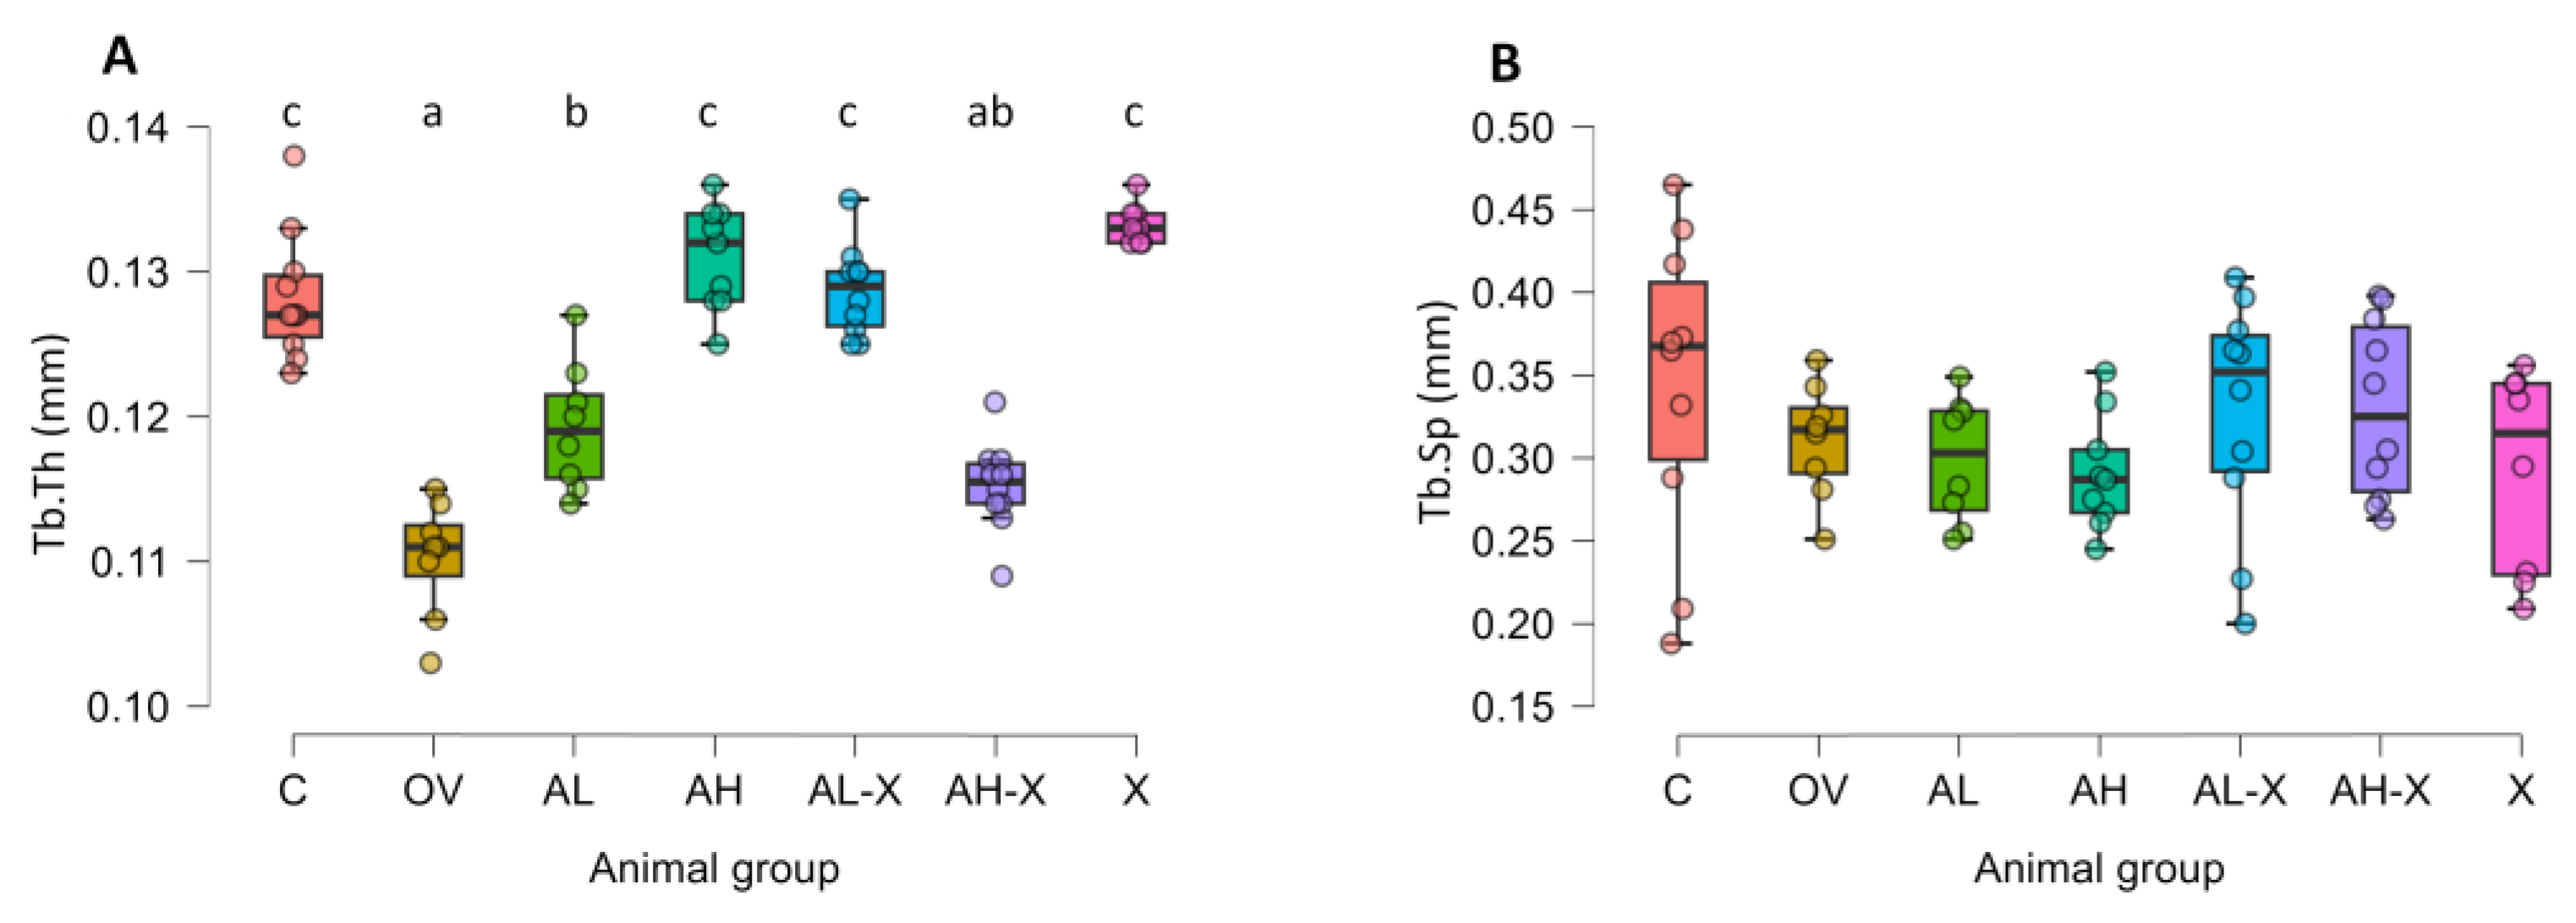
Figure 8.
Results of Western blot analyses. The figure shows relative signal intensity for C-terminal cross-linked telopeptide of type 1 collagen (CTX1) (A), and N-terminal propeptide of type 1 procollagen (P1NP) (B). Six-month-old rats were ovariectomized (n = 60) or sham-operated (n = 10). One month later, animals were assigned to treatment groups for two weeks and then euthanized. Blood was collected for hematology and serum biochemistry; a portion of serum was used for Western blot. Groups: C, sham-operated control group; OV, untreated ovariectomized animals; AL, ovariectomized animals, low alendronate dose; AH, ovariectomized animals, high alendronate dose; AL-X, ovariectomized animals, low alendronate dose and hop extract; AH-X, ovariectomized animals, high alendronate dose and hop extract; X, ovariectomized animals, hop extract (n = 9–10 animals per group). Data are shown as box-and-whisker plots (median, interquartile range, and full range). Statistical significance was assessed using Welch’s ANOVA, followed by Tukey post hoc tests. Statistically significant differences are indicated using a compact letter display (p < 0.05), where samples sharing the same letter are not significantly different. Absence of letter annotations indicates no statistically significant differences between groups.
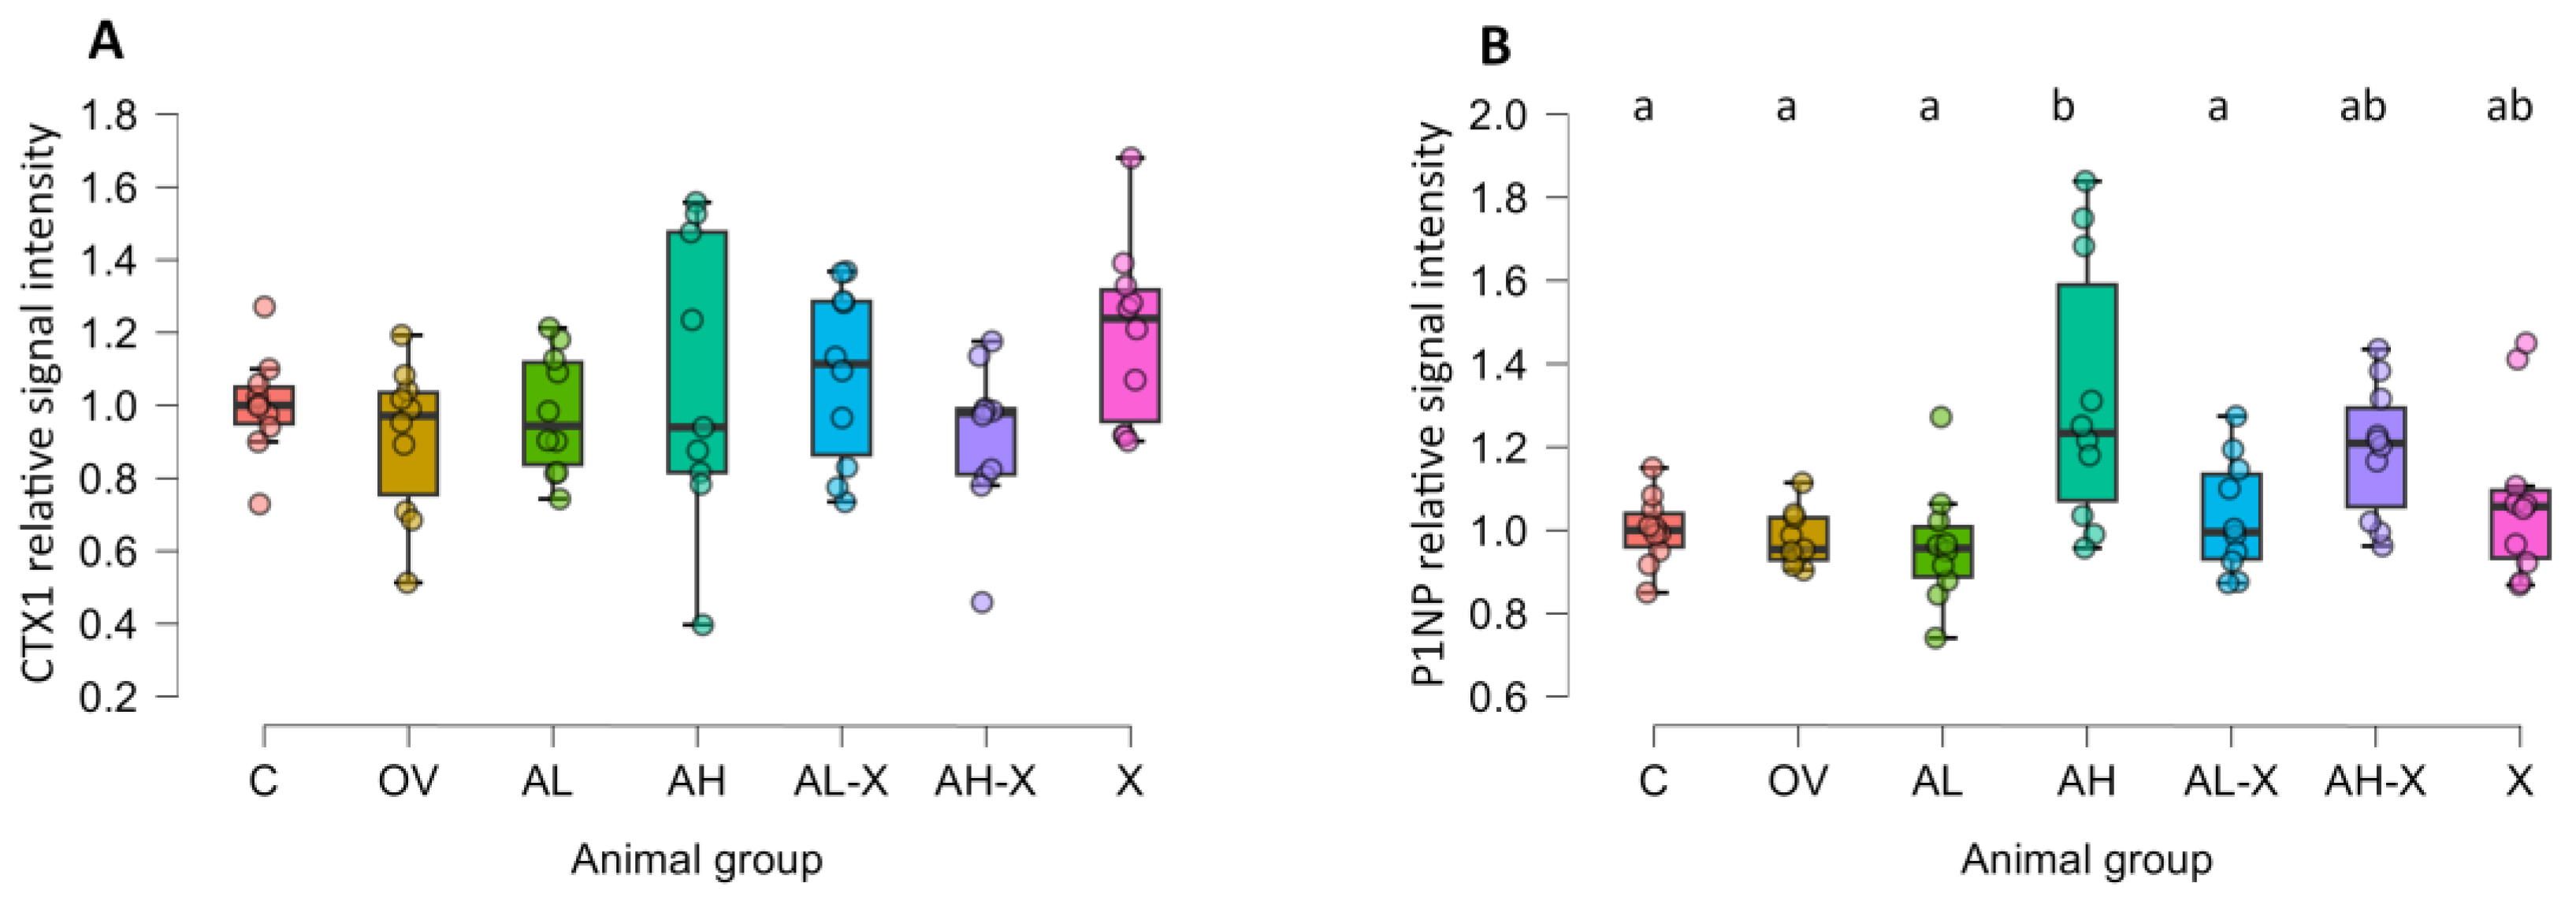
Figure 9.
Digital photographs of representative membranes obtained during the Western blot analysis of serum markers of bone turnover. Abbreviations: CTX1, C-terminal cross-linked telopeptide of type 1 collagen; P1NP, N-terminal propeptide of type 1 procollagen; C, sham-operated control group; OV, untreated ovariectomized animals; AL, ovariectomized animals, low alendronate dose; AH, ovariectomized animals, high alendronate dose; AL-X, ovariectomized animals, low alendronate dose and hop extract; AH-X, ovariectomized animals, high alendronate dose and hop extract; X, ovariectomized animals, hop extract.

Table 1.
Analysis of hematological blood determinants.*.
| Group | RBC (×1012/L) | WBC (×109/L) | PLT (×109/L) | Hb (g/L) | Hct (L/L) | MCV (fL) | MCH (pg) | MCHC (g/L) |
| C | 6.96 (0.26) | 3.52 (0.9) | 716.5 (37.73) | 152.2 (5.2) | 0.41 (0.01) | 58.4 (1.96) | 21.89 (0.68) | 375.1 (8.03) |
| OV | 7.82 (0.51) | 5.3 (2.79) | 623 (64.2) | 170.14 (11.33) | 0.46 (0.03) | 58.29 (2.63) | 21.8 (1.07) | 373.29 (4.82) |
| AL | 7.79 (0.81) | 4.31 (1.14) | 594.38 (104.03) | 175.88 (17.87) | 0.46 (0.05) | 58.75 (1.04) | 22.56 (0.73) | 384.63 (10.68) |
| AH | 7.27 (0.63) | 5.22 (1.21) | 543.44 (94.71) | 167.89 (10.35) | 0.43 (0.03) | 58.89 (1.36) | 23.21 (1.95) | 394.89 (29.17) |
| AL-X | 7.99 (0.32) | 3.92 (1.17) | 556.2 (98.3) | 176.7 (17.73) | 0.48 (0.05) | 59.4 (3.95) | 22.37 (1.34) | 376.22 (6.3) |
| AH-X | 7.32 (0.81) | 5.22 (1.31) | 507.2 (90.08) | 166.8 (11.61) | 0.43 (0.04) | 59.5 (1.9) | 22.88 (1.22) | 384.6 (10.74) |
| X | 7.02 (0.49) | 5.57 (0.9) | 620.83 (29.71) | 161.5 (9.2) | 0.41 (0.02) | 59.17 (1.17) | 23.02 (0.57) | 390 (8.83) |
| p | <0.001 | 0.005 | <0.001 | <0.001 | 0.001 | 0.88 | 0.04 | 0.005 |
*Abbreviations: RBC, red blood cells; WBC, white blood cells; PLT, platelets; Hb, hemoglobin; Hct, hematocrit; MCV, mean corpuscular volume; MCH, mean corpuscular hemoglobin; MCHC, mean corpuscular hemoglobin concentration. Six-month-old rats were ovariectomized (n = 60) or sham-operated (n = 10). One month later, animals were assigned to treatment groups for two weeks and then euthanized. Blood was collected for hematology and serum biochemistry. Groups: C, sham-operated control group; OV, untreated ovariectomized animals; AL, ovariectomized animals, low alendronate dose; AH, ovariectomized animals, high alendronate dose; AL-X, ovariectomized animals, low alendronate dose and hop extract; AH-X, ovariectomized animals, high alendronate dose and hop extract; X, ovariectomized animals, hop extract (n = 6–10 animals per group, as outliers were removed from the analysis). The values in the table are presented as mean (standard deviation). Statistical significance was assessed using Welch’s ANOVA, followed by Tukey post hoc tests. For medians and interquartile ranges, as well as normality tests and other details, please see supplementary material (Table S2).
Table 2.
Electrolytes, renal & metabolic parameters.*.
| Group | Ca (mmol/L) | P (mmol/L) | Na (mmol/L) | K (mmol/L) | Glc (mmol/L) | BUN (mmol/L) | CRE (µmol/L) |
| C | 2.73 (0.09) | 2.13 (0.27) | 131.3 (6.02) | 4.52 (0.39) | 13.7 (2.49) | 5.66 (0.91) | 39.7 (12.4) |
| OV | 2.62 (0.05) | 2.11 (0.24) | 131.57 (4.43) | 4.5 (0.45) | 15.4 (2.95) | 5.79 (1.05) | 36.14 (8.15) |
| AL | 2.66 (0.14) | 1.98 (0.3) | 131.5 (4.9) | 4.59 (0.31) | 15.35 (2.31) | 5.95 (0.64) | 38.13 (7) |
| AH | 2.58 (0.1) | 1.97 (0.5) | 127.67 (7.31) | 4.7 (0.64) | 15.86 (1.94) | 6 (0.93) | 27 (14.59) |
| AL-X | 2.67 (0.09) | 2.06 (0.2) | 132.3 (3.86) | 4.67 (0.57) | 16.25 (1.59) | 5.64 (0.47) | 45.7 (16.61) |
| AH-X | 2.66 (0.05) | 2.08 (0.21) | 132.5 (4.74) | 4.81 (0.5) | 15.68 (1.87) | 6.47 (0.57) | 42.2 (19.05) |
| X | 2.52 (0.31) | 2.1 (0.24) | 132 (4.86) | 4.7 (0.89) | 15.19 (1.34) | 6.49 (1) | 56.67 (14.54) |
| p | 0.06 | 0.94 | 0.81 | 0.85 | 0.34 | 0.08 | 0.09 |
*Abbreviations: Glc, glucose; BUN, blood urea nitrogen; CRE, creatinine. Six-month-old rats were ovariectomized (n = 60) or sham-operated (n = 10). One month later, animals were assigned to treatment groups for two weeks and then euthanized. Blood was collected for hematology and serum biochemistry. Groups: C, sham-operated control group; OV, untreated ovariectomized animals; AL, ovariectomized animals, low alendronate dose; AH, ovariectomized animals, high alendronate dose; AL-X, ovariectomized animals, low alendronate dose and hop extract; AH-X, ovariectomized animals, high alendronate dose and hop extract; X, ovariectomized animals, hop extract (n = 5–10 animals per group, as outliers were removed from the analysis). The values in the table are presented as mean (standard deviation). Statistical significance was assessed using Welch’s ANOVA, followed by Tukey post hoc tests. For medians and interquartile ranges, as well as normality tests, please see supplementary material (Table S2).
Table 3.
Parameters describing liver function, protein metabolism, and enzymes.*.
| Group* | ALP (U/L) | ALT (U/L) | TBIL (mmol/L) | AMY (U/L) | ALB (g/L) | GLO (g/L) | TP (g/L) |
| C | 66.1 (29.34) | 24.1 (10.72) | 4.5 (0.53) | 508.2 (100.11) | 52.6 (3.95) | 12 (3.27) | 64.6 (2.63) |
| OV | 97.57 (40.48) | 21.86 (7.34) | 4.71 (1.5) | 454.14 (59.68) | 46.29 (4.5) | 12.29 (4.72) | 58.57 (3.51) |
| AL | 68.13 (19.42) | 28.25 (19.25) | 5 (0.93) | 477.63 (63.88) | 46.75 (4.5) | 14 (2.27) | 60.75 (3.73) |
| AH | 92 (33.99) | 21.33 (9.68) | 4.78 (0.44) | 512.33 (53.84) | 50.11 (5.06) | 10.44 (1.42) | 60.67 (4.44) |
| AL-X | 90.9 (43.46) | 32.7 (18.3) | 4.8 (0.79) | 468.5 (71.53) | 49.4 (5.17) | 12.3 (2.31) | 61.6 (4.48) |
| AH-X | 102.2 (49.17) | 44.4 (33.24) | 4.8 (0.63) | 492.3 (60.41) | 47.1 (2.51) | 11.4 (2.5) | 58.6 (2.01) |
| X | 112.5 (36.83) | 24.43 (7.93) | 5 (0.89) | 466.43 (58.69) | 48 (2.37) | 11.67 (1.86) | 61.14 (3.53) |
| p | 0.11 | 0.38 | 0.81 | 0.51 | 0.04 | 0.07 | 0.002 |
*Abbreviations: ALP, alkaline phosphatase; ALT, alanine aminotransferase; TBIL, total bilirubin; AMY, amylase; ALB, albumin; GLO, globulin; TP, total protein. Six-month-old rats were ovariectomized (n = 60) or sham-operated (n = 10). One month later, animals were assigned to treatment groups for two weeks and then euthanized. Blood was collected for hematology and serum biochemistry. Groups: C, sham-operated control group; OV, untreated ovariectomized animals; AL, ovariectomized animals, low alendronate dose; AH, ovariectomized animals, high alendronate dose; AL-X, ovariectomized animals, low alendronate dose and hop extract; AH-X, ovariectomized animals, high alendronate dose and hop extract; X, ovariectomized animals, hop extract (n = 5–10 animals per group, as outliers were removed from the analysis). The values in the table are presented as mean (standard deviation). Statistical significance was assessed using Welch’s ANOVA, followed by Tukey post hoc tests. For medians and interquartile ranges, as well as normality tests, please see supplementary material (Table S2).
Disclaimer/Publisher’s Note: The statements, opinions and data contained in all publications are solely those of the individual author(s) and contributor(s) and not of MDPI and/or the editor(s). MDPI and/or the editor(s) disclaim responsibility for any injury to people or property resulting from any ideas, methods, instructions or products referred to in the content. |
© 2025 by the authors. Licensee MDPI, Basel, Switzerland. This article is an open access article distributed under the terms and conditions of the Creative Commons Attribution (CC BY) license (http://creativecommons.org/licenses/by/4.0/).
Copyright: This open access article is published under a Creative Commons CC BY 4.0 license, which permit the free download, distribution, and reuse, provided that the author and preprint are cited in any reuse.


