
Submitted:
08 December 2025
Posted:
08 December 2025
You are already at the latest version
Abstract
The transition to Outcome-Based Education (OBE) in engineering demands instructional tools that bridge theoretical knowledge and practical engineering competencies. However, traditional Learning Management Systems (LMS) primarily function as static resource repositories, lacking the semantic structure necessary to support deep learning and precise competency tracking.
To address this, this study developed a three-layer domain Knowledge Graph (KG) for Structural Geology and integrated it into the ChaoXing LMS (a widely used Learning Management System in Chinese higher education). A semester-long quasi-experimental study (N=84) was conducted to evaluate its impact on student performance and specific graduation attribute achievement compared to a conventional folder-based approach.
Empirical results demonstrate that the KG-integrated group significantly outperformed the control group (p< 0.01, Cohen’s d=0.74). Notably, while performance on rote memorization tasks was similar, the experimental group showed marked improvement in identifying and solving complex engineering problems. LMS log analysis confirmed a strong positive correlation (r=0.68) between graph navigation depth and academic success. KG effectively bridged the gap between theoretical knowledge and practical engineering applications (e.g., geohazard analysis).
This research confirms that explicit semantic visualization acts as vital cognitive scaffolding, effectively enhancing high-order thinking and ensuring the rigorous alignment of instruction with engineering accreditation standards. Ultimately, this approach promotes sustainable learning capabilities and prepares future engineers to address complex, interdisciplinary challenges in sustainable development.
Keywords:
knowledge graph
; blended learning
; outcome-based education (OBE)
; structural geology
; sustainable engineering education
; sustainable development goal 4 (SDG 4)
1. Introduction
1.1. Background and Problem Statement
Under the context of Industry 4.0 and the UN’s Sustainable Development Goals (specifically SDG 4), engineering education is shifting from static knowledge transmission to dynamic capability cultivation. To achieve sustainable engineering education, it is crucial to equip students with lifelong learning skills and the ability to solve complex, non-standard problems. This necessitates a rigorous implementation of the Outcome-Based Education (OBE) philosophy, which emphasizes measurable student outcomes and the "substantial equivalence" of global engineering competencies [1,2].
However, applying OBE in Structural Geology—a core course characterized by complex spatial concepts and strong practicality—remains challenging [3]. Traditional teaching methods often rely on flat illustrations, leading to rote memorization rather than the deep understanding required for professional adaptability [4,5]. Students frequently struggle to reconstruct 3D geological models from 2D maps, hindering the development of high-order thinking.
While emerging educational technologies (e.g., MOOCs) offer rich resources, they often lack semantic interconnections, causing "information overload" in blended learning contexts [6]. Therefore, utilizing intelligent technology to integrate fragmented resources and visualize knowledge logic is urgent. Developing a system that supports both personalized learning and closed-loop OBE evaluation is a key step toward fostering the sustainable development of future engineering talent.
1.2. Pedagogical Challenges and Sustainability Imperatives
Structural geology is not merely a theoretical discipline describing rock deformation; it serves as the fundamental basis for critical sustainable engineering practices. In the context of global sustainability, the professional competencies derived from this course are prerequisites for deep-earth exploration and geo-hazard mitigation. For instance, the accurate 3D interpretation of fracture systems is vital for the efficiency of Enhanced Geothermal Systems (EGS) and ensuring the seal integrity of Carbon Capture and Storage (CCS) sites [7,8]. Similarly, in civil infrastructure, the ability to identify hidden fault zones is critical for preventing catastrophic water inrush accidents in tunnel construction and selecting safe, long-term repositories for nuclear waste disposal [9,10]. Therefore, the primary challenge in structural geology education is not just knowledge transmission, but fostering the high-order spatial reasoning required to solve these complex environmental and engineering problems.
However, achieving this learning outcome is fraught with difficulties. As highlighted in educational research, structural geology is a discipline characterized by strong abstraction and high practical requirements [11]. It demands that students construct rigorous geological models through sophisticated spatial thinking [12]. Learners are required to reconstruct four-dimensional evolutionary processes (3D space + time) from limited two-dimensional observations [10,13]. Consequently, novice learners often struggle with "spatial penetration"—the ability to mentally visualize subsurface structures based on surface outcrops [14].
Crucially, a significant gap exists between these complex cognitive demands and traditional instructional delivery. While current Learning Management Systems (LMS) like Moodle, Blackboard, or ChaoXing facilitate resource distribution, they typically organize content in linear, folder-based structures [15]. This creates an "epistemological mismatch": while sustainable underground development requires systemic, interconnected reasoning to navigate complex geological bodies, traditional LMS presents knowledge in fragmented silos [16]. This fragmentation hinders students from building the cross-concept links necessary for engineering decision-making, leading to superficial learning that is insufficient for addressing modern sustainability challenges.
1.3. Limitations of Linear LMS and the Potential of Knowledge Graphs
Although mainstream LMS platforms (e.g., Moodle, Blackboard, or localized platforms like ChaoXing, a widely used Learning Management System in Chinese higher education) provide robust repositories for digital resources, their content organization is predominantly linear (e.g., file trees, chapter lists) [6]. This linear structure contradicts the reticulated and interconnected nature of geological knowledge. Students navigating these platforms often lack a "semantic map" to guide their learning paths, leading to disorientation and inefficient knowledge retrieval.
To address this epistemological mismatch, Knowledge Graphs (KGs) have emerged as a promising educational technology. By representing knowledge as a network of entities and relationships, KGs can visualize the semantic structure of a discipline, acting as a "cognitive scaffold" for learners [17]. While KGs have been applied in adaptive testing and resource recommendation [11], few studies have explored their integration into the instructional design specifically for Engineering Education Accreditation. Furthermore, empirical evidence is scarce regarding how KG-based navigation in an LMS environment specifically influences the achievement of defined engineering competency indicators.
1.4. Research Objectives and Contributions
Addressing these gaps, this study proposes an OBE-oriented instructional framework that integrates Knowledge Graphs into the teaching of Structural Geology. Utilizing a widely used LMS (ChaoXing) as the technical base, we constructed a domain-specific knowledge graph that explicitly maps course content to engineering accreditation indicators. Unlike previous studies that focus solely on algorithmic construction, this research emphasizes the pedagogical intervention: using the KG as a navigational and cognitive tool to transform the learning process. Specifically, this paper aims to:
1) Propose a methodology for constructing a Structural Geology Knowledge Graph that embeds OBE accreditation standards.
2) Develop a blended learning model where the KG serves as a non-linear navigation tool to support pre-class inquiry, in-class elaboration, and post-class consolidation.
3) Validate the effectiveness of this approach through a quasi-experimental study, providing empirical data on how KG-integrated instruction improves students’ academic performance and the achievement of specific engineering competency indicators.
2. The OBE-Oriented Knowledge Graph Construction
2.1. Ontology Modeling of Structural Geology
The construction of the domain Knowledge Graph (KG) for Structural Geology was executed using the integrated knowledge visualization engine of the ChaoXing platform. This selection aligns with recent calls for integrating sustainable governance frameworks into higher education digital infrastructure [12]. By leveraging a widely accessible Learning Management System (LMS) rather than bespoke programming code, we ensure that the framework is highly replicable. Unlike automated extraction methods that may introduce semantic noise, this study adopted a rigorous, expert-driven top-down ontology construction strategy. This "human-in-the-loop" approach ensures that the knowledge structure aligns strictly with the Outcome-Based Education (OBE) competencies required for solving complex engineering problems as outlined in global engineering frameworks [13].
Formally, the semantic architecture is defined as a directed graph G (E, R), where E denotes the set of educational entities and R represents the cognitive relations. The entity set E is structured into three tiers of granularity: (1) the Macro-level, representing core disciplinary themes; (2) the Meso-level, covering specific chapter units; and (3) the Micro-level, consisting of atomic knowledge points. Crucially, these nodes function not merely as semantic labels but as digital resource hubs. We systematically mapped multi-modal learning materials—including digital courseware, targeted exercises, instructional videos, and recent scientific publications—to their corresponding nodes. This integration allows students to seamlessly transition from foundational theory to cutting-edge research application, a method proven to enhance students’ higher-order thinking and engagement [14]. Through this systematic modeling, a comprehensive topology comprising 432 knowledge nodes was established, forming a digital scaffold that visualizes the complex logic of the discipline.
2.2. Mapping Knowledge to OBE Accreditation Standards
A critical innovation of this framework is the explicit, theoretically grounded mapping between the domain knowledge and the engineering accreditation standards. To ensure the validity of these connections, Bloom’s Taxonomy was employed as a theoretical bridge to categorize the cognitive depth of each knowledge point [15]. In this framework, lower-order concepts, such as the basic definitions of strike and dip, are mapped to "Engineering Knowledge" indicators corresponding to the levels of recalling and understanding. Conversely, higher-order concepts that require synthesis and evaluation, such as Stereographic Projection Analysis, are mapped to "Investigation" or "Complex Problem Solving" indicators. For instance, the node representing the “Mohr Circle” is explicitly linked to the indicator regarding the “ability to apply mathematical and natural science principles to engineering problems” via a weighted edge. This pedagogical design transforms the knowledge graph from a static database into a navigational map for competency development, clarifying to students not just what they are learning, but which engineering capability they are developing [18].
2.3. Implementation on the LMS Platform
The practical implementation of this framework was conducted using the native knowledge graph tools embedded in the ChaoXing platform. The construction process followed a rigorous three-phase sequence. Initially, key entities were extracted and disambiguated from the standard textbook and course syllabus to ensure semantic uniqueness, merging synonyms such as “Thrust Fault” and “Reverse Fault” where appropriate. Subsequently, the semantic network was visually constructed within the platform editor, where central nodes like Folds and Faults were established as hubs radiating outwards to specific sub-types and mechanical principles. Finally, over 200 discrete learning resources, including micro-videos, quizzes, and case study documents, were bound to specific nodes. This binding process turns the static graph into an interactive "Knowledge Graph (KG)," enabling students to click on a node like “Cleavage” and immediately access relevant learning materials, thereby facilitating an in-context, non-linear learning experience essential for mastering complex geological structures.
3. Instructional Intervention Model
3.1. The KG-Integrated Blended Learning Framework
To bridge the gap between abstract geological concepts and the rigorous competency requirements of engineering accreditation, we designed a KG-Integrated Blended Learning Model (Figure 1). Grounded in Social Constructivism, this model posits that meaningful learning occurs when learners actively construct new knowledge upon their existing cognitive structures. Unlike traditional blended learning, which often presents resources in isolated lists, our approach utilizes the Knowledge Graph as a persistent "cognitive scaffold" throughout the learning lifecycle. The KG functions as an "Advance Organizer", a concept introduced by Ausubel (1960), providing a global semantic overview that helps students anchor new details within a broader conceptual framework [19]. This intervention transforms the passive consumption of LMS resources into an active, navigation-driven inquiry process, explicitly targeting the "Complex Problem Solving" graduate attributes.
To operationalize this model, the online learning component was implemented using the ChaoXing (Superstar) Learning Management System (LMS), widely adopted in Chinese higher education. However, it is crucial to emphasize that the Knowledge Graph-driven framework proposed in this study is platform-agnostic. The architectural logic—specifically the integration of the semantic graph with front-end learning modules—is transferable and can be seamlessly adapted to other global LMS platforms such as Moodle, Canvas, or Blackboard. The ChaoXing platform served merely as the experimental environment to validate the framework’s efficacy in fostering sustainable engineering competencies.
3.2. Pre-Class Phase: Guided Inquiry and Pathfinding
Prior to the face-to-face sessions, the pedagogical objective is to facilitate structured inquiry and reduce the cognitive load associated with new terminology. In traditional settings, students often feel overwhelmed by the density of textbook content. In our intervention, students are required to navigate the KG on the LMS to visualize the logical path of the upcoming lesson. For instance, before the lecture on "Fault Mechanics," students trace the prerequisite relationships (R prerequisite) in the graph, identifying that "Stress Analysis" and "Rock Failure Criteria" are necessary antecedents. By clicking on these nodes, they access bite-sized micro-videos to reactivate prior knowledge. This graph-guided preparation ensures that students enter the classroom with a clear mental map of the knowledge structure, significantly enhancing the efficacy of the Flipped Classroom approach [20].
3.3. In-Class Phase: Structured Scaffolding and Visualization
During the instructional phase, the instructor utilizes the dynamic KG as the primary presentation tool, replacing linear slide decks for structural explanations. Structural Geology requires students to toggle between microscopic mechanisms and macroscopic tectonic patterns, a cognitive leap that is often difficult for novices. The instructor demonstrates this linkage by dynamically traversing the graph, visually zooming out from a specific node like "En Echelon Fractures" to its parent tectonic setting, "Shear Zone." This visual demonstration serves as Instructional Scaffolding, explicitly modeling the expert thinking process required for engineering analysis [21]. Furthermore, when discussing complex engineering cases (e.g., tunnel stability in faulted zones), the instructor highlights the specific nodes involved, visually connecting theoretical concepts to the "Engineering Problem Analysis" accreditation indicator, thereby reinforcing the relevance of the curriculum to professional practice.
3.4. Post-Class Phase: Self-Regulated Consolidation
In the post-class phase, the KG transforms into a tool for Self-Regulated Learning (SRL). Unlike linear homework assignments, the graph supports personalized remediation. When a student struggles with a specific problem in the chapter quiz (e.g., interpreting a geological map), they are guided to consult the KG to identify the specific knowledge gaps. The semantic links allow them to trace back from the "Application" node (the map problem) to the underlying "Concept" nodes (e.g., "Rule of Vs") and access targeted remedial resources. This mechanism encourages students to take ownership of their learning process, shifting the focus from merely "getting the right answer" to understanding the underlying knowledge network, a critical trait for lifelong learning in engineering [22].
4. Methodology of Evaluation
4.1. Quasi-Experimental Design and Participants
To empirically validate the effectiveness of the KG-integrated instructional model, a quasi-experimental study was conducted over a full semester (16 weeks) in the Structural Geology course. The participants consisted of 84 junior undergraduates majoring in Geological Engineering at [Name of University], divided into two parallel classes based on administrative assignment. One class was designated as the Experimental Group (N=42), which adopted the KG-driven blended learning model described in Section 3. The other served as the Control Group (N=42), receiving instruction via the traditional LMS interface (folder-based resources) and standard PowerPoint lectures. To ensure the internal validity of the experiment, both groups were taught by the same instructor, adhered to identical syllabi, and underwent the same assessments. An independent t-test on the pre-course GPA showed no statistically significant difference between the two groups (p>0.05), indicating comparable baseline academic ability [23].
4.2. Data Collection Instruments
Data collection was rigorously designed to capture both the process of learning engagement and the outcome of competency achievement.
First, LMS Log Data were extracted from the backend of the ChaoXing platform to quantify student interaction patterns. For the Experimental Group (N=42), specific behavioral metrics included "KG Node Click Frequency" and "Navigation Path Depth," representing the utilization of the semantic structure. In contrast, for the Control Group (N=42), standard metrics such as "Resource Download Frequency" and "Video Completion Rate" were monitored.
Second, Assessment Data were aggregated from three distinct sources to ensure a holistic evaluation: (1) Regular Assignments (20%), (2) Chapter Quizzes (30%), and (3) Final Examination (50%). Crucially, every assessment item—whether a quiz question or an exam problem—was explicitly tagged with a corresponding Graduate Attribute (GA) indicator prior to administration. This granular tagging strategy allows for the disaggregation of student scores specifically mapped to accreditation standards [24].
To specifically evaluate Indicator 2.3: Design/Development of Solutions for Complex Engineering Problems, we focused on the comprehensive analysis section of the final exam. Unlike traditional questions that test rote memorization, this section featured a real-world engineering scenario:
Case Example: The Tunnel-Fault Intersection Challenge.
Problem: A high-speed railway tunnel is projected to cross a regional normal fault. Students were required to (1) predict the intersection geometry based on surface data, (2) assess geohazards (e.g., water inrush), and (3) propose a sustainable lining reinforcement strategy.
This specific item serves as a critical proxy for "Sustainable Engineering Competency," requiring students to activate the semantic chain (e.g., Fault Geometry → Stress Field → Engineering Stability) fostered by the KG. Grading was conducted using a standardized rubric by two independent instructors to ensure reliability.
4.3. Calculation Method of Indicator Achievement
Although the knowledge graph itself serves as a pedagogical tool rather than a direct calculation engine, the achievement of OBE indicators was rigorously computed using the assessment data generated. Following the standard evaluation mechanism of Engineering Education Accreditation, the achievement value (A) for a specific indicator (Indk) is calculated using a weighted summation formula:
Where:
- Si represents the average score obtained by the student cohort on assessment item i associated with indicator k.
- Ti is the total possible score for assessment item i.
- Wi s the weight of the assessment item in the overall evaluation scheme.
- n is the total number of assessment items supporting indicator k.
This calculation was performed externally using Python scripts to process the raw score data exported from the LMS. By comparing the calculated A (Indk) values between the Experimental and Control groups, we can quantitatively assess whether the KG-based intervention led to a significant improvement in specific engineering competencies, particularly those related to structural analysis and spatial reasoning.
5. Results and Analysis
5.1. Overall Academic Performance
To evaluate the general impact of the KG-integrated instruction, we compared the final comprehensive scores of the two groups. The descriptive statistics reveal that the Experimental Group achieved a higher mean score (M=82.4, SD=7.8) compared to the Control Group (M=76.1, SD = 9.2). An independent-samples t-test confirmed that this difference is statistically significant (t (82) = 3.38, p < 0.01, d = 0.74) (Table 1), with a medium-to-large effect size [25]. Notably, the variance in the Experimental Group was lower, suggesting that the structured scaffolding provided by the knowledge graph helped bridge the gap for lower-performing students, resulting in a more uniform mastery of the course content. In contrast, the Control Group exhibited a bi-modal distribution, indicating that while high achievers could navigate the traditional folder-based resources effectively, weaker students struggled to synthesize the fragmented information without semantic guidance.
5.2. Achievement of Engineering Competency Indicators
A more granular analysis was conducted based on the specific Graduation Attribute indicators defined in Section 4.3. The results demonstrate a non-uniform improvement across different competency dimensions (Figure 2).
• Memorization-based Indicators (e.g., Ind 1.2): For indicators requiring simple recall of geological definitions, the difference between groups was marginal (p>0.05). This suggests that traditional LMS resources are sufficient for rote learning.
• Complex Problem Solving Indicators (e.g., Ind 2.1, Ind 3.2): The Experimental Group showed a marked superiority in higher-order indicators. Specifically, for Indicator 2.1 (Identify and formulate complex engineering problems), the Experimental Group’s achievement value was 0.78, significantly outperforming the Control Group’s 0.65 (p<0.01).
This divergence supports the hypothesis that the knowledge graph’s primary value lies in Cognitive Integration. By explicitly visualizing the links between mechanical principles and geological structures, the KG enabled students to perform the multi-step reasoning required for complex indicators, whereas the Control Group often failed to connect isolated concepts during problem-solving tasks [26].
5.3. Correlation Between KG Engagement and Learning Outcomes
To establish a direct link between the instructional intervention and the observed outcomes, we analyzed the LMS log data of the Experimental Group. A Pearson correlation analysis was performed between the "KG Node Access Frequency" and the "Final Exam Score" (Figure 3). The analysis revealed a strong positive correlation (r=0.68, p<0.001). Furthermore, we analyzed the "Navigation Depth"—defined as the number of sequential hops a student makes in the graph during a single session. Students who frequently traversed 3 or more layers (e.g., from Tectonics →→ Faulting →→ Mechanics →→ Engineering Case) scored significantly higher on the comprehensive analysis questions. This behavioral pattern provides empirical evidence that the knowledge graph was not merely used as a resource repository, but as a cognitive tool for Deep Learning. The visualization of semantic relationships successfully prompted students to engage in the "relational processing" of information, which is critical for transferring geological knowledge to engineering applications [27].
6. Discussion
6.1. Impact of Knowledge Graph Construction on High-Order Thinking Skills
The quantitative results (Table 1) demonstrated that the Experimental Group (EG) significantly outperformed the Control Group (CG) in final comprehensive scores (Mean: 82.4 vs. 76.1, p < 0.01), with a medium-to-large effect size (Cohen’s d = 0.74). Notably, the performance gap was most pronounced in tasks requiring complex problem-solving rather than simple memorization. This aligns with our hypothesis that the Knowledge Graph (KG) helps students transcend rote learning. Zhu et al. recently emphasized that in the era of AI, the value of education lies not in storing information but in structuralizing it [28]. Our findings corroborate their view, showing that visualizing the semantic relationships of Structural Geology enables students to form a "cognitive map," thereby facilitating the transfer of knowledge to complex spatial problems.
Furthermore, the visualization of the domain ontology acts as a cognitive scaffold. Drawing on Sweller’s foundational Cognitive Load Theory [29], effective learning requires minimizing ’extraneous cognitive load’ to free up working memory for ’germane load’—the construction of schemas. By presenting geological concepts (e.g., fold mechanisms, fault stress) in a structured graph rather than fragmented texts, our system reduces the mental effort required to search for information. This aligns with recent findings by Skulmowski and Xu [30], who emphasize that in digital environments, structural aids are critical for deep learning. This explains why EG students showed higher accuracy in identifying geological structures, a competency vital for future engineering practice [31].
6.2. Differential Impact on Competency Dimensions
A granular analysis of Graduation Attributes (Figure 2) reveals that the KG intervention specifically targets high-order engineering competencies. While both groups achieved similar scores on memorization-based indicators (Ind 1.2, p > 0.05), the EG showed a marked superiority in "Complex Problem Solving" (Ind 2.1), achieving an indicator value of 0.78 compared to the CG’s 0.65. This divergence validates the specific pedagogical affordance of the KG. Traditional instruction is sufficient for declarative knowledge, but the KG-integrated model forces students to traverse the path from Phenomenon to Mechanism to Engineering Consequence. This mandatory traversal mimics the expert reasoning process, directly enhancing the "Complex Engineering Problem Analysis" competency required by the Washington Accord [28].
6.3. Correlation Between Online Behavioral Patterns and Learning Outcomes
Our correlation analysis (Figure 3) revealed a strong positive relationship (r = 0.68) between system usage frequency (e.g., node clicks) and final grades. This suggests that the "blended" nature of the framework effectively promotes active learning. Baber [32] argued in Sustainability that student engagement in online environments is a primary predictor of academic success. Unlike passive MOOC watching, the KG-driven system requires active exploration of knowledge nodes, which creates a positive feedback loop for learning. However, it is worth noting that a small fraction of students in the EG did not show significant improvement, suggesting that future iterations should incorporate stronger "nudge" mechanisms to support students with lower self-regulated learning (SRL) skills [33].
6.4. From Academic Performance to Sustainable Engineering Education
Beyond the immediate improvement in grades, this study offers a viable pathway for realizing Sustainable Engineering Education (SDG 4). Specifically, our results align with SDG Target 4.4, which calls for increasing the number of youth with relevant skills for employment and decent jobs. Traditional "cramming" teaching methods often lead to student burnout and surface learning, which are unsustainable for long-term career resilience. Alam [34] highlights that adaptive learning technologies are essential for maintaining the sustainability of higher education by accommodating diverse learning paces. Our system enables personalized learning paths, allowing students to revisit knowledge gaps without peer pressure.
Crucially, this study highlights the role of Knowledge Graphs in promoting Educational Equity. As observed in Table 1, the Standard Deviation (SD) of the Experimental Group was significantly lower than that of the Control Group. This statistical convergence indicates that the KG framework disproportionately benefits low-achieving students. By visualizing implicit disciplinary logic, the KG functions as a digital "cognitive scaffold," helping students with weaker theoretical foundations to grasp complex structural relationships that high-achievers might intuitively understand. This reduces the "competency gap" within the classroom, representing a concrete practice of inclusive education where "no student is left behind."
Moreover, the proposed framework responds to the call by Sánchez-Carracedo et al. to integrate sustainability competencies into engineering degrees [35]. By embedding OBE evaluation directly into the learning process, we achieved a "closed-loop" quality assurance mechanism. This data-driven approach ensures that the cultivation of engineering talent remains aligned with evolving industry standards, as noted by Hassan et al. [36]. Ultimately, by equipping students with the ability to navigate complex knowledge structures independently, we are fostering the "lifelong learning" capability required to address the interdisciplinary challenges of the future [18]. Furthermore, as Leal Filho et al. (2023) emphasize the necessity of top-down governance, our findings demonstrate that bottom-up digital innovations—such as this KG-driven framework—are equally critical for operationalizing these sustainability goals at the operational classroom level [12].
7. Conclusions and Future Work
7.1. Conclusions
This study addresses the critical challenge of aligning digital learning environments with Outcome-Based Education (OBE) standards. By constructing a three-layer domain ontology for Structural Geology and integrating it into the ChaoXing LMS, we developed a novel instructional model that transforms static resource repositories into dynamic cognitive maps. The quasi-experimental results demonstrate that while the KG intervention has a moderate effect on basic knowledge retention, it significantly enhances students’ ability to analyze complex engineering problems (d=0.74).
The core contribution of this work is twofold: pedagogically, it demonstrates that explicit semantic visualization serves as an effective ’Advance Organizer’ to bridge the gap between theoretical geology and practical engineering analysis; methodologically, it offers a validated workflow for leveraging LMS log data to trace and quantify the achievement of specific graduate attributes, going beyond mere grade analysis. By reducing the cognitive load and enabling personalized learning paths, this system contributes to the social sustainability of the educational environment, reducing student burnout and fostering a long-term mindset for professional development.
7.2. Future Work
Future research will focus on addressing the identified limitations through two main avenues:
AI-Driven Ontology Automation: To improve scalability, we aim to integrate Large Language Models (LLMs) to semi-automatically extract entities and relationships from geological textbooks, reducing the manual workload of KG construction.
Adaptive Learning Paths: We plan to develop a recommendation algorithm that dynamically highlights specific graph paths based on a student’s real-time quiz performance, thereby realizing true "Personalized Adaptive Learning" within the OBE framework.
Funding
Funding for this research was provided by: - Shandong Province Teaching Reform Project (Grant No. ZHK202406); - Shandong University of Science and Technology Famous Teachers Project (Grant No. MS20231204);- National Natural Science Foundation of China (Grant No. 42072226). The funders had no role in study design, data collection, analysis, or manuscript preparation.
Conflicts of Interest
Authors declare no competing interests between them regarding to the publication of this paper.
References
- Spady, W.G. Outcome-Based Education: Critical Issues and Answers, 1994.
- Passow, H.J.; Passmore, P.H. The value of ABET outcomes: Perspectives of engineering graduates and their employers. Journal of Engineering Education 2013, 102, 578–612. [Google Scholar]
- Jonassen, D.H. Supporting problem solving in PBL. Interdisciplinary Journal of Problem-Based Learning 2011, 5, 95–119. [Google Scholar] [CrossRef]
- Alles, M.; Riggs, E.M. Developing a valid and reliable geoscience concept inventory: A case study. Int J Sci Educ 2011, 34, 477–499. [Google Scholar]
- Kastens, K.A.; Manduca, C.A.; Cervato, C. How geoscientists think and learn. Eos. Transactions American Geophysical Union 2009, 90, 265–266. [Google Scholar] [CrossRef]
- Dabbagh, N.; Kitsantas, A. Personal Learning Environments, social media, and self-regulated learning: A natural formula for connecting formal and informal learning. The Internet and Higher Education 2012, 15, 3–8. [Google Scholar] [CrossRef]
- Moeck, I.S. Catalog of geothermal play types based on geologic controls. Renew. Sustain. Energy. [CrossRef]
- Alcalde, J.; Flude, S.; Wilkinson, M.; Johnson, G.; Edlmann, K.; Bond, C.E.; Scott, V.; Gilfillan, S.M. Estimating geological CO2 storage security to deliver on climate mitigation. Nat. Commun. 2018, 9, 2201. [Google Scholar] [CrossRef]
- Zhang, Q.; Zhang, L.; Liu, Y. Risk Assessment of Water Inrush in Tunnels Construction Based on the Cloud Model. Sustainability-Basel 2022, 14, 9228. [Google Scholar]
- Hudson, J.A.; Feng, X.T. Radiating information: The status of nuclear waste disposal and the role of rock engineering. Eng. Geol. 2010, 116, 1–2. [Google Scholar]
- Ouyang, F.; Zheng, L.; Jiao, P. Artificial intelligence in online higher education: A systematic review of empirical research from 2011 to 2020. Education and Information Technologies 2022, 27, 7893–7925. [Google Scholar] [CrossRef]
- Leal Filho, W.; Salvia, A.L.; Frankenberger, F. Governance and sustainable development goals (SDGs) in higher education institutions. Sustainability-Basel 2023, 15, 4512. [Google Scholar]
- UNESCO Engineering for Sustainable Development: Delivering on the Sustainable Development Goals; UNESCO Publishing: Paris, France, 2021.
- Zheng, L.; Lu, X. The effectiveness of knowledge graph-based adaptive learning approach on student learning performance and engagement. Interact Learn Envir 2022, 32, 1655–1669. [Google Scholar]
- Krathwohl, D.R. A revision of Bloom’s taxonomy: An overview. Theor Pract 2002, 41, 212–218. [Google Scholar] [CrossRef]
- Chowdhury, H.; Alam, F.; Mustary, I. Developing an outcome-based education (OBE) framework for an engineering course; Proceedings of the IEEE Global Engineering Education Conference (EDUCON), 2019; pp. 1163–1169. [Google Scholar]
- Chen, C.M.; Bai, Y.N. Construction of a knowledge map for distinct concept based on main path analysis. Comput Educ 2020, 150, 103846. [Google Scholar]
- Crawford, J.; Cifuentes-Faura, J. Sustainability in higher education during the post-COVID-19 recovery: A systematic literature review. Sustainability-Basel 2023, 15. [Google Scholar]
- Ausubel, D.P. The use of advance organizers in the learning and retention of meaningful verbal material. Journal of Educational Psychology 1960, 51, 267–272. [Google Scholar] [CrossRef]
- Tucker, B. The flipped classroom. Education Next 2012, 12, 82–83. [Google Scholar]
- Van de Pol, J.; Volman, M.; Beishuizen, J. Scaffolding in teacher–student interaction: A decade of research. Educ Psychol Rev 2010, 22, 271–296. [Google Scholar] [CrossRef]
- Zimmerman, B.J. Becoming a self-regulated learner: An overview. Theor Pract 2002, 41, 64–70. [Google Scholar] [CrossRef]
- Creswell, J.W.; Creswell, J.D. Research Design: Qualitative, Quantitative, and Mixed Methods Approaches, 5th ed.; SAGE Publications, 2017. [Google Scholar]
- Spurlin, J.E.; Rajala, S.A.; Lavelle, J.P. Designing Better Engineering Education Through Assessment: A Practical Resource for Faculty and Department Chairs on Using Assessment and ABET Criteria; Stylus Publishing, 2008. [Google Scholar]
- Cohen, J. Statistical Power Analysis for the Behavioral Sciences, 2nd ed.; Lawrence Erlbaum Associates, 1988. [Google Scholar]
- Biggs, J.B.; Tang, C. Teaching for Quality Learning at University, 4th ed.; McGraw-Hill Education, 2011. [Google Scholar]
- Siemens, G.; Long, P. Penetrating the fog: Analytics in learning and education. Educause Review 2011, 46, 30–32. [Google Scholar]
- Zhu, X.; Zhang, X.; Zhang, Y. The impact of knowledge graphs on students’ learning achievements and cognitive load in varying task complexities. Education and Information Technologies 2023, 28, 14295–14317. [Google Scholar]
- Sweller, J. Cognitive load theory. Psychology of Learning and Motivation 2011, 55, 37–76. [Google Scholar]
- Skulmowski, A.; Xu, K.M. Understanding cognitive load in digital and online learning: A new perspective on extraneous cognitive load. Educ Psychol Rev 2022, 34, 171–196. [Google Scholar] [CrossRef]
- García-Alberti, M.; Suárez, F.; Chiyón, I.; Mosquera Feijoo, J.C. Challenges and experiences of rapid digital transformation in engineering education during the COVID-19 pandemic. Sustainability-Basel 2021, 13, 8867. [Google Scholar]
- Baber, H. Modelling the acceptance of e-learning during the pandemic of COVID-19-A study of South Korea. Sustainabilit 2021, 13, 2681. [Google Scholar] [CrossRef]
- Su, C.H. Visualizing the knowledge domain of self-regulated learning in higher education: A bibliometric analysis. Sustainability-Basel 2023, 15, 2329. [Google Scholar]
- Alam, A. Employing adaptive learning technologies for the sustainability of higher education. Sustainability 2022, 14, 11014. [Google Scholar]
- Sánchez-Carracedo, F.; Sureda, B.; Moreno-Pino, F.M.; Romero-Portillo, D. Education for sustainable development in Spanish engineering degrees. Sustainability 2021, 13, 2467. [Google Scholar] [CrossRef]
- Hassan, M.U.; Aljohani, N.R.; Santana-Mancilla, P.C. Outcome-Based Education (OBE) in the context of Industry 4.0: A systematic review. Sustainability-Basel 2023, 15, 7221. [Google Scholar]
Figure 1.
Conceptual framework of the proposed instructional model. The architecture integrates the three-layer domain Knowledge Graph (Concept-Method-Application) into the pre-, in-, and post-class phases of blended learning to support data-driven engineering competency evaluation.
Figure 1.
Conceptual framework of the proposed instructional model. The architecture integrates the three-layer domain Knowledge Graph (Concept-Method-Application) into the pre-, in-, and post-class phases of blended learning to support data-driven engineering competency evaluation.
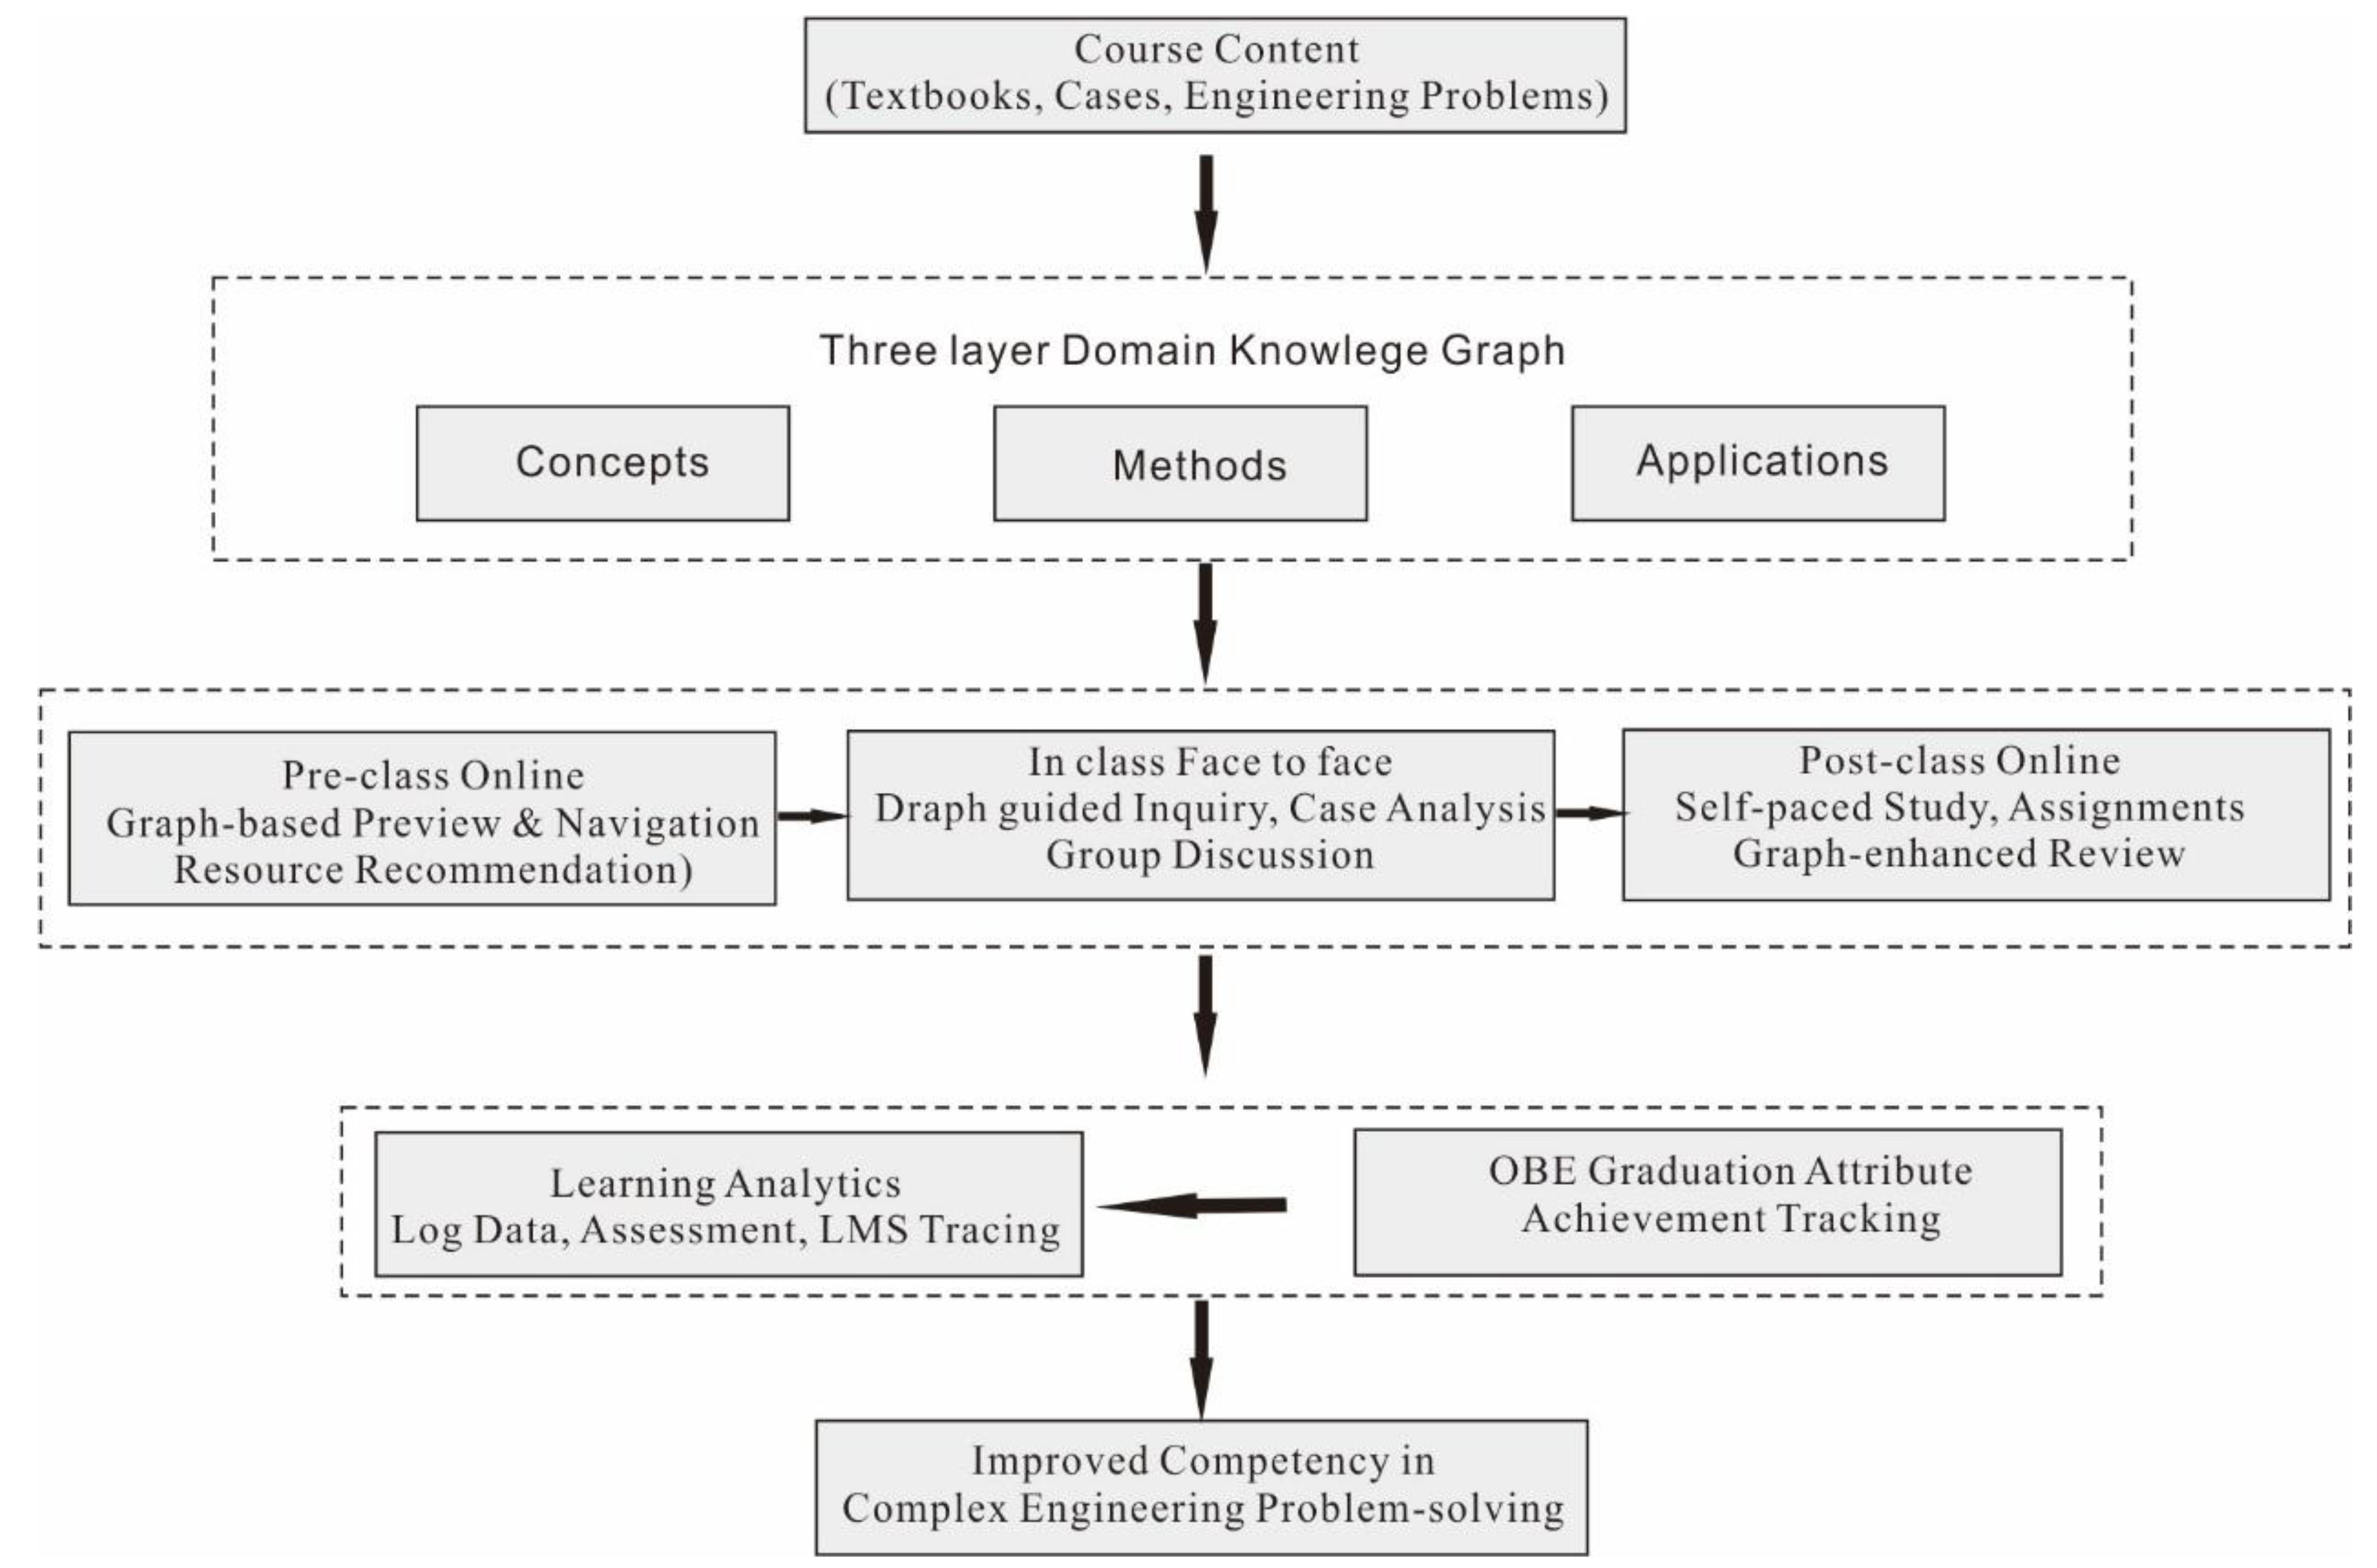
Figure 2.
Comparison of Graduation Attribute achievement values between the Experimental and Control groups across different cognitive levels.
Figure 2.
Comparison of Graduation Attribute achievement values between the Experimental and Control groups across different cognitive levels.
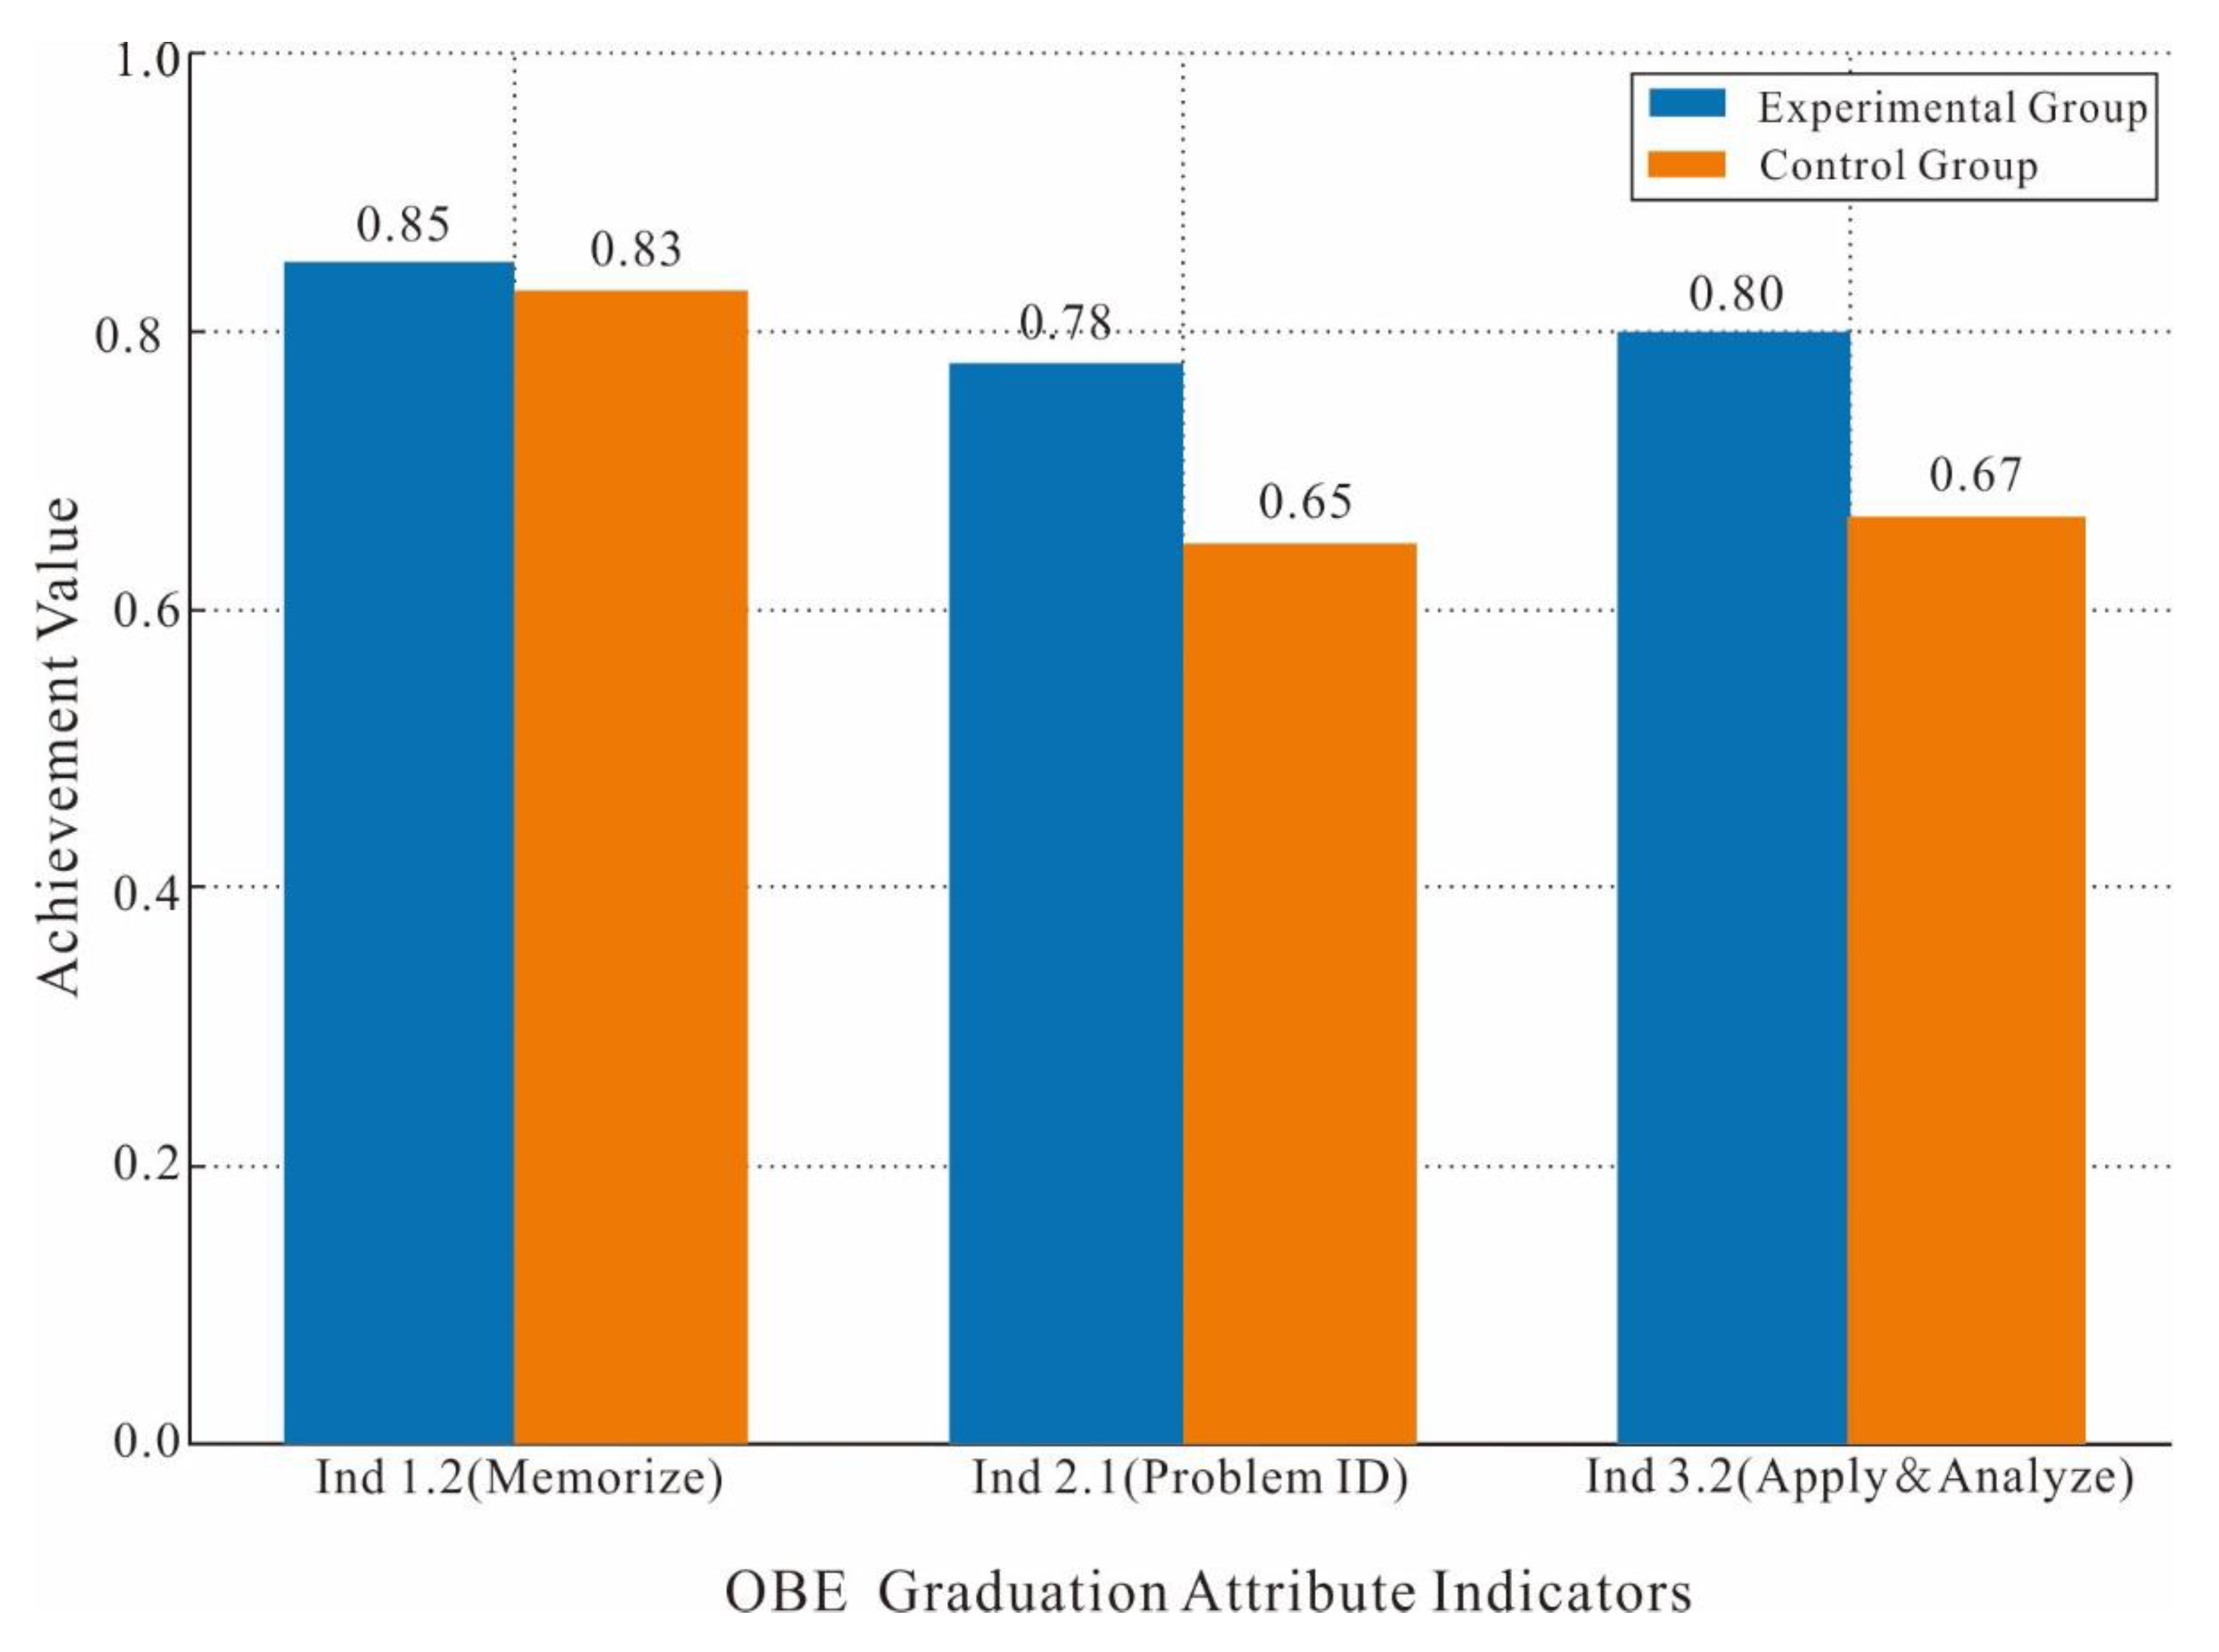
Figure 3.
Correlation analysis between Knowledge Graph node access frequency and final comprehensive scores for the Experimental Group (n=42). Note: The solid line represents the linear regression trend. The Pearson correlation coefficient is r=0.68 (p<0.001).
Figure 3.
Correlation analysis between Knowledge Graph node access frequency and final comprehensive scores for the Experimental Group (n=42). Note: The solid line represents the linear regression trend. The Pearson correlation coefficient is r=0.68 (p<0.001).
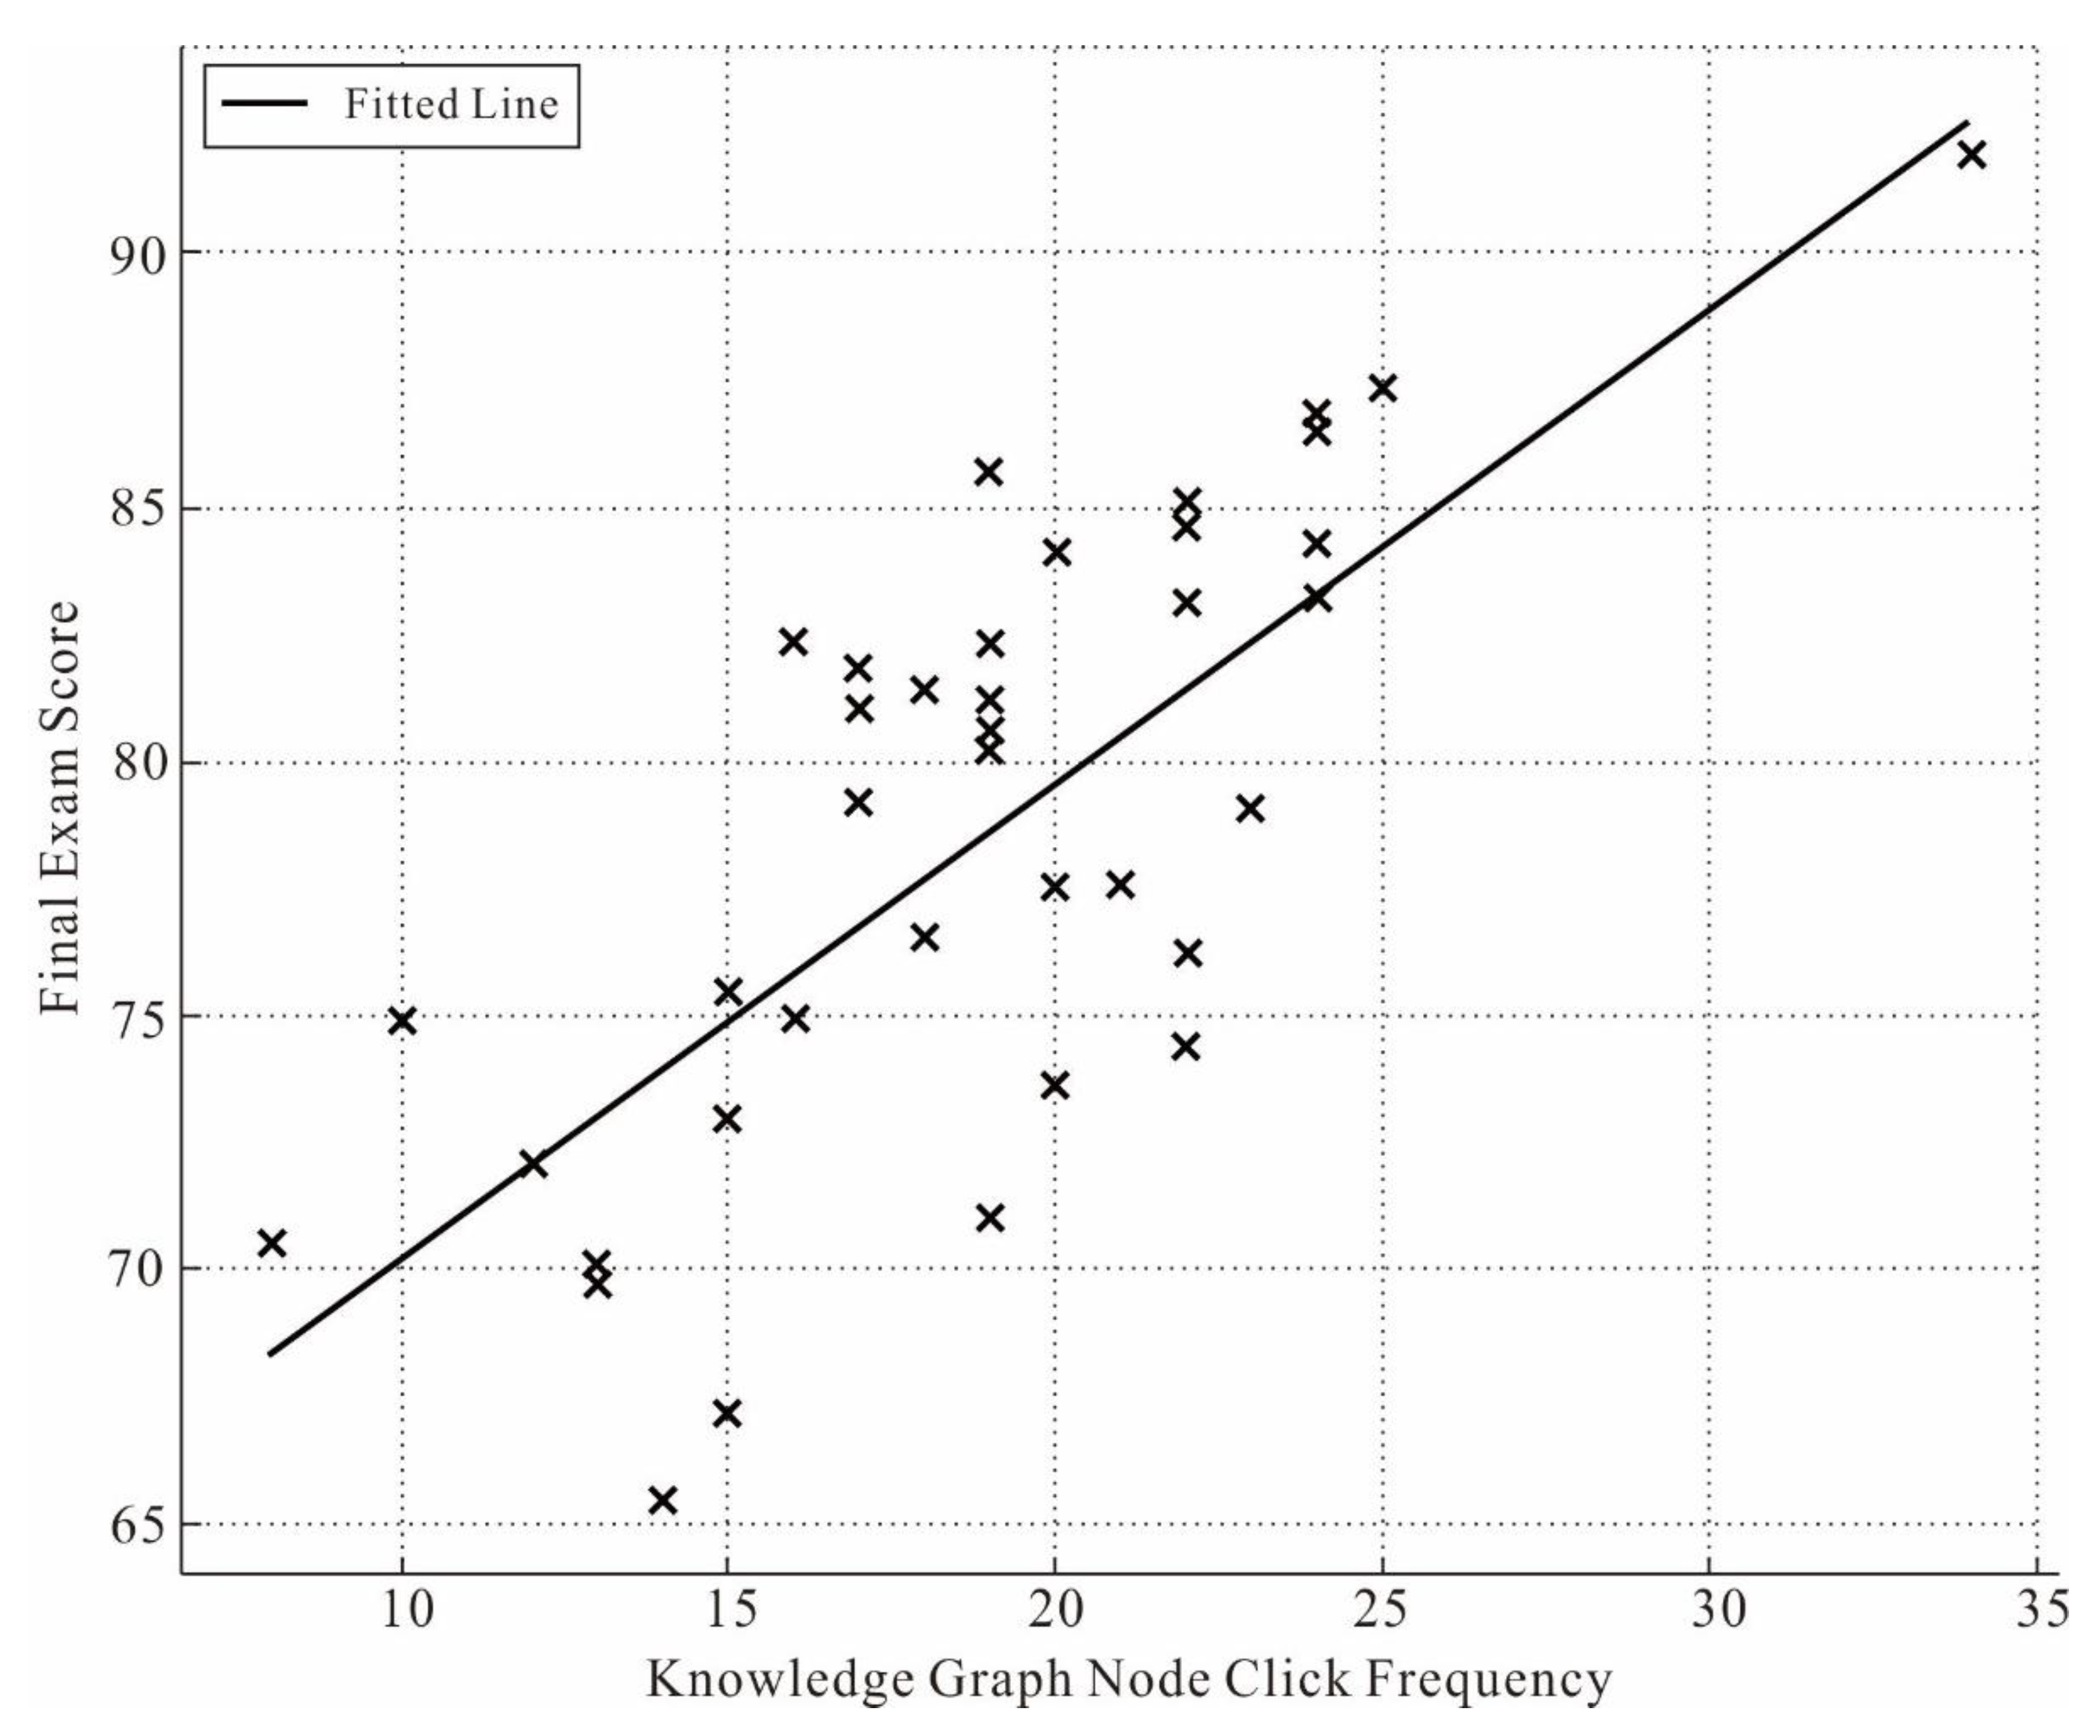

Table 1.
Comparison of Academic Performance between Experimental and Control Groups.
| Variable | Group | N | Mean ($M$) | Std. Dev. ($SD$) | t-value | p-value | Cohen’s d |
|---|---|---|---|---|---|---|---|
| Pre-course GPA | Experimental | 42 | 3.15 | 0.42 | -0.45 | 0.654 | 0.09 |
| Pre-course GPA | Control | 42 | 3.19 | 0.45 | |||
| Final Comprehensive Score | Experimental | 42 | 82.4 | 7.8 | 3.38 | < 0.01 | 0.74 |
| Final Comprehensive Score | Control | 42 | 76.1 | 9.2 |
Note: GPA is calculated on a 4.0 scale. Final scores are based on a 100-point scale. Statistical significance is set at p < 0.05. Bold values indicate significant differences.
Disclaimer/Publisher’s Note: The statements, opinions and data contained in all publications are solely those of the individual author(s) and contributor(s) and not of MDPI and/or the editor(s). MDPI and/or the editor(s) disclaim responsibility for any injury to people or property resulting from any ideas, methods, instructions or products referred to in the content. |
© 2025 by the authors. Licensee MDPI, Basel, Switzerland. This article is an open access article distributed under the terms and conditions of the Creative Commons Attribution (CC BY) license (http://creativecommons.org/licenses/by/4.0/).
Copyright: This open access article is published under a Creative Commons CC BY 4.0 license, which permit the free download, distribution, and reuse, provided that the author and preprint are cited in any reuse.


