
Submitted:
07 December 2025
Posted:
09 December 2025
You are already at the latest version
Abstract
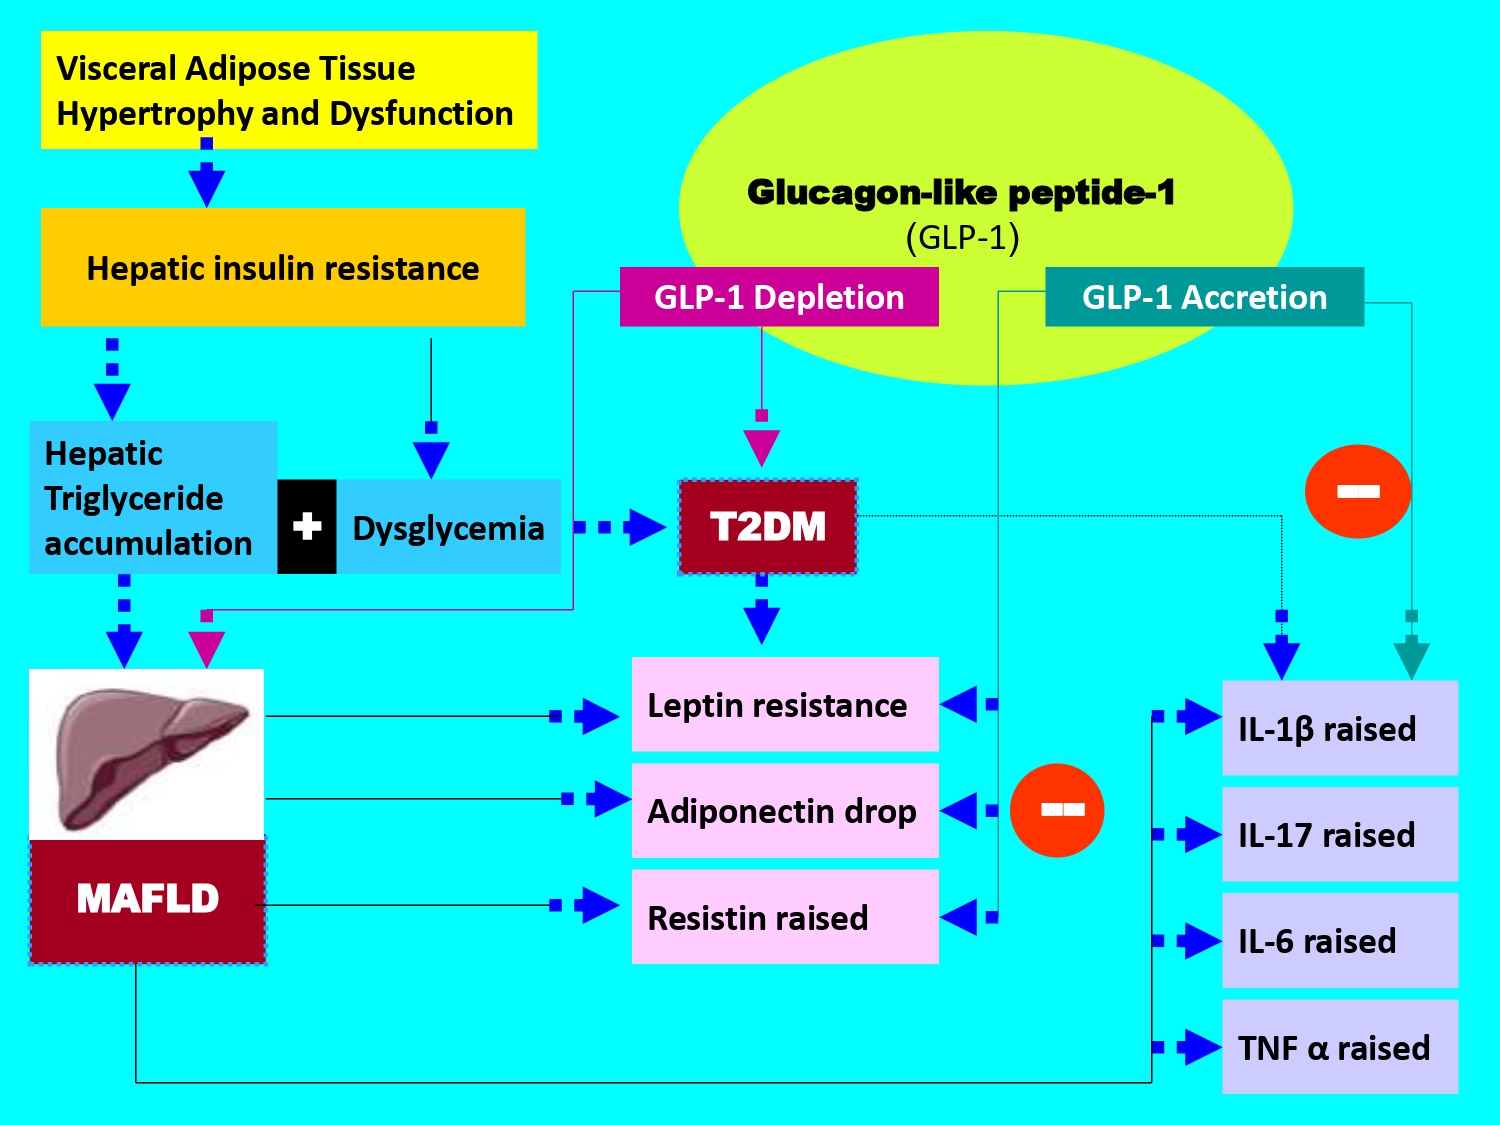
The triad association between Type 2 Diabetes Mellitus (T2DM), Metabolic Associated Fatty Liver Disease (MAFLD) and incretin secretion dysfunction, including GLP-1 (Glucagon-Like Peptide-1) maintains a critical cardiovascular risk and liver-related mortality. The aim of this study is to establish interactions between the GLP-1 plasma levels and metabolic syndrome clusters and adipokines profile (leptin, adiponectin, resistin) and proinflammatory cytokines (TNFα, IL-6, IL1β, IL-17) in diabetic subjects with or without MAFLD. The data revealed that insulin resistance (Homa-IR) is present in all groups. Homa-IR is negatively associated with plasma GLP-1 depletion in the MAFLD, T2DM and MAFLD + T2DM groups. Adiponectin levels are decreased in all groups as for GLP-1. At the opposite, leptin, resistin, TNFα, IL-6, IL1β and IL-17 levels show an inverse correlation with GLP-1. It appears that plasma GLP-1 can be considered as a transition and evolution biomarker in MAFLD and T2DM. GLP-1 accurately reflects metabolic and inflammatory status, both in subjects with MAFLD only or with T2DM only, before the Diabetes - Steatosis stage.
Keywords:
MAFLD (Metabolic Associated Fatty Liver Disease)
; Type 2 Diabetes Mellitus
; glucagon-like peptide-1
; adipokines
; proinflammatory cytokines
; metabolic syndrome
1. Introduction
According to the World Health Organization, approximately 415 million adults aged 20 to 79 years are affected by T2DM and this epidemiological number is enhanced to 800 million by 2040; whether in the adult subjects [1] or adolescents and children populations [2]. T2DM accounts for about 90% of all cases of diabetes mellitus, such as type 1 diabetes, gestational diabetes, MODY (Maturity Onset Diabetes of the Young) diabetes, LADA (Latent Autoimmune Diabetes in Adults) diabetes, and secondary diabetes caused by other diseases or medications. In T2DM, the glucose intolerance is related to either impaired insulin secretion, resistance to peripheral insulin actions, or a combination of both. However, it is admitted that T2DM is characterized by chronic metabolic syndrome disorders, specifically a chronic hyperglycemia associated or not with visceral adiposity, dyslipidemia, a blood pressure disorder and diffuse hepatic steatosis. In 2020, an international hepatic consensus suggested modifying the classification of hepatic steatosis between Non-Alcoholic Fatty Liver Disease (NAFLD) and Metabolic Associated Fatty Liver Disease (MAFLD) and recently MASLD (Metabolic Dysfunction-Associated Steatotic Liver Disease) [3]. Thus, MAFLD has been proposed as an overarching concept to replace NAFLD [4]. MAFLD criteria do not require the exclusion of other causes of liver disease, such as excessive alcohol consumption or viral hepatitis, as those for NAFLD, which is an advantage in terms of consistency with the clinical situation of patients. Furthermore, in a large cohort study of individuals participating in the Third National Health and Nutrition Examination Survey (NHANES III), patients diagnosed with MAFLD were older, had a higher body mass index (BMI), a higher incidence of metabolic complications, including type 2 diabetes and hypertension, and the presence of non-invasive biomarkers of liver fibrosis than patients with NAFLD, suggesting that the MAFLD criteria may identify patients at higher risk of intrahepatic or extrahepatic complications [5]. Since this update, the superiority of MAFLD to NAFLD is still unclear, further studies are needed. Nevertheless, it is important to report previous studies that have highlighted that NAFLD or MAFLD is one of the most common chronic liver diseases, affecting approximately 25% of the global population requiring treatment [6]. NAFLD is a progressive disease leading not only to fatal hepatic complications, including cirrhosis, liver cancer, and liver failure, but also to extrahepatic complications [7] such as cardiovascular diseases, chronic kidney disease, and extrahepatic cancers. The increasing prevalence of NAFLD or MASLD represents an urgent medical and public health problem in several countries [8]. The term NAFLD was coined by Jürgen Ludwig et al. in 1980 [9]. NAFLD is now diagnosed as liver steatosis, visible on imaging or pathogenic in biopsy, without any secondary factors leading to hepatic fat accumulation, such as excessive alcohol consumption and prolonged use of steatogenic drugs [10]. Previous studies have shown that many factors are involved in the development and progression of NAFLD, including hs-CRP/HDL-C ratio [11], insulin resistance [12], genetic factors [13], oxidative stress [14], and the gut microbiome [15]. Following these countless studies, the clarification between MAFLD and NAFLD was made in order to improved account for the heterogeneity of clinical phenotypes and to highlight the close link between fatty liver disease and metabolic dysfunction. This nomenclature precision was made to better reflect the fatty liver disease’s metabolic profile, emphasizing the role of cardiometabolic risk factors such as obesity, insulin resistance, dysglycemia and dyslipidemia. Additionally, the new terminology aims to reduce the stigma associated with the disease and provide a more accurate description of its pathophysiology, both on the ultrastructural aspect of the liver [16] and molecular mechanisms [17]. During the last decade, MAFLD is an increasingly significant public health issue worldwide and mortality linked-liver disease. In 2021, approximately 1.27 billion MAFLD cases were reported globally [18]. Since the introduction of MAFLD, the risk of mortality from hepatic complications has been clearly distinguished from mortality from extrahepatic causes. Areas of interest in hepatological clinical research have opened up new avenues for pharmacological the liver targets [19]. Over the last ten years, several meta-analyses have highlighted the role of incretins in the T2DM pathophysiology [20] and recently with MAFLD [21]. The incretins history begins in 1902 with the secretin discovery by Bayliss and Starling and the endocrine role of the intestine [22]. An incretin is intestinal hormone that stimulates the insulin secretion in response to food intake, and this in proportion to the plasma glucose level; defined as a specific incretins physiological action [23]. Two gastrointestinal hormones have been defined as incretins: Glucose-dependent insulinotropic polypeptide or gastric inhibitory peptide (GIP) and Glucagon-like peptide-1 (GLP-1) [24]. Among the incretins family, Glucagon-Like Peptide-1 (GLP-1) remains the most incretin used in glycemic control of diabetic patients and has been the largely studied for its multiple physiological enterohormonal effects [25]. The incretin pharmacological targets is currently recognized as new anti-diabetic therapeutic classes, such as Liraglutide, semaglutide and Exanatide both in diabetes [26] including gestational diabetes [27] and MAFLD [28,29]. The GLP-1 is produced via the gene encoding proglucagon expression, secreted by duodeno-jejunal enteroendocrine L cells. It is released in response to the ingestion of nutrients, particularly carbohydrates and monounsaturated lipids. The half-life of plasma GLP-1 is very short (2 minutes), as it is rapidly inactivated by dipeptidyl peptidase IV (DPP-IV) [30]. The GLP-1 binds to specific heptahelical cell receptors coupled with adenylate kinase activation, which stimulates the cyclic AMP synthesis via the glucose-dependent protein kinase A signaling pathway. However, it should be emphasized that there is a duality in the mechanism of action between GLP-1 and GIP [31]. The GLP-1 receptors agonists are expressed in different tissues such as pancreas, liver, heart, lung, adipose tissue, smooth muscle, kidney and hypothalamus [32]. The GLP-1 exerts several physiological effects including satiety, by slowing gastric emptying, potentiates postprandial insulin secretion with more than 70% of insulinotropic effects without hypoglycaemia [33,34]. The GLP-1 has no direct action on insulin secretion in the absence of glucose and inhibits the glucagon release [35]. The relationships between T2DM, MAFLD and incretins hormone are very little described in the literature or often separately elucidated. Indeed, several studies have described independently the T2DM and MAFLD associations [36] or T2DM and GLP-1 [37] or MAFLD and GLP-1[38]. These associations have most often been linked to hepatic insulin resistance [39] and cardiometabolic syndrome clusters [40]. All meta-analyses published support the interactions between MAFLD and GLP-1 in T2DM. The hyperactivity of visceral adipose tissue has been recognized as pivot between MAFLD and adipocytokines [41]. This relationship is found between liver ectopic fat and GLP-1 in T2DM. These interactions are implicated in the metabolic disorders genesis, such as metabolic syndrome, related to hepatic dysfunction and vasculo-inflammatory disorders [42]. However, recent studies has considered the primum movens of physiological dysfunctions observed during MAFLD and T2DM are linked to gut-liver axis, predominantly by inappropriate GLP-1 flux secretion [43] including the microbiota [44]. Furthermore, the concept of anatomical axis between gastrointestinal tract and other organs, such as liver, adipose tissue, endocrine pancreas and brain has helped to clarify the physiological mechanisms involved in complexity of GLP-1 action [45]. Indeed, the digestive tract maintains multiple interactions with endocrine pancreas axis via the entero-insular - beta cells proliferation via brain function [46]; the entero-hepatic axis via the gluconeogenesis attenuation and the glycogenogenesis stimulation [47]; the entero-adipocyte axis via the reduction of free fatty acids flow and adipocytokines modulation [48] and the entero-cerebrospinal axis via the physiological effects of intestinal microbiota [49] or via vagal afferent neuron signalling [50]. On the other hand, the dysglycemia in T2DM and steatosis in MAFLD coexistence is linked to the adipokines family which has been most incriminated, such adiponectin [51] via incretins therapy, particularly GLP-1 [52]. Several studies have shown that leptin interacts with GLP-1 and its antagonist to reduce overeating. The eating behaviour modulation by GLP-1 via Leptin neurons receptors is observed in the dorsomedial hypothalamus [53]. In brain, LepR receptors were detected in GLP-1R-expressing neurons of the nucleus of the solitary tract, and leptin stimulated these neurons [54]. Previous studies using glucagon-like peptide-1 receptor agonists (GLP-1 RA) as therapy have reported an elevation in adiponectin levels after GLP-1 RA injection [55]. Other studies have shown that liraglutide (GLP-1 analogue) treatment in patients with T2DM resulted in increased adiponectin levels and decreased resistin levels compared to subjects treated with glimepiride (insulin secretagogy) while reducing hyperglycemia levels to the same level [56]. In addition, Adipokines secretion disorder in MAFLD and T2DM is strongly associated with the inflammation process, activated by the pro-inflammatory cytokines signaling pathway which becomes exacerbated with a significant production of TNFα (Tumor Necrosis factor alpha) and interleukins, particularly IL6 [57]. The pro-inflammatory cytokines are major mediators of the transition from MAFLD to MASH (metabolic dysfunction-associated steatohepatitis). Some studies have shown that administration of GLP1 analogue in obese patients with type 2 diabetes modulates hepatic glucose production by a decrease in IL-6 secretion. It is described that IL-6 has been shown to enhance hepatic pro-inflammatory activity via activation of Macrophage Polarization in Kuppfer cells by altering insulin secretion in pancreatic beta cells and insulin signaling pathways in the liver, leading to insulin resistance [58]. Among the transition interleukins, some studies have shown that interleukin-17 (IL-17) is involved in the pathogenesis of liver fibrosis [59]. IL-17 causes neutrophil infiltration, insulin resistance, inflammation and subsequent steatohepatitis [60]. IL-1β plays a crucial role in hepatic steatosis by stimulating the accumulation of triglycerides and cholesterol in hepatocytes and the formation of lipid droplets [61]. IL-1β promotes hepatic inflammation by acting on liver sinusoidal endothelial cells via regulation of ICAM-1 (intercellular adhesion molecule 1) expression, which attracts neutrophils into the liver. In association with IL-6 and TNF-α, IL-1β activates local immune cells and attracts other leukocytes to the liver, causing a chronic inflammatory state. Finally, IL-1β contributes to the progression of hepatic inflammation to liver fibrosis via hepatic inflammasome activation [62]. On the other hand, previous work has demonstrated that TNF-α infusion results in a reduction in GLP-1 synthesis, indicating the inflammation state counteracts the beneficial effects of GLP-1 [63]. Conversely, treatment with GLP-1 (or its analogues) reduces pro-inflammatory effect of TNF-α and improves glycemic control [64]. This study has a dual objective: i) to determine the pleiotropic effects of GLP-1 as a modulator of adaptive physiological responses to metabolic syndrome cardiovascular risk factors and to the pro-inflammatory plasma adipocytokines profile; ii) to evaluate the GLP-1 secretion and determine whether this can be considered as a biomarker of transition between MAFLD and T2DM.
2. Results
2.1. Cohort Participant’s Characterization According Clinical Metabolic Syndrome
Our study cohort included 590 participants, distributed following the inclusion and exclusion criteria application: (i) 94 Metabolic Dysfunction-associated Fatty Liver Disease (MAFLD) without diabetes (T2DM); (ii) 222 T2DM without MAFLD; (iii) 174 MAFLD with T2DM comorbidity; and 100 Healthy subjects. The all participant’s cohort was classified according to age and sex, with a sex ratio of men/women = 0.57. In our study, MAFLD incidence was predominant in male compared to women participants (60.9 % versus 39.1 %, respectively, p < 0.001). Concomitantly, most men are overweight or obese (89%), with a median age of 48 years in Men and 44 years in Women (Table 1).
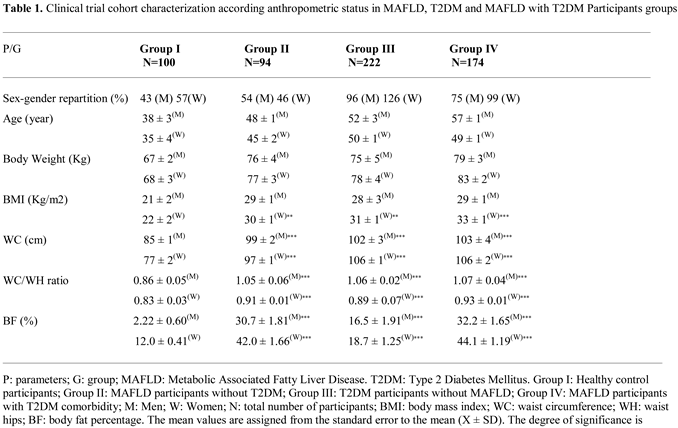
In contrast, the prevalence of type 2 diabetes mellitus (T2DM) was higher among women than men participants (53% versus 47%, respectively, p < 0.001). However, women participants with association NAFLD and metabolic syndrome (MetS) were more likely to become diabetic’s compared to males. In this investigation the MAFLD participants (group III) exhibited moderate steatosis (grade 2) characterized by microvesicular steatosis, with 45% of hepatocytes overloaded with lipids, without signs of fibrosis (data not shown). As summarized in Table 1, anthropometric data showed a strong relationship between body mass index (BMI) and body fat percentage (%BF), but not with body weight in all groups.
The waist-to-hip ratio (WC/WH) ratio confirms that diabetics (T2DM group) and diabetic’s steatosis (T2DM+MAFLD group) participants are obese with android-type abdominal adiposity in men, and gynoid-type in women compared to healthy group. Similarly, the %BF indicates that adipose tissue hypertrophy is exacerbated in the T2D+NAFLD groups and to a lesser extent in the T2DM group. A positive and significant correlation was observed between GLP-1 and %BF in MAFLD, T2DM and MAFLD+T2D groups (Figure 3C). Waist circumference (WC) revealed abdominal adipose tissue deposition, reflecting a significant increase in visceral adiposity (p < 0.001) in groups II (Steatosis), III (Diabetics) and IV (Diabetics Steatosis) compared to Healthy group. A positive and significant correlation was observed between GLP-1 and BMI (Figure 3A), and between GLP-1 and WC (Figure 3B), and between GLP-1 and WC/WH ratio (Figure 3D) in groups II, III and IV compared to group I.
Similarly, the Homa-IR index evolves in parallel with hyperinsulinism. The Homa-test is used as a screening tool to detect MAFLD in a diabetic subject [65]. An acute insulin resistance is revealed in the group IV (+93% vs controls groups, p<0.001), T2DM and MAFLD groups (+88% and +70%, respectively vs control subject). Referring to the National Cholesterol Education Program Adult Treatment Panel III (NCEP/ATP-III) consensus [66], MAFLD participants group manifest glucose intolerance. T2DM and MAFLD+T2DM groups are characterized by hyperglycemia > 7 mmol/L, while HbA1c being < 7% (Table 2), which indicates adequate glycemic control. We found an inverse correlation between GLP-1 and glycemia, and insulinemia, and HbA1C, and Homa-IR in the MAFLD and T2DM groups (Figure 4A, Figure 4B, Figure 4C and Figure 4D respectively). In this study, we observed a strong association between severe dyslipidemic triglyceridemia and cholesterolemia with elevated LDL-c and decreased HDL-c in I, II, II and IV groups versus control group (Table 2). Dyslipidemia was especially due to NEFA hepatic infiltration increase becomes paroxystic levels in group IV versus group I (Table 2). In addition, the hepatic lipids observed in histopathological MAFLD diagnosis increase together with serum triglycerides accumulation. This is obviously indicative of severe liver deterioration in diabetic- steatosis groups versus the healthy group. We recorded a positive correlation between hypertriglyceridemia and serum NEFA levels in the MAFLD+T2DM group (Figure 5A, Figure 5B). On the other hand, the correlation is negative between serum HDL-cholesterol levels and GLP-1 concentrations in this same group (Figure 5C
The data presented in Table 2 show that liver function is severely impaired in the MAFLD+T2DM group. The serum ALT, AST and GGT concentrations are abnormally high by 3 to 4 times the normal value versus control group. Hypertriglyceridemia observed in the MAFLD and MAFLD+T2DM groups is positively correlated with serum ALT and GGT levels as a sign of liver necrosis without non-alcoholic steatohepatitis state (Figure 5D and Figure 6D, respectively). This is also confirmed by the positive correlation between decrease plasma GLP-1 levels and decrease AST/ALT ratio, but high elevation of serum ferritin levels in the MAFLD and MAFLD+T2DM groups and normal in the T2DM group (Figure 6A, Figure 6B). Interestingly, the increase of transaminase levels is positively associated with the drastic fall in serum GLP-1 levels in both steatosis patients (Groups II and IV). Furthermore, in the MAFLD+T2DM group, it is noted that liver dysfunction is associated both with an acute inflammatory state, supported by excessively high Hs-CRP concentrations. Concomitantly, plasma ferritin and total bilirubin concentrations are exacerbated in Groups II and IV (Table 2). A strong correlation was found between ALT levels and Mets clusters in MAFLD+T2DM groups. The association was observed between decrease GLP-1 and visceral adiposity (TT), Homa-IR and hypertriglyceridemia. A blood pressure disorder was observed in group IV compared to the other groups who remained normotensive state. However, if we consider the NCEP-ATP III criteria (PAS> 130 mm Hg), a blood pressure disorder seems to occur in the MAFLD+DT2M group.
2.2. Plasma Glucagon-Like Peptide 1 (GLP-1) Profile
Plasma GLP-1 production is presented in Table 2. It should be to remember that GLP-1 was measured after a 12-hour fasting phase, and after the meal consumption contained 820 kcalories. The data mentioned in Table 2 represent the average values between 60 and 15 minutes (Δ GLP-1) after the meal digestion phase. Fasting and fed state values vary between 11.7 ± 1.71 and 34.5 ± 3.81 pmole/L, respectively in the control group. It should be noted that GLP1 secretion rates were decreased in both the fasting and fed states in the steatotis and diabetic groups compared to the healthy group (Table 2). We recorded a decrease of 19%, 25% and 76%; and of 40%, 58% and 68% respectively in groups II, II and IV (p < 0.001). Remarkably, GLP-1 secretion was significantly increased in the postprandial (PP) state compared to the fasting (Fs) state in all groups. The difference in GLP-1 synthesis was decreased by 66%, 54%, 40% and 39% respectively in groups I, II, II and IV (p < 0.001). However, when considering each nutritional state separately, GLP-1 production decreased in both MAFLD and T2DM participants compared to control group (40% to 19% decrease, respectively, p<0.001). The GLP-1 depletion was accentuated when steatosis was associated with diabetes in the MAFLD+T2DM group. GLP-1 concentrations are reduced by 43% and 68%, respectively, in the fasting and postprandial states. In the MAFLD+DT2M group, we found a negative correlation between plasma GLP-1 levels and HbA1c (Figure 4C), Homa-IR (Figure 4D), hypertriglyceridemia (Figure 5A), TT (Figure 3B) and Hs-CRP (Figure 6C). Similarly, fasting GLP-1 values were inversely correlated with fasting insulin values in groups II, III and IV compared to the control group (Figure 4B). It is important to note that despite the drop in plasma GLP1 levels in the steatosis participants (Group II), glucose tolerance was not affected in this group. Group II remains normoglycemic, although it presents hyperinsulinism (Table 2).
2.3. Plasma Adipokines Profile
2.3.1. Plasma Leptin Levels
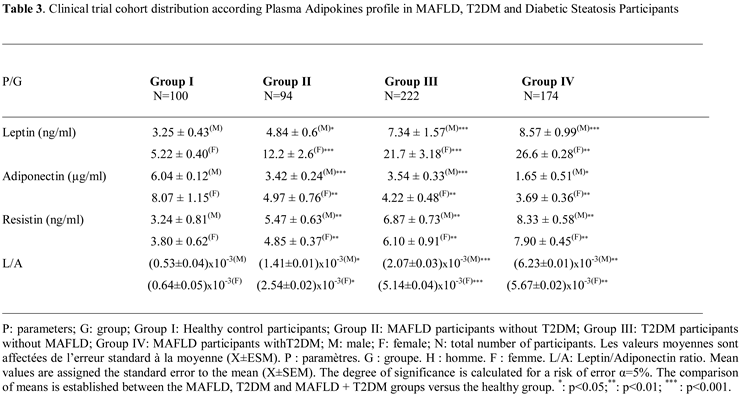
The leptin profile is gender dependent. In this study, the data reveal that women have higher serum leptin levels than men participants in control groups, respectively 5.22 ± 0.40 ng/mL versus 3.25 ± 0.43 ng/mL. The sex difference is highly significant, at 60% (p<0.001). This sex-variation is maintained in steatosis, diabetic, and diabetic-steatosis groups. Leptin secretion increases depending on the intensity of adipose tissue accumulation (% fat and BMI). Surprisingly, the data obtained on the adipokines status that leptin levels are higher proportionally to the fat mass increase, especially the diabetic-steatosis group and even elevated in the diabetic group compared to the control group. We recorded an average increase of 45%, 55% and 71% in groups II, III and IV respectively (Table 3). The strong correlation has been observed between plasma GLP-1 levels and leptinemia in the MAFLD, T2DM and MAFLD+T2DM groups (Figure 7A). Similarly, the correlation is positive between leptinemia and Homa-IR in the three groups (r=+0.88; r=+0.91; r=+0.99, respectively, p<0.001).
2.3.2. Plasma Adiponectin Levels
Similar to the leptin profile, adiponectin secretions also gender depend. A significant difference was observed between circulating serum adiponectin levels in women and men (33% increases in women), respectively 8.07 ± 1.15 versus 6.04 ± 0.12 ng/mL in the control group (Table 3). In contrast to leptin, plasma adiponectin concentrations were reduced in all MAFLD, T2DM, and MAFLD+T2DM participants, resulting in an elevated leptin/adiponectin (L/A) ratio (Figure 7CIn addition, we noted an association between adiponectin depletion levels and a reduction in circulating GLP-1 concentrations in the MAFLD+T2DM group (Figure 7B). In addition, a positive correlation is observed between adiponectin and GLP-1 levels in the MAFLD and T2DM groups (Figure 7B). In contrast, adiponectin levels are inversely correlated with BMI, insulin levels, serum triglycerides, and insulin resistance in the T2DM (r=-0.45, r=-0.39, r=-0.51, r=-0.69, respectively, p<0.001). Furthermore, a negative correlation is observed in MAFLD+T2DM (r=-0.44, r=-0.38, r=-0.50, r=-0.68, respectively, p<0.001) groups. However, we did not find a correlation between adiponectin levels and % BF in Group II, III and IV. Unlike hyperleptinemia, it appears that hypoadiponectinemia is an independent factor in the evolution of body fat mass during steatosis phase, except in diabetic participants where the correlation is positive.
2.3.3. Plasma Leptin/Adiponectin Ratio
Regarding the correlation between leptin/adiponectin ratio (L/A) and plasma GLP-1 level (Figure 7C). Moreover, the L/A ratio was negatively correlated with HDLcholesterol level (r=−0.314, p < 0.001). On the other hand, the L/A ratio very weakly correlated with LDL-cholesterol level (r=0.117, p < 0.001), and there was no significant correlation between the L/A ratio and serum NEFA level (r=0.066, p=0.053). Overall, the L/A ratio was also correlated with the ratio of total cholesterol to HDL-cholesterol (Table 3). With respect to the relation with other parameters, the L/A ratio was weakly correlated with glycated hemoglobin A1c, ALT, and GGT, and there was no correlation between L/A ratio and AST. On the over hand, the L/A ratio was changes proportionally to elevated leptin levels and decreased adiponectin levels in diabetics groups, but not steatosis groups compared to control group (Figure 7B). Consequently, L/A ratio increased with increasing severity of steatosis when associated with diabetes in group IV. The L/A ratio showed positive correlations with BMI (r=0.588, p < 0.001) and % BF (r=0.603, p < 0.001).
2.3.4. Plasma Resistin Levels
Unlike leptin and adiponectin plasma levels, resistin production is not gender dependent. Although, we noticed that the resistin plasma levels are slightly elevated in men than women, but non-significant difference (Table 3). A mean value of 3.52 ± 0.24 ng/mL was obtained in group I; 5.16 ± 0.29 ng/mL in group II; 6.48 ± 0.38 ng/mL in group III and 7.67 ± 0.29 ng/mL in group IV, both women and men. Plasma resistin levels were increased in all diabetic subjects with or without steatosis. It is noted that resistinemia tends to increase during the phases of steatosis, diabetes, and the steatosis-diabetes association. Serum resistin levels are highly elevated in the MAFLD-T2D group. We recorded an increase of 29%, 42% and 64%, respectively in MAFLD, T2DM and MAFLD+T2DM groups. The difference was highly significant (p<0.001). Resistinemia evolved concomitantly with insulin resistance. In this study we observed a strong positive correlation between plasma resistin levels and Homa-IR in groups II and IV (r=0.803, r=0.776, respectively, p < 0.001). Interestingly, GLP-1 concentrations were inversely correlated with resistin concentrations in the MAFLD, T2DM and MAFLD+T2DM groups (Figure 7D).
2.4. Plasma Pro-Inflammatory Cytokines Profile
2.4.1. Plasma TNFα (Tumor Necrosis Factor-Alpha) Levels
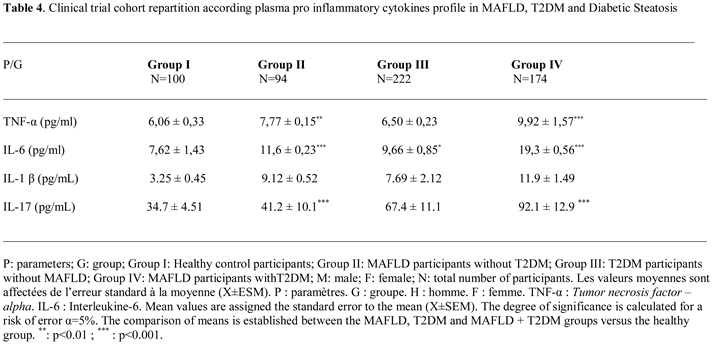
In this study, we observed that plasma TNFα levels are increased proportionally to the elevation of serum Hs-CRP levels in all diabetic and steatosis groups compared to healthy subjects. However, the TNF plasma levels are highly deleterious in the steatosis group (groups II and IV) and to a lesser extent in the non-steatosis diabetic group (group III). We observed a positive correlation between Hs-CRP levels both with TNFα, IL-6, IL-1β and IL-17 in MAFLD+T2DM group (r=+0.68; r=+0.77; r=+0.91; r=+0.51, respectively, p<0.001). We found that TNFα is increased by 39% and 22% (p<0.001) in the MAFLD+T2DM and MAFLD groups respectively (Table 4); whereas, TNFα is increased only by 6% in the diabetic group without steatosis versus healthy group. The correlation is positive between TNFα, IL-6 and IL-1 β and BF in MAFLD (r=+66, r=+47, r=+38, respectively, p<0.001) and MAFLD+T2DM (r=+67, r=+49, r=+55, respectively, p<0.001) groups. In contrast, plasma GLP-1 is inversely correlated with TNFα, IL-6, IL-1β and IL-17 concentrations in T2DM and MAFLD+T2DM groups (Figure 8A, Figure 8B, Figure 8C and Figure 8D).
2.4.2. Plasma IL-6 (Interleukin-6) Levels
Unlike the TNF alpha plasma profile was increased only in the steatosis groups (groups II and IV); however, plasma IL-6 levels were elevated in both the steatosis and diabetic groups (groups III). The inflammation due to interleukin-6 (IL-6) is more fulminating than TNFα (Table 4; Figure 2B). Interestingly, MAFLD group III and IV increased IL-6 levels by 60% and 34% versus healthy group (19.3 ± 0.56 and 11.6 ± 0.23 vs. 7.62 ± 1.43 pg/mL; P ≤ 0.001, respectively). Furthermore, we found a positive correlation between IL-6 levels and L/A ratio in group II and IV (r=0.133, p < 0.001 and r=0.130, p < 0.001, respectively), whereas there was no correlation between IL-6 level and adiponectin level in steatosis groups (II, IV).
2.4.3. Plasma IL-1 β (Interleukin-1β) Levels
We showed a strong increase for IL-1β by 72%; 64% in the MAFLD+T2DM and MAFLD groups respectively; p<0.001 versus healthy group. IL-1β promotes hepatic steatosis by stimulating the accumulation of triglycerides in steatosis groups II, IV (Table 4). We established a positive correlation between IL-1β levels and triglycerides levels in group II and IV (r=0.545, p < 0.001 and r=0.308, p < 0.001, respectively). Likewise, there was strong correlation between IL-1β level and plasma NEFA (non-esterified fatty acids) level in steatosis groups II, IV (r=0.661, p < 0.001 and r=0.801, p < 0.001, respectively). It appears that IL-1β, together with IL-6 and TNFα, activates lipolysis by releasing a significant flux of NEFA. The correlation is positive and highly significant in steatosis groups II, IV (p < 0.001). On the over hand, IL-1β contributes to steatosis progression from fatty liver to inflammation liver fibrosis as evidenced by elevated plasma ferritin and hs-CRP levels in steatosis groups II, IV. The difference is highly significant (p < 0.001) compared to the control group.
2.4.4. Plasma IL-17 (Interleukin-17) Levels
We have seen a clear increase for IL-17 by 62%; 16% in the MAFLD+T2DM and MAFLD groups respectively; p<0.001 versus healthy group. Our study confirms the importance of IL-17 in steatosis group III and diabetic-steatotic participants (Group IV) when MAFLD is complicated with presence of diabetes (Table 4). Indeed, we observed a positive correlation between enhance in IL-17 levels and rise flux of plasma NEFA (r=0.851 and r=0.791, p < 0.001, respectively). Furthermore, we observed a proportional and synergistic increase in transaminase activities, particularly the AST/ALT ratio, with the dramatic rise in IL17 levels in group IV. Surprisingly, we noticed that in group IV, concomitantly with the increase in IL-17 and the increase in plasma NEFA flow, insulin sensitivity decreased significantly, as demonstrated by the increase in HOMA-IR index, which leads to insulin resistance.
3. Discussion
Our clinical data divulge important abnormalities of GLP-1 secretion in the MAFLD participants with or without T2DM. The plasma GLP-1 levels reveal a progressive decrease in both participants with steatosis and diabetes without comorbidity, and in diabetic steatosis participants with comorbidity. The GLP1 secretion in the different groups of participants can be classified into three stages: moderate in MAFLD without diabetes (group II), severe in T2DM without steatosis (group III), and morbid in diabetic steatosis (group IV). In our study, five factors modulated GLP-1secretion or it bioavailability: (i) insulin resistance; (ii) liver dysfunction; (iii) visceral adipose tissue hyperactivity; (iv) Adipokines profile; (v) and pro-inflammatory cytokines production.
i) The first major point is linked to the MAFLD – T2DM – GLP-1 plasma levels interactions and metabolic syndrome clusters
It is undeniably confirmed that the incretin effect of GLP-1 is inhibited in the presence of insulin resistance (Homa-IR). The insulin resistance observed in steatosis without diabetes (MAFLD group) is explained by hepatic insulin resistance due to highly active lipogenesis, marked by increased de novo fatty acid synthesis (malonyl CoA pathway), which stimulates overproduction of VLDL lipoproteins [67]. Hepatic insulin resistance is also due to an exacerbated increase in adipocyte lipolysis, leading to intrahepatocyte lipid infiltration [68]. Gradually, this fatty infiltration affects the skeletal muscle when steatosis becomes complicated by diabetes (MAFLD+DT2 group). At this stage, insulin resistance becomes hepato-muscular, and there is an alteration of the insulin signaling pathway via the activation of the protein kinase C epsilon pathway [69].
Our data are explained by the involvement of adipose tissue via triglyceride dyslipidemia, which we found in the steatosis groups with and without diabetes. Indeed, lipolysis of visceral adipose tissue (VAT), which is highly hypertrophied (TT, WHR, MGC percentage), rich in adrenergic receptors, particularly when steatosis is associated to obesity [70], releases an excessive flow of triglycerides, creating a large pool of non-esterified free fatty acids (NEFAs), which maintains insulin resistance [71]. In addition, hyperactivity of adipocyte triglyceride lipase and inhibition of NEFA oxidation partly explain the glucose intolerance of steatosis subjects (MAFLD group) and the diabetic’s hyperglycemia (T2DM group) [72]. The impaired blood glucose regulation observed in the MAFLD and T2DM groups is no longer mediated by incretins, given the lack of effect of GLP-1, a potent inhibitor of glucagon secretion, as had been proposed as a therapeutic target [73].
Some studies have suggested that GLP-1 acts through paracrine effects by increasing somatostatin and insulin concentrations, thereby modulating steatosis in diabetic subjects. [74]. Recently, it has been shown that elevated free fatty acid release induced by a high-fat diet, particularly saturated FA, but not unsaturated FA, leads to duodenal lipotoxicity that inhibits GLP-1 synthesis via PPARdelta/UCP2 pathway [75]. These data explain hypoincretinemia of GLP-1 in MAFLD [76] and its depletion in T2DM [77]. These studies found a strong association between GLP-1 depletion and dysfunction of transmembrane G proteins, particularly when they are activated by increased free fatty acids. This primarily involves GPR40 in the beta cell. This dysregulation also affects other G proteins, such as GPR119 and GPR120. GLP-1R expression has also been described as poorly detectable (low mRNA concentration) in hepatocytes from liver biopsies of subjects with MAFLD, and becomes undetectable in NASH [78].
ii) The second crucial point is linked between MAFLD - T2DM - GLP-1 plasma levels interactions and plasma adipokines profile
In both groups of diabetics with or without steatosis, we demonstrated hypoadiponectinemia concomitant with a marked depletion of plasma GLP-1 concentrations, with an increase in leptin and resistin. Hyperleptinemia does not appear to be due solely to overproduction of leptin by adipose tissue, as insulin resistance increases circulating leptin concentrations [79], but more specifically to a situation of resistance to the action of leptin, favoured by drop in GLP-1 concentrations. Indeed, GLP-1 has been reported to maintain a state of satiety after food intake by regulating the secretion of leptin and ghrelin via the vagus nerve in diabetic’s patients [80].
This supports major interactions at the brain level between GLP-1 and leptin, as GLP-1 receptors (Glp-1R) and leptin are distributed in the neurons hypothalamic regions (arcuate nuclei and solitary tract). Through this, GLP-1 and leptin exert their satiety-inducing effect. In our study, it appears that a lack of GLP-1 leads to an accumulation of leptin in the cerebrospinal fluid, which inhibits its passage from the blood to the brain via the blood-brain barrier (BBB). Indeed, leptin, transported in the CSF, reaches the brain, more precisely in the hypothalamus at the arcuate nucleus, where it is recognized by specific receptors (Lep-Rb) and then internalized into neurons [81]. In the hypothalamic region, the selectivity function of the blood-brain barrier is ensured by glial cells, called tanycytes, irrigated by insulin-sensitive fenestrated blood vessels [82].
It is precisely in the tanycytes that leptin binds and then accesses the neurons of the arcuate nucleus. In our study, we hypothesized a state of resistance to leptin penetration into the brain (arcuate nucleus), where leptin remains trapped in the tanycytes, which leads to its accumulation in the Cerebrospinal fluid, particularly in diabetes [83]. Consequently, it would also accumulate in the blood, which would explain our results. The originality of our study lies in the fact that GLP-1 deficiency could also be associated with this form of leptin resistance via the insulin resistance signaling pathway [84]. Based on anima model, this set of events represents a brake on leptin signaling pathways at the hypothalamic level via inhibition of the JAK-STAT3 (Janus activated kinase-signal transducer and activator of transcription 3) signaling pathway [85].
The data obtained with adiponectin are concomitant with GLP-1 depletion, but also with insulin resistance. Several meta-analyses confirm that hypoadiponectinemia is most often associated with MAFLD and contributes to the onset of T2DM in a steatotic subject. However, the administration of a GLP-1 mimetic treatment corrects this disorder by increasing serum adiponectin levels [86]. One of the arguments explaining hypoadiponectinemia is linked to the alteration of the same signaling insulin, adiponectin, and GLP-1 pathways related to diet-induced stetaosis [87]. These pathways are mediated by modulating the NF-kappaB p65/PI3K/Akt signaling pathway [88].
Regarding resistin, to our knowledge, very few studies have examined the effects of GLP-1 on resistin secretion. Recently, the cross-sectional study examined the relationship between resistin, steatosis, and obesity. The results showed that resistin levels were elevated while adiponectin levels were decreased. Treatment with thiazolidinediones was associated with a decrease in resistin. [89].
The results of our study showed that high levels of resistin were concomitantly with Homa-IR data and inversely proportional to GLP-1 levels. Regarding the literature, meta-analyses on resistin are controversial. Some authors do not consider it an adipokine, but rather a pro-inflammatory cytokine, given its synergy with interleukin 6 and its role correlated with visceral adipose tissue [90]. Resistin signaling pathways are not clearly understood. It appears that resistin uses the NF-kB (nuclear factor-kB) pathway in the liver, which explains its paroxysmal level in our study [91]. In the MAFLD subjects, an important study has highlighted an association between the genetic variant rs3745367 of the RETN (resistin gene) and the development of NAFLD confirmed by biopsy [92]. Interestingly, treatment with a GLP-1 agonist (liraglutide) increases serum concentrations of adiponectin and decreases those of resistin, compared to conventional treatment with sulfonylureas (glibenclamide) [93].
iii) The third relevant point is related to MALFD – T2DM – GLP-1 plasma levels interactions and plasma pro-inflammatory cytokines profile.
The last point of this investigation relates to the (TNFα, IL-6, IL-1β and IL-17). We observed that the drop in plasma GLP-1 concentrations was associated with moderate or even excessive production of these two cytokines. Some authors show that elevated cytokines, particularly C-reactive protein (CRP), tumor necrosis factor-alpha (TNF-α), interleukin-6 (IL-6) and interleukin-1β (IL-1β) in patients with T2DM. IL-6 plays an important role in liver fibrosis caused by various etiologies. As a key pathway in fibrosis development, the IL-6- related signaling cascade holds promise as a novel serum marker for evaluating the severity of liver fibrosis. Furthermore, antibodies based therapies targeting the IL-6 pathway represent a potential new approach for treating liver fibrosis. In the MAFLD, IL-6 is predominantly expressed in hepatocytes, Kupffer cells and hepatic stellate cells (HSCs). IL-6 is a pro-inflammatory cytokines with pleiotropic biological activities. Numerous studies have demonstrated that, in addition to promoting inflammatory responses, IL-6 induces lymphocyte differentiation and proliferation, facilitates HSCs activation, and contributes to the development of liver fibrosis [94]. Additionally, IL-6 induces HSCs activation and liver fibrosis via the Janus Kinase/Signal Transducer and Activator of Transcription 3 (JAK/STAT3) signaling pathway [95]. Some meta-analyses demonstrate that glucagon-like peptide-1 receptor agonists (GLP-1 RA) exert significant anti-inflammatory effects, notably by decreasing IL-6 in patients with type 2 diabetes [96]. The GLP-1 RAs exert immunomodulatory effects on cytokines and chemokines. GLP-1 RAs (such as liraglutide and semaglutide) reduce levels of IL-1β, IL-6, IL-18, and TNF-α, and increase levels of IL-10. These agents modulate the TGF-β/Smad and AMPK signaling pathways to attenuate fibrosis and oxidative damage [97]. Furthermore, clinical trials have shown that short-term infusion of supraphysiological concentrations of GLP-1 in T2DM leads to decreased IL-6 concentrations [98]. However, this does not exclude the possibility that MAFLD+T2DM subjects, as in our study, may insidiously develop NASH. It has recently been described that MAFLD rapidly progresses to NASH without apparent clinical signs and persists asymptomatically in T2D [99].
It is important to return the interactions between the cytokines IL-1β and IL-17 with MAFLD in diabetes. These interactions are as follows: (i) it has been described that IL-1β promotes MAFLD progression by contributing to inflammation, inhibiting fatty acid oxidation, and increasing fat synthesis in hepatocytes. It plays a key role in the evolution from simple steatosis to more severe non-alcoholic steatohepatitis (NASH) and fibrosis. High levels of IL-1β are found in patients with liver steatosis, and blocking IL-1β signaling in animal models reduces liver steatosis and inflammation [100]. IL-1β activates a complex signaling cascade via IL-1R1, which then triggers transcription factors such as nuclear factor kappa B (NF-κB) and induces the production of inflammatory cytokines [101]. In patients with MAFLD, serum expression of IL-1β is elevated has been shown implied of hepatic steatosis to steatohepatitis and hepatic fibrosis. Peroxisome Proliferator-Activated Receptor gamma (PPARg) antagonists have demonstrated therapeutic efficacy in NASH, while Peroxisome Proliferator-Activated Receptor Delta (PPARd) activation improved fatty acid oxidation and inhibited hepatic liposynthesis and gluconeogenesis.
These results highlight the crucial role of IL-1β in MAFLD damage and its progression to fibrosis, suggesting that targeting the IL-1β signaling pathway could offer therapeutic potential [102]. Interleukin-17A (IL-17) is a cytokine characteristic of Th17 helper T cells, primarily produced by hepatocytes and Kupffer cells (KCs) of the liver. IL-17 exacerbates hepatic steatosis and inflammation, particularly in non-alcoholic fatty liver disease (MAFLD/MASLD), by promoting lipid accumulation and the recruitment of inflammatory cells. It worsens the progression of simple steatosis to more severe conditions such as steatohepatitis and fibrosis, and represents a target for potential therapeutic interventions [103]. IL-17 has been shown to stimulate HSC activation and contribute to liver fibrosis by increasing the expression of pro-inflammatory cytokines as well as profibrotic factors like TGF-β (Transforming Growth Factor-Beta). The synergistic effects of IL-17 and TGF-β further activate HSCs, leading to increased collagen production and exacerbation of liver fibrosis [104]. Several experimental studies have confirmed that IL-17A contributes to liver fibrosis through two main pathways: (1) IL-17A expressed in the hepatic interstitium directly activates hepatic stellate cells to produce large amounts of collagen; (2) IL-17 stimulates endothelial cells and fibroblasts to secrete various cytokines, chemokines, and cell adhesion factors, inhibits extracellular matrix degradation, and promotes fibroblast proliferation. IL-17-mediated immune responses significantly affect the liver microenvironment, exacerbating liver fibrosis and being positively correlated with fibrosis severity [105]. The effects of GLP-1 on IL17 metabolism have not been described in the literature; however, as we argued previously with other proinflammatory cytokines, GLP-1 receptor agonists (GLP-1RAs) represent a multifactorial anti inflammatory cytokines therapeutic target in MAFLD [106] including IL-17 [107]. GLP-1 inhibits IL-17 production by stimulating insulin sensitivity, as IL-17 induces an insulin resistance state [108].
4. Patients and Methods
4.1. Informed Consent Statement and Ethical Considerations
This clinical study protocol (Algiers Incretin-T2DM-MALFD Study) was approved by the Ethics Committee of Algerian Ministry of Public Health (ECAMPH) and conformed to the principles outlined in the declaration of Helsinki (http://www.wma.net). Ethical approval code: The permits and ethical rules have been achieved according to the Executive Decree no. 10–90 (10 March 2010) completing the Executive Decree no. 04–82 (18 March 2004) of the Algerian Government, establishing the terms and approval modalities. An informed consent form was signed by each participant.
4.2. Participants and Clinical Protocol Design
This longitudinal clinical investigation was a randomized, multicenter cross-sectional and observational design study-Case-control was carried between November 2022 and December 2024. All participants were admitted to diabetology unit, Mohamed Seghir Nekkache Hôpital, and diabetology-cardiology unit, Bab El Oued University Hospital Center (UHC), Mohamed Lamine Debaghine (MLD) of Algiers, Algeria. All the study parameters measurements were evaluated in the Biochemistry and Genetics Laboratory, UHC-MLD of Algiers. We included in the study 590 adult participants, aged between 35 and 57 years, including 215 men (M) and 375 women (W). The sample size was estimated using the Coshrans’ formula. This clinical investigation was undertaken on (Figure 9).
- -
- 100 Healthy participants, non-alcohol consumers and non-smokers (Group I)
- -
- 94 MAFLD participants without T2DM (Group III)
- -
- 222 MAFLD participants without T2DM (Group II)
- -
- 174 MAFLD participants with T2DM comorbidity (Group IV)
Diabetic participants were treated with metformin 300 mg/24 h, associated with a sulfonylurea. No participants were insulin-requiring. The drug doses were stable throughout the study. The Group IV was no treated, because no specific medication for MAFLD.
It is mainly based on hygiene and dietary measures. The diabetes age and the presence of MAFLD in Group IV were variable, between 5 and 10 years. In this study, we excluded all subjects with Type 1 diabetes, diabetics insulin-requiring, diabetics treated with sulfonylureas, endocrinopathy, alcohol consumers, hepato-carcinoma, viral hepatitis, hydatid cyst cirrhosis, hemochromatosis, Wilson's disease, jaundice, α-1 antitrypsin deficiency, pregnant women, oral contraceptives, subjects treated with corticosteroids, antidepressants and hormonotherapy.
4.3. Radiological MAFLD Diagnosis
As part of the day hospital program, the MAFLD diagnosis was confirmed by abdominal ultrasound, histological liver biopsies examination, and biochemical profiles of liver function, whether or not associated with hepatomegaly [109]. All study subjects were diagnosed for MAFLD according to the radiological protocol described by Saadeh et al. [110]. Non-invasive liver fibrosis assessment included fibrosis-4 index (Fib-4 index) and MAFLD fibrosis score. Ultrasound scans were performed after a 12-hour fast in a medical imaging center by a single radiologist as operator. A 3.5 MHz transducer (Toosbee, Toshiba, Japan) was attached to a Fibroscan, used to obtain a sagittal view of the right lobe of the liver in relation to the right kidney. This gastroenterological technique allows the detection of vibration-controlled transient elastography scores to predict liver-related events in steatotic liver disease [111]. MAFLD severity was assessed using a 4-grade test scale: i) Grade 0: normal echogenicity; ii) Grade 1: Slight diffuse increase in fine echoes in the liver parenchyma with normal visualization of the diaphragm; iii) Grade 2: Moderate to moderate diffuse increase in echoes with slightly impaired visualization of the intrahepatic vascular system and that of the diaphragm; and iv) Grade 3: Marked increase in fine echoes with poor border of the right posterior lobe or non-visualization of the intrahepatic vascular system and that of the diaphragm. All clinical explorations participants have been examined by the same physician.
4.4. Histopathological MAFLD Diagnosis
In addition to radiological exploration, participants underwent a liver biopsy to distinguish MAFLD from NASH (nonalcoholic steatohepatitis). Histological slides were stained with hematoxylin and eosin and Masson's trichrome. Steatosis was assessed semi quantitatively based on the percentage of hepatocytes containing lipid droplets according to the Kleiner classification. The chronicity of NAFLD was categorized as no steatosis (<5% of hepatocytes affected), initial steatosis (5% to 33%), moderate steatosis (33% to 66%), and severe steatosis (>66%) [112].
4.5. Metabolic Syndrome (MetS) Screening
MetS was confirmed according to the definition of the NCEP/ATPIII (National cholesterol education program third adult treatment panel /Adult Treatment Panel III) criteria [113]. The MetS was identified by the presence of three or more disorders of MetS clusters as follows: (1) visceral obesity; (2) high plasma triglyceride level; (3) low plasma HDL cholesterol level; (4) high fasting plasma glucose; (5) a blood pressure disturbance. Insulin resistance was calculated by the homeostasis model assessment insulin resistance (HOMA-IR) method: HOMA index = fasting glucose (mmol/L) x fasting insulin (mU/L)/22.5 [114]. The percentage of body fat (BF) was calculated using the formula: (1.2 x BMI) + (0.23 x age) - (10.8 x S) - 5.4 (S is the gender correction factor) [115]. The SBP (Systolic blood pressure) and DBP (Diastolic blood pressure) were measured in the prone position of the two arms, three times and two minutes after ten minutes of rest using a validated Omron 705 CP type BP monitor (Omron Healthcare Europe BV, Amsterdam, The Netherlands) [116].
4.4. Plasma Samples and Biochemical Analysis
The participants were admitted to the hospital at 7 am after 12 h of fasting before therapeutic treatment. Blood samples were centrifuged at 3000 rpm for 10 min, and plasma was obtained. Fasting plasma samples were immediately put on ice and kept frozen at - 80°C until analyses were performed. Fasting plasma glucose, triglycerides (TG), total cholesterol (TC), high-density lipoprotein cholesterol (HDL-C), Alanine aminotransferase (ALAT), Aspartate aminotransferase (ASAT), Gamma-glutamyltranspeptidase (GGT), alkaline phosphatase (AP) and total bilirubin (TB) were determined by enzymatic methods using an automatic biochemical analyzer (Cobas Integra 400® analyzer, Roche Diagnostics, Meylan, France). Plasma glycosylated haemoglobin (HbA1C) wase determined by turbidimetry (Roche Diagnostic Systems, Basel, Switzerland). The low-density lipoprotein cholesterol (LDL-C) was calculated using Friedewald’s formula [LDL-C (mg/dL) = TC - HDL-C - TG/5.0]. The criterion for detecting low-grade inflammation has been determined by plasma high-sensitive C-reactive protein (Hs-CRP) level and ferritin assessed using immuno-turbidimetric methods on chemical Synchron analyzer LX®20 PRO. Plasma non-esterified fatty acids (NEFA) were determined by microfluorimetry. The fibrinogen was evaluated by the chronometric Von Clauss methods using hemostasis analyzer ACL TOPTM (Biolabo, Maizy, France). Insulin concentrations were determined by RIA (RadioImmunoAssay) using commercially available kits (Human insulin specific RIA kit, EMD Millipore Corporation St. Louis, MO 63,103, USA). Plasma Adipokines (leptin, adiponectin, resistine) were measured using an enzyme-linked immunosorbent assay on a BiotekELX800 human ELISA reader. ELISA kits were provided by IBL International GmbH (Germany). The assay sensitivity was 0.5 ng/mL for leptin; 0.012 ng/mL for resistin, and 0.185 μg/mL for adiponectin. Plasma pro-inflammatory cytokines: TNF (tumor necrosis factor-alpha), interleukin IL-6 and interleukin IL-1β were measured on EDTA tubes using ELISA, with a sensitivity of 2 and 1 pg/mL, respectively. Standards, reagents, and test samples were prepared and analyzed according to the manufacturer's instructions.
4.5. Plasma Glucagon-Like Peptide-1 (GLP-1) Assessment
Plasma GLP-1 was measured in the fasting and post prandial state when maximal incretin secretion. We opted for a nutritional stimulation that most closely assimilated to the physiological GLP-1secretion, compared to the oral glucose test. Since GLP-1 secretion is biphasic (two peaks of secretion, as with insulin), it was measured after 15 and 60 minutes of meal digestion. Food intake contains 820 kcalories composed of carbohydrates, fats, and proteins. This standard test meal consists of 2 eggs, 250 mL of semi-skimmed milk glass, 2 rusks, 50 g of jam, and 250 mL of orange juice glass. The test is performed after a 12-hour fast and a 24-hour abstinence from medication. Blood samples were collected in EDTA tubes containing a DPP-IV inhibitor for a final concentration of 0.01 mmol/L of buffer (Novo Nordisk A/S, Bagsværd, Denmark). In our study, we opted to measure total GLP-1, containing the most insulinotropic fragments, particularly fragments 7-36, 7-37, and 9-36, and very little fragments 1-36 and 1-37. For calculations, we used an average value of the measurements obtained at 15 and 60 minutes, expressed as GLP-1. GLP-1 was measured using an ELISA method (with a sensitivity of 0.6 pmol/L) according to the supplier's instructions (ALPCO Diagnostics, USA, https://www.alpco.com/store/total-glp-1-elisa-7-36-and-9-36.html).
4.6. Statistical Analysis
Considering our investigation was randomised cohort, all data are measured normally distribution series. All statistical analyses were performed with Epi-info version 5 and Statview version 5 (Abacus Concepts, Berkeley, USA). Student’s t-test and one-way ANOVA were used Results were expressed as mean ± standard error (SEM) with a significance level of p < 0.05. The ANOVA test was used to compare means between the MAFLD, T2DM, and MAFLD+T2D groups versus healthy participants. Pearson's correlation coefficient (r) was applied to quantify the associations between GLP-1 and metabolic syndrome clusters, adipokines (leptin, adiponectin, resistin) and inflammatory markers (TNF-alpha, IL-6, IL-1β, IL-17).
5. Conclusions
This study analyzes a clinical plasma GLP-1 profile in hepatic steatosis (MAFLD) group with or without type 2diabetes mellitus (T2DM). The change in the GLP-1 secretion is correlated with a state of insulin resistance that disrupts liver function through increased lipogenesis and intrahepatocyte lipid infiltration, laying the foundation for MAFLD. Hepatic dysfunction and hyperactivity of visceral adipose tissue alter the adipocytokine profile and impair glycoregulation, which explains the coexistence of T2D with MAFLD. These interactions maintain insulin resistance and minimize the beneficial action of incretins via the effects of GLP-1. Finally, a longitudinal study would be desirable to confirm the role of GLP-1 as an accurate transition biomarker between non-alcoholic fatty liver disease and glucose intolerance in diabetic subjects. This study may serve as a therapeutic target for GLP-1 in steatotic and diabetic subjects exhibiting acute inflammatory shock and oxidative stress.
Author Contributions
H.Z and EA.K: Methodology, Data curation, Investigation, Formal analysis and Validation. W.S: Statistical Analysis and Validation Software. AEM.H and S.A: recruitment of diabetic participants. EA.K, M.M and A.O: Conceptualization, Investigation, Methodology. EA.K: Writing-original draft-review & editing. All authors have read and agreed to the published version of the manuscript.
Funding
The authors would like to acknowledge the financial support of the Algerian Agency for the Research & Development in Health (PNR No. 208/ANDRS and PNR No.41/ANDRS/2011) and the Algerian Ministry of Higher Education Program (No. D00L01UN160420200001).
Institutional Review Board Statement
Not applicable.
Informed Consent Statement
Not applicable.
Data Availability Statement
The data presented in this study are available on request from the Corresponding author.
Acknowledgments
The authors thank all participants of this study for their cooperation and the Algerian Health Ministry.
Conflicts of Interest
The authors declare that they have no conflicts of interest related to this study.
References
- He, KJ.; Wang, H.; Xu, J.; Gong, G.; Liu, X.; Guan, H. Global burden of type 2 diabetes mellitus from 1990 to 2021, with projections of prevalence to 2044: a systematic analysis across SDI levels for the global burden of disease study 2021. Front Endocrinol (Lausanne). 2024, 8, 1501690. [CrossRef]
- Hu, Y.; He, T.; Zhang, Y.; Long, Y.; Gao, C.; Xu, Y. Analysis of the global burden of diabetes and attributable risk factor in children and adolescents across 204 countries and regions from 1990 to 2021. Front Endocrinol (Lausanne). 2025, 8, 1587055. [CrossRef]
- Djeagou, A.; Gunukula, K.; Sermani, A.; Vaspari, SK. Emerging Perspectives in the Diagnosis and Management of Metabolic Dysfunction-Associated Steatotic Liver Disease (MASLD): A Narrative Review. Cureus 2025, 24, e95288. [CrossRef]
- Eslam, M.; Sanyal, AJ.; George, J. International Consensus Panel. MAFLD: A consensus-driven proposed nomenclature for metabolic associated fatty liver disease. Gastroenterology 2020, 158, 1999-2014.e1. [CrossRef]
- Lin, S.; Huang, J.; Wang, M.; Kumar, R.; Liu, Y.; Liu, S.; Wu, Y.; Wang, X.; Zhu, Y. Comparison of MAFLD and NAFLD diagnostic criteria in real world. Liver Int. 2020, 40, 2082-2089. [CrossRef]
- Fang, X.; Yin, Y.; Wu, Q.; Chai, L.; Guo, Y.; Tong, Z.; Méndez-Sánchez, N.; Qi, X. Efficacy and safety of statins for nonalcoholic/metabolic dysfunction-associated fatty liver diseases: a systematic review and meta-analysis. Expert Rev Clin Pharmacol. 2025, 4. [CrossRef]
- Mantovani, A.; Scorletti, E.; Mosca, A.; Alisi, A.; Byrne, CD.; Targher, G. Complications, morbidity and mortality of nonalcoholic fatty liver disease. Metabolism 2020, 111S, 154170. [CrossRef]
- Miller, DM.; McCauley, KF.; Dunham-Snary, KJ. Metabolic Dysfunction-Associated Steatotic Liver Disease (MASLD): Mechanisms, Clinical Implications and Therapeutic Advances. Endocrinol Diabetes Metab. 2025, 8, e70132. [CrossRef]
- Ludwig, J.; Viggiano, TR.; McGill, DB.; Oh, BJ. Nonalcoholic steatohepatitis: Mayo clinic experiences with a hitherto unnamed disease. Mayo Clin Proc. 1980,55, 434–8.
- Jaawan, S.; Krämer, A.; Masri, R.; Neesse, A.; Ellenrieder, V.; Amanzada, A.; Ströbel, P.; Bremmer, F.; Petzold, G. Diagnostic Utility of Liver Biopsy in Persistent Unexplained Liver Enzyme Elevation: A Retrospective Cohort Study. JGH Open 2025, 9, e70310. [CrossRef]
- Zhang, FM.; Zhao, HD.; Qi, ZM.; Chen, R.; Liao, ZX.; Xie, LF.; Zheng, C. The association between the hs-CRP/HDL-C ratio and nonalcoholic fatty liver disease: The mediating role of insulin resistance in a cross-sectional study using NHANES 2017-2020. Medicine (Baltimore) 2025, 104, e46085. [CrossRef]
- Fujii, H.; Kawada, N. Japan Study Group of NAFLD. The role of insulin resistance and diabetes in nonalcoholic fatty liver disease. Int J Mol Sci. 2020, 21, 3863. [CrossRef]
- Jonas, W.; Schürmann, A. Genetic and epigenetic factors determining NAFLD risk. Mol Metab. 2021,50, 101111. [CrossRef]
- Chen, Z.; Tian, R.; She, Z.; Cai, J.; Li, H. Role of oxidative stress in the pathogenesis of nonalcoholic fatty liver disease. Free Radic Biol Med. 2020, 152, 116–41. [CrossRef]
- Chen, J.; Vitetta, L. Gut microbiota metabolites in NAFLD pathogenesis and therapeutic implications. Int J Mol Sci. 2020, 21, 5214. [CrossRef]
- Eslam, M.; Newsome, PN.; Sarin, SK.; Anstee, QM.; Targher, G.; Romero-Gomez, M.; Zelber-Sagi, S.; Wai-Sun Wong, V.; Dufour, JF.; Schattenberg, JM.; et al. A new definition for metabolic dysfunction-associated fatty liver disease: An international expert consensus statement. J Hepatol, 2020, 73, 202–09. [CrossRef]
- Badmus, OO.; Hillhouse, SA.; Anderson, CD.; Hinds, TD.; Stec, DE. Molecular mechanisms of metabolic associated fatty liver disease (MAFLD): functional analysis of lipid metabolism pathways. Clin Sci (Lond). 2022, 136, 1347-1366. [CrossRef]
- Guo, Z.; Wu, D.; Mao, R.; Yao, Z.; Wu, Q.; Lv, W. Global burden of MAFLD, MAFLD related cirrhosis and MASH related liver cancer from 1990 to 2021. SciRep. 2025, 15, 7083. [CrossRef]
- Gofton, C.; Upendran, Y.; Zheng, MH.; George, J. MAFLD: How is it different from NAFLD? Clin Mol Hepatol. 2023, 29, S17-S31. [CrossRef]
- Chia, CW.; Egan, JM. Incretins in obesity and diabetes. Ann N Y Acad Sci. 2020, 1461, 104-126.
- Elangovan, H.; Gunton, JE.; Zheng, MH.; Fan, JG.; Goh, GBB.; Gronbaek, H.; George, J. The promise of incretin-based pharmacotherapies for metabolic dysfunction-associated fatty liver disease. Hepatol Int. 2025, 19, 337-348. [CrossRef]
- Barrett, KE. Endogenous and exogenous control of gastrointestinal epithelial function: building on the legacy of Bayliss and Starling. J Physiol. 2017, 595, 423-432. [CrossRef]
- Nauck, MA.; Meier, JJ. The incretin effect in healthy individuals and those with type 2 diabetes: physiology, pathophysiology, and response to therapeutic interventions. Lancet Diabetes Endocrinol. 2016, 4, 525-36. [CrossRef]
- Saha, B.; Kamalumpundi, V.; Codipilly, DC. GLP1 and GIP Receptor Agonists: Effects on the Gastrointestinal Tract and Management Strategies for Primary Care Physicians. Mayo Clin Proc. 2025, S0025-6196(25)00551-8. [CrossRef]
- Purcell, AR.; Zhen, XM.; Wong, J.; Glastras, SJ. Glucagon-like peptide-1 receptor agonist treatment reduces body weight and improves glycaemic outcomes in patients with concurrent overweight/obesity and type 1 diabetes: A systematic review and meta- analysis. Diabetes Obes Metab. 2026, 28, 296-305. [CrossRef]
- Drucker, DJ. Efficacy and Safety of GLP-1 Medicines for Type 2 Diabetes and Obesity. Diabetes Care 2024, 47, 1873-1888. [CrossRef]
- Alshehri, FS. New developments in GLP-1 agonist therapy for gestational diabetes: Systematic review on liraglutide, semaglutide, and exenatide from Clinical Trials.gov. Medicine (Baltimore) 2025, 104, e44917. [CrossRef]
- Zacharia, GS.; Gongati, SR.; Kharel, A.; Jacob, A. Semaglutide in Metabolic Dysfunction-Associated Steatohepatitis: A Narrative Review. Cureus 2025, 17, e95632. [CrossRef]
- Kong, W.; Fang, B.; Xing, W. Efficacy and safety of liraglutide in non-alcoholic fatty liver disease with or without type 2 diabetes: A systematic review and meta-analysis. Diabetes Obes Metab. 2025. [CrossRef]
- Müller, TD.; Finan, B.; Bloom, SR.; D'Alessio, D.; Drucker, DJ.; Flatt, PR.; Fritsche, A.; Gribble, F.; Grill, HJ.; Habener, JF.; et al. Glucagon-like peptide 1 (GLP-1). Mol Metab. 2019, 30, 72-130.
- Liu, QK. Mechanisms of action and therapeutic applications of GLP-1 and dual GIP/GLP-1 receptor agonists. Front Endocrinol (Lausanne) 2024, 15, 1431292. [CrossRef]
- Clark L. GLP-1 receptor agonists: A review of glycemic benefits and beyond. JAAPA 2024, 37, 1-4.
- van Ruiten, CC.; Ten Kulve, JS.; van Bloemendaal, L.; Nieuwdorp, M.; Veltman, DJ.; IJzerman, RG. Eating behavior modulates the sensitivity to the central effects of GLP-1 receptor agonist treatment: a secondary analysis of a randomized trial. Psychoneuroendocrinology 2022, 137, 105667. [CrossRef]
- Huber, H.; Schieren, A.; Holst, JJ.; Simon, MC. Dietary impact on fasting and stimulated GLP-1 secretion in different metabolic conditions - a narrative review. Am J Clin Nutr. 2024, 119, 599-627. [CrossRef]
- Smith, NK.; Hackett, TA.; Galli, A.; Flynn, CR. GLP-1: Molecular mechanisms and outcomes of a complex signaling system. Neurochem Int. 2019, 128, 94-105. [CrossRef]
- Ji, Y.; Wang, Q.; Jiang, Y.; Liu, B. Global epidemiology of T2DM in patients with NAFLD or MAFLD: the real situation may be even more serious. BMC Med. 2024, 22, 476. [CrossRef]
- Ghosal, S.; Ghosal, A. Optimizing GLP-1RA Efficacy: A Meta-Analysis of Baseline Age and HbA1c as Predictors of MACE Reduction in T2DM. Diabetes Metab Syndr Obes. 2025, 18, 4347-4358. [CrossRef]
- Moon, JS.; Hong, JH.; Jung, YJ.; Ferrannini, E.; Nauck, MA.; Lim, S. SGLT-2 inhibitors and GLP-1 receptor agonists in metabolic dysfunction-associated fatty liver disease. Trends Endocrinol Metab. 2022, 33, 424-442. [CrossRef]
- Zhao, X.; An, X.; Yang, C.; Sun, W.; Ji, H.; Lian, F. The crucial role and mechanism of insulin resistance in metabolic disease. Front Endocrinol (Lausanne). 2023,14, 1149239. [CrossRef]
- Pezzoli, A.; Abenavoli, L.; Scarcella, M.; Rasetti, C.; Svegliati Baroni, G.; Tack, J.; Scarpellini, E. The Management of Cardiometabolic Risk in MAFLD: Therapeutic Strategies to Modulate Deranged Metabolism and Cholesterol Levels. Medicine (Kaunas) 2025, 61, 387. [CrossRef]
- Rusu, E.; Jinga, M.; Cursaru, R.; Enache, G.; Costache, A.; Verde, I.; Nica, A.; Alionescu, A.; Rusu, F.; Radulian, G. Adipose Tissue Dysfunction and Hepatic Steatosis in New-Onset Diabetes. Diabetology 2025, 6, 70. [CrossRef]
- Liao, C.; Liang, X.; Zhang, X.; Li, Y. The effects of GLP-1 receptor agonists on visceral fat and liver ectopic fat in an adult population with or without diabetes and nonalcoholic fatty liver disease: A systematic review and meta-analysis. PLoS One 2023, 18, e0289616. [CrossRef]
- Rochoń, J.; Kalinowski, P.; Szymanek-Majchrzak, K.; Grąt, M. Role of gut-liver axis and glucagon-like peptide-1 receptor agonists in the treatment of metabolic dysfunction- associated fatty liver disease. World J Gastroenterol. 2024, 30, 2964-2980. [CrossRef]
- Guney-Coskun, M.; Basaranoglu, M. Interplay of gut microbiota, glucagon-like peptide receptor agonists, and nutrition: New frontiers in metabolic dysfunction-associated steatotic liver disease therapy. World J Gastroenterol. 2024, 30, 4682-4688. [CrossRef]
- McLean, BA.; Wong, CK.; Campbell, JE.; Hodson, DJ.; Trapp, S.; Drucker, DJ. Revisiting the Complexity of GLP-1 Action from Sites of Synthesis to Receptor Activation. Endocr Rev. 2021, 42, 101-132. [CrossRef]
- Ranganath, LR. The entero-insular axis: implications for human metabolism. Clin Chem Lab Med. 2008, 46, 43-56. [CrossRef]
- Visschers, RG.; Luyer, MD.; Schaap, FG.; Olde Damink, SW.; Soeters, PB. The gut- liver axis. Curr Opin Clin Nutr Metab Care. 2013, 16, 576-81.
- Musso, G.; Gambino, R.; Pacini, G.; De Michieli, F.; Cassader, M. Prolonged saturated fat-induced, glucose-dependent insulinotropic polypeptide elevation is associated with adipokine imbalance and liver injury in non alcoholic steatohepatitis: dysregulated entero- adipocyte axis as a novel feature of fatty liver. Am J Clin Nutr. 2009, 89, 558-67.
- Khan, MT.; Zohair, M.; Khan, A.; Kashif, A.; Mumtaz, S.; Muskan, F. From Gut to Brain: The roles of intestinal microbiota, immune system, and hormones in intestinal physiology and gut-brain-axis. Mol Cell Endocrinol. 2025, 607, 112599. [CrossRef]
- Ronveaux, CC.; Tomé, D.; Raybould, HE. Glucagon-like peptide 1 interacts with ghrelin and leptin to regulate glucose metabolism and food intake through vagal afferent neuron signaling. J Nutr. 2015, 145, 672-80. [CrossRef]
- Francisco, V.; Sanz, MJ.; Real, JT.; Marques, P.; Capuozzo, M.; Ait Eldjoudi, D.; Gualillo, O. Adipokines in Non-Alcoholic Fatty Liver Disease: Are We on the Road toward New Biomarkers and Therapeutic Targets? Biology (Basel) 2022, 11, 1237. [CrossRef]
- Yaribeygi, H.; Maleki, M.; Atkin, SL.; Jamialahmadi, T.; Sahebkar, A. Impact of Incretin-Based Therapies on Adipokines and Adiponectin. J Diabetes Res. 2021, 2021, 3331865. [CrossRef]
- Park, JS.; Kim, KS.; Choi, HJ. Glucagon-Like Peptide-1 and Hypothalamic Regulation of Satiation: Cognitive and Neural Insights from Human and Animal Studies. Diabetes Metab J. 2025, 49, 333-347. [CrossRef]
- Polex-Wolf, J.; Deibler, K.; Hogendorf, WFJ.; Bau, S.; Glendorf, T.; Stidsen, CE.;
- Tornøe, CW.; Tiantang, D.; Lundh, S.; Pyke C.; et al. Glp1r-Lepr coexpressing neurons modulate the suppression of food intake and body weight by a GLP-1/leptin dual agonist. Sci Transl Med. 2024, 16, eadk4908. [CrossRef]
- Simental-Mendía, LE.; Sánchez-García, A.; Linden-Torres, E.; Simental-Mendía, M. Impact of glucagon-like peptide-1 receptor agonists on adiponectin concentrations: A meta-analysis of randomized controlled trials. Br J Clin Pharmacol. 2021, 87, 4140- 4149. [CrossRef]
- Li, D.; Xu, X.; Zhang, Y.; Zhu, J.; Ye, L.; Lee, KO.; Ma, J. Liraglutide treatment causes upregulation of adiponectin and downregulation of resistin in Chinese type 2 diabetes. Diabetes Res Clin Pract. 2015, 110, 224-8. [CrossRef]
- Li, SL.; Wang, ZM.; Xu, C.; Che, FH.; Hu, XF.; Cao, R.; Xie, YN.; Qiu, Y.; Shi, HB.; Liu, B.; et al. Liraglutide Attenuates Hepatic Ischemia-Reperfusion Injury by Modulating Macrophage Polarization. Front Immunol. 2022, 13, 869050. [CrossRef]
- Vachliotis, ID.; Polyzos, SA. The Intriguing Roles of Cytokines in Metabolic Dysfunction-Associated Steatotic Liver Disease: A Narrative Review. Curr Obes Rep. 2025, 14, 65. [CrossRef]
- Coste, SC.; Orășan, OH.; Cozma, A.; Negrean, V.; Sitar-Tăut, AV.; Filip, GA.; Hangan, AC.; Lucaciu, RL.; Iancu, M.; Procopciuc, LM. Metabolic Dysfunction-Associated Steatotic Liver Disease: The Associations between Inflammatory Markers, TLR4, and Cytokines IL-17A/F, and Their Connections to the Degree of Steatosis and the Risk of Fibrosis. Biomedicines 2024, 12, 2144. [CrossRef]
- Dabbaghizadeh, A.; Dion, J.; Maali, Y.; Fouda, A.; Bédard, N.; Evaristo, G.; Hassan, GS.; Tchervenkov, J.; Shoukry, NH. Novel RORgammat inverse agonists limit IL-17- mediated liver inflammation and fibrosis. J Immunol. 2025, 214, 1321-1331. [CrossRef]
- Negrin, KA.; Roth Flach, RJ.; DiStefano, MT.; Matevossian, A.; Friedline, RH.; Jung, D.; Kim, JK., Czech, MP. IL-1 signaling in obesity-induced hepatic lipogenesis and steatosis. PLoS One 2014, 9, e107265. [CrossRef]
- Praktiknjo, M.; Schierwagen, R.; Monteiro, S.; Ortiz, C.; Uschner, FE.; Jansen, C.; Claria, J.; Trebicka, J. Hepatic inflammasome activation as origin of Interleukin-1α and Interleukin-1β in liver cirrhosis. Gut 2021, 70, 1799-1800. [CrossRef]
- Chen, S.; Wei, W.; Chen, M.; Qin, X.; Qiu, L.; Zhang, L.; Zhang, Y.; Cao, Q.; Ying, Z. TNF Signaling Impacts Glucagon-Like Peptide-1 Expression and Secretion. J Mol Endocrinol. 2018, 61, 153-161. [CrossRef]
- Lehrskov-Schmidt, L.; Lehrskov-Schmidt, L.; Nielsen, ST.; Holst, JJ.; Møller, K.; Solomon, TP. The effects of TNF-α on GLP-1-stimulated plasma glucose kinetics. J Clin Endocrinol Metab. 2015, 100, E616-22. [CrossRef]
- Gutierrez-Buey, G.; Nú˜nez-Córdoba, JM.; Llavero-Valero, M.; Gargallo, J.; Salvador, J.; Escalada, J. Is HOMA-IR a potential screening test for nonalcoholic fatty liver disease in adults with type 2 diabetes ? Eur J Intern Med. 2017, 41, 74-8.
- Fattahi, MR.; Niknam, R.; Safarpour, A.; Sepehrimanesh, M.; Lotfi, M. The Prevalence of Metabolic Syndrome In Non-alcoholic Fatty Liver Disease; A Population-Based Study. Middle East J Dig Dis. 2016, 8, 131-7. [CrossRef]
- Hirano, T. J. Excess Triglycerides in Very Low-Density Lipoprotein (VLDL) Estimated from VLDL-Cholesterol could be a Useful Biomarker of Metabolic Dysfunction Associated Steatotic Liver Disease in Patients with Type 2 Diabetes. Atheroscler Thromb. 2025, 32, 253-264. [CrossRef]
- Truong, XT.; Lee, DH. Hepatic Insulin Resistance and Steatosis in Metabolic Dysfunction-Associated Steatotic Liver Disease: New Insights into Mechanisms and Clinical Implications. Diabetes Metab J. 2025, 49, 964-986. [CrossRef]
- Samuel, VT.; Petersen, MC.; Gassaway, BM.; Vatner, DF.; Rinehart, J.; Shulman, GI. Considering the Links Between Nonalcoholic Fatty Liver Disease and Insulin Resistance: Revisiting the Role of Protein Kinase C epsilon. Hepatology 2019, 70, 2217-2220. [CrossRef]
- Lajeunesse-Trempe, F.; Dugas, S.; Maltais-Payette, I.; Tremblay, ÈJ. ; Piché, ME. ; Dimitriadis, GK. ; Lafortune, A.; Marceau, S.; Biertho, L.; Tchernof, A. Anthropometric Indices and Metabolic Dysfunction-Associated Fatty Liver Disease in Males and Females Living With Severe Obesity. Can J Gastroenterol Hepatol. 2025, 2025, 5545227. [CrossRef]
- Henderson, GC. Plasma Free Fatty Acid Concentration as a Modifiable Risk Factor for Metabolic Disease. Nutrients 2021, 13, 2590. [CrossRef]
- Oikawa, R.; Nakanishi, Y.; Fujimoto, K.; Wakasa, A.; Iwadare, M.; Iwao, HK.; Ishida, R.; Iwai, K. Elevated glucagon and postprandial hyperglycemia in fatty liver indicate early glucose intolerance in metabolic dysfunction associated steatotic liver disease. Sci Rep. 2024, 14, 29916. [CrossRef]
- Dong, W.; Zhang, H.; Mu, S.; Shi, S.; Zhang, J.; Xu, K. Advances in Incretin-Based Therapies for MAFLD: Mechanisms and Clinical Evidence. Clin Pharmacol Ther. 2025. [CrossRef]
- Jepsen, SL.; Albrechtsen, NJW.; Windeløv, JA.; Galsgaard, KD.; Hunt, JE.; Farb, TB.; Kissow, H.; Pedersen, J.; Deacon, CF.; Martin, RE.; et al. Antagonizing somatostatin receptor subtype 2 and 5 reduces blood glucose in a gut- and GLP-1R- dependent manner. JCI Insight. 2021, 6, e143228. [CrossRef]
- Liu, Z.; Chen, Y.; Su, Y.; Peng, Y.; Xu, F.; Yao, B.; Liang, H.; Lin, B.; Xu, W. GLP-1 receptor agonist protects glucose-stimulated insulin secretion in pancreatic beta-cells against lipotoxicity via PPARdelta/UCP2 pathway. Cell Mol Life Sci. 2025, 82, 375. 76. Liu, L.; Xia, Y.; Wang, B.; Zhang, Y. J. Efficacy of Incretin-Based Therapies in Patients With Metabolic Dysfunction-Associated Steatotic Liver Disease: An Updated Systematic Review and Meta-Analysis of Randomized Controlled Trials. Gastroenterol Hepatol. 2025, 40, 2659-2673. [CrossRef]
- Ghobar, F.; Tarhini, A.; Osman, Z.; Sbeih, S.; Ghayda, RA.; Matar, P.; Haddad, G.; Kanaan, A.; Eid, A.; Azar, S.; Ghadieh, HE.; Harb, F. GLP1 receptor agonists and SGLT2 inhibitors for the prevention or delay of type 2 diabetes mellitus onset: a systematic review and meta-analysis. Front Endocrinol (Lausanne). 2025, 16, 1627909. [CrossRef]
- Conley, JM.; Jochim, A.; Evans-Molina, C.; Watts, VJ.; Ren, H. G Protein-Coupled Receptor 17 Inhibits Glucagon-like Peptide-1 Secretion via a Gi/o-Dependent Mechanism in Enteroendocrine Cells. Biomolecules 2024, 15, 9. [CrossRef]
- Wang, JL.; Xiao, Y.; Li, ML.; Chen, GL.; Cui, MH.; Liu, JL. Research Progress on Leptin in Metabolic Dysfunction-associated Fatty Liver Disease. J Clin Transl Hepatol. 2025, 13, 964-975. [CrossRef]
- Al-Ghurayr, NK.; Al-Mowalad, AM.; Omar, UM.; Ashi, HM.; Al-Shehri, SS.; AlShaikh, AA.; AlHarbi, SM.; Alsufiani, HM. Salivary Hormones Leptin, Ghrelin, Glucagon, and Glucagon-Like Peptide 1 and Their Relation to Sweet Taste Perception in Diabetic Patients. J Diabetes Res. 2023, 2023, 7559078. [CrossRef]
- He, Z.; Gao, Y.; Lieu, L.; Afrin, S.; Cao, J.; Michael, NJ.; Dong, Y.; Sun, J.; Guo, H.; Williams, KW. Direct and indirect effects of liraglutide on hypothalamic POMC and NPY/AgRP neurons - Implications for energy balance and glucose control. Mol Metab. 2019, 28,120-134. [CrossRef]
- Porniece Kumar, M.; Cremer, AL.; Klemm, P.; Steuernagel, L.; Sundaram, S.; Jais, A.; Hausen, AC.; Tao, J.; Secher, A.; Pedersen, TÅ., et al. Insulin signalling in tanycytes gates hypothalamic insulin uptake and regulation of AgRP neuron activity. Nat Metab. 2021, 3, 1662-1679. [CrossRef]
- Salazar, J.; Chávez-Castillo, M.; Rojas, J.; Ortega, A.; Nava, M.; Pérez, J.; Rojas, M.; Espinoza, C.; Chacin, M.; Herazo, Y.; et al. Is "Leptin Resistance" Another Key Resistance to Manage Type 2 Diabetes?. Curr Diabetes Rev. 2020,16, 733-749.
- Contreras, PH.; Falhammar, H. CRF1 and ACTH inhibitors are a promising approach to treat obesity and leptin and insulin resistance. Front Endocrinol (Lausanne). 2025, 16, 1647028. [CrossRef]
- Tawfik, MK.; Badran, DI.; Keshawy, MM.; Makary, S.; Abdo, M. Alternate-day fat diet and exenatide modulate the brain leptin JAK2/STAT3/SOCS3 pathway in a fat diet-induced obesity and insulin resistance mouse model. Arch Med Sci. 2023, 19, 1508-1519. [CrossRef]
- Al Refaie, A.; Baldassini, L.; Mondillo, C.; Ceccarelli, E.; Tarquini, R.; Gennari, L.; Gonnelli, S.; Caffarelli, C. Adiponectin may play a crucial role in the metabolic effects of GLP-1RAs treatment in patients with Type 2 Diabetes Mellitus: a preliminary longitudinal study. Endocrine 2025, 87, 951-958. [CrossRef]
- Prakash, S.; Rai, U.; Kosuru, R.; Tiwari, V.; Singh, S. Amelioration of diet-induced metabolic syndrome and fatty liver with sitagliptin via regulation of adipose tissue inflammation and hepatic Adiponectin/AMPK levels in mice. Biochimie 2020, 168, 198-209. [CrossRef]
- Qin, M.; Xu, S.; Chen, Y.; Luo, X.; Tang, X.; Zhang, L.; Xu, Q. Adiponectin attenuates atherosclerosis via macrophage polarization-mediated T Cell exhaustion by modulating the NF-kappaB p65/PI3K/Akt signaling pathway. Tissue Cell. 2025, 98,103150. [CrossRef]
- Al-Dallal, R.; Thomas, K.; Lee, M.; Chaudhri, A.; Davis, E.; Vaidya, P.; Lee, M.; McCormick, JB.; Fisher-Hoch, SP.; Gutierrez, AD. The Association of Resistin with Metabolic Health and Obesity in a Mexican-American Population. Int J Mol Sci. 2025, 26, 4443. [CrossRef]
- Risum, K.; Olarescu, NC.; Godang, K.; Marstein, HS.; Bollerslev, J.; Sanner, H. Visceral adipose tissue is associated with interleukin 6 and resistin in juvenile idiopathic arthritis - a case-control study. Rheumatol Int. 2025, 45, 63. [CrossRef]
- Qi, MM.; Guan, XQ.; Zhu, LR.; Wang, LJ.; Liu, L.; Yang, YP. The effect of resistin on nuclear factor-kB and tumor necrosis factor-alpha expression in hepatic steatosis. Zhonghua Gan Zang Bing Za Zhi 2012, 20, 40-4. [CrossRef]
- Tabaeian, SP.; Mahmoudi, T.; Rezamand, G.; Nobakht, H.; Dabiri, R.; Farahani, H.; Asadi, A.; Zali, MR. Resistin gene polymorphism and nonalcoholic fatty liver disease risk. Arq Gastroenterol. 2022, 59, 483-487. [CrossRef]
- Li, D.; Xu, X.; Zhang, Y.; Zhu, J.; Ye, L.; Lee, KO.; Ma. J. Liraglutide treatment causes upregulation of adiponectin and downregulation of resistin in Chinese type 2 diabetes. Diabetes Res Clin Pract. 2015, 110, 224-8. [CrossRef]
- Li, Y.; Zhao, J.; Yin, Y.; Li, K.; Zhang, C.; Zheng, Y. The Role of IL-6 in Fibrotic Diseases: Molecular and Cellular Mechanisms. Int J Biol Sci. 2022, 18, 5405-5414. [CrossRef]
- Kagan, P.; Sultan, M.; Tachlytski, I.; Safran, M.; Ben-Ari, Z. Both MAPK and STAT3 signal transduction pathways are necessary for IL-6-dependent hepatic stellate cells activation. PloS One 2017, 12, e0176173. [CrossRef]
- Ren, Y.; Chen, Y.; Zheng, W.; Kong, W.; Liao, Y.;, Zhang, J.; Wang, M.; Zeng, T. The effect of GLP-1 receptor agonists on circulating inflammatory markers in type 2 diabetes patients: A systematic review and meta-analysis. Diabetes Obes Metab. 2025, 27, 3607-3626. [CrossRef]
- Ullah, A.; Shen, B. Immunomodulatory effects of anti-diabetic therapies: Cytokine and chemokine modulation by metformin, sodium-glucose cotransporter 2 inhibitors, and glucagon-like peptide-1 receptor agonists (2013-2025). Eur J Med Chem. 2025, 299, 118065. [CrossRef]
- Daousi, C.; Pinkney, JH.; Cleator, J.; Wilding, JP.; Ranganath, LR. Acute peripheral administration of synthetic human GLP-1 (7–36 amide) decreases circulating IL-6 in obese patients with type 2 diabetes mellitus: A potential role for GLP-1 in modulation of the diabetic pro-inflammatory state? Regulatory Peptides 2013, 183, 54–61. [CrossRef]
- Younossi, ZM.; Golabi, P.; Price, JK.; Owrangi, S.; Gundu-Rao, N.; Satchi, R.; Paik, JM. The Global Epidemiology of Nonalcoholic Fatty Liver Disease and Nonalcoholic Steatohepatitis Among Patients With Type 2 Diabetes. Clin Gastroenterol Hepatol. 2024, 22, 1999-2010.e8. [CrossRef]
- Zhang, Z.; Wang, J.; Li, H.; Niu, Q.; Tao, Y.; Zhao, X.; Zeng, Z.; Dong, H. The role of the interleukin family in liver fibrosis. Front Immunol. 2025, 16, 1497095. [CrossRef]
- Wang, L.; Gu, Y.; Zhao, H.; Chen, R.; Chen, W.; Qi, H.; Gao, W. Dioscin Attenuates Interleukin 1β (IL-1β)-Induced Catabolism and Apoptosis via Modulating the Toll- Like Receptor 4 (TLR4)/Nuclear Factor kappa B (NF-κB) Signaling in Human Nucleus Pulposus Cells. Med Sci Monit. 2020, 26, e923386. [CrossRef]
- Ćurčić, IB.; Kizivat, T.; Petrović, A.; Smolić, R.; Tabll, A.; Wu, GY.; Smolić, M. Therapeutic Perspectives of IL1 Family Members in Liver Diseases: An Update. J Clin Transl Hepatol. 2022, 10, 1186-1193. [CrossRef]
- Olivier, A.; Augustin, S.; Benlloch, S.; Ampuero, J.; Suárez-Pérez, JA.; Armesto, S.; Vilarrasa, E.; Belinchón-Romero, I.; Herranz, P.; Crespo, J.; et al. The Essential Role of IL-17 as the Pathogenetic Link between Psoriasis and Metabolic-Associated Fatty Liver Disease. Life (Basel) 2023, 13, 419. [CrossRef]
- Zhang, S. The role of transforming growth factor β in T helper 17 differentiation. Immunology 2018, 155, 24-35. [CrossRef]
- Meng, F.; Wang, K.; Aoyama, T.; Grivennikov, SI.; Paik, Y.; Scholten, D.; Cong, M.; Iwaisako, K.; Liu, X.; Zhang, M.; et al. Interleukin-17 signaling in inflammatory, Kupffer cells, and hepatic stellate cells exacerbates liver fibrosis in mice. Gastroenterology 2012, 143,765–776.e3. [CrossRef]
- Mehdi, SF.; Pusapati, S.; Anwar, MS.; Lohana, D.; Kumar, P.; Nandula, SA.; Nawaz, FK.; Tracey, K.; Yang, H.; LeRoith, D.; et al. Glucagon-like peptide-1: a multi-faceted anti-inflammatory agent. Front Immunol. 2023, 14, 1148209. [CrossRef]
- Abdel-Moneim, A.; Bakery, HH.; Allam, G. The potential pathogenic role of IL- 17/Th17 cells in both type 1 and type 2 diabetes mellitus. Biomed Pharmacother. 2018,101, 287–92. [CrossRef]
- Bozzetto, L.; Annuzzi, G.; Ragucci, M.; Di Donato, O.; Della Pepa, G.; Della Corte, G.; Griffo, E.; Anniballi, G.; Giacco, A.; Mancini, M.; et al. Insulin resistance, postprandial GLP-1 and adaptive immunity are the main predictors of NAFLD in a homogeneous population at high cardiovascular risk. Nutr Metab Cardiovasc Dis. 2016, 26, 623-629. [CrossRef]
- Fouad, Y.; Alboraie, M.; Shiha, G. Epidemiology and diagnosis of metabolic dysfunction-associated fatty liver disease. Hepatol Int. 2024, 18(Suppl 2), 827-833. [CrossRef]
- Chan, WK.; Wong, VW.; Adams, LA.; Nguyen, MH. MAFLD in adults: non- invasive tests for diagnosis and monitoring of MAFLD. Hepatol Int. 2024, 18(Suppl 2), 909-921. [CrossRef]
- Lin, H.; Lee, HW.; Yip, TC.; Tsochatzis, E.; Petta, S.; Bugianesi, E.; Yoneda, M.; Zheng, MH.; Hagström, H.; Boursier, J.; et al. Vibration-Controlled Transient Elastography Scores to Predict Liver-Related Events in Steatotic Liver Disease. JAMA 2024, 331,1287-1297. [CrossRef]
- Chowdhury, AB.; Mehta, KJ. Liver biopsy for assessment of chronic liver diseases: a synopsis. Clin Exp Med. 2023, 23, 273-285. [CrossRef]
- Expert panel on detection evaluation treatment of high blood cholesterol in adults. Executive summary of the third report of the National cholesterol education program (NCEP) expert panel on detection, evaluation, and treatment of high blood cholesterol in adults (adult treatment panel III). JAMA 2001, 285, 2486-97.
- Bonora, E.; Targher, G.; Alberiche, M.; Bonadonna, R.C.; Saggiani, F.; Zenere, M.B.; Monauni, T.; Muggeo, M. Homeostasis model assessment closely mirrors the glucose clamp technique in the assessment of insulin sensitivity: Studies in subjects with various degrees of glucose tolerance and insulin sensitivity. Diabetes Care 2000, 23, 57–63. [CrossRef]
- Deurenberg, P.; Westrate, J.A.; Seidell, J.C. Body mass index as a measure of body fatness: Age- and sex-specific prediction formulas. Br. J. Nutr. 1991, 65, 105–111. [CrossRef]
- O’Brien, E.; Mee, F.; Atkins, N.; Thomas, M. Evaluation of three devices for self measurement of blood pressure according to the revised British Hypertension Society Protocol: The Omron HEM-705CP, Philips HP5332, and Nissei DS-175. Blood Press. Monit. 1996, 1, 55-61.
Figure 3.
Pearson correlation between GLP-1and BMI (A), WC (B), %BF (C), and WC/WH ratio (D) in different trial groups. Group I: Healthy control participants; Group II: MAFLD participants; Group III: T2DM participants; Group IV: MAFLD+ T2DM participants. MAFLD: Metabolic Associated Fatty Liver Disease. T2DM: Type 2 Diabetes Mellitus. GLP1: Glucagon-Like Peptide-1; BMI: body mass index; WC: waist circumference; WH: waist hips; %BF: body fat percentage. ***p < 0.001.
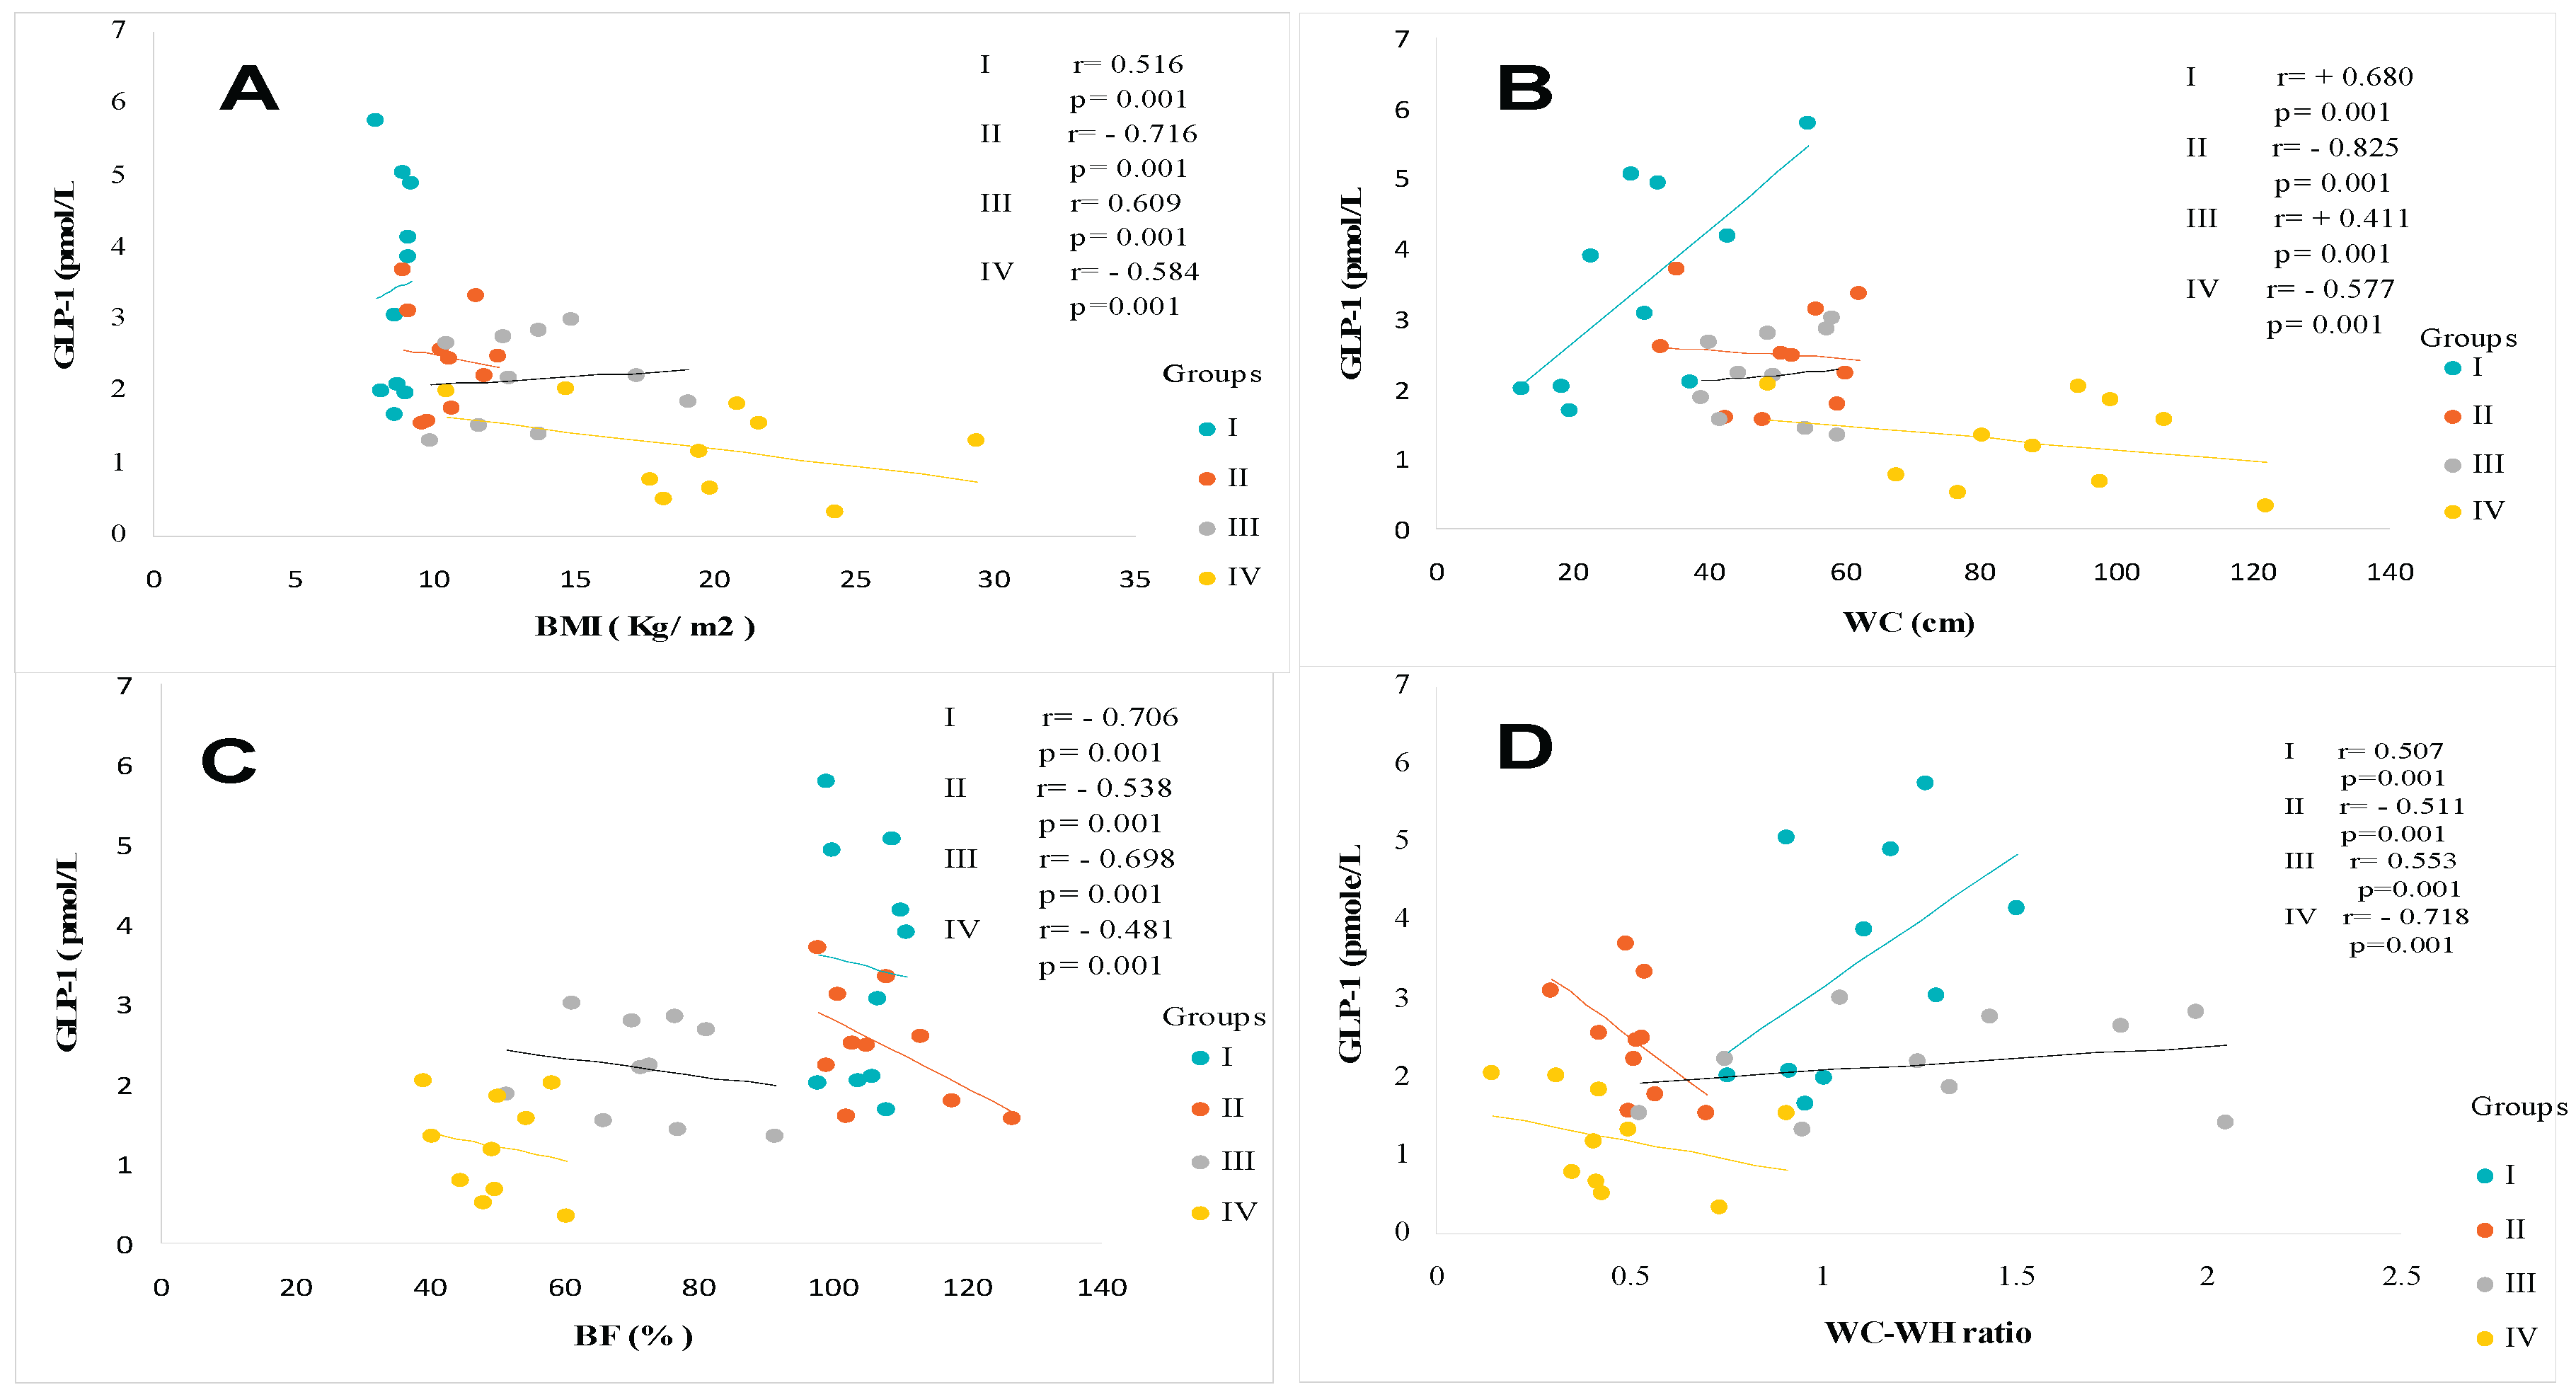
Figure 4.
Pearson correlation between GLP-1and Glycemia (A), HbA1C (B), Insulinemia (C), and Homa-IR Index (D) in different trial groups. Group I: Healthy control participants; Group II: MAFLD participants; Group III: T2DM participants; Group IV: MAFLD+ T2DM participants. MAFLD: Metabolic Associated Fatty Liver Disease. T2DM: Type 2 Diabetes Mellitus. GLP1: Glucagon-Like Peptide-1; Homa-IR: Homeostasis Model Assessment-Insulinresistance. ***p < 0.001.
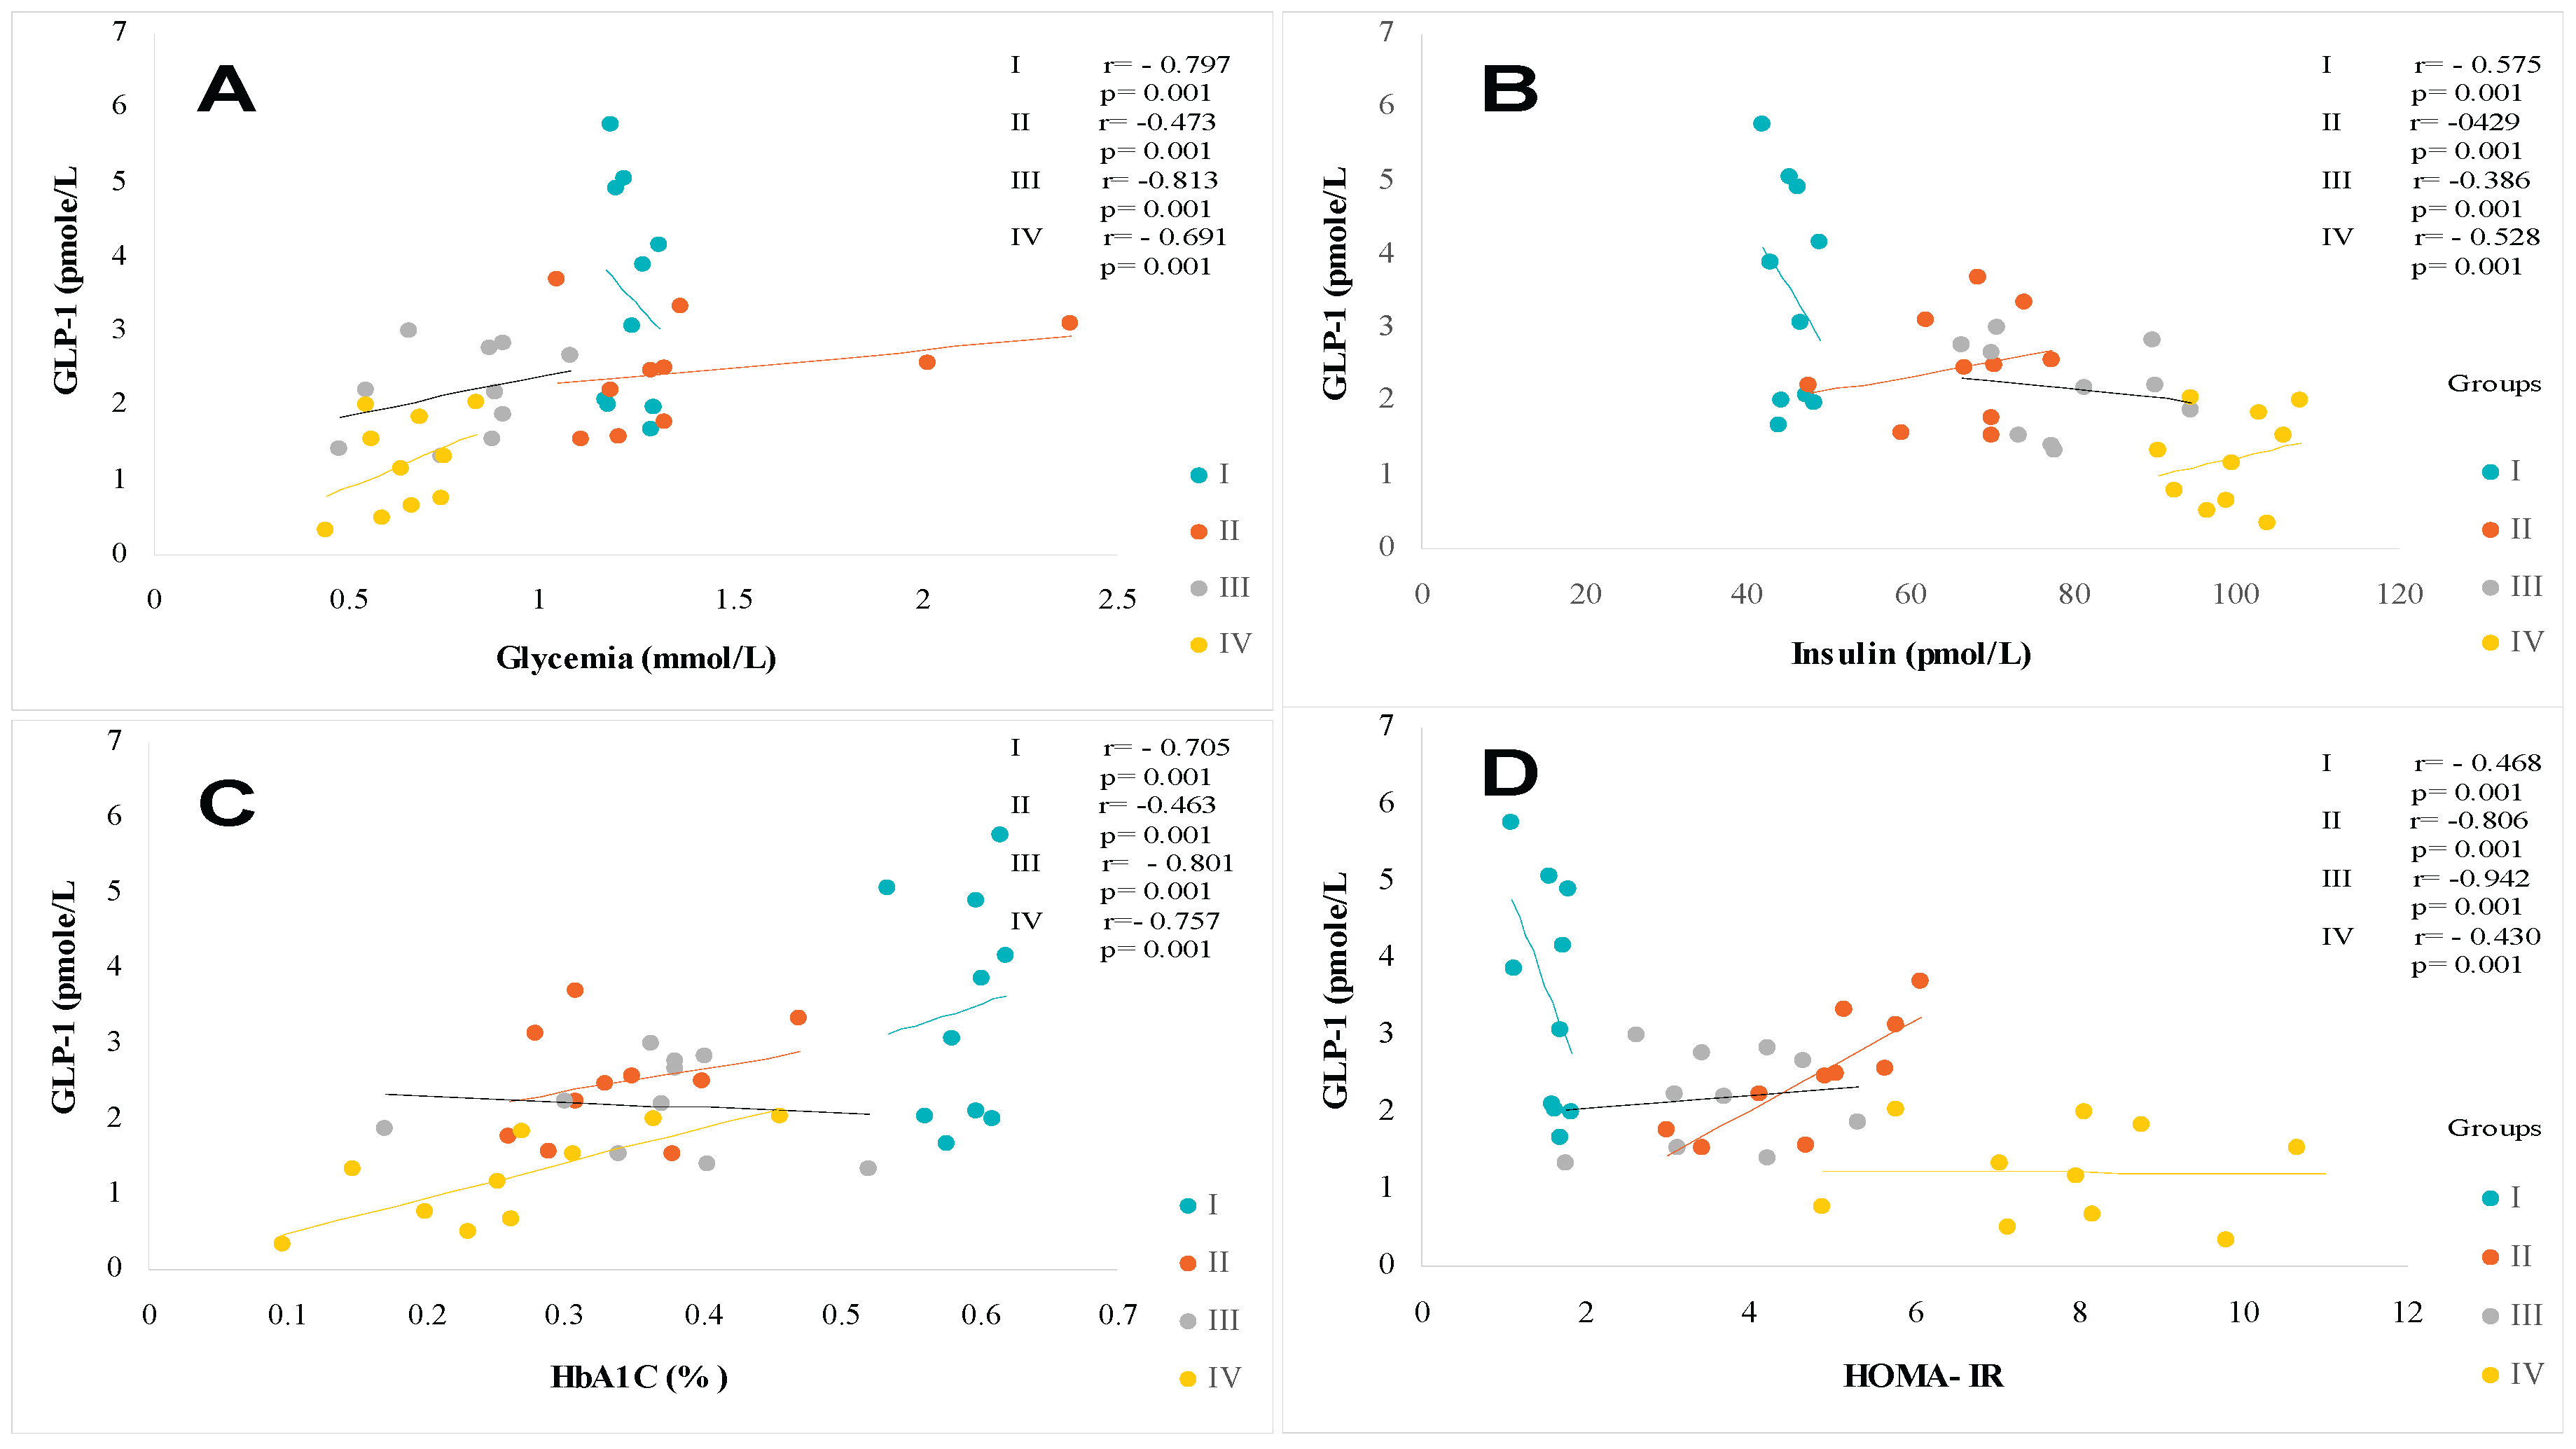
Figure 5.
Pearson correlation between GLP-1and Triglycerides (A), HDL- Cholesterol (B), NEFA (C), and ALT (D) in different trial groups. Group I: Healthy control participants; Group II: MAFLD participants; Group III: T2DM participants; Group IV: MAFLD+ T2DM participants. MAFLD: Metabolic Associated Fatty Liver Disease. T2DM: Type 2 Diabetes Mellitus. GLP1: Glucagon-Like Peptide-1; NEFA: non-esterified fatty acids; ALT: Alanine aminotransferase. ***p < 0.001.
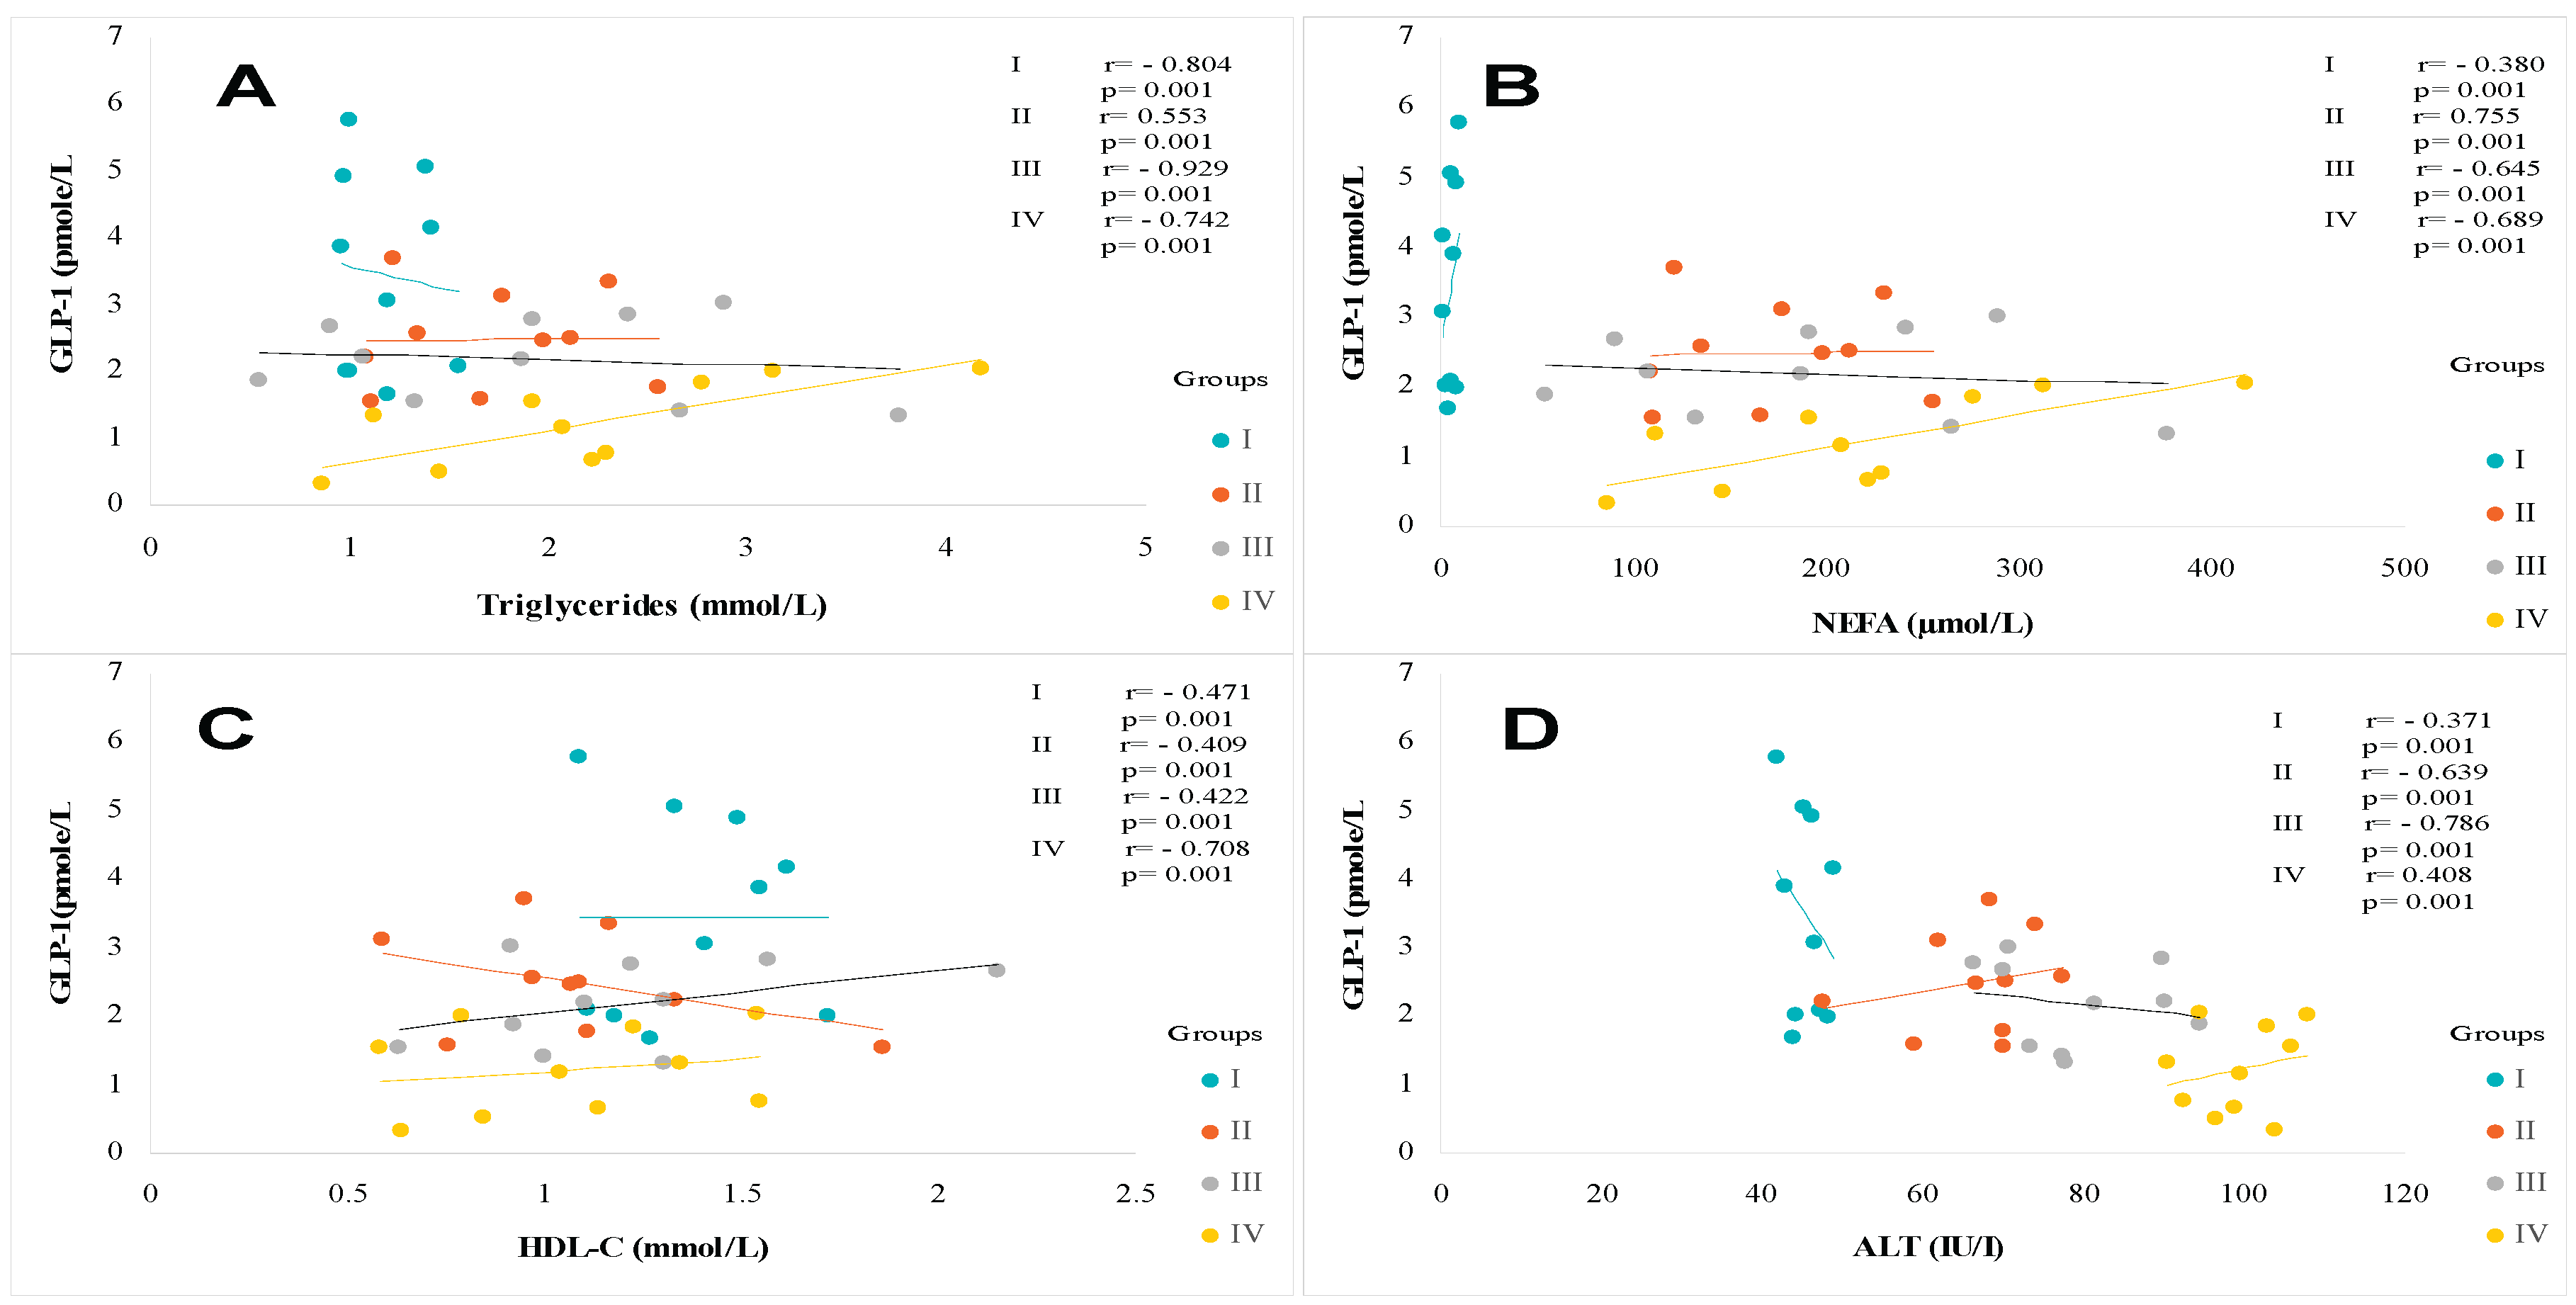
Figure 6.
Pearson correlation between GLP-1 and AST/ALT Ratio (A), Ferritin (B), Hs-CRP (C), and GGT (D) in different trial groups. Group I: Healthy control participants; Group II: MAFLD participants; Group III: T2DM participants; Group IV: MAFLD+ T2DM participants. MAFLD: Metabolic Associated Fatty Liver Disease. T2DM: Type 2 Diabetes Mellitus. GLP1: Glucagon-Like Peptide-1. GGT: Gamma glutamyl transferase. ***p < 0.001.
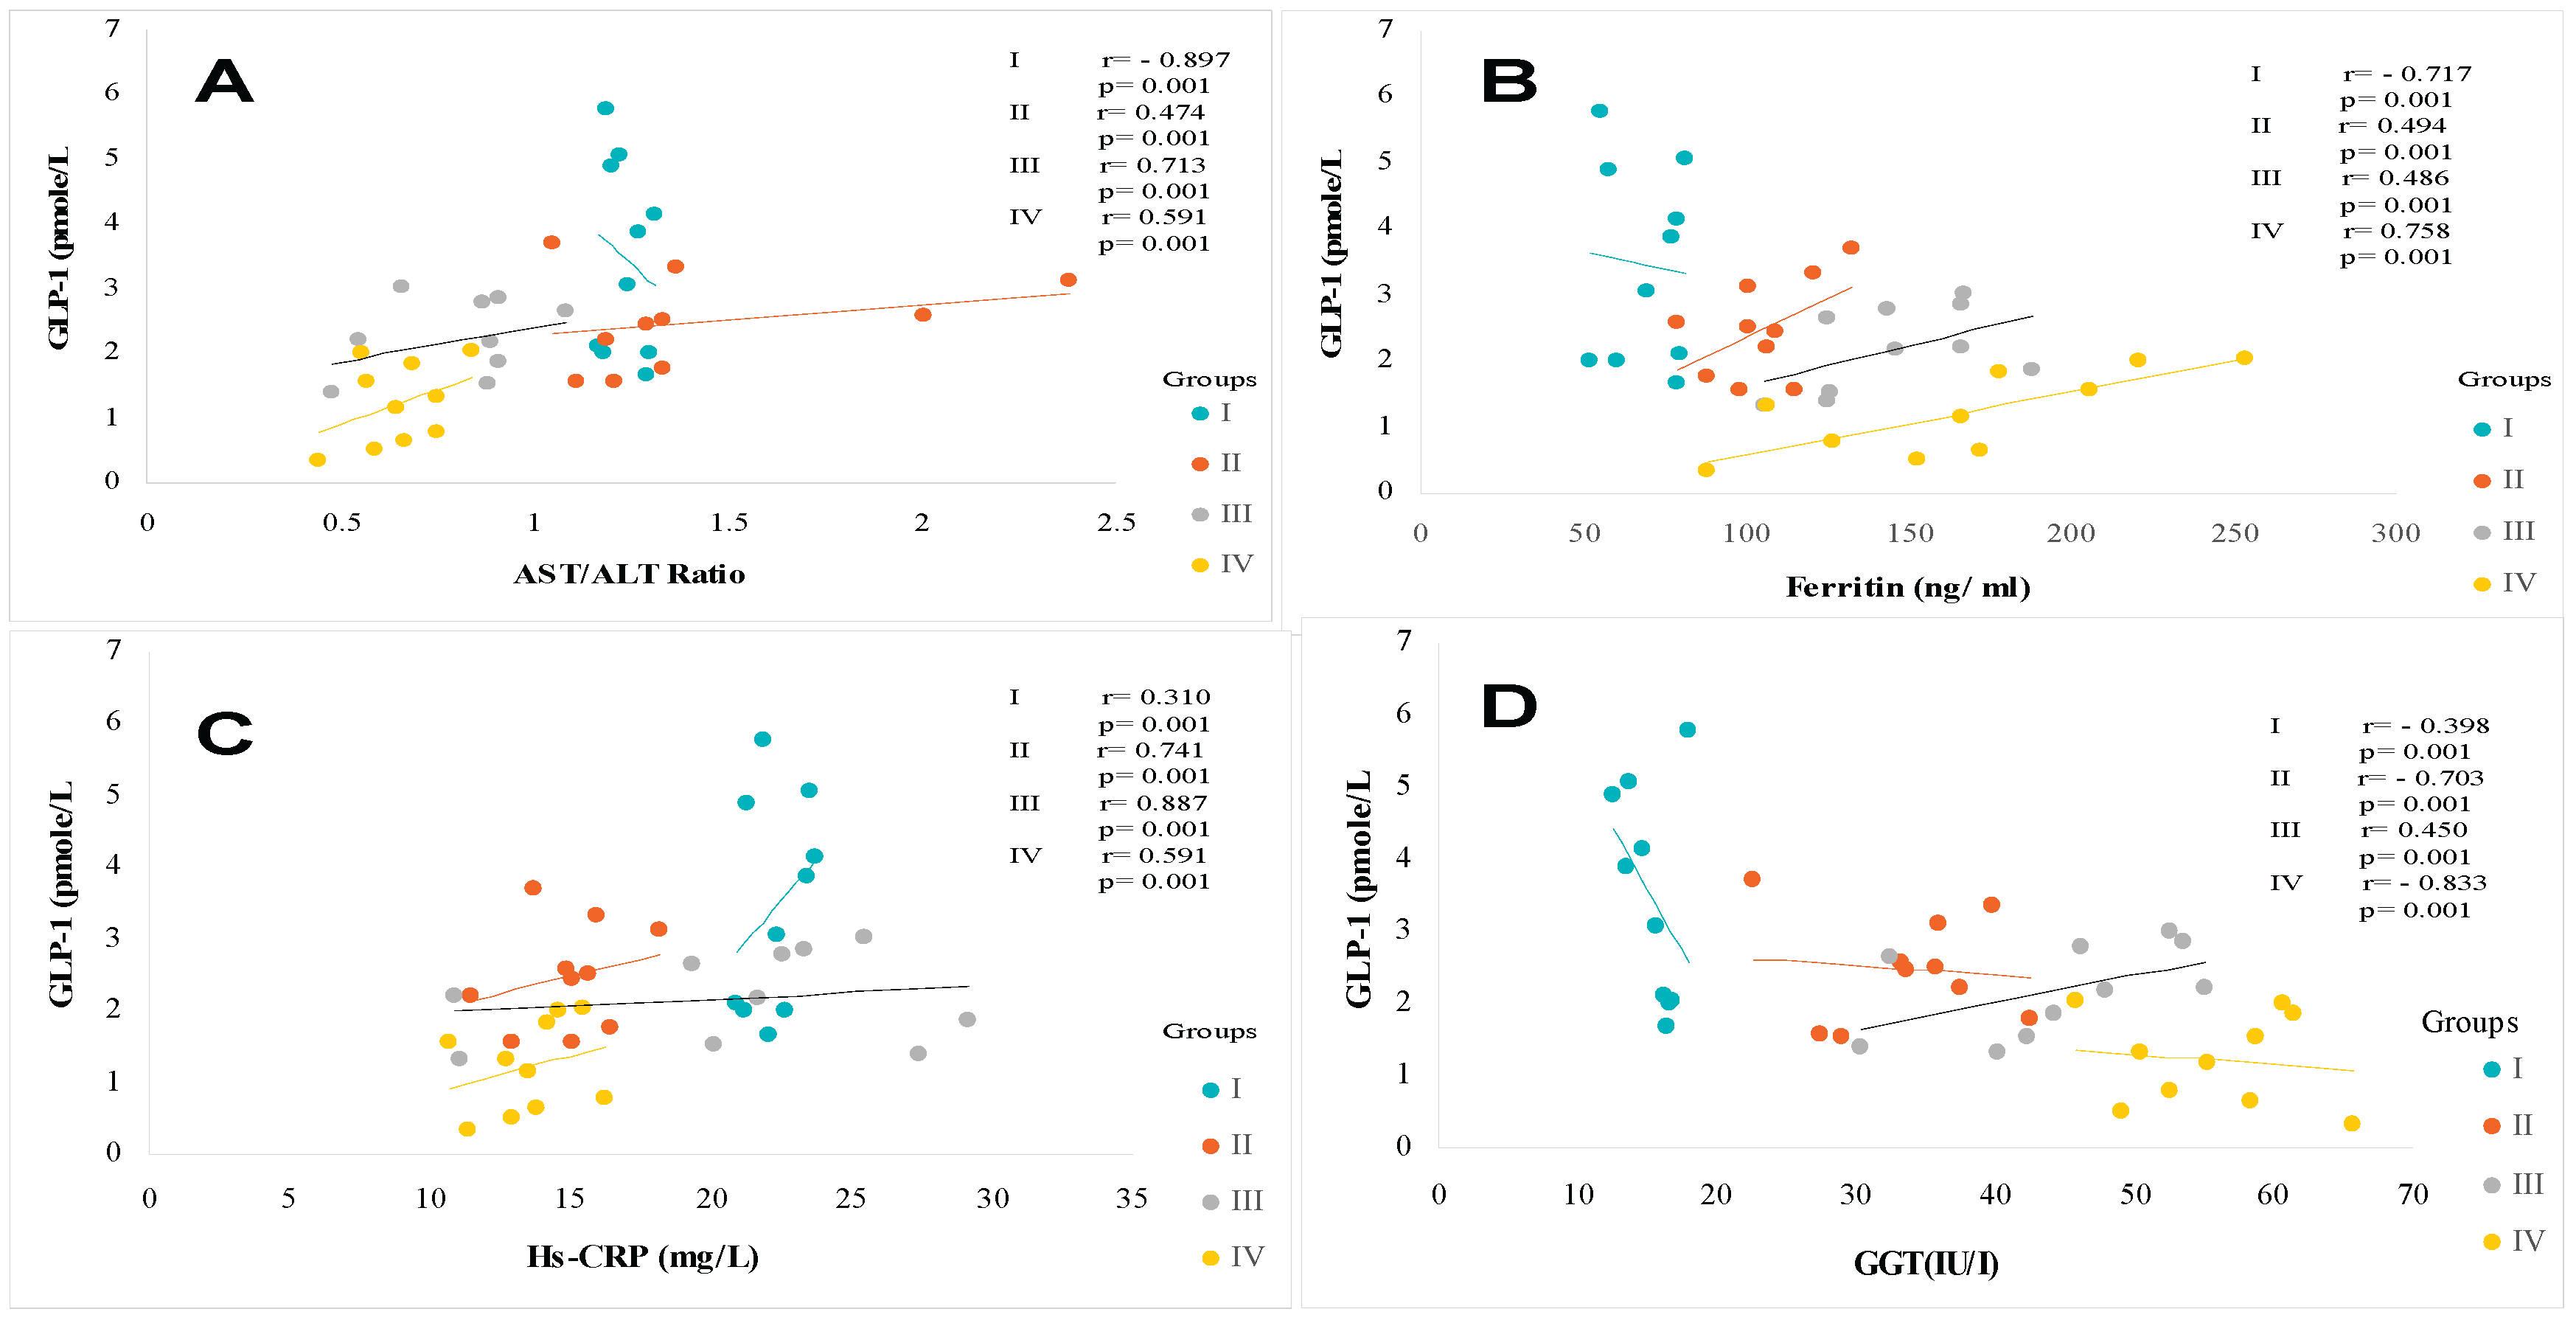
Figure 7.
Pearson correlation between GLP-1and Leptin (A), Adiponectin (B), Resistin (C), and Leptin- Adiponectin ratio (D) in different trial groups. Group I: Healthy control participants; Group II: MAFLD participants; Group III: T2DM participants; Group IV: MAFLD+ T2DM participants. MAFLD: Metabolic Associated Fatty Liver Disease. T2DM: Type 2 Diabetes Mellitus. GLP1: Glucagon-Like Peptide-1. *p < 0.05; **p < 0.01; ***p < 0.001.
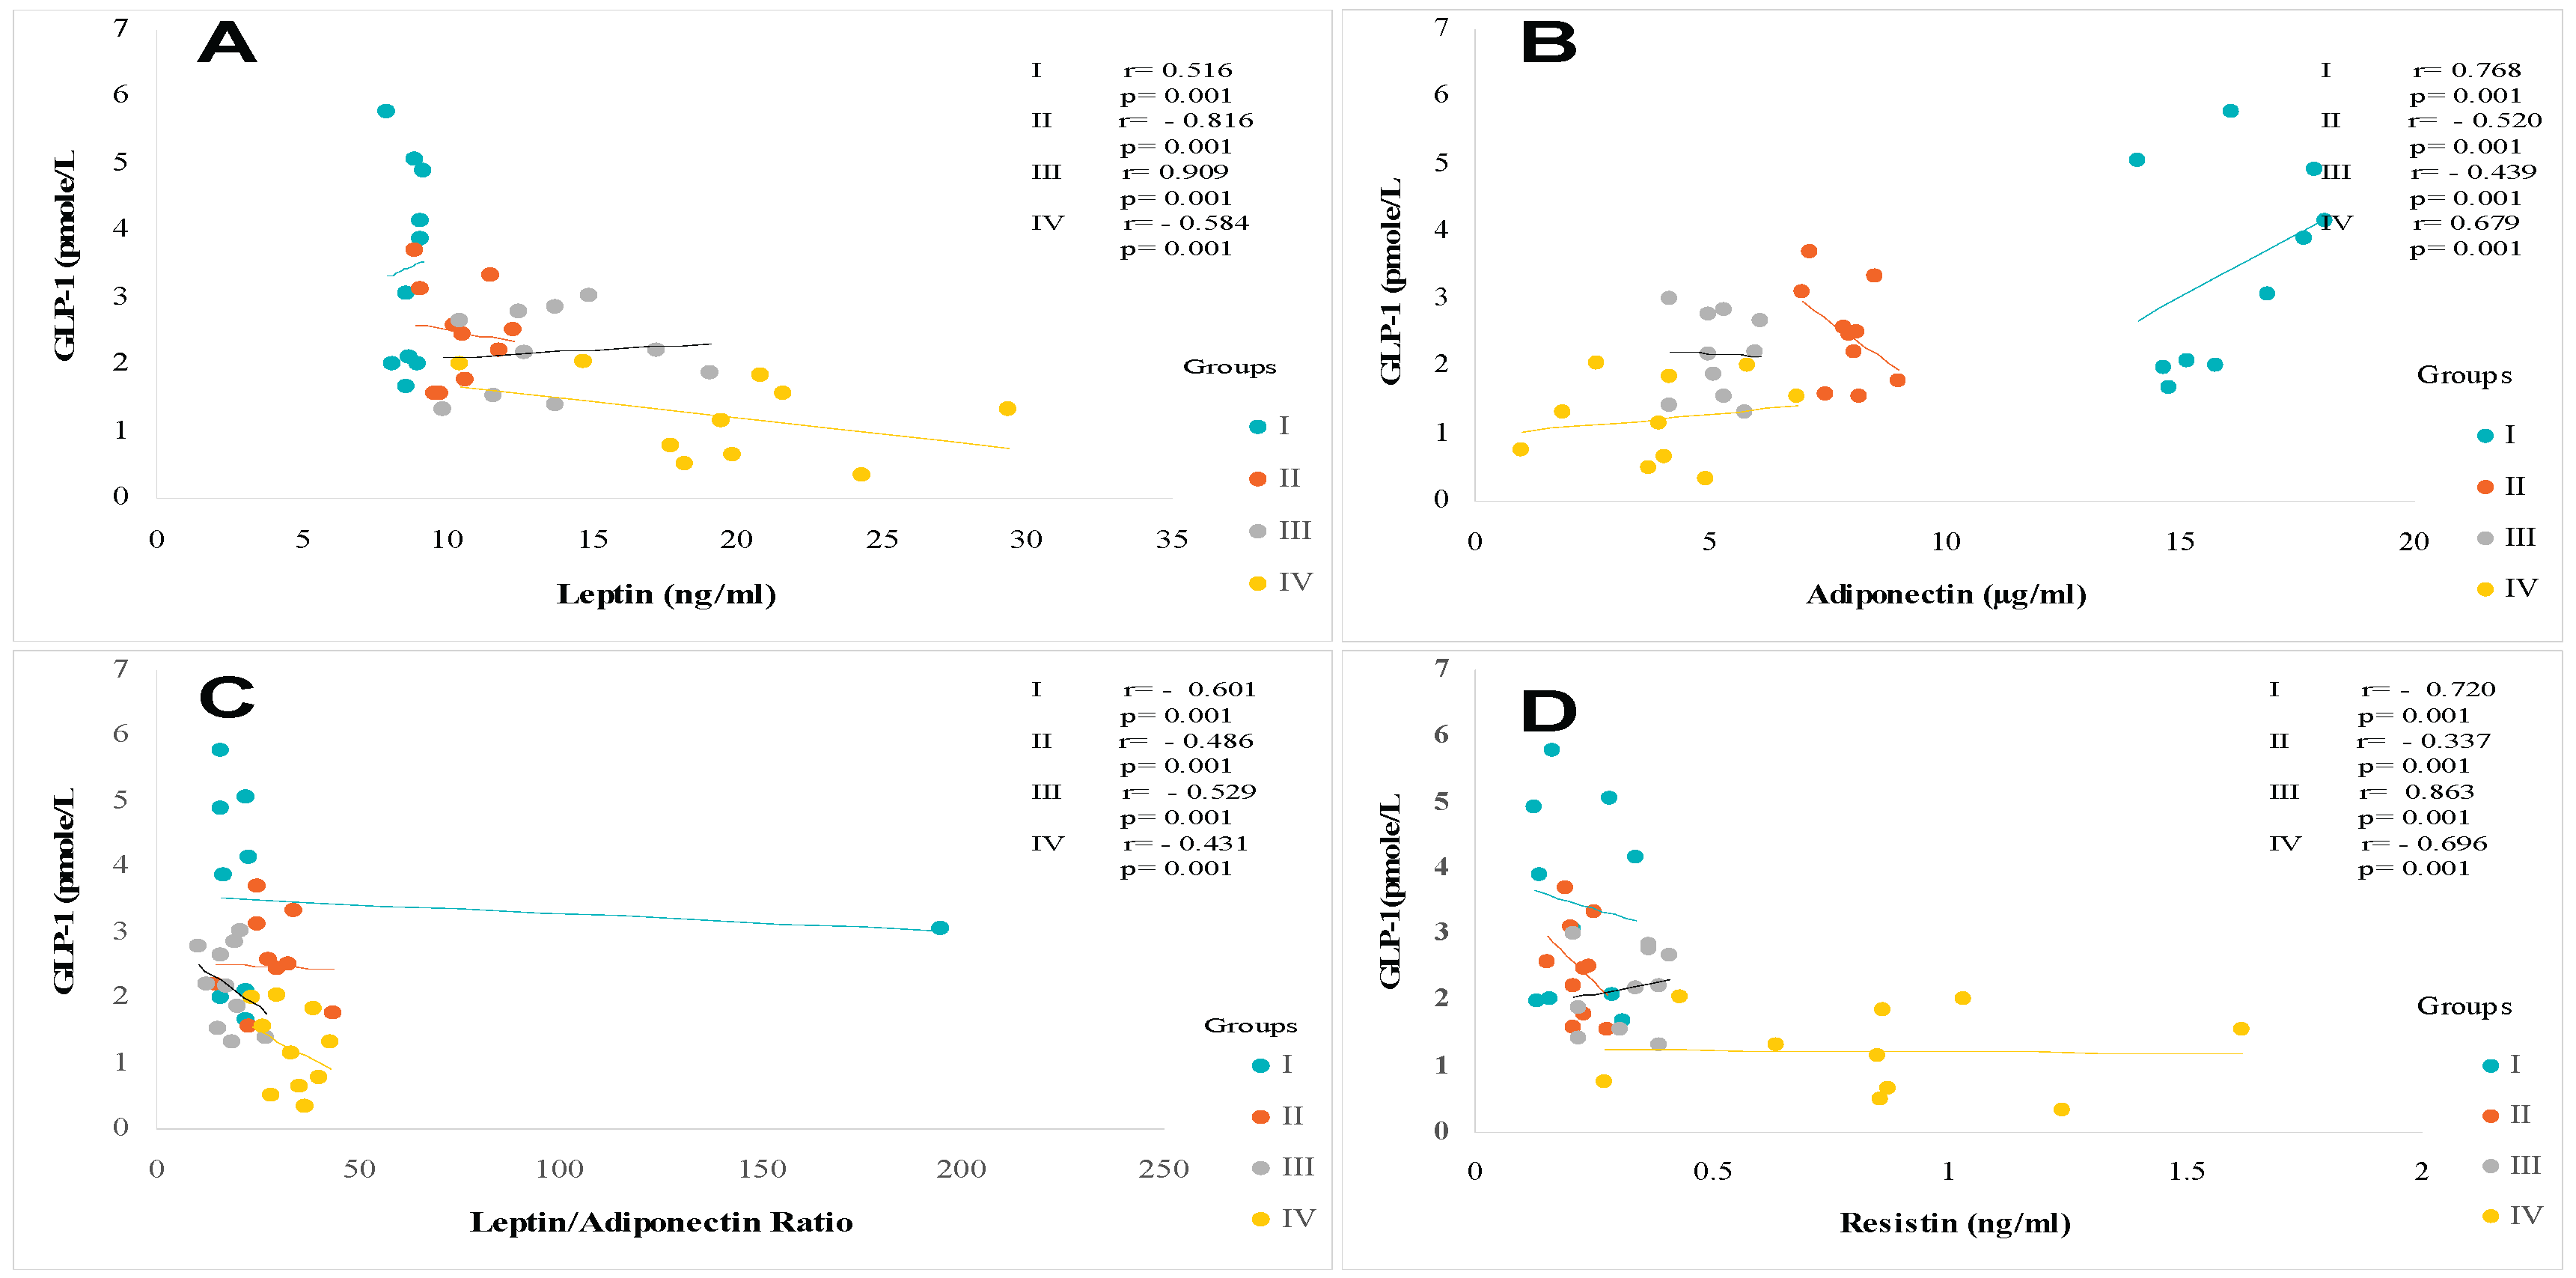
Figure 8.
Pearson correlation between GLP-1and TNF-α (A), IL-6 (B), IL-1 β (C), and IL-17 (D) in different trial groups. Group I: Healthy control participants; Group II: MAFLD participants; Group III: T2DM participants; Group IV: MAFLD+ T2DM participants. MAFLD: Metabolic Associated Fatty Liver Disease. T2DM: Type 2 Diabetes Mellitus. GLP1: Glucagon-Like Peptide-1; TNF-α: Tumor necrosis factor – alpha; IL-6: Interleukine-6; IL-1 β: Interleukine-1 β, IL-17: Interleukine-17. *p < 0.05; **p < 0.01; ***p < 0.001.
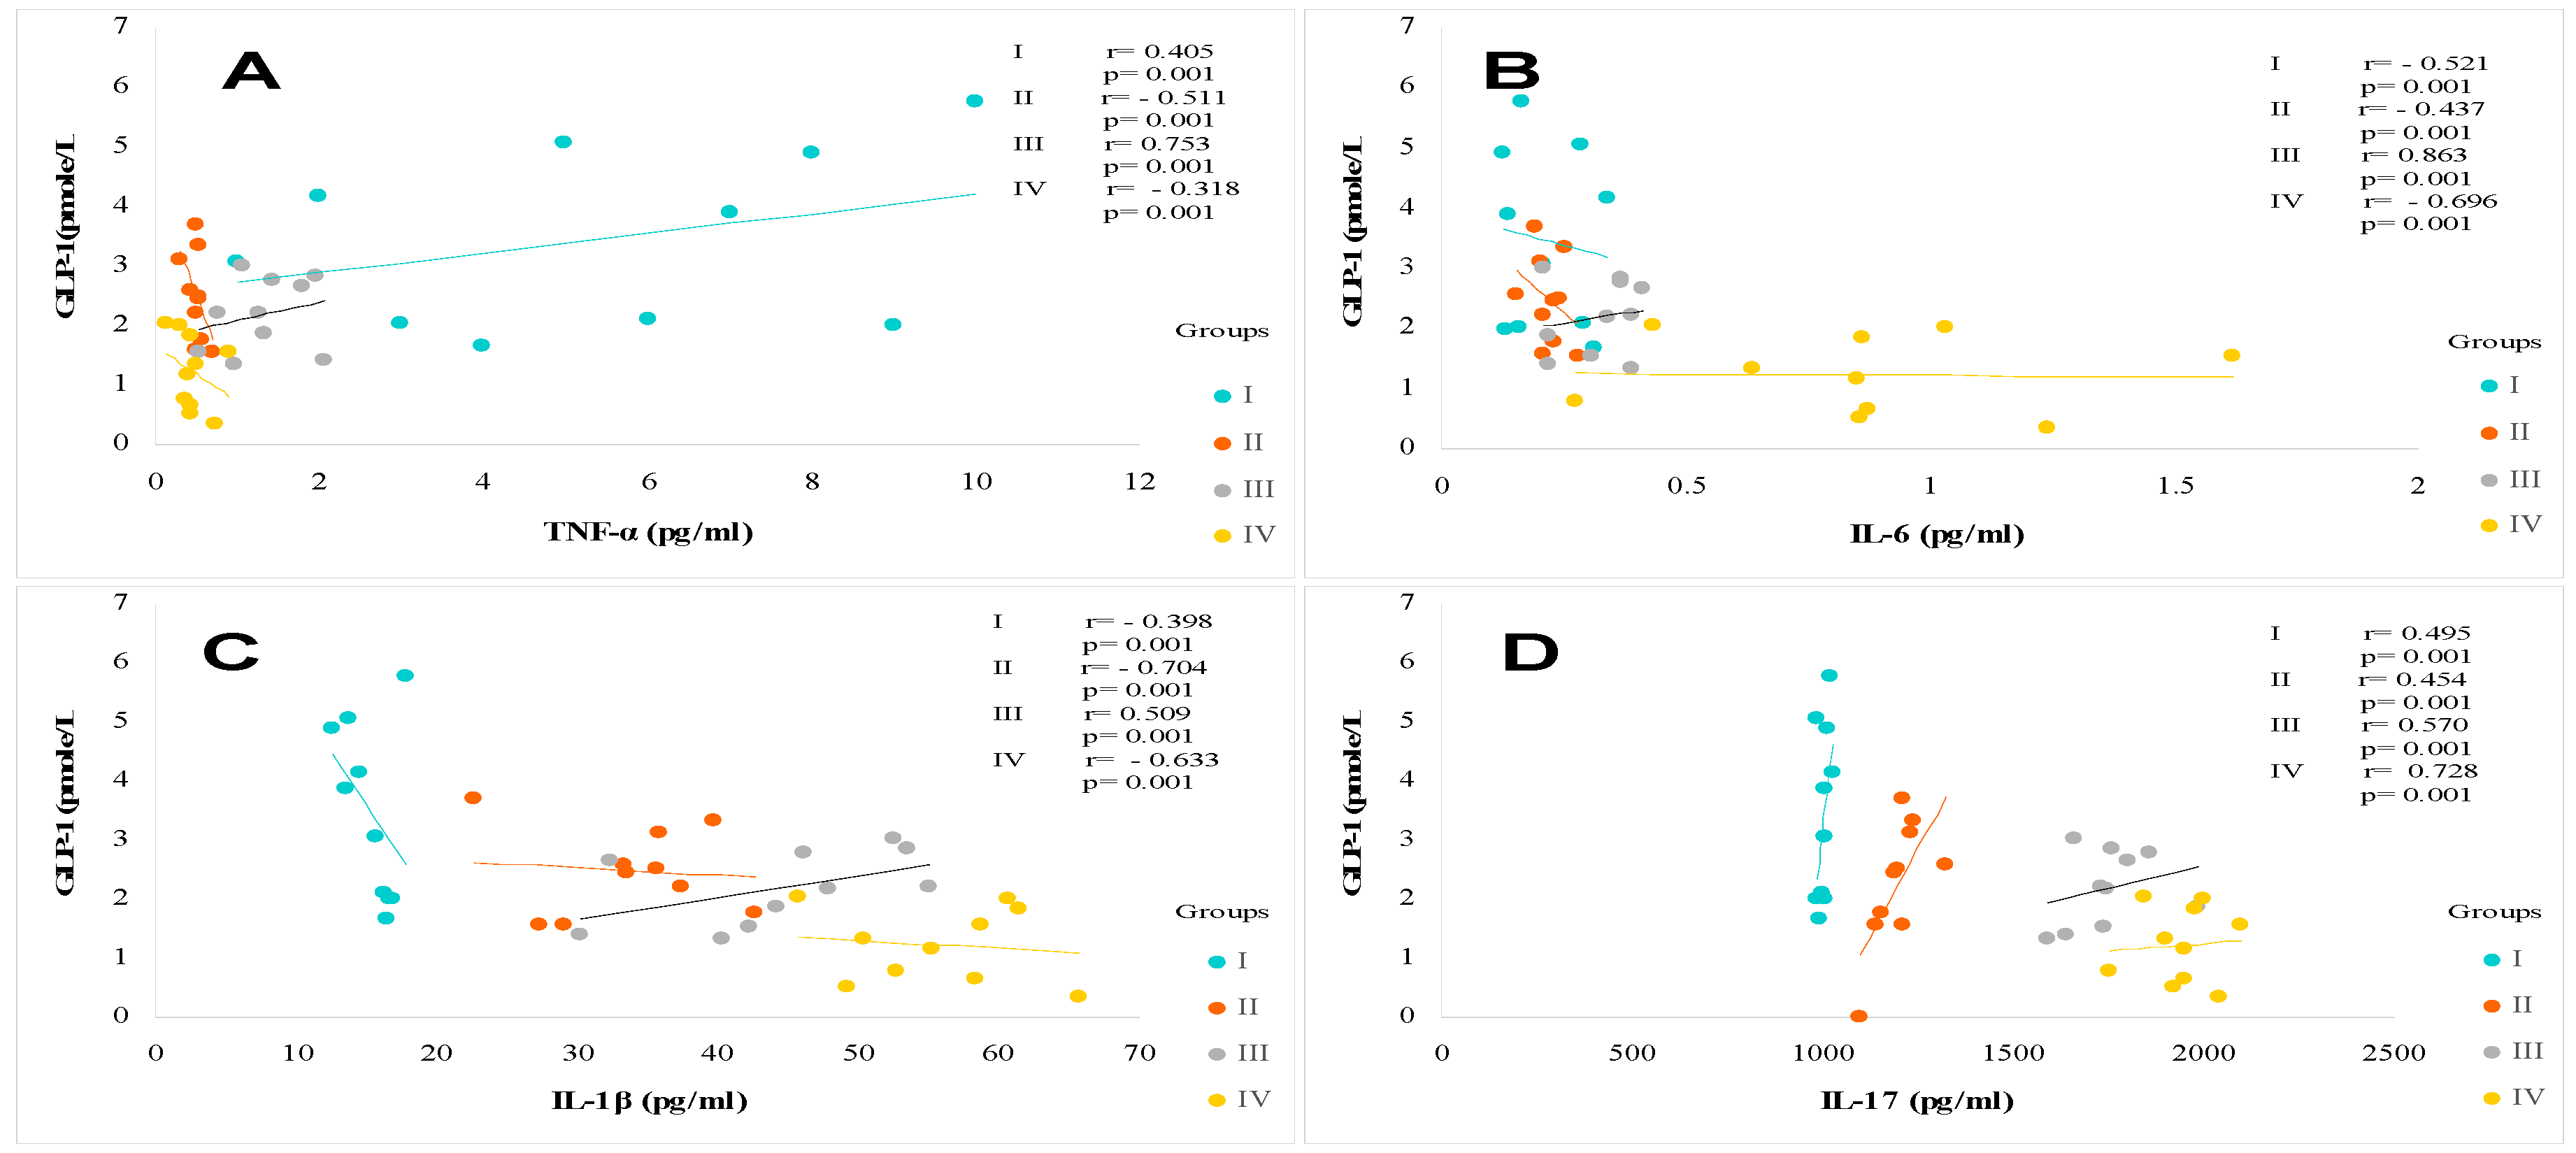
Figure 9.
The clinical protocol design in participants with Metabolic Dysfunction-associated Fatty Liver Disease (MAFLD-Group II), Type 2 Diabetes Mellitus (T2DM-Group III) and T2DM associated with MAFLD (Group IV) compared to Healthy participants (Group I). This clinical investigation was a randomized, multicenter cross-sectional and observational design study-Case-control was carried between November 2022 and December 2024. We included in the study 590 adult participants, aged between 35 and 57 years, including 215 men (M) and 375 women (W). The sample size was estimated using the Coshrans’ formula. The all participant’s cohort was classified according to age and sex, with a sex ratio of men/women = 0.57. Diabetic participants were treated with metformin 300 mg/24 h, associated with a sulfonylurea. The Group II was no-treated. No participants were insulin-requiring. The drug doses were stable throughout the study. The diabetes age and the presence of MAFLD in Group IV were variable, between 5 and 10 years. In this study, we excluded all subjects with endocrinopathies, such as Cushing’s disease, dysthyroidism, acromegaly, pheochromocytoma, pituitary, and adrenal insufficiency. We also excluded pregnant women and those on oral contraceptives. Similarly, patients treated with corticosteroids, antidepressants, hormone therapy, and type 1 diabetics, diabetics insulin-requiring, diabetics treated with sulfonylureas, alcohol consumers, hepato-carcinoma, viral hepatitis, hydatid cyst cirrhosis, hemochromatosis, Wilson's disease, jaundice, α-1 antitrypsin deficiency were excluded. In day hospital, the MAFLD diagnosis was confirmed by abdominal ultrasound, histological liver biopsies examination, and biochemical profiles of liver function, whether or not associated with hepatomegaly. All study subjects were diagnosed for % MAFLD according to the radiological protocol. Ultrasound scans and fibroscan techniques were performed after a 12-hour fast in a medical imaging center by a single radiologist as operator. Steatosis severity was assessed using a 4-grade test scale (see Patients and Methods). All clinical explorations participants have been examined by the same physician.
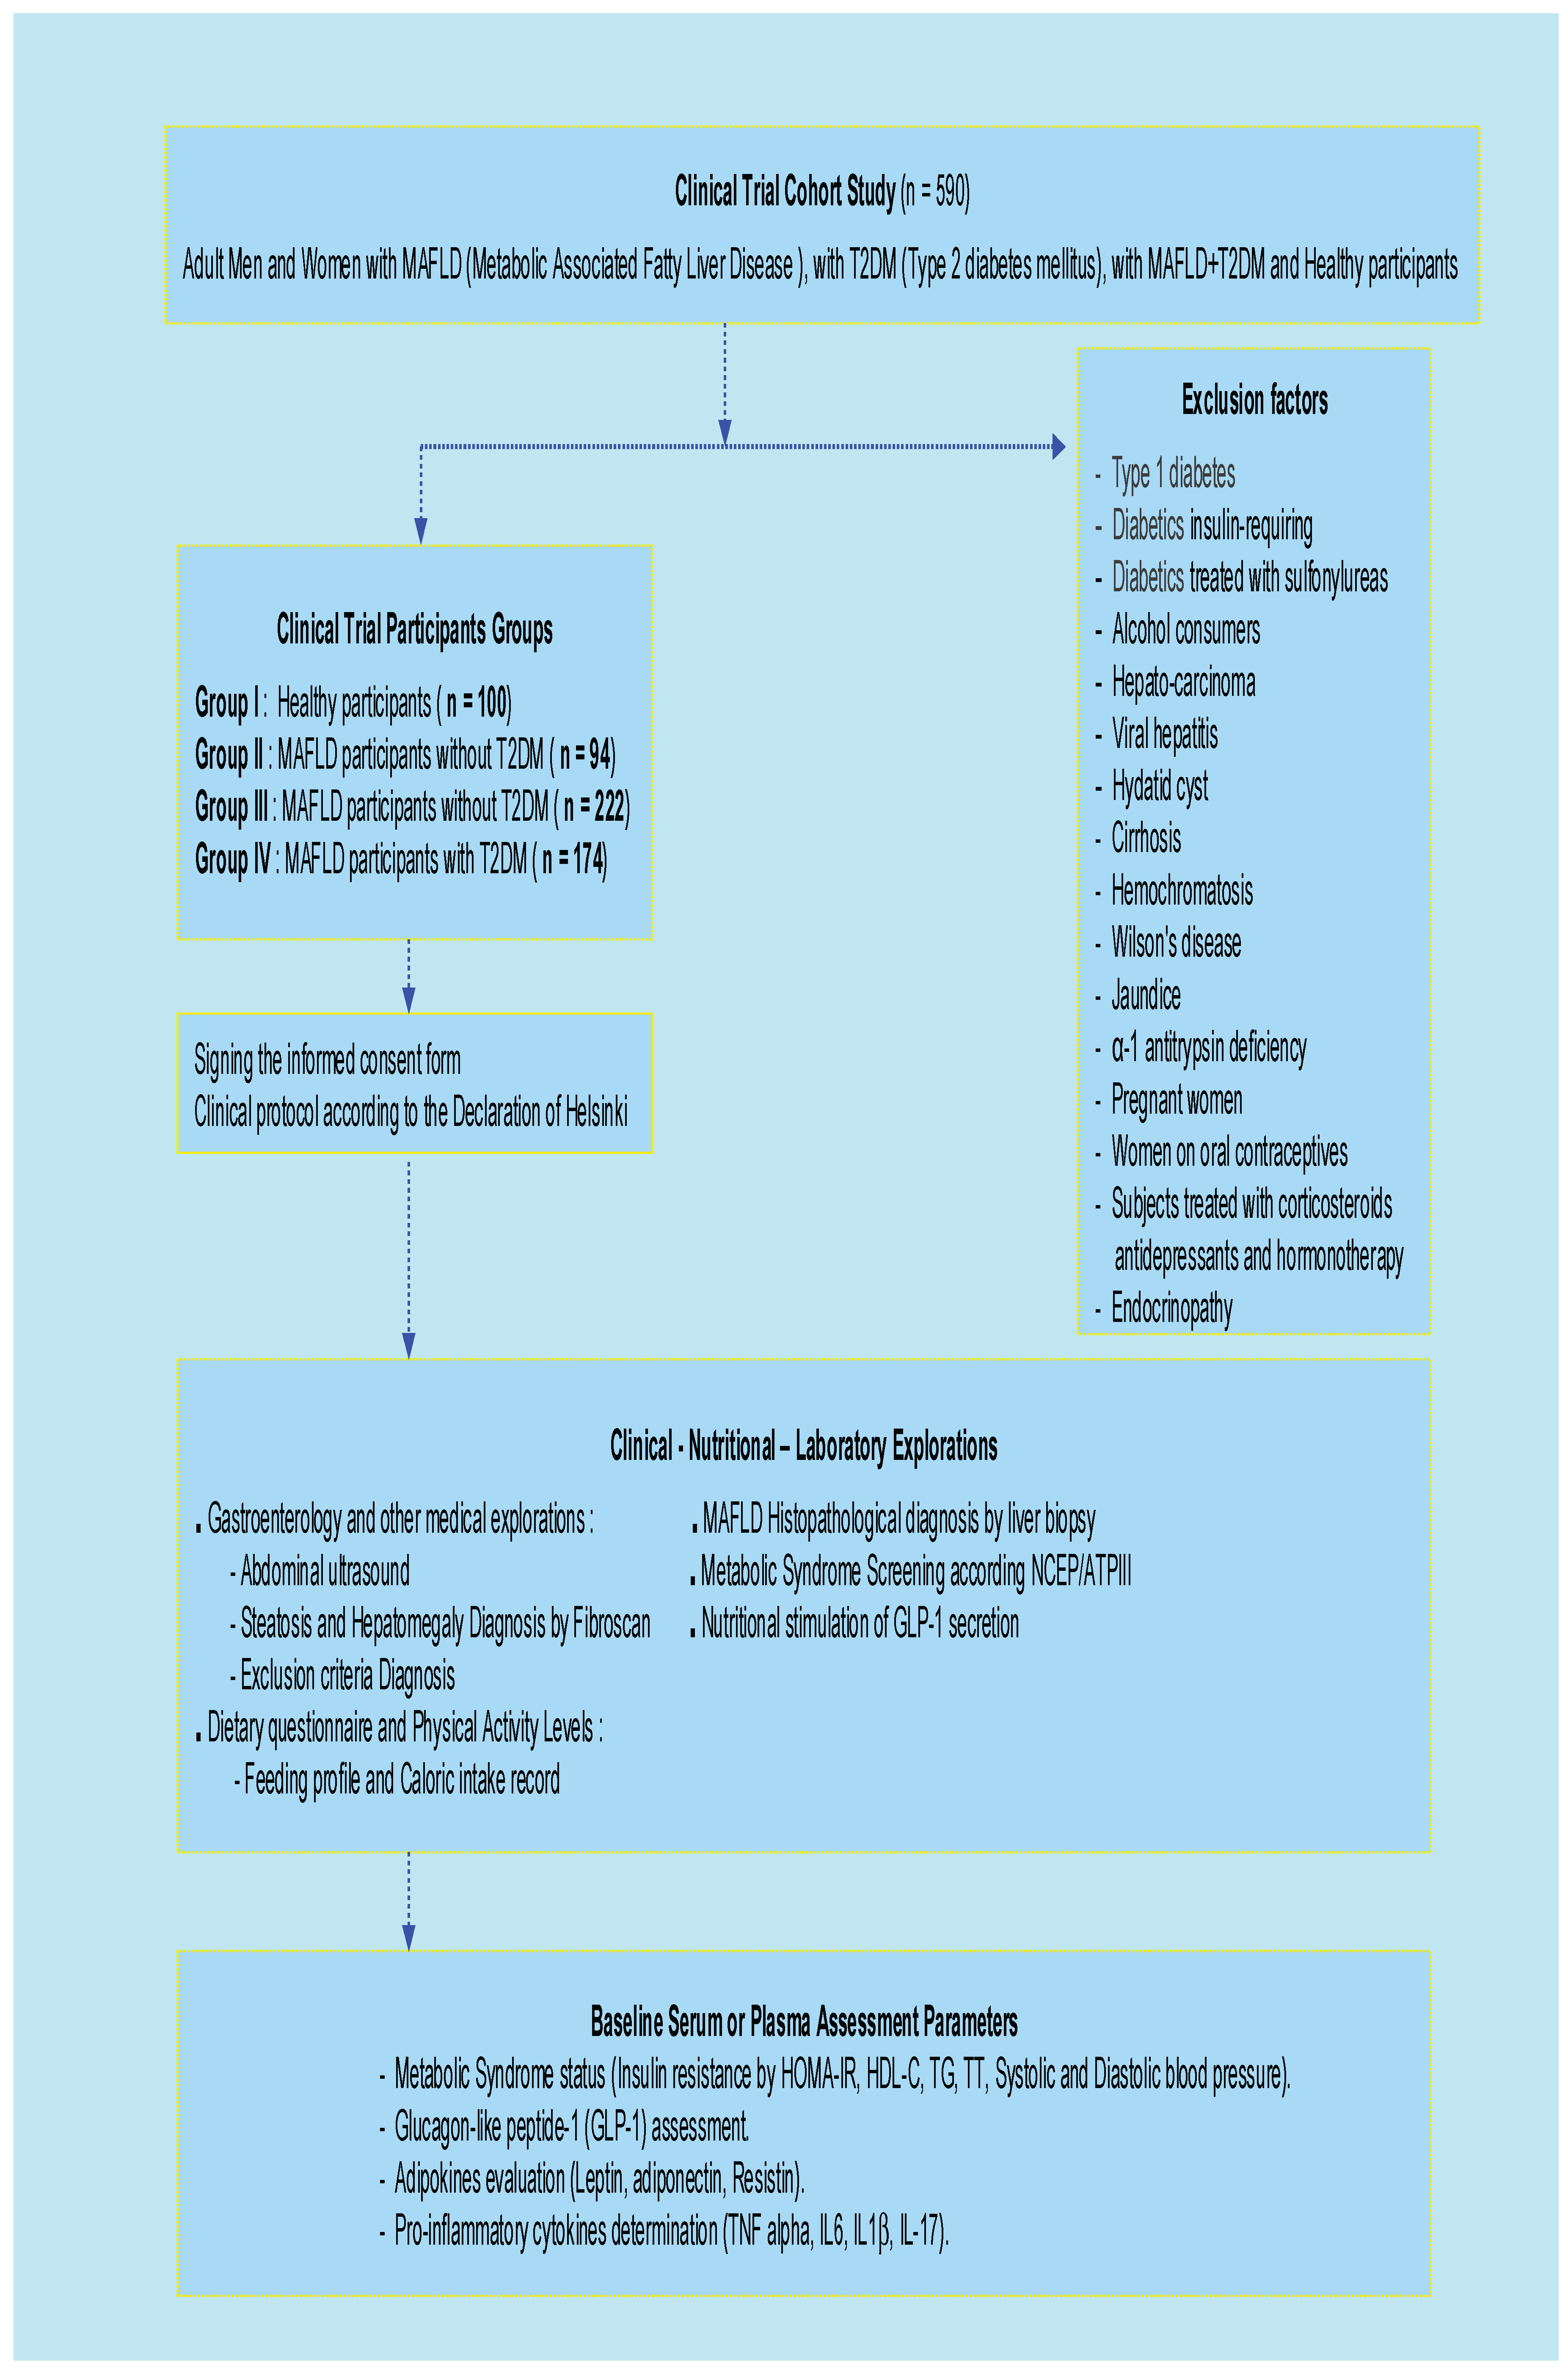

Table 2.
Clinical trial cohort classification according metabolic syndrome in MAFLD, T2DM and MAFLD with T2DM Participants groups.
Table 2.
Clinical trial cohort classification according metabolic syndrome in MAFLD, T2DM and MAFLD with T2DM Participants groups.
| P/G |
Group I (N=100) |
Group II (N=94) |
Group III (N=222) |
Group IV (N=174) |
| Δ GLP-1 (pmole/L) | 11.7 ± 1.71(Fs) | 9.50 ± 2.52(Fs)* | 8.80 ± 1.52(Fs)*** | 6.62 ± 1.6(Fs)*** |
| 34.5 ± 3.81(PP) | 20.7 ± 4.18(PP)* | 14.6 ± 2.25(PP)*** | 10.9 ± 2.70(PP) *** | |
| Glycemia (mmol/L) | 4.67 ± 0.39 | 6.27 ± 0.09** | 8.71 ± 0.33*** | 9.21 ± 0.42*** |
| HbA1C (%) | 5.53 ± 0.80 | 5.62 ± 0.70*** | 6.17 ± 0.18*** | 6.39 ± 0.11*** |
| HbA1c (mmol/mol) | 37 ± 5.35 | 38 ± 4.05*** | 44.1 ± 3.80*** | 46.1 ± 1.46*** |
| Insulinemia (pmol/L) | 63 ± 3.47 | 165 ± 5.62*** | 299 ± 21*** | 510 ± 38*** |
| Homa-IR Index | 1.98 ± 0.10 | 6.65 ± 0.26*** | 17.06 ± 1.54*** | 30.6 ± 2.48*** |
| Triglycerides (mmol/L) | 0.72 ± 0.04 | 1.50 ± 0.19*** | 1.76 ± 0.10*** | 2.22 ± 0.14*** |
| Total Cholesterol (mmol/L) | 3.98 ± 0.22 | 5.05 ± 0.40*** | 4.89 ± 0.57*** | 5.54 ± 0.93*** |
| HDL- Chol (mmol/L) | 1.24 ± 0.04(M) 1.57 ± 0.08 (W) |
1.10 ± 0.05(M) 1.23 ± 0.05 (W) |
1.05 ± 0.03 (M) 1.14 ± 0.06 (W) |
1.00 ± 0.04(M) 1.06 ± 0.02(W) |
| LDL- Chol (mmol/L) | 2.49 ± 0.02 | 3.21 ± 0.15 | 3.49 ± 0.12*** | 4.29 ± 0.06*** |
| SBP (mm Hg) | 125 ± 15 | 126 ± 16 | 129 ± 13 | 135 ± 17 |
| DBP (mm Hg) | 80.3 ± 3.81 | 79.8 ± 5.7 | 80.7 ± 6.3 | 81.3 ± 7.4 |
| Total bilirubin (µmol/L) | 9.91 ± 0.68 | 11.4 ± 0.17 | 11.2 ± 0.68 | 12.1 ± 0.34 |
| AST (IU/l) | 21.7 ± 1.20 | 30.6 ± 2.61 | 26.4 ± 1.82 | 41.0 ± 4.68*** |
| ALT (IU/l) | 26.8 ± 1.09 | 76.3 ± 5.90*** | 29.1 ± 1.58 | 82.1 ± 5.98*** |
| AST/ALT Ratio | 0.81 ± 0.06 | 0.66 ± 0.04*** | 0.90 ± 0.05 | 0.63 ± 0.08*** |
| GGT (IU/l) | 21.9 ± 2.20 | 70.4 ± 4.42*** | 52.4 ± 3.66*** | 83.7 ± 5.24*** |
| AP (UI/L) | 79.3 ± 3.37 | 91.4 ± 5.11 | 86.5 ± 4.64 | 98.0 ± 6.92*** |
| Iron (g/L) | 1.28 ± 0.05 | 1.33 ± 0.02 | 1.55 ± 0.07* | 1.95 ± 0.07* |
| Ferritin (pmol/L) | 147 ± 11 | 204 ± 3*** | 172 ± 5 | 309 ± 4*** |
| Hs-CRP (mg/L) | 3.5 ± 1.2 | 7.70 ± 0.6*** | 5.61 ± 0.1** | 9.44 ± 0.8*** |
| NEFA (µmol/L) | 290 ± 36 | 510 ± 51** | 689 ± 123*** | 897 ± 78*** |
P: parameters; G: group; MAFLD: Metabolic Associated Fatty Liver Disease. T2DM: Type 2 Diabetes Mellitus. Group I: Healthy control participants; Group II: MAFLD participants without T2DM; Group III: T2DM participants without MAFLD; Group IV: MAFLD participants with T2DM comorbidity; M: Men; W: Women; N: total number of participants; GLP1: Glucagon-Like Peptide-1. Fs: Fasting state. PP: Post-prandial or fed state. Δ GLP-1: average values at 15 and 60 minutes. Homa-IR: Homeostasis Model Assessment-Insulinresistance. Chol : Cholestérol. HDL/LDL-C: high-density/low-density lipoprotein cholesterol. SBP: Systolic Blood Pressure. DBP: Diastolic Blood Pressure. AST: Aspartate aminotransferase; ALT: Alanine aminotransferase; GGT: Gamma-glutamyl transferase. AP: Alkaline phosphatase. Hs-CRP: High sensitive C reactive Protein. NEFA: non-esterified fatty acids. Mean values are assigned the standard error to the mean (X±SEM). The degree of significance is calculated for a risk of error α=5%. The comparison of means is established between the MAFLD, T2DM and MAFLD + T2DM groups versus Healthy group. *p<0.05; **p<0.01; ***p<0.001.
Disclaimer/Publisher’s Note: The statements, opinions and data contained in all publications are solely those of the individual author(s) and contributor(s) and not of MDPI and/or the editor(s). MDPI and/or the editor(s) disclaim responsibility for any injury to people or property resulting from any ideas, methods, instructions or products referred to in the content. |
© 2025 by the authors. Licensee MDPI, Basel, Switzerland. This article is an open access article distributed under the terms and conditions of the Creative Commons Attribution (CC BY) license (http://creativecommons.org/licenses/by/4.0/).
Copyright: This open access article is published under a Creative Commons CC BY 4.0 license, which permit the free download, distribution, and reuse, provided that the author and preprint are cited in any reuse.


