
Submitted:
12 March 2025
Posted:
12 March 2025
You are already at the latest version
Abstract
Obesity is considered a global pandemic. Visceral adipose tissue (VAT) presents greater lipolysis, lower insulin sensitivity and greater metabolic alterations. Liraglutide is a GLP-1 analogue that improves the expression of GLUT 4R, MAP kinases, decreases TGF-β, reactivates the PPAR-ɣ pathway and decreases chronic inflammation. Objectives: To compare the difference in the determination of visceral adipose tissue in people with obesity and type 2 diabetes vs obesity and prediabetes treated with liraglutide. Methods: A quasi-experimental, analytical, prolective, non-randomized, non-blind study was carried out over a period of 6 months in a third-level center. A total of 36 participants were divided into 2 arms; G1 (Obesity and prediabetes) and G2 (Obesity and type 2 diabetes) for 6 months. Inclusion criteria: men and women ≥18 years, with type 2 diabetes, prediabetes and obesity. Exclusion criteria: GFR <60 thousand/min/1.73m2sc, elevated transaminases (> 5 times ULN) and use of non-weight-modifying antidiabetic drugs. Conclusion: No statistically significant difference was found in the decrease of visceral adipose tissue when comparing G1 (OB and PD) vs. G2 (OB and T2D). When comparing intragroups in G2 (OB and DT2), greater weight loss was found [(-3.78 kg; p0.012)Vs.(-3.78 kg;p0.012)], waist circumference [(-3.9 cm;p0.049)Vs.(-3.09 cm;p0.017)], glucose [(-1.75 mmol/L; p0.002)Vs.(- 0.56 mmol/L; p0.002)], A1c% [(-1.15%;p0.001)Vs.(-0.5%; p0.000)].
Keywords:
Obesity
; type 2 diabetes
; prediabetes
; visceral adipose tissue
; liraglutide
; GLP-1R
1. Introduction
Obesity (OB) is considered a global pandemic. The World Health Organization (WHO) defines it as an excess of adipose tissue and predisposes to Type 2 Diabetes (T2D) [1]. According to its figures, in 2019 there were 650 million adults over 18 years of age with OB [2]. In Mexico, the prevalence rose from 72.5% to 75.2% from 2016 to 2018 [3]. The risk of developing T2D increases with adiposity and increasing BMI [4]. T2D is a chronic disease that manifests when not enough insulin is secreted by the pancreas or when it is not used efficiently by the body [5]. According to the International Diabetes Federation, there are 537 million adults aged 20 to 79 living with diabetes in the world and in North America 1 in 7 adults (51 million) lives with diabetes and 1 in 4 adults lives with undiagnosed diabetes [6]. In Mexico, according to the National Health and Nutrition Survey (ENSANUT) there are 8.6 million inhabitants diagnosed with T2D and it is estimated that in 2045 20% of the Mexican population could develop T2D [7]. According to the American Diabetes Association (ADA) 2023, the diagnostic criteria for T2D are: fasting glucose ≥ 126 mg/dL, glycosylated hemoglobin (A1c%) ≥ 6.5%, 2 h postprandial glucose ≥ 200 mg/dL, Symptoms + Random glucose ≥200 mg/dl [8].
Prediabetes (PD) is a condition with glucose levels above normal without reaching diabetes criteria [9]. According to the American Diabetes Association (ADA) 2023, the PD criteria are: fasting glucose ≥ 100-125 mg/dL, A1c ≥ 5.7-6.4%, 2 h postprandial glucose ≥ 140-199 mg/dL [8]. It is considered the precursor of T2D. In the world, there are 88 million people over 18 years of age with PD and 24.2 million aged 65 and older [10]. In Mexico there is a prevalence of 19.9% [11]. PD increases the risk of T2D, stroke (ACV) and heart attack (AMI) by 3 to 10 times [12].
Adipose tissue (AT) is a complex organ composed of adipocytes, stromal cells (macrophages) and endothelial and blood cells.[13] According to its various characteristics, it is classified into four types: White Adipose Tissue (WAT), Pink Adipose Tissue (PAT), Beige Adipose Tissue (BAT) and Brown Adipose Tissue (BAT) [14]. By its location, TA is classified into Visceral Adipose Tissue (VAT) and Subcutaneous Adipose Tissue (SAT) [15,16]. The VAT and the Ectopic Adipose Tissue (EAT) are the fat close to the intra-abdominal organs and are the pillars of the etiology of T2D and Cardiovascular Disease (CVD).[14] When the diet exceeds the energy expenditure, it accumulates in the visceral deposit and induces lipotoxicity by free fatty acids (FFA) and lower Insulin Sensitivity (IS) [16,17].
The body composition is analyzed by fractioning the total body fat in different units. The excess of Body Fat (BF) and the RCV have developed numerous methods that allow us to evaluate the distribution of the different fats. The Bioimpedance (BIA) estimates the body composition, consists of the resistance that the tissue offers to the passage of alternating electricity, has a high diagnostic precision (r2=0.84-0.90 and a coefficient of variation of 1.7 – 4.5%) and is an indirect noninvasive and inexpensive method. Its accuracy is influenced by electrode placement, hydration level, food consumed, menstruation, and ambient temperature; therefore, it is important to have adequate preparation prior to the study [18,19,20,21].
The risk of T2D and CVD varies depending on the type of adipose tissue. People with T2D have a 2- to 4-fold increased risk of CVD and a 1.5- to 3.6-fold increased mortality [7]. Insulin disables lipolysis, stimulates glucose and circulating FA uptake in the AT, and promotes TG synthesis by suppressing hormone-sensitive lipase [22]. Adipokines and FFA secreted by the AT cause apoptosis of pancreatic β cells and decrease insulin synthesis and secretion [23].
Lifestyle changes are the basis of obesity treatment and the first step in the treatment of T2D [14]. The American Association of Clinical Endocrinologists (AACE), the Endocrine Society Obesity Guidelines, and The Latest Consensus report from the European Association for the Study of Diabetes/American Diabetes Association (ADA) all recommend that the effect on weight should be considered when choosing diabetes treatment [24].
Insulin-like peptide-1 (GLP-1) is a polypeptide incretin hormone that stimulates insulin secretion dependent on the amount of oral glucose consumed, reduces plasma glucagon concentrations, slows gastric emptying, and suppresses appetite [14,25]. GLP-1 enhances insulin synthesis and secretion by binding to GLP-1 receptors on β-cells, thereby increasing β-cell sensitivity to glucose [26,27]. Liraglutide is a GLP-1 Receptor Analogue (GLP-1RA), approved by the FDA, in doses up to 1.8 mg in combination with insulin for the treatment of T2D and doses of 3.0 mg for people with overweight or obesity [24].
2. Materials and Methods
Prior signature and authorization informed consent, a quasi-experimental, analytical, prolective, longitudinal study was conducted for a period of 6 months at a third-level center (Centro Medico Nacional La Raza “Dr. Antonio Fraga Mouret”) from 07/01/2023 to 03/01/2024. Approved by the institution’s ethics committee with folio R-2023-3501-093.
A study was conducted whose baseline state included men and women with OB, which was divided into two arms: G1 (OB and PD) vs. G2 (OB and T2D) according to the ADA definition. Using the mean difference formula with a 95% confidence level, a 1:1 ratio, a total of 36 participants was calculated. Participants were recruited according to the inclusion, exclusion, non-exclusion, and elimination criteria discussed in the following section. Patients were followed up at 0, 3, and 6 months. Before the administration of the medication, baseline anthropometric measurements (weight, height, BMI, waist circumference, total body fat, visceral fat, muscle tissue) and laboratory measurements (glucose, A1c%, lipid profile) were performed. Both arms were administered liraglutide at escalating doses every week (0.6, 1.2, and 1.8 mg) according to the patient’s tolerance in order to reduce the side effects associated with the medication discussed previously. The target dose was 1.8 mg subcutaneously every 24 hours for all members of both treatment arms at 3 weeks.
Inclusion criteria were men and women ≥ 18 years old, with type 2 diabetes, prediabetes and obesity listed in NOM-008-SSA3-2010. Non-inclusion criteria: Pregnancy, type 1 diabetes, people with diseases that alter weight such as: Cushing’s syndrome, poorly replaced hypothyroidism, chronic kidney disease or liver failure; Elevated transaminases (≥5 times ULN) and/or known liver disease, biliary lithiasis and use of hypoglycemic agents that alter weight (SGLT-2 inhibitors, sulfonylureas, insulins, thiazolidinediones, without previous use of GLP-1 analogue). Exclusion criteria: men and women with loss of membership. Elimination criteria: men and women who do not apply the medication correctly and people who do not comply with the preparation for taking the bioimpedance.
The statistical package SPSS® and Microsoft Excel® were used for data analysis.
Univariate analysis: To determine the distribution of the variables, the Komolgorov Smirnov test was performed. For quantitative variables with normal distribution, the results were reported as mean and standard deviation; for quantitative variables with free distribution, as median and interquartile ranges. Bivariate analysis: To demonstrate whether there is a difference in the decrease in VAT between both groups (OB and PD vs. OB and DT2) in the variables with normal distribution, the Student T test was performed and in variables with free distribution, the Mann-Whitney U test. For the intragroup or related samples analysis of VAT at 0, 3 and 6 months, a 1-factor ANOVA was performed for variables with normal distribution and Friedman for variables with free distribution. Multivariate analysis: No multivariate study was performed, since no statistical significance was found in VAT between both groups (OB and PD vs. OB and DT2).
Bias control: To avoid bias from inadequate assembly, type 2 diabetics were included according to the definition of the ADA criteria: Fasting glucose ≥ 126 mg/dL, A1c% ≥ 6.5%, 2-hour postprandial glucose ≥ 200 mg/dL and Symptoms + Random glucose ≥ 200 mg/dL. Similarly, for the PD arm, the following were established by the ADA: Fasting glucose ≥ 100-125 mg/dL, A1c% ≥5.7-6.4%, 2-hour postprandial glucose ≥ 140-199 mg/dL. Finally, to define people living with OB, they were integrated using BMI according to the guidelines established in the Mexican official standard NOM-008-SSA3-2010 for the comprehensive treatment of overweight and obesity. They were classified as grade 1: 30.0 – 34.9, grade 2: 35- 39.9 and grade 3: ≥40 to 49.9.
Sample maintenance: All patients were referred to psychology, psychiatry and nutrition as part of our hospital protocol for subjects living with obesity to receive dietary guidance and rule out any eating disorder. For sample maintenance, participants were followed up every 3 months.
Quality of the maneuver: To avoid any bias in execution, body fat distribution was measured by bioimpedance according to established international preparation standards: fasting for 2 to 4 hours prior to the measurement, removal of metal objects, no intense physical exercise 8 to 12 hours prior, limbs in abduction and separated from the trunk, use of the electrodes outside of injured areas and prior cleaning of the same with 70° alcohol.
Transfer control: To avoid transfer bias due to side effects of the medications, the sample size was increased to 20% estimated in the permissible range of losses.
Type of analysis: An analysis was performed by protocol.
Ethical considerations: This study was conducted in accordance with the Regulations of the General Health Law, articles 100, 101, 102 and 103; based on the Declaration of Helsinki, this research protocol: Degree of risk according to the General Health Law: this study is considered research with greater than minimum risk. To minimize the side effects of the medication, escalated doses of the medication were performed according to the patient’s tolerance, personalized description of the foods that should be avoided with the use of the medication, feeding techniques allowed in case of significant intolerance to the oral route; as well as emergency data suggestive of pancreatitis (transient abdominal pain in the epigastrium that radiates to the back, fever, nausea, vomiting, tachycardia).
3. Results
Of the 36 participants, 36.1% (n=13) were male and 63.9% (n=23) were female. The mean age was 48.36 ± 10.85 years, 33.3% (n = 12) had grade 1 obesity, 15.0% (n = 15) grade 2 obesity and 9% (n = 9) grade 3 obesity. Regarding anthropometric measurements, the average weight was 99.28 ± 19.39 kilos, height 1.65 ± 0.08 meters, waist circumference 115.75 ± 12.72 cm, total body fat 43.90 ± 9.76%, muscle 24.72 ± 4.49% and visceral fat 14.5 (IQR 8.0-30.0). Regarding the laboratory parameters, the median glucose was 6.25 mmol/L (IQR 3.55 – 16.44)), glycated hemoglobin 6.05% (IQR 4.9-12.3), triglycerides 1.90 mmol/L (IQR 0.80 – 6.89)), high-density cholesterol 1.03 mmol/L (IQR 0.71 – 1.66) the average low-density cholesterol 2.58 ± 0.82 mmol/L and total cholesterol 44.30 ± 11.01 mmol/L; being statistically significant the male sex, glucose and glycated hemoglobin with a p 0.053, 0.000 and 0.0002 respectively; As specified in Table 1.
In G1 (OB and PD) 38.9% (n=7) were male, 61.1% (n=11) female, average age 48.36 ± 10.85 years, 38.9% (n=7) grade 1 obesity, 16.67% (n=3) grade 2 obesity and 4.44% (n=8) grade 3 obesity. In anthropometric measurements, mean height was 1.64 ± 0.08 meters, weight 105.21 ± 20.94 kilos, waist circumference 119.22 ±15.20 centimeters, body fat 44.83 ± 8.6%, muscle 24.58 ± 4.16% and median visceral fat of 16.0% (IQR 8.0 – 30.0). Of the biochemical parameters, the median glucose was 5.50 mmol/L (IQR 3.55 – 6.68), glycosylated hemoglobin 5.9% (IQR 5.7 – 6.2), triglycerides 1.76 mmol/L (IQR 0.89 – 6.89), high-density cholesterol 1.01 mmol/L (IQR 0.71 - 1.29), total cholesterol 44.01 ± 10.67 mmol/L and low-density cholesterol 2.30 ± 350.90 mmol/L as specified in Table 2
In G2 (OB and DT2, 33.3% (n = 6) were male, 66.7% (n = 12) were female. The average age was 46.67 ± 12.23 years, 66.6% (n = 12) had < 5 years of diabetes diagnosis, 22.2% (n = 4) 5 to 10 years and 11.1% (n = 2) > 10 years; regarding the degree of OB 29.4% (n = 5) were in OB grade 1, 70.6% (n = 12) OB grade 2 and 5.56% (n = 1) obesity grade 3. Regarding anthropometric measurements, the average height was 1.65 ± 0.08 meters, weight 98.10 ± 11.80 kilos, total body fat 44.67 ± 8.91%, muscle 24.87 ± 4.92% and median visceral fat 12.5 (IQR 9.00-20.00). In the biochemical parameters the median glucose was 7.68 mmol/L (IQR 4.44 – 16.44), glycosylated hemoglobin 7.6% (IQR 5.40 – 12.30), triglycerides 2.33 mmol/L (IQR 0.80 – 6.05) and high-density cholesterol 1.03 mmol/L (IQR 0.78 – 1.66); the total cholesterol 44.65 ± 10.68 mmol/L, low-density cholesterol 2.86 ± 0.65 mmol/L; as observed in the Table 2
Bivariate analysis: When comparing groups G1 (OB and PD) vs. G2 (OB and DT2) at month 0, using Student’s T test and Mann-Whitney U, statistical significance was found in glucose levels (-0.56 mmol/L; p0.002) and A1c% (-0.4%; p0.000; as well as at month 3 glucose (-1.36 mmol/L; p0.001) and A1c% (-0.75%; p0.000); and month 6 glucose (-0.99 mmol/L; p0.012) and A1c% (-1.05%; p0.000). At month 0, month 3 or month 6 no statistically significant differences were found in any anthropometric and bioimpedance parameter. Although significant differences were found in glucose and A1c% between both groups, these are not considered to have clinical value, since the baseline levels of each group were different according to the inclusion criteria.
When comparing intragroups in G1 (OB and PD) statistical significance was found in weight (-3.4 kg; p 0.000), waist circumference (-3.09 cm; p 0.017), glucose (- 0.56 mmol/L; p0.002), A1c% (-0.5%; p0.000) and HDL (+0.004 mmol/L; p0.049). In G2 (OB and DT2) statistical significance was found in weight (-3.78 kg; p0.012), waist circumference (-3.9%; p0.049), glucose (-1.75 mmol/L; p0.002), A1c% (-1.15%; p0.001), HDL-c (+ 0.27 mmol/L; p0.001) and LDL-c (-0.17 mmol/L; p0.004). At month 0, month 3 or month 6, no statistically significant differences were found in any bioimpedance parameter as described in Table 3.
In addition, the main side effects presented by the participants were recorded. The most frequent were gastrointestinal in 27.8%: nausea 19.4%, diarrhea 27.8% and vomiting 8.33%; followed by headache 11.11% and urticaria at the application site 5.55%. One participant was excluded from the study due to documented eating disorder with 1 sentinel event (Vomiting coffee grounds secondary to a Mallory Weiss tear) who was treated in this unit by the gastroenterology and internal medicine service without complications. Upon discharge he was sent to the psychiatry service where he continued to be monitored. A test was performed X2 test to demonstrate difference in means, without statistical significance or relative risk of importance.
4. Discussion
The present study was carried out with the aim of comparing the decrease in visceral adipose tissue in patients with OB and PD vs. OB and T2D, since there is no article in the literature that compares which, group has greater benefit. In both T2D and PD, most of the preceding glucose alterations are usually associated with weight. It is known that the accumulation of TA, mainly visceral, is usually associated with greater lipolysis and less SI due to a greater amount of FFA in the form of TGC [17]. Excess nutrients, physical inactivity, and carbohydrate-rich meals are usually risk factors that increase TAV. Excess TAV produces aberration of different metabolic pathways.
Dephosphorylation and inactivation of the MAP kinase (MAPK) pathway: induces adipose tissue inflammation and Insulin Resistance (IR) by inactivating Insulin Receptor Substrate-1 (IRS1) directly and Peroxisome Proliferator-Activated Receptors ɣ (PPAR-ɣ) indirectly. Aberrant phosphatidylinositol-3 kinase (PI3K-AKT) pathway: PI3K transforms phosphatidylinositol 4,5-bisphosphate (PIP2) into phosphatidylinositol 3, 4, 5-triphosphate (PIP3), which activates phosphoinositide-dependent kinases and AKT that regulate glycogen synthesis, glucose uptake, and adipogenesis. Excess TAV produces a selective inhibition of the PI3K pathway, which eliminates the effect of leptin (suppressing food intake in the hypothalamus). (30,31) In addition, the inhibition of the PI3K/AKT pathway degrades Sort1, a key element in the storage of the Glucose Transporter 4 (GLUT4) decreasing insulin sensitivity [32]. Suppression of the Janus kinase (JAK)/Signal Transducer and Activator of Transcription (STAT) pathway: In people with normal weight, the pathway activates the Proprio melanocortin (POMC) that suppresses food intake. In excess TAV, there is a suppression of the JAK/STAT pathway in the Central Nervous System (CNS) which reduces leptin sensitivity in POMC neurons. In addition, hepatic steatosis is produced by an aberration in the JAK/STAT pathway mediated by growth factors and cytokines, which is associated with IR and increased expression of gluconeogenesis genes [33]. Elevation of Transforming Growth Factor β (TGF-β): This has dual effects on adipogenesis and adipocyte differentiation. It inhibits the differentiation of Mesenchymal Stem Cells (MSC) by phosphorylating and suppressing PPAR-ɣ, increasing the expansion of adipose cells in the bone marrow [34]. Excess TAV presents elevated levels of TGF-β and aerobic exercise suppresses its values [35].
Our study was focused on patients with weight disorders and glucose problems, who presented elevated TAV. Among the results found, 100% of the patients presented clinical manifestations of IR (acanthosis nigricans and presence of skin tags), which were corroborated by the measurement of an Oral Glucose Tolerance Curve (OGTC) of 75 gr, fasting glucose and A1c%. GLP-1 is a hormone that belongs to the group of incretins, which is secreted by enteroendocrine cells type L and α cells of the pancreas and the CNS. Its main function is to decrease apoptosis of β cells and increases neogenesis and proliferation [36]. Its function begins when it binds to its receptor (GLP-1R) of the G protein-coupled type and activates various metabolic pathways.
Initially, through the adenylate cyclase (AC) pathway, it increases cyclic adenosine monophosphate (cAMP), then through Protein Kinase A (PKA) which promotes the exocytosis of insulin vesicles from the β cells of the pancreas, then through the PI3K/mTOR pathway which leads to the activation of Hypoxia Inducible Factor 1α (HIF-1α) which activates glycolysis, Krebs and the increase of intracellular adenosine triphosphate (ATP) [37]. This increase in ATP activates the closure of ATP-dependent potassium channels, increasing calcium channels whose gradient passage depolarizes the cell membrane and increases the cell’s sensitivity to glucose [38]. Normally this pathway is activated 10 minutes after the initial glucose peak, followed by a second sustained releasing phase of up to 60 minutes [37,39]. Inhibits the release of glucagon in pancreatic α cells [36]. Stimulates the Epidermal Growth Factor (EGF) which stimulates Phosphatidylinositol-3 Kinase (PI3K) and this stimulates the growth factors of the b cells [38,39]. Inhibits appetite by stimulating Propio melanocortin (POMC) and the transcriptase regulated by cocaine and amphetamine (CART) responsible for the anoxygenic pathway and suppresses the Agouti Related Neurons (AgRP) and Neuropeptide Y (NPY) responsible for the oxygenic pathway through signaling dependent on ɣ-Aminobutyric Acid (GABA) [30].
The Mexican Obesity Association (SMO) recommends that patients with glucose disorders (carbohydrate intolerance, dyslipidemia) prefer medications that reduce weight and VAT for greater metabolic benefit. The ADA recommends considering the effect of weight when choosing a hypoglycemic therapy in diabetes. There are already approved medications on the market to reduce weight and control glucose in patients with PD and T2D, these targets are focused on the group of medications called GLP-1 analogues. Liraglutide is a GLP-1RA, it was chosen in our study because it is a molecule with high homology with human GLP-1 (97%). It has an arginine-lysine substitution at position 34 and a fatty acid residue at lysine 26; this modification allows the drug’s half-life to be 11 to 13 hours [36,37]. This modification allows to prolong the effects of GLP-1Rs while maintaining insulin production through the mTOR-dependent HIF-1α pathway [40]. It was approved by the FDA up to doses of 1.8 mg in patients with T2D and 3.0 mg in patients with OB. In our study, we used doses of 1.8 mg, which are the maximum allowed by our institution for both arms.
GLP-1RAs are involved in satiety, thermogenesis, blood pressure, reduction of chronic inflammation, and neurogenesis as part of the CNS processes. GLP-1R is found in: Macrophages, lymphocytes, and monocytes that suppress Tumor Necrosis Factor α (TNF-α), interleukin 6 (IL-6), and interleukin 1β (IL-1β), thus decreasing oxidative stress, chronic inflammation, and improving endothelial function [41]. At the brain level, they are found in the cerebral cortex, thalamus, hypothalamus, substantia nigra and cerebellum; crossing the blood-brain barrier and exercising control over satiety and hunger [37]. At the gastrointestinal level, they decrease food consumption, slow down gastric emptying, promote the release of hormones such as leptin and peptide YY [42]. In adipose tissue, they stimulate the WNT/B-catenin pathway that inhibits de novo lipogenesis (genes such as DGAT1, SCD1, Apo B, FABP1 and FOXA1) involved in the synthesis of fatty acids and TGC [43]. In lipid metabolism, they stimulate the cAMP pathway that activates Sirtulin 1 (SIRT1), a Nicotianamine Adenine Dinucleotide (NAD)-dependent deacetylase that increases triacylglycerol lipase, which depletes TGCs in WAT resulting in improved fat accumulation and energy expenditure, and inhibit PPAR-ɣ that decreases proteins associated with lipid metabolism [43,44].
SCALE Diabetes, a 56-week randomized, double-blind, multinational, multicenter, placebo-controlled trial of liraglutide at doses of 1.8 mg and 3.0 mg in people with T2D and overweight or OB treated with ≤2 oral antidiabetic drugs (OADs); a weight reduction of 4.7% and 6.0% was observed with liraglutide at doses of 1.8 mg and 3.0 mg respectively, compared to 2.0% with placebo [45]. In our study, G1 (OB and PD) presented a lower weight loss (-3.4 kg; p 0.000) vs. G2 (OB and T2D) (-3.78 kg; p0.012),
Santilli, F. et.al. in 2017, conducted a longitudinal, randomized, controlled, parallel-arm study in patients with OB treated with metformin and PD or newly diagnosed T2D (< 1 year from diagnosis) to receive liraglutide (dose of 1.8 mg/day) vs. lifestyle changes. They found a greater reduction in VAT in the liraglutide arm (-15.3% vs. -9.0%) with no statistical differences in SBP [14,46]. Neeland, I. et.al in 2021, conducted a randomized, placebo-controlled clinical trial with liraglutide at a dose of 3.0 mg to assess the change in visceral fat and ectopic fat in people with PB and SP without diabetes with high CVR; they found that liraglutide obtained a 2-fold greater reduction in visceral abdominal fat and a six-fold greater reduction in liver fat (−12.49% with liraglutide vs. −1.63% with placebo) [14].
In our study, both arms received liraglutide at 1.8 mg/day. Intragroup comparison showed statistical significance in weight G2 (OB and DT2) (-3.78 kg; p0.012), vs. G1 (OB and DT2) (-3.78 kg; p0.012), waist circumference G1 (OB and DT2) (-3.9 cm; p0.049) vs. G1 (OB and PD) (-3.09 cm; p0.017), glucose G2 (OB and DT2(-1.75 mmol/L; p0.002) vs. G1 (OB and PD (- 0.56 mmol/L; p0.002), A1c% G2 (OB and DT2) (-1.15%; p0.001) vs. G1 (OB and PD) (-0.5%; p0.000) and HDL-c G2 (OB and DT2) (+ 0.27 mmol/L; p0.001) vs. G1 (OB and PD) (+0.004 mmol/L; p0.049), respectively. There was greater weight loss, glycemic control, reduction in A1c% and greater increase in HDL-c for G2 (OB and DT2). At month 0, month 3 or month 6, no statistically significant differences were found in any bioimpedance parameter as described in Table 3.
However, something worth highlighting is the pattern of weight loss in G1 (OB and PD) and G2 (OB and T2D). G1 (OB and PD) had a faster weight loss, metabolic control and decrease in VAT in the first 3 months with a slight rebound in month 3 to 6; unlike G2 (OB and T2D) whose weight loss, metabolic control and decrease in VAT was slower, constant and sustained; as evidenced in Figure 1. It is likely that the benefit has a greater impact on G2 (OB and T2D) because in T2D GLP-1RA improves the expression of GLUT 4 receptors, improves the MAP kinase pathway, decreases TGF-β, reactivates the PPAR-ɣ pathway, decreases chronic inflammation by inhibiting TNF-α, IL-6 and IL-1β and reactivates appetite inhibition through POMC which are altered in people living with diabetes. Among the weaknesses of this study, there is a different visceral fat in the baseline populations at the time of the start of the study and the intermittence of the medication in the last 2 months of the follow-up due to governmental reasons (this occurred in less than 10% of the population, on average from 15 to 45 days), which can bias the final measurements at 6 months of the study. Finally, controlled studies with a longer follow-up time are suggested to demonstrate the rebound effect and the long-term benefits of the medication.
5. Conclusions
Treatment with liraglutide offers benefits to both G1 (OB and PD) and G2 (OB and T2D) populations, since this drug is a GLP-1RA. In our study, there was no statistically significant difference in anthropometric measurements (weight, height, BMI) and bioimpedance (visceral adipose tissue, subcutaneous adipose tissue and muscle) when comparing both treatment arms, G1 (OB and PD) vs. G2 (OB and T2D). However, when making intragroup comparisons; in G1 (OB and PD) and G2 (OB and T2D) benefits were observed in weight loss, waist circumference, metabolic control (glucose, A1c%, HDL-c and LDL-c) with greater benefit in G2 (OB and T2D). However, more long-term studies are needed to assess the biochemical and anthropometric effects.
Conflicts of Interest
The authors declare no conflicts of interest.
References
- Obesity and Overweight. Available online: https://www.who.int/es/news-room/fact-sheets/detail/obesity-and-overweight (accessed on 30 September 2024).
- Diabetes [Internet]. [cited on 30 September 2024]. Available at: https://www.who.int/es/news-room/fact-sheets/detail/diabetes.
- Barquera, S.; Hernández-Barrera, L.; Trejo-Valdivia, B.; Shamah, T.; Campos-Nonato, I.; Rivera-Dommarco, J. [Obesity in Mexico, prevalence and trends in adults. Ensanut 2018-19]. Salud Publica Mex. 2020, 62, 682–692. [Google Scholar] [CrossRef]
- Bentham, J.; Di Cesare, M.; Bilano, V.; Bixby, H.; Zhou, B.; Stevens, G.A.; et al. Worldwide trends in body-mass index, underweight, overweight, and obesity from 1975 to 2016: a pooled analysis of 2416 population-based measurement studies in 128 9 million children, adolescents, and adults. Lancet 2017, 390, 2627–2642. [Google Scholar]
- Obesity [Internet]. [cited 30 Sep 2024]. Available at: https://www.who.int/health-topics/obesity#tab=tab_1.
- International Diabetes Federation. IDF Diabetes Atlas Tenth Edition 2021. Available online: https://diabetesatlas.org/ (accessed on 30 September 2024).
- Fujishima, Y.; Maeda, N.; Inoue, K.; Kashine, S.; Nishizawa, H.; Hirata, A.; et al. Efficacy of liraglutide, a glucagon-like peptide-1 (GLP-1) analogue, on body weight, eating behavior, and glycemic control, in Japanese obese type 2 diabetes. Cardiovasc Diabetol [Internet]. 14 September 2012 [cited 30 September 2024];11. Available at: https://pubmed.ncbi.nlm.nih.gov/22973968/.
- American Diabetes Association. Standards of Care in Diabetes—2023 Abridged for Primary Care Providers. Clin. Diabetes 2023, 41, 4–31. [Google Scholar] [CrossRef]
- Prediabetes: Your chance to prevent type 2 diabetes | Diabetes | CDC [Internet]. [cited September 30, 2024]. Available at: https://www.cdc.gov/diabetes/prevention-type-2/prediabetes-your-chance-to-prevent-type-2-diabetes.html.
- CDC Centers for Disease Control and Prevention. CDC 24/7 Saving Lives. Protecting PeopleTM. The National Diabetes Statistics Report, 2020. Estimates of Diabetes and Its Burden in the United States. Available at: URL: https://www.cdc.gov/diabetes/resources/statistics-report.html - Google Search [Internet]. [cited 30 September 2024]. Available at: https://www.google.com/search?q=10.+CDC+Centers+for+Control+and+Prevenci%C3%B3n+of+Diseases.+CDC+24%2F7+We save+lives.+We protect+the+peopleTM.+The+National+State+Report%C3%ADsticas+of+Diabet es%2C+2020.+Estimates+of+diabetes+and+its+burden+in+the+United States.+Available+at%3A+URL%3A+https% 3A%2F%2Fwww.cdc.gov%2Fdiabetes%2Fspanish%2Fresources%2Fstatistics-report.html&oq=10.%09CDC+Centers+for+ Disease+Control+and+Prevention.+CDC+24%2F7+We+Save+Lives.+We+Protect+PeopleTM.+The+2020+National+Diabetes+Statistics+Report.+Estimates+of+Diabetes+and+Its+Burden+in+the+United States.+Available+at%3A+URL%3A+https%3A%2F%2Fwww.cdc.gov%2Fdiabetes%2Fspanish%2Fresources%2Fstatistics-report.html&gs_lcrp=EgZjaHJvbWUyBggAEEUYOdIBBzU0MGowajSoAgCwAgE&sourceid=chrome&ie=UTF-8.
- González-Gallegos, N.; Valadez-Figueroa, I.; Morales-Sánchez, A.; Romero, N.A.R. UNDERDIAGNOSIS OF DIABETES AND PREDIABETES IN A RURAL POPULATION. RESPYN Public Health and Nutrition Journal 2016, 15, 9–13. [Google Scholar]
- Zhang, Y.; Dall, T.M.; Chen, Y.; Baldwin, A.; Yang, W.; Mann, S.; Moore, V.; Le Nestour, E.; Quick, W.W. Medical Cost Associated with Prediabetes. Popul. Heal. Manag. 2009, 12, 157–163. [Google Scholar] [CrossRef]
- Gil, A.; Olza, J.; Gil-Campos, M.; Gomez-Llorente, C.; Aguilera, C.M. Is adipose tissue metabolically different at different sites? Int J Pediatr Obes 2011, 6 (SUPPL. S1), 13–20. [Google Scholar] [CrossRef] [PubMed]
- Neeland, I.J.; Marso, S.P.; Ayers, C.R.; Lewis, B.; Oslica, R.; Francis, W.; et al. Effects of liraglutide on visceral and ectopic fat in adults with overweight and obesity at high cardiovascular risk: a randomized, double-blind, placebo-controlled, clinical trial. Lancet Diabetes Endocrinol. 2021, 9, 595–605. [Google Scholar] [CrossRef]
- Rosenwald, M.; Wolfrum, C. The origin and definition of brite versus white and classical brown adipocytes. Adipocyte 2013, 3, 4–9. [Google Scholar] [CrossRef]
- Biondi, G.; Marrano, N.; Borrelli, A.; Rella, M.; Palma, G.; Calderoni, I.; Siciliano, E.; Lops, P.; Giorgino, F.; Natalicchio, A. Adipose Tissue Secretion Pattern Influences β-Cell Wellness in the Transition from Obesity to Type 2 Diabetes. Int. J. Mol. Sci. 2022, 23, 5522. [Google Scholar] [CrossRef]
- Wajchenberg, B.L.; Giannella-Neto, D.; da Silva, M.E.; Santos, R.F. Depot-Specific Hormonal Characteristics of Subcutaneous and Visceral Adipose Tissue and their Relation to the Metabolic Syndrome. Horm. Metab. Res. 2002, 34, 616–621. [Google Scholar] [CrossRef]
- Andalusian Center for Sports Medicine Volume, C.D.E. Sports Medicine. Rev Andal Med Deporte 2011, 4, 167–174. [Google Scholar]
- Archivos de Medicina del Deporte - “Methods for assessing body composition: an updated review of description, application, advantages and disadvantages” [Internet]. [cited 30 September 2024]. Available at: https://archivosdemedicinadeldeporte.com/articulo/es/105/2001/1310/.
- Quesada Leyva, L.; Cira Cecilia León Ramentol, D.; Betancourt Bethencourt, J.; Nicolau Pestana, E. Theoretical and practical facts about health electric bioimpedance.
- Rodón Ortega, A.; Vallejo Castillo, F.J.; García Falcón, M.E. Nutritional assessment using impedance techniques. Advantages and disadvantages of nutritional eating disorders. Eating disorders, ISSN-e 1699-7611, No 19, 2014, pp 2090-2114 [Internet]. 2014 [cited September 30, 2024];19(19):2090–114. Available at: https://dialnet.unirioja.es/servlet/articulo?codigo=6250754&info=resumen&idioma=ENG.
- Meijssen, S.; Cabezas, M.C.; Ballieux, C.G.M.; Derksen, R.J.; Bilecen, S.; Erkelens, D.W. Insulin Mediated Inhibition of Hormone Sensitive Lipase Activityin Vivoin Relation to Endogenous Catecholamines in Healthy Subjects. J. Clin. Endocrinol. Metab. 2001, 86, 4193–4197. [Google Scholar] [CrossRef]
- Cantley, J. The control of insulin secretion by adipokines: current evidence for adipocyte-beta cell endocrine signalling in metabolic homeostasis. Mamm. Genome 2014, 25, 442–454. [Google Scholar] [CrossRef]
- Garvey, W.T.; Birkenfeld, A.L.; Dicker, D.; Mingrone, G.; Pedersen, S.D.; Satylganova, A.; Skovgaard, D.; Sugimoto, D.; Jensen, C.; Mosenzon, O. Efficacy and Safety of Liraglutide 3.0 mg in Individuals With Overweight or Obesity and Type 2 Diabetes Treated With Basal Insulin: The SCALE Insulin Randomized Controlled Trial. Diabetes Care 2020, 43, 1085–1093. [Google Scholar] [CrossRef]
- Santilli, F.; Simeone, P.G.; Guagnano, M.T.; Leo, M.; Maccarone, M.T.; Di Castelnuovo, A.; et al. Effects of Liraglutide on Weight Loss, Fat Distribution, and β-Cell Function in Obese Subjects With Prediabetes or Early Type 2 Diabetes. Diabetes Care 2017, 40, 1556–1564. [Google Scholar] [CrossRef]
- Vendrell, J.; El Bekay, R.; Peral, B.; Garcia-Fuentes, E.; Megia, A.; Macías-González, M.; Fernández Real, J.; Jiménez-Gómez, Y.; Escoté, X.; Pachón, G.; et al. Study of the Potential Association of Adipose Tissue GLP-1 Receptor with Obesity and Insulin Resistance. Endocrinology 2011, 152, 4072–4079. [Google Scholar] [CrossRef]
- Cornu, M.; Yang, J.Y.; Jaccard, E.; Poussin, C.; Widmann, C.; Thorens, B. Glucagon-Like Peptide-1 Protects β-Cells Against Apoptosis by Increasing the Activity of an Igf-2/Igf-1 Receptor Autocrine Loop. Diabetes 2009, 58, 1816. [Google Scholar]
- Davies, M.J.; Bergenstal, R.; Bode, B.; Kushner, R.F.; Lewin, A.; Skjøth, T.V.; et al. Efficacy of Liraglutide for Weight Loss Among Patients With Type 2 Diabetes: The SCALE Diabetes Randomized Clinical Trial. JAMA 2015, 314, 687–699. [Google Scholar]
- Overweight and obesity, risk factors for developing diabetes | Ministry of Health | Government | gob.mx [Internet]. [cited 2024-09-30]. Available at: https://www.gob.mx/salud/es/articulos/sobrepeso-y-obesidad-factores-de-riesgos-para-desarrollar-diabetes?idiom=es.
- Huang, R.; Ding, X.; Fu, H.; Cai, Q. Potential mechanisms of sleeve gastrectomy for reducing weight and improving metabolism in patients with obesity. Surg. Obes. Relat. Dis. 2019, 15, 1861–1871. [Google Scholar] [CrossRef]
- Friedrichsen, M.; Poulsen, P.; Richter, E.A.; Hansen, B.F.; Birk, J.B.; Ribel-Madsen, R.; Stender-Petersen, K.; Nilsson, E.; Beck-Nielsen, H.; Vaag, A.; et al. Differential aetiology and impact of phosphoinositide 3-kinase (PI3K) and Akt signalling in skeletal muscle on in vivo insulin action. Diabetologia 2010, 53, 1998–2007. [Google Scholar] [CrossRef]
- Zhong, X.; Ke, C.; Cai, Z.; Wu, H.; Ye, Y.; Liang, X.; Yu, L.; Jiang, S.; Shen, J.; Wang, L.; et al. LNK deficiency decreases obesity-induced insulin resistance by regulating GLUT4 through the PI3K-Akt-AS160 pathway in adipose tissue. Aging 2020, 12, 17150–17166. [Google Scholar] [CrossRef]
- Chen, T.; Zhang, Y.; Liu, Y.; Zhu, D.; Yu, J.; Li, G.; Sun, Z.; Wang, W.; Jiang, H.; Hong, Z. MiR-27a promotes insulin resistance and mediates glucose metabolism by targeting PPAR-γ-mediated PI3K/AKT signaling. Aging 2019, 11, 7510–7524. [Google Scholar] [CrossRef] [PubMed]
- Roh, H.C.; Kumari, M.; Taleb, S.; Tenen, D.; Jacobs, C.; Lyubetskaya, A.; Tsai, L.T.-Y.; Rosen, E.D. Adipocytes fail to maintain cellular identity during obesity due to reduced PPARγ activity and elevated TGFβ-SMAD signaling. Mol. Metab. 2020, 42, 101086. [Google Scholar] [CrossRef] [PubMed]
- Pfeiffer, A.; Middelberg-Bisping, K.; Drewes, C.; Schatz, H. Elevated Plasma Levels of Transforming Growth Factor-β1 in NIDDM. Diabetes Care 1996, 19, 1113–1117. [Google Scholar] [CrossRef]
- de Graaf, C.; Donnelly, D.; Wootten, D.; Lau, J.; Sexton, P.M.; Miller, L.J.; Ahn, J.-M.; Liao, J.; Fletcher, M.M.; Yang, D.; et al. Glucagon-Like Peptide-1 and Its Class B G Protein–Coupled Receptors: A Long March to Therapeutic Successes. Pharmacol. Rev. 2016, 68, 954–1013. [Google Scholar] [CrossRef]
- Rowlands, J.; Heng, J.; Newsholme, P.; Carlessi, R. Pleiotropic Effects of GLP-1 and Analogs on Cell Signaling, Metabolism, and Function. Front. Endocrinol. 2018, 9, 672. [Google Scholar] [CrossRef]
- Peyot, M.-L.; Gray, J.P.; Lamontagne, J.; Smith, P.J.S.; Holz, G.G.; Madiraju, S.R.M.; Prentki, M.; Heart, E. Glucagon-Like Peptide-1 Induced Signaling and Insulin Secretion Do Not Drive Fuel and Energy Metabolism in Primary Rodent Pancreatic β-Cells. PLOS ONE 2009, 4, e6221. [Google Scholar] [CrossRef]
- Carlessi, R.; Chen, Y.; Rowlands, J.; Cruzat, V.F.; Keane, K.N.; Egan, L.; Mamotte, C.; Stokes, R.; Gunton, J.E.; de Bittencourt, P.I.H.; et al. GLP-1 receptor signalling promotes β-cell glucose metabolism via mTOR-dependent HIF-1α activation. Sci. Rep. 2017, 7, 1–13. [Google Scholar] [CrossRef]
- Knudsen, L.B.; Lau, J. The Discovery and Development of Liraglutide and Semaglutide. Front. Endocrinol. 2019, 10, 155. [Google Scholar] [CrossRef]
- Alharbi, S.H. Anti-inflammatory role of glucagon-like peptide 1 receptor agonists and its clinical implications. Ther. Adv. Endocrinol. Metab. 2024, 15. [Google Scholar] [CrossRef]
- Temple, N.J. The Origins of the Obesity Epidemic in the USA-Lessons for Today. Nutrients 2022, 14. [Google Scholar] [CrossRef]
- Wen, X.; Zhang, B.; Wu, B.; Xiao, H.; Li, Z.; Li, R.; Xu, X.; Li, T. Signaling pathways in obesity: mechanisms and therapeutic interventions. Signal Transduct. Target. Ther. 2022, 7, 1–31. [Google Scholar] [CrossRef]
- Xu, F.; Lin, B.; Zheng, X.; Chen, Z.; Cao, H.; Xu, H.; Liang, H.; Weng, J. GLP-1 receptor agonist promotes brown remodelling in mouse white adipose tissue through SIRT1. Diabetologia 2016, 59, 1059–1069. [Google Scholar] [CrossRef]
- Davies MJ, Bergenstal R, Bode B, Kushner RF, Lewin A, Skjøth TV, et al. Efficacy of Liraglutide for Weight Loss Among Patients With Type 2 Diabetes: The SCALE Diabetes Randomized Clinical Trial. JAMA [Internet]. el 18 de agosto de 2015 [citado el 29 de agosto de 2022];314(7):687–99. Disponible en: https://jamanetwork.com/journals/jama/fullarticle/2428956.
- Santilli, F.; Simeone, P.G.; Guagnano, M.T.; Leo, M.; Maccarone, M.T.; Di Castelnuovo, A.; et al. Effects of Liraglutide on Weight Loss, Fat Distribution, and β-Cell Function in Obese Subjects With Prediabetes or Early Type 2 Diabetes. Diabetes Care 2017, 40, 1556–1564. [Google Scholar]
Figure 1.
Graphs of anthropometric changes in patients in G1 (OB and PB) vs. G2 (OB and DT2) at month 0, month 3 and month 6 treated with liraglutide 1.8 mg/day.
Figure 1.
Graphs of anthropometric changes in patients in G1 (OB and PB) vs. G2 (OB and DT2) at month 0, month 3 and month 6 treated with liraglutide 1.8 mg/day.
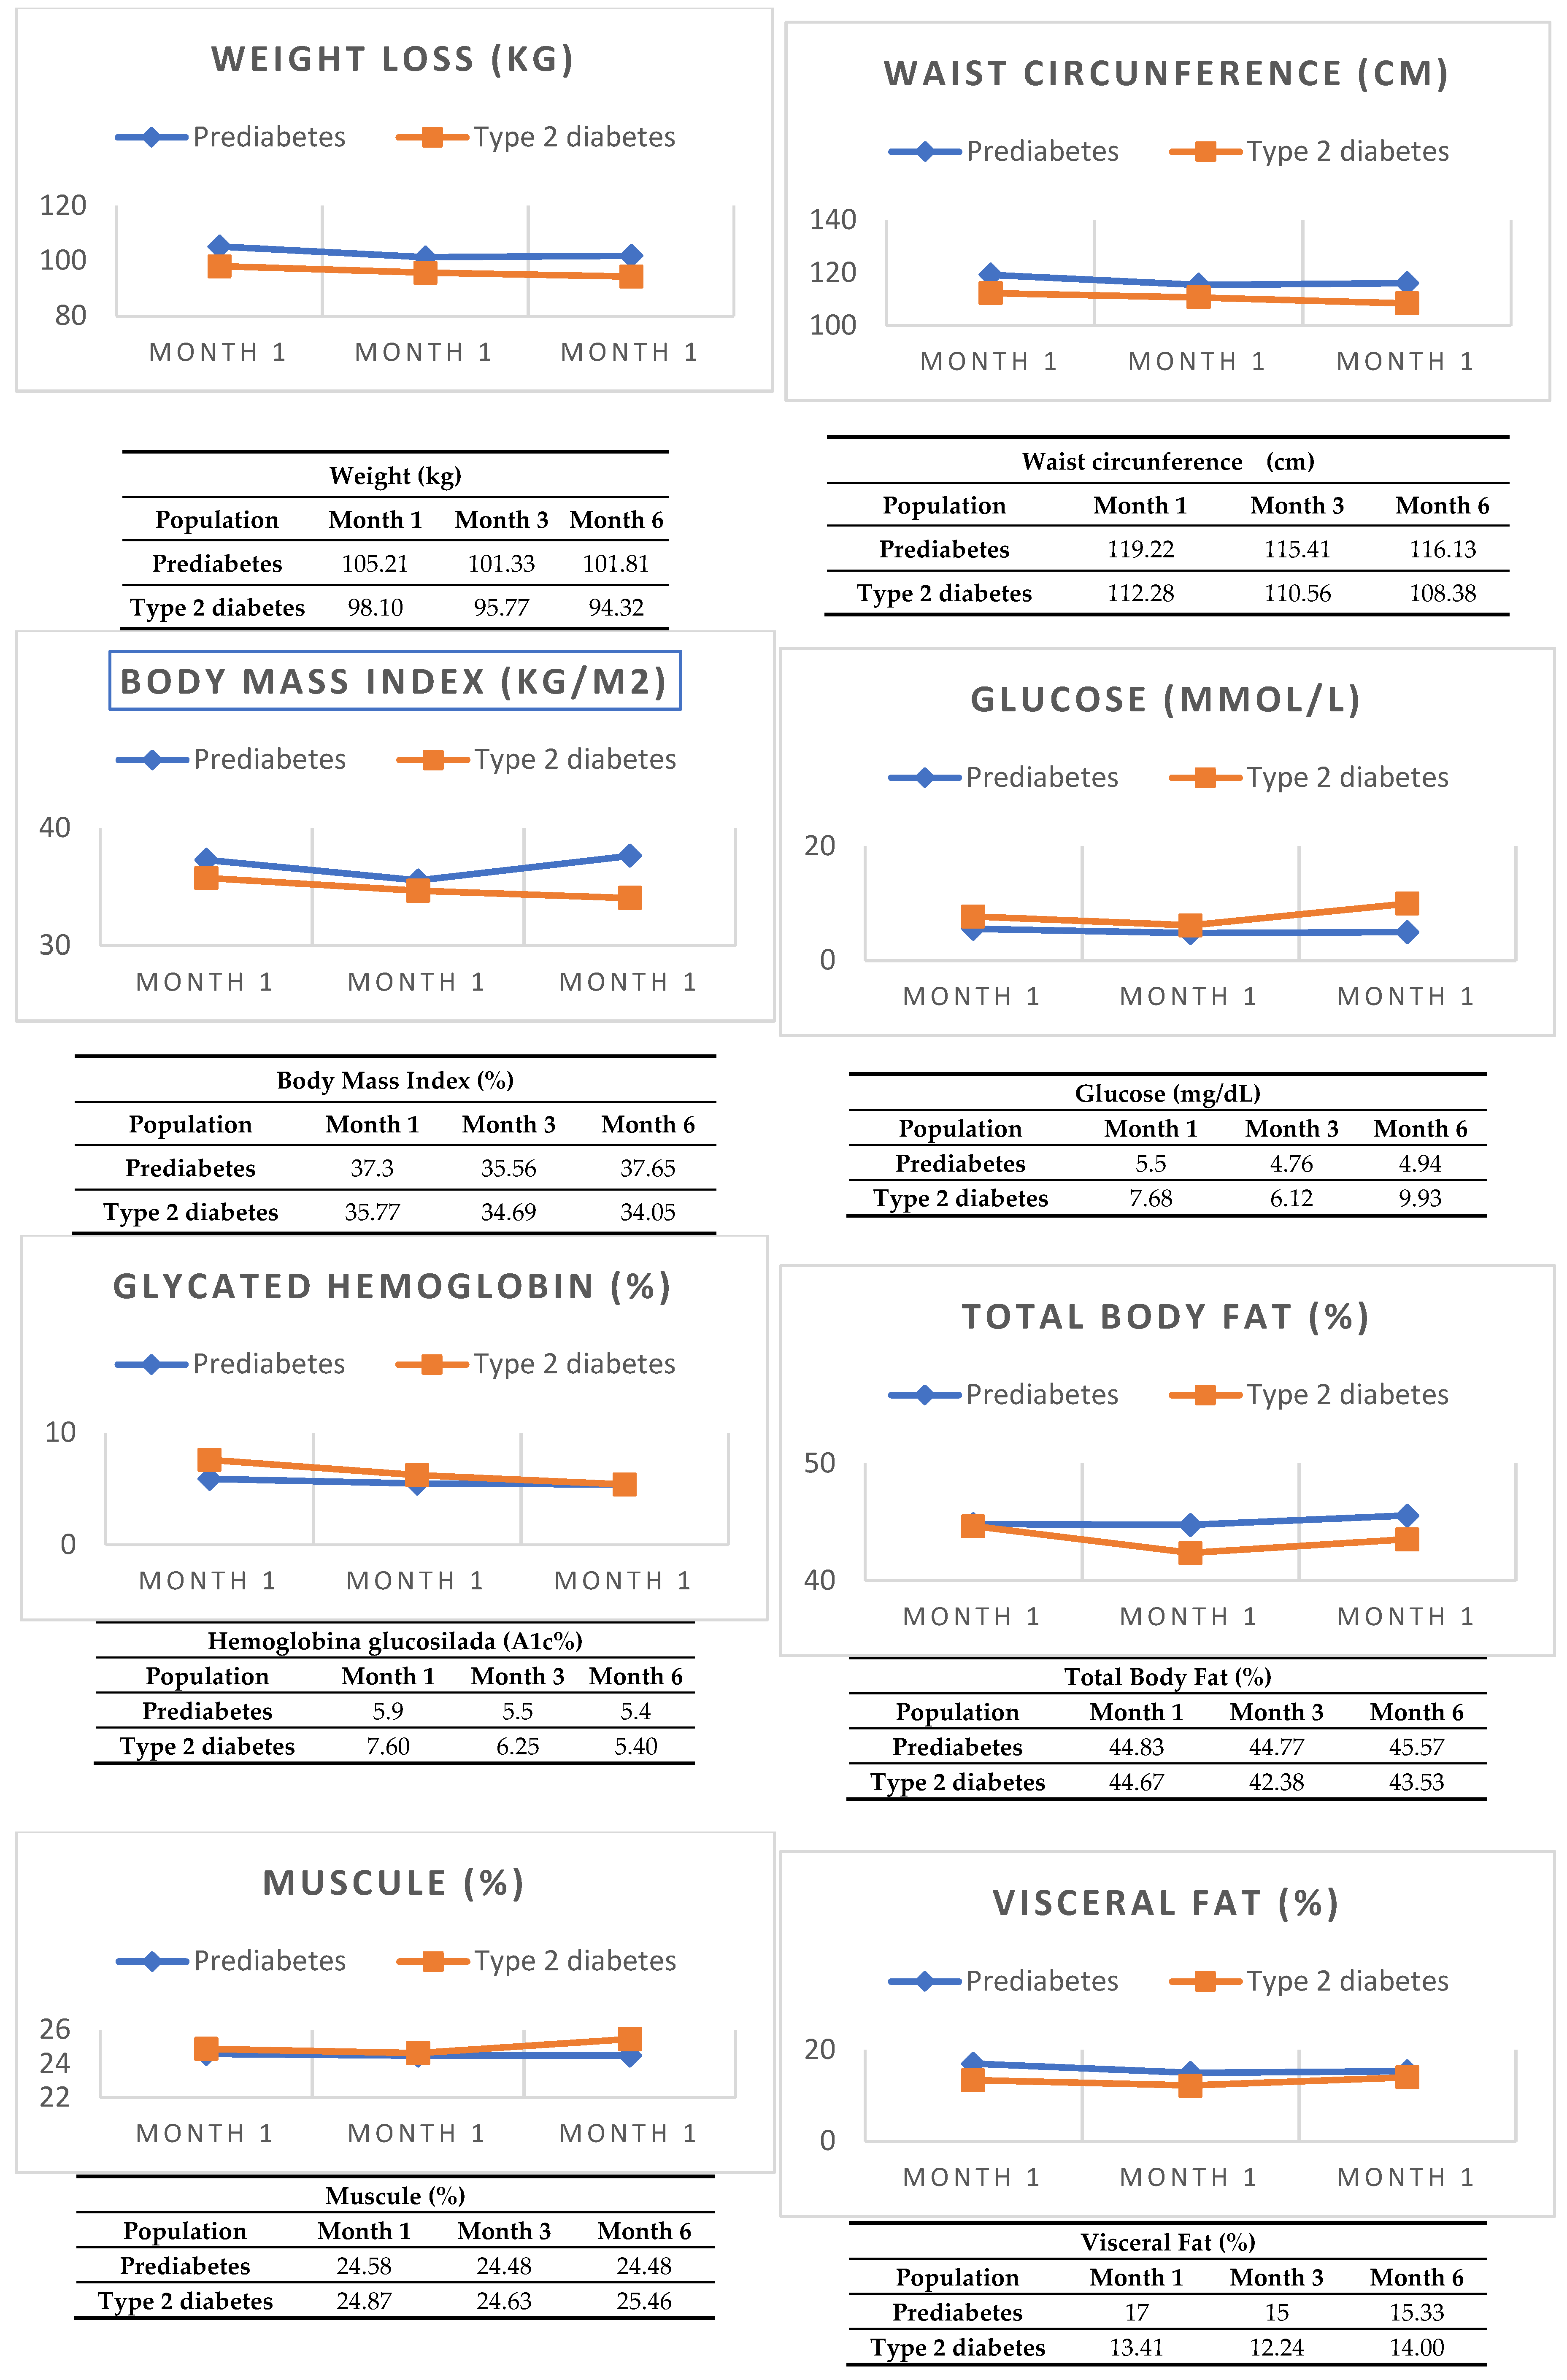

Table 1.
Sociodemographic, clinical and laboratory characteristics of the population.
| Variable | Total n = 36 |
|---|---|
| Sociodemographic variables | |
| Age, years1 Sex Men, n (%) Women, n (%) |
48.36 ± 10.85 13 (36.1%) 23 (63.9%) |
| Anthropometry | |
| Height, mts1 Weight, kg1 Waist circumference, cm1 BMI, kg/m2 Grade 1 obesity (30-34.9) Grade 2 obesity (35.0-39.9) Grade 3 obesity (>40) |
1.65 ± 0.08 99.28 ± 19.39 115.75 ± 12.72 12 (33.3%) 15.0 (41.7%) 9.0 (25.0 %) |
| Bioimpedance | |
| Body fat, %1 Muscle, %1 Visceral fat, %1 |
43.90 ± 9.76 24.72 ± 4.49 15.20 ± 5.91 |
| Laboratory | |
| Glucose, mmol/L2 Glycated hemoglobin (A1c), %2 Cholesterol, mmol/L1 Triglycerides, mmol/L2 High-density lipoprotein (HDL) cholesterol, mmol/L2 Low-density lipoprotein (LDL) cholesterol, mmol/L1 |
6.25(3.55– 16.44) 6.05 (5.7 – 12.3) 44.30 ± 11.01 1.90 (0.80 – 6.89) 1.03 (0.71 – 1.66) 2.58 ± 0.82 |
The information is presented in frequency (percentage), otherwise it is indicated as 1 mean ± standard deviation or 2 median or interquartile range, according to the distribution estimated with the Komolgorov-Smirnov test.
Table 2.
Sociodemographic, clinical and laboratory characteristics by intervention group.
| Variable | Total n = 36 |
Obesity and Prediabetes n = 18 |
Obesity and Type 2 Diabetes n = 18 |
p |
|---|---|---|---|---|
| Sociodemographic variables | ||||
| Age, years1 Sex 2 Men, n (%) Women, n (%) Tiempo de evolución de diabetes ¥ 2 < 5 años 5 a 10 años > 10 años |
48.36 ± 10.85 13.00 (36.1%) 23.00 (63.9%) |
50.06 ± 9.32 7.00 (38.9%) 11.0 (61.1%) |
46.67 ± 12.23 6.00 (33.3%) 12.0 (66.7%) 12.00 (66.6%) 4.00 (22.2%) 2.00 (11.1%) |
0.356 ᵻ 0.053≠ 0.968≠ |
| Anthropometry | ||||
| Height, m, mts1 Weight, kg1 Waist circumference, cm1 BMI, kg/m2 Grade 1 obesity (30-34.9) Grade 2 obesity (35.0-39.9) Grade 3 obesity (>40) |
1.65 ± 0.08 99.28 ± 19.39 115.75 ± 12.72 12 (33.3%) 15.0 (41.7%) 9.0 (25.0 %) |
1.64 ± 0.08 105.21 ± 20.94 119.22 ± 15.20 7.0 (38.9%) 3.0 (16.67%) 8.0 (4.44%) |
1.65 ± 0.08 98.10 ± 11.80 112.28 ± 8.76 5.0 (29.4%) 12.0 (70.6%) 1 (5.56%) |
0.582 ᵻ 0.280 ᵻ 0.102 ᵻ 0.222≠ |
| Bioimpedance | ||||
| Body fat, %1 Muscle, %1 Visceral fat, %1 |
43.90 ± 9.76 24.72 ± 4.49 15.20 ± 5.91 |
44.83 ± 8.60 24.58 ± 4.16 17.00 ±7.18 |
44.67 ± 8.91 24.87 ±4.92 13.41 ± 3.69 |
0.956 ᵻ 0.850 ᵻ 0.009 ᵻ |
| Laboratory | ||||
| Glucose , mmol/L2 Glycated hemoglobin (A1c), %2 Cholesterol , mmol/L1 Triglycerides, mmol/L2 High-density lipoprotein (HDL) cholesterol, mmol/L2 Low-density lipoprotein (LDL) cholesterol, mg/dL1 |
6.25(3.55– 16.44) 6.05 (4.9 – 12.3) 44.30 ± 11.01 1.90 (0.80 – 6.89) 1.03 (0.71 – 1.66) 2.58 ± 0.82 |
5.5(3.55– 6.68) 5.9 (5.7 – 6.20) 44.01 ± 10.67 1.76 (0.98 - 6.89) 1.01 (0.71 – 1.29) 2.30 ± 0.90 |
7.68(4.44- 16.44) 7.60 (5.40 – 12.30) 44.65 ± 10.68 2.33 (0.80 - 6.05) 1.03 (0.78– 1.66) 2.86 ± 0.65 |
0.000*§ 0.002*§ 0.870 ᵻ 0.401§ 0.407§ 0.042* ᵻ |
The information is presented in frequency (percentage), otherwise it is indicated as 1 mean ± standard deviation or 2 median (interquartile range), according to the distribution estimated with the Komolgorov-Smirnov test. The ≠Chi-square test was used for dichotomous variables; ᵻ: Student’s T test for the difference in means in quantitative variables with a normal distribution; §: Mann-Whitney U test for the difference in means in quantitative variables with a free distribution, Kruskal-Wallis for ordinal qualitative variables. *Significance is shown in bold and was set at a p value <0.05.
Table 3.
Anthropometric and biochemical changes in the Obesity and Prediabetes group vs. Obesity and type 2 diabetes treated with liraglutide 1.8 mg subcutaneously every 24 hours.
Table 3.
Anthropometric and biochemical changes in the Obesity and Prediabetes group vs. Obesity and type 2 diabetes treated with liraglutide 1.8 mg subcutaneously every 24 hours.
| Analysis of unrelated samples (between groups) | |||||||||||
|
Variables |
Month 0 n = 36 |
Month 3 n = 36 |
Month 6 n = 36 |
||||||||
| Obesity and Prediabetes n=18 |
Obesity and Type 2 Diabetes n=18 |
p |
Obesity and Prediabetes n=18 |
Obesity and Type 2 Diabetes n=18 |
p |
Obesity and Prediabetes n=18 |
Obesity and Type 2 Diabetes n=18 |
P | |||
| Antropometría | |||||||||||
| Weight, kg1 Waist circumference, cm1 BMI, kg/m2 2 |
105.21 ± 20.94 119.22 ± 15.20 37.30 (30.46 – 54.83) |
98.10 ± 11.80 112.28 ± 8.76 35.77 (30.10 – 42.17) |
0.226 0.098 0.401 |
101.33 ± 22.31 115.41 ± 16.33 35.56 (28.08 – 53.61) |
95.77 ± 12.28 110.56 ±9.57 34.69 (29.51 – 41.93) |
0.352 ᵻ 0.273 ᵻ 0.673§ |
101.81 ± 23.89 116.13 ± 17.64 37.65 (27.47 – 54.53) |
94.32 ± 12.30 108.38 ±8.90 34.05 (29.51 – 41.93) |
0.269ᵻ 0.129 ᵻ 0.573§ |
||
| Bioimpedance | |||||||||||
| Body fat, %1 Muscle, %1 Visceral fat, %1 |
44.83 ± 8.60 24.58 ± 4.16 17.00 ±7.18 |
44.67 ± 8.91 24.87 ± 4.92 13.41 ± 3.69 |
0.910 0.820 0.081 |
44.77 ± 8.81 24.28 ± 3.83 15.00 ± 6.69 |
42.38 ± 10.43 24.63 ± 3.91 12.42 ±3.77 |
0.414 ᵻ 0.760 ᵻ 0.218§ |
45.57 ± 7.82 24.48 ± 3.74 15.33 ± 7.20 |
43.53 ± 6.89 25.46 ± 3.97 14.00 ±4.47 |
0.427 ᵻ 0.463 ᵻ 0.626 ᵻ |
||
| Laboratory | |||||||||||
| Glucose , mg/dL2 Glycated hemoglobin (A1c), %2 Cholesterol , mmol/L1 Triglycerides, mmol/L2 High-density lipoprotein (HDL) cholesterol, mmol/L2 Low-density lipoprotein (LDL) cholesterol, mmol/L1 |
5.50 (3.55 - 6.68) 5.90 (5.70 – 6.30) 44.01 ± 10.67 1.76 (0.98 - 6.89) 1.01 (0.71 – 1.29) 2.30 ± 0.90 |
7.68(4.44- 16.44) 7.60 (5.7 - 12.30) 44.65 ± 10.68 2.33 (0.80 - 6.05) 1.03 (0.78– 1.66) 2.86 ± 0.65 |
0.002* 0.010* 0.949 0.178 0.849 0.105 |
4.76 (4.04 - 6.15) 5.50 (4.9 – 6.0) 43.63± 10.19 1.35 (0.72 - 10.65) - - |
6.12 (3.83 - 9.78) 6.25 ( - 42.20 ± 13.00 1.49 (0.83– 5.00) - - |
0.001* 0.000* 0.715 ᵻ 0.389§ - 0.659 ᵻ |
4.94 (3.99 - 6.21) 5.40 (4.90 – 5.80) 43.57 ± 11.49 1.46 (0.49– 7.58) 1.05 (0.81 – 1.60) 2.01 ± 0.53 |
5.93 (4.13 - 8.24) 6.45 (5.0 – 9.10) 43.06 ± 10.90 1.54 (0.74– 6.04) 1.30 (0.71 – 1-76) 2.69 ± 0.74 |
0.012*§ 0.000*§ 0.541§ 0.925 ᵻ 0.005*§ 0.056 ᵻ |
||
| Analysis of related samples (intragroup) | |||||||||||
|
Variable |
Obesity and Prediabetes n = 18 |
Obesity and Type 2 Diabetes n = 18 |
|||||||||
| Month 0 | Month 3 | Month 6 | p | Month 0 | Month 3 | Month 6 | p | ||||
| Antropometría | |||||||||||
| Weight, kg1 Waist circumference, cm1 BMI, kg/m2 2 |
105.21 ± 20.94 119.22 ± 15.20 37.30 (30.46 – 54.83) |
101.33 ± 22.31 115.41 ± 16.33 35.56 (28.08 – 53.61) |
101.81 ± 23.89 116.13 ± 17.64 37.65 (27.47 – 54.53) |
0.000*€ 0.017*€ 0.002*© |
98.10 ± 11.80 112.28 ± 8.76 37.30 (30.46 – 54.83) |
95.77 ± 12.28 110.56 ±9.57 35.56 (28.08 – 53.61) |
94.32 ± 12.30 108.38 ±8.90 37.65 (27.47 – 54.53) |
0.012*€ 0.049*€ 0.002*© |
|||
| Bioimpedance | |||||||||||
| Body fat, %1 Muscle, %1 Visceral fat, %1 |
44.83 ± 8.60 24.58 ± 4.16 17.00 ±7.18 |
44.77 ± 8.81 24.28 ± 3.83 15.00 ± 6.69 |
44.77 ± 8.81 24.28 ± 3.83 15.00 ± 6.69 |
0.776€ 0.771€ 0.077€ |
44.67 ± 8.91 24.87 ±16.0 13.41 ± 3.69 |
42.38 ± 10.43 24.63 ± 3.91 12.42 ±3.77 |
43.53 ± 6.89 25.46 ± 3.97 14.00 ±4.47 |
0.389€ 0.154€ 0.107€ |
|||
| Laboratory | |||||||||||
| Glucose , mmol/L2 Glycated hemoglobin (A1c), %2 Cholesterol , mmol/L1 Triglycerides, mg/dL2 High-density lipoprotein (HDL) cholesterol, mmol/L2 Low-density lipoprotein (LDL) cholesterol, mmol/L1 |
5.50 (3.55– 6.68) 5.90 (5.70 – 6.30) 44.01 ± 10.67 1.76 (0.98 - 6.89) 1.01 (0.71 – 1.29) 2.30 ± 0.90 |
4.76 (4.04– 6.15) 5.50 (4.9 – 6.0) 43.63± 10.19 1.35 (0.72 - 10.65) - - |
4.94 (3.99– 6.21) 5.40 (4.90 – 5.80) 43.57 ± 11.49 1.46 (0.49– 7.58) 1.05 (0.81 – 1.60) 2.01 ± 0.53 |
0.002*© 0.000*© 0.969€ 0.906© 0.049*ω 0.069 ᵻ |
7.68(4.44- 16.44) 7.60 (5.40– 12.13) 44.65 ± 10.68 2.33 (0.80 - 6.05) 1.03 (0.78– 1.66) 2.86 ± 0.65 |
6.12 (3.83– 9.78) 6.25 (5.5 - 9.5) 42.20 ± 13.00 1.49 (0.83– 5.00) - - |
5.93 (4.13– 8.24) 6.45 (5.0 – 9.10) 43.06 ± 10.90 1.46 (0.49– 7.58) 1.30 (0.71 – 1-76) 2.69 ± 0.74 |
0.002*© 0.001*© 0.556€ 0.141© 0.001* ω 0.004*€ ᵻ |
|||
Unrelated samples analysis: Student’s ᵻ T test was used for the difference in means in quantitative variables with a normal distribution and the Mann-Whitney U test for the difference in means in quantitative variables with a free distribution. Related samples analysis: € ANOVA and Student’s ᵻ T test were used for the difference in means in quantitative variables with a normal distribution of 3 and 2 groups respectively and © Friedman and ω Wilxocon for the difference in means in quantitative variables with a free distribution of 3 and 2 groups respectively. *Significance is shown in bold and was set at a p value <0.05.
Disclaimer/Publisher’s Note: The statements, opinions and data contained in all publications are solely those of the individual author(s) and contributor(s) and not of MDPI and/or the editor(s). MDPI and/or the editor(s) disclaim responsibility for any injury to people or property resulting from any ideas, methods, instructions or products referred to in the content. |
© 2025 by the authors. Licensee MDPI, Basel, Switzerland. This article is an open access article distributed under the terms and conditions of the Creative Commons Attribution (CC BY) license (http://creativecommons.org/licenses/by/4.0/).
Copyright: This open access article is published under a Creative Commons CC BY 4.0 license, which permit the free download, distribution, and reuse, provided that the author and preprint are cited in any reuse.


