
Submitted:
12 September 2025
Posted:
15 September 2025
You are already at the latest version
Abstract
The efficacy of ketogenic diets (KD) in inducing weight loss is well documented, but the changes in peripheral and hepatic insulin sensitivity and their associated effects on fatty acid anabolism remain to be elucidated. The present study examined the impact of a chow diet (CD) versus a one-month KD on peripheral and hepatic insulin sensitivity in male mice with obesity due to two months on a high-fat diet. The subsequent effect of instauration of one-month CD in both subgroups was also investigated. KD mice presented higher weight, serum leptin and high-molecular weight adiponectin levels along with reduced HOMA-IR index. Phosphorylation of STAT3 was increased, while the phosphorylation of insulin receptor, Akt and cAMP response element-binding protein, the activation of ATP citrate lyase and levels of fatty acid synthase, were reduced in KD mice. After instauration of CD in both subgroups, those mice previously fed KD exhibited lower HOMA-IR index and serum and hepatic triglycerides. These findings suggest that KD intervention improves peripheral insulin sensitivity through the reduction in hepatic insulin signaling that inhibits fatty acid anabolism, thereby reducing hepatic triglyceride content.
Keywords:
fatty acid anabolism
; high-fat diet
; insulin signaling
; ketogenic diet
; liver
; leptin
; triglyceride
1. Introduction
Obesity, resulting from an imbalance in energy homeostasis often associated with increased high fat intake, is frequently associated with resistance to the actions of insulin [1] and is one of the factors that most contribute to the appearance of metabolic syndrome [2]. The obesity epidemic has become a major public health problem in recent decades and the pathophysiology of obesity, which underlies its progressive and self-sustaining progression, hampers the development of effective and safe therapies for weight loss. Although understanding the molecular mechanisms that regulate energy intake and homeostasis has allowed the development of effective drugs for weight reduction [3], the use of different nutritional interventions remain the most common therapy for weight loss and obesity-associated comorbidities [4].
Hyperglycemia and hyperlipidemia are risk factors in patients with obesity, as well as a low-grade systemic inflammatory profile [5]. Among the dietary strategies used to control some of these obesity-associated comorbidities is the use of ketogenic diets (KD), mainly composed of fat and protein, with small amounts of carbohydrate. KD decrease serum insulin concentrations, independent of weight loss [6]. This decline in circulating insulin stimulates hepatic lipolysis resulting in the generation of ketone bodies from β-oxidation of fatty acids that are secreted as additional fuel [7]. This diet also affects lipid anabolism, downregulating lipogenic enzyme activity in the liver [8]. However, data on systemic and hepatic inflammation in response to KD are contradictory [9,10] and the effects of transition from a KD to a normal diet have been scarcely studied [11].
Leptin, which is mainly produced in white adipose tissue, is a pro-inflammatory cytokine and can affect insulin actions. In fact, in the liver leptin has been shown to interfere with insulin signaling, affecting its important actions in this tissue [12]. Hyperleptinemia, which is frequent in obesity, can inhibit Akt activation through increased signal transducer and activator of transcription 3 (STAT3) and suppressor of cytokine signaling 3 (SOCS3) levels [13]. In addition, leptin favors the release of macrophage chemoattractant factors, increasing insulin resistance, augmenting proinflammatory cytokines, and promoting resistance to insulin action [14]. In contrast, deletion of liver-SOCS3 improves hepatic insulin sensitivity and lipogenesis [15]. In fact, insulin plays a crucial role in fatty acid synthesis, modulating activity and levels of key enzymes involved in this process, contributing not only to changes in the serum lipid profile but also in hepatic lipid accumulation, factors that are closely related to inflammation [16].
We hypothesized that intake of a KD can reduce serum and hepatic lipid levels through an inhibition of lipid anabolism in the liver related to a decrease in insulin action, related to cytokine environment. Thus, our aims were to evaluate the effects of one-month of a KD compared to intake of a normal diet in HFD-induced obese mice on peripheral and hepatic insulin sensitivity and its relationship with fatty acid anabolism and inflammatory environment, as well as the effect of an additional period of normal diet intake in both groups of mice on the same parameters.
2. Materials and Methods
2.1. Materials
All reagents were from Merck (Darmstadt, Germany) unless otherwise stated. Antibodies against vinculin were from Thermo Fisher Scientific (Waltham, MA, USA), and long-chain acyl-CoA synthetase (ACSL)1, phosphorylated (p) ATP citrate lyase (ACL) and fatty acid synthase (FASN) from Cell Signaling Technology (Danvers, MA, USA). The Immun-Star Western C kit was from Bio-Rad Laboratories (Hercules, CA, USA). The secondary antibodies conjugated with horseradish peroxidase (HRP) were purchased from Thermo Fisher Scientific.
2.2. Ethical Statement
This study was designed and performed according to the European Communities Council Directive (2010/63/UE) and the Spanish Royal Decree 53/2013 concerning the protection of experimental animals. It was approved by the Ethical Committee of Animal Experimentation of the Hospital Puerta de Hierro of Madrid and the Animal Welfare Organ of the Community of Madrid (PROEX 009.4/24, 12 February 2024). The number of animals used in this study was reduced to the minimum required. Mice were maintained at 22 ± 2 °C with free access to tap water in a stable 12-h light–dark cycle. The study design and reporting of the results adheres to the ARRIVE guidelines (https:// arriveguidelines.org).
2.3. Animals and Diets
Fifty-six six-week-old C57BL/6J male mice were purchased from Envigo RMS Spain (Sant Feliu de Codines, Barcelona, Spain). Upon their arrival, animals were weighed, and 2 mice were randomly placed in each cage. They had free access to standard rodent chow and tap water while being allowed to acclimate to their new environment for one week.
For the study, one group of 21 mice was fed a standard rodent chow diet (CD, 6% Kcal from fat, 17% Kcal from proteins, 77% from carbohydrates, 3.41 kcal/g, Panlab, Barcelona, Spain) during the 2, 3 or 4 months and served as controls (n = 7 per group). Another group of 35 mice received a HFD (62% Kcal from fat, 18% Kcal from proteins, 20% Kcal from carbohydrates, 5.1 kcal/g, LabDiet, Sodispan Research SL, Madrid, Spain) for 2 months. After this period, 7 animals were euthanized (HH) and the rest of animals were subdivided into 2 groups; one received the CD and the other a KD (84% Kcal from fat, 11% Kcal from proteins, 5% Kcal from carbohydrates, 6.4 kcal/g, Altromin, Lage, Germany; n=14 per group). After one month, 7 animals of both groups were euthanized (HHC and HHK, respectively) and the rest of mice were fed with CD, being euthanized one month later (HHCC and HHKC, respectively). Thus, this resulted in eight experimental groups (n = 7 per group): Chow and HH at 2 months; chow, HHC and HHK at 3 months; and chow, HHCC and HHKC at 4 months.
Body weight and food intake were monitored weekly in all groups until the termination of the study. Food intake was monitored by weighing the amount of food remaining of a previously determined quantity, with the pieces that fell into the cages being taken into account. Mean energy efficiency during the entire study was calculated as the weight gained in grams per the total number of calories consumed. Animals were euthanized by decapitation between 8.00 and 9:00 h after a fasting period of 12 h and the whole liver, without removal lipids, was dissected, weighed and prepared for biochemical determinations. Inguinal fat was also dissected and weighed. Peripheral blood was collected and centrifuged at 1800 × g for 10 min at 4°C and serum was aliquoted and frozen at −80°C until processed.
2.4. Glycemia and Serum and Tissue Free Fatty Acid (FFA) and Triglyceride (TG) Levels
Freestyle Optimum Neo glucometer (Abbott, Whitney, UK) was employed for determining serum glucose levels.
Circulating concentrations of FFA and TG were determined by using colorimetric kits (AkrivisBio, Fremont, CA, USA), following the manufacturer’s instructions. To determine the levels in liver, extraction of total lipids was performed following the method of Folch et al. [17], and then measured by using the same kits. The average coefficients of variation were lower than 10%.
2.5. ELISAs
2.5.1. Adiponectin, Insulin and Leptin
The levels of adiponectin in serum were determined by using an ELISA kit from Bio Vendor (Brno, Czech Republic) and insulin and leptin were measured with kits from Merck, following the manufacturer’s recommendations. Homeostatic Model Assessment for Insulin Resistance (HOMA-IR) was calculated according to the equation:
HOMA-IR= [glycemia (mmol/L) x insulin (mU/L)]/22.5
2.5.2. High Molecular Weight (HMW)-Adiponectin
Serum HMW-adiponectin concentrations were measured using an ELISA kit from Fujirebio (Tokyo, Japan) in diluted samples (from 1/50 to 1/500) with assay buffer and determined as indicated by the manufacturer.
2.5.3. Phosphorylation of Insulin Receptor
The solid phase sandwich ELISA was from Assay Solution (Woburn, MA, USA) and detects phosphorylated insulin receptor β. After incubation with lysates of liver, the ligand was bound by the monoclonal antibody in the microplate. The absorbance is proportional to the quantity of insulin receptor phosphorylated. Intra- and inter-assay variation coefficients were lower than 10% in all assays.
2.6. Tissue Homogenization and Protein Quantification
For detection of ACSL1, phosphorylated (p) activating transcription factor 2 (pATF-2), pSer473-Akt, Akt, pATP-CL, pSer133-cAMP response element binding protein (CREB), CREB, FASN, interleukin (IL)-1β, IL-6, p-insulin receptor (p-IR), pThr389-p70 S6 kinase (pThr389p70 S6K), p70 S6K, pSer2448-mammalian target of rapamycin (pSer2448mTOR), mTOR, pSer380-phosphatase and tensin homolog (pSer380PTEN), PTEN, pSer727STAT3, STAT3, tumor necrosis factor (TNF)-α, β-actin, and vinculin, 30 mg of liver of the same lobe in all animals were homogenized on ice in 350 μL of lysis buffer (Merck). The lysates were frozen during 16 h at −80°C. Later, samples were centrifuged at 12,000 × g for 5 min at 4°C and the supernatants kept at -80°C until assayed [18]. Protein levels were measured by the Bradford procedure (Bio-Rad Laboratories).
2.7. Western Blotting
Western blotting was performed as previously described [19]. Twenty µg of protein was resolved on 10% sodium-dodecyl-sulphate-denaturing polyacrylamide gels, transferred to polyvinylidene difluoride membranes, and then incubated with antibodies. Peroxidase activity was detected by using an ECL system (Bio-Rad Laboratories), and the chemiluminescent signal was calculated with ImageQuant Las 4000 Software (GE Healthcare Life Sciences, Barcelona, Spain). Gel-loading variabilities were normalized with vinculin.
2.8. Multiplexed Bead Immunoassays
Phosphorylated levels of ATF-2 and phosphorylated and total levels of Akt, CREB, PTEN, mTOR, p70 S6K and STAT3 in liver, and serum and tissue levels of IL-1β, IL-6 and TNF-α, were measured by multiplexed bead immunoassays (Bio-Rad Laboratories and Merck), as stated [20]. Phosphorylated ATF-2 was normalized with β-actin. Concisely, antibodies coupled to magnetic beads and lysates were incubated overnight at room temperature or 4°C. Subsequently, after washing with a magnetic separation block (Merck), the corresponding antibodies coupled to biotin were added. After incubation for 30 min at room temperature, a streptavidin-phycoerythrin complex was added and incubated during the same-time period. At least 50 beads per analyte were examined in the Bio-Plex suspension array system 200 (Bio-Rad Laboratories). Raw data (median fluorescence intensity, MFI) were evaluated with the Bio-Plex Manager Software 6.2 (Bio-Rad Laboratories).
2.9. Statistical Analysis
Data are summarized as mean ± standard error of the mean (SEM). The analysis of all data was carried out using Student’s t-test for unpaired samples or one-way ANOVAs followed by Bonferroni’s post hoc tests. Linear regression analysis was used to determine the possible relationships between specific parameters. In all analyses p < 0.05 was considered significant. Analyses were performed using Statview software (Statview 5.01, SAS Institute, Cary, NC, USA),
3. Results
3.1. Weight and Caloric Intake Differ Between KD and CD
After two months of HFD there was a significant increase in weight gain and caloric intake (Figure 1A and Figure 1D, respectively). After one month on a CD, obese mice had a decrease in body weight, although there was no difference in caloric intake compared to controls. KD caused an increase in weight with respect to the obese animals fed CD, as well as an increase in caloric intake with respect to the other two experimental groups (Figure 1B and Figure 1E).
3.2. Differences in Weight Gain, Caloric Intake and Energy Efficiency During the Entire Study Period
Total weight gain at the end of the study was increased in mice that received the HFD regardless of subsequently receiving a KD and/or CD or KD, with no differences between these latter two groups (Figure 2A). Caloric intake was augmented in both experimental groups, being higher in those supplemented with KD (Figure 2B), and energy efficiency was reduced with this reaching statistical significance in obese mice receiving a KD (Figure 2C).
3.3. General Characteristics of the Experimental Groups
3.3.1. KD or CD Administration in Obese Mice (3 Months)
We found that the percentage of liver weight was reduced in HHK with respect to CD mice. Percentage of inguinal fat was increased in HHK compared to the other experimental groups. Serum glucose and insulin levels and HOMA-IR were lower in HHK than HHC mice. Circulating leptin levels were increased in HHK with respect to CD and HHC mice. No changes in total adiponectin were detected among the experimental groups, however, high molecular weight (HMW)-adiponectin levels were increased in HHK with respect to the CD and HHC groups (Table 1).
3.3.1. CD Administration to HHC and HHK (4 Months)
The percentage of liver weight was lower in HHKC with respect to HHCC mice. Percentage of inguinal fat depot was increased in HHKC. There were no differences in serum glucose levels, but serum insulin and HOMA-IR index were increased in HHCC compared to CD and HHKC mice. No changes in leptin, adiponectin and HMW-adiponectin were detected (Table 1).
3.4. KD Generates a Better Cytokine Profile than CD in the Circulation, but Not in Liver
At 3 months, no changes in hepatic concentrations of IL-1β or IL-6 were found after obese mice received a CD or KD for one month; however, TNF-α was increased in the liver of KD fed mice (Table 2). After an additional month of the CD or reintroduction of the CD to the KD group for one month, an increase in liver IL-1β was seen in both groups and IL-6 was augmented in mice previously fed with the KD, with TNF-α values no longer being different between groups (Table 2).
Serum IL-1β levels were decreased in HHK compared to HHC with no changes in IL-6. Circulating TNF-α was augmented in HHC compared to CD and HHK. These changes remained after reintroduction of a chow diet in both groups (Table 2).
3.5. KD Reduces Activation and Levels of Enzymes of Fatty Acid Anabolism and Akt-Related Signaling in Obese Mice
When obese mice were put on a CD or KD for one month there was a decrease in the phosphorylation of ATP-CL in the liver, with this decrease being more pronounced with the KD (Figure 3A). No change in ACSL1 was found (Figure 3B), while the KD induced a reduction in FASN levels (Figure 3C).
Phosphorylation of STAT3 was increased in the liver of mice fed a KD (Figure 3D) and phosphorylation of IR and Akt was diminished in the same group of mice (Figure 3E and Figure 3F, respectively). No changes in phosphorylation of any of these parameters were detected in CD-fed obese mice (Figure 3D, Figure 3E and Figure 3F).
3.6. Decreased Hepatic FASN Levels in KD-Fed Mice Are Associated with Changes in Activation of Downstream Akt Signaling
Obese mice fed a KD had increased phosphorylation of PTEN and decreased phosphorylation of mTOR (Figure 4A and Figure 4B, respectively), with no changes in these factors when fed a CD. Both diets decreased p70 S6K phosphorylation (Figure 4C) and only the KD diminished CREB and ATF-2 activation (Figure 4D and Figure 4E, respectively).
3.7. Effect of Reintroduction of a CD to Obese Mice previously Fed a KD on Lipid Anabolism Enzymes and Insulin-Related Signaling
Chow diet administered to the HHK group, as well as continued intake of the CD in the obese group, did not change phosphorylation levels of ATP-CL in the liver (Figure 5A), but reduced ACSL1 in the HHK mice (Figure 5B). Hepatic levels of FASN were reduced in both groups (Figure 5C). Phosphorylation of IR and CREB were decreased in HHCK mice (Figure 5D and Figure 5E, respectively) and ATF-2 activation was diminished in HHCC mice (Figure 5F).
3.8. Changes in Hepatic Insulin Content After CD or KD Intake in Obese Mice and Reintroduction of CD to Both Groups of Mice
Given the existence of changes in factors involved in hepatic insulin signaling, we also analyzed the concentration of this hormone in the liver, as well as the possible correlation with serum concentrations. Hepatic levels were decreased in HHC, with no variation between CD and HHK (Figure 6A). When we studied the effect of reintroduction of CD, we found an increase in HHKC with respect to the other experimental groups (Figure 6C).
3.9. KD Causes a Reduction in Hepatic TG Content
There were no changes in hepatic FFA concentrations in the HHC, HHK, HHCC or HHKC groups (Figure 7A and Figure 7C). Triglyceride content was diminished in HHK mice compared to the CD and HHC (Figure 7B) groups and augmented in HHCC with respect to CD and HHKC (Figure 7D).
Serum levels of FFA and TG were increased in HHK mice with respect to the CD and HHC groups (Figure 7E and Figure 7F, respectively). At the end of the study, the content of FFA was not different between the three experimental groups (Figure 7G) and the hepatic content of TG was increased in HHCC mice, whereas HHKC showed no differences with respect to the CD group (Figure 7H).
4. Discussion
This study was conceived to analyze the possible differential effects of a ketogenic diet versus a normal chow diet, as well as the resumption of a chow diet after exposure to a ketogenic diet, on hepatic and serum triglyceride content in obese male mice, as well as its probable relationship with insulin-related signaling and fatty acid anabolism in the liver. We found that ingestion of the ketogenic diet for one month reduced the hepatic content of triglycerides and that even after the reintroduction of a chow diet for one month they maintained lower serum and hepatic concentrations of triglycerides compared to obese mice that had received the chow diet for two months. Our results suggest that these changes are associated with attenuation of hepatic insulin signaling and a consequent reduction in the activation and levels of enzymes involved in lipid anabolism in the liver.
Obese animals fed the KD consumed more kilocalories per gram of body weight than those on the CD, but weight gain was similar in both groups at the end of the study, showing a lower energy efficiency in mice fed a KD. Although we have used an unrestricted KD, it is known that restricted KDs can be more effective for weight loss, providing metabolic benefits such as muscle mass preservation, lower metabolic efficiency, causing metabolic activation of thermogenesis, and enhancing fat loss, even when restricted KD contain more calories than other controlled diets [21,22]. In addition, KDs have been reported to have lower energy digestibility than diets with a balanced nutrient composition, suggesting a lower efficiency of energy utilization [23].
Ketogenic diets have a high percentage of lipids, and this fat is usually used for energy rather than stored [24]. In our study, an unrestricted KD was used, and we found an increase in both circulating FFA and the percentage of weight inguinal fat, which could explain the hyperleptinemia detected after administration of this diet. Higher circulating leptin levels are associated with increases in activation of its intracellular signaling, such as augmented STAT3 phosphorylation, in mice fed the KD and its activation may augment SOCS3 levels [25]. On the opposite hand, reduction in STAT3 phosphorylation decreases SOCS3 levels and insulin resistance [26], while SOCS3 is a negative regulator of insulin signaling as it is capable of binding to the IR and suppressing insulin-mediated autophosphorylation of the receptor [27].
We found that KD intake reduced circulating insulin levels, as previously reported [28,29]. We found a reduction in hepatic insulin signaling that might be consistent with reduced circulating levels of this hormone. However, hepatic insulin levels in the KD group were not different from those found in the controls, and then increased after being switched to the CD. It is important to denote that hepatic insulin clearance is involved in regulating the homeostatic level of insulin that reaches insulin target tissues, such as the liver itself, to produce appropriate insulin action. Receptor-mediated insulin uptake followed by its degradation is an important mechanism of insulin clearance. Upon its phosphorylation by the IR tyrosine kinase, carcino-embryonic antigen-related cell adhesion molecule 1 (CEACAM1) increases the rate of endocytosis and the targeting to degradation pathways [30]. Thus, the lower phosphorylation of IR found in our study may be related, at least in part, to the increase of hepatic insulin content. In addition, the low-grade hepatic inflammation found in our study, could reduce insulin-degrading enzyme activity [31], maintaining similar hepatic insulin concentrations than controls. although their circulating levels were lower.
How the intake of a KD affects blood glucose, lipid levels, cytokines and insulin sensitivity is still controversial. Some clinical studies have shown a favorable effect on circulating glucose, fatty acid levels and insulin sensitivity [32,33], while others have reported an increase in lipids and proinflammatory markers in subjects with obesity [34]. Here we found a favorable circulating profile of glucose, insulin, and cytokines with elevated levels of HMW-adiponectin and a lower HOMA-IR index in obese mice fed a KD compared to those fed a CD, with this index remaining stable even the mice ingesting the KD were changed to a CD. This is in agreement with studies showing that the administration of ketone bodies reduces circulating glucose levels [35] and that KD improves various metabolic parameters, such as HMW-adiponectin [21], and can have anti-inflammatory properties [36].
However, we found a reduction in the activation of hepatic insulin signaling both in obese mice fed KD and after reintroducing a CD to these animals. This decrease in insulin signaling was accompanied by a proinflammatory environment in the liver. The lower IR phosphorylation may be due to several factors, including a possible increase in SOCS3 levels and an inflammatory profile in the liver of these mice. As mentioned above, SOCS3, dependent on STAT3 activation, can interfere with insulin-dependent IR phosphorylation [27] and pro-inflammatory cytokines restrain Akt phosphorylation [37]. An increase in PTEN phosphorylation as seen here is reported to reduce Akt activation [38] and activation of this phosphatase has been related to an increase in IL-1β, IL-6 or TNF-α [39], as found in our study. In summary, an adverse inflammatory profile can interfere with several targets of intracellular insulin signaling [40,41] and KD has been reported to induce hepatic insulin resistance in mice [42,43].
Mammalian TOR and S6K are two downstream targets of Akt that promote protein synthesis and are closely related to the regulation of key enzymes in fatty acid metabolism, mainly FASN [44] through modulation of sterol regulatory element binding protein-1c (SREBP-1c), a key transcription for lipogenesis [45,46]. In mice fed KD we found a reduction in mTOR and S6K phosphorylation with a decrease in hepatic FASN levels, as well as the activation of ATP citrate lyase, which is also regulated by Akt signaling [47].
The decrease in FASN persists after reintroducing a CD to obese mice previously fed a KD diet and also appears in those who were not fed a KD. The CREB/ATF family of transcription factors integrates nutritional signals to regulate metabolism, principally in the liver [48]. Akt signaling, in addition to regulating mTOR, modulates CREB phosphorylation [49], that induces expression of FASN [50,51], which would explain, at least in part, the lower levels of this anabolic enzyme. The reduction in phosphorylation of ATF-2 could explain the reduction in FASN levels in mice following the reintroduction of a CD to obese mice that had not received a KD, as this transcription factor binds to CREB to promote their actions [52]. ACSL1 is another crucial enzyme in fatty acid metabolism, which we found to be reduced in mice fed KD plus CD. This enzyme is also regulated by insulin signaling [53] and inflammatory signals [54], factors reduced in this experimental group.
Our results showed a decrease in hepatic TG content after KD intake, with hepatic and circulating TG levels not being different from controls and actually lower than in mice that only received the CD to induce weight loss. These data are consistent with the decrease in the levels or activation of some key enzymes in lipid anabolism found here. In fact, it has been reported that under some conditions KD can reduce circulating levels of TG [55], as well as intrahepatic lipid content by reducing lipogenesis [56].
A couple of caveats should be taken into consideration when evaluating our results. A weakness of this study is the lack of data on hepatic SOCS3 levels, as well as its interaction with the insulin receptor, since it decreases its autophosphorylation [57]. A limitation related to the unrestricted KD is the increase in inguinal fat, which could modify circulating levels of FFA and TG. However, the use of an unrestricted KD has allowed us to better study the mechanisms that regulate hepatic lipid biosynthesis, because of the hyperleptinemia linked to this diet. In this regard, hyperleptinemia allowed us to better understand some of the mechanisms that modulate these biosynthetic processes, since activation of leptin signaling may promote an attenuation of insulin signaling [12,58,59].
5. Conclusions
Our results indicate that an unrestricted KD in obese male mice initially increases serum triglyceride levels, while decreasing intrahepatic fat content. Reintroducing a CD to mice previously fed a KD normalized serum triglyceride content, while those receiving only a CD to induce weight loss had elevated levels. These beneficial effects are associated with a decrease in hepatic levels of key lipid anabolism enzymes and closely related to an attenuation of hepatic insulin signaling. In summary, reduction in hepatic insulin signaling translates into an improvement in the hepatic triglyceride content of obese mice fed KD that persists after the reintroduction of CD, accompanied by a higher peripheral insulin sensitivity.
Author Contributions
Conceptualization, G.Á.M.-M. and V.B.; methodology, A.G.-R., M.E.C., S.C. and M.J.-H.; validation, M.E.C., L.M.F., P.R. and V.B.; formal analysis, P.R. and V.B.; investigation, A.G.-R., L.M.F. and G.Á.M.-M.; data curation, A.G.-R., M.E.C. and V.B.; writing—original draft preparation, G.Á.M.-M. and V.B.; writing—review and editing, L.M.F., P.R., G.Á.M.-M. and V.B.; supervision, P.R. and V.B.; funding acquisition, L.M.F., G.Á.M.-M. and V.B. All authors have read and agreed to the published version of the manuscript.
Funding
This research was funded by the Spanish Ministry of Science, Innovation and Universities with the help of European FEDER funding (FIS PI22/01820 and PID2021-122653OB-I00) and the Network Center for Biomedical Research on Obesity and Nutrition (CIBEROBN) Instituto Carlos III. A.G.-R. was supported by Programa de Ayudas Predoctorales of Spanish Ministry of Science, Innovation and Universities with the help of European FEDER funding (PRE2022-103731), M.E.C. and S.C. by CIBEROBN and M.J.-H. by Biomedical Research Foundation Hospital I.U. Niño Jesús.
Institutional Review Board Statement
This study was conducted according to the guidelines of the declaration of Helsinki and approved by the Ethical Committee of Animal Experimentation of the Hospital Puerta de Hierro of Madrid and the Animal Welfare Organ of the Community of Madrid (PROEX 009.4/24, 12 February 2024).
Informed Consent Statement
Not applicable.
Data Availability Statement
All relevant data are included within the manuscript.
Acknowledgments
The authors thank Prof. Jesús Argente and Dr. Julie A. Chowen for the critical review of the manuscript.
Conflicts of Interest
The authors declare no conflicts of interest. The funders had no role in the design of the study; in the collection, analyses, or interpretation of data; in the writing of the manuscript; or in the decision to publish the results.
Abbreviations
The following abbreviations are used in this manuscript:
| ACSL1 | long-chain acyl-CoA synthetase 1 |
| Akt | Protein kinase B |
| ATF-2 | Activating transcription factor 2 |
| ATP-CL | ATP citrate lyase |
| AU | Absorbance units |
| CD | Chow diet |
| CEACAM1 | Carcino-embryonic antigen-related cell adhesion molecule 1 |
| CREB | cAMP response element-binding protein |
| DU | Densitometry units |
| ELISA | Enzyme-linked immunosorbent assay |
| FFA | Free fatty acid |
| HFD | High-fat diet |
| HHC | HFD plus CD |
| HHCC | HHC plus CD |
| HHK | HFD plus KD |
| HHKC | HHK plus CD |
| HMW | High molecular weight |
| HOMA-IR | Homeostatic model assessment for insulin resistance |
| HRP | Horseradish peroxidase |
| IL | Interleukin |
| IR | Insulin receptor |
| KD | Ketogenic diet |
| MFI | Median fluorescence intensity |
| mTOR | Mammalian target of rapamycin |
| NS | Non-significant |
| PTEN | Phosphatase and tensin homolog |
| p70 S6K | p70 S6 kinase |
| SEM | Standard error of the mean |
| SOCS3 | Suppressor of cytokine signaling 3 |
| SREBP-1c | Sterol regulatory element binding protein-1c |
| STAT3 | Signal transducer and activator of transcription 3 |
| TG | Triglyceride |
| TMB | Tetramethylbenzidine |
| TNF-α | Tumor necrosis factor-alpha |
References
- Islam, M.S.; Wei, P.; Suzauddula, M.; Nime, I.; Feroz, F.; Acharjee, M.; Pan, F. The interplay of factors in metabolic syndrome: Understanding its roots and complexity. Mol. Med. 2024, 30, 279. [Google Scholar] [CrossRef] [PubMed]
- Boddu, S.K.; Giannini, C.; Marcovecchio, M.L. Metabolic disorders in young people around the world. Diabetologia 2025. [Google Scholar] [CrossRef] [PubMed]
- Anastasiou, I.A.; Argyrakopoulou, G.; Dalamaga, M.; Kokkinos, A. Dual and Triple Gut Peptide Agonists on the Horizon for the Treatment of Type 2 Diabetes and Obesity. An Overview of Preclinical and Clinical Data. Curr. Obes. Rep. 2025, 14, 34. [Google Scholar] [CrossRef] [PubMed]
- Pavlidou, E.; Papadopoulou, S.K.; Fasoulas, A.; Papaliagkas, V.; Alexatou, O.; Chatzidimitriou, M.; Mentzelou, M.; Giaginis, C. Diabesity and Dietary Interventions: Evaluating the Impact of Mediterranean Diet and Other Types of Diets on Obesity and Type 2 Diabetes Management. Nutrients 2023, 16, 34. [Google Scholar] [CrossRef]
- Accacha, S.; Barillas-Cerritos, J.; Srivastava, A.; Ross, F.; Drewes, W.; Gulkarov, S.; De Leon, J.; Reiss, A.B. From Childhood Obesity to Metabolic Dysfunction-Associated Steatotic Liver Disease (MASLD) and Hyperlipidemia Through Oxidative Stress During Childhood. Metabolites 2025, 15, 287. [Google Scholar] [CrossRef]
- Badman, M.K.; Kennedy, A.R.; Adams, A.C.; Pissios, P.; Maratos-Flier, E. A very low carbohydrate ketogenic diet improves glucose tolerance in ob/ob mice independently of weight loss. Am. J. Physiol. Endocrinol. Metab. 2009, 297, E1197–E1204. [Google Scholar] [CrossRef]
- Kolb, H.; Kempf, K.; Röhling, M.; Lenzen-Schulte, M.; Schloot, N.C.; Martin, S. Ketone bodies: From enemy to friend and guardian angel. BMC Med. 2021, 19, 313. [Google Scholar] [CrossRef]
- Paoli, A. The Influence of Physical Exercise, Ketogenic Diet, and Time-Restricted Eating on De Novo Lipogenesis: A Narrative Review. Nutrients 2025, 17, 663. [Google Scholar] [CrossRef]
- Nandivada, P.; Fell, G.L.; Pan, A.H.; Nose, V.; Ling, P.R.; Bistrian, B.R.; Puder, M. Eucaloric Ketogenic Diet Reduces Hypoglycemia and Inflammation in Mice with Endotoxemia. Lipids 2016, 51, 703–714. [Google Scholar] [CrossRef]
- Rezazadeh, K.; Barzegar, M.; Nezamdoost, E.; Shoaran, M.; Abbasi, M.M.; Ghasemi, B.; Madadi, S.; Raeisi, S. Hepatic toll of keto: Unveiling the inflammatory and structural consequences of ketogenic diet in rats. BMC Nutr. 2025, 11, 72. [Google Scholar] [CrossRef]
- Barrea, L.; Vetrani, C.V.; Caprio, M.; Cataldi, M.; Ghoch, M.E.; Elce, A.; Camajani, E.; Verde, L.; Savastano, S.; Colao, A.; et al. From the Ketogenic Diet to the Mediterranean Diet: The Potential Dietary Therapy in Patients with Obesity after CoVID-19 Infection (Post CoVID Syndrome). Curr. Obes. Rep. 2022, 11, 144–165. [Google Scholar] [CrossRef]
- Balland, E.; Chen, W.; Dodd, G.T.; Conductier, G.; Coppari, R.; Tiganis, T.; Cowley, M.A. Leptin Signaling in the Arcuate Nucleus Reduces Insulin’s Capacity to Suppress Hepatic Glucose Production in Obese Mice. Cell Rep. 2019, 26, 346–355.e3. [Google Scholar] [CrossRef]
- Kim, J.H.; Kim, J.E.; Liu, H.Y.; Cao, W.; Chen, J. Regulation of interleukin-6-induced hepatic insulin resistance by mammalian target of rapamycin through the STAT3-SOCS3 pathway. J. Biol. Chem. 2008, 283, 708–715. [Google Scholar] [CrossRef]
- Kukla, M.; Mazur, W.; Bułdak, R.J.; Zwirska-Korczala, K. Potential role of leptin, adiponectin and three novel adipokines -- visfatin, chemerin and vaspin -- in chronic hepatitis. Mol. Med. 2011, 17, 1397–1410. [Google Scholar] [CrossRef] [PubMed]
- Sachithanandan, N.; Fam, B.C.; Fynch, S.; Dzamko, N.; Watt, M.J.; Wormald, S.; Honeyman, J.; Galic, S.; Proietto, J.; Andrikopoulos, S.; et al. Liver-specific suppressor of cytokine signaling-3 deletion in mice enhances hepatic insulin sensitivity and lipogenesis resulting in fatty liver and obesity. Hepatology 2010, 52, 1632–1642. [Google Scholar] [CrossRef] [PubMed]
- Barbhuiya, P.A.; Yoshitomi, R.; Pathak, M.P. Understanding the Link Between Sterol Regulatory Element Binding Protein (SREBPs) and Metabolic Dysfunction Associated Steatotic Liver Disease (MASLD). Curr. Obes. Rep. 2025, 14, 36. [Google Scholar] [CrossRef] [PubMed]
- Folch, J.; Lees, M.; Sloane Stanley, G.H. A simple method for the isolation and purification of total lipides from animal tissues. J. Biol. Chem. 1957, 226, 497–509. [Google Scholar] [CrossRef] [PubMed]
- Perianes-Cachero, A.; Burgos-Ramos, E.; Puebla-Jiménez, L.; Canelles, S.; Viveros, M.P.; Mela, V.; Chowen, J.A.; Argente, J.; Arilla-Ferreiro, E.; Barrios, V. Leptin-induced downregulation of the rat hippocampal somatostatinergic system may potentiate its anorexigenic effects. Neurochem. Int. 2012, 61, 1385–1396. [Google Scholar] [CrossRef]
- Barrios, V.; Campillo-Calatayud, A.; Guerra-Cantera, S.; Canelles, S.; Martín-Rivada, Á.; Frago, L.M.; Chowen, J.A.; Argente, J. Opposite Effects of Chronic Central Leptin Infusion on Activation of Insulin Signaling Pathways in Adipose Tissue and Liver Are Related to Changes in the Inflammatory Environment. Biomolecules 2021, 11, 1734. [Google Scholar] [CrossRef]
- Khan, S.S.; Smith, M.S.; Reda, D.; Suffredini, A.F.; McCoy, J.P. Jr. Multiplex bead array assays for detection of soluble cytokines: Comparisons of sensitivity and quantitative values among kits from multiple manufacturers. Cytometry B Clin. Cytom. 2004, 61, 35–39. [Google Scholar] [CrossRef]
- Partsalaki, I.; Karvela, A.; Spiliotis, B.E. Metabolic impact of a ketogenic diet compared to a hypocaloric diet in obese children and adolescents. J. Pediatr. Endocrinol. Metab. 2012, 25, 697–704. [Google Scholar] [CrossRef]
- Ahmad, Y.; Seo, D.S.; Jang, Y. Metabolic Effects of Ketogenic Diets: Exploring Whole-Body Metabolism in Connection with Adipose Tissue and Other Metabolic Organs. Int. J. Mol. Sci. 2024, 25, 7076. [Google Scholar] [CrossRef] [PubMed]
- Kirchgessner, M.; Müller, H.L. Thermogenesis from the breakdown of a ketogenic diet in an experimental model using swine. Int. J. Vitam. Nutr. Res. 1984, 54, 99–106. [Google Scholar] [PubMed]
- Basolo, A.; Magno, S.; Santini, F.; Ceccarini, G. Ketogenic Diet and Weight Loss: Is There an Effect on Energy Expenditure? Nutrients 2022, 14, 1814. [Google Scholar] [CrossRef] [PubMed]
- Handy, J.A.; Fu, P.P.; Kumar, P.; Mells, J.E.; Sharma, S.; Saxena, N.K.; Anania, F.A. Adiponectin inhibits leptin signalling via multiple mechanisms to exert protective effects against hepatic fibrosis. Biochem. J. 2011, 440, 385–395. [Google Scholar] [CrossRef]
- Abdelaziz, H.M.; Abdelmageed, M.E.; Suddek, G.M. Molsidomine ameliorates DEXA-induced insulin resistance: Involvement of HMGB1/JAK1/STAT3 signaling pathway. Eur. J. Pharmacol. 2025, 1002, 177832. [Google Scholar] [CrossRef]
- Senn, J.J.; Klover, P.J.; Nowak, I.A.; Zimmers, T.A.; Koniaris, L.G.; Furlanetto, R.W.; Mooney, R.A. Suppressor of cytokine signaling-3 (SOCS-3), a potential mediator of interleukin-6-dependent insulin resistance in hepatocytes. J. Biol. Chem. 2003, 278, 13740–13746. [Google Scholar] [CrossRef]
- Yamada, K.A. Calorie restriction and glucose regulation. Epilepsia 2008, 49 (Suppl 8), 94–96. [Google Scholar] [CrossRef]
- Douris, N.; Melman, T.; Pecherer, J.M.; Pissios, P.; Flier, J.S.; Cantley, L.C.; Locasale, J.W.; Maratos-Flier, E. Adaptive changes in amino acid metabolism permit normal longevity in mice consuming a low-carbohydrate ketogenic diet. Biochim. Biophys. Acta 2015, 1852, 2056–2065. [Google Scholar] [CrossRef]
- Najjar, S.M.; Perdomo, G. Hepatic Insulin Clearance: Mechanism and Physiology. Physiology (Bethesda) 2019, 34, 198–215. [Google Scholar] [CrossRef]
- Wei, X.; Ke, B.; Zhao, Z.; Ye, X.; Gao, Z.; Ye, J. Regulation of insulin degrading enzyme activity by obesity-associated factors and pioglitazone in liver of diet-induced obese mice. PLoS ONE 2014, 9, e95399. [Google Scholar] [CrossRef]
- Dashti, H.M.; Mathew, T.C.; Hussein, T.; Asfar, S.K.; Behbahani, A.; Khoursheed, M.A.; Al-Sayer, H.M.; Bo-Abbas, Y.Y.; Al-Zaid, N.S. Long-term effects of a ketogenic diet in obese patients. Exp. Clin. Cardiol. 2004, 9, 200–205. [Google Scholar] [PubMed]
- Bellanti, F.; Losavio, F.; Quiete, S.; Lo Buglio, A.; Calvanese, C.; Dobrakowski, M.; Kasperczyk, A.; Kasperczyk, S.; Vendemiale, G.; Cincione, R.I. A multiphase very-low calorie ketogenic diet improves serum redox balance by reducing oxidative status in obese patients. Free Radic. Biol. Med. 2024, 223, 109–117. [Google Scholar] [CrossRef]
- Garbow, J.R.; Doherty, J.M.; Schugar, R.C.; Travers, S.; Weber, M.L.; Wentz, A.E.; Ezenwajiaku, N.; Cotter, D.G.; Brunt, E.M.; Crawford, P.A. Hepatic steatosis, inflammation, and ER stress in mice maintained long term on a very low-carbohydrate ketogenic diet. Am. J. Physiol. Gastrointest. Liver Physiol. 2011, 300, G956–G967. [Google Scholar] [CrossRef] [PubMed]
- Ari, C.; Murdun, C.; Koutnik, A.P.; Goldhagen, C.R.; Rogers, C.; Park, C.; Bharwani, S.; Diamond, D.M.; Kindy, M.S.; D’Agostino, D.P.; et al. Exogenous Ketones Lower Blood Glucose Level in Rested and Exercised Rodent Models. Nutrients 2019, 11, 2330. [Google Scholar] [CrossRef] [PubMed]
- Dupuis, N.; Curatolo, N.; Benoist, J.F.; Auvin, S. Ketogenic diet exhibits anti-inflammatory properties. Epilepsia 2015, 56, e95–e98. [Google Scholar] [CrossRef] [PubMed]
- Pinto, L.d.F.; Compri, C.M.; Fornari, J.V.; Bartchewsky, W.; Cintra, D.E.; Trevisan, M.; Carvalho, P.d.O.; Ribeiro, M.L.; Velloso, L.A.; Saad, M.J.; et al. The immunosuppressant drug, thalidomide, improves hepatic alterations induced by a high-fat diet in mice. Liver Int. 2010, 30, 603–610. [Google Scholar] [CrossRef]
- Premeti, K.; Tsipa, D.; Nadalis, A.E.; Papanikolaou, M.G.; Syropoulou, V.; Karagkiozeli, K.D.; Aggelis, G.; Iordanidou, E.; Labrakakis, C.; Pappas, P.; et al. First generation vanadium-based PTEN inhibitors: Comparative study in vitro and in vivo and identification of a novel mechanism of action. Biochem. Pharmacol. 2025, 233, 116756. [Google Scholar] [CrossRef]
- Meshkani, R.; Adeli, K. Hepatic insulin resistance, metabolic syndrome and cardiovascular disease. Clin. Biochem. 2009, 42, 1331–1346. [Google Scholar] [CrossRef]
- Zhou, J.; Xu, S.; Zhu, Y.; Li, X.; Wang, A.; Hu, J.; Li, L.; Liu, Y. Inhibition of neuropilin-1 improves non-alcoholic fatty liver disease in high-fat-diet induced obese mouse. Minerva Endocrinol. (Torino) 2023, 48, 194–205. [Google Scholar] [CrossRef]
- Grodsky, L.; Wilson, M.; Rathinasabapathy, T.; Komarnytsky, S. Triptolide Administration Alters Immune Responses to Mitigate Insulin Resistance in Obese States. Biomolecules 2024, 14, 395. [Google Scholar] [CrossRef]
- Jornayvaz, F.R.; Jurczak, M.J.; Lee, H.Y.; Birkenfeld, A.L.; Frederick, D.W.; Zhang, D.; Zhang, X.M.; Samuel, V.T.; Shulman, G.I. A high-fat, ketogenic diet causes hepatic insulin resistance in mice, despite increasing energy expenditure and preventing weight gain. Am. J. Physiol. Endocrinol. Metab. 2010, 299, E808–E815. [Google Scholar] [CrossRef] [PubMed]
- Long, F.; Bhatti, M.R.; Kellenberger, A.; Sun, W.; Modica, S.; Höring, M.; Liebisch, G.; Krieger, J.P.; Wolfrum, C.; Challa, T.D. A low-carbohydrate diet induces hepatic insulin resistance and metabolic associated fatty liver disease in mice. Mol. Metab. 2023, 69, 101675. [Google Scholar] [CrossRef]
- Hu, J.; Che, L.; Li, L.; Pilo, M.G.; Cigliano, A.; Ribback, S.; Li, X.; Latte, G.; Mela, M.; Evert, M.; et al. Co-activation of AKT and c-Met triggers rapid hepatocellular carcinoma development via the mTORC1/FASN pathway in mice. Sci. Rep. 2016, 6, 20484. [Google Scholar] [CrossRef] [PubMed]
- Griffin, M.J.; Wong, R.H.; Pandya, N.; Sul, H.S. Direct interaction between USF and SREBP-1c mediates synergistic activation of the fatty-acid synthase promoter. J. Biol. Chem. 2007, 282, 5453–5467. [Google Scholar] [CrossRef] [PubMed]
- Thiel, G.; Guethlein, L.A.; Rössler, O.G. Insulin-Responsive Transcription Factors. Biomolecules 2021, 11, 1886. [Google Scholar] [CrossRef]
- Liu, P.; Wang, Y.; Li, X.; Liu, Z.; Sun, Y.; Liu, H.; Shao, Z.; Jiang, E.; Zhou, X.; Shang, Z. Enhanced lipid biosynthesis in oral squamous cell carcinoma cancer-associated fibroblasts contributes to tumor progression: Role of IL8/AKT/p-ACLY axis. Cancer Sci. 2024, 115, 1433–1445. [Google Scholar] [CrossRef]
- Cui, A.; Ding, D.; Li, Y. Regulation of Hepatic Metabolism and Cell Growth by the ATF/CREB Family of Transcription Factors. Diabetes 2021, 70, 653–664. [Google Scholar] [CrossRef]
- Liu, Z.; Patil, I.Y.; Jiang, T.; Sancheti, H.; Walsh, J.P.; Stiles, B.L.; Yin, F.; Cadenas, E. High-fat diet induces hepatic insulin resistance and impairment of synaptic plasticity. PLoS ONE 2015, 10, e0128274. [Google Scholar] [CrossRef]
- Klemm, D.J.; Leitner, J.W.; Watson, P.; Nesterova, A.; Reusch, J.E.; Goalstone, M.L.; Draznin, B. Insulin-induced adipocyte differentiation. Activation of CREB rescues adipogenesis from the arrest caused by inhibition of prenylation. J. Biol. Chem. 2001, 276, 28430–28435. [Google Scholar] [CrossRef]
- Chung, Y.C.; Hyun, C.G. Inhibitory Effects of Pinostilbene on Adipogenesis in 3T3-L1 Adipocytes: A Study of Possible Mechanisms. Int. J. Mol. Sci. 2021, 22, 13446. [Google Scholar] [CrossRef]
- Deb, S.; Zhou, J.; Amin, S.A.; Imir, A.G.; Yilmaz, M.B.; Lin, Z.; Bulun, S.E. A novel role of sodium butyrate in the regulation of cancer-associated aromatase promoters I.3 and II by disrupting a transcriptional complex in breast adipose fibroblasts. J. Biol. Chem. 2006, 281, 2585–2597. [Google Scholar] [CrossRef] [PubMed]
- Poppelreuther, M.; Lundsgaard, A.M.; Mensberg, P.; Sjøberg, K.; Vilsbøll, T.; Kiens, B.; Füllekrug, J. Acyl-CoA synthetase expression in human skeletal muscle is reduced in obesity and insulin resistance. Physiol. Rep. 2023, 11, e15817. [Google Scholar] [CrossRef] [PubMed]
- Wang, C.H.; Surbhi; Goraya, S.; Byun, J.; Pennathur, S. Fatty acids and inflammatory stimuli induce expression of long-chain acyl-CoA synthetase 1 to promote lipid remodeling in diabetic kidney disease. J. Biol. Chem. 2024, 300, 105502. [CrossRef]
- Yan, J.; Ren, C.; Dong, Y.; Wali, J.A.; Song, H.; Zhang, Y.; Zhang, H.; Kou, G.; Raubenheimer, D.; Cui, Z. Ketogenic Diet Combined with Moderate Aerobic Exercise Training Ameliorates White Adipose Tissue Mass, Serum Biomarkers, and Hepatic Lipid Metabolism in High-Fat Diet-Induced Obese Mice. Nutrients 2023, 15, 251. [Google Scholar] [CrossRef]
- Jani, S.; Da Eira, D.; Stefanovic, M.; Ceddia, R.B. The ketogenic diet prevents steatosis and insulin resistance by reducing lipogenesis, diacylglycerol accumulation and protein kinase C activity in male rat liver. J. Physiol. 2022, 600, 4137–4151. [Google Scholar] [CrossRef]
- Emanuelli, B.; Peraldi, P.; Filloux, C.; Sawka-Verhelle, D.; Hilton, D.; Van Obberghen, E. SOCS-3 is an insulin-induced negative regulator of insulin signaling. J. Biol. Chem. 2000, 275, 15985–15991. [Google Scholar] [CrossRef]
- Benomar, Y.; Wetzler, S.; Larue-Achagiotis, C.; Djiane, J.; Tomé, D.; Taouis, M. In vivo leptin infusion impairs insulin and leptin signalling in liver and hypothalamus. Mol. Cell. Endocrinol. 2005, 242, 59–66. [Google Scholar] [CrossRef]
- Huynh, F.K.; Levi, J.; Denroche, H.C.; Gray, S.L.; Voshol, P.J.; Neumann, U.H.; Speck, M.; Chua, S.C.; Covey, S.D.; Kieffer, T.J. Disruption of hepatic leptin signaling protects mice from age- and diet-related glucose intolerance. Diabetes 2010, 59, 3032–3040. [Google Scholar] [CrossRef]
Figure 1.
Percent weight gain and mean caloric intake per day from baseline to the end of month 2 (A and D, respectively), from the end of month 2 to the end of month 3 (B and E, respectively), and from the end of month 3 to the end of month 4 (C and F, respectively). Data are presented as mean ± SEM. CD, chow diet, HH, high-fat diet (HFD) for 2 months; HHC, HH followed by CD for 1 month; HHK, HH followed by ketogenic diet (KD) for 1 month; HHCC, HHC plus CD for 1 month; HHKC, HHK followed by CD for 1 month. NS, non-significant. *** p < 0.001 vs. CD; ### p < 0.001 vs. HHC or HHCC.
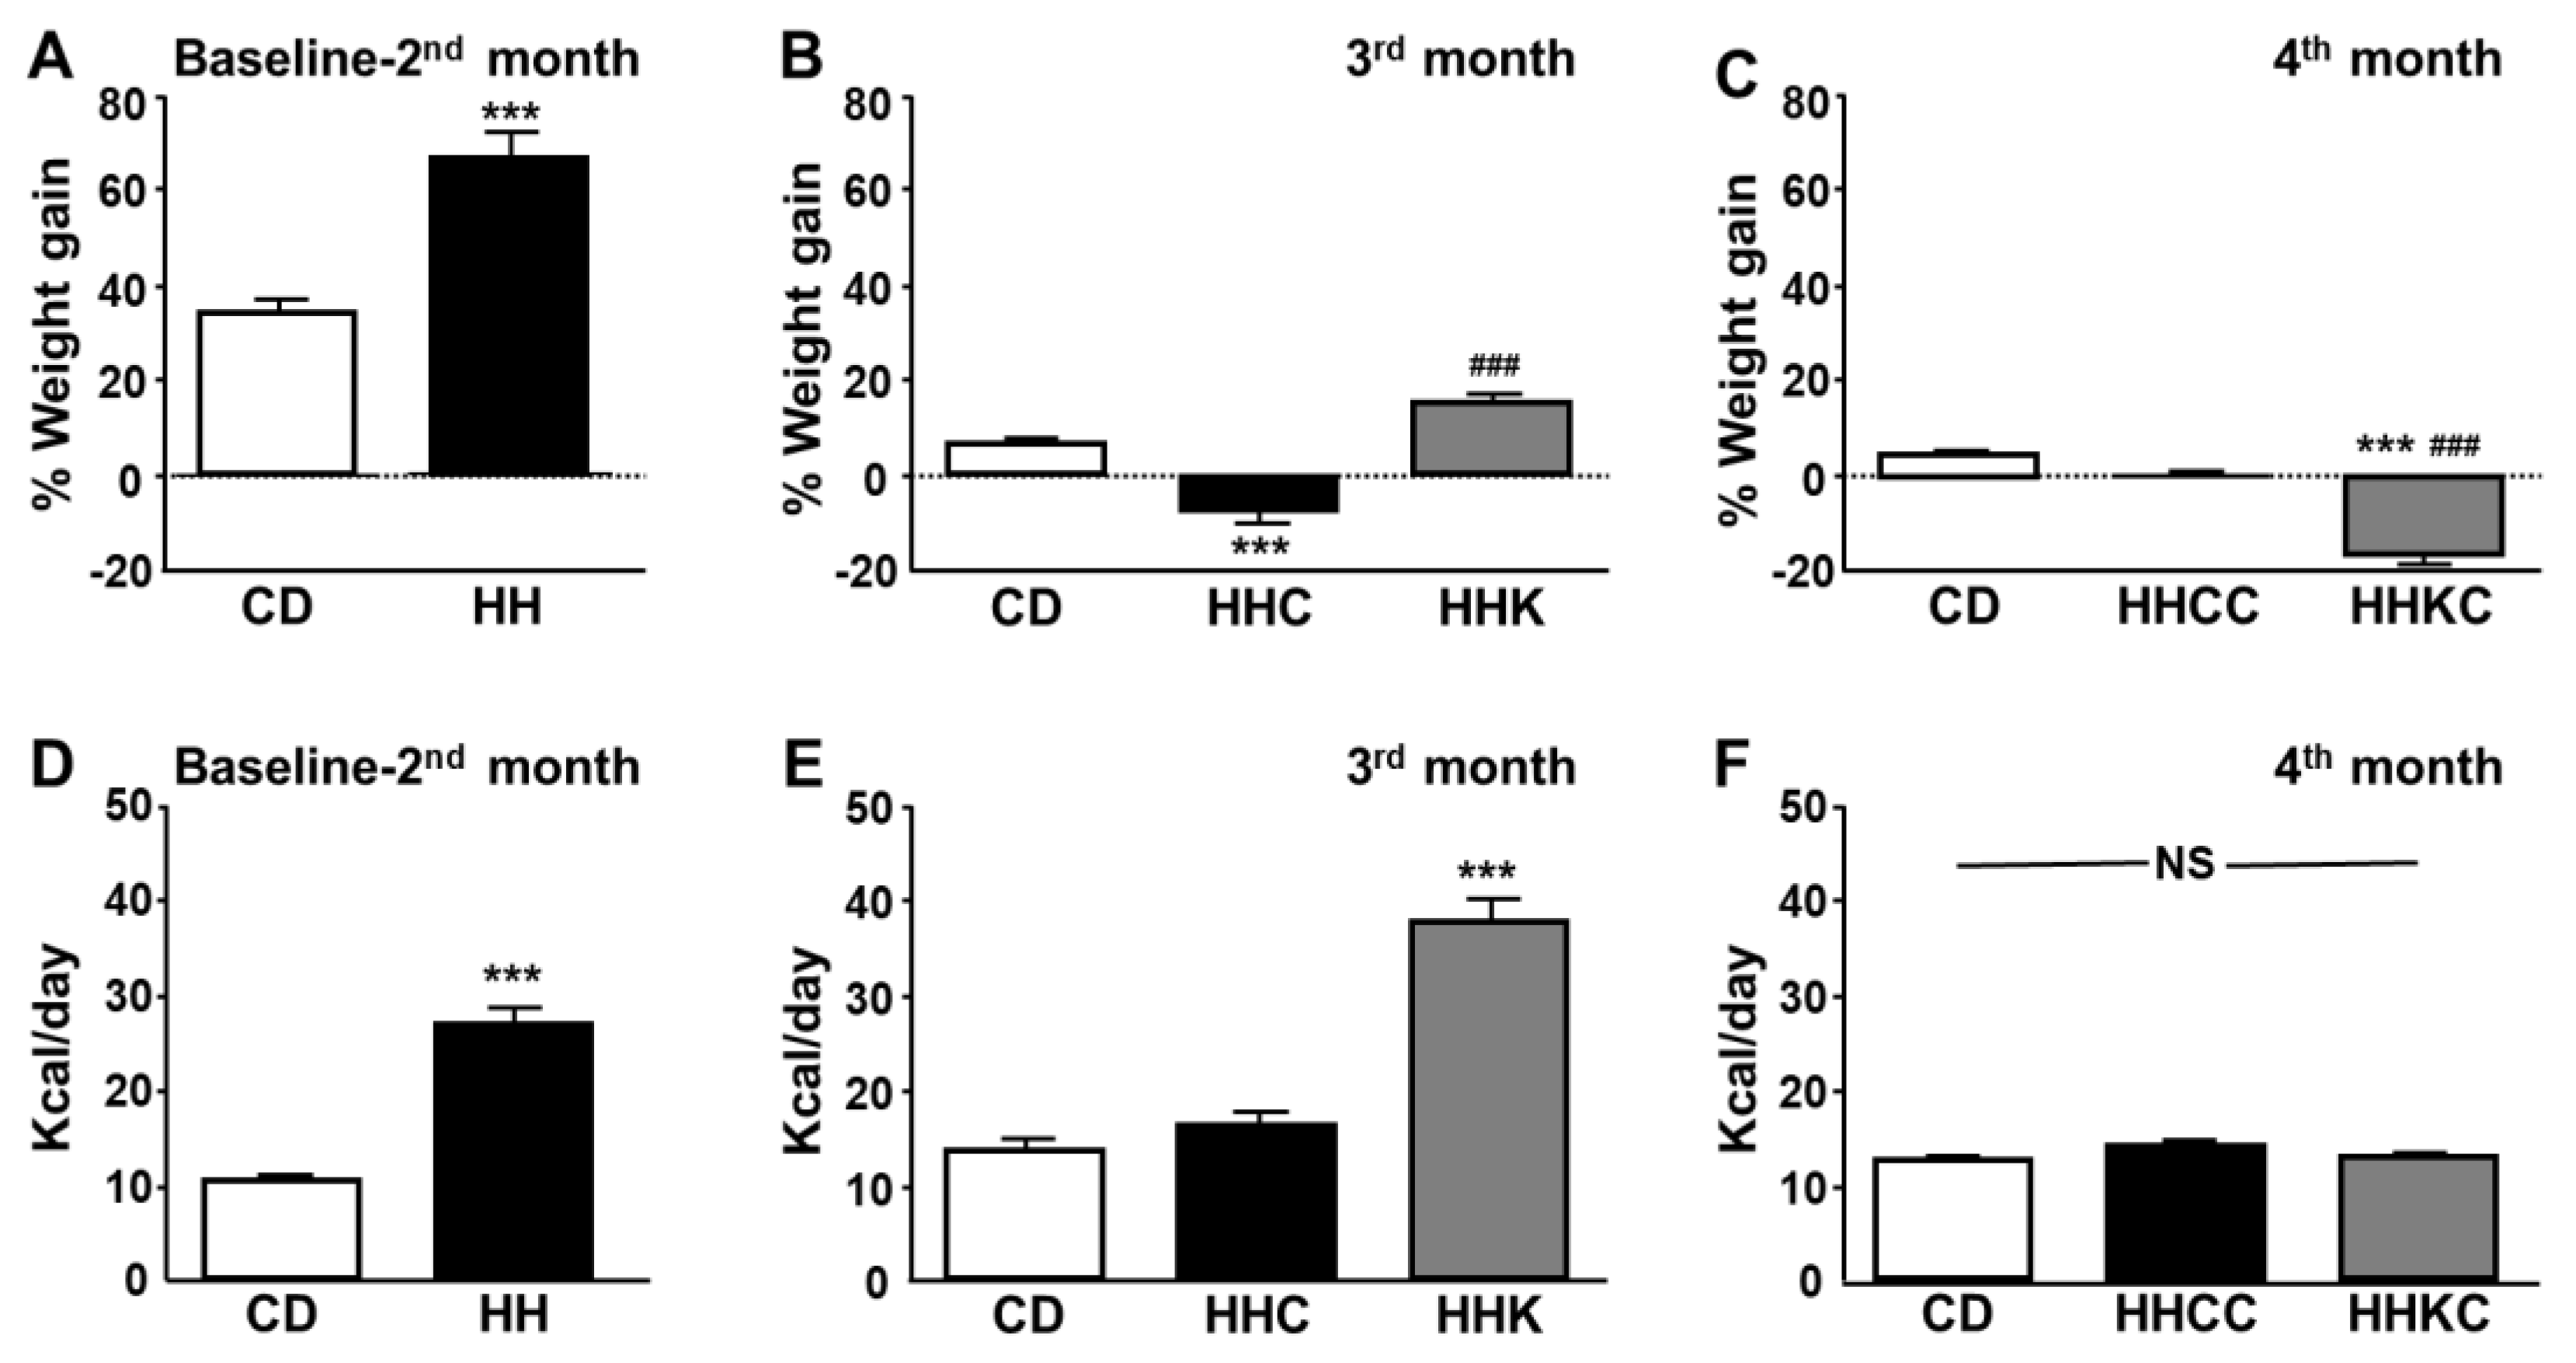
Figure 2.
Percent weight gain, mean caloric intake per day and energy efficiency from baseline to the end of study (A, B and C, respectively). Data are presented as mean ± SEM. CD, chow diet during 4 months; HHCC, high fat diet (HFD) for 2 months followed by CD for 2 months; HHKC, HFD for 2 months, followed by a ketogenic diet (KD) for 1 month and then CD for 1 month. * p < 0.05, ** p <0.01 vs. CD; ## p <0.01 vs. HHCC.
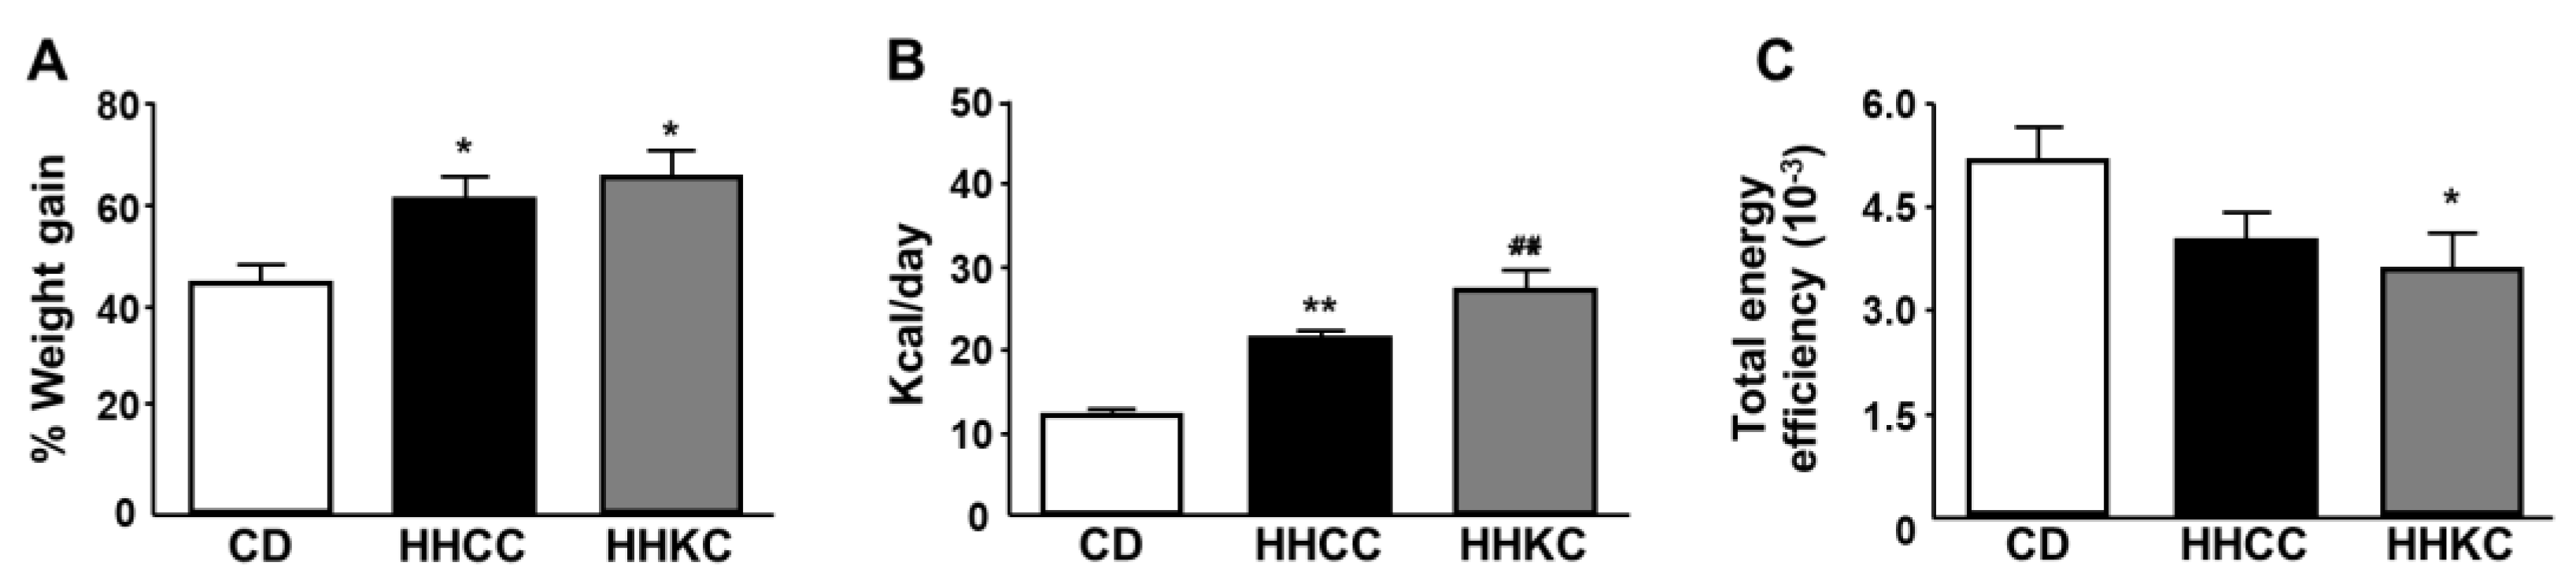
Figure 3.
Effect of CD or KD on enzymes of fatty acid anabolism and leptin- and insulin-related signaling in the liver. Relative protein levels of (A) ATP citrate lyase (ATP-CL) phosphorylated at Ser455 (pSer455ATP-CL), (B) long-chain acyl-CoA synthetase (ACSL)1, (C) fatty acid synthase (FASN), (D) signal transducer and activator of transcription 3 (STAT3) phosphorylated at Ser727 (pSer727STAT3), (E) insulin receptor (IR) phosphorylated at Tyr residues (pTyrIR) and (F) Akt phosphorylated at Ser473 (pSer473Akt). Data are presented as mean ± SEM. CD, chow diet, HHC, high-fat diet (HFD) for 2 months followed by CD for 1 month; HHK, HFD for 2 months followed by ketogenic diet (KD) for 1 month. AU, absorbance units; DU, densitometry units; MFI, median fluorescence intensity; NS, non-significant. ** p <0.01, *** p < 0.001 vs. CD; ## p <0.01, ### p < 0.001 vs. HHC.
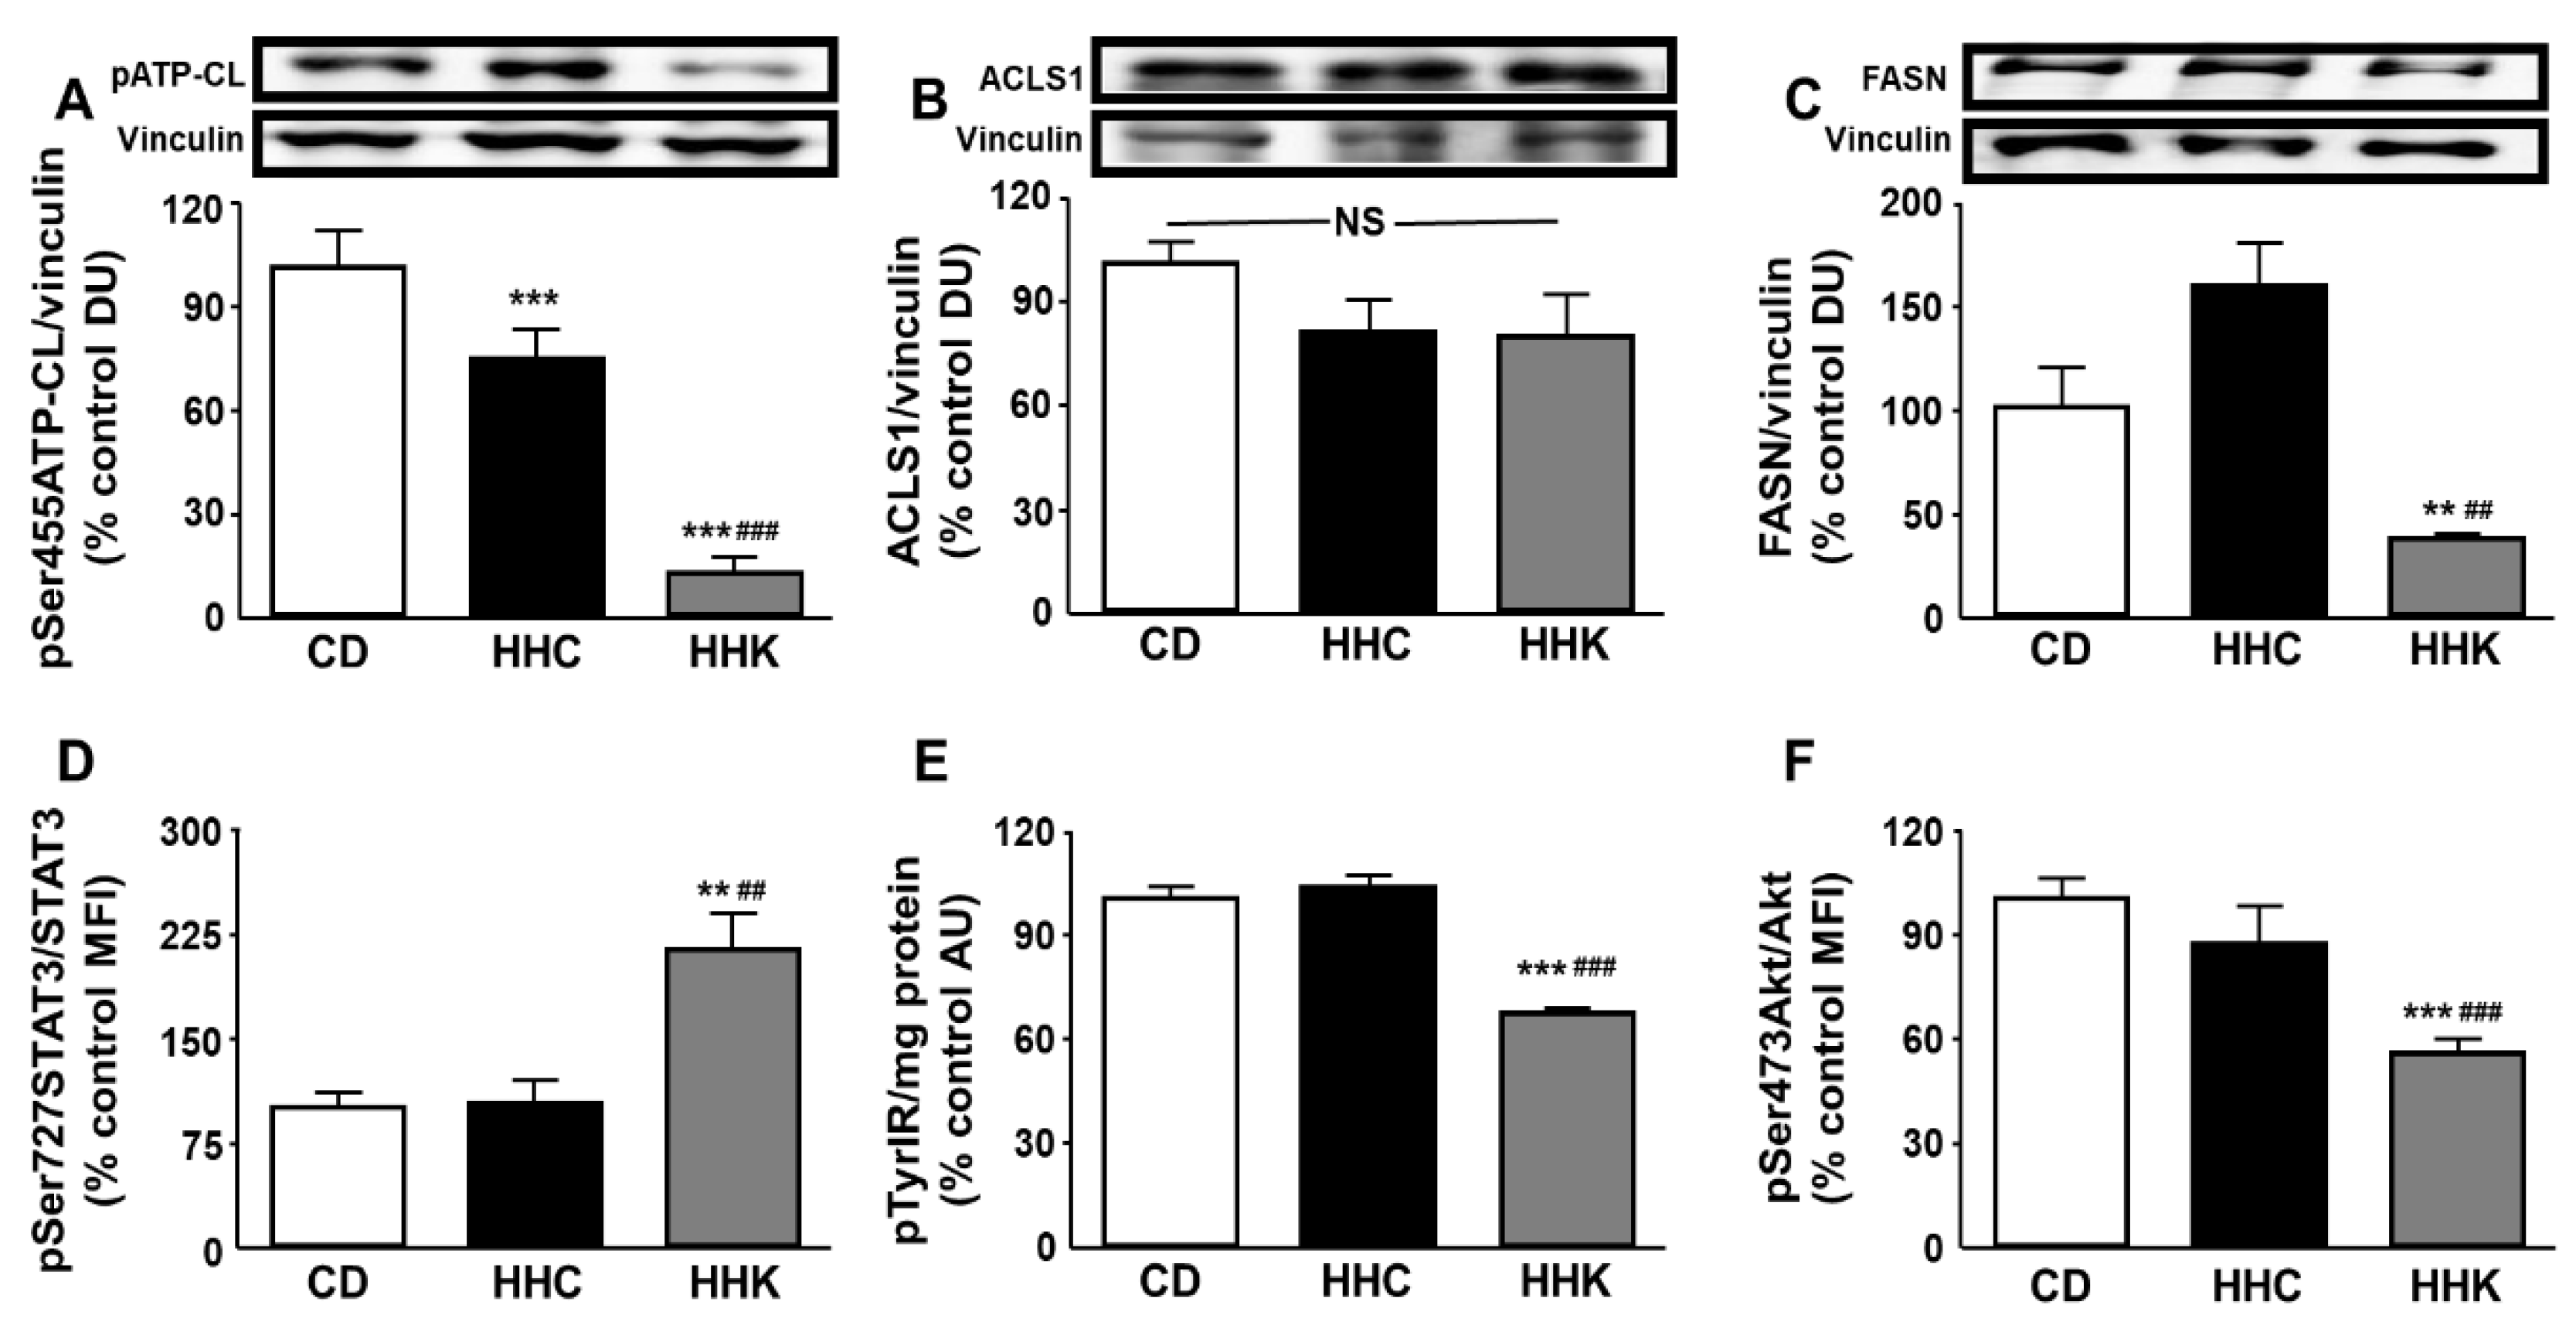
Figure 4.
Effect of CD or KD in obese mice on downstream Akt-related signaling. Relative protein levels of (A) phosphatase and tensin homolog (PTEN) phosphorylated at Ser380 (pSer380PTEN), (B) mammalian target of rapamycin (mTOR) phosphorylated at Ser2248 (pSer2248mTOR), (C) p70 S6 kinase (p70 S6K) phosphorylated at Thr389 (pThr389p70 S6K), (D) cAMP response element binding protein (CREB) phosphorylated at Ser133 (pSer133CREB) and (E) activating transcription factor 2 (ATF-2) phosphorylated at Thr71 (pThr71ATF-2). Data are presented as mean ± SEM. CD, chow diet, HHC, high-fat diet (HFD) for 2 months followed by CD for 1 month; HHK, HFD for 2 months followed by ketogenic diet (KD) for 1 month. MFI, median fluorescence intensity. *** p < 0.001 vs. CD; ### p < 0.001 vs. HHC.
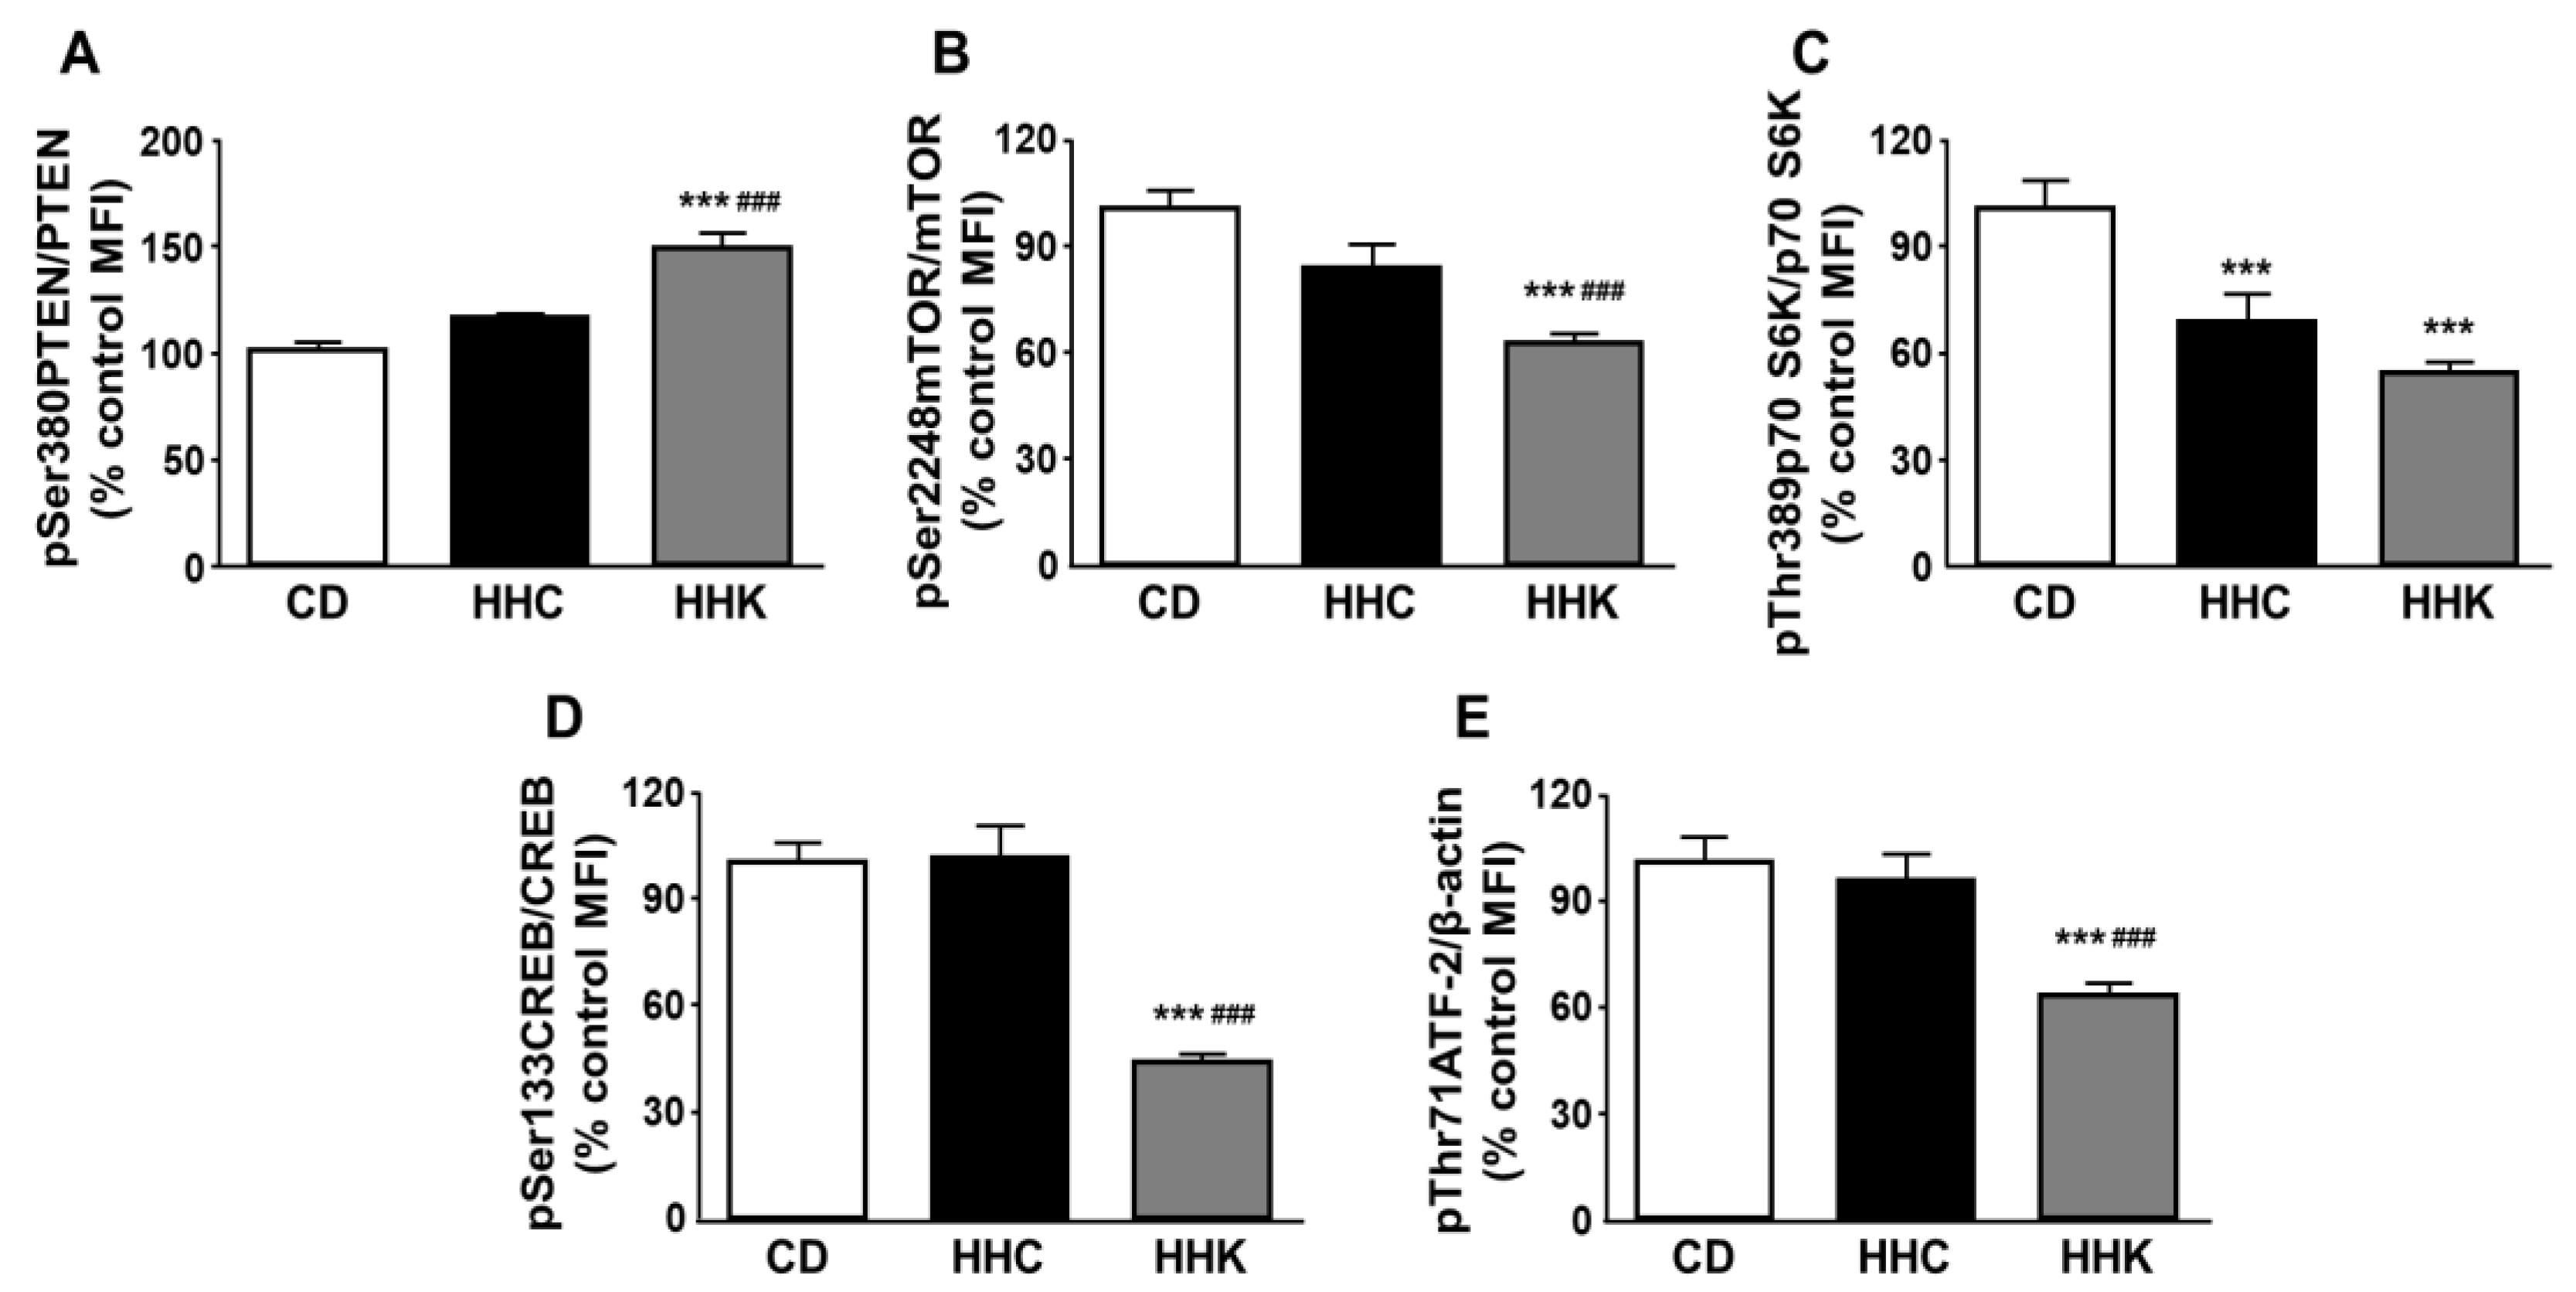
Figure 5.
Effect of CD on enzymes of fatty acid anabolism and insulin-related signaling in obese mice fed previously with CD or KD. Relative protein levels of (A) ATP citrate lyase (ATP-CL) phosphorylated at Ser455 (pSer455ATP-CL), (B) long-chain acyl-CoA synthetase (ACSL)1, (C) fatty acid synthase (FASN), (D) insulin receptor (IR) phosphorylated at Tyr residues (pTyrIR), (E) cAMP response element binding protein (CREB) phosphorylated at Ser133 (pSer133CREB) and (F) activating transcription factor 2 (ATF-2) phosphorylated at Thr71 (pThr71ATF-2). Data are presented as mean ± SEM. CD, chow diet, HHCC, high-fat diet (HFD) plus CD for 2 months; HHCK, HFD followed by ketogenic diet (KD) for 1 month and CD for another month. AU, absorbance units; DU, densitometry units; MFI, median fluorescence intensity; NS, non-significant. * p < 0.05, ** p <0.01, *** p < 0.001 vs. CD; ## p < 0.01, ### p < 0.001 vs. HHCC.
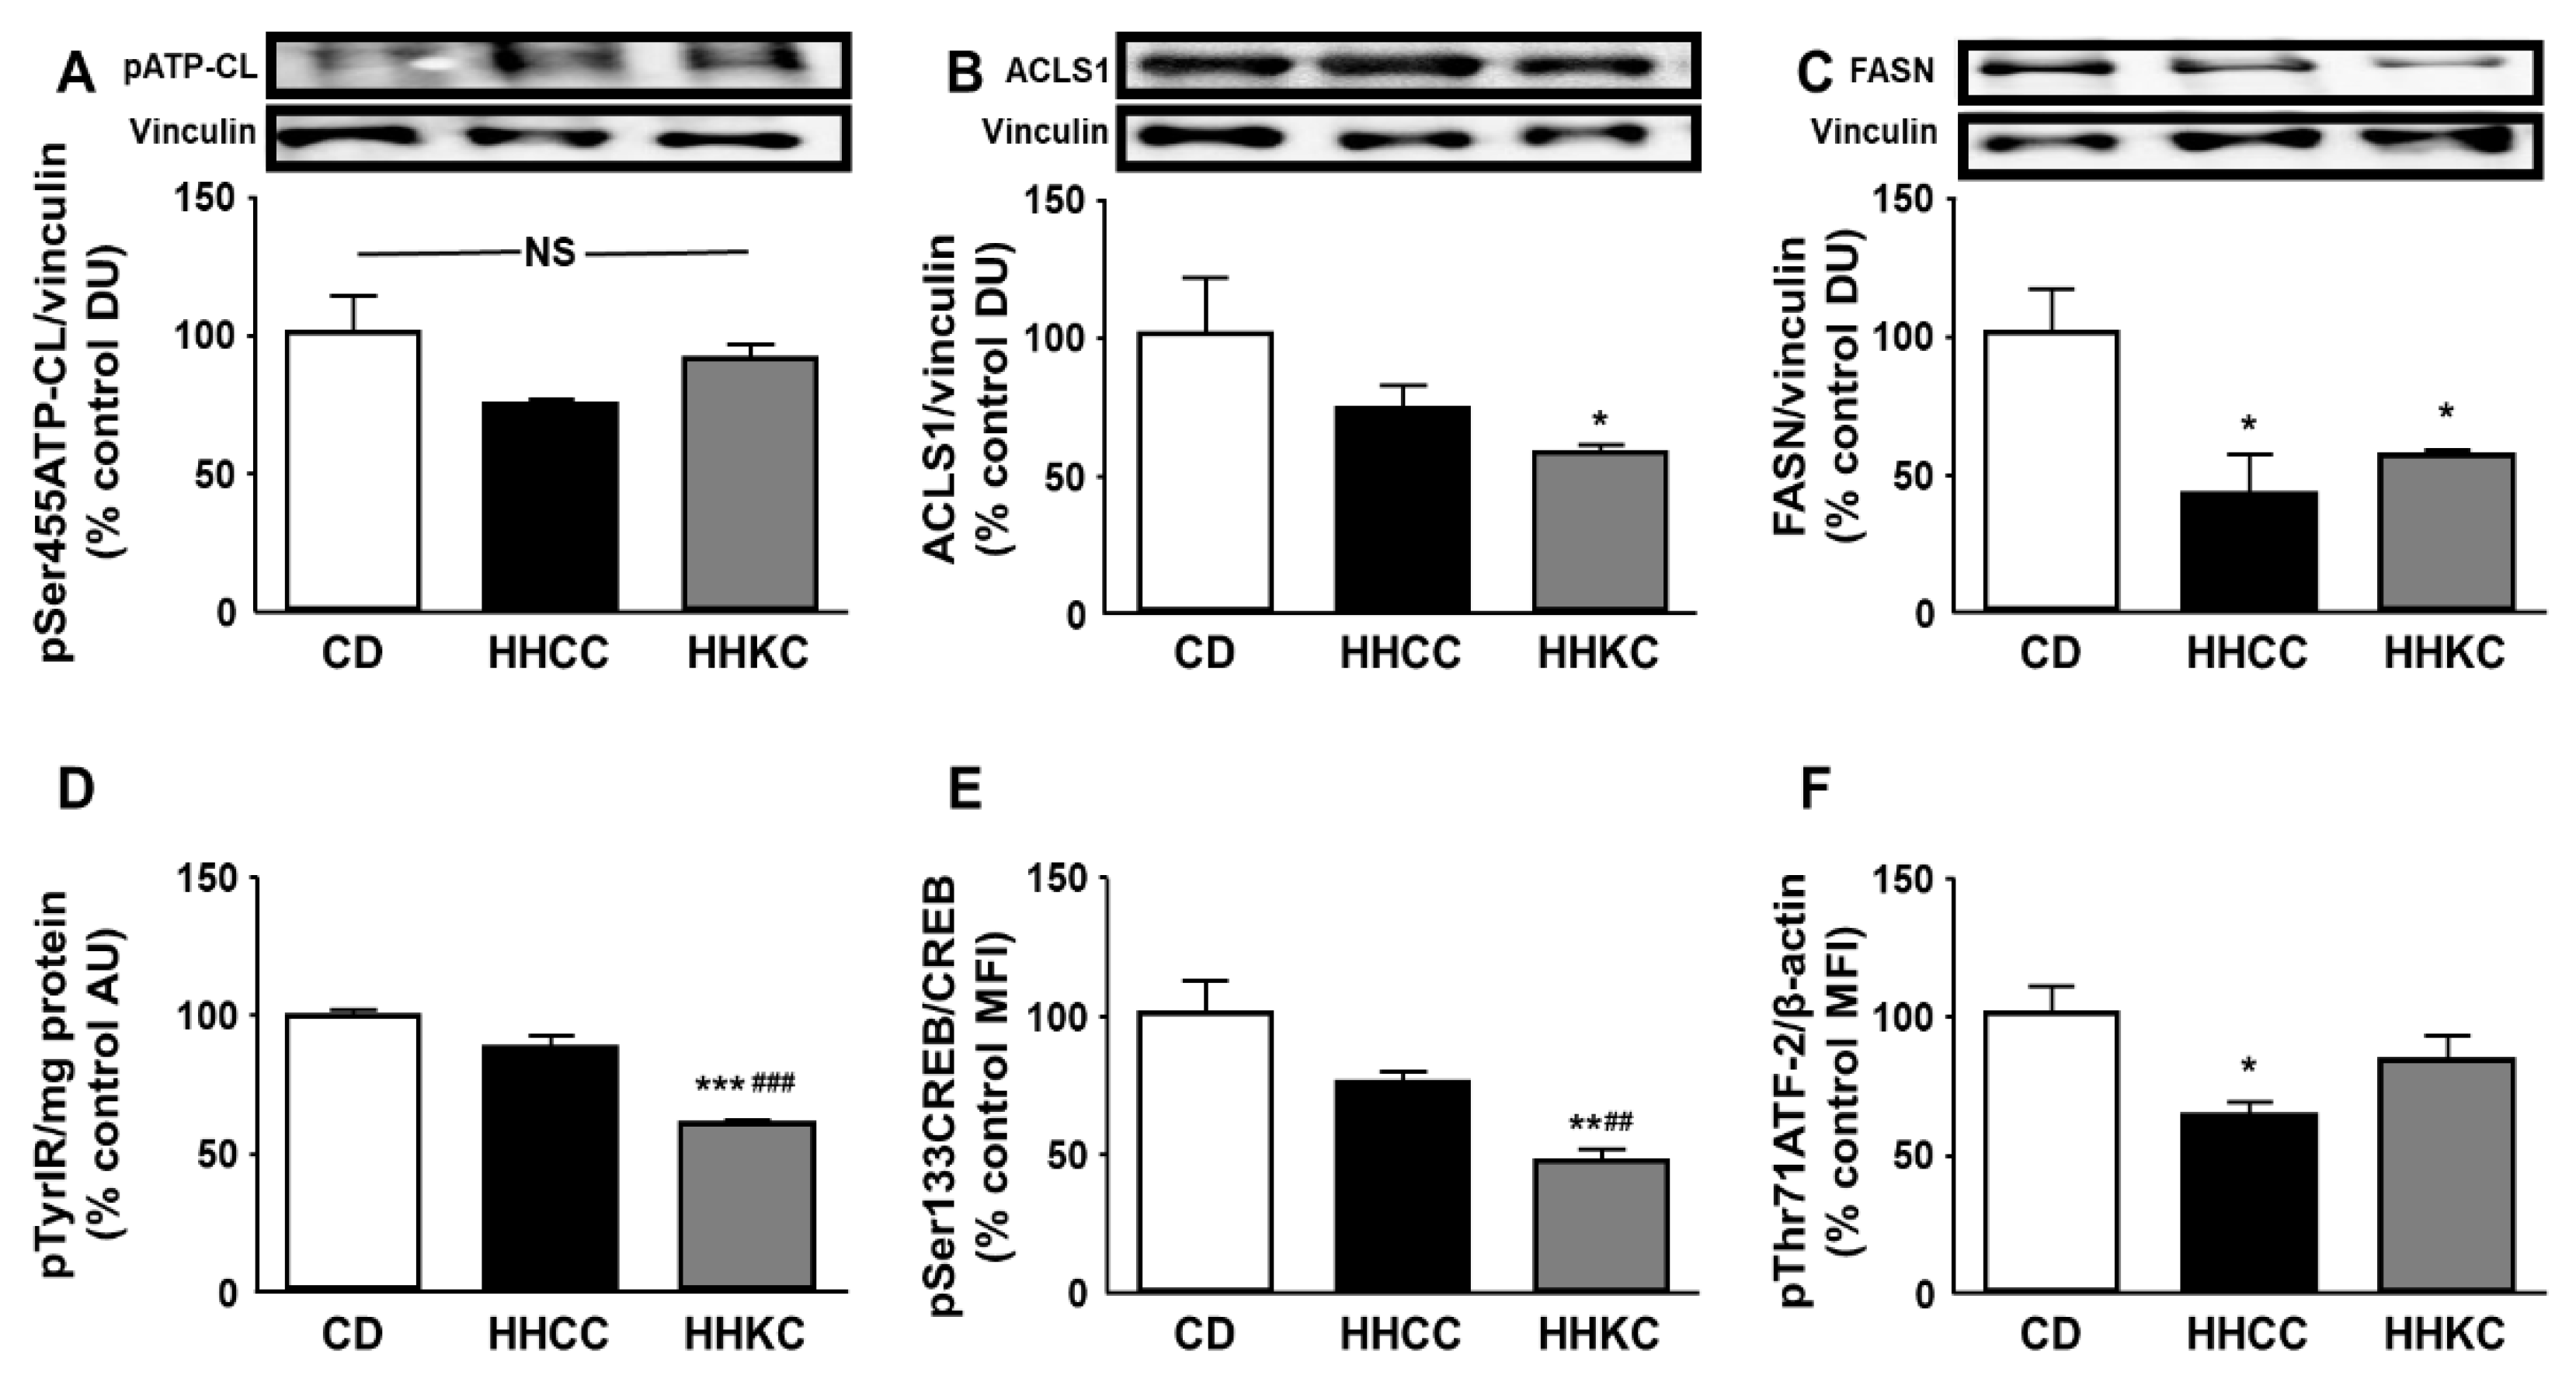
Figure 6.
Effect of CD or KD in obese mice (A) and reintroduction of CD to both groups (C) on hepatic insulin levels and linear correlations between serum insulin and hepatic insulin levels in these groups (B and D, respectively). Data are presented as mean ± SEM. CD, chow diet, HHC, high-fat diet (HFD) for 2 months followed by C for 1 month; HHK, HFD for 2 months followed by ketogenic diet (KD) for 1 month, HHCC, HHC plus CD for 1 month; HHKC, HHK plus CD for 1 month. * p < 0.05, *** p < 0.001 vs. CD; ### p < 0.001 vs. HHCC. Correlation coefficients (r) and p values are represented for each analysis. Dots represent the individual data.
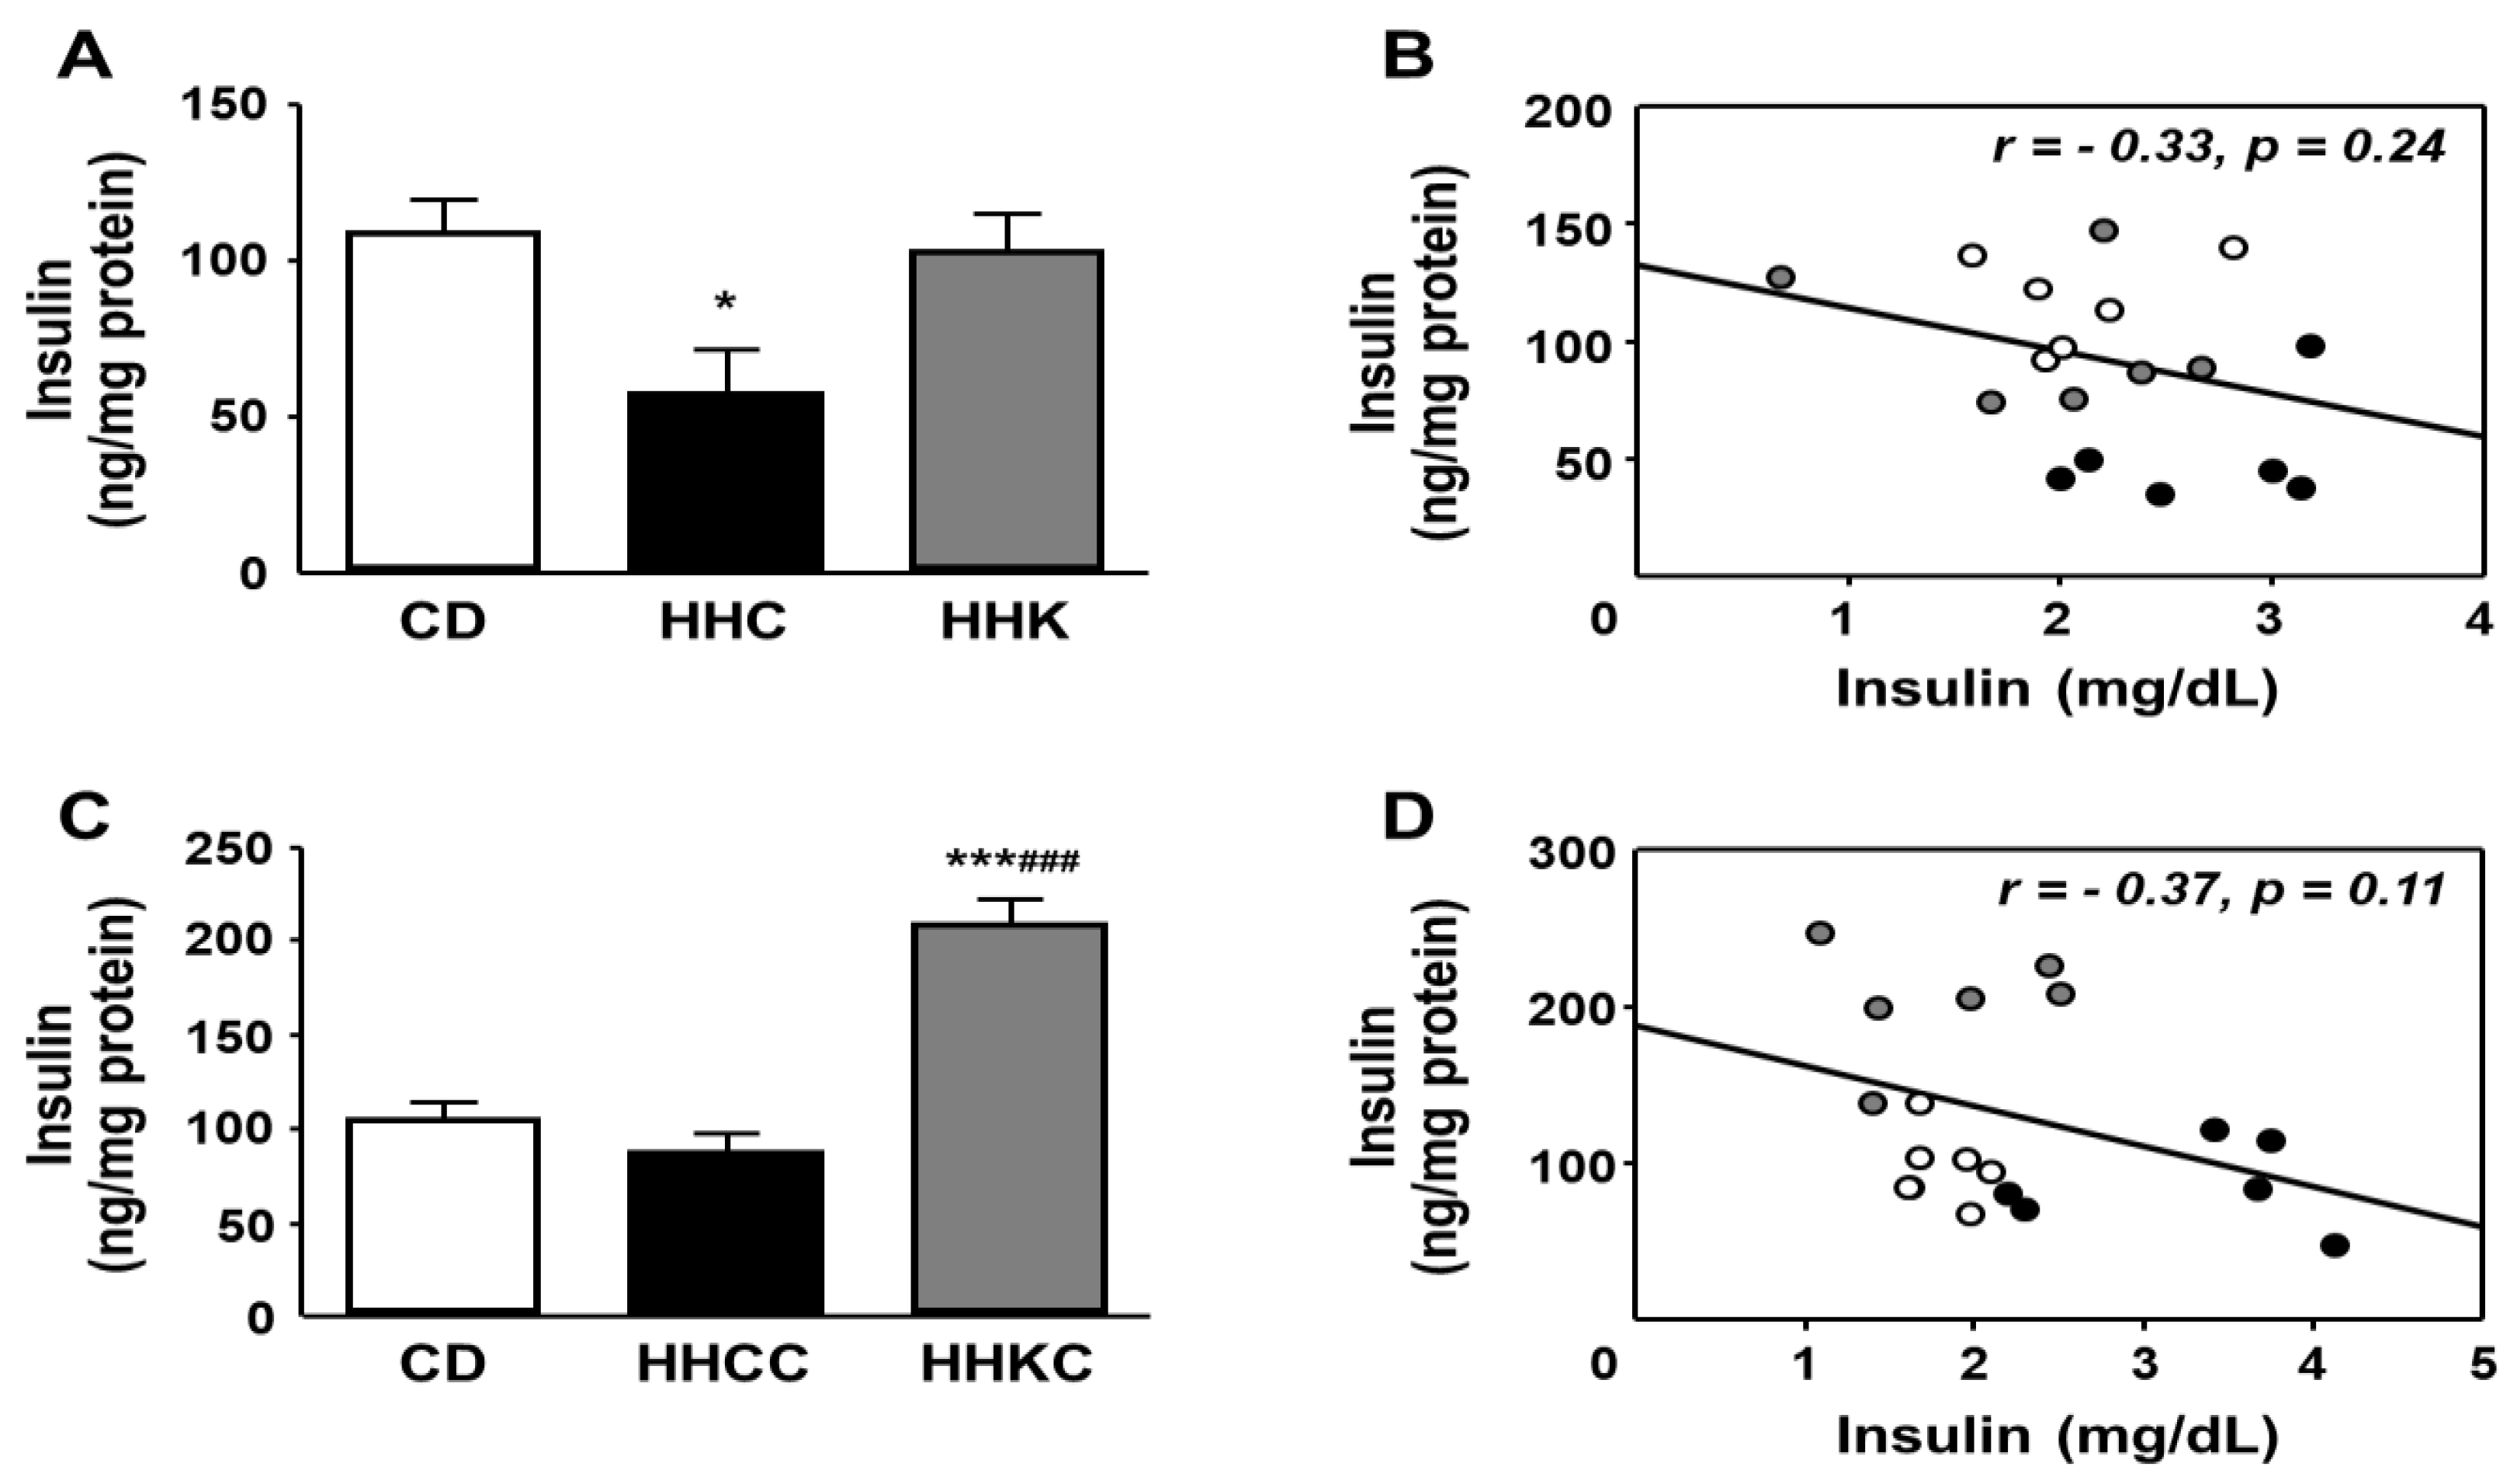
Figure 7.
Effects of CD or KD in obese mice and reintroduction of CD in both groups on hepatic and circulating levels of free fatty acids (FFA) and triglycerides (TG). Hepatic levels of FFA and TG in obese mice fed with CD or KD (A and B, respectively) and after reintroduction of CD (C and D, respectively). Serum levels of FFA and TG in obese mice fed with CD or KD (E and F, respectively) and after reintroduction of CD (G and H, respectively). Data are presented as mean ± SEM. CD, chow diet, HH, high-fat diet (HFD) for 2 months; HHC, HH followed by CD for 1 month; HHK, HH followed by ketogenic diet (KD) for 1 month; HHCC, HHC plus CD for 1 month; HHKC, HHK followed by CD for 1 month. NS, non-significant. ** p <0.01, *** p < 0.001 vs. CD; ## p <0.01, ### p < 0.001 vs. HHC or HHCC.
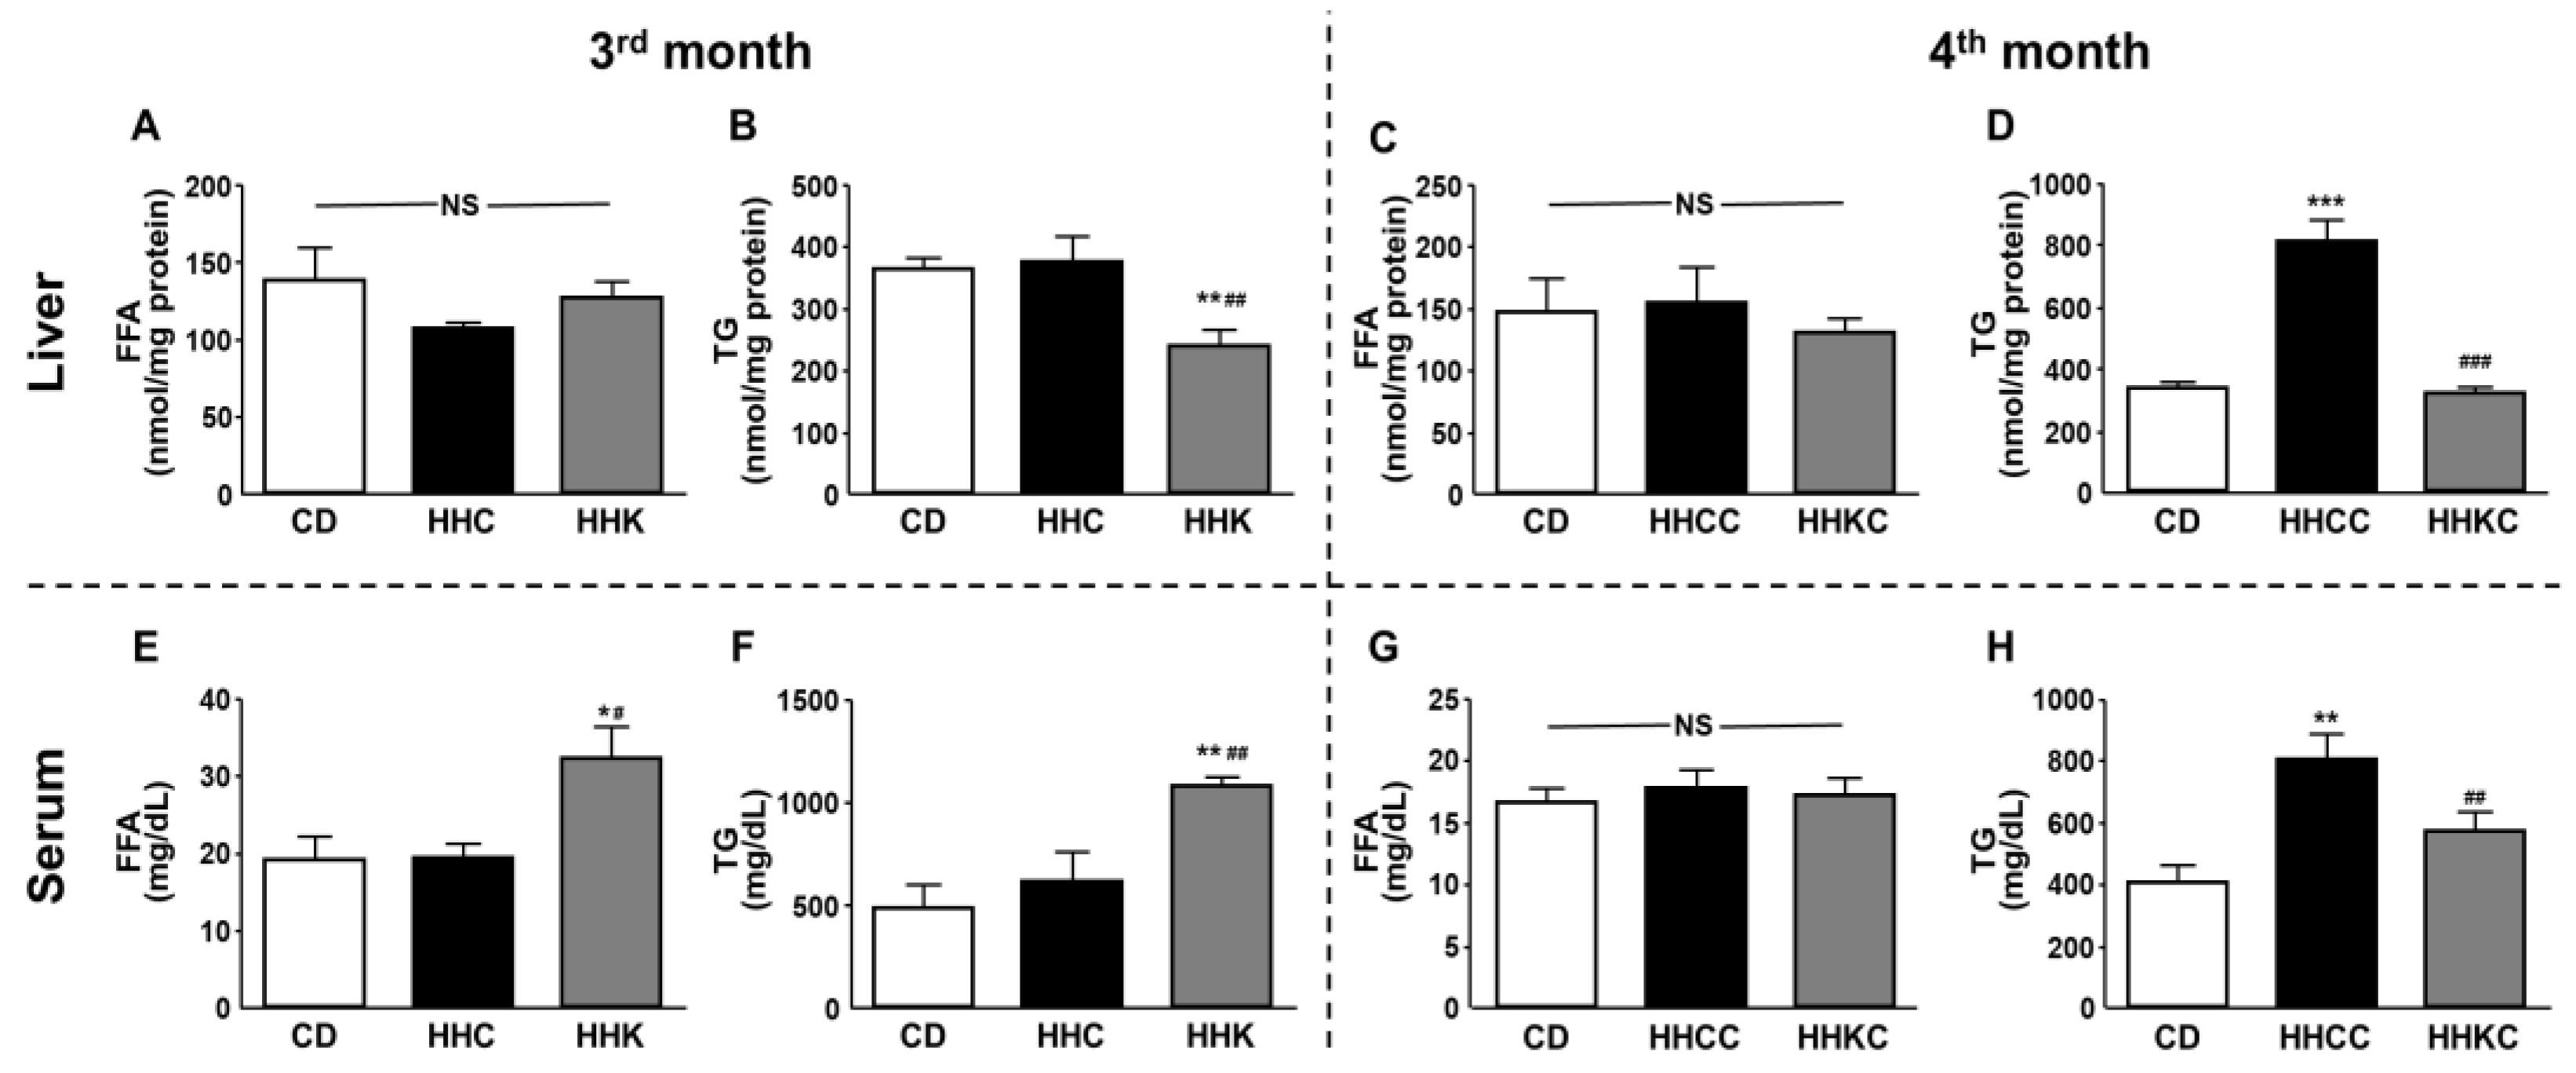

Table 1.
Weight of liver, inguinal fat, glucose and circulating levels of hormones and adipokines at 3 and 4 months.
Table 1.
Weight of liver, inguinal fat, glucose and circulating levels of hormones and adipokines at 3 and 4 months.
| Parameter (3 months) | CD | HHC | HHK |
| Liver weight (% BW) | 4.50 ± 0.12 | 4.44 ± 0.24 | 3.91 ± 0.20 * |
| Inguinal fat (% BW) | 1.15 ± 0.18 | 1.07 ± 0.19 | 2.94 ± 0.81 * # |
| Serum glucose (mg/dL) | 130.3 ± 5.9 | 105.3 ± 5.2 | 89.6 ± 7.8 ** |
| Serum insulin (ng/mL) | 2.07 ± 0.26 | 2.91 ± 0.27 | 1.92 ± 0.21 # |
| HOMA-IR | 16.03 ± 2.42 | 19.67 ± 2.63 | 10.93 ± 1.57 # |
| Serum leptin (ng/ml) | 3.77 ± 0.36 | 2.84 ± 0.45 | 15.91 ± 4.18 * # |
| Serum ADP (µg/mL) | 3.88 ± 0.17 | 2.92 ± 0.43 | 3.58 ± 0.19 |
| Serum HMW-ADP (µg/mL) | 1.87 ± 0.11 | 1.57 ± 0.32 | 2.94 ± 0.05 *** ### |
| Parameter (4 months) | CD | HHCC | HHKC |
| Liver weight (% BW) | 4.53 ± 0.12 | 5.08 ± 0.25 | 4.34 ± 0.07 # |
| Inguinal fat (% BW) | 1.03 ± 0.27 | 1.04 ± 0.12 | 2.24 ± 0.41 ** ## |
| Serum glucose (mg/dL) | 113.1 ± 3.8 | 102.6 ± 8.00 | 117.8 ± 7.3 |
| Serum insulin (ng/mL) | 1.76 ± 0.08 | 3.05 ± 0.33 ** | 1.68 ± 0.23 ## |
| HOMA-IR | 12.59 ± 0.87 | 21.21 ± 3.44 * | 12.54 ± 1.73 # |
| Serum leptin (ng/ml) | 3.40 ± 0.79 | 4.82 ± 0.72 | 6.26 ± 1.22 |
| Serum ADP (µg/mL) | 3.02 ± 0.13 | 2.75 ± 0.17 | 2.89 ± 0.12 |
| Serum HMW-ADP (µg/mL) | 1.60 ± 0.28 | 1.51 ± 0.25 | 1.93 ± 0.42 |
Values are means ± SEM of seven animals. ADP, adiponectin; BW, body weight; CD, chow diet; HHC, high fat diet (HFD) during 2 months plus CD during 1 month; HHCC, HHC plus CD during another month; HHK, HFD plus a ketogenic diet (KD) during 1 month; HHKC, HHK plus CD during one month; HOMA-IR, homeostatic model assessment for insulin resistance; IL, interleukin; HMW; high molecular weight. * p < 0.05, ** p < 0.01, *** p < 0.001 vs. CD; # p < 0.05, ## p < 0.01, ### p < 0.001 vs. HHCC.
Table 2.
Hepatic and circulating levels of cytokines at 3 and 4 months.
| Parameter (3 months) | CD | HHC | HHK |
| Liver IL-1β (ng/mg protein) | 21.76 ± 2.67 | 21.14 ± 3.54 | 19.61 ± 2.50 |
| Liver IL-6 (ng/mg protein) | 22.52 ± 4.83 | 22.94 ± 1.68 | 17.83 ± 4.01 |
| Liver TNF-α (ng/mg protein) | 6.41 ± 0.54 | 7.92 ± 1.01 | 16.33 ± 2.28 ** ## |
| Serum IL-1β (pg/mL) | 108.1 ± 19.0 | 152.4 ± 25.5 | 69.6 ± 18.2 # |
| Serum IL-6 (pg/mL) | 16.07 ± 2.54 | 23.76 ± 8.95 | 20.0 ± 4.16 |
| Serum TNF-α (pg/mL) | 9.87 ± 1.10 | 20.77 ± 1.91 *** | 11.38 ± 1.24 ### |
| Parameter (4 months) | CD | HHCC | HHKC |
| Liver IL-1β (ng/mg protein) | 8.58 ± 2.27 | 17.31 ± 1.23 ** | 16.26 ± 1.02 ** |
| Liver IL-6 (ng/mg protein) | 12.85 ± 1.50 | 16.37 ± 0.63 | 19.34 ± 1.18 ** |
| Liver TNF-α (ng/mg protein) | 5.57 ± 1.97 | 5.12 ± 1.74 | 3.83 ± 1.35 |
| Serum IL-1β (pg/mL) | 145.8 ± 21.7 | 152.3 ± 25.7 | 62.3 ± 7.9 ** ## |
| Serum IL-6 (pg/mL) | 18.20 ± 3.24 | 21.13 ± 5.06 | 12.84 ± 3.53 |
| Serum TNF-α (pg/mL) | 11.29 ± 0.85 | 20.63 ± 3.29 ** | 9.54 ± 2.02 ## |
Values are means ± SEM of seven animals. CD, chow diet; HHC, high fat diet (HFD) during 2 months plus CD during 1 month; HHCC, HHC plus CD during another month; HHK, HFD plus KD during 1 month; HHKC, HHK plus CD during one month; IL, interleukin; TNF, tumor necrosis factor. ** p < 0.01, *** p < 0.001 vs. CD; # p < 0.05, ## p < 0.01, ### p < 0.001 vs. HHCC.
Disclaimer/Publisher’s Note: The statements, opinions and data contained in all publications are solely those of the individual author(s) and contributor(s) and not of MDPI and/or the editor(s). MDPI and/or the editor(s) disclaim responsibility for any injury to people or property resulting from any ideas, methods, instructions or products referred to in the content. |
© 2025 by the authors. Licensee MDPI, Basel, Switzerland. This article is an open access article distributed under the terms and conditions of the Creative Commons Attribution (CC BY) license (http://creativecommons.org/licenses/by/4.0/).
Copyright: This open access article is published under a Creative Commons CC BY 4.0 license, which permit the free download, distribution, and reuse, provided that the author and preprint are cited in any reuse.


