
Submitted:
10 July 2024
Posted:
12 July 2024
You are already at the latest version
Abstract
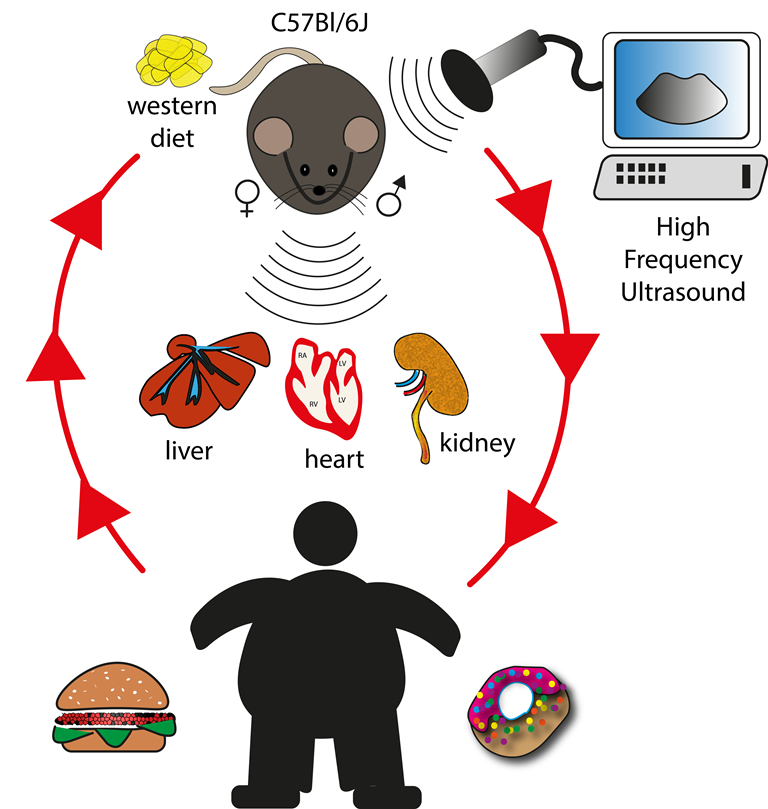
Overconsumption of an unbalanced diet and overweight, leading to insulin resistance, dyslipidemia, hepatic steatosis, cardiovascular diseases and obesity, is nowadays a worldwide health issue, with different patterns of metabolic disturbances in the young and adult popula-tions, in both gender. Preclinical models that closely mimic the gradual weight gain that occurs in humans upon consumption of a “western-type” diet (WD) are of great interest. In particular, the diet-induced obesity (DIO) model in the C57BL/6J mouse sub-strain is often used in biomed-ical research, considering that it is prone to metabolic disorders and obesity, and is widely used to generate genetically modified mice. This study aimed to phenotypically characterize the C57BL/6J mouse strain fed a WD-like diet, using high-frequency ultrasound imaging (HFUS) as a complementary tool to longitudinally monitor morphofunctional changes in the liver, heart and kidney associated with DIO. Long term WD feeding increased mice body weight (BW), liver/BW ratio and body condition score (BCS), serum transaminases, glucose and insulin, as well as Homeostasis model assessment (HOMA) indexes, and caused dyslipidemia and insulin resistance. According to the 3Rs, ultrasound imaging has enabled a comprehensive study of metabolic syndrome in mice, in vivo and non-invasive, improving the identification of early stages of diseases.
Keywords:
obesity
; metabolic syndrome
; animal model
; C57Bl/6J mouse
; high frequency ultrasound imaging
1. Introduction
Overweight and obesity, leading to age-associated disorders such as insulin resistance, dyslipidemia, non-alcoholic fatty liver disease (NAFLD) and cardiovascular diseases, have become a global health concern for the young and adult population, with gender-related differences.
Consequently, preclinical models of obesity and metabolic syndrome are of great interest, particularly those that more closely resemble the gradual weight gain that occurs in western humans due to excessive calories consumption and unbalanced diets, leading to subtle obesity phenotypes.
Diet-induced obesity (DIO) in the C57BL/6J mouse sub-strain has become a very common approach in both pathogenetic and therapeutic preclinical studies, since diet is clearly involved in the etiology of many chronic diseases, and this mouse sub-strain shows a high genetic predisposition to develop the metabolic disorders that are observed in obesity [1].
Furthermore, C57BL/6J mice are widely used to generate genetically modified animals, which could greatly help in understanding gene-disease interactions and reduce the translation gap between humans and animal models. In particular, differences between mouse sub-strain can influence the response to dietary manipulation, and the C57BL/6J strain from supplier Charles Rivers appears markedly prone to obesity induced by both high-fat diet (>60% energy from fat) and a “western-type” diet (~45% energy from fat associated to higher levels of sucrose as an increased carbohydrate component) [2]. Importantly, although sexual dimorphism has been demonstrated in mouse models of obesity, little data is available on the metabolic effects of DIO in female mice [1].
The standardized maintenance diets (SD) for nutrition research are low-fat diets resulting in a lean, healthy phenotype in rodents, and are used as control diets for preclinical studies, avoiding a significant source of experimental variation. Diverse commercial diets used in DIO rodent models are higher in fat (30–78% of total energy intake from fat) or manipulated to resemble the Western human dietary pattern associated with metabolic chronic diseases. The typical American diet contains approximately 49%, 35%, and 16% of energy from carbohydrates, fat, and protein, respectively. Therefore, rodent diet commonly referred to as a “Western-type diet” (WD) more closely resemble a modern, high-energy dietary pattern from western countries responsible for the increased incidence of the human metabolic syndrome [1], compared to a range of diets under discussion, containing fats in concentration much higher than those usually consumed by humans [3].
More recently, such diets have been enriched with various levels of simple sugars (sucrose, fructose) and of cholesterol to accelerate the progression of liver disease [4] and induce atherosclerosis.
Overall, WD are able to induce obesity, hepatic steatosis and insulin resistance, fat deposition in peripheral tissues and dysregulated lipid metabolism in rodent models [5], providing more relevant physiologic insight to study human obesity [3]. Notably, non-alcoholic steato-hepatitis (NASH) is usually preceded by metabolic syndrome, characterized by the presence of at least three of the following criteria: abdominal obesity, high serum triglycerides, low high-density lipoprotein (HDL) cholesterol, high blood pressure, and hyperglycemia/insulin resistance. However, some metabolic differences compared to humans should be taken into consideration; for example, mice have high levels of HDL and low levels of low-density lipoprotein (LDL) and very low-density lipoprotein (VLDL). However, the C57BL/6 mouse strain has been shown to be very susceptible to developing atherosclerosis when fed with diets promoting an increase in VLDL [6].
Common study endpoints in DIO models are: body weight and composition; food intake and feeding efficiency; blood chemistry parameters for the evaluation of liver and kidney function, lipid and glucose metabolism, and insulin resistance; hepatomegaly (measured as percentual liver to body weight ratio); and histopathological alterations. In addition, High-frequency ultrasound imaging (HFUS) can be a useful complementary tool for studying in vivo and non-invasively the morpho-functional changes of the heart, liver and kidney in such animal models. HFUS offers several possibilities for refinement in preclinical research; for example, it does not use ionizing radiation and allows the examination of different organs with minimal discomfort for mice. In addition, HFUS provides longitudinal and detailed information on disease progression, improving sensitivity and specificity in identifying early stages of the metabolic syndrome in rodent models [7,8]. By providing imaging data in the same mice over time, HFUS reduces the number of mice needed, avoiding sacrifice of cohorts of animals at different times, and improves statistical power compared to cross-sectional studies, allowing each animal to be its own control. Finally, ultrasound imaging is an attractive diagnostic tool in the clinical field since it is relatively cheap compared to other imaging techniques and more easily available; also, it provides a good correlation with pathological findings. Therefore, ultrasonography is a relevant translatable imaging modality, which could improve the “bench-to-bedside” process, rapidly exploiting preclinical research findings into clinical research applications. Although the relatively low signal-to-noise ratio in ultrasound images represents a potential challenge in calculating image features compared to other imaging modalities, this is a rapidly evolving technology, and the development of advanced computerized image analysis methods will be crucial to improve diagnostic accuracy.
In particular, HFUS is a useful diagnostic tool for monitoring the progression of liver disease (i.e., steatosis) in laboratory rodents, with good agreement among US images, gross pathology, and histological sections. Ultrasound can noninvasively examine the internal architecture of the liver parenchyma and changes in liver echogenicity: indeed hepatic fat deposition causes increased echogenicity on ultrasonography owing to intracellular accumulation of lipid vesicles [9]. In this respect, ultrasonography has 84–95% specificity for detecting hepatic steatosis [10], and 90-91% sensitivity for the detection of moderate to marked steatosis. In addition to qualitative ultrasound assessment of changes in shape, size, echogenicity, and alterations in anatomical and echogenic relationships with neighboring organs, the extraction of quantitative features from medical images, known as “radiomics”, allows for more objective and comprehensive assessments of pathologies based on quantitative indices. Furthermore, ultrasound is a first-line imaging technique for the clinical management of cardio-renal metabolic diseases.
Now, attempts to calculate quantitative features from ultrasound images in the field of preclinical research have mainly been performed in the phenotypic evaluation of cancer mouse models [11,12,13]. However, the availability of reliable approaches to perform such characterization in rodent models of obesity-related metabolic alterations has recently attracted attention. In general, NASH in mouse models appears less severe than in humans, with the advantage of showing pathological features of the early stages of the disease, making them useful for the development of new treatments aimed at early processes of NASH or the prevention of fibrosis [14].
The aim of this study was to perform phenotypic characterization of the C57BL/6J mouse strain as a DIO model paradigm, using HFUS for longitudinal evaluation of the morpho-functional changes of the liver, heart and kidney. In particular, the present work analyzed hepatic disease in its earlier stages using an experimental model induced by the administration of a diet that mimics Western human diet.
2. Materials and Methods
Compliance with Ethical Standards
All experimental procedures complied with the European Communities Council directives (2010/63/EU) and national regulations (D.L. 26/2014) and were performed in accordance with National Institutes of Health (NIH) recommendations. The present study was approved by the Animal Welfare Board (AWB) of the Fondazione Toscana Life Sciences (FTLS) and by the Italian Ministry of Health (authorization number 175/2021-03-03 and 175/2023-02-17). All efforts were made to minimize the number of animals used to produce reliable results and their suffering. The Animal Research: Reporting of In Vivo Experiments (ARRIVE) guidelines were followed for the replacement, refinement, and reduction of animals as closely as possible. All the study data are maintained and available on request from the corresponding author.
Study Design and Animals
C57BL/6J mice were purchased from Jackson Laboratories (Bar Harbor, ME) via Charles River (Calco, LC, Italy) at 7 weeks of age. Mice were socially housed in group of up to 4 mice per cage as individual housing could influence parameters assessed on energy balance in metabolic murine models, under standard conditions (12-hour light cycle, ambient temperature of 20-23°C), and free access to food and water [15]. After 7 days of acclimation, the animals were marked for identification. For practical reasons, we divided the 32 experimental animals into 2 cohorts subsequently tested as diet-groups (WD; SD), each containing 16 mice and divided into 2 sets based on sex (8 males and 8 females), examined simultaneously. Experimental sets of mixed sexes are not recommended for studies of energy balance due to sex-differences in adipose tissue depots, inflammatory cytokines, blood lipid profile, and insulin activity [16], while it is suggested that male and female animals be studied separately [17].
Mice in the DIO group were switched from the standard diet [SD: 3% fat, 4RF21, Mucedola®, Italy; Kcal 18.5% from protein; 3% from fat; 53.5% carbohydrates (3% sucrose); kcal/g 3.150] to a lipid-rich diet [WD: 0.2% cholesterol and 21% butter, Western U8958 version 35, SAFE®, France; Kcal 14,4% from protein; 38.1% from fat; 47% carbohydrates (33% sucrose); kcal/g 4.2594] starting from 8 up to 24 weeks of age. The WD was stored at 4°C and replaced once per week to avoid lipid peroxidation. The feeding period of 17 weeks were selected based on the literatures considering findings in mice fed a high fat diet [18,19]. All WD-fed mice appeared healthy and active throughout the diet intervention period, and no mouse had to be euthanized before 17 weeks of feeding.
Mice in the control group were fed SD from weaning until 24 weeks of age. In control group, one male mouse with severe dental malocclusion leading to malnutrition and weight loss was excluded from the study at 16 weeks of age, as it was not suitable to ongoing laboratory experiments. This mouse was euthanized, and data obtained from it were excluded from the analysis. Body weight and food consumption were monitored twice per week over a 17-week period using a precision balance reading to the nearest 0.1 gram, in order to exclude any subject with significant weight loss; mice were weighted immediately after food replenishment [20]. Food pellets were weighted twice per week and the amount of food left in the cages was subtracted from the initially recorded amount. Any large piece of uneaten food found in the cage were also subtracted from the original value and recorded again to maintain maximum precision. Pellets smaller than approximately 5 mm were removed [20]. For each mouse, average daily food intake (g) per week was calculated. According to NIH-MMPCs guidelines, we calculated the body weight (BW) change (g) from the initial body weight measurements to analyze the overall effect of diet on BW [17]. Furthermore, the Body Condition Score (BCS) was monitored at relevant time points (every 8 weeks) over a 17-week period, as recommended, since variations in food intake and body weight of rodents can occur in different context like obesity or accelerated growth [21,22]. Food intake of mice was analyzed as the daily amount of food (g) consumed by single mouse for each experimental week. To evaluate changes in metabolism according to food intake, the food efficiency ratio (FER) was monitored weekly as the (total weight gain / total food intake) × 100. Key data were analyzed separately by sex, as recommended, due to a difference in their energy balance, in body composition and in body fat distribution related to hormonal influence, like in humans [17]. Stress was minimized by assigning responsibility for animal handling to a single, experienced DVM technologist throughout the study. This is suggested as key issue when designing study protocols, since stress per se influences all aspects of energy homeostasis including food intake, energy expenditure, locomotor activity and body composition [17]. Experimental blinding was not achieved because the sole experimenter and sonographer inevitably knew the housing condition and the dietary regimen of each mouse.
Biochemical Analysis
Since several methodological parameters (fasted/feed state; route of blood sampling; anticoagulants; circadian rhythm, restrain method, etc.) can influence blood chemistry results, sample collection time of day, feeding state, route and vessels for blood collection were standardized as best practices throughout a study. At 8 weeks of age (before the start of WD in the DIO group) and at 16 weeks of age (after 8 weeks of WD), whole blood was directly collected in K3-EDTA vials (100 µl/mouse, at 8:00-9:00 AM) by facial vein puncture, under 3 % isoflurane + 2Lt/min oxygen anesthesia (40-60 seconds) consistent with current veterinary recommendations [23,24]. Non-fasting values of glucose, cholesterol and triglycerides were measured (Multicare IN, Biochemical System International), and hyperglycemia was monitored as non-fasting blood glucose ≥250 mg/dL [25,26].
At 24 weeks of age, mice were fasted 3 hours at 8:00-11:00 AM and blood was collected prior to euthanasia under 3% isoflurane + 2Lt/min oxygen anesthesia by cardiac puncture (40-60 seconds) [27]. Blood samples were centrifuged at 3500 rpm for 15 min to obtain sera, which were immediately frozen (-20 °C). Serum alanine aminotransferase (ALT), aspartate transaminase (AST), cholesterol, triglycerides, glucose, and blood urea nitrogen (BUN) results were provided by the laboratories of a research organization (IZSLT, Rome, Italy; Galileo Research, Pisa, Italy) accredited by the Italian Ministry of Health to carry out studies on rodents for research purposes. In addition, fasted serum insulin was determined using Mercodia ultrasensitive mouse insulin ELISA kit. The insulin ELISA protocol is adopted from the manufacturer’s instruction. Insulin units were converted from ng/ml to pmol/l by multiplying by 172.18, and subsequently to µIU/ml by dividing by a conversion factor of 6. Measured blood glucose was converted from mg/dl to mmol/l by multiplying by 0.0555. HOMA-IR was calculated multiplying insulin (µIU/ml) by glucose (mmol/l) and dividing by 22.5. The translational calculation of HOMA-IR adjusted to murine species was adopted from Fraulob e al (2010) [28] and conversion factor of insulin was derived from Knopp et al. (2019) [29]. Alternatively, insulin sensitivity was assessed by using homeostasis model assessment-2 (HOMA2) index using online-based calculator version 2.2.3 on the Diabetes Trials Unit of the University of Oxford website [30], providing values for insulin resistance (HOMA-IR), steady-state β-cell function (HOMA-%B), and insulin sensitivity (HOMA-%S) [31]. Since the reference ranges of most analytes differ significantly with respect to the gender and age of animals, the metabolic changes of blood chemistry parameters in C57BL/6J have been evaluated against gender- and age-dependent reference intervals [32,33,34].
Ultrasound Imaging
Ultrasound images at 8 weeks of age (before WD starting in DIO group), and at 16 and 24 weeks of age (after 8 and 17 weeks of WD in DIO group) were acquired and analyzed by an experienced veterinary operator, using a high-frequency ultrasound unit (VisualSonics 2100, Toronto, Ontario, Canada) equipped with MS550 Blue Transducer probe (central frequency 40 MHz; focal length 6 mm; depth of penetration 5 -15 mm; 30–40 µm axial and 70–90 µm lateral resolution), and using the Vevo Lab software (version 3.0.0). Mice were not fasted before imaging, to minimize animal discomfort and avoid fasting-induced changes in body weight, metabolism, hepatic enzymes, and cardiovascular parameters [35]. During imaging sessions, mice were kept under inhalant anesthesia (induction chamber with 4% isoflurane plus 2 Lt/min oxygen; maintenance with nose cone using the lowest possible dose of isoflurane in the range of 1.5-1.8%) on a heated platform. Such isoflurane concentrations produce stable body temperature, mean arterial pressure (MAP) and heart rate (HR) values in C57BL/6 mice, comparable to those observed in awake animals, so they are recommended for studies of cardiac function and cardiovascular imaging [36]. Body temperature was monitored using a rectal probe and kept in a physiological interval by an infrared lamp. Induction of anesthesia and stabilization of heart rate were performed in approximately 10 minutes before the start of the echocardiographic examination [37]. Approximately 5 minutes of this time-interval was useful for performing trichotomy of the thorax and abdomen of mice before each imaging session, by applying depilatory cream on the skin and subsequently removing it with paper towel moistened with water. In that way, experimental procedure was refined to prevent handling stress and health risks resulting from ingestion of approved depilatory creams during normal grooming behavior [38]. Next, mice were symmetrically positioned in dorsal recumbency, an ultrasound coupling gel was applied to the depilated skin, and the animal’s limbs were coated with conductive paste and taped to four electrocardiogram (ECG) electrodes incorporated in the platform for the measurement of heart rate, ECG and respiratory rate. Conventional echocardiography was performed in anesthetized mice as described before, taking no more than 10 minutes per mouse. To be consistent between animals and images, we stored optimized acquisition settings on the instrument. All B mode ultrasound images were acquired under the same data capture settings (frequency = 40 MHz, frame rate = 20 images/s, gain = 30 dB, depth = 11 mm, width = 13.00 mm, dynamic range = 60 dB, line density: high, sensitivity = high) for each mouse. The time-gain compensation was set to adjust the tissue echogenicity as constant as possible regardless of the depth, and the transmit power was set at 100%. Two-dimensional echocardiography B-mode loops were acquired through the chest wall in single-plane parasternal long-axis (LAX), then rotating the probe 90° clockwise in short axis (SAX), and subsequently analyzed offline. The conventional echocardiography was applied on experimental mice to fully visualize the anatomical structures and wall movements. In LAX the following measurements were performed: the thickness of the interventricular septum (IVS) or the left ventricle anterior wall (LVAW) (this will depend on the imaging plane and rotation of the heart in the thoracic cavity), the left ventricular interior diameter (LVID), the left ventricle posterior wall (LVPW). End-diastolic and end-systolic measurements were obtained at the time of maximal internal chamber dimensions and at the minimal internal chamber dimensions and were measured for at least three heartbeats to calculate an average value [39,40,41].
These measurements were used to calculate EF (ejection fraction), FS (fractional shortening), LV Mass, LV volume in systole and diastole according the following formulas:
EF (%): 100 * ((LV Vol;d – LV Vol;s) / LV Vol;d) [is a measurement, expressed as a percentage, of how much blood the left ventricle pumps out with each contraction]
FS (%): 100 * ((LVID;d – LVID;s) / LVID;d) [is a measurement, expressed as a percentage, of the reduction of the length of the end-diastolic diameter that occurs by the end of systole]
LV mass corr (g): 1.053 * [(LVID;d + LVPW;d + IVS;d)3 – LVID;d3 ] *0.8
Note: myocardial density is approximately 1.053 g/mL; LV Mass Corrected multiplies the LV mass value by 0.8 to “correct” for an overestimation of LV mass, according to manufacturer instructions [42].
LV vol;d (µl) [(7.0 / (2.4 + LVID;d)] * LVID;d3
LV vol;s (µl) [(7.0 / (2.4 + LVID;s)] * LVID;s3
SV (stroke volume) and CO (cardiac output) were calculated according the following formulas:
LV SV [Stroke volume, µl]: (LV Vol, d- LV Vol, s) [is the volume of blood pumped out of the left ventricle of the heart during each systolic cardiac contraction].
LV CO [Cardiac output, ml/minute]: (SV × HR)/1000 [is the amount of blood the heart pumps through the circulatory system in a minute].
To estimate LV geometric remodeling using an index less vulnerable to variability related to body morphometry, relative wall thickness (RWT, the ratio of wall thickness to cavity diameter) was measured as septal wall thickness + posterior wall thickness divided by LV diastolic diameter [(SWTd + PWTd)/LVEDD)] [43,44].
A generally accepted assumption is that a mammal’s heart weight scales linearly to its BW and that cardiac growth also scales proportionally to body growth. In animal experiments, BW or tibia length are generally recommended to index cardiac measures [43,45]. The choice of either BW or TL depends on the disease model under study and the research question that is being addressed. For example, the disease under study might affect BW, such as heart failure by cachexia or fluid retention, while in the case of obese animals, some degree of cardiac hypertrophy is considered normal for their body composition, and subsequently the measure of choice to index by would be BW. Notably, 1-D measures (diameter) were normalized by BW1/3 and 3-D measures (volume/mass) were normalized by BW to avoid biases related to BW changes [45]. Next, liver images were acquired by two-dimensional (B-mode) imaging through the ventral body wall in transversal and longitudinal planes, and subsequently analyzed offline. Four to six B-mode cine-loops imaging the left and right lobes of the liver and at the caudate lobe-right kidney interface were acquired in sagittal and axial imaging planes. To be consistent between animals and images, we stored optimized acquisition settings on the instrument. All B mode ultrasound images were acquired under the same data capture settings (frequency = 40 MHz, frame rate = 16 images/s, gain = 30 dB, depth = 11 mm, width = 13.00 mm, dynamic range = 60 dB, sensitivity = high) for each mouse. The time-gain compensation was set to adjust the tissue echogenicity as constant as possible regardless of the depth, and the transmit power was set at 100%. The liver parenchyma was examined for echogenicity, echostructure, presence or absence of nodules, and border definition. B-mode images (256 grayscale values) were selected at the tele-expiratory phase to reduce at minimum artefacts related to respiratory motion, as well as shadowing artefacts related to bone or intestinal gas.
The detection and grading of hepatic steatosis by visual inspection and parametric evaluation of liver were performed according to previously validated protocols in humans and already applied to mouse models as marker for steatosis:
- Echostructure – score 1: homogenous liver parenchyma and regular hepatic surface; score 2 (mild steatosis): diffuse parenchymal mild heterogeneity, reduced visualization of the diaphragm and small peripheral vessels with no change on liver surface; score 3 (moderate steatosis): discrete coarse and heterogeneous parenchymal echogenicity, dotted or slightly irregular liver surface; score 4 (severe steatosis): extensive coarse and heterogeneous parenchymal echostructure, marked echogenicity, irregular or nodular hepatic surface with underlying regenerative nodules, obscured diaphragm and reduced visibility of kidney.
- Echogenicity (relative to the renal cortex) – score 0: liver less echogenic than the renal cortex; score 1: hepatic echogenicity equal to the renal cortex; score 2: liver more echogenic than the renal cortex.
- Presence of ascites – score 0: absent; score1: present.
- Parametric analysis: The hepatic parenchyma is less echogenic than the right renal cortex in the great majority of rodents, a finding that contrasts with humans [48]. The hepatic echogenicity increases due to the presence of fatty infiltration and/or fibrosis, changing the relation between liver and right renal cortex [9].
- hepatic-renal ratio (HR): This measurement is based on the hypothesis that a higher liver fat content causes an increase in US liver echogenicity. Longitudinal view was acquired in order to have both the liver (caudate lobe) and the right kidney clearly visualized. Liver echogenicity was compared with that of the renal parenchyma, to normalize differences in the overall US gain value used for the acquisitions. Two regions of interest (ROI, (0.1±0.02 mm2) were manually drawn: the first one was placed in the liver parenchyma avoiding focal hypo and hyperechogenicity; the second was positioned in correspondence with a portion of the renal cortex devoid of large vessels, along the focusing area of the image, at the same distance from the probe and along the focus area of the image to avoid distorting effects in ultrasonic wave patterns. HR values were obtained dividing the mean grey level of the hepatic ROI for that obtained for the renal one (Pixel intensity = average intensity/mm2 [a.u.]) [7,46].
- hepatic-portal vein ratio (HPV): Similarly to HR, liver echogenicity was normalized for that correspondent to the blood within the portal vein. The evaluation of this parameter requires the acquisition of US images in order to correctly visualized a portion of the portal vein in the center of the liver. Two ROIs (0.1±0.02 mm2) were manually drawn: the first one was positioned within the portal vein lumen, while the second was placed at the same depth to keep the ultrasound attenuation comparable of the liver parenchyma, avoiding focal hypo and hyperechogenicity. To avoid effects related to borderline echo distortion, the two ROIs were placed as close as possible to the center of the image [7,46].
- gray-level histogram analysis of echogenicity (GLH): liver images at different scanning planes (left lateral lobe, longitudinal; caudate lobe, longitudinal; right median lobe, axial.) were analyzed using a gray-level histogram to obtain the quantitative mean and standard deviation values of echogenicity of each spatial region. Anatomical landmarks (greater curvature of stomach; cranial pole of the right kidney; porta hepatis, at the level which aorta, portal vein, caudal vena cava are visible in cross-section) were chosen to scan imaging planes reproducible. ROIs (1±0.02 mm2) were manually drawn in the liver parenchyma avoiding focal hypo and hyperechogenicity as close as possible in the center of the image, providing objective values of echointensity and echotexture. This approach is useful to include more representative parts of the hepatic parenchyma and avoid errors due to image artifacts, with good intra-observer reproducibility [49]. Changes in brightness and variance of the liver parenchyma were reported as: i) mean echogenicity of different lobes; ìì) standard deviation of brightness within ROI encompassing right median lobe as measure of tissue heterogeneity; ììì) standard deviation of brightness among ROIs in all planes imaged as measure of anisotropy [49,50].
Furthermore, kidney alterations as consequence of the WD have been investigated through the complementary use of blood chemistry and ultrasound morpho-functional evaluation. Since a good correlation of some ultrasonographic features with renal function have been demonstrated, cortical echogenicity and cortical thickness normalized for BW (CRT/BW) were calculated [51,52]. The renal cortical thickness was measured in the sagittal plane at the level of the mid kidney over a medullary pyramid, perpendicular to the capsule as was the distance from corticomedullary junction to the renal capsule [51]. In addition, renal pulsatility index (PI) and resistive index (RI) were measured as reliable and repeatable functional measurements of arterial resistance and compliance. These parameters allow to assess pathological changes in renal hemodynamic, including the early stages of diabetic nephropathy, both in clinical fields and animal research [53,54,55,56]. Moreover, variation in PI and RI may be related to systemic hemodynamic changes, such as heart rate, blood pressure and cardiac output [57].
Several studies have shown that a normal RI value in adults is in the range of 0.47–0.70 with differences of less than 5-8% between the two kidneys; in general, most sonographers consider 0.70 to be the upper threshold of the normal RI [58,59,60]. Since the RI value is the ratio of velocities, instead of absolute value, it is stable and unbiased parameters for flow analysis. In literature, RI value for 24 weeks old C57Bl/6 male mice fed standard chow are reported approximately around 0.5 ± 0.15, while PI value for the same mouse model at 21 weeks of age was 1.18±0.19 (ultrasound examination performed under anesthetic regimen similar to that used in our experiments which and known to be hemodynamically neutral) [53,61]. In all 24-weeks old mice, the right kidney was identified in the B-mode longitudinal plane image with the same acquisition setting used for the liver, and the maximum longitudinal plane was evaluated, focusing on the renal papilla in the center of the organ. Color-Doppler images of the renal vascular tree were used to identify an interlobar artery and guide the positioning of sample volume in correspondence of an intrarenal segmental artery, to measure the blood flow by Pulse Wave (PW) Doppler mode with a PRF (pulse repetition frequency) of 9-10 kHz. On the PW spectrum, the peak systolic velocity (PSV), the End-Diastolic Velocity (EDV) and the velocity time integral (VTI) were calculated over an average of three to four cardiac cycles. Mean velocity (MV) was obtained by semi-automatically tracing the envelope of the flow signal corresponding to a single cardiac cycle. Based on these measurements, the RI was calculated as following: RI = (PSV – EDV) / PSV [54,62], while the PI was assessed as (PSV-EDV)/MV [61]. After the imaging sessions, mice were allowed to recover completely in a heated cage, and monitored for signs of pain or discomfort.
Histological Examination
Liver was weighted and then samples of the organs of interest were formalin-fixed and embedded in paraffin as previously described [64]. Briefly, samples were formalin-fixed for 24h, dehydrated and embedded in paraffin. Seven μm sections were cut from each paraffin block and stained with hematoxylin and eosin (H&E) for morphological evaluation. Periodic Acid-Schiff (PAS) and Masson’s trichrome staining were used to assess glycogen and collagen content, respectively. Two unblinded examiners, including an anatomical pathologist and a veterinarian with competencies in animal pathology (VB and SG) reviewed histological sections and performed the histopathological evaluation using a Nikon Eclipse E600 light microscope equipped with a digital camera. The morphometric analysis was done using Nis element v3AR software (Nikon Instruments, NY, U.S.A). Steatosis and inflammation were assessed on H&E-stained slide. At least five microscopic fields per section (400X magnification) and three section per animal were examined, including at least two different hepatic lobes; microscopic fields including hepatic venules and portal tracts were excluded. The pathological grades of fatty liver disease in each mouse were determined by the NAFLD preclinical scoring system [65], a validated histological score adapted in rodents from the human NASH–Cancer Research Network scoring system [63]. This simplified score comprises 4 histological features which are evaluated semi-quantitatively: steatosis: macrovescicular (score 0-3), microvescicular (score 0-3), hypertrophy (score 0-3); inflammation (score 0-3). A global NAFLD activity score (NAS) was defined as the unweighted sum of the scores for steatosis, hypertrophy and inflammation, thus ranging from 0 to 9. In addition, the presence and extent of fibrosis was evaluated for NAFLD staging [65]. Changes from normal hepatocyte morphology were classified as borderline lesions accordingly steatosis, activity, fibrosis (SAF) scoring system [66] and differential diagnosis were made from glycogen accumulation [67]. Histological analysis of renal structural changes was performed on H&E and PAS-stained sections on 20 glomeruli per mouse throughout the cortex, using a simplified scoring system according to that previously described in laboratory rodents [68]. In particular, the presence of morphological alterations of the glomerular areas was examined by two unblinded anatomists, with a semi-quantitative score as follows: score 0: none or <30% of glomeruli altered; score 1: >30 - <70 % of glomeruli altered; score 2: >70% of glomeruli altered.
Statistical Analysis
In this experimental protocol, we examined the effects of SD and WD in C57Bl/6J WT mice for future comparison with genetically modified mice, C57Bl/6J genetic background. Experimental group included 7-8 mice (n=7-8). The sample size was calculated a priori, based on relevant data from scientific literature [69] in order to obtain statistically significant results for differences of at least 30% (Reference mean = 100; Test mean = 70) between the averages of the measurements carried out for the various parameters examined. A power of 80%, an expected variability of 20% (Standard deviation = 20) and a significance level of 5% (P≤0.05) were considered. Further statistical analyses were performed using GraphPad Prism software version 8.0 (GraphPad Software, Inc., San Diego, CA). Since the distribution of the data was unknown, variables were analyzed by use of nonparametric tests were appropriate. The t test/Mann-Whitney test was used to compare differences in experimental outcomes between sex-and age- matched control and DIO groups. Repeated measures – One-way ANOVA/Wilcoxon test was used to detect differences in experimental outcomes over time (8, 16, 24 weeks of age) in the same group. Repeated measures – Two-way ANOVA-Mixed effect model followed by Sidak’s multiple comparison post-hoc test was used where appropriate, to compare group differences within time-points of interest. Statistical significance was set at P < 0.05. Extreme values of the biochemical analysis of a 24-week-old male mouse in the SD group were excluded from the statistical calculations, and insulin sensitivity data were lost for one male mouse in WD group for insufficient sample quantity. Pearson correlations (one-tailed) were performed between the semi-quantitative and ordinal data of the NAS scoring system and the US visual grading, as well as the numerical values of the parametric ultrasound analyses.
3. Results
3.1. General Health-Behavioral Status
All WD-fed mice appeared healthy and active throughout the dietary intervention period and none of them exhibited signs of adverse health and had to be euthanized before experimental endpoint. Specifically, we did not observe sudden decrease in body weights (10 grams over 7 days), and/or abnormal changes in fur and skin integrity (i.e., focal hair loss and ulcerative dermatitis) previously reported in wild-type or transgenic C57Bl/6J mice under high fat /cholesterol diet [70,71,72]. As observational evidence, male mice were progressively less active compared to female. Mainly female mice exhibited “food grinding” behavior [73,74]. Therefore, any large piece of uneaten food found in the cage (that had fallen through the hopper bars) were returned to the hopper, orts production was measured as the mean amount fragmented (g/mouse/day) and the mass of food missing from the hopper was recorded.
3.2. Growth Metrics
Measurements of weight and body condition recorded throughout the study revealed significant changes to the physical state of mice in response to Western-style regimen. Baseline BW (g) was not different between male SD and male WD groups (Mann-Whitney test, p=0.7587). However, male WD group showed a trend in greater mean BW (g) than male SD group starting from 11 weeks of age until endpoint, and ANOVA showed statistical significance between 13 and 15 weeks of age [F (16, 208) = 5.978; p<0.0001; Sidak’s test p<0.05] (Figure 1A). Female SD group was significantly heavier than female WD group at 8 weeks of age before starting the dietary intervention (Mann-Whitney test, p = 0.0005). However, female WD group showed a trend in greater mean BW (g) than female SD group starting from 19 weeks of age until endpoint, even if ANOVA confirmed statistical significance only at 8 weeks of age [single main effect: diet intervention F (1, 14) = 0.08653; p<0.7730; Sidak’s test p<0.05] (Figure 1B). Nevertheless, BW of all females was within the strain- and age-specific normal range provided by supplier [34,75] and derived by literature [76] at each experimental point. For that reason, BW gain (g) from baseline was correctly used for comparisons [77]. As shown in Figure 1C,D, high fat/carbohydrate feeding resulted in increased rates of body weight gain in both male and female mice, respectively. In male mice, ANOVA demonstrated significant effects of age [F (2.188, 28.45) = 121.2, p<0.0001] and diet intervention [F (1, 13) = 15.03, p<0.0001] on BW gain (g), as well as a significant interaction between age and diets [F (16, 208) = 7.182, p<0.0001]. Overall, WD resulted in a greater increase in body weight of male mice, which was statistically significant from 12 to 15 weeks of age (Sidak’s test p<0.01). Similar results of ANOVA were obtained in female mice, showing a significant effect of age [F (3.235, 45.29) = 92.79, p<0.0001] and diet intervention [F (1, 14) = 11.43, p<0.0001] on BW gain (g), and a significant interaction between age and diets during experiment [F (16, 224) = 5.217 p<0.0001]. Indeed, female mice gained a greater amount of body weight in response to a 17-wk exposure to WD, which was statistically significant from 9 to 10 weeks of age and at the endpoint (Sidak’s test p<0.05).
In this study, the WD intervention produced a significant increase in BCS only in C57BL/6J males compared with SD-fed mice at 16 and 24 weeks of age [single main effect: age F (1.000, 14.00) = 73.00; diet intervention F (1, 14) = 289.0; interaction effect: F (2, 28) = 73.00; p=0.0001; Sidak’s test p<0.05] [Figure 2A,B]. This finding was consistent with visual evidence of increased subcutaneous, abdominal and gonadal adipose tissue depots, as well as “fatty liver” appearance at necropsy of rodents [78], despite no significant difference in BW gain compared to counterpart at these experimental points, suggesting sex-dependent differences in fat distribution pattern [Figure 2C,D].
At 24 weeks of age, the liver weight (g) was not significantly different between SD- and WD-fed groups [Figure 3A,B], but the ratio of liver weight to body weight (%) [Figure 3C,D] were significantly higher in the WD-fed males and females compared to the control groups (Mann-Whitney test, p=0.0289 and p=0.0379, respectively).
3.3. Feeding Behavior
Overall, mice of both sexes showed a change in food intake in response to WD, and the dietary regimen exerted effects on feeding pattern in an age- and sex-specific manner, as shown in Figure 4. In male mice, ANOVA demonstrated significant effects of age [F (1.826, 23.73) = 15.27, p<0.0001] and diet intervention [F (1, 13) = 132.5, p<0.0001] on food intake (g), as well as a significant interaction between age and diets [F (16, 208) = 35.31, p<0.0001]. Male WD group displayed a variable trend of food intake from 8 to 16 weeks of age and significantly greater values at 8 and 12 weeks of age compared to male SD group, while the male WD group ate significantly less than SD males from 16 to 24 weeks of age (Sidak’s test p<0.0001). In female mice, ANOVA showed a non-significant effect of dietary intervention on food intake [F (1, 14)=1.754; p<0.2066]. Nevertheless, a significant effect of age [F (1.348, 18.87) = 24.31; p<0.0001] and a significant interaction between age and diets [F (16, 224) = 24.31, p<0.0001] were reported. Overall, female WD mice ate significantly more than the sex-matched control group from 8 to 12 weeks of age, and the trend subsequently reversed, eating significantly less than their counterpart at 16 and 18 weeks of age (Sidak’s test p<0.0001), with a pattern similar to what was described in males [Figure 4A,B]. Assuming that WD had a higher caloric density than SD, ANOVA demonstrated significant effects of age [F (2.047, 26.62) = 22.18, p<0.0001] and diet intervention [F (1, 13) = 279.6, p<0.0001] on caloric intake (kcal/day), as well as a significant interaction between age and diets [F (16, 208) = 46.17, p<0.0001] in male mice. Male WD group initially showed increased calorie intake than male SD group from 8 to 17 weeks of age, reaching statistical significance at different time points. Thereafter, the trend significantly reversed (Sidak’s test p<0.0001) and finally male WD and SD groups were nearly isocaloric from 21 to 24 weeks of age. In female mice, ANOVA demonstrated significant effects of diet intervention [F (1, 14) = 70.44, p<0.0001] and a significant interaction between age and diets [F (16, 224) = 26.79, p<0.0001] on caloric intake (kcal/day). Female WD group showed a significantly higher caloric intake than the female SD group from 8 to 16 weeks of age but, unlike males, the trend never reversed and the isocaloric phase was reached at 22 weeks of age (Sidak’s test p<0.05-p<0.0001) [Figure 4C,D]. In male mice, ANOVA showed significant effects of age [F (2.013, 26.16) = 96.11, p<0.0001] and diet intervention [F (1, 13) = 10.27, p<0.0001] on FER, as well as a significant interaction between age and diets [F (16, 208) = 10.67, p<0.0001]. Male WD group displayed a greater FER than male SD group from 13 weeks of age, with statistically significant different values at 14 and from 18 to 20 weeks of age (Sidak’s test p<0.05). In female mice, ANOVA did not show a significant effect of dietary intervention on FER [F (1, 14) = 2.316 p<0.1503]. Although a significant effect of age [F (2.276, 31.86) = 60.16; p<0.0001] and a significant interaction between age and diets [F (16, 224) = 5.894, p<0.0001] were observed, FER was not significantly different between WD mice and the sex-matched control group at any time-point (Sidak’s test p>0.05) [Figure 4E,F]. Overall, the tendency for greater body weight gain during WD could be explained by a temporary hyperphagic phase observed within the first 10 week of high fat/sucrose diet regimen in WD-fed mice. WD-fed C57Bl/6J mice showed an initial phase of food/caloric overconsumption (first half of the dietary intervention period) followed by a normalization phase. However, a significant difference in FER was found in the last experimental weeks only between male WD- and SD- fed mice when male WD group developed an overweight phenotype, even though it ate less than male SD-fed mice and consumed an equivalent amount of calories.
3.4. Lipid Metabolism
Development of hyperlipidemia was serially monitored using the non-fasting blood triglycerides and cholesterol levels determined by a multiparameter diagnostic device, as previously described in literature [25,26].
In clinical field, there is evidence that non-fasting lipid profile could better predict cardiovascular risk than fasting levels [79,80]. Similarly, atherosclerotic plaques development in Apoe−/− mice showed a significant correlation with non-fasting glucose and triglycerides, but not with fasting cholesterol and triglycerides levels [81]. Overall, ANOVA did not show a significant main effect of dietary intervention on non-fasting total cholesterol (mg/dl) in male mice, [F (1, 13) = 2.095; p=0.1715], even though a significant effect of age [F (1, 13) = 11.28; p=0.0051] and a significant interaction between age and diets [F (1, 13) = 10.67, p=0.0061] were observed. Notably, non-fasting basal total cholesterol levels were not significantly different between male groups, but a significant increase of blood cholesterol was observed after 8 weeks of WD (Sidak’s test p>0.05) [Figure 5A]. A significant interaction between age and diets [F (1, 13) = 10.67, p=0.0061] was observed also on non-fasting triglycerides [F (1, 13) = 74.00; p<0.0001] [Figure 5C]. Male WD group had significantly higher non-fasting triglycerides (mg/dl) at 8 weeks of age before starting the dietary intervention, whereas the trend was reversed at 16 week of age after 8 weeks of WD (Sidak’s test p>0.01). For that reason, changes in plasma triglycerides (mg/dl) from baseline were used for comparisons and a significant decrease of triglycerides was observed after 8 weeks of WD (Mann-Whitney test p=0.0003) [Figure 5E]. Similarly, ANOVA showed no significant main effect of dietary intervention on non-fasting total cholesterol (mg/dl) in female mice, [F (1, 14) = 2.429; p=0.1414], despite a significant effect of age [F (1, 14) = 15.03; p=0.0017] and a significant interaction between age and diets [F (1, 14) = 25.66, p=0.0002] were observed [Figure 5B]. Non-fasting basal total cholesterol levels were not significantly different between female groups, but blood cholesterol increased significantly after 8 weeks of WD (Sidak’s test p>0.001). Furthermore, a significant effect of dietary intervention [F (1, 14) = 29.23; p<0.0001] and a significant effect of age [F (1, 14) = 23.89; p=0.0002] on non-fasting triglycerides was highlighted in females. Female SD group had significantly higher non-fasting triglycerides (mg/dl) at 8 weeks of age before starting the dietary intervention, as well as at 16 week of age (Sidak’s test p<0.05) [Figure 5D]. For that reason, changes in plasma triglycerides (mg/dl) from baseline were used for comparisons (Mann-Whitney test p>0.05) [Figure 5F].
Fasting total cholesterol was significantly higher in WD group of both sexes compared to SD-fed counterparts also at 24 weeks of age (Mann-Whitney test p=0.0143 and p=0.0002, respectively) [Figure 6A,B]. Conversely, at the same age, fasting triglycerides were significantly greater only in male WD group compared to SD-fed controls (Mann-Whitney test p=0.0370) [Figure 6C,D].
In summary, after 8 weeks of WD, non-fasting total cholesterol increased significantly in both female and male mice, while triglycerides showed an unexpected reduction. This finding has been described in other studies on C57Bl/6J mice fed a high fat-high cholesterol diet [10,82]. The hypothesis was that this specific dietetic regimen might result in reduced synthesis and/or increased clearance of triglycerides or decreased hepatic VLDL secretion/increased absorption of triglycerides from adipose tissue due to the acute increase in insulin [10]. Furthermore, it has been described that the expression of lipoprotein lipase can be induced in the liver of adult mice with high dietary cholesterol, lowering plasma triglycerides levels [83]. In addition, these results could be interpreted considering that sex- and age- related differences in serum biochemical parameters have been described in the SD-fed C57BL/6J mouse strain [32] and that variable results have been reported depending on the age of mice and to the vending source of mouse substrain [84,85].
3.5. Glucose Homeostasis
Glucose homeostasis is regulated through a fine balance between its synthesis and catabolism, involving hepatic gluconeogenesis and insulin levels. Sexual dimorphism regarding glucose homeostasis has been described in the C57BL/6J mouse strain, although few studies have evaluated the metabolic effects of WD in female mice [1]. No significant changes over time in non-fasting blood glucose (mg/dl) were observed between sex- matched SD- and WD-fed groups [ANOVA, effect of diet intervention, males: F (1, 13) = 0.002305, p=0.9624 - females: F (1, 14) = 1.499, p=0.2411; effect of age, males: F (1, 13) = 0.8042, p=0.3861 - females: F (1, 14) = 0.0003461, p=0.9854; interaction between age and diets, males: F (1, 13) = 0.001694, p=0.9678 - females: F (1, 14) = 0.01696, p=0.8982] [Figure 7A,B]. Only two males in WD-fed group showed mild hyperglycemia after 8 weeks of WD (specifically, non-fasting blood glucose values of 250 and 253 mg/dl). Measuring fasting glucose and insulin is a simple approach to detect alterations in glucose metabolism, and the HOMA index is a useful indicator of relative insulin resistance. At 24 weeks of age, fasting blood glucose was significantly higher in WD group of both sexes compared to SD-fed counterparts (Mann-Whitney test, males: p=0.0002 and females: p=0.0030) [Figure 7C,D]. Furthermore, the male WD group showed a significantly higher fasting insulin value (ng/ml) and a significantly lower HOMA-percent sensitivity (HOMA S, %) (Mann-Whitney test p=0.0012 and p=0.0043, respectively) [Figure 7E,G]. A trend toward impaired β-cell function (HOMA B, %) and insulin resistance (HOMA IR) was highlighted in male WD group, although there was no statistically significant difference compared to SD-fed males [Figure 7I,M]. In contrast, the SD-fed and WD-fed female groups showed no significant differences in fasting insulin values, although a trend toward higher values of fasting insulin and insulin resistance was observable in WD-fed mice [Figure 7F,N], as well as a lower insulin sensitivity and β-cell function [Figure 7H,L].
3.6. Liver and Kidneys Function
AST and ALT are widely used to investigate liver injury in humans and rodents. ALT is a more specific biomarker of hepatic alterations like steatosis, due to its greater concentration in the liver compared with other tissues, while AST has the highest concentration in the heart followed by the liver, skeletal muscles, kidneys, brain, and pancreas [86].
The male WD group showed higher ALT (U/L) and AST (U/L) values compared to SD- fed counterpart, reaching statistical significance for AST (Mann-Whitney test p=0.002) [Figure 8A,C]. A similar trend was observed between SD-fed and WD-fed female groups for AST. Conversely, female WD group showed significantly lower ALT values compared to sex-matched controls (Mann-Whitney test p=0.0134) [Figure 8B,D]. However, liver enzymes were in the normal range reported in literature for both SD-fed and WD-fed mice [85,87]. Interestingly, BUN (mg/dl) was significantly higher in SD groups of both sexes (Mann-Whitney test, males: p=0.0003 and females: p=0.0001) [Figure 8E,F], although yet in the reference range for healthy mice.
BUN represent the final product of the hepatic detoxification of ammonia and could be useful to investigate liver function. BUN may decrease when conversion of ammonia to urea by the liver is impaired by parenchymal liver disease. However, low serum BUN is not specific for liver disease and is also seen in subjects consuming low-protein diet [88]. Low-protein content for a laboratory mouse diet is ≥14% [89]. Moreover, qualitative changes in body composition related to metabolic syndrome, characterized by augmented visceral fat and muscle mass reduction, are gained attention as a risk factor for hepatic steatosis and was found related to decreased BUN value [90].
3.7. Ultrasound Imaging
All animals showed normal sinus rhythm on ECG and, based on the visual wall motion assessed, no evident myocardial contraction abnormalities of the left ventricle were captured on the B-mode movie frames acquired in the long and short axis views.
Descriptive statistics (mean ± SD) for echocardiographic morphometric and functional parameters over time are reported in Table 1. ANOVA for repeated measures was used to evaluate the differences between the sex-matched diet-groups concerning the significant echocardiographic parameters. Since ANOVA post-hoc test revealed that some baseline echocardiographic normalised measurements at 8 weeks of age were statistically different between the sex-matched groups (Sidak test p>0.05), the magnitude of changes from baseline was used correctly in these cases for comparisons. In male mice, ANOVA showed overall no significant differences in the magnitude of IVS/LVAW; d changes between SD- and WD-fed mice, while IVS/LVAW; s variations over time showed a significative interaction between age and diets [F (1, 13) = 8.393, p=0.0125], although the post-hoc test showed no statistical differences between SD- and WD-fed male mice at 16 and 24 weeks of age. Age had significant effects on both LVID; d and LVID; s equally on SD- and WD-fed mice [ANOVA, single main effect of age: F (1.877, 24.40) = 72.23 and F (1.925, 25.02) = 28.27 respectively; p<0.0001]. LVPW; d values were significantly lower in WD-fed males at 16 and 24 weeks compared to SD-fed counterpart [ANOVA, effect of diet intervention: F (1, 13) = 15.61, p=0.0017; effect of age: F (1.585, 20.61) = 4.283, p=0.0354; interaction between age and diets: F (2, 26) = 0.06788, p=0.9345; Sidak test p=0.0213 and p=0.0137 at 16 and 24 weeks of age, respectively]. In addition, diet and age had a significant effect on LVPW; s, with a tendency similar to the diastolic parameter [ANOVA, effect of diet intervention: F (1, 13) = 6.011, p=0.0291; effect of age: F (1.946, 25.30) = 5.476, p=0.0111; interaction between age and diets: F (2, 26) = 0.1252, p=0.8829]. Global systolic function parameters EF and FS showed no statistical differences between SD- and WD-fed male groups, as well as LV mass corrected. HR was monitored and generally maintained at 400–500 beats per minute (bpm), occasionally dropping <400 in one male at 16 weeks of age (Sidak test p=0.0268), otherwise showing no significant differences between groups of male mice. Diastolic and systolic LV volume, as well as SV and CO, showed significant changes overtime, but without statistical differences between different diets [ANOVA, single main effect of age: F (1.907, 24.80) = 13.58, p<0.0001; F (1.875, 24.37) = 3.589, p=0.0456; F (1.899, 24.69) = 10.66, p=0.0005; and F (1.682, 21.86) = 11.39, p=0.0007 respectively]. Although the post-hoc test showed no statistical differences between SD- and WD-fed male mice at any time point, RWT was significantly affected by age and diet, with an higher tendency for SD-male mice [ANOVA, effect of diet intervention: F (1, 13) = 10.35, p=0.0067; effect of age: F (1.833, 23.83) = 11,38, p=0.0005; interaction between age and diets: F (2, 26) = 0.02768, p=0.9727; Sidak test p>0.05]. In female mice, ANOVA showed overall no significant differences in the magnitude of IVS/LVAW; d changes and in IVS/LVAW; s. Similarly to male mice, age had significant effects on both LVID; d and LVID; s regardless of diet [ANOVA, single main effect of age: F (1.497, 20.96) = 84.36 and F (1.623, 22.73) = 58.19 respectively; p<0.0001]. In contrast to males, diastolic and systolic LVPW showed no significant differences over time and between SD- and WD-fed groups. As with males, EF, FS, and LV mass-corrected showed no statistical differences between SD- and WD-fed female groups. Although female mice showed an overall HR between 400 - 500 beats bpm, this value dropped to 300 - 400 bpm in 50 % of WD-fed females. Nevertheless, ANOVA showed no significant differences in the magnitude of HR changes overtime between SD- and WD-fed mice, instead revealing a slight relative increase in this parameter with age [ANOVA, single main effect of age: F (1, 14) = 4.819 p=0.0455]. SV and CO showed significant changes with age as well as a significant interaction between age and diets, showing a lower trend in females fed WD compared to counterpart fed SD; in particular, a significant main effect of diet for CO was highlighted [ANOVA, effect of diet intervention, SV: F (1, 14) = 0.08110, p=0.7800 - CO: F (1, 14) = 6.523, p<0.0229; effect of age, SV: F (1.422, 19.91) = 12,17, p=0.0010 - CO: F (1.405, 19.67) = 7.852, p=0.0063; interaction between age and diets, SV: F (2, 28) = 9.257, p=0.0008 - CO: F (2, 28) = 5.614, p=0.0089; Sidak test CO 16 weeks of age, p=0.0074]. Finally, the magnitude of RWT changes in female mice was significantly affected by age and the interaction between age and diets, with a higher trend for WD-fed mice [ANOVA, effect of diet intervention: F (1, 14) = 3.780, p=0,0723; effect of age: F (1, 14) = 6.749, p=0.0211; interaction between age and diets: F (1, 14) = 4.618, p=0.0496; Sidak test 16 weeks of age, p=0.0175].
Qualitative ultrasound examination of liver at baseline showed no altered echogenicity and echostructure in all mice. Visual inspection highlighted that at 24 weeks of age, 14% of SD-fed male mice showed a slightly diffuse increase in liver echogenicity/heterogeneity of echotexture and, in all mice, liver was less echogenic than the renal cortex. Conversely, WD-fed male mice showed a diffusely increased echogenicity (12,5%), a discretely (16,6%) or extensively coarsened and heterogeneous parenchyma (12,5%), whose brightness was higher to the right renal cortex in some mice (25%). At the same age, all SD-fed female mouse showed no obvious ultrasonographic alterations of the liver, while WD-fed female mice showed a diffusely increased parenchymal echogenicity (62,5%) or discretely coarsened and heterogeneous parenchyma (37,5%), as well as liver brightness nearly equal to the right renal cortex in some mice (25%) [Table 2, Figure 9 and Figure 10].
PANEL (B) example of normal, liver/kidney echogenicity ratio, constant over time in a 24-weeks-old female mouse (upper row, left); homogenous liver parenchymal echogenicity and echostructure, regular hepatic surface, sharp margins, distinct visualization of the portal vein vessels (upper row, right). Histological evaluation of the same liver parenchyma in US images showing homogenous distribution of hepatocytes with eosinophilic cytoplasm (H&E); PAS staining highlights the presence of diffuse physiologic cytoplasmic glycogen (lower row, right). Scale bar 50 µm.
Orange arrows: intestinal loops with mucous or gaseous pattern, associated with shadow effects; PV: portal vein; CCv: caudal vena cava; AbAo: abdominal aorta.
PANEL (A) example of mild steatosis in a 24-week-old male mouse, with liver parenchyma even less echogenic than the right renal cortex (score 0), but diffusely increased parenchymal echogenicity and slightly rounded lobe edges (score 2) compared to those observed at 8 weeks of age. H&E histological evaluation of the same liver parenchyma showed “patches” of round-shaped hepatocytes with pale, reticulated cytoplasm, of normal size or enlarged some of which corresponded to physiological deposits of glycogen in the cytoplasm (PAS), otherwise identified as lipids (Oil-Red-O staining, data not shown). Scale bar 50 µm.
PANEL (B) example of severe steatosis in a 24-week-old male mouse, showing a marked increase of echogenicity, reduced visibility of portal vessels, enlarged volume of the liver extending caudally to the costal arch, rounded margins (red dotted line), coarse and heterogeneous parenchymal echostructure (score 4); caudate hepatic lobe echogenicity was greater than the right renal cortex echogenicity (score 2) compared to those observed at 8 weeks of age. H&E histological of the same liver parenchyma showed diffuse fatty liver, with large lipid droplets (black arrowheads), swollen hepatocytes containing small lipid droplets (microvesicular steatosis, green arrows). PAS staining confirmed the presence of lipid accumulation showing large white areas. Scale bar 50µm.
PANEL (C) example of moderate steatosis in a 24-week-old female mouse, displaying discrete coarse and heterogeneous parenchymal echogenicity (score 3) and hepatic echogenicity equal to the renal cortex (score 1) compared to those observed at 8 weeks of age. H&E histological of the same liver parenchyma showed diffuse microvesicular steatosis (green arrows) evolving into large lipid droplets (black arrowheads). PAS staining confirmed the presence of hepatocytes with microvesicular steatosis (white areas) and with glycogen deposits (pink areas). Scale bar 50µm.
Orange arrows: stomach; orange arrowheads: intestinal loops with mucous or gaseous pattern, associated with shadow effects; blue arrows: acoustic shadowing by the ribs.
In multiparametric analysis, all ultrasound measures analyzed at baseline before the start of the dietary intervention were not statistically different between the sex-matched groups (Sidak’s test p>0.05). In male mice, mean echogenicity of liver parenchyma did not showed significative changes over time and between the different diets, while in female mice overall a significative effect of age on this index has been observed [ANOVA, effect of diet intervention, males: F (1, 13) = 0.07539, p=0.4010 - females: F (1, 14) = 0.2933, p=0.5966; effect of age, males: F (1.715, 22.30) = 2.124, p=0.1483 - females: F (1.490, 20.86) = 4.0, p=0.0316; interaction between age and diets, males: F (2, 26) = 0.9775, p=0.3897 - females: F (2, 28) = 1.998, p=0.1545]. Ultrasound images can be processed by calculating the ratio between the average gray-level intensities of a ROI traced in the liver parenchyma and another in a reference anatomical structure like renal cortex or a vessel lumen, which is assumed to have a constant average brightness over time, generating operator-independent sonographic indexes to evaluate the texture alterations of the liver. In male mice, HR ratio did not show significative changes over time and between the different diets, while in WD-fed female group a progressive increase of this index has been observed from 16 to 24 weeks of age compared to SD-fed female group. Nevertheless, a similar trend has been observed in the WD-fed male group in comparison to the SD-fed counterpart at the same time points [ANOVA, effect of diet intervention, males: F (1, 13) = 0.05244, p=0.4818 - females: F (1, 14) = 29.76, p<0.0001; effect of age, males: F (1.866, 24.26) = 1.022, p=0.3701 - females: F (1.649, 23.09) = 6.939, p=0.0065; interaction between age and diets, males: F (2, 26) = 0.3281, p=0.0536 - females: F (2, 28) = 0.3446, p=0.0459; Sidak’s test, females: 16 weeks, p=0.0005; 24 weeks, p=0.0033] [Figure 11].
Comparable results were obtained about HPV ratio [ANOVA, effect of diet intervention, males: F (1, 13) = 0.1735, p=0.2105 - females: F (1, 13) = 12.50, p<0.0037; effect of age, males: F (1.445, 18.79) = 3.290, p=0.0727 - females: F (1.576, 20.48) = 9,767, p=0.0019; interaction between age and diets, males: F (2, 26) = 0.05281, p=0.09487 - females: F (2, 26) = 2.537, p=0.0985].
As representation of local variation in tissue echogenicity, heterogeneity of right median liver lobe did not showed significative effects of diet and age in mice of both sexes, although interaction between diet intervention and age was significative in females at 24 weeks of age [ANOVA, effect of diet intervention, males: F (1, 13) = 0.7151, p=0.4130 - females: F (1, 14) = 0.01106, p=0.9177; effect of age, males: F (F (1.554, 20.21) = 0.4260, p=0.6090 - females: F (1.754, 24.56) = 3.012, p=0.0735; interaction between age and diets, males: F (2, 26) = 0.6800, p=0.5154 - females: F (2, 28) = 4.434, p=0.0212; 24 weeks Sidak’s test p=0.0258]. Anisotropy, as measure of regional variation in tissue brightness among different lobes, showed significative changes between the different diets in mice of both sexes, with WD-fed mice showing a trend towards higher values compared to SD-fed mice of the same age and sex [ANOVA, effect of diet intervention, males: F (1, 13) = 6.430, p=0.0249 - females: F (1, 14) = 7.899, p=0.0139; effect of age, males: F (1.920, 24.95) = 2.258, p=0.1272 - females: F (1.535, 21.49) = 0.2147, p=0.7502; interaction between age and diets, males: F (2, 26) = 0.9083, p=0.4156 - females: F (2, 28) = 0.3328, p=0.7197] [Figure 12].
Finally, the pattern of temporal changes in PV diameter differed between SD- and WD-fed male mice, although this value was not statistically different at any time point in both sex-matched comparisons [ANOVA, effect of diet intervention, males: F (1, 13) = 0.004345, p=0.9484 - females: F (1, 14) = 1.074, p=0.3175; effect of age, males: F (1.965, 25.54) = 8.409, p=0.0016 - females: F (1.542, 21,58) = 3.617, p=0.0544; interaction between age and diets, males: F (2, 26) = 3.894, p=0.0332 - females: F (2, 28) = 0.1340, p=0.8752] [Figure 13].
Over time, all animals showed a normal ultrasound appearance of the right kidney, characterized by the thin, bright line of the renal capsule, a regular and defined renal cortical margin, the medulla in the medial portion of the kidney darker than the surrounding cortex, and the pelvis almost entirely occupied by the papilla [56]. Although WD-fed mice showed slightly lower normalized cortical thickness values, no significant differences were found in CRT/BW between sex-matched groups fed different diets (Mann-Whitney test, p>0.05). However, unlike males, ANOVA showed a significant increase in renal cortex echogenicity from baseline in WD-fed female mice compared to SD-fed ones [ANOVA, effect of diet intervention: F (1, 14) = 8.796, p=0.0102; effect of age: F (1, 14) = 0.03374, p=0.8569; interaction between age and diets: F (1, 14) = 0.001743, p=0.9673].
At 24 weeks of age, PI and RI were not statistically different between SD- and WD-fed male mice, whereas in WD-fed female mice these values were significantly lower than SD-fed counterpart (Mann-Whitney test, p>0.05 and ≤0.01, respectively) and compared to the reference range. This finding could be likely related to the lower trend for SV and CO found in WD-fed female compared to SD-fed ones [Figure 14]. The correlation of renal RI with systemic circulation parameters has been well demonstrated, highlighting the complex interplay between systemic and renal circulation, and making this parameter an indicator of subclinical hemodynamic alterations as well as a marker for kidney disease [57].
3.7. Histological Examination
The pathological grades of fatty liver disease in each mouse were determined by the NAFLD preclinical scoring system as reported in material and methods section. Histological samples were scored for macrovesicular and microvesicular steatosis, hypertrophy and inflammation. Briefly, in microvesicular steatosis small, clearly defined lipid droplets are widespread in the cytoplasm of hepatocytes, whereas large lipid droplets that occupy almost the entire cytoplasm of hepatocytes characterize macrovesicular steatosis. Lipid droplets appear optically empty in H&E and PAS-stained sections and progressively displace cells nuclei marginally. Hypertrophic hepatocytes have the same cytoplasmic characteristics but appear much larger than surrounding ones. In Table 3, the total score assigned for the most relevant histological features in murine liver samples is listed by grading category and the number of subjects per score is shown.
In H&E-stained liver sections from 24-weeks-old mice fed SD of either sex, hepatocytes showed a normal appearance with abundant cytoplasm and centrally located round nuclei. The PAS staining revealed glycogen rich areas, allowing the differential diagnosis of physiological glycogen accumulation in mouse liver from borderline pathological foam cells [91].
In WD-fed female mice, 37.5% of subjects showed the lowest grade of macrovesicular hepatic steatosis, while 75% displayed the lowest grade of microvesicular hepatic steatosis and/or hypertrophic hepatocytes encompassing the entire grading window. Mild liver inflammation was observed in one (12.5%) and mild fibrosis in two (25%) WD-fed female mice. Three WD-fed male mice (37.5%) showed histological features of borderline “ballooning” lesions, characterized by “patches” of hepatocytes with round shape and pale, reticulated cytoplasm, with normal or enlarged size, as confirmed by comparison of serial sections stained with H&E, PAS and Oil-Red-O techniques (data not shown). Macrovesicular hepatic steatosis at the lowest grade was observed in 62.5 % of WD-fed male mice, in almost all cases (50%) associated with microvesicular hepatic steatosis in a mixed pattern. No hypertrophic hepatocytes and inflammation were observed, while mild fibrosis was found in the liver of 50% of WD-fed male.
A moderate positive linear correlation was found in male WD mice between US visual grading and NAFLD histological score (Pearson r=0.6379; p= 0.0444), HR index (Pearson r=0.6604; p= 0.0373) and mean liver echogenicity (Pearson r=0.7214; p= 0.0217).
Examination of renal histological specimens revealed no tubulointerstitial lesions in mice of either sex fed different diets. However, we observed Bowman’s space narrowing in glomeruli from WD-fed mice compared to age- and sex-matched SD-fed mice. Table 4 displays the qualitative, semi-quantitative grading of structural renal changes with respect to the proportion of glomeruli affected. Notably, according to the renal score grading used, a different pattern of frequency distribution between sexes was observed under WD: score 0: males, 14.28%- females, 0%; score 1: males, 42.85%- females, 85.71%; score 2: males, 48.85%- females, 14.28%.
Comparable histological features, with progressive collapse of Bowman’s space, have been described early in patients with diabetic nephropathy, leading to glomerulosclerosis in advanced stages of disease [92], and in rodent models fed high fat diet [93,94,95].
4. Discussion
The Western-style diet, which includes energy-dense and palatable processed foods with high fat and sucrose content, can contribute to overweight and, associated with large portions and reduced physical activity, often leads to metabolic damage of the heart, liver and kidneys.
WD-fed C57Bl/6J mice represent a valuable experimental model to study the onset of diet-induced metabolic abnormalities according to sex and age, mimicking the metabolic syndrome in humans, thus providing a contribution to the development of preventive measures and set-up of management strategies in biomedical research.
The characterization of mouse models of metabolic diseases takes advantage of careful planning of procedures and protocols, based on the specific experimental context, and a combination of different techniques to collect information on morphological, functional, biochemical and histological alterations.
In this study, we demonstrated that HFUS represents a useful complementary tool for in vivo phenotyping of cardiovascular, hepatic and renal changes in such animal models. HFUS technology is increasingly recognized as a relevant translational tool in pre-clinical studies, as it can add useful morphofunctional and quantitative information about disease progression. Furthermore, longitudinal assessment can be performed in each subject non-invasively, thus contributing to further refinement and sample size reduction in animal studies.
In agreement with literature, our multimodality approach showed some degree of sex-specific differences in C57Bl/6J DIO murine model fed with WD, with a more evident overweight phenotype in males.
As expected, WD-fed mice of both sexes showed greater changes in BW gain than SD-fed mice.
At 24 weeks of age, mean BW of WD-fed mice increased approximately by 30% compared to SD-fed mice, and a significant interaction between age and diets was observed during experiment (p<0.0001). Furthermore, WD-fed males and females showed differences in body composition and fat distribution, as evidenced by the clinical overweight score observed only in 24-weeks age males (p<0.05), in agreement with an evident greater amount of subcutaneous and visceral adipose tissue and a paler liver seen at necropsy of male mice. Nevertheless, both WD-fed males and females showed hepatomegaly, as evidenced by the significant difference in liver to body weight ratio compared to sex-matched SD-fed mice (p<0.05).
These findings are concordant with well-known sex-specific disparities in obesity susceptibility of the C57Bl/6J mouse strain, likely linked to differences in sex hormone-related regulation of metabolic homeostasis [96]. Our finding are in agreement with a recent study using quantitative imaging DEXA on C57Bl/6J mice fed with high fat/carbohydrate diet. Authors found a significant decrease in lean mass and a significant increase in fat mass in both sexes compared to control mice, although the increase of the fat mass was significantly higher in males than in females [96].
During the first half of the high fat/sucrose diet regimen, WD-fed mice showed significantly higher food intake than SD-fed ones of the same sex, thereafter WD-fed mice ate significantly less.
The higher caloric density of the WD in the hyperphagic phase is likely responsible for the greater rate of weight gain of the WD-fed groups, which reach isocaloric intake with the sex matched SD-fed groups in the last experimental weeks.
Interestingly, WD-fed male mice showed significantly higher FER not only in experimental weeks when calorie intake was higher, but also in later phases, when calorie intake was lower or approximately comparable to that of the SD-fed males.
Otherwise, female mice fed WD showed an overall trend towards higher caloric intake and FER than those fed SD and an overall significant interaction between age and diet.
These results suggest changes in energy balance related to diet composition that varies according to sex. Like in humans, sexual hormones could likely explain differences in body composition and changes in FER over time between males and females, although the overall feeding pattern was comparable in males and females undergoing WD.
Furthermore, sex-differences in loco-motor activity and energy expenditure, as well as in neurological signalling pathways that regulate food intake in response to diet composition have been described [96].
In addition to the sex-specific differences in the pattern of BW and food intake changes, the complex interaction between the impact of WD and age in both sexes has been highlighted for other clinical outcomes.
The C57BL/6J is widely used as mouse strain to generate wild type and genetically modified murine models of obesity and metabolic disease, but little data on reference values for clinical biochemistry are available. Indeed, blood biochemical parameters, such as glucose, triglycerides and cholesterol are relevant for monitoring the metabolic state and diseases in preclinical research. In our study, non-fasting total cholesterol increased significantly in earlier experimental phases in both sexes as a response to WD, while non-fasting triglycerides changed differently between male and female mice. After 8 weeks of WD, non-fasting triglycerides decreased by 133.24% compared to baseline in male WD group, whereas male SD group had an increase of 37.05% of this blood parameter. Otherwise, both female SD and WD groups showed a non-statistically different decrease of this value in early response to WD, ranging from 22.17 to 36.96 % of basal reference, respectively. At 24 weeks of age, fasting triglycerides were significantly higher only in male WD group compared to SD-fed controls. As described previously, our data are in line with some literature, describing an inverse relationship between cholesterol intake and plasma triglycerides levels [10,82,83]. However, in this regards, some reports provide variable results, probably due to differences in the mice strain/substrain and suppliers used, to the range of ages analyzed or to diet duration, as well as to the composition of food [32,84,85]. Importantly, in agreement with a previous study [1], WD-fed mice demonstrated changes in glucose homeostasis and insulin sensitivity (elevations of postprandial and fasting glycaemia, fasting insulinemia, higher HOMA-IR index, lower HOMA-%S index). Notably, at 24 weeks of age, only WD-fed males showed significantly higher insulin and lower HOMA-%S index than SD-fed males. Furthermore, WD-fed mice showed a trend toward higher values of ALT, as well as significantly higher AST values and lower BUN values compared to SD-fed mice of the same sex, which could likely reflect the involvement of diverse organs in diet-related metabolic changes, including heart, liver and kidney, as detailed above [85,86,87,88,89,90].
The reference values for the C57BL/6J mouse of both sexes reported here could contribute to support researchers for interpreting the biochemical data of mouse mutants and corresponding wild-type controls based on the substrain examined.
Hyperlipidemia is responsible of lipid overload in various organs, especially heart and endothelium of blood vessels, liver and kidney, leading to lipotoxicity and tissue damage.
In the present study, the effects of WD on left ventricular structure and function were assessed using echocardiography in both male and female adult C57Bl/6J mice. WD-fed mice showed a mild cardiac remodeling, with a different pattern according to sex. Notably, in WD-fed male mice, LVPW; d values were significantly lower at 16 and 24 weeks compared to SD-fed counterpart (p<0.05), and diet significantly influenced the pattern of RWT values according by age (p<0.01), with a lower trend for WD-male mice. Systolic function was preserved in both males and females feeding WD (EF and FS showed no statistical differences compared to sex-matched SD-fed groups).
Differently, a significant interaction between diet and age was highlighted in WD-fed female mice for SV and CO, showing a lower trend compared to SD-fed females.
HR was not different between sex-matched SD- and WD-fed mice at any time point.
Overall, our results appear in line with those of previous studies. Consumption of WD, with a marked content of both fat and refined sugar, appears to contribute to early metabolic alterations in myocardium, quite distinct from chronic conditions of diabetic cardiomyopathy or heart hypertrophy induced primarily by fat overload [97]. Such alterations could be very interesting from a translational point of view, possibly resembling more closely those that occur in humans consuming unbalanced Western-style diets in association to metabolic syndrome [98]. Overall, our results are indicative of early stages of cardiac remodeling, likely toward concentric hypertrophy in females and eccentric hypertrophy in males, with preserved ejection fraction [98,99]. Nevertheless, WD-fed female mice showed reduced SV and CO compared to SD-fed counterpart, suggesting incipient progression to deterioration of systolic function [100].
A previous study showed that in C57Bl/6J male mice feeding a WD for 24 weeks, diastolic dysfunction was detectable by echocardiography after 16 weeks of diet duration, followed by signs of systolic dysfunction starting from 20 and 24 weeks of diet [97].
Another recent report describes, in the same animal model fed WD for 7 months, a distinct cardiac remodeling phenotype characterized by reduction of EF and SV associated with alterations of cardiac metabolism, due to an anomalous accumulation of lipids both in the endothelium and in the myocardium [101]. Considering this evidence, a strength of our study is that it included both sexes in the echocardiographic analysis, but a limitation was that diastolic function and strain analysis of left ventricle were not performed.
In general, ultrasound images of livers showed a progressive increase in echogenicity over time upon visual assessment in WD-fed mice, while control mice maintained a lower level of brightness during the experimental period. In addition, WD-fed mice showed changes toward parenchymal heterogeneity like a grainier texture at 16 and/or 24 weeks of age, as well as the brightness of liver parenchyma became comparable up to exceeding that of the right renal cortex at the intermediate or final experimental time point. As highlighted previously [9], the presence of renal fibrosis was excluded at histological examination to correctly apply such approach (data not shown).
Overall, these findings were likely related to greater scattering and reflection of the ultrasound waves by the hepatic tissue, mainly due to intracellular lipids accumulation, as confirmed by histology. Although mean liver echogenicity showed no significant changes over time between different age- and sex-matched diet groups, the HR ratio showed a trend toward greater values in WD-fed male mice, reaching significance in WD-fed female mice compared to SD-fed counterparts. Moreover, the quantitative measures of tissue heterogeneity, in particular the variance in tissue echogenicity among different lobes, were significantly higher in WD-fed mice compared to SD-fed mice of the same age and sex, further suggesting variable severity of disease throughout the liver lobes, as confirmed by histology.
In general, the absence of significant differences for some hepatic measurements obtained with HFUS between the matched groups could be related to technical limits of specificity and sensitivity in the case of fat accumulation in the liver was quite mild [10]. Furthermore, the heterogeneity of phenotypes induced in C57Bl/6J mouse substrain feeding high fat dietary regimens, related to variability in individual response, might result in statistically non-significant results [102,103]. On the other hand, the applied quality scoring system allowed to find significant differences between matched groups subjected to different dietary regimes, confirmed by the concordant trend/statistical significance of some quantitative HFUS indices, as well as by histological examination and the correlation among the scores assigned by the two techniques in male WD mice (p<0.05).
Furthermore, the quantitative and qualitative parameters used in our study were derived from various preclinical and clinical studies, but an ultrasonographic multiparametric analysis system for hepatic steatosis has not been yet standardized in mice [7,9,46,47,49,50]. Therefore, the absence of significance for some quantitative ultrasound characteristics could also be related to interspecies differences, suggesting the need for further investigations to implement more specific diagnostic approaches dedicated to murine species.
For HFUS evaluation of kidney after chronic exposure to WD, the anatomical structures of interest have been visualized in B mode, and the interlobar arteries have been identified by color Doppler mode, recording the blood flow parameters through a spectral signal. In this way, HFUS allows both morphological and functional imaging of the kidney in real time and non-invasively, including the assessment of renal cortex thinning and decreased differentiation of corticomedullary junction.
In our study, PI and RI were significantly reduced in WD-fed female mice compared to SD-fed ones.
In literature, a significant correlation was described between PI and RI with glomerular filtration rate and serum creatinine, suggesting they complementary use to biochemical parameters. Moreover, PI and RI were found to be very sensitive to identify early stages of chronic kidney disease, for example in case of obesity and diabetes [60]. Usually, increased RI suggests impaired renal function, especially when associated to histopathologic markers, but overall, several studies showed that RI could indicate pathologies other than those specific to the kidney [104,106]. The complex interplay of different factors such as high fat/carbohydrate diet overconsumption, overweight, impaired glucose tolerance, dyslipidemia, fatty liver disease and aging could contribute to a metabolic cardiomyopathy, characterized by impaired diastolic relaxation with preserved ejection fraction, which in turn could induce a reduction in the LV early diastolic filling [106]. In this regard, due to the limitations of the available equipment/technical issues, the evaluation of diastolic function was not carried out by echocardiography and serum creatinine was not determined in WD-fed mice, even if this serum parameter resulted within normal ranges in mice of both sexes fed SD (data not shown), encouraging future research that addresses these gaps.
Based on these evidences, HFUS might improve early detection of subclinical morpho-functional alterations of the examined organs. The emerging pathological paradigm of WD-induced hepato-cardio-renal syndrome has been studied in rodent models, suggesting an involvement of unbalanced activation of renin-angiotensin aldosterone system, inflammation and oxidative stress in the development of hepatic steatosis, cardiac remodeling and renal alterations after a long-term high fat diet [107,108] driving early tubulointerstitial fibrosis [109]. In particular, female mice fed a WD for 16 weeks showed an enhanced activation of cardiovascular endothelial cell-specific mineralocorticoid receptor signaling compared to males, associated with macro- and micro-vascular stiffening early occurring at the endothelium level before that perivascular and myocardial interstitial fibrosis became evident [109]. The development of renal alterations after consumption of a WD leading to an increase in body weight have been observed particularly in women, but the pathogenetic mechanisms involved are poorly understood, and in this perspective sexual dimorphism in mouse models could help to provide new information [109]. Furthermore, it has been reported that ultrasound evaluation of the kidney, including cortical echogenicity, would better identify renal dysfunction [52]. Morphological parameters of kidney measured by ultrasonography should be appropriately adapted to body size, as suggested in human and animal models [110,111].
In our preclinical research, ultrasonographic and histopathological indexes can be considered complementary. Histology provided ultrastructural details on parenchymal diseases, while HFUS was very useful for investigating cardiac morphology and ventricular contractility, to provide qualitative description of organs surface and internal architecture, and to estimate quantitative parameters related to echogenicity and echostructure of biological tissues, as well as on the diameter and blood flow velocity in the vessels.
Although the results presented here may be specific to the C57BL/6J strain, which was chosen because it is the most commonly used reference strain in diabetes and obesity research [35], they highlight the need to include both sexes in future metabolic studies. Further investigation to elucidate the underlying peripheral mechanisms driving these metabolic differences between males and females will allow for the development of better preventative and treatment strategies for people suffering from weight issues and associated complications.
Overall, our findings showed that HFUS is a useful tool to complement conventional methods of studying DIO research models for more comprehensive evaluation, providing also sex-specific reference values in healthy C57BL/6J mice fed SD and age-matched mice fed WD.
Author Contributions
S.G. and M.C. conceived the study and outlined the scope of work; S.G. conceived and carried out the animal procedures and blood biochemistry, performed imaging acquisition and post-processing, and wrote the original draft; V.B., D.B. and T.T. performed the histological analysis; G.I. supported blood biochemistry analysis; L.G. supported the animal work; V.B. and M.C. edited and reviewed the manuscript; M.C. carried out funding acquisition; E.B. supervised the histological analysis. All authors have read and agreed to the published version of the manuscript.
Funding
This work was supported by Next Generation EU [DM 1557 11.10.2022], in the context of the National Recovery and Resilience Plan, Investment PE8 – Project Age-It: “Ageing Well in an Ageing Society”. The views and opinions expressed are only those of the authors and do not necessarily reflect those of the European Union or the European Commission. Neither the European Union nor the European Commission can be held responsible for them. This work was also supported by specific funding from Regione Toscana/Istituto per lo Studio, la Prevenzione e la Rete Oncologica (ISPRO).
Institutional Review Board Statement
The animal study protocol was approved by the Animal Welfare Board of Fondazione Toscana Life Sciences (FTLS), Siena, Italy, (protocol code: 9AECF.34, date of approval: 22/12/2020) and by the Italian Ministry of Health (protocol code: 175/2021-PR, date of approval: 03/03/2021).
Data Availability Statement
The datasets used and/or analyzed during the current study available from the corresponding author on reasonable request.
Conflicts of Interest
The authors declare no conflicts of interest. The funders had no role in the design of the study; in the collection, analyses, or interpretation of data; in the writing of the manuscript; or in the decision to publish the results.
References
- Casimiro, I., Stull, N.D., Tersey, S.A., Mirmira, R.G. Phenotypic sexual dimorphism in response to dietary fat manipulation in C57BL/6J mice. J Diabetes Complications. 2021 Feb;35(2):107795. [CrossRef]
- Siersbæk, M.S., Ditzel, N., Hejbøl, E.K., Præstholm, S.M., Markussen, L.K., Avolio, F., Li, L., Lehtonen, L., Hansen, A.K., Schrøder, H.D., Krych, L., Mandrup, S., Langhorn, L., Bollen, P., Grøntved, L. C57BL/6J substrain differences in response to high-fat diet intervention. Sci Rep. 2020 Aug 20;10(1):14052. [CrossRef]
- Speakman, J.R. Use of high-fat diets to study rodent obesity as a model of human obesity. Int J Obes 43, 1491–1492 (2019). [CrossRef]
- Shi, H., Prough, R.A., McClain, C.J., Song, M. Different Types of Dietary Fat and Fructose Interactions Result in Distinct Metabolic Phenotypes in Male Mice. The Journal of Nutritional Biochemistry. 2023 Jan;111:109189. [CrossRef]
- Hintze, K.J., Benninghoff, A.D., Cho, C.E., Ward, R.E. Modeling the Western Diet for Preclinical Investigations. Adv Nutr. 2018 May 1;9(3):263-271. [CrossRef]
- Gargiulo, S., Gramanzini, M., Mancini, M. Molecular Imaging of Vulnerable Atherosclerotic Plaques in Animal Models. Int J Mol Sci. 2016 Sep 9;17(9):1511. [CrossRef]
- Di Lascio, N., Kusmic, C., Stea, F., Lenzarini, F., Barsanti, C., Leloup, A., Faita, F. Longitudinal micro-ultrasound assessment of the ob/ob mouse model: evaluation of cardiovascular, renal and hepatic parameters. Int J Obes (Lond). 2018 Mar;42(3):518-524. [CrossRef]
- Pantaleão Jr., A.C.S., de Castro, M.P., Meirelles Araujo, K.S.F., Campos, C.F.F., da Silva, A.L.A., Manso, J.E.F., Machado, J.C. Ultrasound biomicroscopy for the assessment of early-stage nonalcoholic fatty liver disease induced in rats by a high-fat diet. Ultrasonography. 2022;41(4):750-760.
- Resende, C., Lessa, A., Goldenberg, R. C. S. Ultrasonic Imaging in Liver Disease: From Bench to Bedside. In Ultrasound Imaging - Medical Applications. London, United Kingdom: IntechOpen, 2011.
- Available online: https://www.intechopen.com/chapters/18256#B23. [CrossRef]
- Cui, G., Martin, R.C., Liu, X., Zheng, Q., Pandit, H., Zhang, P., Li, W., Li, Y. Serological biomarkers associate ultrasound characteristics of steatohepatitis in mice with liver cancer. Nutr Metab (Lond). 2018 Oct 5;15:71. [CrossRef]
- Vlad, R.M., Brand, S., Giles, A., Kolios, M.C., Czarnota, G.J. Quantitative ultrasound characterization of responses to radiotherapy in cancer mouse models. Clin Cancer Res. 2009 Mar 15;15(6):2067-75. [CrossRef]
- Lavarello, R.J., Ridgway, W.R., Sarwate, S.S., Oelze, M.L. Characterization of thyroid cancer in mouse models using high-frequency quantitative ultrasound techniques. Ultrasound Med Biol. 2013 Dec;39(12):2333-41. [CrossRef]
- Mirniaharikandehei, S., VanOsdol, J., Heidari, M., Danala, G., Sethuraman, S.N., Ranjan, A., Zheng, B. Developing a Quantitative Ultrasound Image Feature Analysis Scheme to Assess Tumor Treatment Efficacy Using a Mouse Model. Sci Rep 9, 7293 (2019). [CrossRef]
- Liang, W., Menke, A.L., Driessen, A., Koek, G.H., Lindeman, J.H., Stoop, R., Havekes, L.M., Kleemann, R., van den Hoek, A.M. Establishment of a general NAFLD scoring system for rodent models and comparison to human liver pathology. PLoS One. 2014 Dec 23;9(12):e115922. [CrossRef]
- Schipper, L., van Heijningen, S., Karapetsas, G., van der Beek, E.M., van Dijk, G. Individual housing of male C57BL/6J mice after weaning impairs growth and predisposes for obesity. PLoS One. 2020 May 26;15(5):e0225488. [CrossRef]
- Olga, L., Bobeldijk-Pastorova, I., Bas, R.C., Seidel, F., Snowden, S.G., Furse, S., Ong, K.K., Kleemann, R., Koulman, A. Lipid profiling analyses from mouse models and human infants. STAR Protoc. 2022 Dec 16;3(4):101679. [CrossRef]
- Ellacott, K.L., Morton, G.J., Woods, S.C., Tso, P., Schwartz, M.W. Assessment of feeding behavior in laboratory mice. Cell Metab. 2010 Jul 7;12(1):10-7. [CrossRef]
- Wang, C.Y., Liao, J.K. A mouse model of diet-induced obesity and insulin resistance. Methods Mol Biol. 2012;821:421-33. [CrossRef]
- Lau, J.K., Zhang, X., Yu, J. Animal models of non-alcoholic fatty liver disease: current perspectives and recent advances. J Pathol 2017;241:36–44.
- Ali, M.A., Kravitz, A.V. Challenges in quantifying food intake in rodents. Brain Res. 2018 Aug 15;1693(Pt B):188-191. [CrossRef]
- Cowley, P.M., Roberts, C.R., Baker, A.J. Monitoring the Health Status of Mice with Bleomycin-induced Lung Injury by Using Body Condition Scoring. Comp Med. 2019 Apr 1;69(2):95-102. [CrossRef]
- Siriarchavatana, P., C.Kruger, M., & M.Wolber, F. Correlation between body condition score and body composition in a rat model for obesity research: Veterinary Integrative Sciences. 2022; 20(3), 531–545. Available online: https://he02.tci-thaijo.org/index.php/vis/article/view/258598. [CrossRef]
- Hoggatt, J., Hoggatt, A.F., Tate, T.A., Fortman, J., Pelus, L.M. Bleeding the laboratory mouse: Not all methods are equal. Exp Hematol. 2016 Feb;44(2):132-137.e1. [CrossRef]
- Windeløv, J.A., Pedersen, J., Holst, J.J. Use of anesthesia dramatically alters the oral glucose tolerance and insulin secretion in C57Bl/6 mice. Physiol Rep. 2016 Jun;4(11):e12824. [CrossRef]
- Valladolid-Acebes, I., Daraio, T., Brismar, K., Harkany, T., Ögren, S.O., Hökfelt, T.G., Bark, C. Replacing SNAP-25b with SNAP-25a expression results in metabolic disease. Proc Natl Acad Sci U S A. 2015 Aug 4;112(31):E4326-35. [CrossRef]
- Pauter, A.M., Fischer, A.W., Bengtsson, T., Asadi, A., Talamonti, E., Jacobsson, A. Synergistic Effects of DHA and Sucrose on Body Weight Gain in PUFA-Deficient Elovl2 -/- Mice. Nutrients. 2019 Apr 15;11(4):852. [CrossRef]
- Carper, D., Coué, M., Laurens, C., Langin, D., Moro, C. Reappraisal of the optimal fasting time for insulin tolerance tests in mice. MOLECULAR METABOLISM. 2020, 42, 101058. [CrossRef]
- Fraulob, J.C., Ogg-Diamantino, R., Fernandes-Santos, C., Aguila, M.B., Mandarim-de-Lacerda, C.A. A Mouse Model of Metabolic Syndrome: Insulin Resistance, Fatty Liver and Non-Alcoholic Fatty Pancreas Disease (NAFPD) in C57BL/6 Mice Fed a High Fat Diet. J Clin Biochem Nutr. 2010;46(3):212-223. [CrossRef]
- Knopp, J.L., Holder-Pearson, L., Chase, J.G. Insulin Units and Conversion Factors: A Story of Truth, Boots, and Faster Half-Truths. J Diabetes Sci Technol. 2019 May;13(3):597-600. [CrossRef]
- Diabetes Trials Unit, University of Oxford, Oxford, UK. Available online: https://www.dtu.ox.ac.uk/homacalculator/ (accessed on 5 September 2022).
- Avtanski, D., Pavlov, V.A., Tracey, K.J., Poretsky, L. Characterization of inflammation and insulin resistance in high-fat diet-induced male C57BL/6J mouse model of obesity. Animal Model Exp Med. 2019 Sep 25;2(4):252-258. [CrossRef]
- Zhou, X., Hansson, G. K. Effect of Sex and Age on Serum Biochemical Reference Ranges in C57BL/6J Mice. Comparative Medicine 2004. Vol 54, No 2 April 2004, Pages 176-178.
- Mazzaccara, C., Labruna, G., Cito, G., Scarfò, M., De Felice, M., Pastore, L., Sacchetti, L. Age-Related Reference Intervals of the Main Biochemical and Hematological Parameters in C57BL/6J, 129SV/EV and C3H/HeJ Mouse Strains PLoS One. 2008;3(11):e3772. [CrossRef]
- The Jackson Laboratory online resource library. Available online: http://jackson.jax.org/rs/444-BUH-304/images/physiological_data_000664.pdf (accessed on 1 November 2021).
- Jensen, T., Kiersgaard, M., Sørensen, D., Mikkelsen, L. Fasting of mice: a review. Laboratory Animals. 2013;47(4):225-240. [CrossRef]
- Constantinides, C., Mean, R., Janssen, B.J. Effects of isoflurane anesthesia on the cardiovascular function of the C57BL/6 mouse. ILAR J. 2011, 52: 21-31.
- Sørensen, L.L., Bedja, D., Sysa-Shah, P., Liu, H., Maxwell, A., Yi, X., Pozios, I., Olsen, N.T., Abraham, T.P., Abraham, R., Gabrielson, K. Echocardiographic Characterization of a Murine Model of Hypertrophic Obstructive Cardiomyopathy Induced by Cardiac-specific Overexpression of Epidermal Growth Factor Receptor 2. Comp Med. 2016;66(4):268-77.
- Andorko, J.I., Tostanoski, L.H., Solano, E., Mukhamedova, M., Jewell, C.M. Intra-lymph node injection of biodegradable polymer particles. J Vis Exp. 2014 Jan 2;(83):e50984. [CrossRef]
- Stypmann, J., Engelen, M.A., Troatz, C., Rothenburger, M., Eckardt, L., Tiemann, K. Echocardiographic assessment of global left ventricular function in mice. Laboratory Animals 2009; 43: 127–137. [CrossRef]
- Gao, S., Ho, D., Vatner, D.E., Vatner, S.F. Echocardiography in mice. Curr Protoc Mouse Biol. 2011 Mar 1; 1: 71–83. [CrossRef]
- Zacchigna, S., Paldino, A., Falcão-Pires, I., Daskalopoulos, E.P., Dal Ferro, M., Vodret, S., Lesizza, P., Cannatà, A., Miranda-Silva, D., Lourenço, A.P., Pinamonti, B., Sinagra, G., Weinberger, F., Eschenhagen, T., Carrier, L., Kehat, I., Tocchetti, C.G., Russo, M., Ghigo, A., Cimino, J., Hirsch, E., Dawson, D., Ciccarelli, M., Oliveti, M., Linke, W.A., Cuijpers, I., Heymans, S., Hamdani, N., de Boer, M., Duncker, D.J., Kuster, D., van der Velden, J., Beauloye, C., Bertrand, L., Mayr, M., Giacca, M., Leuschner, F., Backs, J., Thum, T. Towards standardization of echocardiography for the evaluation of left ventricular function in adult rodents: a position paper of the ESC Working Group on Myocardial Function. Cardiovasc Res. 2021 Jan 1;117(1):43-59. [CrossRef]
- IBB CNR Vevo 2100 manual. Available online: https://www.ibb.cnr.it/img/Vevo2100-manual.pdf (accessed on 5 February 2022).
- Foppa, M., Duncan, B.B., Rohde, L.E. Echocardiography-based left ventricular mass estimation. How should we define hypertrophy? Cardiovasc Ultrasound. 2005 Jun 17;3:17. [CrossRef]
- Hubesch, G., Hanthazi, A., Acheampong, A., Chomette, L., Lasolle, H., Hupkens, E., Jespers, P., Vegh, G., Wembonyama, C.W.M., Verhoeven, C., Dewachter, C., Vachiery, J.L., Entee, K.M., Dewachter, L. A Preclinical Rat Model of Heart Failure With Preserved Ejection Fraction With Multiple Comorbidities. Front Cardiovasc Med. 2022 Jan 13;8:809885. [CrossRef]
- Hagdorn, Q.A.J., Bossers, G.P.L., Koop, A.C., Piek, A., Eijgenraam, T.R., van der Feen, D.E., Silljé, H.H.W., de Boer, R.A., Berger, R.M.F. A novel method optimizing the normalization of cardiac parameters in small animal models: the importance of dimensional indexing. Am J Physiol Heart Circ Physiol. 2019 Jun 1;316(6):H1552-H1557. [CrossRef]
- Mancini M, Prinster A, Annuzzi G, Liuzzi R, Giacco R, Medagli C, Cremone M, Clemente G, Maurea S, Riccardi G, Rivellese AA, Salvatore M. Sonographic hepatic-renal ratio as indicator of hepatic steatosis: comparison with (1)H magnetic resonance spectroscopy. Metabolism. 2009 Dec;58(12):1724-30. Epub 2009 Aug 28. [CrossRef]
- Pagliuca C, Cicatiello AG, Colicchio R, et al. Novel Approach for Evaluation of Bacteroides fragilis Protective Role against Bartonella henselae Liver Damage in Immunocompromised Murine Model. Frontiers in Microbiology. 2016;7:1750. [CrossRef]
- Lessa, A.S., Paredes, B.D., Dias, J.V., Carvalho, A.B., Quintanilha, L.F., Takiya, C.M., Tura, B.R., Rezende, G.F., Campos de Carvalho, A.C., Resende, C.M., Goldenberg, R.C. Ultrasound imaging in an experimental model of fatty liver disease and cirrhosis in rats. BMC Vet Res. 2010 Jan 29;6:6. [CrossRef]
- D’Souza, J.C., Sultan, L.R., Hunt, S.J., Schultz, S.M., Brice, A.K., Wood, A.K.W., Sehgal, C.M. B-mode ultrasound for the assessment of hepatic fibrosis: a quantitative multiparametric analysis for a radiomics approach. Sci Rep. 2019, 9, 8708. [CrossRef] [PubMed]
- Castiglioni, M.C.R., de Campos Vettorato, M., Fogaça, J.L., Puoli Filho, J.N.P., de Vasconcelos Machado, V.M. Quantitative Ultrasound of Kidneys, Liver, and Spleen: a Comparison Between Mules and Horses. Journal of Equine Veterinary Science, Volume 70, 2018, Pages 71-75, ISSN 0737-0806. [CrossRef]
- Beland, M.D., Walle, N.L., Machan, J.T., Cronan, J.J. Renal cortical thickness measured at ultrasound: is it better than renal length as an indicator of renal function in chronic kidney disease? AJR Am J Roentgenol. 2010 Aug;195(2):W146-9. [CrossRef]
- Araújo, N.C., Rebelo, M.A.P., da Silveira Rioja, L. et al. Sonographically determined kidney measurements are better able to predict histological changes and a low CKD-EPI eGFR when weighted towards cortical echogenicity. BMC Nephrol. 2020, 21, 123. [CrossRef]
- Xu. H., Ma, Z., Lu, S., Li, R., Lyu, L., Ding, L., Lu, Q. Renal Resistive Index as a Novel Indicator for Renal Complications in High-Fat Diet-Fed Mice. Kidney Blood Press Res. 2017;42(6):1128-1140. [CrossRef]
- Ma, Z., Lu, S., Ding, L., Lu, Q. Renal resistive index in mouse model. Exp Tech Urol Nephrol. 2018, 1(4). ETUN.000522.2018. [CrossRef]
- Maksoud, A.A.A., Sharara, S.M., Nanda, A., Khouzam, R.N. The renal resistive index as a new complementary tool to predict microvascular diabetic complications in children and adolescents: a groundbreaking finding. Ann Transl Med. 2019 Sep;7(17):422. [CrossRef]
- Meyer, S., Fuchs, D., and Meier, M. Ultrasound and Photoacoustic Imaging of the Kidney: Basic Concepts and Protocols. Methods Mol. Biol. 2021. 2216, 109–130. [CrossRef]
- Cauwenberghs, N., Kuznetsova, T. Determinants and Prognostic Significance of the Renal Resistive Index. Pulse (Basel). 2016 Apr;3(3-4):172-8. [CrossRef]
- Tublin, M., Bude, R., Platt, J. The resistive index in renal Doppler sonography: where do we stand? AJR Am J Roentgenol. 2003. 180: 885–892. [CrossRef]
- Lubas, A., Kade, G., Niemczyk, S. Renal resistive index as a marker of vascular damage in cardiovascular diseases. Int Urol Nephrol. 2014 Feb;46(2):395-402. [CrossRef]
- K C, T., Das, S.K., Shetty, M.S. Renal Resistive Index: Revisited. Cureus. 2023 Mar 13;15(3):e36091. [CrossRef]
- Westergren, H.U., Grönros, J., Heinonen, S.E., Miliotis, T., Jennbacken, K., Sabirsh, A., Ericsson, A., Jönsson-Rylander, A.C., Svedlund, S., Gan, L.M. Impaired Coronary and Renal Vascular Function in Spontaneously Type 2 Diabetic Leptin-Deficient Mice. PLoS One. 2015 Jun 22;10(6):e0130648. [CrossRef]
- Faita, F., Di Lascio, N., Rossi, C., Kusmic, C., Solini, A. Ultrasonographic Characterization of the db/db Mouse: An Animal Model of Metabolic Abnormalities. J Diabetes Res. 2018 Mar 8;2018:4561309. [CrossRef]
- Kleiner, D.E., Brunt, E.M., Van Natta, M., Behling, C., Contos, M.J., Cummings, O.W., Ferrell, L.D., Liu, Y.C., Torbenson, M.S., Unalp-Arida, A., Yeh, M., McCullough, A.J., Sanyal, A.J. Nonalcoholic Steatohepatitis Clinical Research Network. Design and validation of a histological scoring system for nonalcoholic fatty liver disease. Hepatology. 2005 Jun;41(6):1313-21. [CrossRef]
- Barone, V., Borghini, A., Tedone, C. E., Aglianò, M., Gabriele, G., Gennaro, P., Weber, E. New Insights into the Pathophysiology of Primary and Secondary Lymphedema: Histopathological Studies on Human Lymphatic Collecting Vessels. Lymphat Res Biol. 2020, ISSN: 1539-6851. [CrossRef]
- Liang, W., Menke, A.L., Driessen, A., Koek, G.H., Lindeman, J.H., Stoop, R., Havekes, L.M., Kleemann, R., van den Hoek, A.M. Establishment of a general NAFLD scoring system for rodent models and comparison to human liver pathology. PLoS One. 2014 Dec 23;9(12):e115922. [CrossRef]
- Bedossa, P., FLIP Pathology Consortium. Utility and appropriateness of the fatty liver inhibition of progression (FLIP) algorithm and steatosis, activity, and fibrosis (SAF) score in the evaluation of biopsies of nonalcoholic fatty liver disease. Hepatology (Baltimore, Md.). 2014 Aug;60(2):565-575. [CrossRef]
- Glastras, S.J., Chen, H., The, R., McGrath, R.T., Chen, J., Pollock, C.A., Wong, M.G., Saad, S. Mouse Models of Diabetes, Obesity and Related Kidney Disease. PLoS One. 2016 Aug 31;11(8):e0162131. [CrossRef]
- Søgaard, S.B., Andersen, S.B., Taghavi, I., Schou, M., Christoffersen, C., Jacobsen, J.C.B., Kjer, H.M., Gundlach, C., McDermott, A., Jensen, J.A., Nielsen, M.B., Sørensen, C.M. Super-Resolution Ultrasound Imaging of Renal Vascular Alterations in Zucker Diabetic Fatty Rats during the Development of Diabetic Kidney Disease. Diagnostics (Basel). 2023 Oct 12;13(20):3197. [CrossRef]
- Serdar, C.C., Cihan, M., Yücel, D., Serdar, M.A. Sample size, power and effect size revisited: simplified and practical approaches in pre-clinical, clinical and laboratory studies. Biochem Med (Zagreb). 2021 Feb 15;31(1):010502. [CrossRef]
- Weber, C. Diet effects on stem cells. Nat Cell Biol. 2021 Aug;23(8):811. [CrossRef]
- Sargent, J.L., Koewler, N.J., Diggs, H.E. Systematic Literature Review of Risk Factors and Treatments for Ulcerative Dermatitis in C57BL/6 Mice. Comp Med. 2015 Dec;65(6):465-72.
- De Biase, D., Esposito, F., De Martino, M., Pirozzi, C., Luciano, A., Palma, G., Raso, G.M., Iovane, V., Marzocco, S., Fusco, A., Paciello, O. Characterization of inflammatory infiltrate of ulcerative dermatitis in C57BL/6NCrl-Tg(HMGA1P6)1Pg mice. Lab Anim. 2019 Oct;53(5):447-458. [CrossRef]
- Cameron, K.M., Speakman, J.R. The extent and function of ‘food grinding’ in the laboratory mouse (Mus musculus). Lab Anim. 2010 Oct;44(4):298-304. [CrossRef]
- Pritchett-Corning, K.R., Keefe, R., Garner, J.P., Gaskill, B.N. Can seeds help mice with the daily grind? Lab Anim. 2013 Oct;47(4):312-5. [CrossRef]
- Charles River online resource library. Available online: https://www.criver.com/products-services/find-model/c57bl6j-mice-jax-strain?region=27 (accessed on 1 November 2021).
- Gargiulo, S., Gramanzini, M., Megna, R., Greco, A., Albanese, S., Manfredi, C., Brunetti, A. Evaluation of growth patterns and body composition in C57Bl/6J mice using dual energy X-ray absorptiometry. Biomed Res Int. 2014;2014:253067. [CrossRef]
- Breslin, W.L., Strohacker, K., Carpenter, K.C., Esposito, L., Mcfarlin, B.K. Weight gain in response to high-fat feeding in CD-1 male mice. Laboratory Animals. 2010;44(3):231-237. [CrossRef]
- Siriarchavatana, P., C. Kruger, M., M.Wolber, F. Correlation between body condition score and body composition in a rat model for obesity research. Veterinary Integrative Sciences. 2022;20(3), 531–545. [CrossRef]
- Keirns, B. H., Sciarrillo, C. M., Koemel, N. A., Emerson, S.R. Fasting, non-fasting and postprandial triglycerides for screening cardiometabolic risk. J Nutr Sci. 2021 Sep 14;10:e75. [CrossRef]
- Hou, Y., An, Z., Hou, X., Guan, Y., Song, G. A bibliometric analysis and visualization of literature on non-fasting lipid research from 2012 to 2022. Front Endocrinol (Lausanne). 2023 Apr 19;14:1136048. [CrossRef]
- Abramson, A. M., Shi, L. J., Lee, R. N., Chen, M.-H., Shi, W. Phenotypic and Genetic Evidence for a More Prominent Role of Blood Glucose than Cholesterol in Atherosclerosis of Hyperlipidemic Mice. Cells. 2022; 11(17):2669. [CrossRef]
- Eisinger, K., Liebisch, G., Schmitz, G., Aslanidis, C., Krautbauer, S., Buechler, C. Int J Mol Sci. 2014 Feb 20;15(2):2991-3002. [CrossRef]
- Weinstein, M.M., Tu, Y., Beigneux, A.P., Davies, B.S., Gin, P., Voss, C., Walzem, R.L., Reue, K., Tontonoz, P., Bensadoun, A., Fong, L.G., Young, S.G. Cholesterol intake modulates plasma triglyceride levels in glycosylphosphatidylinositol HDL-binding protein 1-deficient mice. Arterioscler Thromb Vasc Biol. 2010 Nov;30(11):2106-13. [CrossRef]
- Mekada, K., Yoshiki, A. Substrains matter in phenotyping of C57BL/6 mice. Exp Anim. 2021 May 13;70(2):145-160. [CrossRef]
- Otto, G.P., Rathkolb, B., Oestereicher, M.A., Lengger, C.J., Moerth, C., Micklich, K., Fuchs, H., Gailus-Durner, V., Wolf, E., Hrabě de Angelis, M. Clinical Chemistry Reference Intervals for C57BL/6J, C57BL/6N, and C3HeB/FeJ Mice (Mus musculus). J Am Assoc Lab Anim Sci. 2016;55(4):375-86.
- Toita, R., Kawano, T., Fujita, S., Murata, M., Kang, J.H. Increased hepatic inflammation in a normal-weight mouse after long-term high-fat diet feeding. J Toxicol Pathol. 2018 Jan;31(1):43-47. [CrossRef]
- Quesenberry, K. E., & Carpenter, J. W. Ferrets, rabbits, and rodents: clinical medicine and surgery: includes sugar gliders and hedgehogs. 2nd ed. St. Louis, Mo., Saunders, 2004; p 290.
- Hosten, A.O. BUN and Creatinine. In: Walker HK, Hall WD, Hurst JW, editors. Clinical Methods: The History, Physical, and Laboratory Examinations. 3rd edition. Boston: Butterworths; 1990. Chapter 193. Available online: https://www.ncbi.nlm.nih.gov/books/NBK305/.
- Wang, K., Peng, X., Yang, A., Huang, Y., Tan, Y., Qian, Y., Lv, F., Si, H. Effects of Diets With Different Protein Levels on Lipid Metabolism and Gut Microbes in the Host of Different Genders. Front Nutr. 2022 Jun 15;9:940217. [CrossRef]
- Imamura, Y., Mawatari, S., Oda, K., Kumagai, K., Hiramine, Y., Saishoji, A., Kakihara, A., Nakahara, M., Oku, M., Hosoyamada, K., Kanmura, S., Moriuchi, A., Miyahara, H., Akio, Ido. Changes in body composition and low blood urea nitrogen level related to an increase in the prevalence of fatty liver over 20 years: A cross-sectional study. Hepatol Res. 2021 May;51(5):570-579. [CrossRef]
- Thoolen, B., Maronpot, R.R., Harada, T., Nyska, A., Rousseaux, C., Nolte, T., Malarkey, D.E., Kaufmann, W., Küttler, K., Deschl, U., Nakae, D., Gregson, R., Vinlove, M.P., Brix, A.E., Singh, B., Belpoggi, F., Ward, J.M. Proliferative and nonproliferative lesions of the rat and mouse hepatobiliary system. Toxicol Pathol. 2010 Dec;38(7 Suppl):5S-81S. [CrossRef]
- Löwen, J., Gröne, E.F., Groß-Weißmann, M.L., Bestvater, F., Gröne, H.J., Kriz, W. Pathomorphological sequence of nephron loss in diabetic nephropathy. Am J Physiol Renal Physiol. 2021 Nov 1;321(5):F600-F616. Epub 2021 Sep 20. Erratum in: Am J Physiol Renal Physiol. 2022 Mar 1;322(3):F308. doi: 10.1152/ajprenal.00669.2020_COR. [CrossRef] [PubMed]
- Muller, C.R., Leite, A.P.O., Yokota, R., Pereira, R.O., Americo, A.L.V., Nascimento, N.R.F., Evangelista, F.S., Farah, V., Fonteles, M.C., Fiorino, P. Post-weaning Exposure to High-Fat Diet Induces Kidney Lipid Accumulation and Function Impairment in Adult Rats. Front Nutr. 2019 May 3;6:60. [CrossRef]
- Prem, P.N., Kurian, G.A. High-Fat Diet Increased Oxidative Stress and Mitochondrial Dysfunction Induced by Renal Ischemia-Reperfusion Injury in Rat. Front Physiol. 2021 Sep 3;12:715693. [CrossRef]
- Hoffler, U., Hobbie, K., Wilson, R., Bai, R., Rahman, A., Malarkey, D., Travlos, G., Ghanayem, B.I. Diet-induced obesity is associated with hyperleptinemia, hyperinsulinemia, hepatic steatosis, and glomerulopathy in C57Bl/6J mice. Endocrine. 2009 Oct;36(2):311-25. [CrossRef]
- Oraha, J., Enriquez, R.F., Herzog, H. et al. Sex-specific changes in metabolism during the transition from chow to high-fat diet feeding are abolished in response to dieting in C57BL/6J mice. Int J Obes 46, 1749–1758 (2022). [CrossRef]
- Maurya, S.K., Carley, A.N., Maurya, C.K., Lewandowski, E.D. Western Diet Causes Heart Failure With Reduced Ejection Fraction and Metabolic Shifts After Diastolic Dysfunction and Novel Cardiac Lipid Derangements. JACC Basic Transl Sci. 2023 Jan 25;8(4):422-435. Erratum in: JACC Basic Transl Sci. 2023 Jun 26;8(6):753. 10.1016/j.jacbts.2023.04.007. [CrossRef]
- Withaar, C., Lam, C.S.P., Schiattarella, G.G., de Boer, R.A., Meems, L.M.G. Heart failure with preserved ejection fraction in humans and mice: embracing clinical complexity in mouse models. Eur Heart J. 2021 Nov 14;42(43):4420-4430. Erratum in: Eur Heart J. 2022 May 21;43(20):1940. doi: 10.1093/eurheartj/ehab883. [CrossRef]
- Grabysa, R., Wańkowicz, Z. Echocardiographic markers of left ventricular dysfunction among men with uncontrolled hypertension and stage 3 chronic kidney disease. Med Sci Monit. 2013 Oct 9;19:838-45. [CrossRef]
- Lisi, M., Luisi, G.A., Pastore, M.C. et al. New perspectives in the echocardiographic hemodynamics multiparametric assessment of patients with heart failure. Heart Fail Rev 29, 799–809 (2024). [CrossRef]
- Liu, I.F., Lin, T.C., Wang, S.C., Yen, C.H., Li, C.Y., Kuo, H.F., Hsieh, C.C., Chang, C.Y., Chang, C.R., Chen, Y.H., Liu, Y.R., Lee, T.Y., Huang, C.Y., Hsu, C.H., Lin, S.J., Liu, P.L. Long-term administration of Western diet induced metabolic syndrome in mice and causes cardiac microvascular dysfunction, cardiomyocyte mitochondrial damage, and cardiac remodeling involving caveolae and caveolin-1 expression. Biol Direct. 2023 Mar 6;18(1):9. [CrossRef]
- Milhem, F.; Hamilton, L.M.; Skates, E.; Wilson, M.; Johanningsmeier, S.D.; Komarnytsky, S. Biomarkers of Metabolic Adaptation to High Dietary Fats in a Mouse Model of Obesity Resistance. Metabolites 2024, 14, 69. [Google Scholar] [CrossRef] [PubMed]
- Ramadori, P., Weiskirchen, R., Trebicka, J., Streetz, K. Mouse models of metabolic liver injury. Lab Anim. 2015 Apr;49(1 Suppl):47-58. [CrossRef] [PubMed]
- Singla, R.K., Kadatz, M., Rohling, R., Nguan, C. Kidney Ultrasound for Nephrologists: A Review. Kidney Med. 2022 Apr 7;4(6):100464. [CrossRef]
- Darabont, R., Mihalcea, D., Vinereanu, D. Current Insights into the Significance of the Renal Resistive Index in Kidney and Cardiovascular Disease. Diagnostics (Basel). 2023 May 10;13(10):1687. [CrossRef]
- Sowers, J.R., Whaley-Connell, A., Hayden, M.R. The Role of Overweight and Obesity in the Cardiorenal Syndrome. Cardiorenal Med. 2011;1(1):5-12. [CrossRef]
- Whaley-Connell, A., Pulakat, L., DeMarco, V.G., Hayden, M.R., Habibi, J., Henriksen, E.J., Sowers, J.R. Overnutrition and the Cardiorenal Syndrome: Use of a Rodent Model to Examine Mechanisms. Cardiorenal Med. 2011;1(1):23-30. [CrossRef]
- Crisóstomo, T., Pardal, M.A.E., Herdy, S.A., Muzi-Filho, H., Mello, D.B., Takiya, C.M., Luzes, R., Vieyra, A. Liver steatosis, cardiac and renal fibrosis, and hypertension in overweight rats: Angiotensin-(3-4)-sensitive hepatocardiorenal syndrome. Metabol Open. 2022 Mar 18;14:100176. [CrossRef]
- Aroor, A.R., Habibi, J., Nistala, R., Ramirez-Perez, F.I., Martinez-Lemus, L.A, Jaffe, I.Z., Sowers, J.R., Jia, G., Whaley-Connell, A. Diet-Induced Obesity Promotes Kidney Endothelial Stiffening and Fibrosis Dependent on the Endothelial Mineralocorticoid Receptor. Hypertension. 2019 Apr;73(4):849-858. [CrossRef]
- Hoi, S., Takata, T., Sugihara, T., Ida, A., Ogawa, M., Mae, Y., Fukuda, S., Munemura, C., Isomoto, H. Predictive Value of Cortical Thickness Measured by Ultrasonography for Renal Impairment: A Longitudinal Study in Chronic Kidney Disease. J Clin Med. 2018 Dec 7;7(12):527. [CrossRef]
- Murawski, I.J., Maina, R.W., Gupta, I.R. The relationship between nephron number, kidney size and body weight in two inbred mouse strains. Organogenesis. 2010 Jul-Sep;6(3):189-94. [CrossRef]
Figure 1.
Effects of diet on BW. C57Bl/6J mice of WD groups had access to high-fat diets at 8 weeks of age for a 17-week period. Body weight (g) in male (A) and female (B) mice were measured weekly. BW gain (g) relative to initial body weight value in male (C) and female (D) mice were calculated per experimental week. Values are reported as mean ± standard deviation. Data were compared using repeated measures – two-way ANOVA-Mixed effect model followed by Sidak’s multiple comparison post-hoc test.
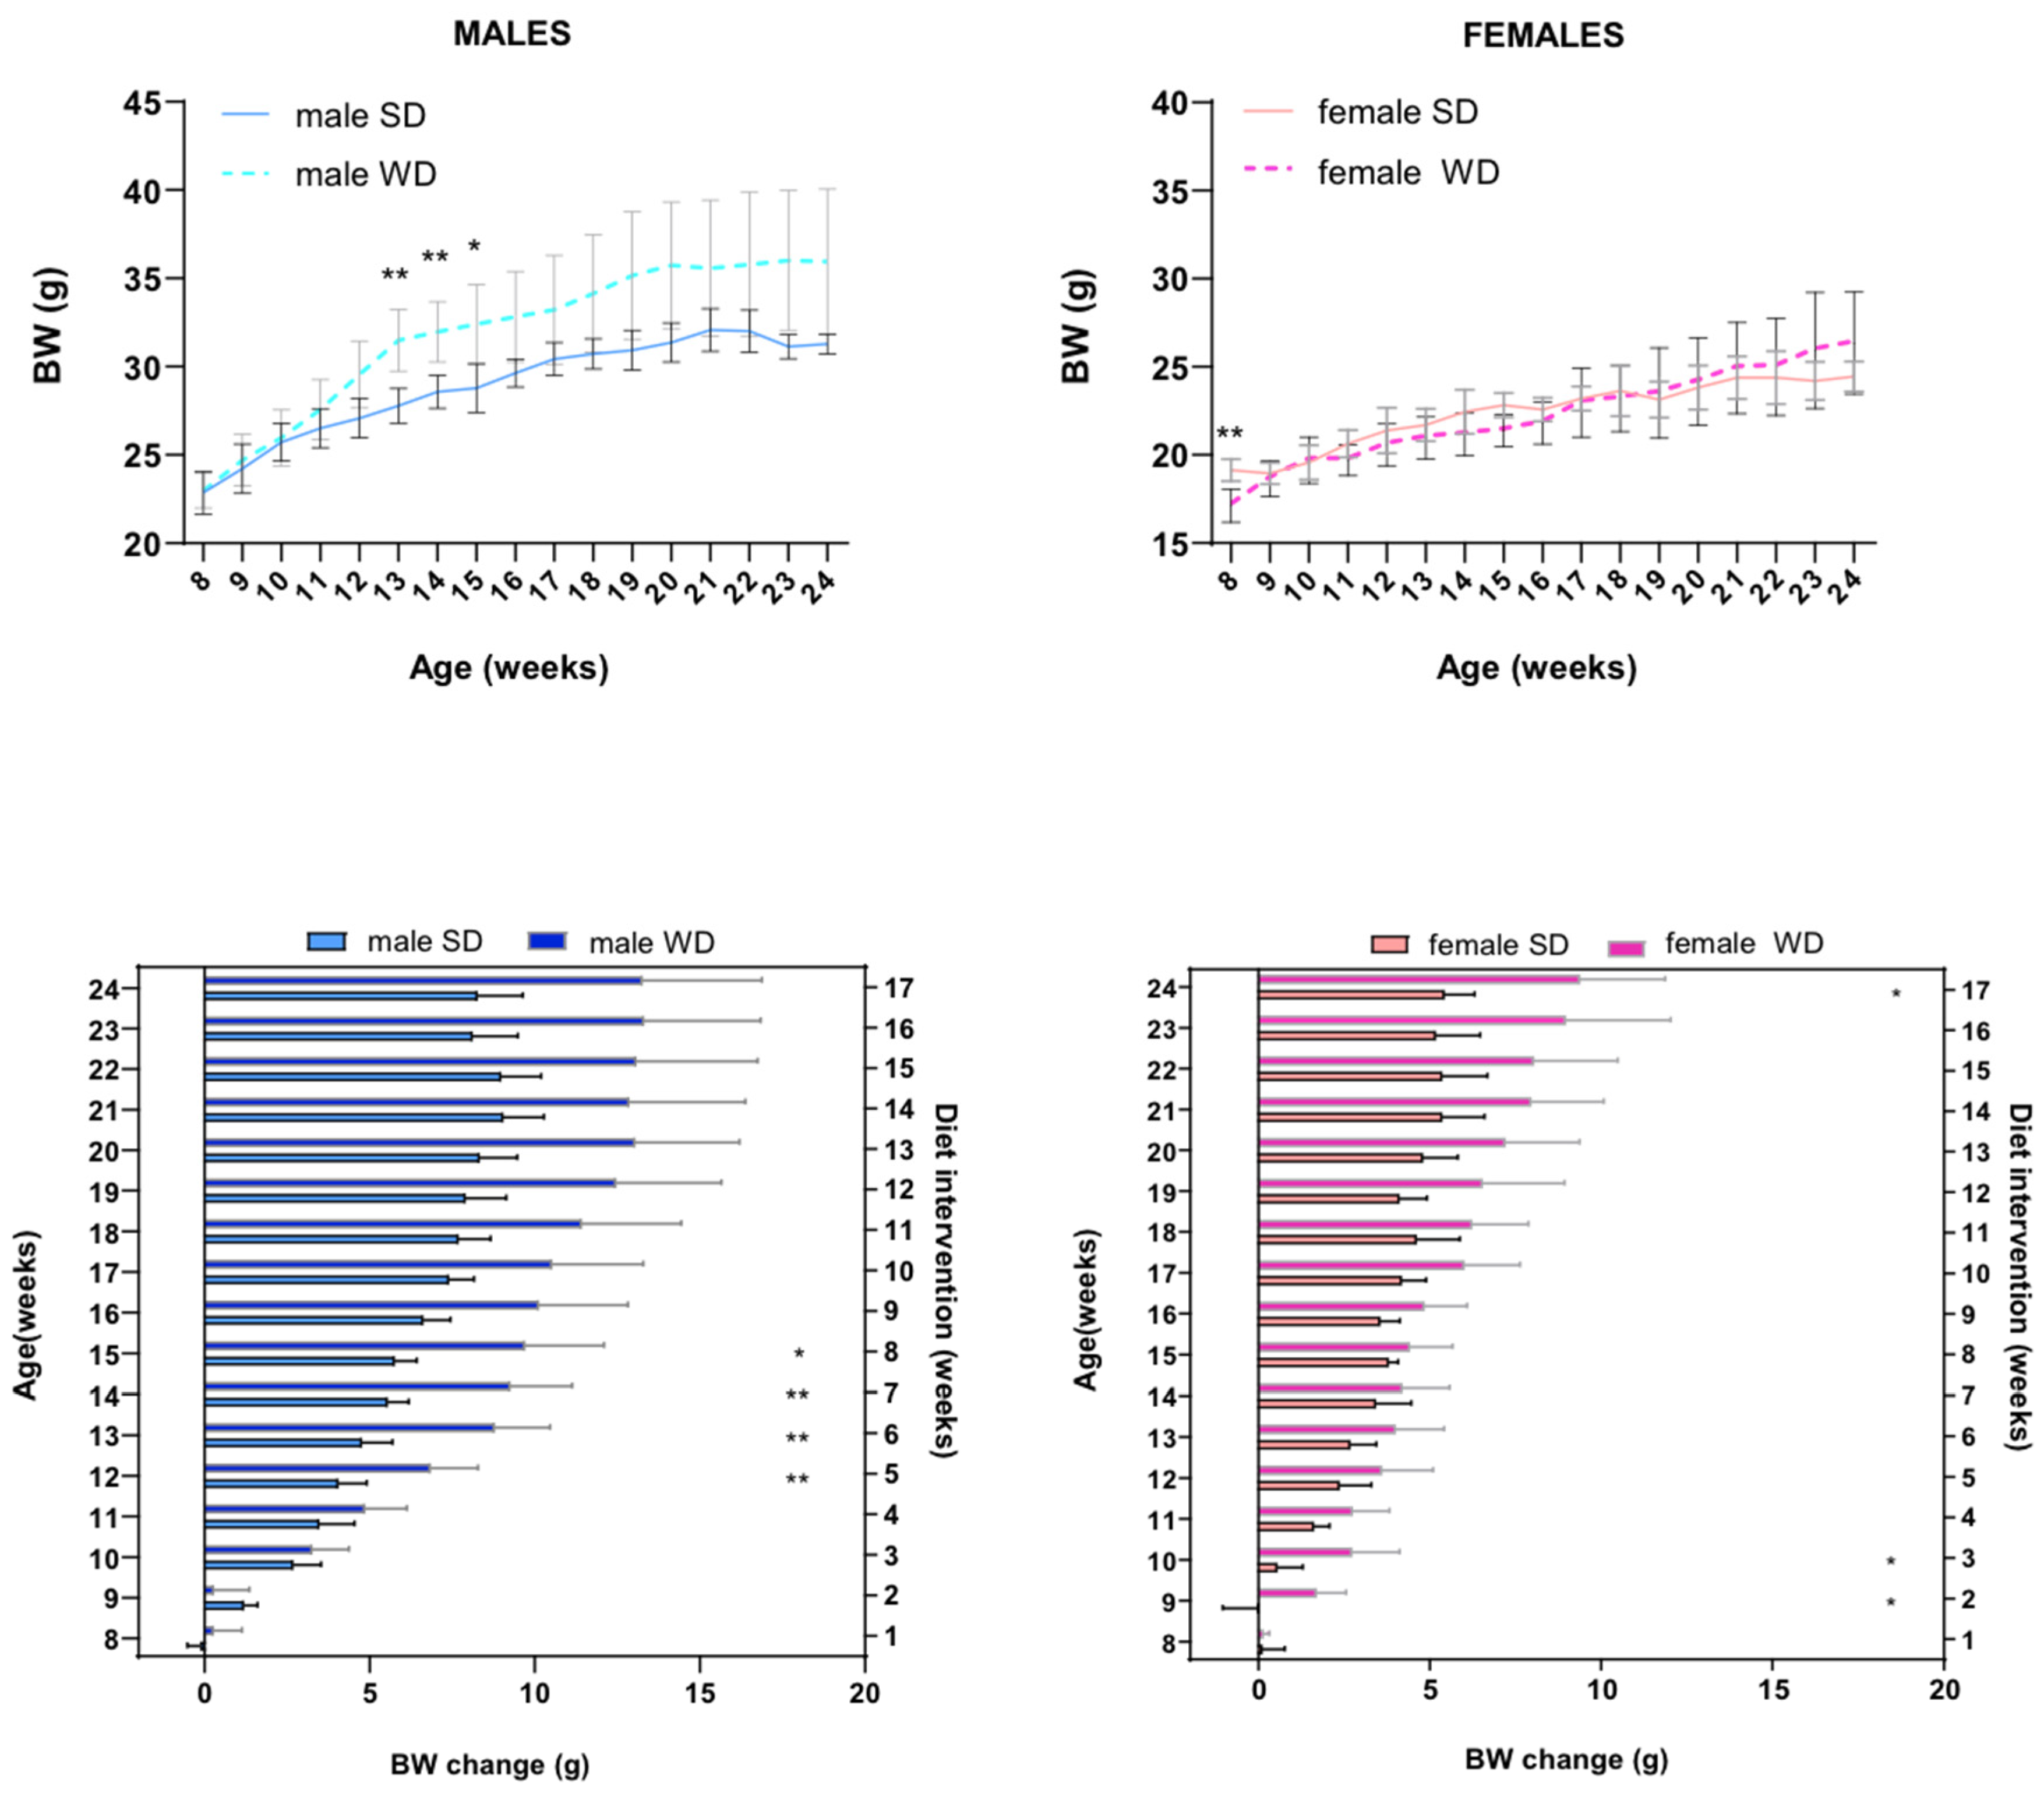
Figure 2.
Effects of diet on body composition. BCS in male (A) and female (B) mice were measured every 8 weeks, starting from 8 weeks of age (onset of high-fat diets for 17 weeks). Visual evidence of a relationship between BCS and body adiposity in SD- and WD- fed male mice at 24 weeks of age is shown in representative photographs: yellow lines highlight a rounded contour at the junction of the costal arch and upper part of the abdomen, scapular area, flank region, and lower abdomen profiles as anatomical landmarks likely due to enhanced subcutaneous and visceral white adipose tissue (C); intra-abdominal fat is increased, and liver shows a macroscopically pale and “fatty” appearance (D) in response to 17-weeks WD. Values are reported as mean ± standard deviation. Data were compared using repeated measures two-way ANOVA-Mixed effect model followed by Sidak’s multiple comparison post-hoc test.
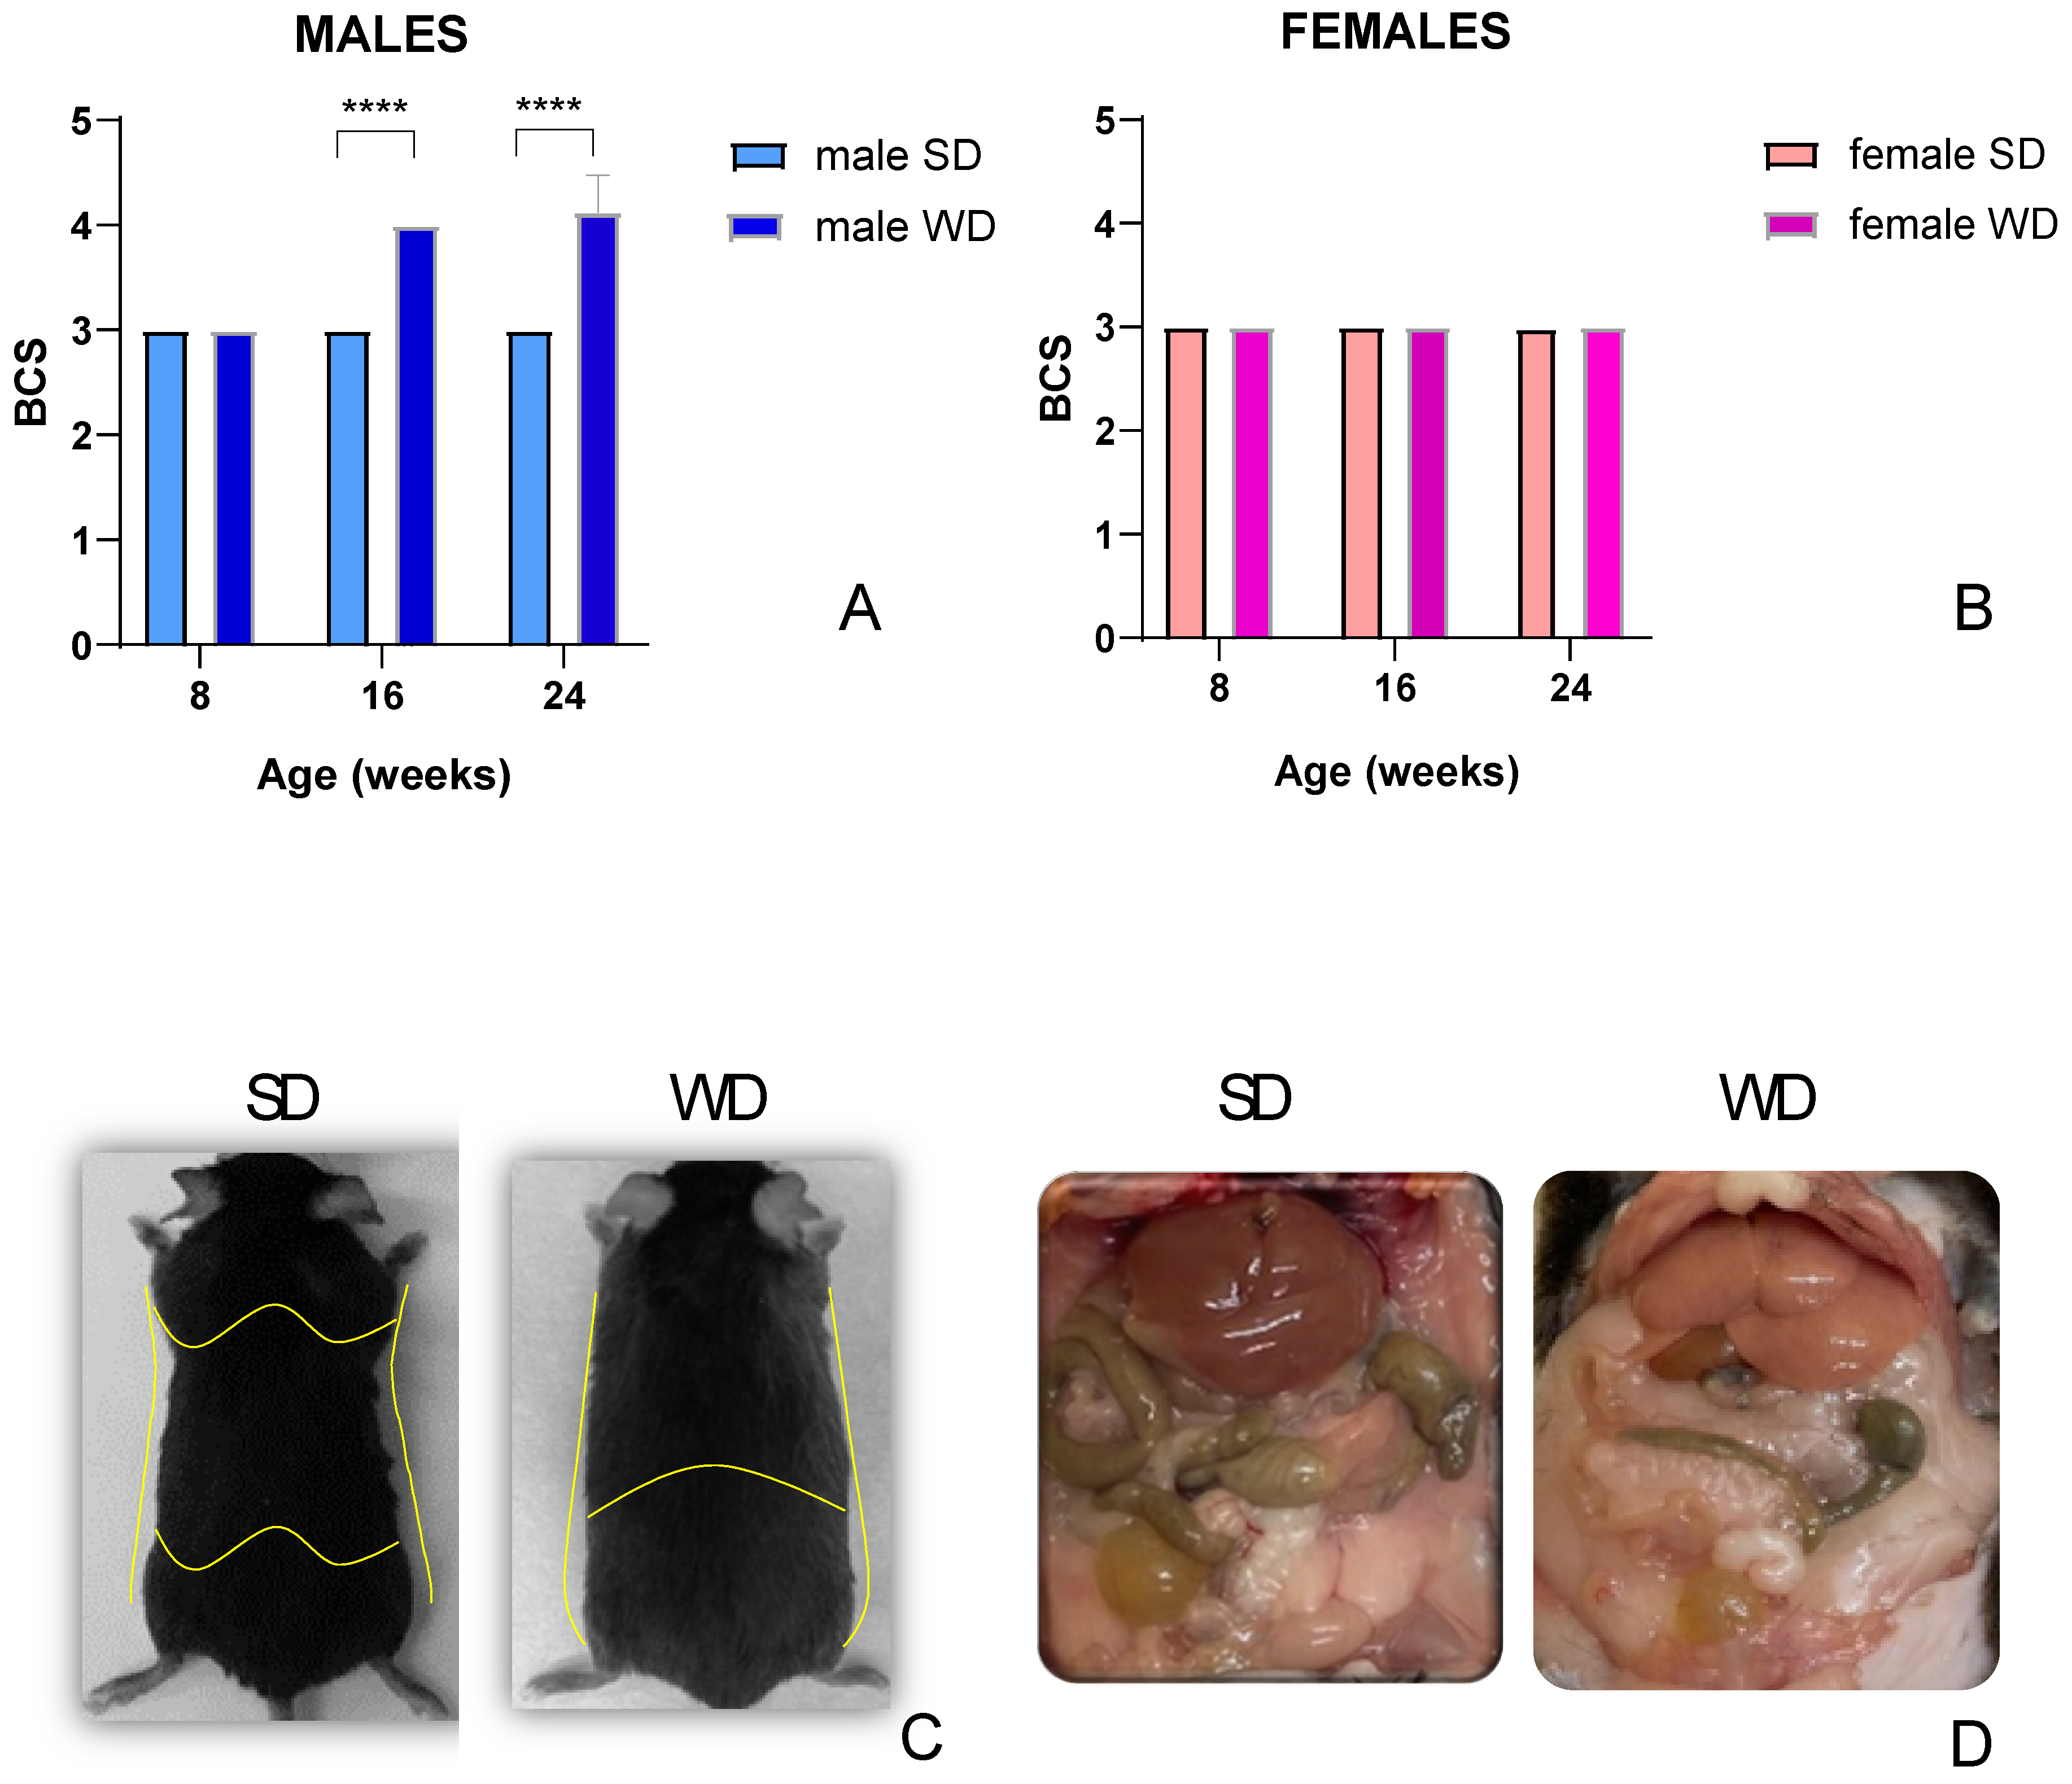
Figure 3.
Effects of diet on liver. Comparisons between livers from SD- and WD-fed mice. Liver weight (g) [Figure 3A,B] and Liver weight/ BW ratio (%) [Figure 3C,D] were calculated at 24 weeks of age. Values are mean ± standard deviation. Data were compared using Mann-Whitney test (p<0.05). Macroscopic appearance of the liver at autopsy: representative photos of the excised liver in a male SD-fed and a WD-fed mouse [Figure 3E,F, respectively]: liver shows a pale color and rounded margins in response to 17-weeks WD.
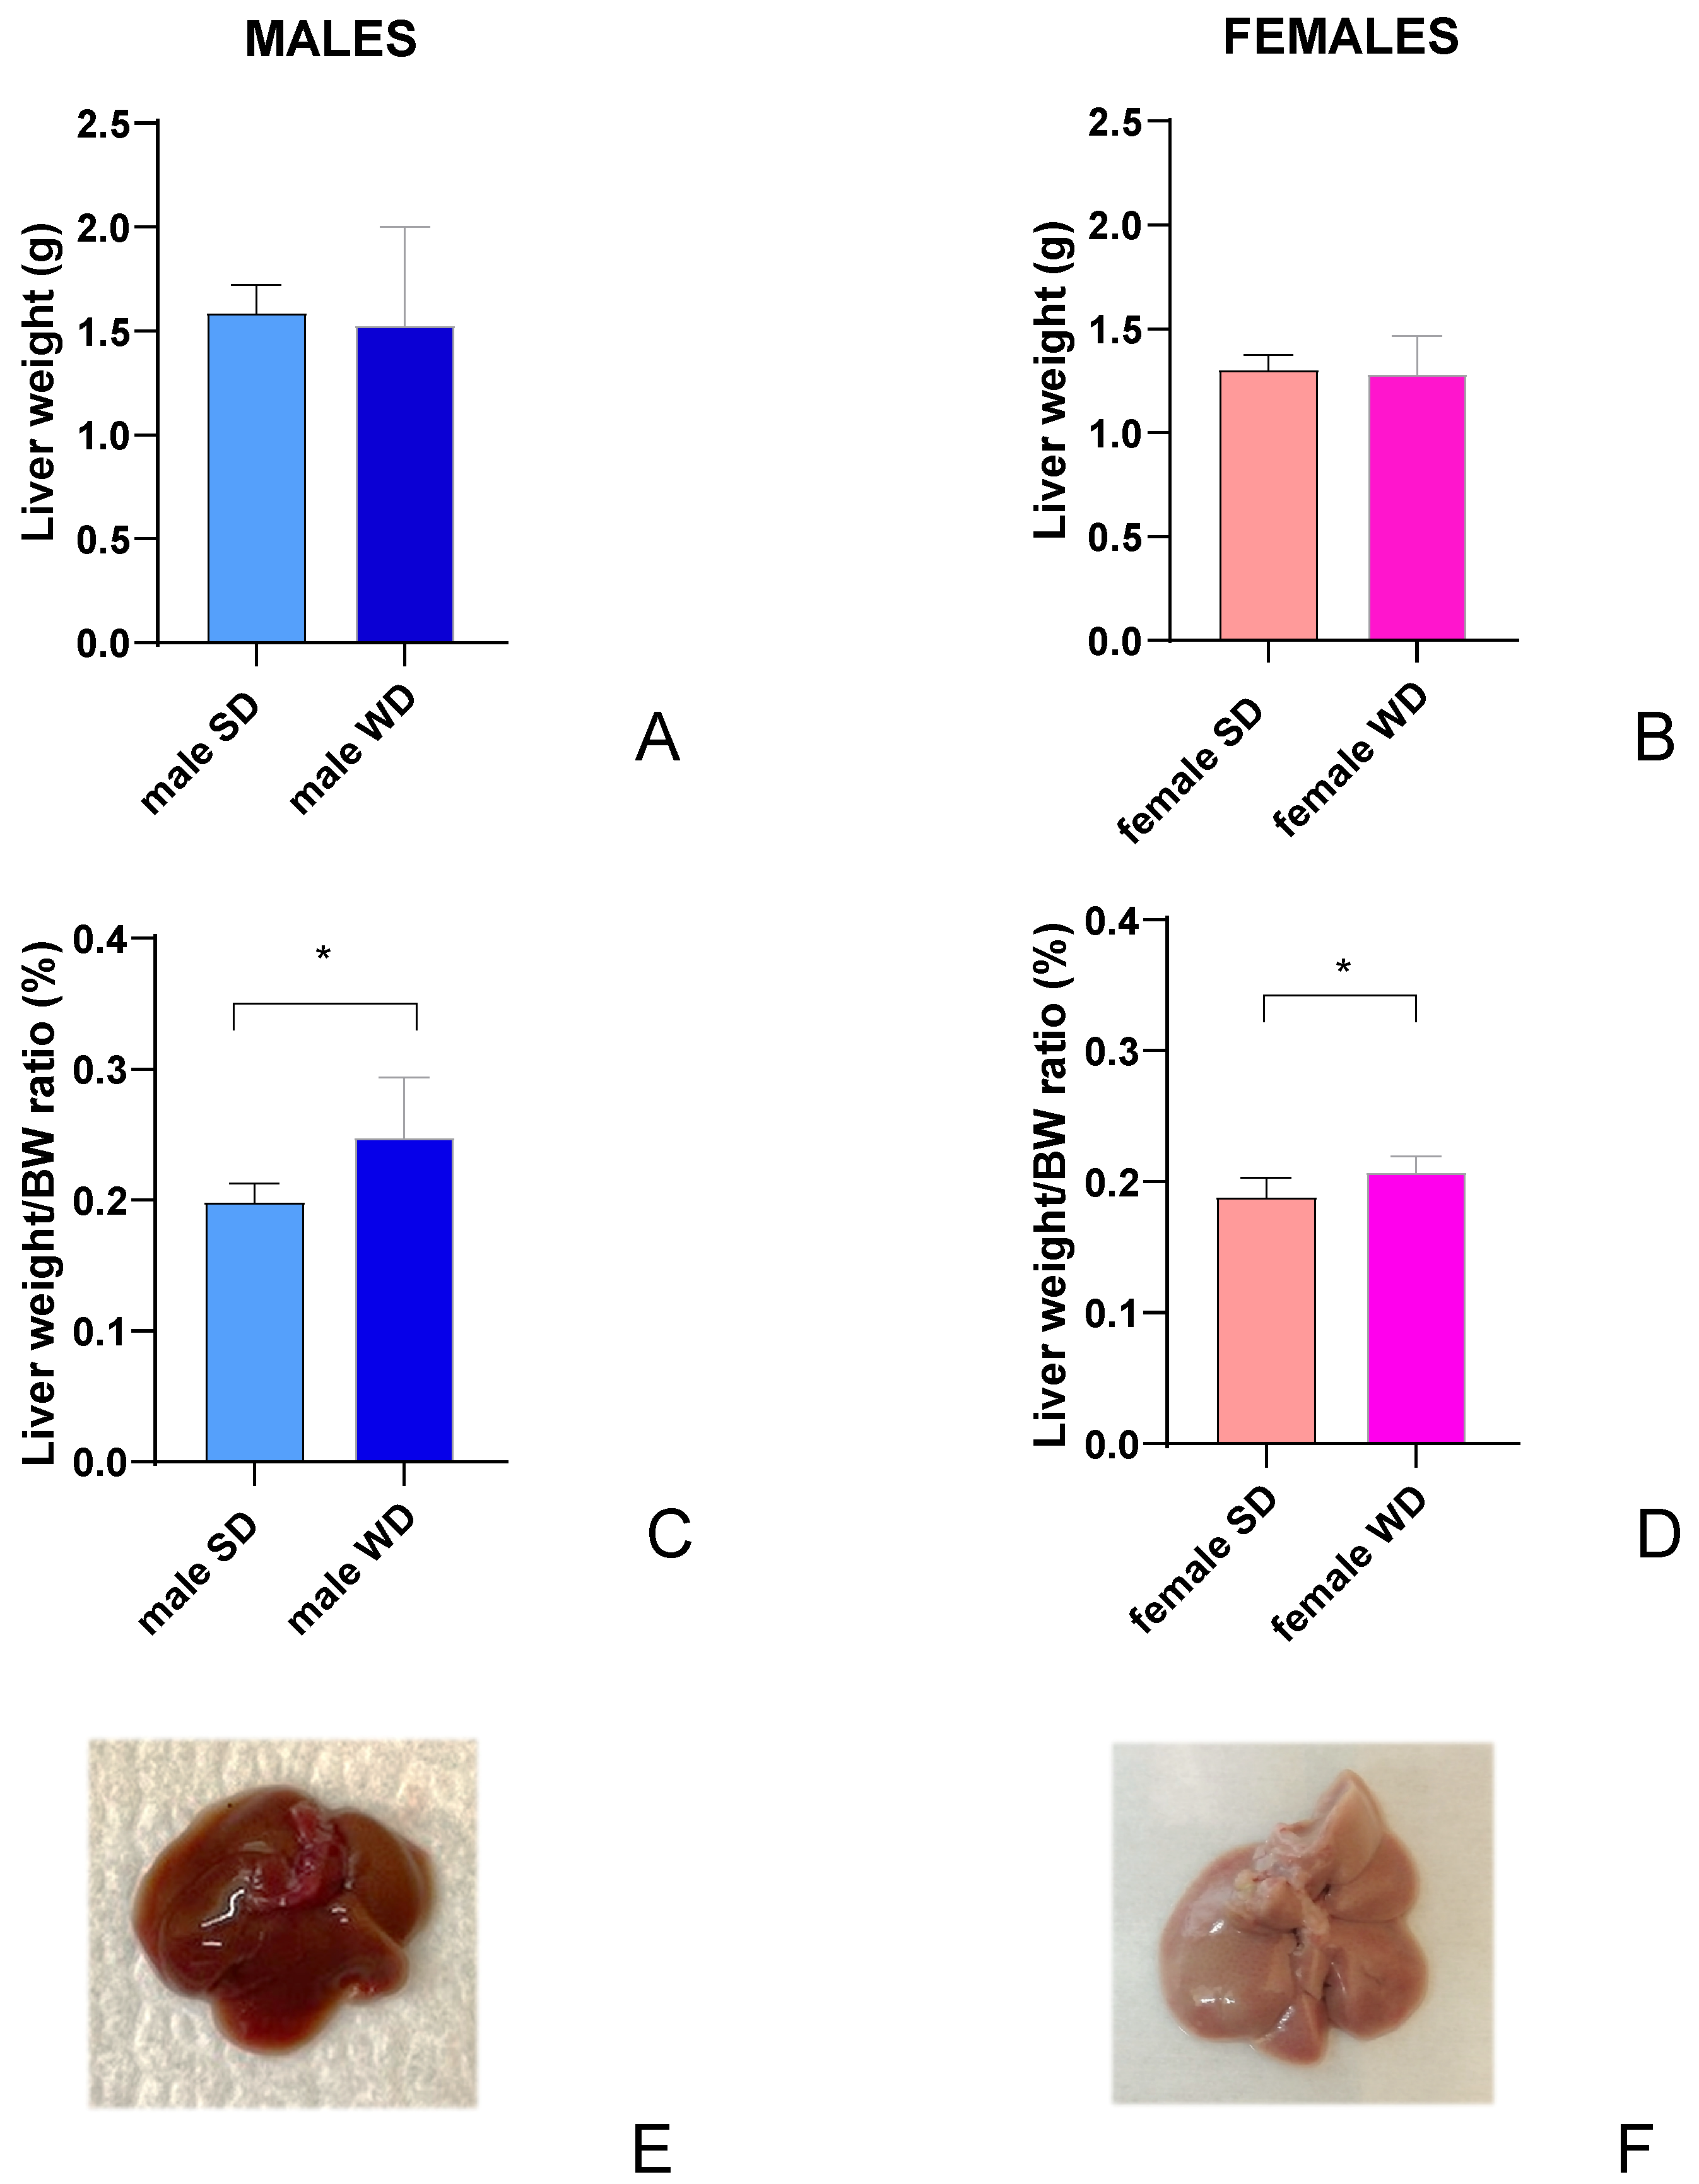
Figure 4.
Effects of diet on feeding behavior. Daily food intake (g) [Figure 4A,B], caloric intake (kcal) [Figure 4C,D] and FER [g of weight gained (g)/kcal consumed (kcal)] [Figure 4E,F] were calculated for each experimental week. Data were compared using repeated measures – two-way ANOVA-Mixed effect model followed by Sidak’s multiple comparison post-hoc test.
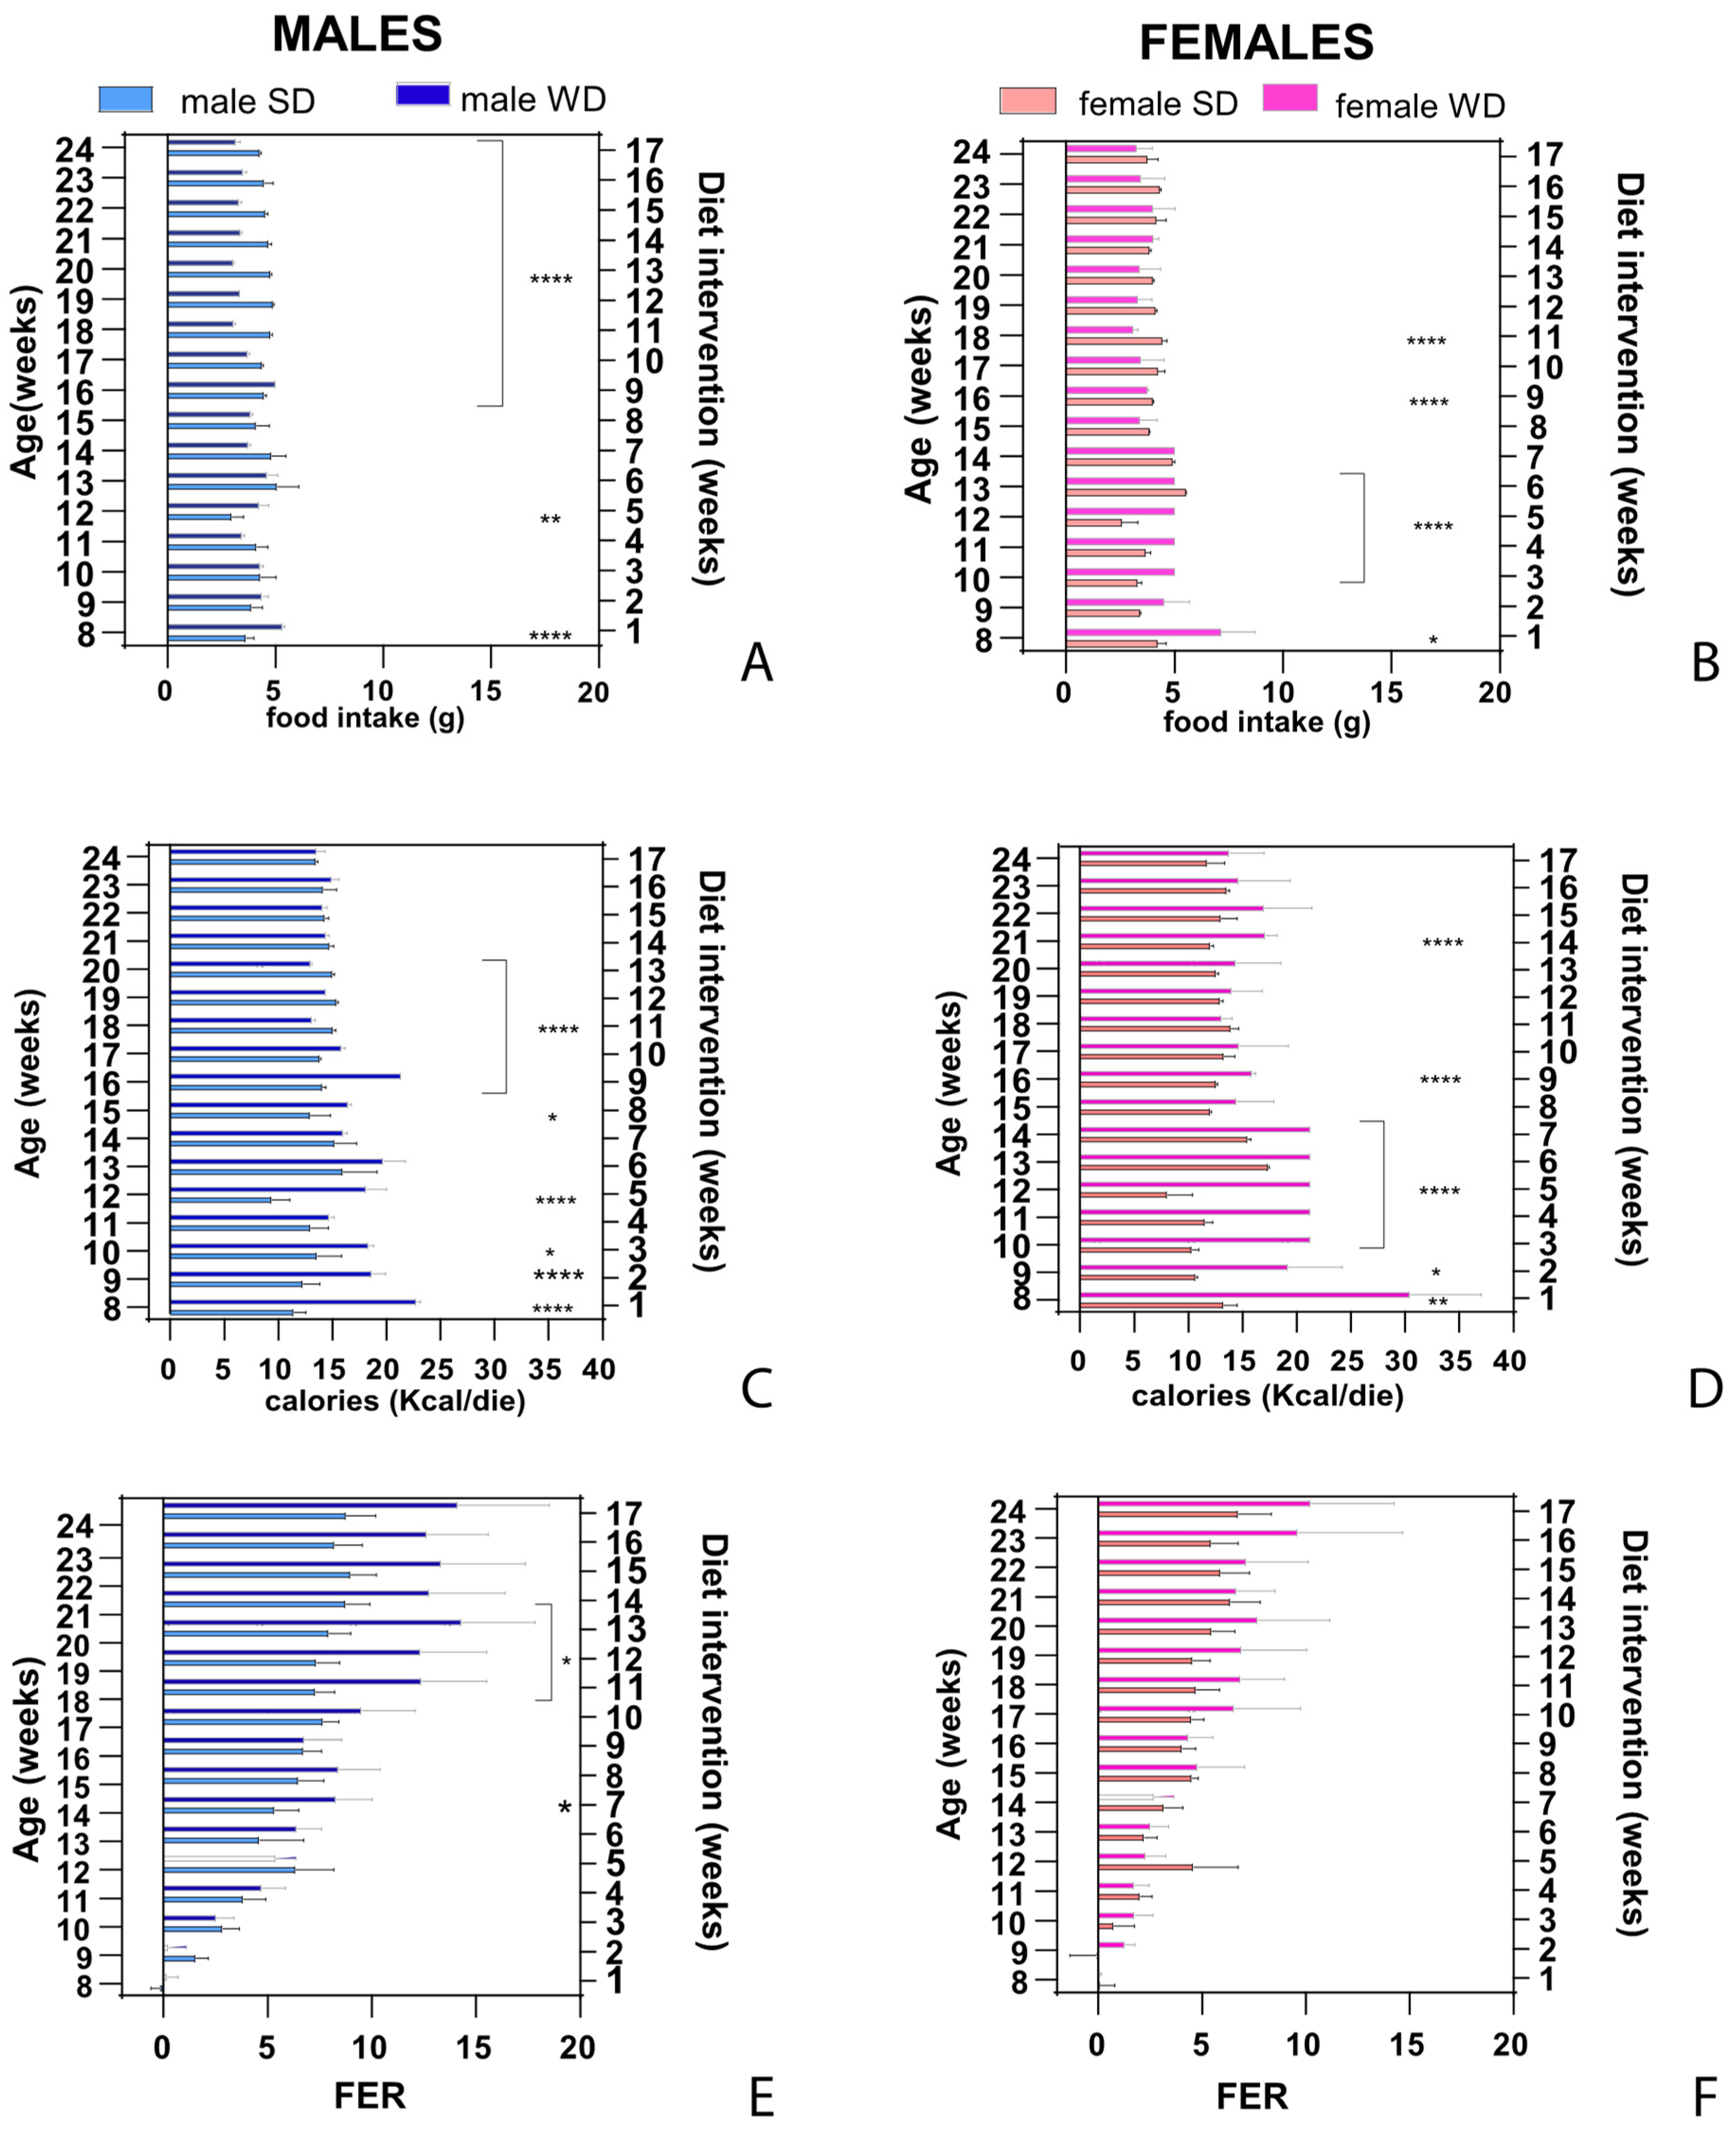
Figure 5.
Effects of diet on lipid homeostasis. Non-fasting total cholesterol (mg/dl) [Figure 5A,B] and non-fasting triglycerides (mg/dl) [Figure 5C,D] at 8 and 16 weeks of age in male and female mice, respectively. Data were compared using repeated measures – two-way ANOVA-Mixed effect model followed by Sidak’s multiple comparison post-hoc test. Changes in non-fasting triglycerides from baseline (%) [Figure 5E,F] were evaluated by Mann-Whitney test in male and female mice, respectively.
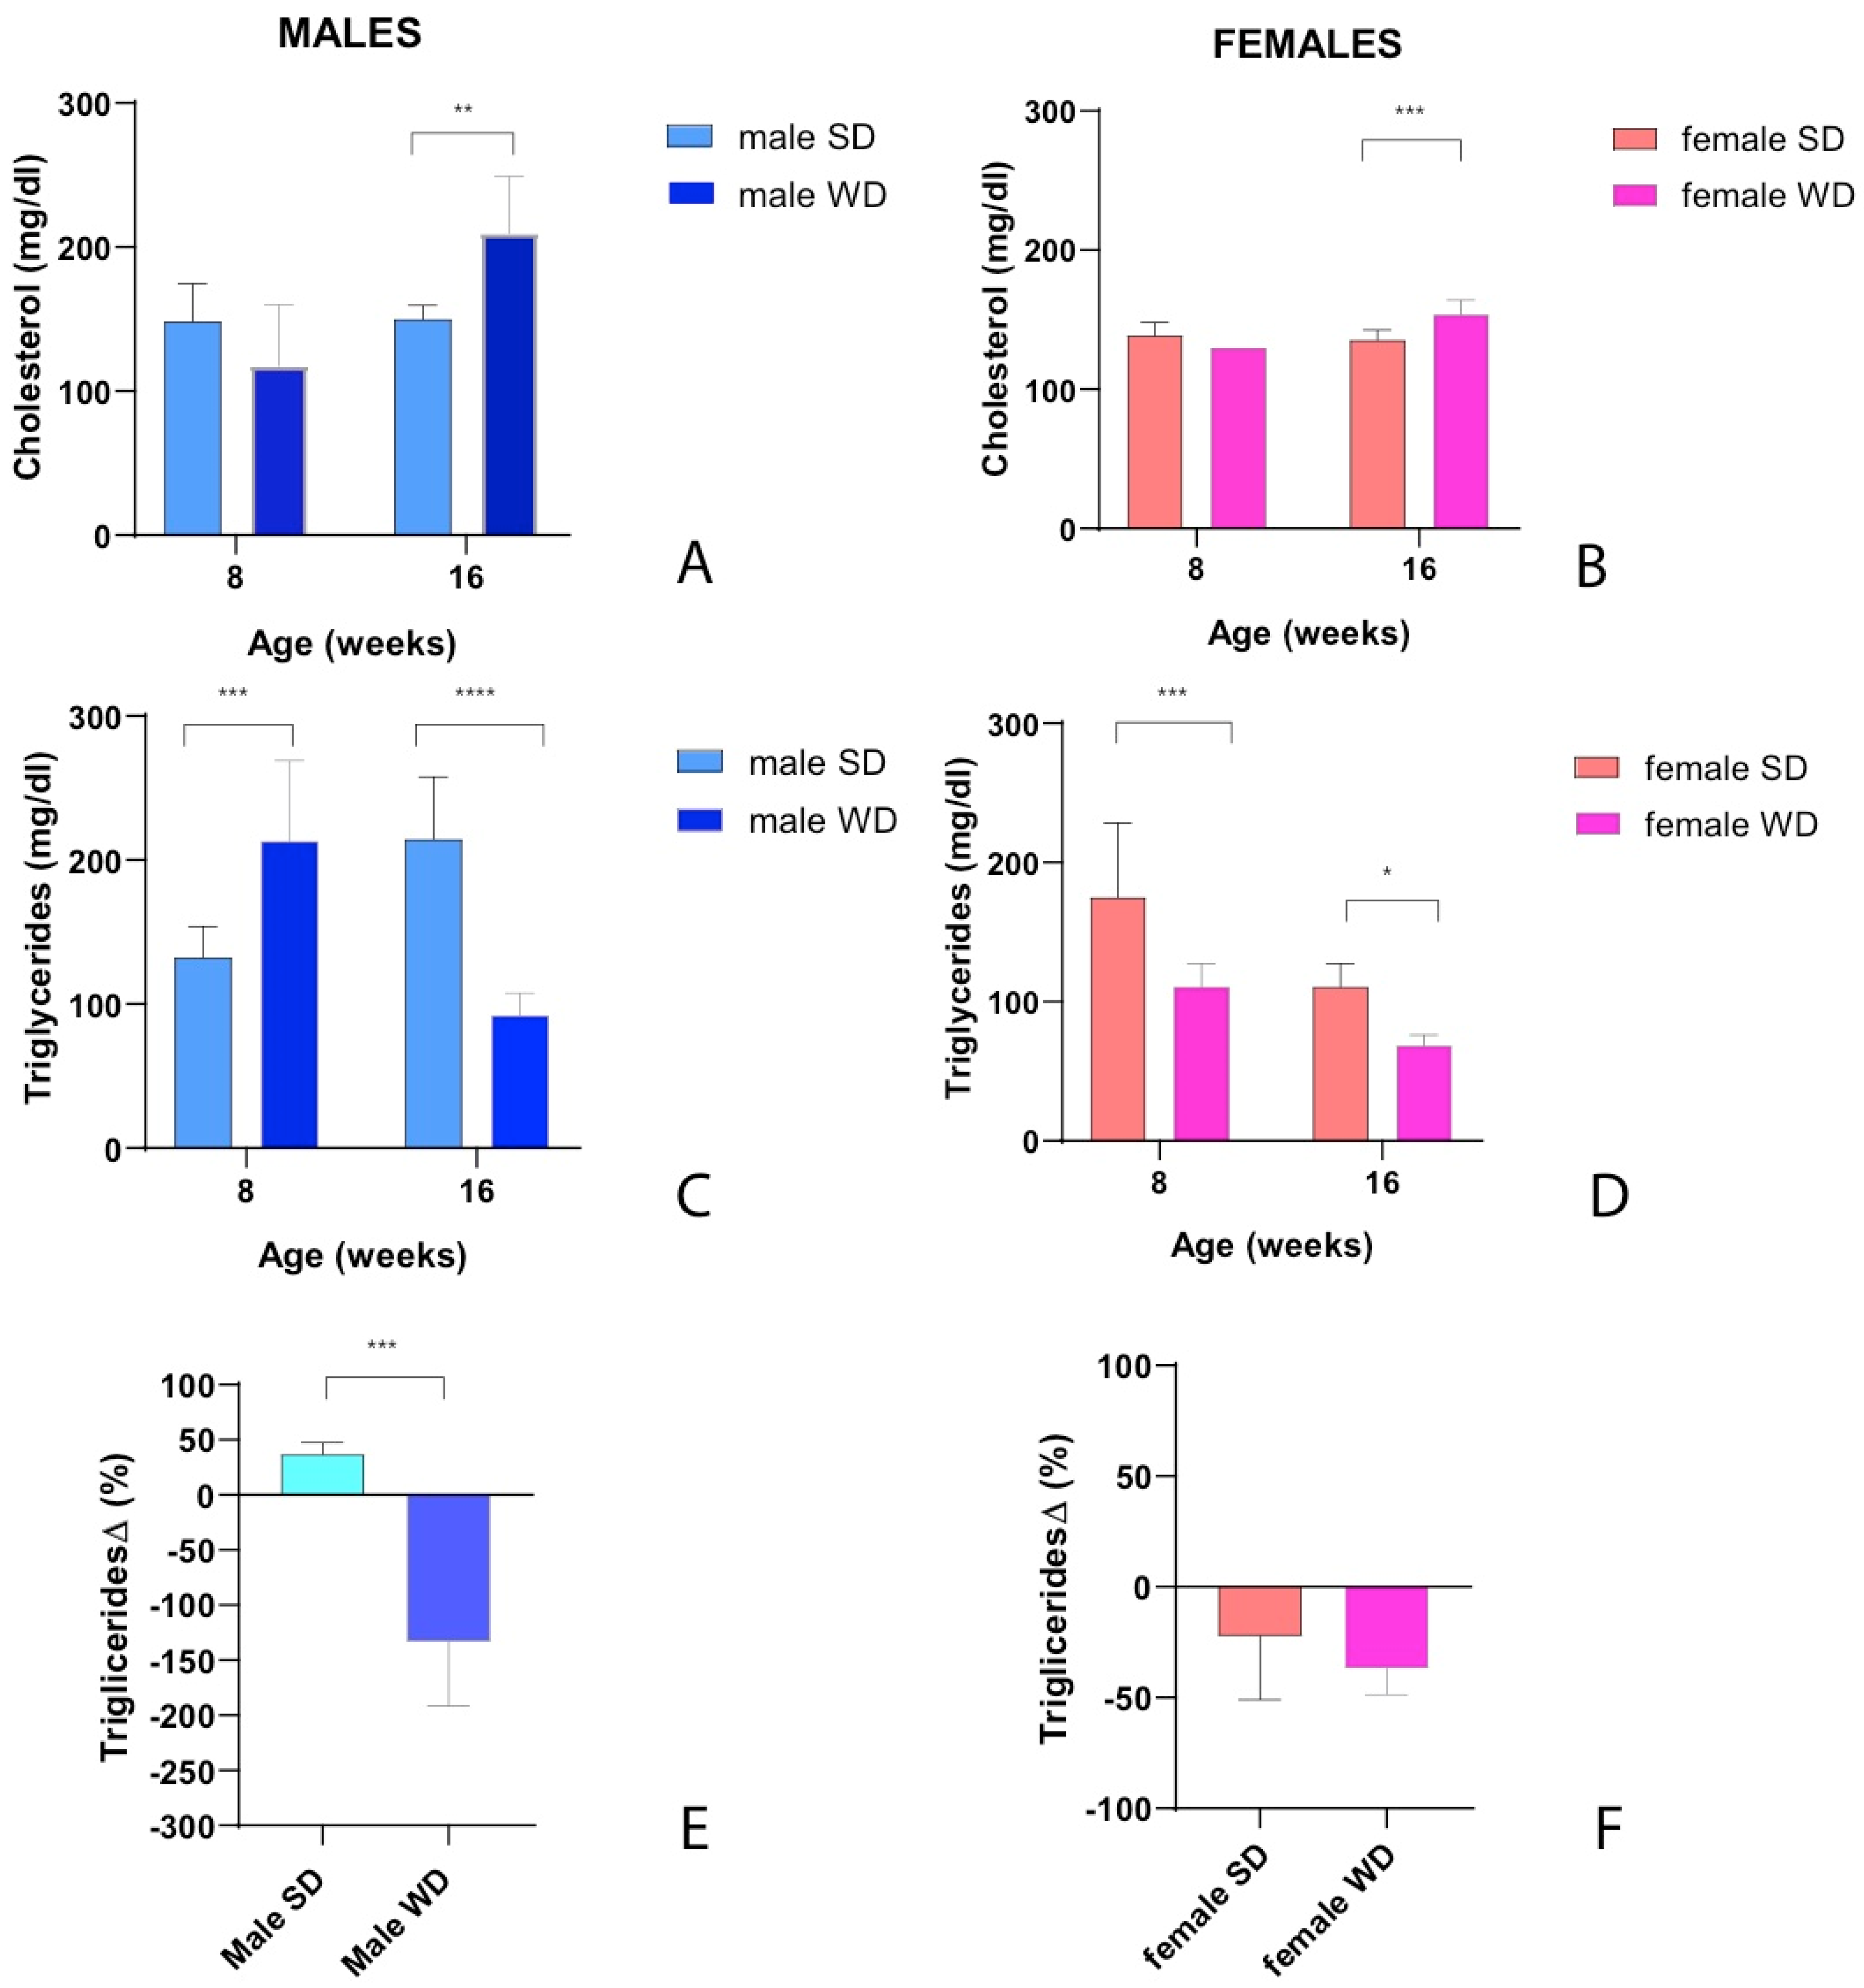
Figure 6.
Effects of diet on lipid homeostasis. Fasting total cholesterol (mg/dl) [Figure 6A,B] and fasting triglycerides (mg/dl) [Figure 6C,D] at 24 weeks of age in male and female mice, respectively. Data were compared using Mann-Whitney test between sex-matched groups.
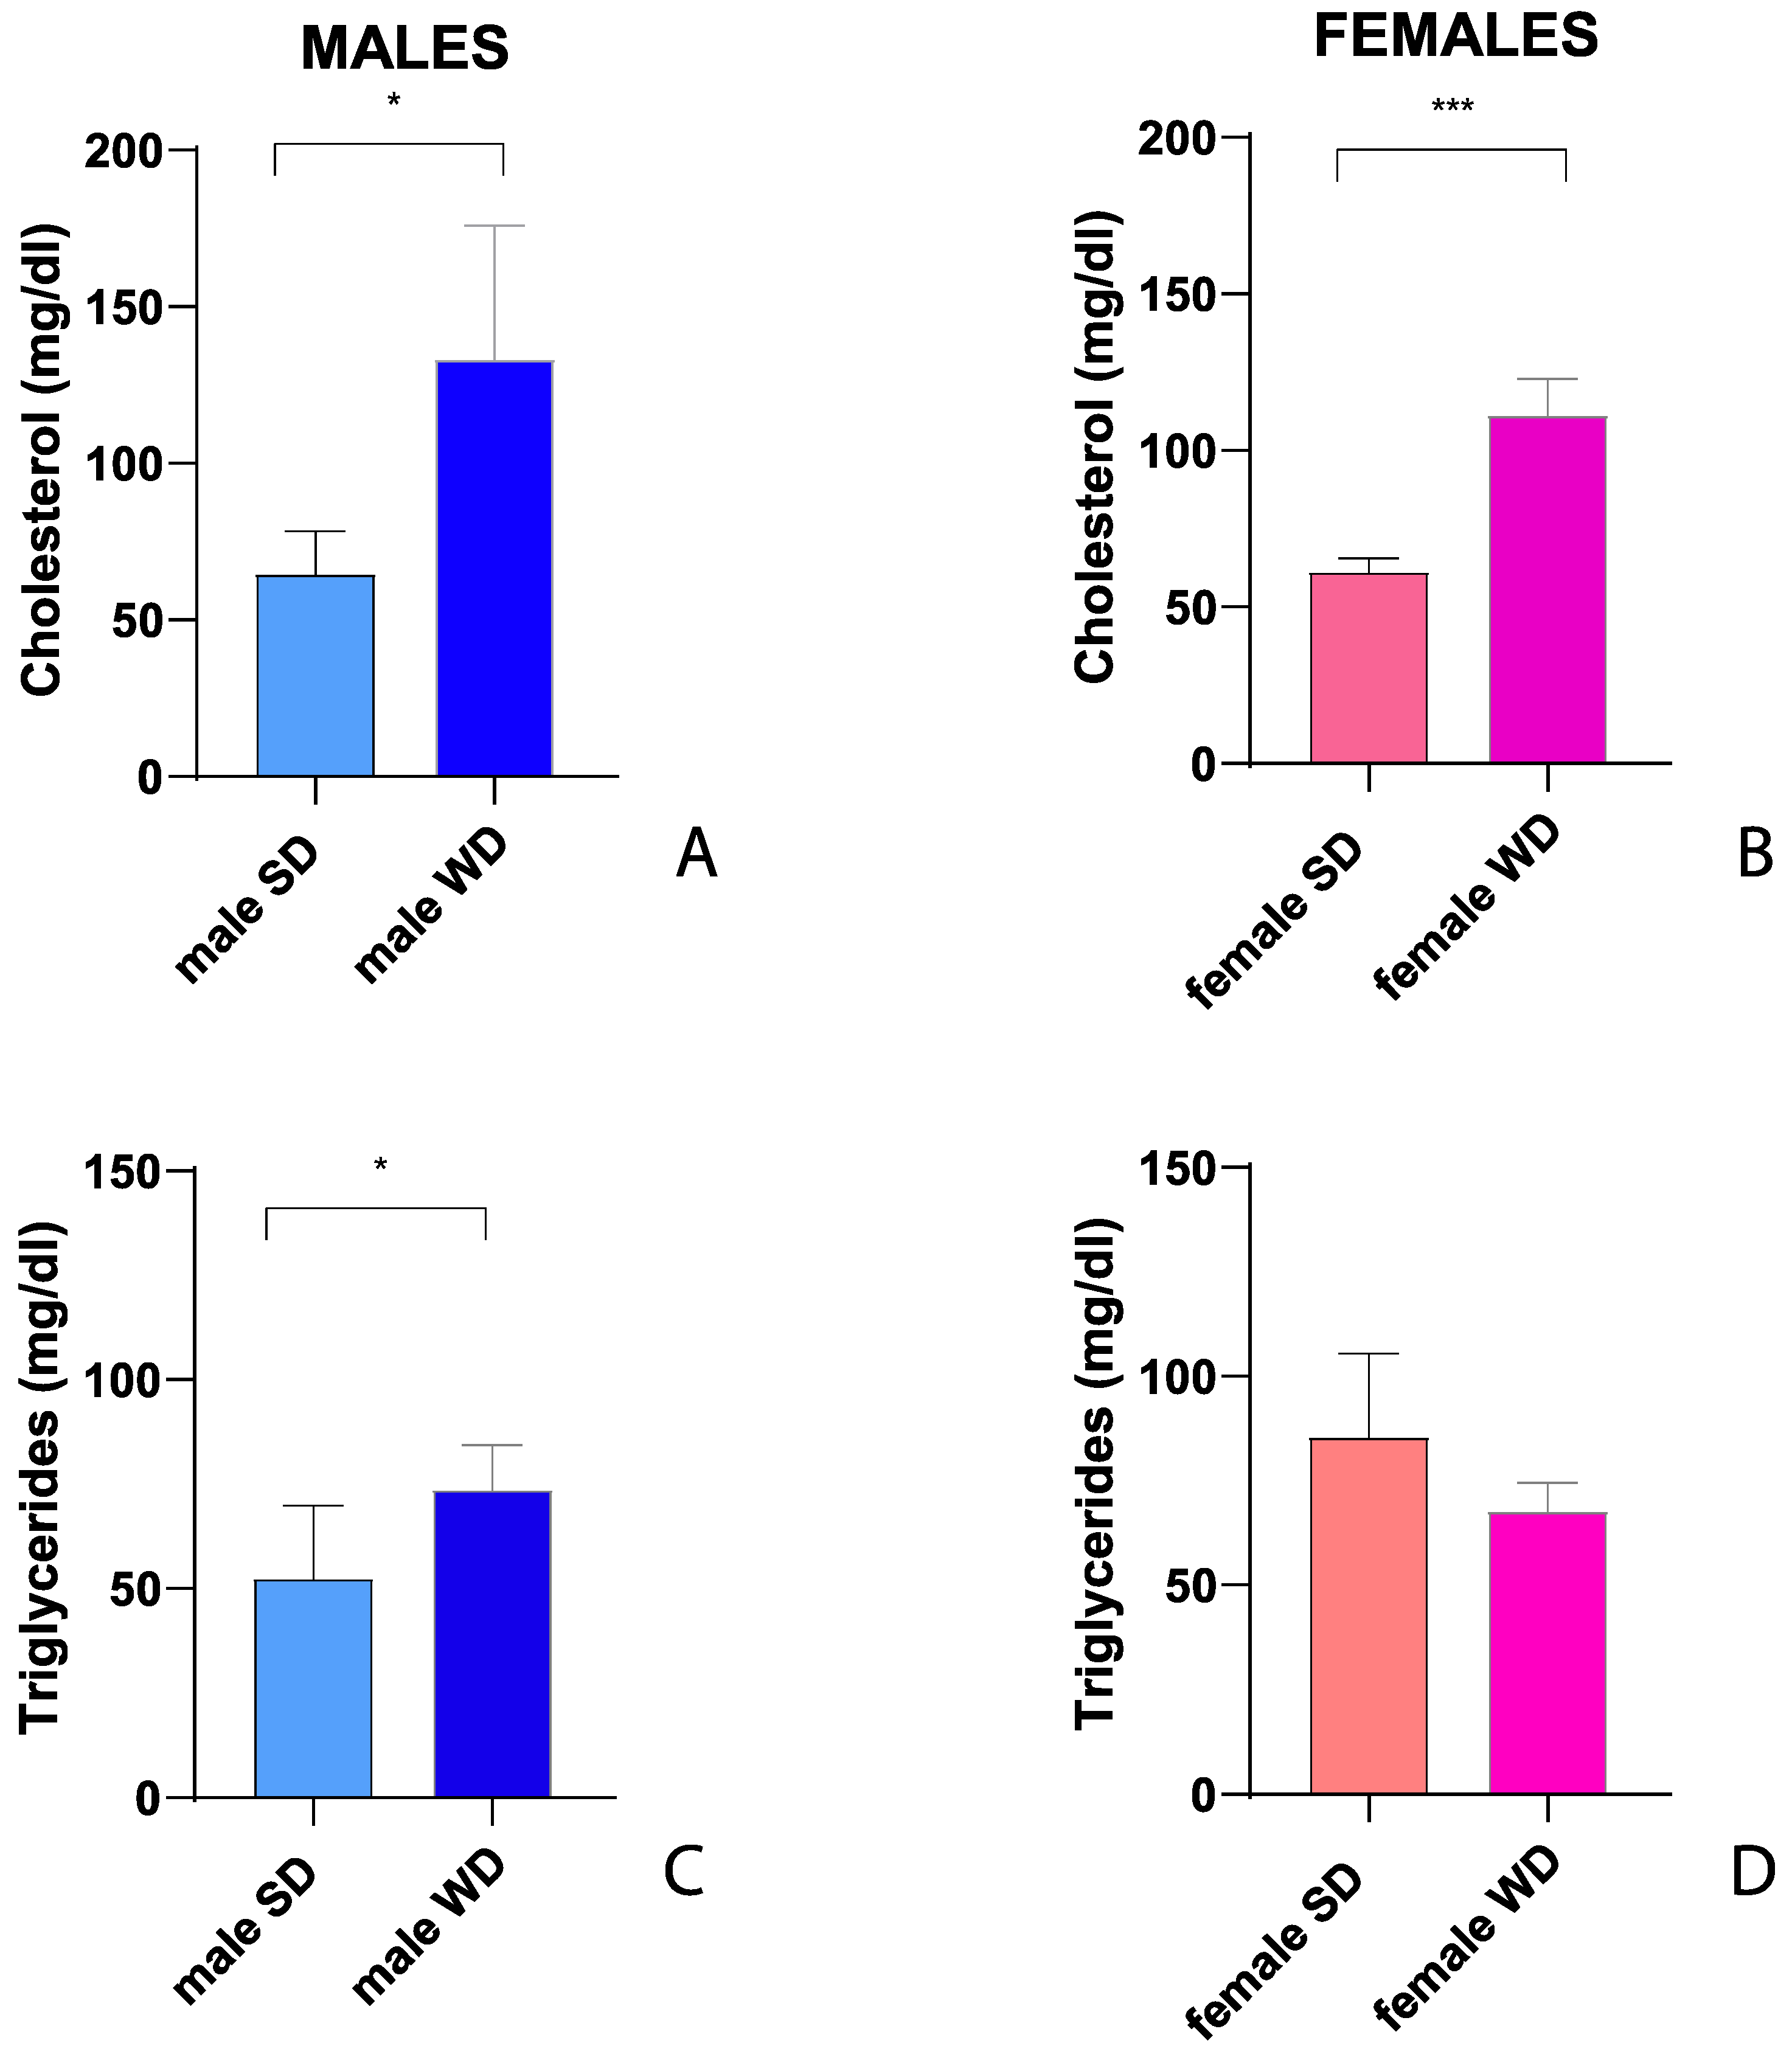
Figure 7.
Effects of diet on glucose homeostasis and insulin sensitivity. Non-fasting glucose (mg/dl) [Figure 7 A, B] at 8 and 16 weeks of age in male and female mice, respectively. Data were compared using repeated measures – two-way ANOVA-Mixed effect model followed by Sidak’s multiple comparison post-hoc test. Fasting glucose (mg/dl) [Figure 7C,D], fasting insulin (ng/ml) [Figure 7E,F], HOMA S (%) [Figure 7G,H], HOMA B (%) [Figure 7I,L] and HOMA IR [Figure 7M,N] indexes at 24 weeks of age in male and female mice. Data were compared using Mann-Whitney test between sex-matched groups.
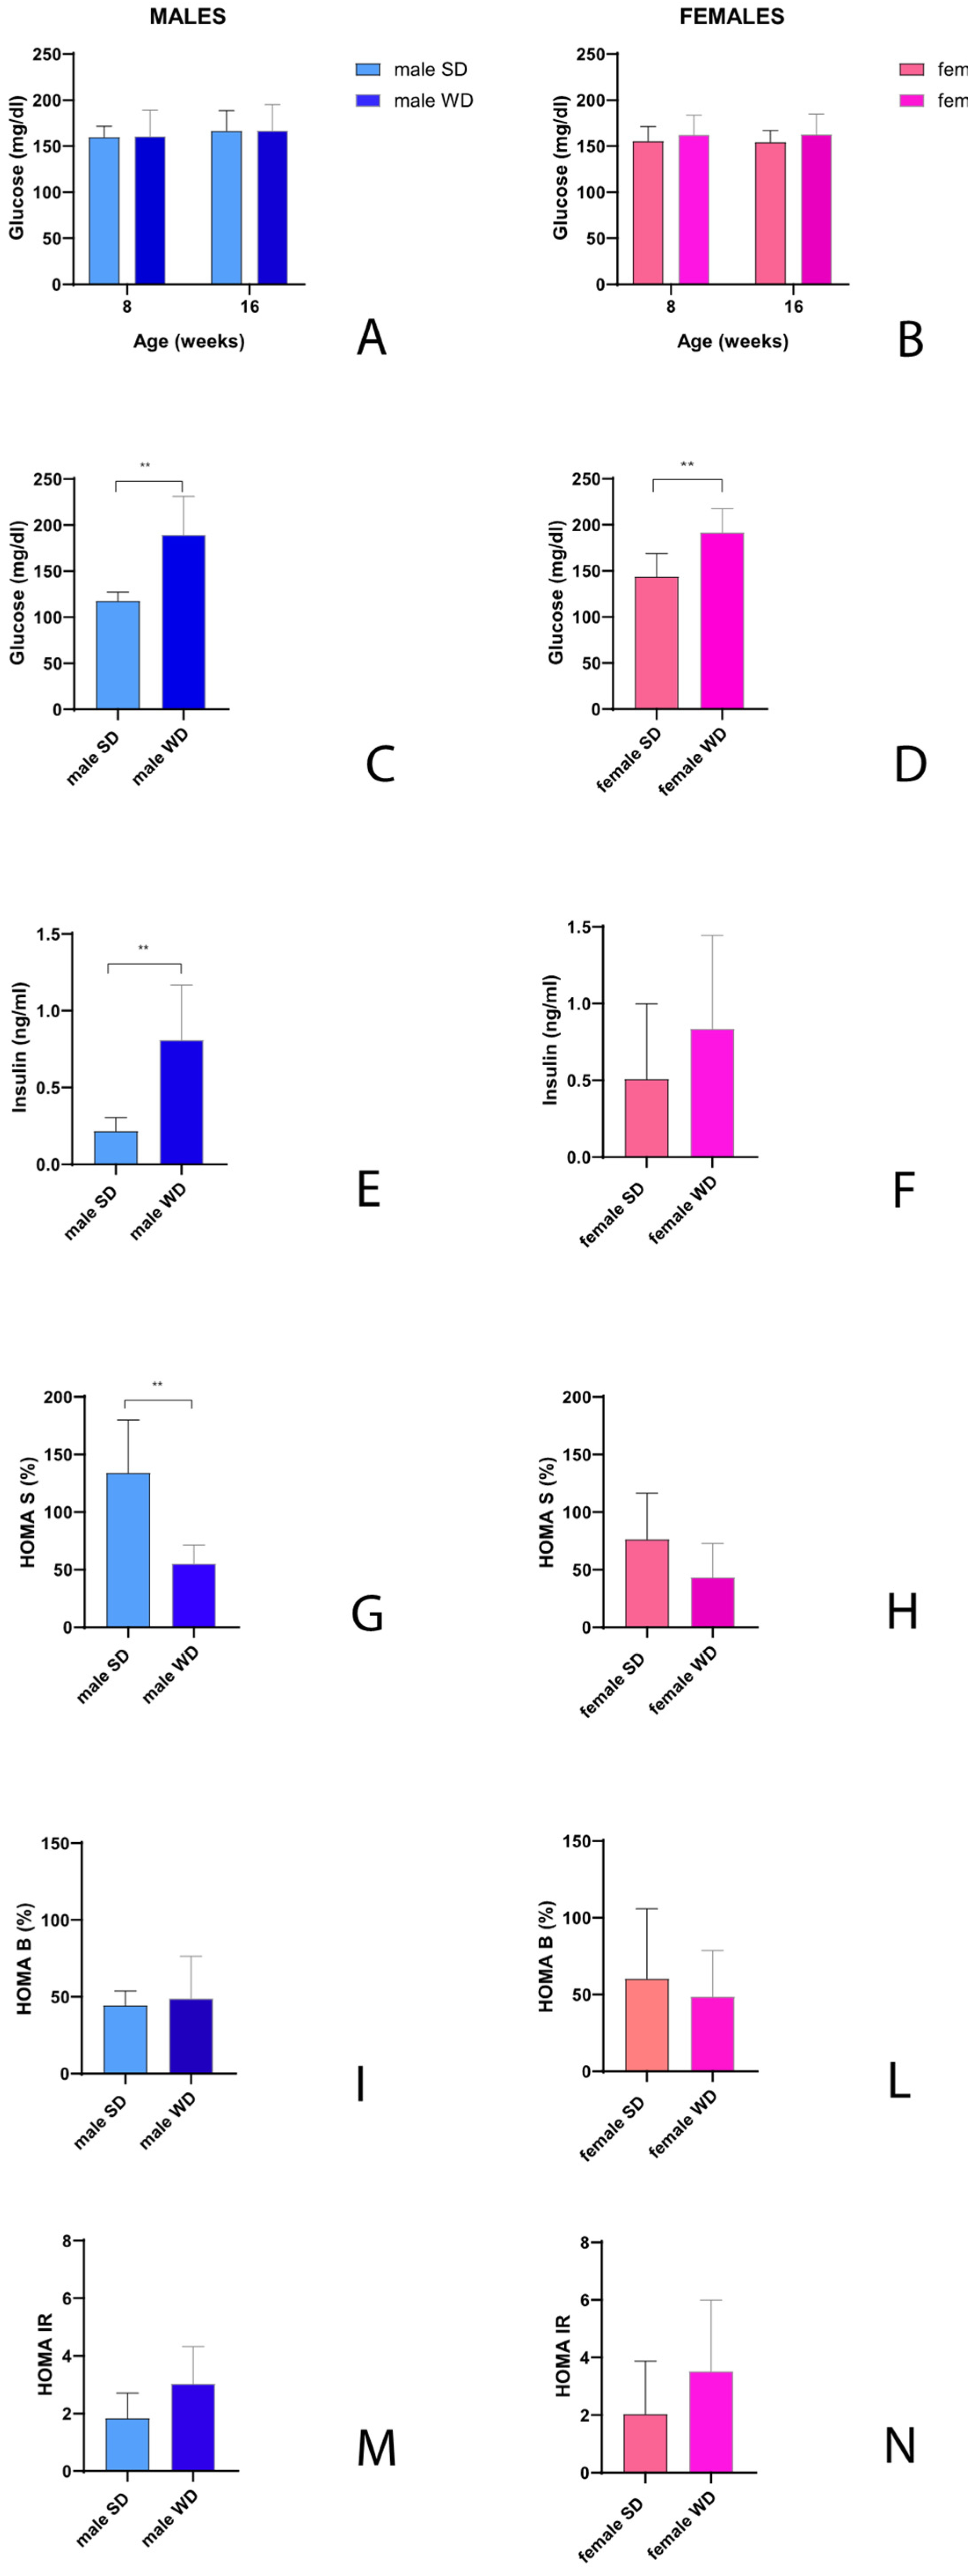
Figure 8.
Effects of diet on liver and kidney function. ALT (U/L) and AST (U/L) values [Figure 8A–D] and BUN (mg/dl) [Figure 8E–F] at 24 weeks of age in male and female mice. Data were compared using Mann-Whitney test between sex-matched groups.
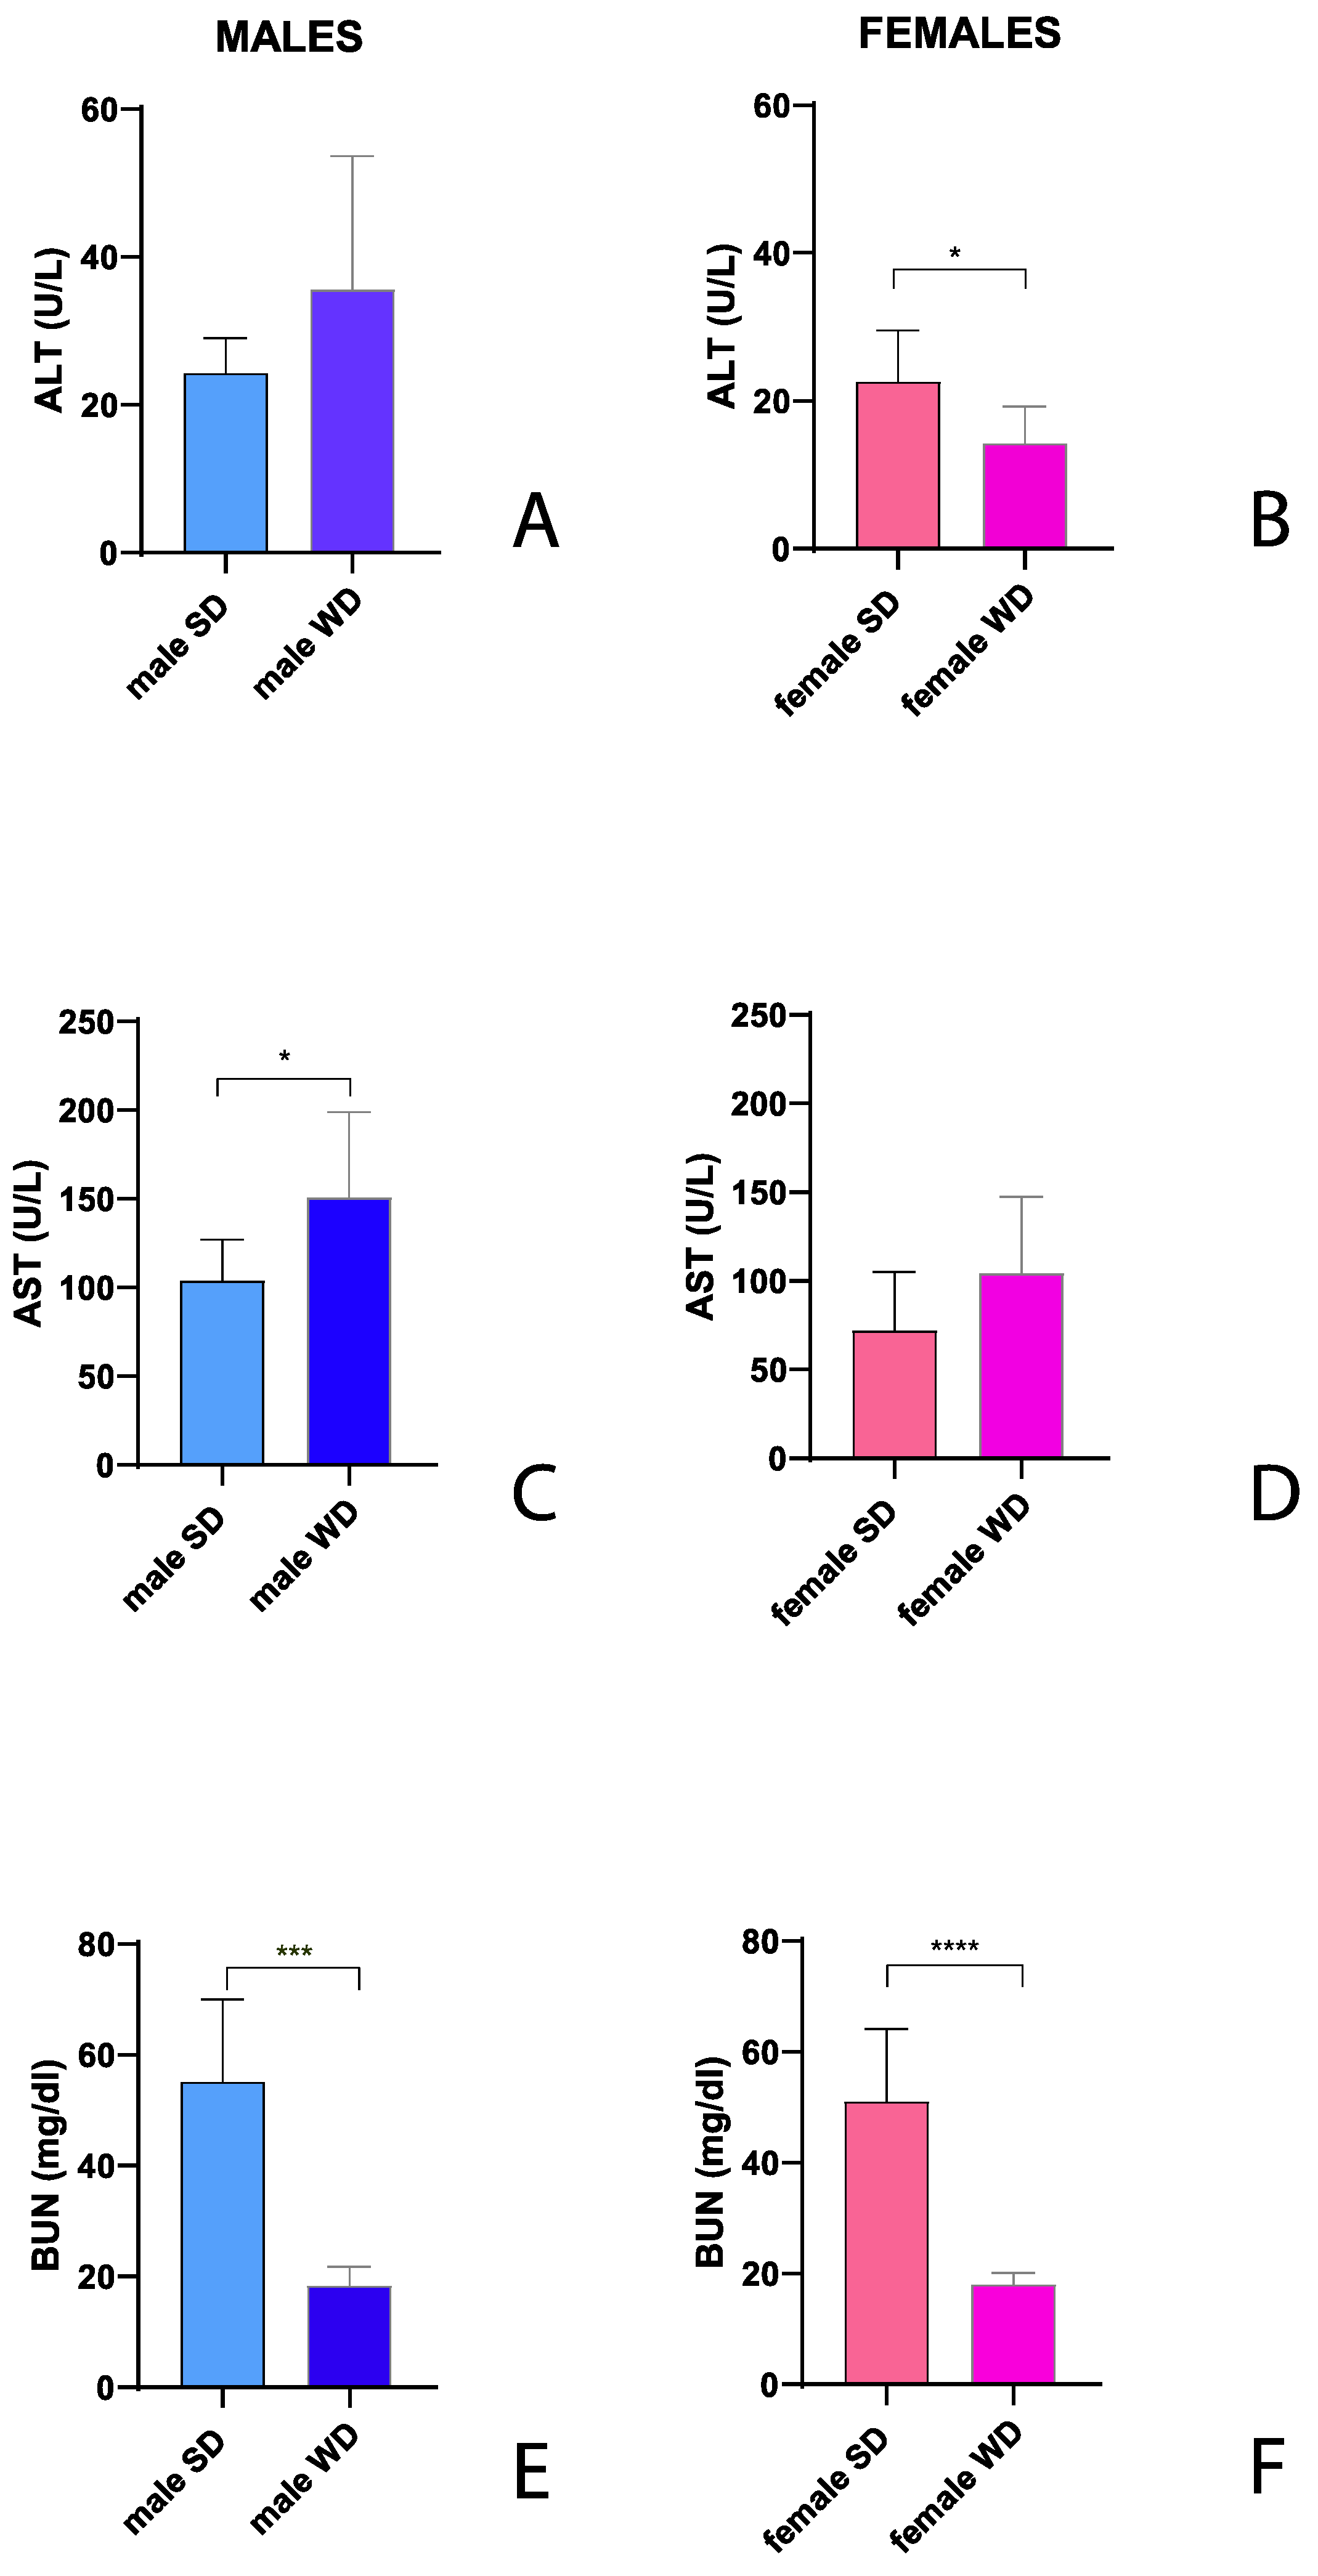
Figure 9.
Representative ultrasound images and correlation with histology of C57Bl/6J mice fed a standard diet. PANEL (A) example of normal rodent liver/kidney echogenicity ratio in a 24-weeks-old male mouse, with less echogenic hepatic parenchyma than the right renal cortex, comparable to that observed at 8 and 16 weeks of age (upper row, left); homogenous hepatic parenchymal echogenicity, regular liver surface, sharp margins, distinct visualization of the portal vein vessels, with finely coarsened echotexture (upper row, right). Histological evaluation of the same hepatic parenchyma in US images showing hepatocytes with a pale cytoplasm and hepatocytes with more eosinophilic cytoplasm (H&E); PAS staining confirmed physiologic cytoplasmic glycogen collections.
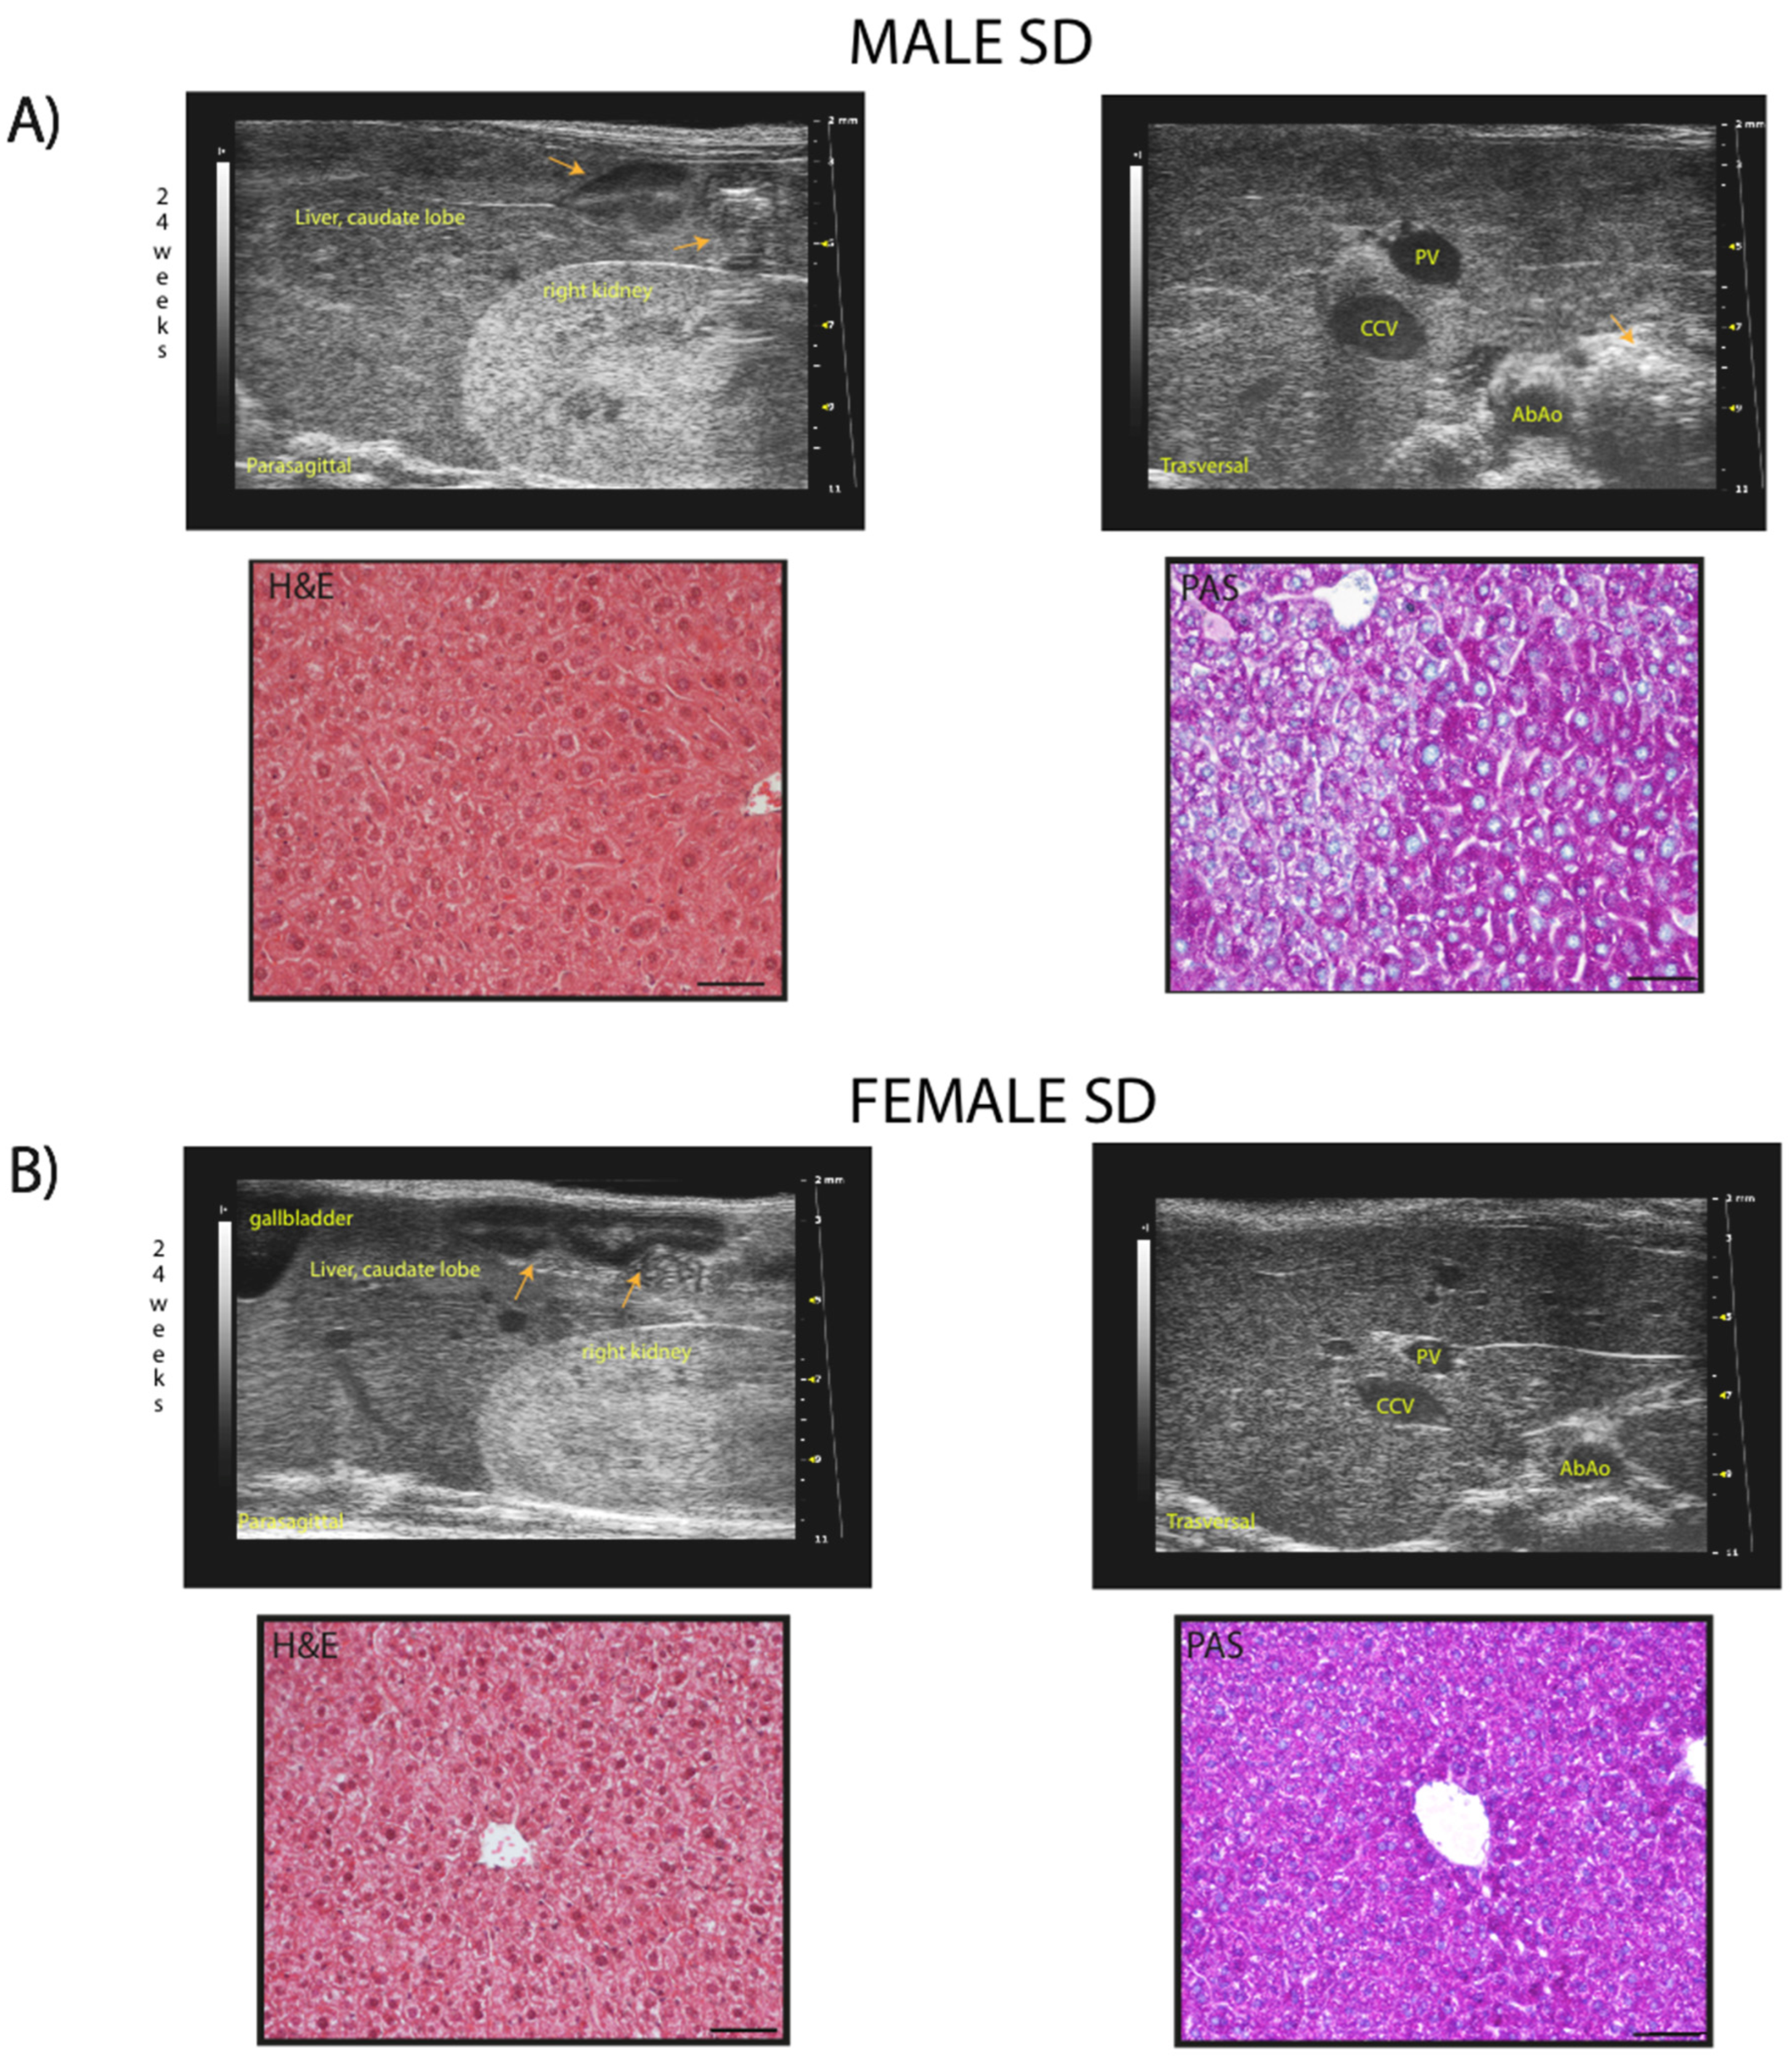
Figure 10.
Representative ultrasound images and correlation with histology of C57Bl/6J mice fed a western diet.
Figure 10.
Representative ultrasound images and correlation with histology of C57Bl/6J mice fed a western diet.
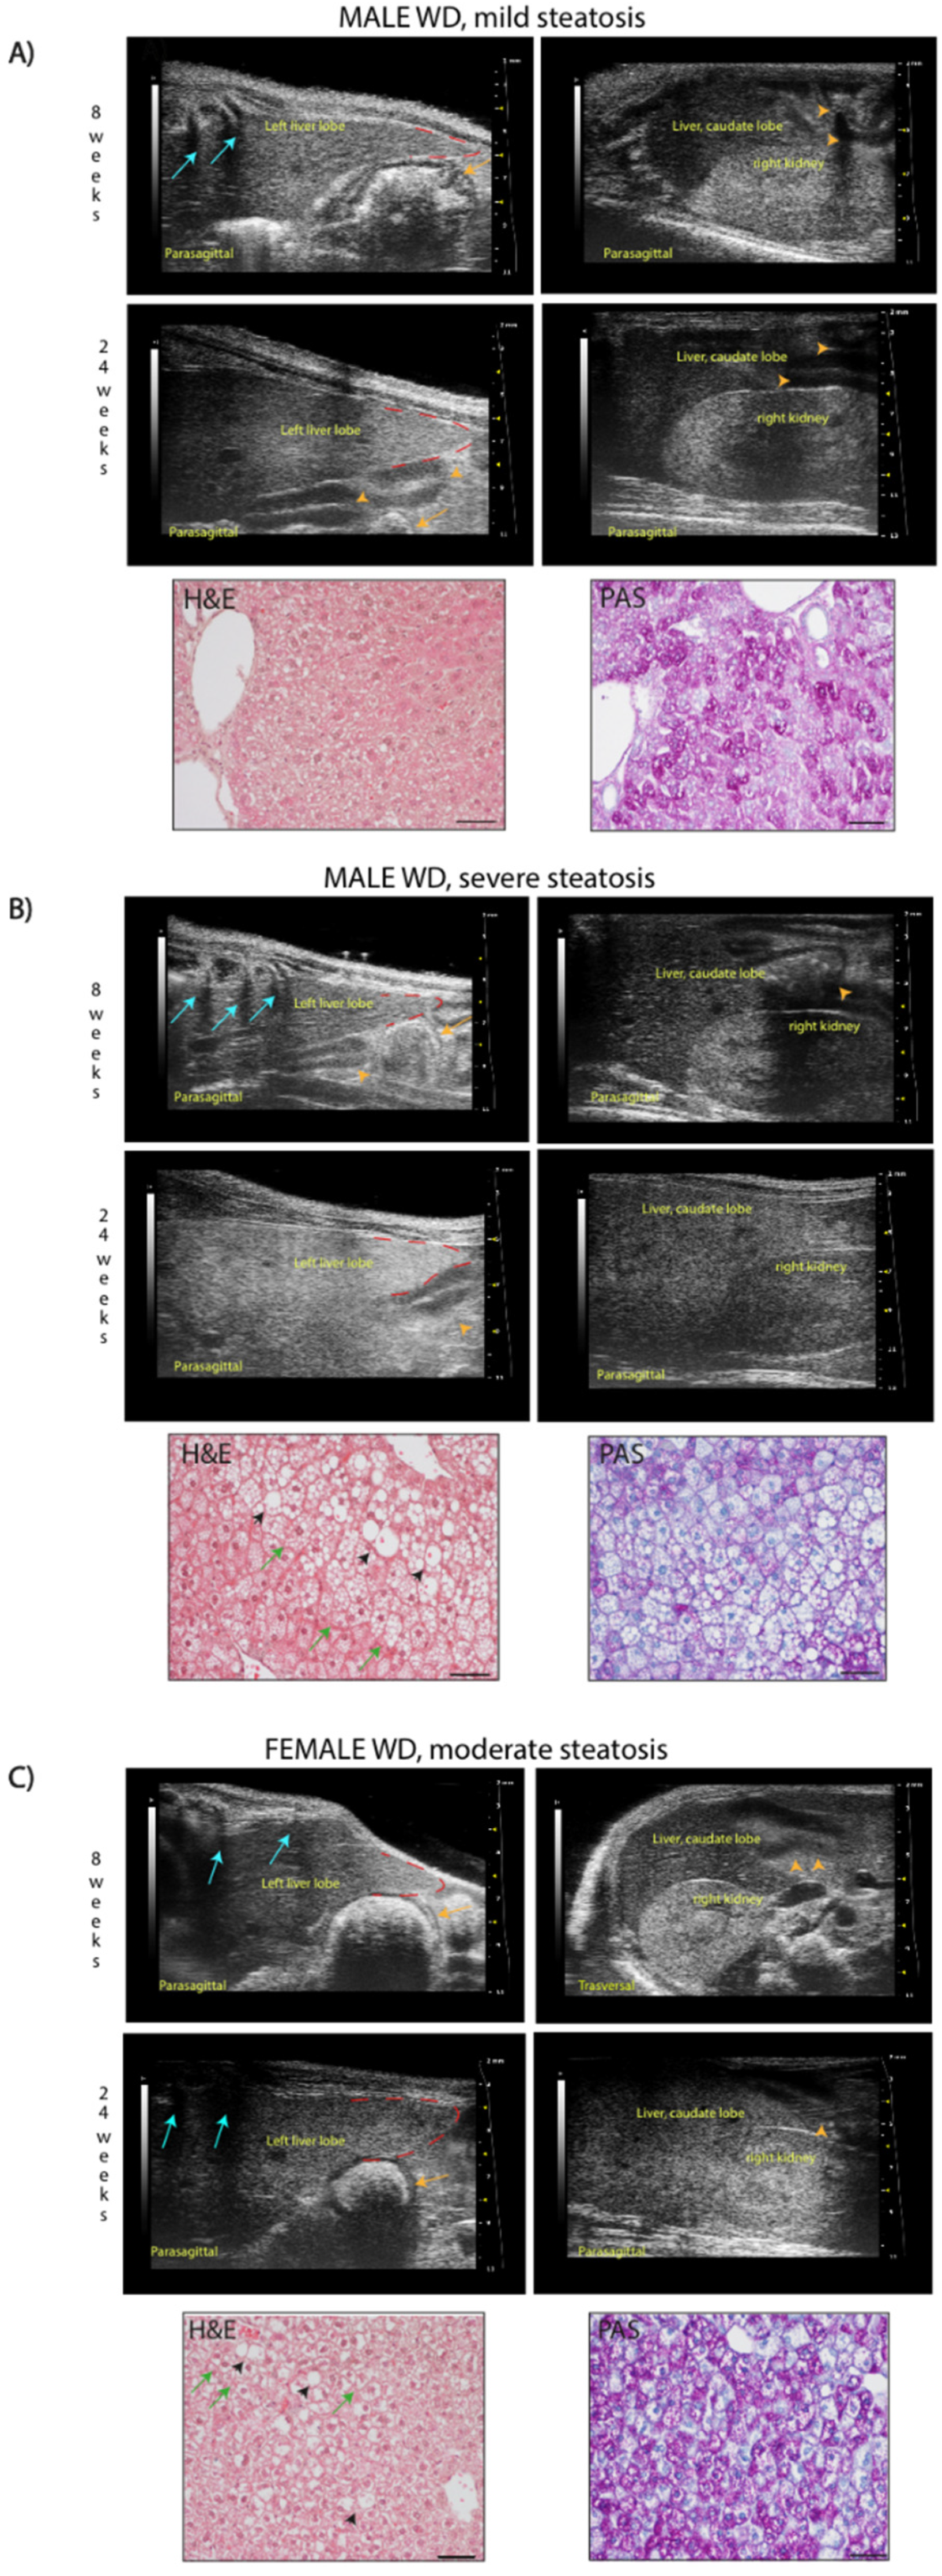
Figure 11.
Standardized Ultrasound Hepatic/Renal Ratio, representative ultrasound parametric imaging for longitudinal assessment of fatty liver progression: (A) 8-weeks-old C57Bl/6J male mouse, baseline examination prior to Western type diet initiation: normal liver/kidney ratio in rodents, with hepatic parenchyma less echogenic than the right renal cortex (HR= 0,79); (B) the same mouse shows hepatic echogenicity equal to the renal cortex at 16 weeks of age (HR= 1,01) and (C) increased liver echogenicity compared to right renal cortex at 24 weeks of age (HR= 1,25). The graphic representation of region of interest (ROI) circles show the gray scale distribution [signal brightness intensity expressed in Arbitrary Units (Au, blue bar=mean value; green bars= standard deviation)] of the pixels in the selected liver, right kidney cortex.
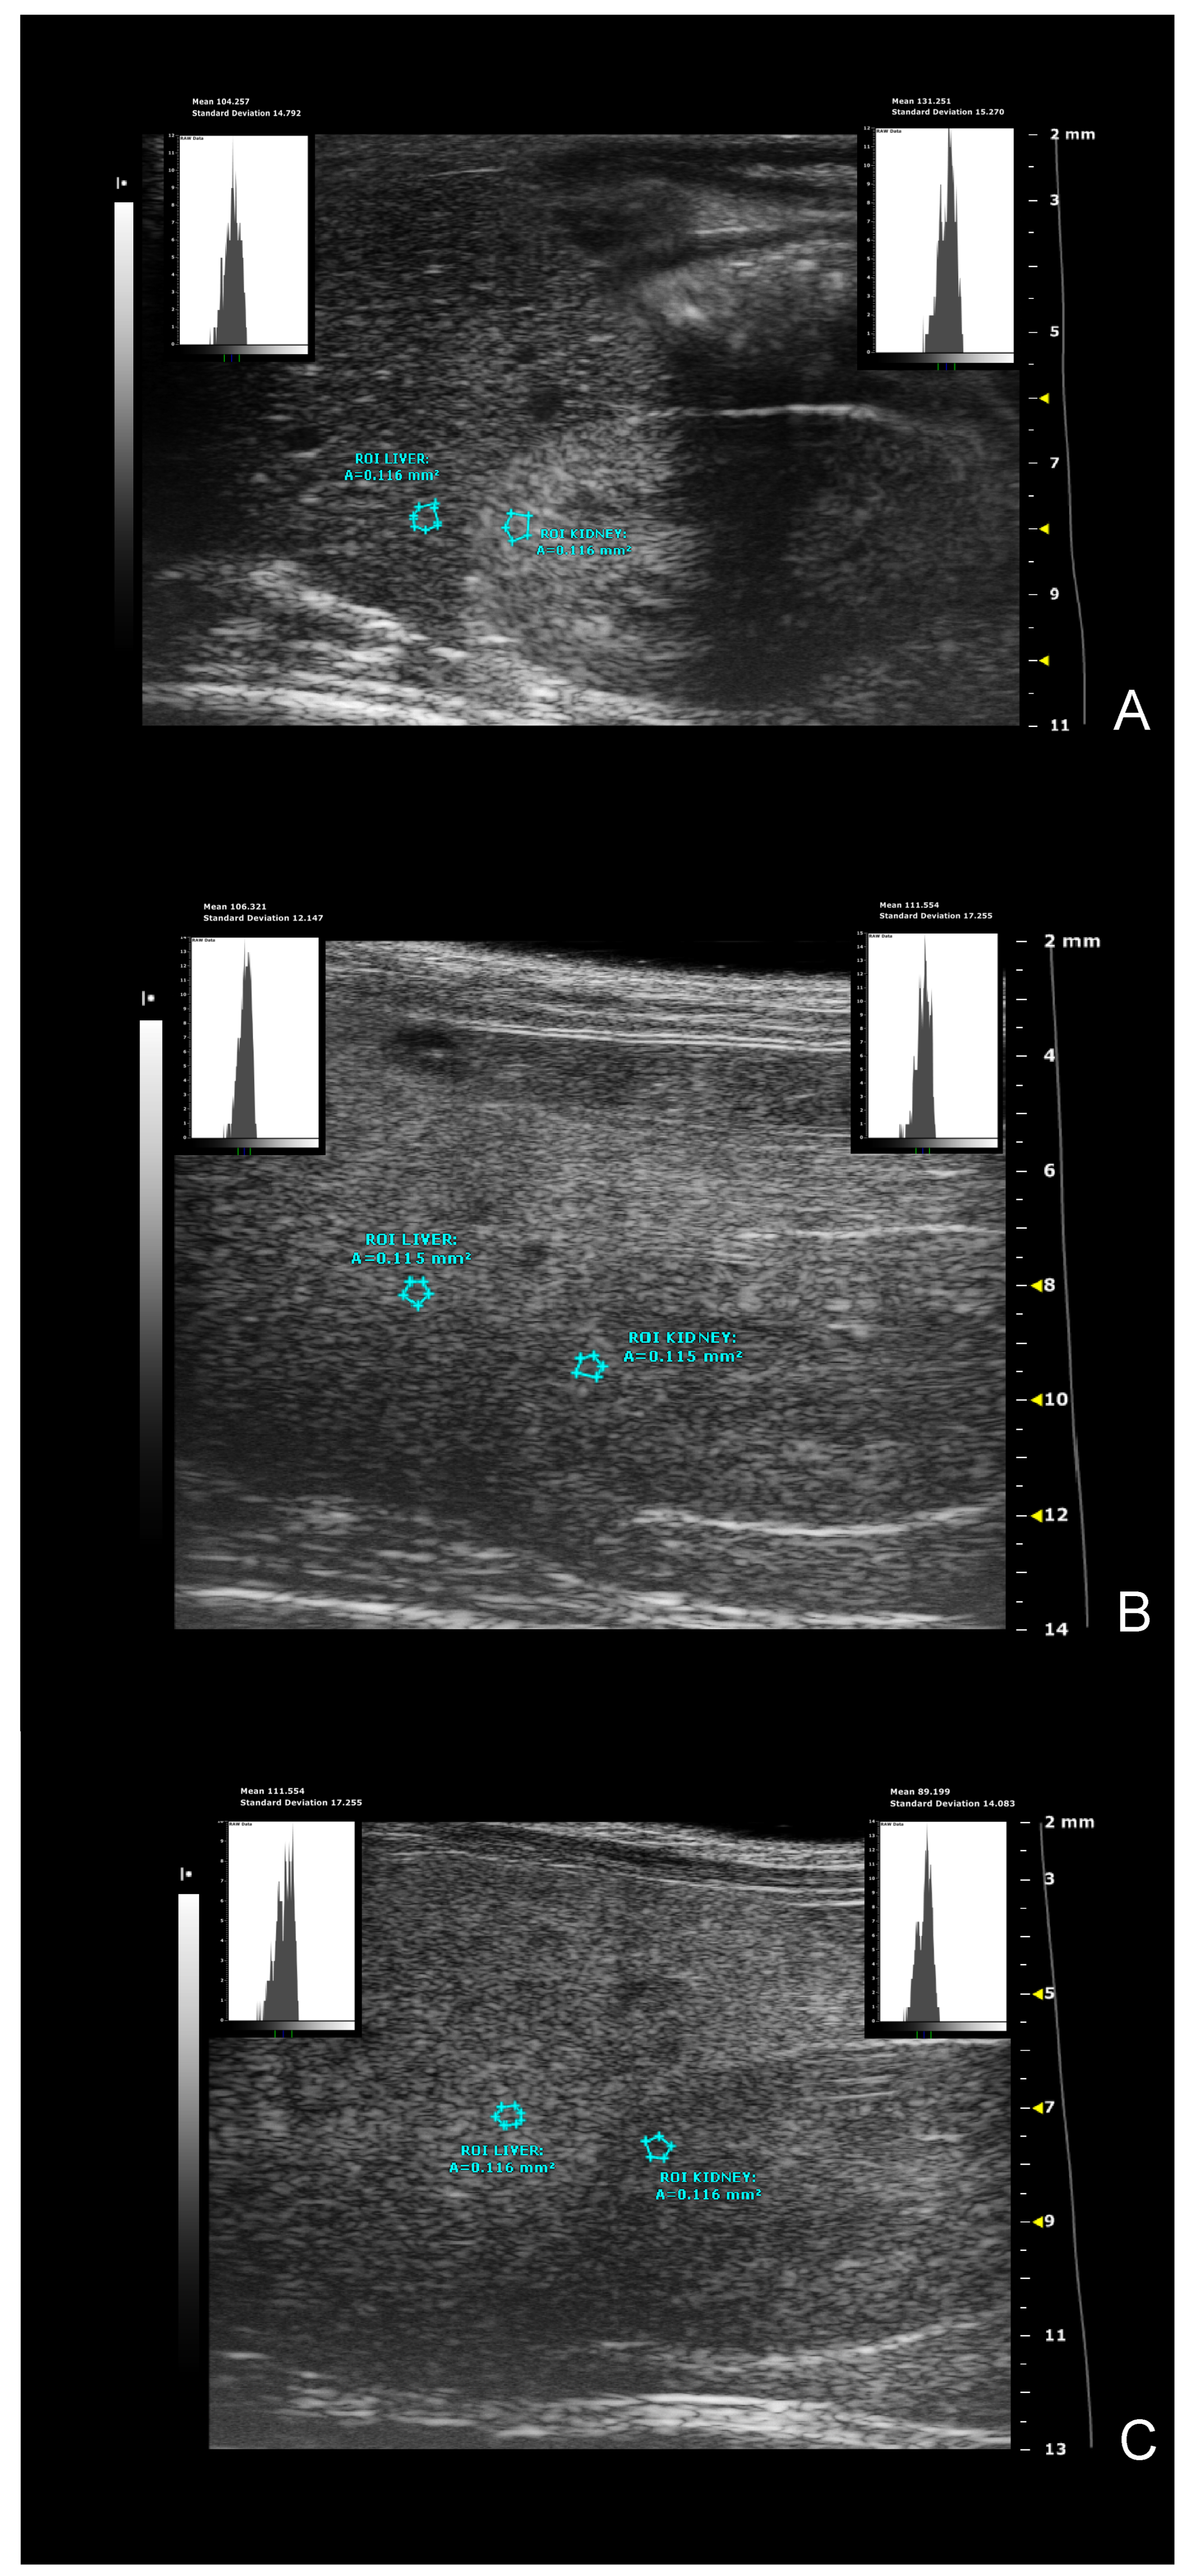
Figure 12.
Effects of diet on liver echogenicity. US measures of tissue brightness intensity [Figure 12A–F] and tissue brightness variance [Figure 12G–L]. Data were compared using repeated measures two-way ANOVA-Mixed effect model followed by Sidak’s multiple comparison post-hoc test between sex-matched groups.
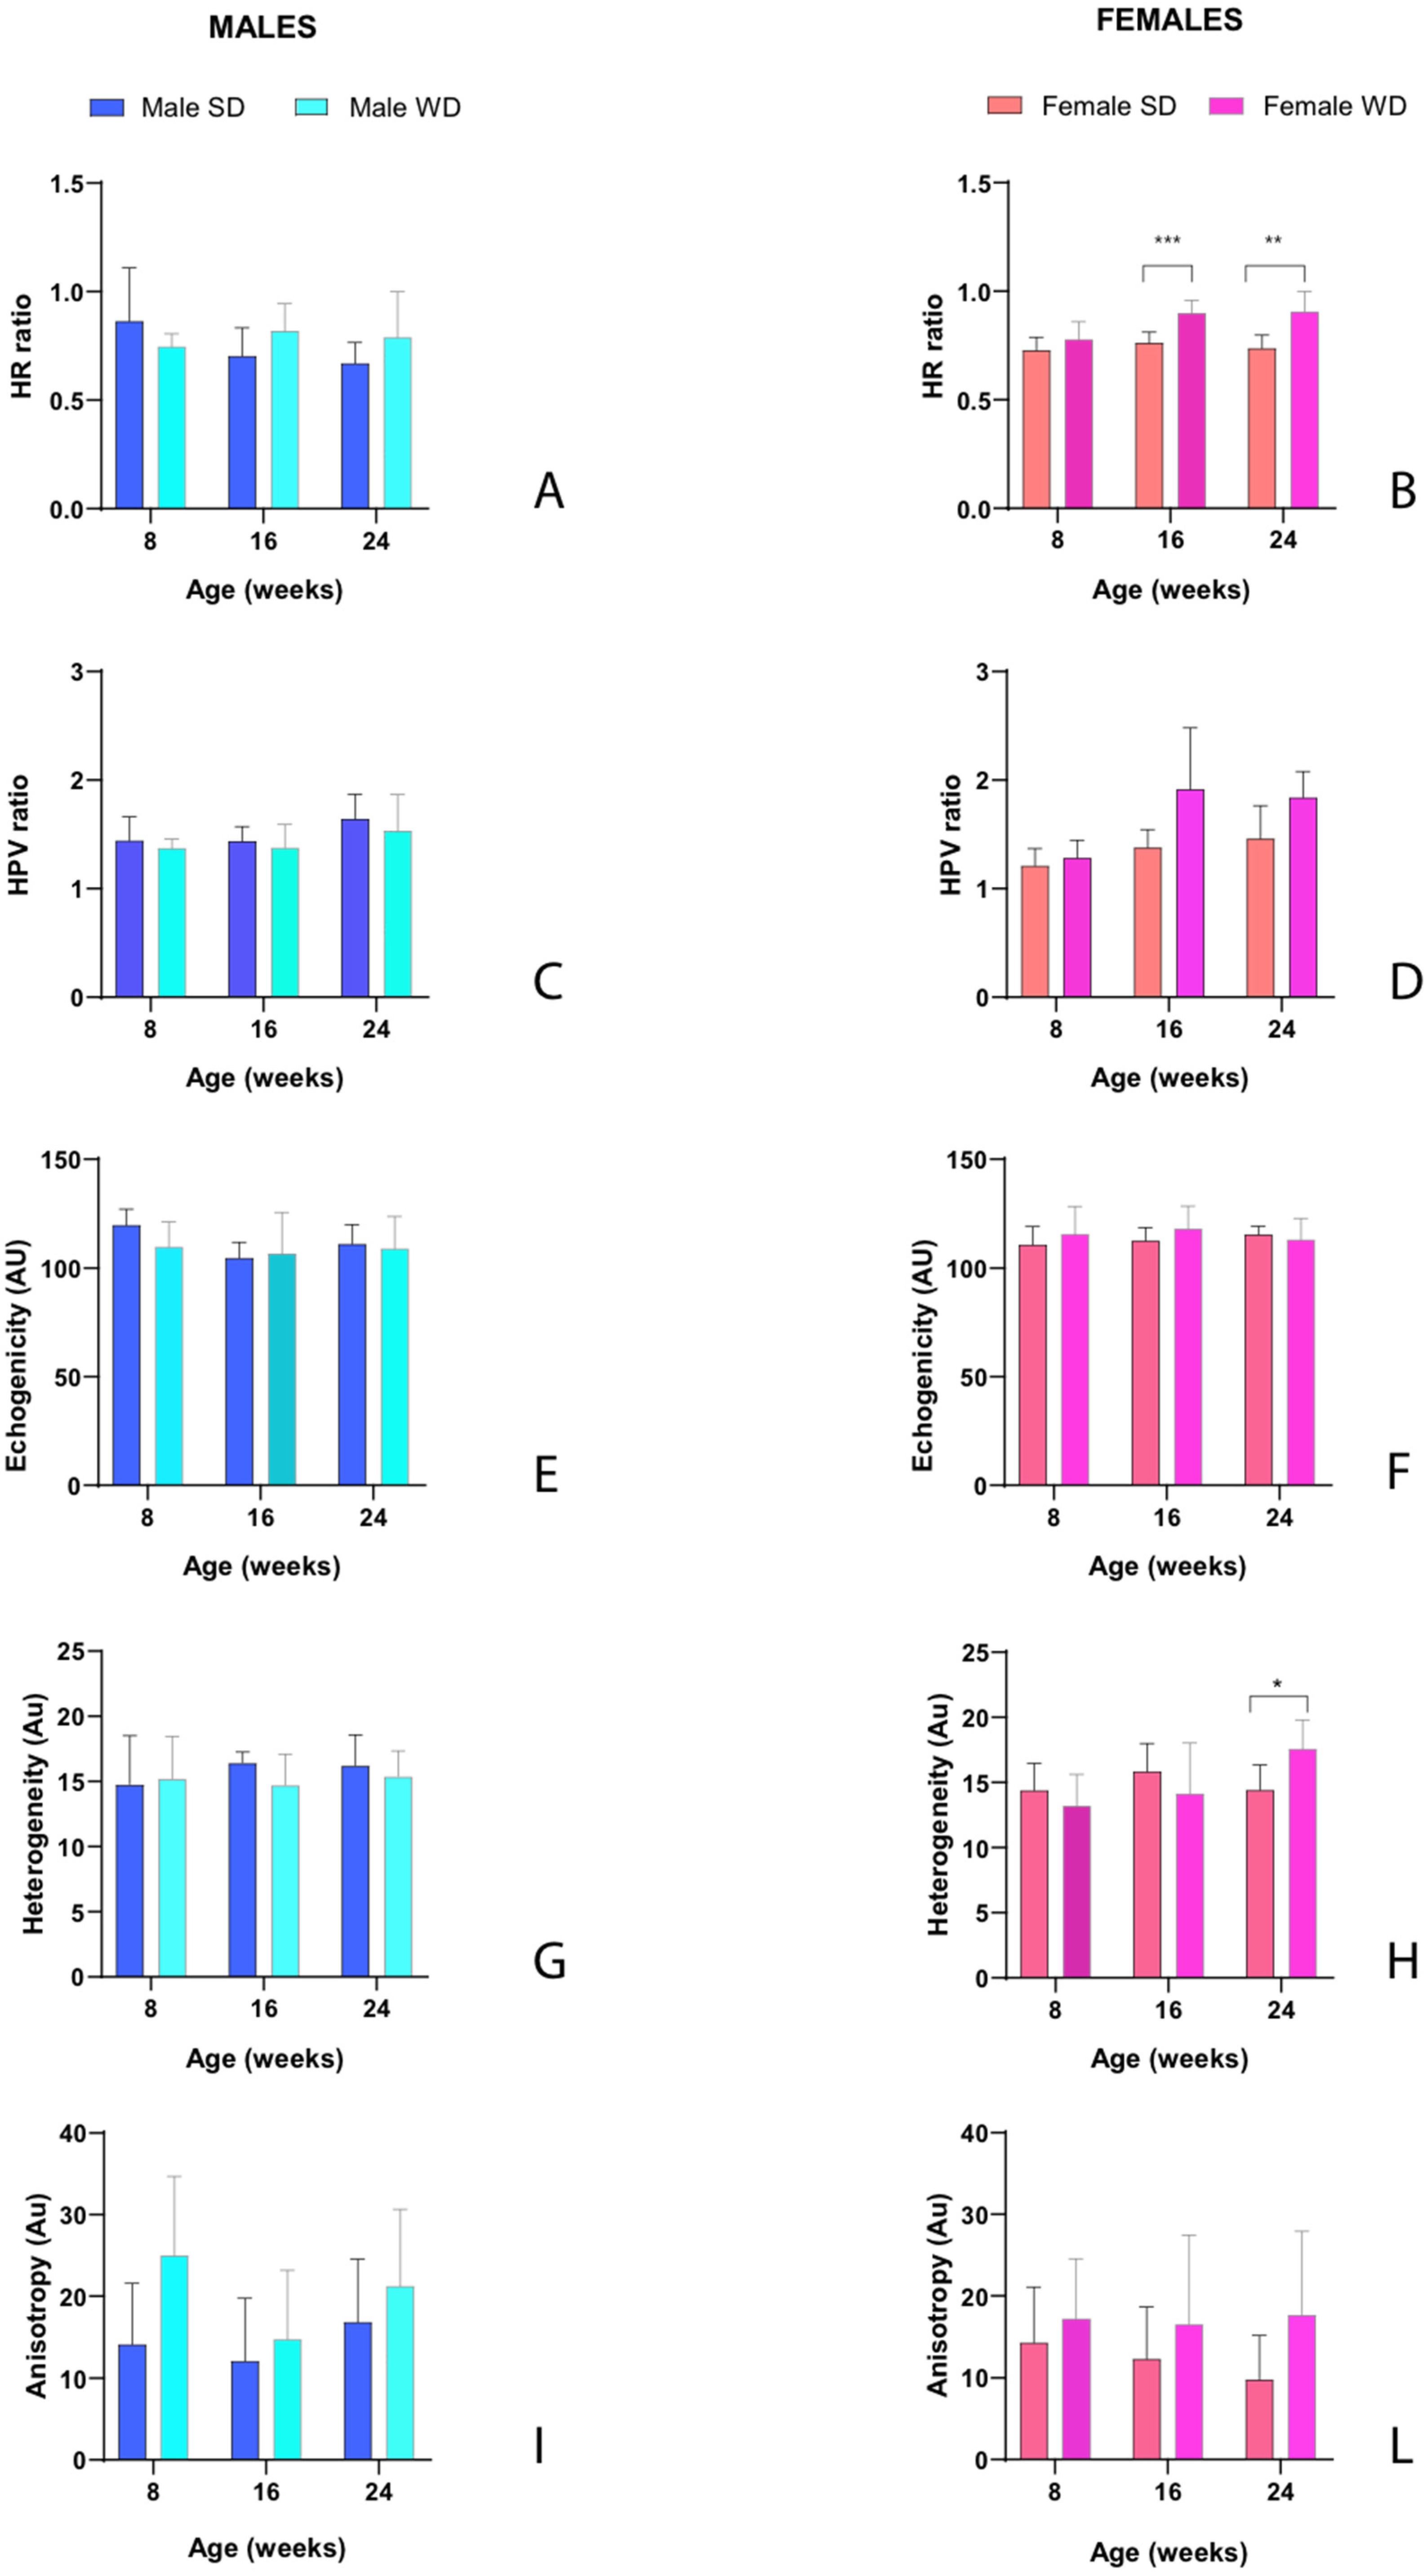
Figure 13.
Effects of diet on liver kidney vessels. US measures of portal vein diameter. Data were compared using repeated measures two-way ANOVA-Mixed effect model followed by Sidak’s multiple comparison post-hoc test.
Figure 13.
Effects of diet on liver kidney vessels. US measures of portal vein diameter. Data were compared using repeated measures two-way ANOVA-Mixed effect model followed by Sidak’s multiple comparison post-hoc test.
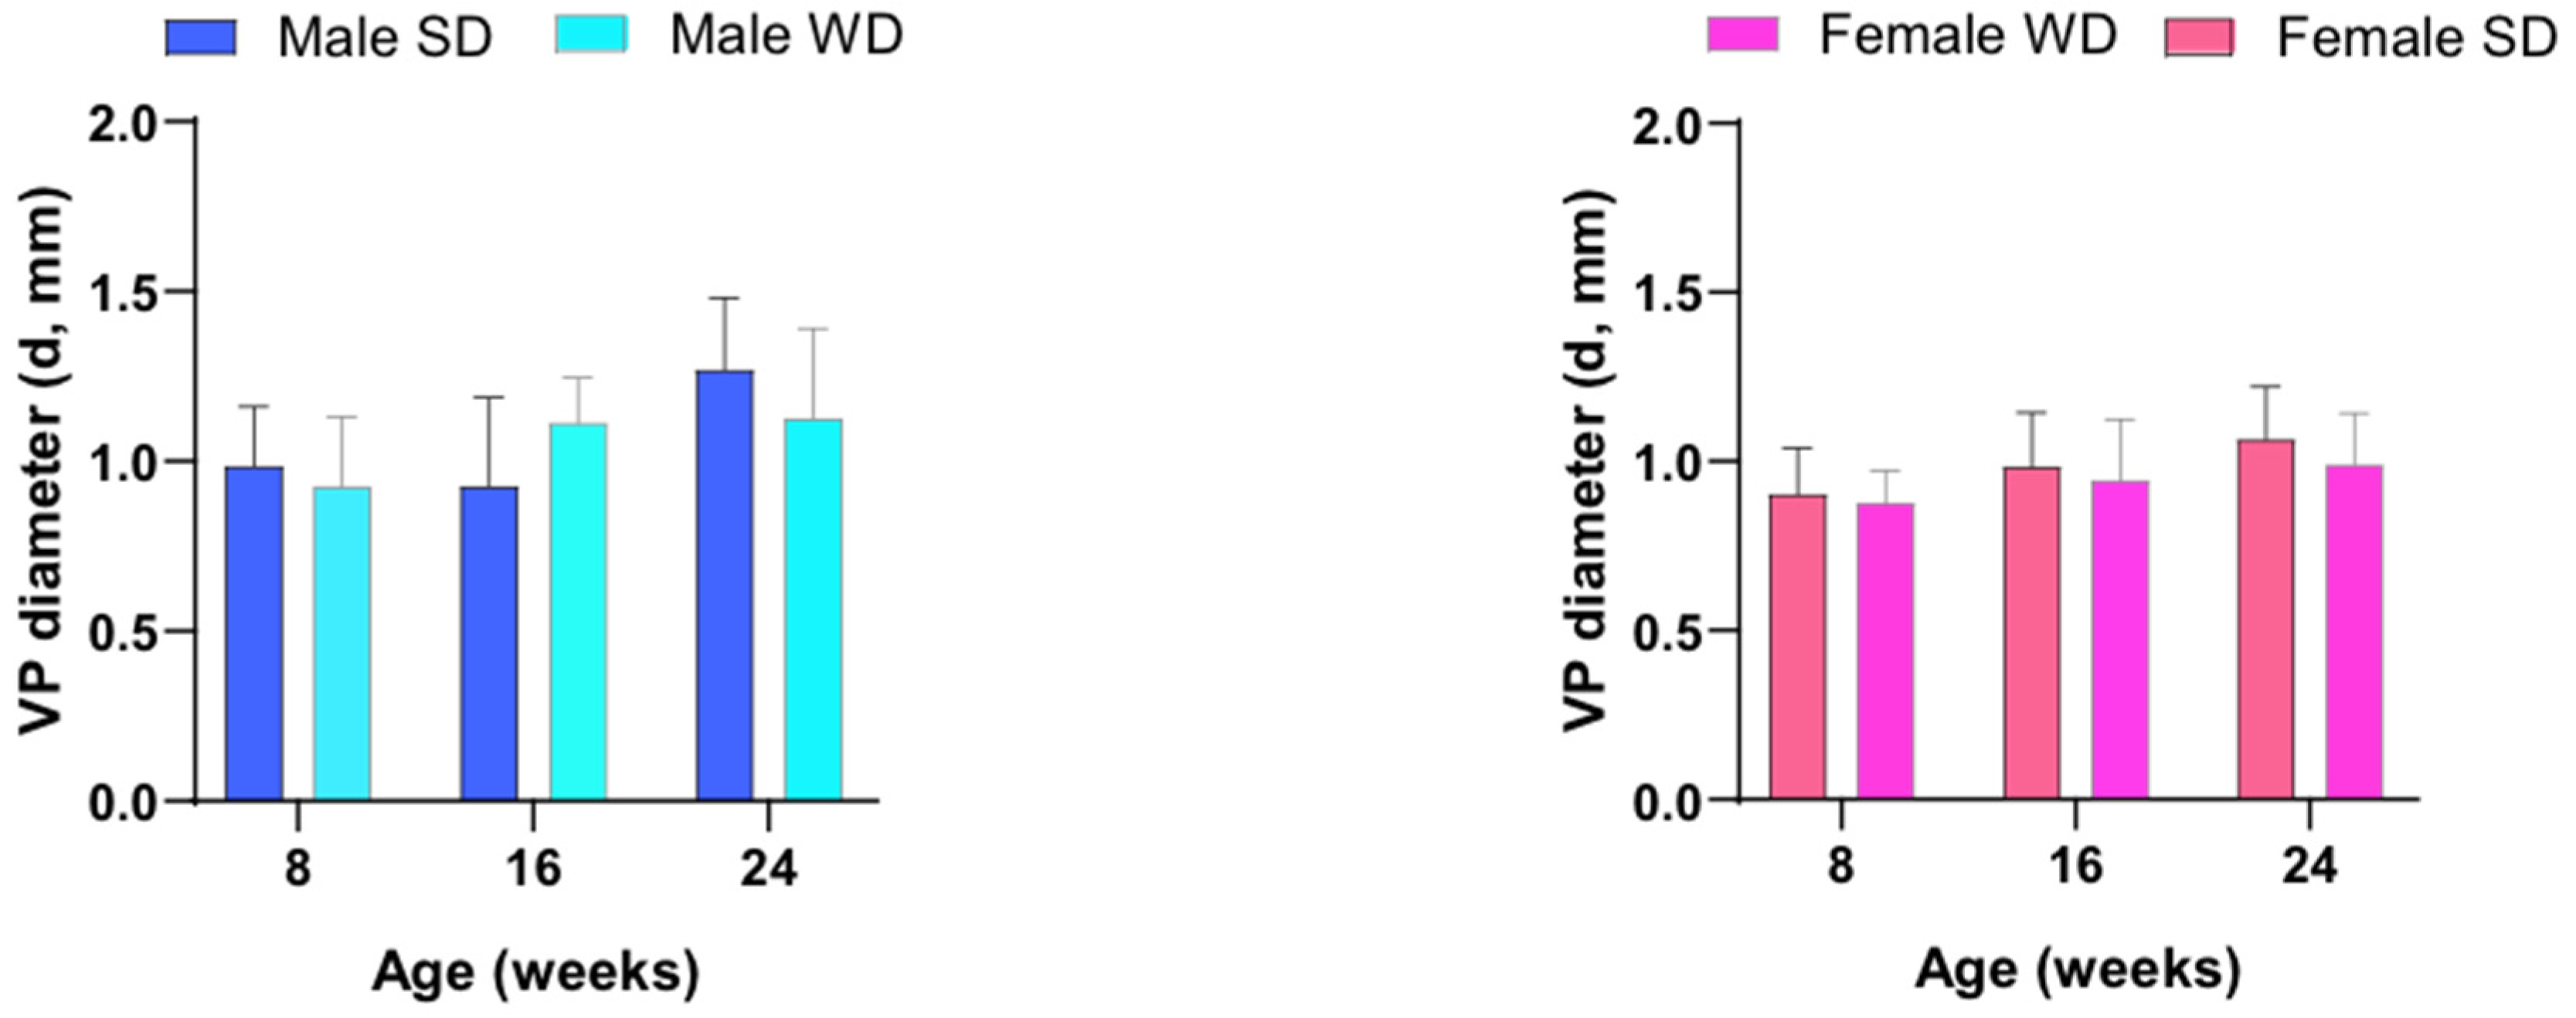
Figure 14.
PANEL (A): Representative ultrasound image of kidney performed using B mode for measurement of intrarenal flow from a male C57Bl/6J fed a Western type diet. Color Doppler overlay was used to locate the intrarenal arteries. Pulse-wave Doppler mode shows the typical peak systolic velocity (PSV) and the end diastolic velocity (EDV) in renal arteries. PANEL (B): Morphofunctional analysis of diet effects on kidney. CRT/BW at 24 weeks of age and changes in tissue brightness intensity over time were measured. PI and RI were calculated from the spectral data. Data were compared using repeated measures two-way ANOVA-Mixed effect model followed by Sidak’s multiple comparison post-hoc test or Mann-Whitney test between sex-matched groups. PANEL (C): representative histological images of kidney in 24-weeks-old female mice (PAS, 400×, scale bar 20µm), showing a normal glomerulus in SD-fed group (left) and altered glomerulus in WD-fed group (right).
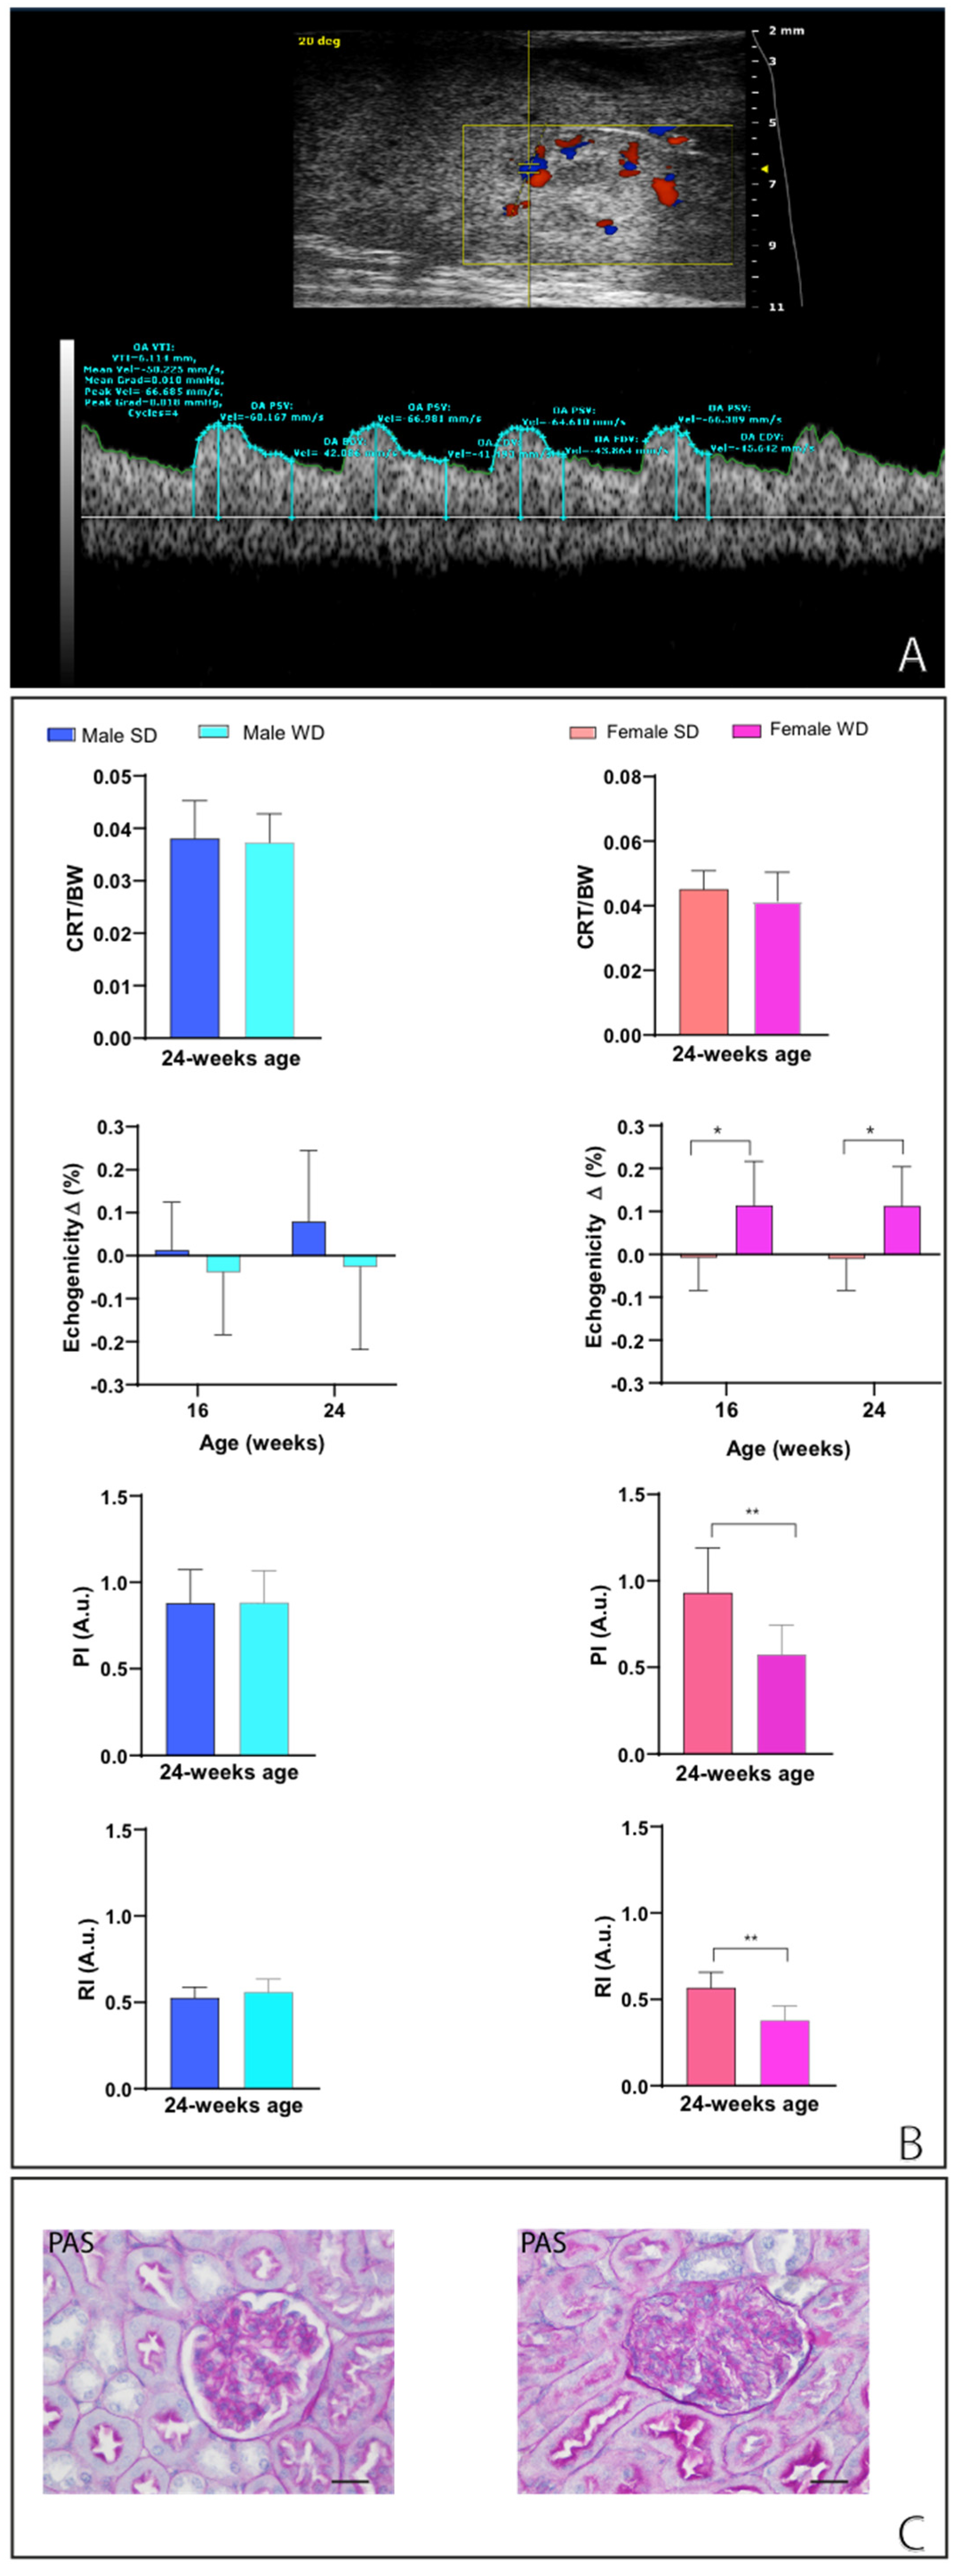

Table 1.
Descriptive statistics (mean ± SD) for male and female WT mice - Echocardiographic morphometric and functional analysis over the time in experimental groups: effects of WTD on cardiac remodeling and left ventricular (LV) contractility indexes overtime (8, 16 and 24 weeks of age). Abbreviations: d= diastole; s= systole; IVS/LVAW: interventricular septum/left ventricle anterior wall; LVPW: left ventricle posterior wall; LVID: left ventricle internal diameter; LV mass= left ventricle mass; LV vol= left ventricle volume; LV SV= left stroke volume; LV CO= left ventricle cardiac output; EF= left ventricle ejection fraction; FS= left ventricle fractional shortening; RWT= relative wall thickness. IVS/LVAW, LVID, LVPW are normalized for BW1/3; LV mass, LV vol, SV, CO are normalized for BW. Inferential statistical tests are described above in the text.
| Age (weeks) | Groups | IVS/LVAW; d (mm) |
IVS/LVAW; s (mm) |
LVID; d (mm) |
LVID; s (mm) |
LVPW;d (mm) | LVPW;s (mm) | LV mass corr (mg) | LV vol; d (uL) |
LV vol; s (uL) | LV SV (uL) | HR (bpm) | LV CO (ml/min) | EF (%) | FS (%) | RWT |
|---|---|---|---|---|---|---|---|---|---|---|---|---|---|---|---|---|
| 8 | ♂ SD | 0.126± 0.020 | 0.175± 0.028 | 0.461± 0.037 | 0.333± 0.036 | 0.129± 0.027 | 0.175± 0.025 | 4.446± 0.755 | 2.277± 0.381 | 1.04± 0.279 | 1.234± 0.195 | 497.71±52.29 | 0.61± 0.13 | 54.67± 6.68 | 27.78± 4.17 | 0.557± 0.107 |
| ♂ WD | 0.095± 0.014 | 0.14± 0.023 | 0.48± 0.069 | 0.33± 0.054 | 0.104± 0.012 | 0.147± 0.021 | 3.42± 0.83 | 2.60± 0.83 | 1.03± 0.39 | 1.56± 0.61 | 499.2±25.45 | 0.77± 0.29 | 59.70± 10.01 | 31.49± 6.82 | 0.42± 0.08 | |
| 16 | ♂ SD | 0.112± 0.011 | 0.152± 0.017 | 0.347± 0.034 | 0.254± 0.018 | 0.123± 0.015 | 0.150± 0.023 | 4.19± 0.45 | 1.63± 0.32 | 0.75± 0.10 | 0.87± 0.35 | 484.28±42.14 | 0.43± 0.17 | 51.87± 13.26 | 26.34± 8.10 | 0.68± 0.12 |
| ♂ WD | 0.094± 0.015 | 0.14± 0.016 | 0.35± 0.060 | 0.23± 0.058 | 0.097± 0.015 | 0.130± 0.017 | 4.20± 1.13 | 2.15± 0.85 | 0.83± 0.46 | 1.32± 0.49 | 420.7±36.12 | 0.54± 0.16 | 63.04± 10.22 | 34.10± 7.21 | 0.54± 0.11 | |
| 24 | ♂ SD | 0.120± 0.013 | 0.159± 0.007 | 0.330± 0.035 | 0.23± 0.040 | 0.116± 0.017 | 0.146± 0.012 | 4.46± 0,69 | 1.57 ± 0.39 | 0.73± 0.30 | 0.84± 0.19 | 501.42±45.06 | 0.42± 0.10 | 54.41± 10.02 | 27.73± 6.36 | 0.73± 0.14 |
| ♂ WD | 0.092± 0.012 | 0.12± 0.019 | 0.32± 0.064 | 0.22± 0.076 | 0.088± 0.012 | 0.125± 0.034 | 3.75± 0.90 | 1.80± 0.71 | 0.86± 0.62 | 0.94± 0.24 | 500.8±46.25 | 0.47± 0.12 | 56.08± 17.84 | 30.23± 13.40 | 0.58± 0.12 | |
| 8 | ♀ SD | 0.141± 0.012 | 0.183± 0.028 | 0.541± 0.036 | 0.419± 0.057 | 0.137± 0.013 | 0.167± 0.025 | 4.44± 0.44 | 2.56± 0.40 | 1.39± 0.44 | 1.17± 0.47 | 498.5±38.58 | 0.58± 0.24 | 45.35± 15.57 | 22.52± 8.78 | 0.51± 0.055 |
| ♀ WD | 0.115± 0.021 | 0.173± 0.022 | 0.61± 0.084 | 0.43± 0.082 | 0.135± 0.017 | 0.190± 0.027 | 3.85± 0.92 | 3.06± 0.81 | 1.32± 0.55 | 1.73± 0.35 | 389.6±36.95 | 0.67± 0.14 | 57.77± 7.81 | 29.91± 5.39 | 0.41± 0.08 | |
| 16 | ♀ SD | 0.119± 0.015 | 0.176± 0.013 | 0.471± 0.032 |
0.31± 0.029 | 0.131± 0.014 | 0.182± 0.021 | 4.41± 0.52 | 2.36± 0.34 | 0.93± 0.17 | 1.43± 0.34 | 471.87±42.60 | 0.68± 0.18 | 60.20± 8.29 | 31,66± 5.75 | 0.53± 0.08 |
| ♀ WD | 0.126± 0.018 | 0.174± 0.029 | 0.447± 0.027 | 0.322± 0.051 | 0.146± 0.029 | 0.176± 0.028 | 4.31± 0.96 | 1.99± 0.38 | 0.92± 0.38 | 1.07± 0.14 | 362.12±75.27 | 0.39± 0.10 | 55.28± 11.57 | 28.32± 7.33 | 0.61± 0.12 | |
| 24 | ♀ SD | 0.139± 0.014 | 0.186± 0.017 | 0.38± 0.030 | 0.25± 0.019 | 0.144± 0.024 | 0.190± 0.008 | 4.52± 0.43 | 1.61± 0.32 | 0.59 ± 0.11 | 1.01± 0.39 | 486±31.88 | 0.49± 0.19 | 61.26± 12.42 | 32.50± 9.00 | 0.75± 0.15 |
| ♀ WD | 0.114± 0.023 | 0.168± 0.035 | 0.387± 0.024 | 0.267± 0.042 | 0.135± 0.040 | 0.180± 0.051 | 4.21± 1.03 | 1.77± 0.26 | 0.75± 0.31 | 0.72± 0.30 | 407.2±38.39 | 0,29± 0,12 | 59.11± 13.05 | 31.17± 9.02 | 0.64± 0.13# | |
Table 2.
US visual grading for male and female SD- vs WD-fed mice: effects of diet intervention on liver echostructure and echogenicity in sex- and age-matched SD- vs WD-fed mice overtime (8, 16 and 24 weeks of age).
Table 2.
US visual grading for male and female SD- vs WD-fed mice: effects of diet intervention on liver echostructure and echogenicity in sex- and age-matched SD- vs WD-fed mice overtime (8, 16 and 24 weeks of age).
| US findings/Time of experiment | SD ♂ mice | WD ♂ mice | ||||
| 8 weeks (n=7) |
16 weeks (n=7) |
24 weeks (n=7) |
8 weeks (n=8) |
16 weeks (n=8) |
24 weeks (n=8) |
|
| Homogeneous liver parenchyma of medium level echogenicity | 7 | 7 | 6 | 8 | 0 | 0 |
| Diffusely increased parenchymal echogenicity | 0 | 0 | 1 | 0 | 8 | 1 |
| Discrete coarsened and heterogeneous parenchyma | 0 | 0 | 0 | 0 | 0 | 6 |
| Extensive coarsened and heterogeneous parenchyma | 0 | 0 | 0 | 0 | 0 | 1 |
| L-Echo<R-Echo | 7 | 7 | 7 | 8 | 7 | 1 |
| L-Echo=R-Echo | 0 | 0 | 0 | 0 | 1 | 5 |
| L-Echo>R-Echo | 0 | 0 | 0 | 0 | 0 | 2 |
| Presence of Ascites | 0 | 0 | 0 | 0 | 0 | 0 |
| SD ♀ mice | WD ♀ mice | |||||
| 8 weeks (n=8) |
16 weeks (n=8) |
24 weeks (n=8) |
8 weeks (n=8) |
16 weeks (n=8) |
24 weeks (n=8) |
|
| Homogeneous liver parenchyma of medium level echogenicity (pattern 1) | 8 | 8 | 8 | 8 | 0 | 0 |
| Diffusely increased parenchymal echogenicity (pattern 2) | 0 | 0 | 0 | 0 | 8 | 5 |
| Discrete coarsened and heterogeneous parenchyma (pattern 3) | 0 | 0 | 0 | 0 | 0 | 3 |
| Extensive coarsened and heterogeneous parenchyma (pattern 4) | 0 | 0 | 0 | 0 | 0 | 0 |
| L-Echo<R-Echo | 8 | 8 | 8 | 8 | 7 | 2 |
| L-Echo=R-Echo | 0 | 0 | 0 | 0 | 1 | 6 |
| L-Echo>R-Echo | 0 | 0 | 0 | 0 | 0 | 0 |
| Presence of Ascites | 0 | 0 | 0 | 0 | 0 | 0 |
Table 3.
Histological characteristics of murine liver samples per score grading category.
| Histological features scoring system | |||||||||||||||||
|---|---|---|---|---|---|---|---|---|---|---|---|---|---|---|---|---|---|
| SAF score grading: percentage of the total area affected | NAFLD score grading: percentage of the total area affected | Fibrosis score grading: qualitative/semiquantitative visual evaluation | |||||||||||||||
| 0 | 1 | 2 | 0 | 1 | 2 | 3 | 4 | 5 | 6 | 7 | 8 | 9 | absent | mild | moderate | severe | |
| SD♂ mice (n=7) | 2 | 4 | 1 | 7 | 0 | 0 | 0 | 0 | 0 | 0 | 0 | 0 | 0 | 7 | 0 | 0 | 0 |
| WD♂ mice(n=8) | 0 | 0 | 8 | 3 | 1 | 1 | 3 | 0 | 0 | 0 | 0 | 0 | 0 | 4 | 4 | 0 | 0 |
| SD♀ mice (n=8) | 0 | 8 | 0 | 8 | 0 | 0 | 0 | 0 | 0 | 0 | 0 | 0 | 0 | 8 | 0 | 0 | 0 |
| WD♀ mice (n=8) | 0 | 0 | 8 | 1 | 2 | 2 | 3 | 0 | 0 | 0 | 0 | 0 | 0 | 6 | 2 | 0 | 0 |
Table 4.
Histological characteristics of murine kidney samples per score grading category. * missing data.
Table 4.
Histological characteristics of murine kidney samples per score grading category. * missing data.
| Histological features scoring system | |||||||||||||||
|---|---|---|---|---|---|---|---|---|---|---|---|---|---|---|---|
| Renal score grading: percentage of the glomeruli altered | Bowman’s capsule and space score grading: percentage of the glomeruli with narrowed/collapsed Bowman’s space | ||||||||||||||
| 0 (<30%) |
1 (30-70%) |
2 (>70%) |
0% | 1-5% | 6-10% | 11-15% | 19-20% | 21-25% | 26-30% | 31-40% | 41-50% | 51-60% | 61-70% | >70% | |
| SD♂ mice (n=7) | 7 | 0 | 0 | 1 | 3 | 2 | 1 | 0 | 0 | 0 | 0 | 0 | 0 | 0 | 0 |
| WD♂ mice(n=7)* | 1 | 3 | 3 | 0 | 0 | 0 | 0 | 0 | 1 | 0 | 2 | 1 | 0 | 0 | 3 |
| SD♀ mice (n=8) | 8 | 0 | 0 | 1 | 2 | 1 | 4 | 0 | 0 | 0 | 0 | 0 | 3 | 0 | 0 |
| WD♀ mice (n=7)* | 0 | 6 | 1 | 0 | 0 | 0 | 0 | 0 | 0 | 0 | 1 | 1 | 3 | 1 | 1 |
Disclaimer/Publisher’s Note: The statements, opinions and data contained in all publications are solely those of the individual author(s) and contributor(s) and not of MDPI and/or the editor(s). MDPI and/or the editor(s) disclaim responsibility for any injury to people or property resulting from any ideas, methods, instructions or products referred to in the content. |
© 2024 by the authors. Licensee MDPI, Basel, Switzerland. This article is an open access article distributed under the terms and conditions of the Creative Commons Attribution (CC BY) license (https://creativecommons.org/licenses/by/4.0/).
Copyright: This open access article is published under a Creative Commons CC BY 4.0 license, which permit the free download, distribution, and reuse, provided that the author and preprint are cited in any reuse.


