
Submitted:
07 March 2025
Posted:
10 March 2025
You are already at the latest version
Abstract
Background: Metabolic dysfunction-associated steatotic liver disease (MASLD) is a prevalent disease influenced by dietary factors. While high sugar and fat consumption are associated with weight gain, their specific impact on liver fat accumulation remains unclear. This study aimed to evaluate the relationship between sugar and saturated fat intake with liver and body fat composition.
Methods: A cross-sectional study was conducted from September 2021 to February 2023 in workers from a tertiary care center in Mexico City. Anthropometric measurements, body composition (bioelectrical impedance analysis and skinfold assessment), and liver fat (vibration-controlled transient elastography) were measured. Dietary intake was assessed with a 24-hour recall questionnaire and analyzed with specialized software. Linear and logistic regression models were fitted to study the relationship between nutrient intake and liver/body fat.
Results: A total of 534 healthcare workers (median age: 41.5 years, 61.4% female) were included. Hepatic steatosis was present in 42.5% of participants. Higher carbohydrate intake was associated with increased liver fat (β=0.23, 95% CI: 0.02-0.45), with each additional 15g of carbohydrates increasing the risk of steatosis by 5% (OR=1.053, 95% CI: 1.006-1.102). Fat and sugar intake were associated with higher body fat but not liver fat.
Conclusion: Carbohydrate intake was linked to liver fat accumulation, whereas fat and sugar intake were primarily associated with body fat. Tailored dietary recommendations could be informed by these findings. Prospective dietary assessment methods and a nutritional geometry approach could be applied in future studies.
Keywords:
liver steatosis
; body fat distribution
; nutrient intakes
; saturated fatty acids
; dietary sugars
1. Introduction
Nonalcoholic fatty liver disease (NAFLD), now termed metabolic dysfunction-associated steatotic liver disease (MASLD), is a common global health problem affecting 25-35% of the population on average [1]. It has been described that diet and sedentary lifestyle influence the development of the disease, with diets high in sugars and fats being important risk factors [2,3,4,5,6,7,8,9,10].
The high consumption of energy-dense foods, especially sugars and fats, is associated with body weight gain. In a systematic review of longitudinal studies in adolescents and early adulthood, a fast food diet pattern led to an excess odds of 23% (OR=1.23; 1.02-1.49) of annual BMI gain of 0.08 kg/m2 [11]. On the contrary, the consumption of dietary fiber in compliance with current recommendations (10-13 g/1000 kcals) [12] was associated with an avoidance of 0.44 kg/m2 BMI gain. So far, it has not been defined whether the type of sugars or fats influences the deposition of fat in different body segments. Thus, the mechanisms by which body fat contributes to the development of metabolic liver disease is not established, although one study found that abdominal fat deposition is associated with greater metabolic imbalance [13]. The objective of this study was to study the relationship between sugar and saturated fat consumption with liver and body fat.
2. Methods
Analytical cross-sectional study conducted from September 2021 to February 2023 in the outpatient clinic of the Department of Gastroenterology, Salvador Zubirán National Institute of Medical Sciences and Nutrition, a tertiary care center in Mexico City.
2.1. Population
Institutional staff were invited through an internal call. Eligible participants were adults over 18 years of both sexes without a previous diagnosis of fatty liver disease or alcohol use disorder. Respondents were scheduled for an intake interview where informed consent for participation in the study was obtained. Non-inclusion criteria were a diagnosis of cancer, heart disease, liver cirrhosis, hyperthyroidism, hypothyroidism, autoimmune diseases, bariatric or cosmetic surgery, metal prostheses, kidney failure, motor disability, amputations of limbs, use of medications that modify body composition (steroids, antipsychotics, antidepressants), and an alcohol consumption above 20 and 30 grams per day for women and men, respectively [14]. Incomplete anthropometric assessments or vibration-controlled elastography were excluded from main analyses, but authorized 24-hour reminders from all participants were included.
2.2. Demographic, Clinical, and Biochemical Data
A questionnaire was applied to obtain the demographic characteristics of the study population. Self-reported questions enquired about comorbidities: diabetes mellitus, arterial hypertension, acute myocardial infarction, rheumatoid arthritis, dyslipidemia, hypothyroidism, insulin resistance, and tobacco use. Anthropometric measurements were obtained with a SECA model 274 stadiometer (Germany) for height (precision ±2 mm), and a scale with bioelectrical impedance (mBCA514), for weight (±100 g). Body mass index (BMI) was calculated as the ratio of kg and squared meters (kg/m2) and categorized into universal BMI classes (<16.5, severely underweight; 16.5-18.5 underweight; 18.5-24.9 normal weight; 25-29.9, overweight; 30–34.9, class I obesity; 35-39.9, class II; and >40, class II obesity) [15]. All participants had blood samples taken for blood cytometry, blood chemistry, liver enzymes, lipid profile, C-reactive protein (CRP), and insulin to calculate the homeostatic model to assess insulin resistance (HOMA-IR), which were analyzed with Beckman Coulter equipment (hematological DxH 1061 and series AU5800 for blood chemistry).
2.3. Body Composition Assessment
Multi-frequency bioelectrical impedance (BIA) analyses (11 frequencies) were performed using the SECA mBCA514 equipment. The data obtained from the BIA were: total fat mass in kg and percentage, and visceral fat in liters (L).
All measurements were made with the anthropometric method validated by the International Society for the Advancement of Kinathropometry and with standardized personnel using the Habitch technique. A Slim Guide caliper was used or body fold measurements (bicipital, tricipital, suprailiac and subscapular skinfold) and a Lufkin metal tape model W606PM for arm and waist circumferences. Body fat percentage was estimated from the sum of the skinfolds with the Durnin and Womersley formula [16].
2.4. Liver Fat Assessment
The degree of steatosis and liver fibrosis was assessed by vibration-controlled transient elastography (Fibroscan® 502; Echosens, Paris, France) performed by trained physicians. The cut-off point used to determine steatosis was a controlled attenuation parameter (TAP) >275 dB/m [17] in accordance with European guidelines. Fasting of at least 3 hours was requested before measurements. Assessments that had 10 valid measurements and an IQR/med ≤30% were included.
2.5. Dietary Assessment
A 24-hour multi-step reminder (supplementary material 1) was used for dietary assessment. The analysis of the main nutrients, their types, and micronutrients was carried out with the Food Processor software v11.11. The analysis included quantification in grams of total sugars, added sugars, fructose and saturated fats, in addition to other types of nutrients. In total, 17 types of sugars, 5 types of fats, and total protein were quantified without distinction of their origin. It was estimated in terms of the amount of Kcal they represented for each nutrient, and as a percentage of average total energy. The 31 micronutrients were expressed per day in the corresponding and universal dietary unit of measurement.
2.6. Sample Size
The sample size was calculated as the difference between two proportions, considering an overall prevalence of fatty liver of 25.2% [18] and an effect size of 11% associated with the consumption of sugary drinks on liver fat [10]. For this calculation, a confidence level of 95% and a statistical power of 80% were assumed. The minimum sample size needed to detect significant differences was 550 subjects. Calculations were performed using G*Power software, version 3.1.9.7.
2.7. Statistical Analysis
Descriptive data are presented as median and interquartile range (Q1-Q3) for quantitative variables and frequency and percentage for qualitative variables. The comparison of macro and micronutrient intake was made using the Mann-Whitney U test.
To determine the relationship between the intake of nutrients and liver and body fat (CAP, body mass index, body fat and waist circumference), different linear regression models were created for Kcal and each nutrient (carbohydrates, protein, fat, saturated fat, total sugars, added sugar and fructose, each one in grams and in percentage of energy). For each model the adjustment was made for age (quantitative), sex, BMI (quantitative), waist circumference (quantitative) and total Kcal (quantitative). The results were presented as the regression coefficient (β) with 95% confidence interval (95%CI). The variance inflation factor (VIF) was calculated to determine the presence of collinearity in the multivariable models, defined as a value greater than 10.
The three evaluation methods recommended in nutritional epidemiology were used to determine the degree of association (19) between Kcal, nutrient intake and hepatic steatosis (>275 dB/m): 1) degree of association between nutrient intake (quantitative) and hepatic steatosis; 2) nutrient intake distributed in quartiles, with quartile 1 as reference; and 3) the association between the total sugar consumption ≥10% (model 1) and saturated fat ≥7% (model 2) with hepatic steatosis. Both logistic regression models were adjusted for age (quantitative), sex, BMI (quantitative), waist circumference, and total kilocalories (quantitative).
The results of the models are presented as regression coefficient (β), standard error, Odds Ratio (OR), 95%CI of the OR and p-value. The assumptions of the models were evaluated by residual analysis. A value of p< 0.05 was considered as statistical significance. All analyses were performed using SPSS v21 software.
2.8. Ethical Procedures
Participants received and signed an informed consent form. In the event of not completing all evaluations, authorization was requested to include any completed evaluations according to the order of the studies. This study was approved by the institutional research ethics committee with registration number GAS-3794. The study was conducted under compliance with the Declaration of Helsinki, whilst maintaining anonymity, privacy and will of participants.
3. Results
A total to 583 eligible adults consented to participate in the study, of which 49 were not included for analysis as elastography was not available. Of the 534 participants, 61.4% (n=328) were female, and the median age was 41.5 (IQR: 29.0-52.0). The most frequently reported comorbidities were smoking (7.68%) and hypertension (3.98%); 30.7% (n=164) of the participants had normal weight (BMI 18-24.9), 41.9% (n=224) were overweight, 20.6% (n=110) were obese class 1, 4.9% were class 2 (n=26), and 0.9% (n=5) were class 3. A total of 493 participants had complete dietary analysis data. The flow of participants is depicted in Figure 1.
Figure 1.
Flowchart of the participants.
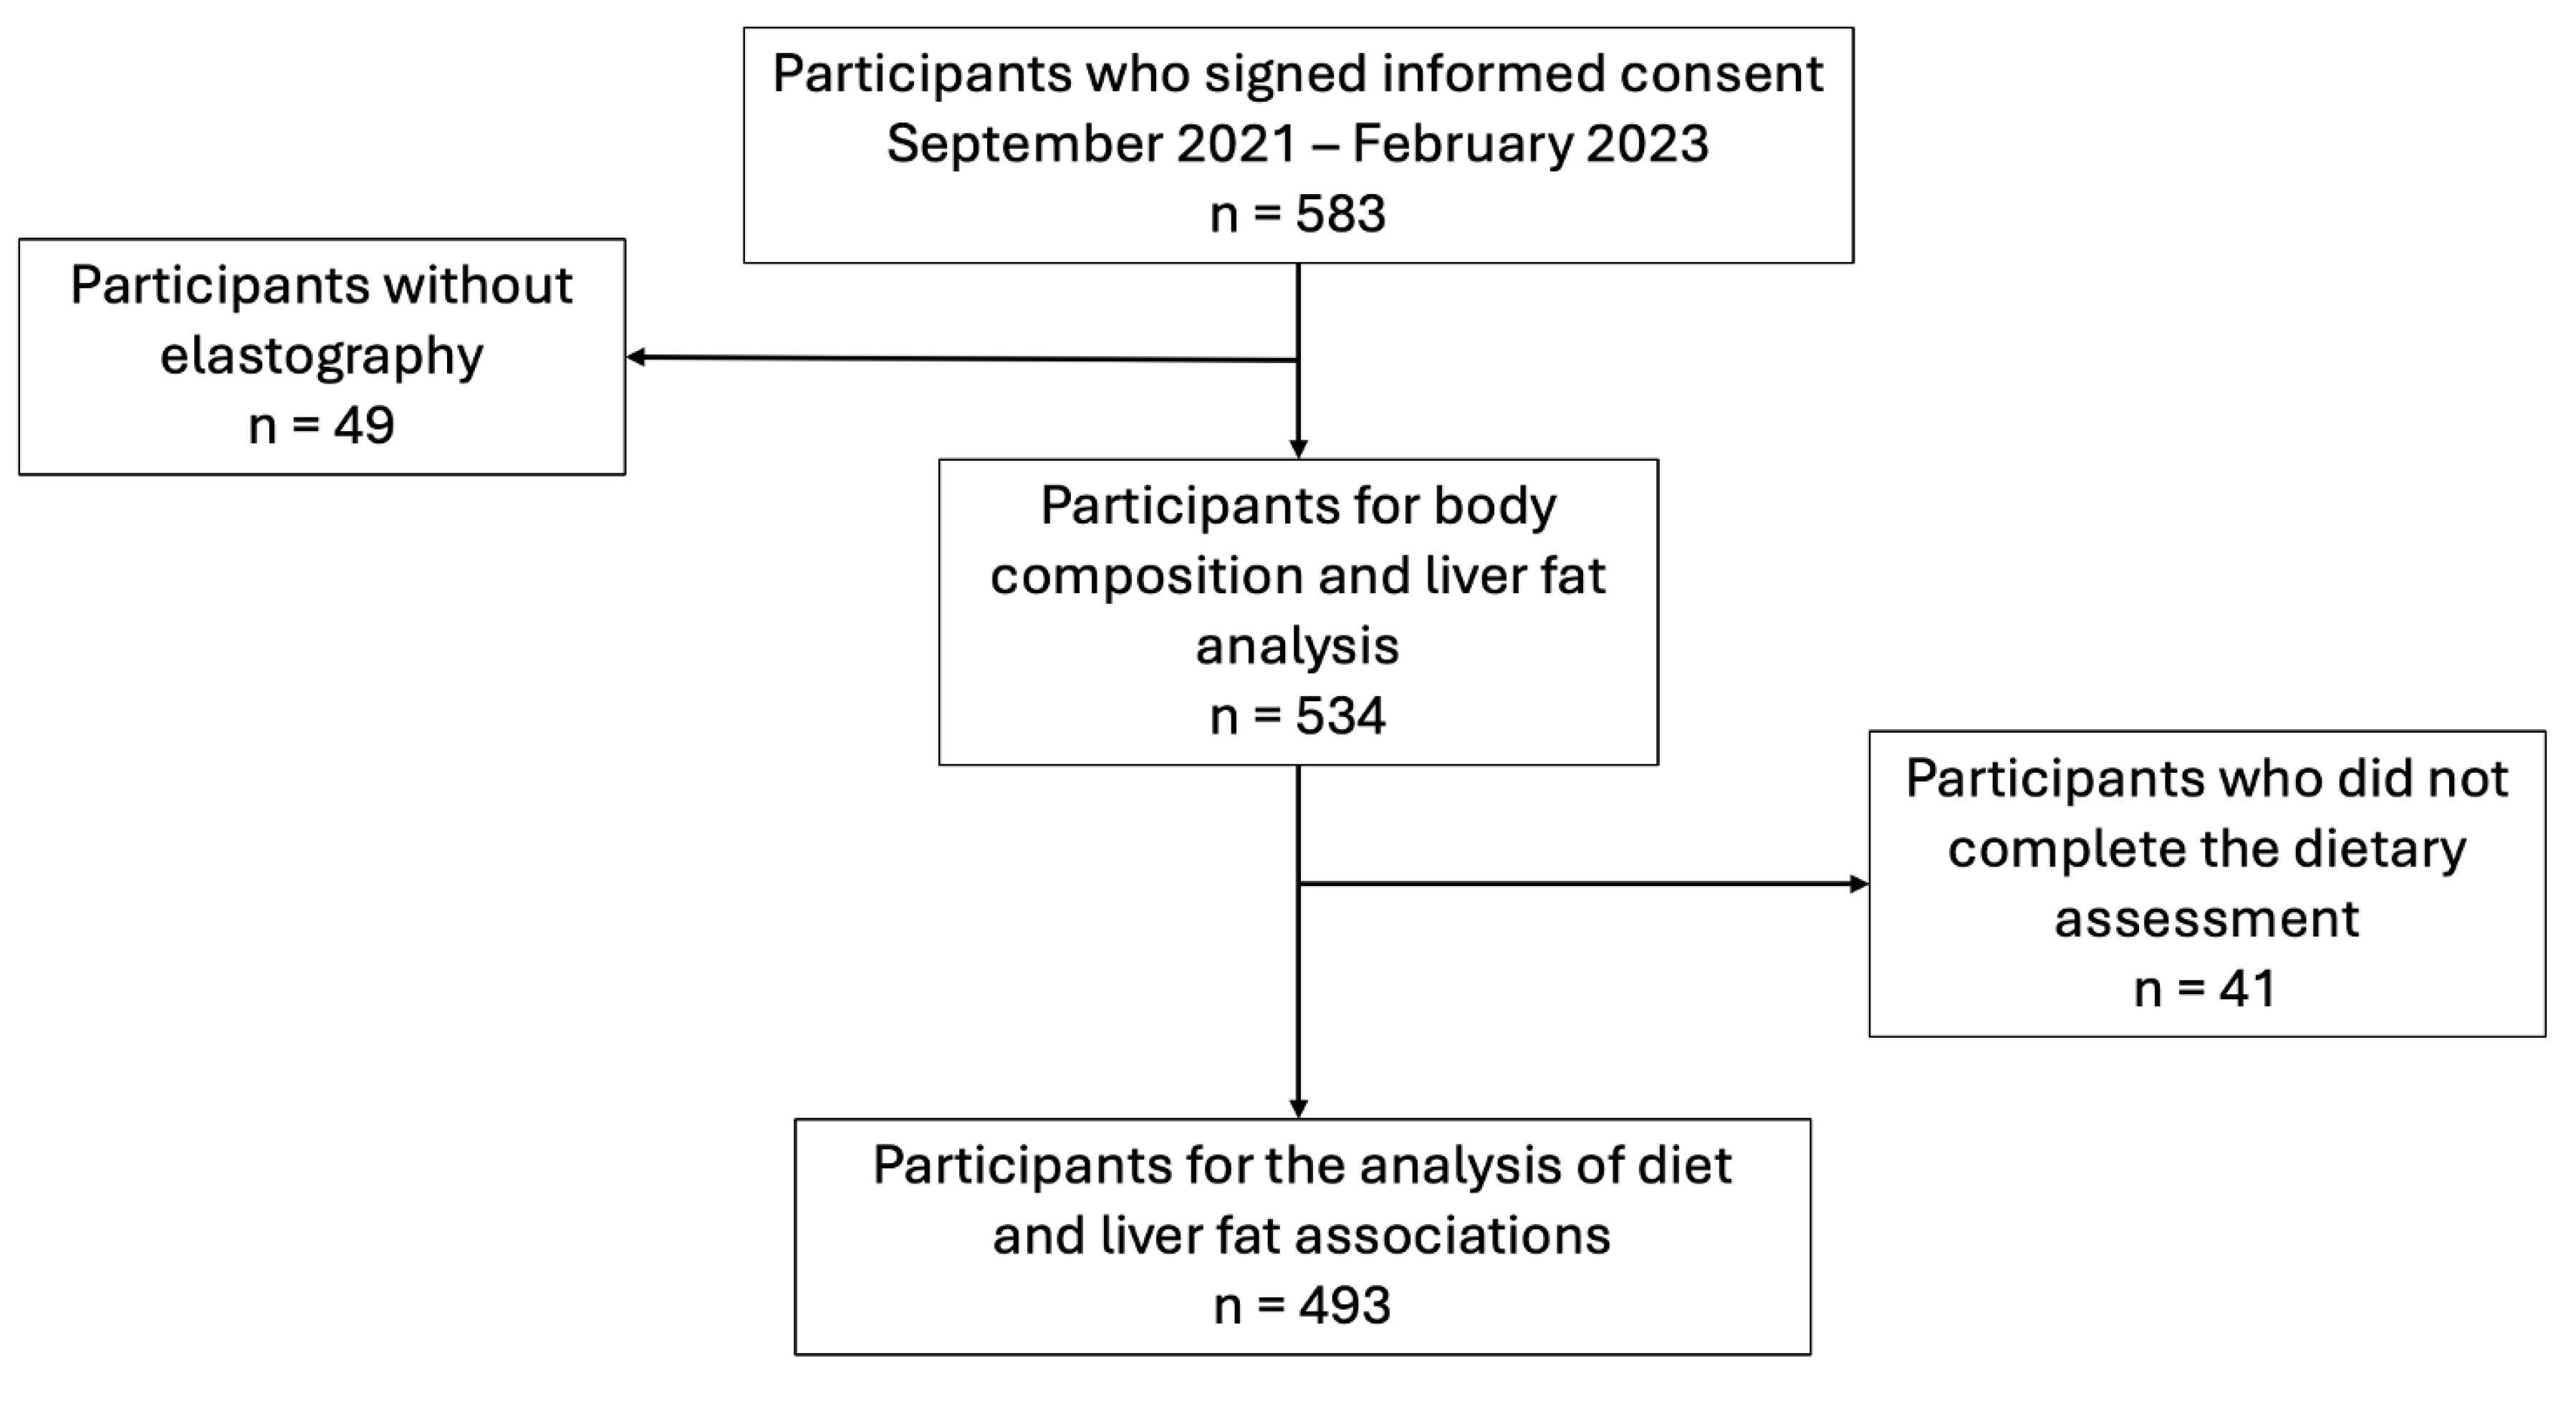
Table 1 presents demographic data, body composition, and results of the most relevant laboratory studies of people with and without hepatic steatosis. People with steatosis had older age and more metabolic alterations and anthropometric indices than those without steatosis. In both groups, the frequency of acute myocardial infarction and arthritis was low (≤ 1 case due to comorbidity, per group). There were no differences between groups in urea nitrogen, urea, non-HDL cholesterol, liver function tests, or blood count.

Table 1.
Clinical, body composition, and laboratory data among participants with and without hepatic steatosis.
Table 1.
Clinical, body composition, and laboratory data among participants with and without hepatic steatosis.
| Total Sample (n=534) |
No steatosis (n=307) |
With steatosis (n=227) |
|
| Age (years) | 41.5 (29.0-52.0) | 36.0 (27.0-51.0) | 45.0 (34.0-53.0) |
| Sex, n (%) | |||
| Women | 328 (61.4) | 199 (64.8) | 129 (56.8) |
| Smoking, n (%) | 41 (7.68) | 18 (5.86) | 23 (10.13) |
| Comorbidities, n (%) | |||
| Diabetes | 9 (1.69) | 3 (0.98) | 6 (2.64) |
| Hypertension | 21 (3.93) | 9 (2.93) | 12 (5.29) |
| Dyslipidemia | 3 (0.56) | 0 (0.00) | 3 (1.32) |
| Hypothyroidism | 9 (1.69) | 5 (1.63) | 4 (1.76) |
| Insulin resistance | 4 (0.75) | 1 (0.33) | 3 (1.32) |
| Body Composition | |||
| Weight (kg) | 70.5 (60.6-80.7) | 64.2 (56.7-74.5) | 77.8 (69.4-86.4) |
| BMI | 27.1 (23.8-30.3) | 25.1 (22.3-27.8) | 29.4 (27.1-32.8) |
| Fat mass (kg) | 25.1 (18.7-31.5) | 20.8 (15.5-27-4) | 29.6 (25.2-35.8) |
| Fat mass (%) | 35.6 (29.0-42.2) | 32.9 (26.2-38.7) | 39.7 (32.6-44.7) |
| Visceral fat (L) | 2.50 (1.80-3.50) | 2.00 (1.50-2.70) | 3.20 (2.48-4.20) |
| Waist circumference (m) | 0.89 (0.80-0.99) | 0.84 (0.76-0.92) | 0.96 (0.89-1.04) |
| Bicipital skinfold (mm) | 10.0 (7.0-14.0) | 8.0 (6.0-12.0) | 12.0 (9.0-17.0) |
| Triceps skinfold (mm) | 17.0 (12.0-22.0) | 15.0 (12.0-19.0) | 20.0 (14.0-25.0) |
| Subscapular skinfold (mm) | 23.0 (17.0-30.0) | 19.0 (15.0-25.0) | 28.0 (23.0-33.0) |
| Suprailiac skinfold (mm) | 24.0 (17.0-30.0) | 20.0 (15.0-27.0) | 28.0 (24.0-35.0) |
| Biochemical data | |||
| HOMA IR | 1.58 (1.04-2.62) | 1.25 (0.81-1.78) | 2.45 (1.55-3.85) |
| Glucose (mg/dL) | 89.0 (84.0-96.0) | 87.0 (82.0-92.0) | 93.0 (88.0-101.0) |
| Creatinine (mg/dL) | 0.76 (0.66-0.89) | 0.74 (0.66-0.87) | 0.77 (0.66-0.92) |
| Cholesterol (mg/dL) | 180.0 (155.0-206.0) | 177.0 (155.0-202.0) | 185.0 (156.0-217.0) |
| Low-density cholesterol (LDL-c; mg/dL) | 110.0 (89.0-129.0) | 105.0 (86.0-124.0) | 116.0 (92.5-134.5) |
| LDL-c, Martin’s method (mg/dL) | 107.0 (86.0-126.0) | 104.0 (83.0-122.0) | 112.0 (88.0-133.0) |
| High-density cholesterol (HDL-c; mg/dL) | 47.0 (40.0-56.0) | 50.0 (43.0-59.0) | 43.0 (37.0-51.0) |
| Triglycerides (mg/dL) | 124.0 (90.0-174.0) | 106.0 (79.0-142.0) | 163.0 (114.5-233.0) |
| Total bilirubin (mg/dL) | 0.64 (0.49-0.85) | 0.64 (0.49-0.85) | 0.63 (0.51-0.83) |
| Alanine aminotransferase (ALT; U/L) | 21.6 (15.4-32.2) | 18.1 (13.9-26.0) | 26.5 (18.0-40.7) |
| Aspartate aminotransferase (AST; U/L) | 19.6 (17.0-24.8) | 19.1 (16.9-23.7) | 21.4 (17.2-26.7) |
| Gammaglutamyl transferase (U/L) | 21.4 (15.1-35.3) | 17.9 (13.1-26.7) | 27.9 (19.1-42.6) |
| Alkaline phosphatase (U/L) | 74.0 (61.5-88.0) | 71.0 (58.0-85.0) | 78.0 (66.0-92.0) |
| Albumin (g/dL) | 4.42 (4.23-4.62) | 4.46 (4.25-4.64) | 4.38 (4.22-4.59) |
| Ultra-sensitive C-reactive protein (mg/dL) | 0.15 (0.08-0.31) | 0.13 (0.06-0.24) | 0.20 (0.11-0.41) |
| Insulin (μIU/mL) | 7.19 (4.95-11.38) | 5.72 (3.96-8.15) | 10.43 (6.91-16.02) |
| Platelets (103/μL) | 249.0 (213.0-289.5) | 251.0 (214.0-290.0) | 242.5 (211.0-287.2) |
Data presented as frequency and percentage (%) or as median and interquartile range (Q1-Q3).
The median CAP of the total sample was 263 dB/m (IQR: 211-304), while the median Kpa was 4.2 (IQR: 3.4-5.3). Of the 534 participants, 227 (42.5%, 95% CI: 38.3-46.7) had hepatic steatosis with a median CAP of 310 (IQR: 292-335) and Kpa 4.6 (IQR: 3.7-5.8). Of the 307 (57.5%) who did not have steatosis, the median CAP was 193 dB/m (IQR: 221-250) with Kpa of 3.3 (IQR: 4.0-4.8).
Table 2 presents the results of the comparisons of the intake of main nutrients and micronutrients between subjects with and without hepatic steatosis. Intake of energy, protein, total fat, and saturated fat was higher in people without hepatic steatosis. Although carbohydrate consumption was similar between both groups, monosaccharide consumption, particularly fructose, was higher in subjects without steatosis. An adjustment was made between the main nutrients by the kilocalories of consumption, thus obtaining the percentage of energy consumed in the form of each nutrient. It was observed that after this adjustment, there were no differences in consumption between the study groups. Regarding micronutrients, no differences were observed between those with and without hepatic steatosis.
Table 2.
Comparison of energy and nutrient intake between participants with and without fatty liver collected with 24-hour recall.
Table 2.
Comparison of energy and nutrient intake between participants with and without fatty liver collected with 24-hour recall.
| Total Sample (n=493) |
No steatosis (n=282) |
With steatosis (n=211) |
P value | |
| Kilocalories | 1278.6 (1021.5-1533.9) | 1326.2 (1050.7-1557.7) | 1188.7 (991.8-1499.0) | 0.009 |
| Nutrients | ||||
| Carbohydrates (gr) | 143.6 (67.5-211.7) | 145.1 (53.6-216.96) | 142.9 (78.0-208.5) | 0.959 |
| Protein (gr) | 55.2 (44.7-69.0) | 56.4 (46.5-70.5) | 53.1 (40.8-65.8) | 0.019 |
| Fat (gr) | 43.1 (30.6-75.2) | 45.2 (32.5-86.6) | 41.3 (28.8-62.3) | 0.008 |
| Kilocalories per carbohydrate | 574.5 (270.1-846.7) | 580.2 (214.4-867.8) | 571.7 (312.2-834.1) | 0.959 |
| Carbohydrates (%) | 53.7 (28.2-60.0) | 51.8 (13.6-60.0) | 55.4 (41.2-60.0) | 0.253 |
| Kilocalories from protein | 221.0 (179.0-276.2) | 225.9 (186.2-281.9) | 212.3 (163.5-263.4) | 0.019 |
| Protein (%) | 16.6 (15.2-18.9) | 16.9 (15.4-19.4) | 16.5 (15.0-18.6) | 0.241 |
| Kilocalories from fat | 387.7 (275.7-676.8) | 407.3 (293.1-780.1) | 372.0 (259.2-560.9 | 0.008 |
| Fats (%) | 26.8 (23.2-49.6) | 27.8 (23.2-70.5) | 26.8 (23.1-39.4) | 0.435 |
| Saturated fat (gr) | 16.8 (11.6-28.6) | 17.7 (12.1-32.1) | 15.8 (10.9-24.9) | 0.022 |
| Kilocalories per saturated fat | 151.4 (104.3-257.9) | 159.4 (109.1-288.7) | 142.4 (98.4-224.9) | 0.022 |
| Saturated Fat (%) | 10.6 (9.05-18.35) | 10.6 (9.11-25.98) | 10.5 (9.05-14.82) | 0.587 |
| Monounsaturated fat (g) | 3.91 (1.56-7.47) | 3.98 (1.62-7.56) | 3.50 (1.41-7.24) | 0.516 |
| Polyunsaturated fat (gr) | 1.76 (0.81-3.36) | 2.02 (0.90-3.39) | 1.60 (0.78-3.34) | 0.232 |
| Trans fats (gr) | 0.00 (0.00-0.12) | 0.00 (0.00-0.08) | 0.00 (0.00-0.13) | 0.250 |
| Types of carbohydrates | ||||
| Available CH (g) | 134.2 (57.8-197.5) | 134.3 (47.5-202.4) | 134.2 (68.4-190.0) | 0.886 |
| Total sugars (g) | 28.0 (17.98-55.39) | 28.4 (18.61-52.03) | 28.0 (16.68-55.99) | 0.352 |
| Added sugar (g) | 7.53 (3.39-20.14) | 7.53 (3.52-21.04) | 7.67 (3.28-19.36) | 0.649 |
| Total sugars (%) | 8.57 (6.43-14.73) | 8.57 (6.43-14.64) | 8.57 (6.43-16.14) | 0.728 |
| Added sugars (%) | 2.44 (1.30-5.65) | 2.43 (1.30-5.71) | 2.49 (1.25-5.63) | 0.845 |
| Monosaccharides (gr) | 7.80 (3.69-12.40) | 8.44 (4.40-12.72) | 6.76 (2.33-12.00) | 0.037 |
| Galactose (gr) | 0.00 (0.00-0.00) | 0.00 (0.00-0.00) | 0.00 (0.00-0.00) | 0.794 |
| Glucose (gr) | 2.91 (1.52-4.71) | 3.06 (1.99-4.67) | 2.51 (0.99-4.72) | 0.049 |
| Fructose (gr) | 4.86 (1.97-8.78) | 5.42 (2.28-8.78) | 4.35 (0.96-7.69) | 0.017 |
| Fructose (%) | 1.56 (0.75-2.45) | 1.65 (0.77-2.46) | 1.50 (0.42-2.45) | 0.266 |
| Disaccharides (gr) | 2.28 (1.18-3.75) | 2.37 (1.41-3.75) | 2.11 (0.71-3.62) | 0.127 |
| Lactose (gr) | 0.00 (0.00-0.00) | 0.00 (0.00-0.00) | 0.00 (0.00-0.00) | 0.834 |
| Maltose (gr) | 0.00 (0.00-0.01) | 0.00 (0.00-0.01) | 0.00 (0.00-0.01) | 0.404 |
| Other HC (gr) | 75.8 (15.3-142.7) | 68.7 (15.1-143.3) | 78.9 (15.6-138.6) | 0.871 |
| Net HC (gr) | 134.4 (63.1-197.5) | 134.4 (47.9-202.0) | 134.4 (68.4-190.0) | 0.938 |
| Non-digestible HC (gr) | 0.00 (0.00-0.00) | 0.00 (0.00-0.00) | 0.00 (0.00-0.00) | 0.833 |
| Dietary fiber (gr) | 8.57 (4.96-13.36) | 8.56 (4.97-13.72) | 8.57 (4.95-13.16) | 0.807 |
| Starch (gr) | 0.00 (0.00-1.84) | 0.00 (0.00-1.84) | 0.00 (0.00-1.83) | 0.418 |
| Micronutrients | ||||
| Cholesterol (mg) | 132.5 (83.4-217.4) | 141.7 (94.1-221.1) | 130.2 (78.8-205.9) | 0.063 |
| Folate (μg) | 106.9 (58.7-157.1) | 108.4 (59.4-159.3) | 104.9 (54.9-156.9) | 0.458 |
| Folic acid (μg) | 13.9 (0.00-62.3) | 7.90 (0.00-66.1) | 14.28 (0.00-60.1) | 0.478 |
| Vitamin B1 (mg) | 0.48 (0.25-0.71) | 0.49 (0.27-0.77) | 0.45 (0.24-0.70) | 0.158 |
| Vitamin B2 (mg) | 0.88 (0.58-1.28) | 0.92 (0.58-1.33) | 0.84 (0.57-1.26) | 0.519 |
| Vitamin B3 (mg) | 12.0 (8.26-19.04) | 12.4 (8.46-19.43) | 11.6 (8.17-18.67) | 0.468 |
| Pantothenic acid (mg) | 0.57 (0.25-1.02) | 0.57 (0.19-1.02) | 0.57 (0.27-1.05) | 0.505 |
| Vitamin B6 (mg) | 0.85 (0.50-1.34) | 0.92 (0.50-1.40) | 0.79 (0.50-1.27) | 0.158 |
| Vitamin B12 (μg) | 1.12 (0.41-2.37) | 1.12 (0.37-2.45) | 1.07 (0.41-2.35) | 0.746 |
| Vitamin C (mg) | 42.3 (13.7-96.4) | 40.1 (14.6-96.9) | 42.9 (11.6-96.4) | 0.952 |
| Vitamin D (μg) | 0.18 (0.00-0.79) | 0.19 (0.00-0.74) | 0.18 (0.00-0.82) | 0.490 |
| Vitamin E (mg) | 0.48 (0.23-1.02) | 0.50 (0.23-1.11) | 0.47 (0.22-0.95) | 0.521 |
| Vitamin K (μg) | 14.7 (5.03-51.57) | 14.6 (5.19-52.50) | 15.0 (4.62-49.98) | 0.483 |
| Biotin (μg) | 3.59 (0.50-7.27) | 3.68 (1.33-7.27) | 3.49 (0.36-7.27) | 0.401 |
| Vitamin A (IU) | 426.9 (135.4-856.3) | 413.5 (124.9-863.7) | 440.1 (155.9-849.0) | 0.691 |
| Calcium (mg) | 916.6 (517.7-1311.1) | 875.1 (453.7-1299.9) | 958.4 (572.5-1320.7) | 0.152 |
| Copper (mg) | 0.34 (0.21-0.53) | 0.35 (0.21-0.54) | 0.32 (0.21-0.51) | 0.517 |
| Iron (mg) | 12.68 (7.52-18.20) | 12.89 (7.35-18.56) | 12.56 (8.04-17.71) | 0.929 |
| Magnesium (mg) | 109.5 (62.3-163.3) | 114.2 (62.6-173.3) | 104.2 (61.6-157.5) | 0.574 |
| Boron (μg) | 155.1 (0.00-529.19) | 248.4 (0.00-529.19) | 122.1 (0.00-529.19) | 0.102 |
| Chlorine (mg) | 62.0 (0.0-150.0) | 84.7 (0.0-150.0) | 46.8 (0.0-150.0) | 0.193 |
| Chromium (μg) | 1.39 (0.00-2.32) | 1.39 (0.00-2.54) | 1.05 (0.00-2.32) | 0.380 |
| Fluoride (mg) | 0.00 (0.00-0.01) | 0.00 (0.00-0.01) | 0.00 (0.00-0.01) | 0.841 |
| Iodine (μg) | 1.13 (0.15-33.51) | 1.42 (0.15-36.74) | 0.88 (0.12-19.79) | 0.147 |
| Manganese (mg) | 0.32 (0.10-0.58) | 0.32 (0.09-0.58) | 0.32 (0.10-0.58) | 0.657 |
| Molybdenum (μg) | 0.00 (0.00-1.26) | 0.00 (0.00-1.29) | 0.00 (0.00-1.22) | 0.833 |
| Phosphorus (mg) | 490.8 (305.7-724.6) | 499.5 (300.4-772.5) | 486.1 (309.1-684.1) | 0.669 |
| Potassium (mg) | 1404.2 (845.2-1957.7) | 1424.5 (807.9-1986.6) | 1373.7 (888.0-1953.6) | 0.833 |
| Selenium (μg) | 45.58 (30.59-70.16) | 46.53 (30.36-72.71) | 44.96 (30.59-68.29) | 0.562 |
| Sodium (mg) | 2332.6 (1597.9-3033.6) | 2335.7 (1589.2-3146.7) | 2289.8 (1610.1-2968.2) | 0.578 |
| Zinc (mg) | 3.73 (1.76-8.89) | 4.33 (1.66-9.27) | 3.47 (1.87-8.22) | 0.496 |
Data presented as median and interquartile range (Q3-Q1). Comparisons were made using the Mann-Whitney U test. HC: carbohydrates.
Table 3 presents the results of multivariable linear regression models to determine the relationship between nutrient intake and the amount of liver fat, determined by CAP, body fat, visceral fat, and waist circumference. It was observed that as the percentage of carbohydrate consumption increases, the CAP increases and therefore the amount of liver fat (β=0.23, 95%CI: 0.02 to 0.45), in the same way it was found that the increase in the percentage of fat consumption is related to lower values of CAP (β=-0.22, 95%CI: -0.44 to -0.006). On the other hand, the consumption of Kcal, total fat, total sugars, added sugar and percentage of fat consumption is related to the increase in the percentage of body fat, while lower intakes of total carbohydrates (g), total protein (g), and percentages of carbohydrates are related to an increase in body fat. Waist circumference had a weak relationship with Kcal intake, and visceral fat was not associated with any nutrient intake.
Table 3.
Multivariable linear regression models on the relationship of dietary intake with liver fat and body fat.
Table 3.
Multivariable linear regression models on the relationship of dietary intake with liver fat and body fat.
| CAP Model | Fat model | Model Waist | Visceral fat model | |||||
|---|---|---|---|---|---|---|---|---|
| Nutrient | B (95% CI) | p-value | B (95% CI) | p-value | B (95% CI) | p-value | B (95% CI) | p-value |
| Kilocalories‡ | -0.006 (-0.016 to 0.004) | 0.204 | 0.001 (0.044-0.000) | 0.002 | -0.001 (-0.002-0.000) | 0.042 | 0.000 (0.000-0.000) | 0.567 |
| Carbohydrates (gr)* | 0.060 (-0.001 to 0.121) | 0.053 | -0.002 (0.372- -0.007) | 0.003 | 0.001 (-0.006-0.007) | 0.862 | 0.000 (0.000-0.001) | 0.589 |
| Protein (gr)* | -0.082 (-0.434 to 0.271) | 0.649 | -0.009 (0.541- -0.039) | 0.020 | 0.002 (-0.034-0.038) | 0.900 | -0.001 (-0.005-0.003) | 0.682 |
| Fat (gr)* | -0.129 (-0.266 to 0.007) | 0.063 | 0.006 (0.318- -0.006) | 0.017 | -0.001 (-0.015-0.013) | 0.845 | 0.000 (-0.002-0.001) | 0.639 |
| Saturated fat (gr)* | -0.325 (-0.706-0.056) | 0.094 | 0.015 (0.347- -0.017) | 0.047 | -0.006 (-0.045-0.033) | 0.747 | -0.001 (-0.005-0.003) | 0.701 |
| Total sugars (gr)* | 0.054 (-0.087-0.195) | 0.453 | 0.005 (0.395- -0.007) | 0.017 | -0.009 (-0.023-0.006) | 0.237 | 0.000 (-0.001-0.002) | 0.812 |
| Added sugar (gr)* | 0.098 (-0.190-0.386) | 0.506 | 0.018 (0.148- -0.006) | 0.042 | -0.012 (-0.041-0.017) | 0.425 | 0.000 (-0.003-0.003) | 0.834 |
| Fructose (gr)* | -0.129 (-0.920-0.661) | 0.748 | 0.026 (0.448- -0.041) | 0.092 | -0.052 (-0.132-0.029) | 0.210 | -0.001 (-0.009-0.008) | 0.884 |
| Protein (%)* | -0.285 (-1.336-0.766) | 0.594 | -0.019 (0.679- -0.106) | 0.069 | 0.006 (-0.101-0.113) | 0.912 | -0.001 (-0.012-0.010) | 0.862 |
| Carbohydrates (%)* | 0.234 (0.019-0.449) | 0.033 | -0.013 (0.155- -0.031) | 0.005 | 0.000 (-0.022-0.022) | 0.977 | 0.001 (-0.001-0.004) | 0.247 |
| Fat (%)* | -0.220 (-0.435- 0.006) | 0.044 | 0.014 (0.133- -0.004) | 0.032 | 0.000 (-0.022-0.022) | 0.995 | -0.001 (-0.04-0.001) | 0.263 |
| Saturated Fat (%)* | -0.557 (-1.145-0.031) | 0.063 | 0.037 (0.145- -0.013) | 0.086 | -0.003 (-0.064-0.057) | 0.910 | -0.003 (-0.010-0.003) | 0.329 |
| Total sugars (%)* | 0.165 (-0.293-0.622) | 0.480 | 0.009 (0.651- -0.029) | 0.047 | -0.028 (-0.075-0.018) | 0.236 | 0.000 (-0.005-0.005) | 0.954 |
| Added sugar (%)* | 0.211 (-0.649-1.072) | 0.630 | 0.034 (0.355- -0.038) | 0.106 | -0.030 (-0.118-0.058) | 0.503 | -0.001 (-0.011-0.008) | 0.791 |
| Fructose (%)* | -0.719 (-3.298-1.859) | 0.584 | 0.049 (0.654- -0.167) | 0.266 | -0.158 (-0.422-0.106) | 0.240 | -0.005 (-0.033-0.023) | 0.725 |
‡: Models adjusted for age, sex, BMI, waist circumference. *: Models adjusted for age, sex, BMI, waist circumference and total Kcal.
Table 4 presents the results of logistic regression models for determining the association of nutrient intake with hepatic steatosis. It was observed that carbohydrate intake was associated with a higher probability of having fatty liver: each gram of consumption was associated with a 0.3% increase in the probability of having fatty liver (β=0.003, p=0.03). We performed a regression model adjusting the variable of carbohydrate consumption per 15 grams, showing that the probability of having fatty liver increases by 5% (β=0.51, OR=1.053, 95%CI:1.006-1.102, p=0.03) for every 15 grams.
Table 4.
Multivariable logistic regression models on the relationship between dietary intake and the presence of hepatic steatosis.
Table 4.
Multivariable logistic regression models on the relationship between dietary intake and the presence of hepatic steatosis.
| Nutrients | B | Standard Error | OR (95%CI) | P value |
|---|---|---|---|---|
| Kilocalories‡ | 0.000 | 0.000 | 1.000 (0.999-1.000) | 0.183 |
| Carbohydrates (gr)* | 0.003 | 0.002 | 1.003 (1.000-1.006) | 0.028 |
| Protein (gr)* | -0.013 | 0.009 | 0.988 (0.970-1.005) | 0.165 |
| Fat (gr)* | -0.007 | 0.003 | 0.993 (0.986-1.000) | 0.048 |
| Saturated fat (gr)* | -0.017 | 0.010 | 0.983 (0.965-1.002) | 0.072 |
| Total sugars (gr)* | 0.005 | 0.003 | 1.005 (0.998-1.011) | 0.187 |
| Added sugar (gr)* | 0.004 | 0.007 | 1.004 (0.990-1.018) | 0.555 |
| Fructose (gr)* | -0.004 | 0.019 | 0.996 (0.960-1.035) | 0.851 |
| Protein (%)* | -0.032 | 0.026 | 0.969 (0.920-1.019) | 0.222 |
| Carbohydrates (%)* | 0.011 | 0.005 | 1.011 (1.000-1.021) | 0.050 |
| Fat (%)* | -0.009 | 0.005 | 0.991 (0.980-1.001) | 0.087 |
| Saturated Fat (%)* | -0.023 | 0.015 | 0.977 (0.949-1.005) | 0.110 |
| Total sugars (%)* | 0.013 | 0.011 | 1.013 (0.991-1.035) | 0.245 |
| Added sugar (%)* | 0.004 | 0.021 | 1.004 (0.965-1.046) | 0.835 |
| Fructose (%)* | -0.015 | 0.062 | 0.985 (0.872-1.112) | 0.802 |
‡: Models adjusted for age, sex, BMI, waist circumference. *: Models adjusted for age, sex, BMI, waist circumference and total Kcal.
The supplementary table 1 presents the results of the logistic regression models, considering the distributions of nutritional intake by quartiles. No association was observed between higher intake and increased risk of hepatic steatosis. For the analysis of this section, participants were classified as those who had consumption within the recommendations on free sugars <10% [20] and saturated fat consumption <7% [20].
Consumption of sugars ≥10% (n=217, 44%, OR=1.04, 95%CI: 0.67-1.60, p=0.86) or saturated fats ≥7% (n=451, 91.5%, OR=0.92, 95%CI: 0.43-1.96, p=0.83) was not associated with the presence of hepatic steatosis in quartile analyses.
Finally, the frequency of subjects with combined intakes of fats, total sugars, added sugars, and fructose was explored by considering those within quartile 4 of each of the nutrients as high consumption. The frequency of combined high consumption was low for all combinations: fats with total sugars (n=7, 1.3%), fats with added sugars (n=6, 1.1%) and fat with fructose (n=20, 3.7%).
4. Discussion
The objective of this study was to analyze the association of the consumption of nutrients, sugars, and saturated fat with liver and body fat in the general population. The results of our study showed that only carbohydrates were related to liver fat, and that, for each 15-gram serving of carbohydrates, the probability of developing hepatic steatosis increases by 5%. Furthermore, the highest consumption of energy from fats and sugars was associated with body fats, without having an effect on waist circumference or visceral fat. These findings give insights into how diet can influence body fat accumulation but do not conclude its effect on fat accumulation at the central level.
The WHO [20] recommends that the usual diet should contain less than 10% free sugars, as well as the least amount of saturated fats. The National Cholesterol Education Program [21] also suggests that the non-atherogenic diet contains less than 7% saturated fat; however, in this cross-sectional study, we found no association with hepatic steatosis that could be attributed to consumption above the aforementioned values, reason why specific nutritional recommendations should be established both to prevent and to treat the disease.
One of the limitations of this study was that a 24-hour reminder (R24) was applied on a single occasion to obtain dietary intakes. The usual dietary intake can be estimated more accurately through repeated R24. The fact that people with hepatic steatosis had lower caloric intake despite having a higher frequency of metabolic comorbidities and higher body weight suggests that the dietary estimate was not as accurate or that the respondents were aware of their metabolic comorbidity and had made lifestyle changes to correct it. This is a limitation of all cross-sectional studies where it is not possible to establish causality.
Another limitation is that we could not establish a consumption pattern with respect to schedules. It is thought that a possible factor that allows the reversal of lipid accumulation in the blood and liver is intermittent fasting [22] especially with high-fat diets. Analysis of the diet with the aforementioned software did not provide the amount of fats such as n-3, n-6 fatty acid, polyphenols, or carotenoids in the diet, which have also been noted as metabolic protective factors [23]. Regarding dietary fiber, our results showed that the consumption of this nutrient is below the minimal intake recommendation, which limited the possibility of evaluating associations with outcomes despite the fact that its protective role has been described.
The inconsistent associations in the different studies that evaluate the main nutrients and micronutrients with hepatic steatosis may be due to the fact that aspects such as the radius of the nutrients, their origin, or the consumption pattern of each individual are not taken into account. In addition to this, there are most likely additional factors, with the microbiota, genetics and epigenetics (as in the case of fats), that modulate this association [23]. Dietary analysis in such disease has taught us that isolated nutrients should not be interpreted causally, as it is difficult to evaluate the effect of nutrition if the interactions between the different components of nutrition are not taken into account. Therefore, future studies could evaluate the association between diet and steatosis from the point of view of nutritional geometry [24]. Noteworthy, the latter has not allowed for the elucidation of the optimal balance between nutrients, foods, diets, appetite regulation, food matrices and homeostatic physiology despite proposing a multilevel analysis based on an axis such as the prioritization of protein [24]. One conclusion of studies that have used nutritional geometry is that nutrient balance affects the relationship between food, energy intake, and various physiological functions in a variety of ways [23].
In this study, the relationship between nutrient consumption and liver and body fat was sought and not the relationship between types or groups of foods, nor between dietary patterns with liver or body fat, which can be very relevant in liver fat accumulation.
Another limitation is that the diagnosis of hepatic steatosis was based on the CAP, which, although more sensitive than ultrasound, is not very sensitive for mild degrees of steatosis, in addition to the fact that the cut-off points to define steatosis vary in the literature.
Once more than 6 kcals/day (25 kJ/day) from carbohydrates and 2 kcals/day (10 kJ/day) from protein are cumulatively ingested during the aging process is likely one of the most sensible explanations regarding the development of metabolic liver disease, reflecting that the nutrient ratio is just as important as the energy content [23]. This is consistent with the controversy that exists about the consumption of sugary drinks (soft drinks in particular) as possible risk or protective factors. However, it has been described that the consumption of fructose from these products from 4 g/kg/day for one week increases liver fat content since it behaves as an inducer of lipogenesis and intestinal endotoxins [22].
Generalizability of the study findings could be limited to populations with similar characteristics to workers in the healthcare sector of Mexico, who are known to be young on average, low physical activity levels, with low fiber intake and excessive processed meats and sweetened beverages consumption, undergoing transition towards higher dietary fats, carbohydrates, and sodium [25]. The application of multiple non-inclusion criteria in this study may further limit the generalizability of findings to other populations.
5. Conclusions
Consumption of free sugars and saturated fats was associated with body fat but not liver fat. The diet high in energy, fat and added sugars, but low in carbohydrates (including fiber) and protein, was found to be associated with body fat. To explain the possible relationship of diet with liver fat, it is necessary to consider a greater registration of the diet prospectively, as well as to analyze it with a focus on nutritional geometry.
Supplementary Materials
The following supporting information is available as supplementary material. Table S1: Multivariable logistic regression models on the relationship of dietary intake quartiles with the presence of hepatic steatosis. File 1: 24- hour recall format.
Author Contributions
SEMV: Conceptualization, Investigation, Methodology, Project administration, Supervision, Writing, Original Draft, Review and Editing, Funding adquisition, Visualization. AKG: Conceptualization, Methodology, Data curation, Formal Analysis, Supervision, Writing, Original Draft, Review and editing, Visualization. CMV: Methodology, Investigation, Supervision, Writing, Original Draft, Review and editing, Visualization. JMG: Methodology, Formal Analysis, Writing, Original Draft, Review and Editing, Visualization. IGJ: Methodology, Supervision, Review and editing, Visualization. LUD: Conceptualization, Supervision, Review and editing, Funding adquisition, Project administration, Visualization.
Funding
There was no funding from public sector agencies, commercial entities or non- profit organizations for this study. The authors used their own resources for the execution of the project.
Institutional Review Board Statement
This study was approved on by the Ethis Committee of Instituto Nacional de Ciencias Médicas y Nutrición “Salvador Zubirán” with number registration GAS- , in accordance with the Declaration of Helsinki. We checked the final manuscript with Turnitin tool thar registeted % of coincidences, mainly.
Informed Consent Statement
Informed consent was obtained from all subjects involved in the study.
Data Availability Statement
The data presented in this study are available on request from the corresponding author. The data are not publicly because they contain information that could compromise the privacy of research participants.
Acknowledgments
The authors thank to José Miguel Corral, Carlos Ignacio Mulia and Karla Cecilia Ramírez to carry out all the standardized body measures and to supervise each participant fills the questionnaires.
Conflicts of Interest
The authors declare that they have no conflicts of interest in conducting or publishing this study.
References
- Miao L, Targher G, Byrne CD, Cao YY, Zheng MH. Current status and future trends of the global burden of MASLD. Trends Endocrinol. Metab. 2024, 35, 697–707. [Google Scholar]
- Ouyang X, Cirillo P, Sautin Y, McCall S, Bruchette JL, Diehl AM, et al. Fructose consumption as a risk factor for non-alcoholic fatty liver disease. J. Hepatol. 2008, 48, 993–999. [Google Scholar] [CrossRef] [PubMed]
- Maersk M, Belza A, Stødkilde-Jørgensen H, Ringgaard S, Chabanova E, Thomsen H, et al. Sucrose-sweetened beverages increase fat storage in the liver, muscle, and visceral fat depot: a 6-mo randomized intervention study. Am. J. Clin. Nutr. 2012, 95, 283–289. [Google Scholar] [CrossRef] [PubMed]
- Simons N, Veeraiah P, Simons PI, Schaper NC, Kooi ME, Schrauwen-Hinderling VB, et al. Effects of fructose restriction on liver steatosis (FRUITLESS); a double-blind randomized controlled trial. Am. J. Clin. Nutr. 2021, 113, 391–400. [Google Scholar]
- Zelber-Sagi S, Nitzan-Kaluski D, Goldsmith R, Webb M, Blendis L, Halpern Z, et al. Long term nutritional intake and the risk for non-alcoholic fatty liver disease (NAFLD): A population based study. J. Hepatol. 2007, 47, 711–717. [Google Scholar]
- Asgari-Taee F, Zerafati-Shoae N, Dehghani M, Sadeghi M, Baradaran HR, Jazayeri S. Association of sugar sweetened beverages consumption with non-alcoholic fatty liver disease: a systematic review and meta-analysis. Eur J Nutr. 2019, 58, 1759–1769. [Google Scholar]
- Ma J, Fox CS, Jacques PF, Speliotes EK, Hoffmann U, Smith CE, et al. Sugar-sweetened beverage, diet soda, and fatty liver disease in the Framingham Heart Study cohorts. J. Hepatol. 2015, 63, 462–469. [Google Scholar]
- Schwarz JM, Noworolski SM, Wen MJ, Dyachenko A, Prior JL, Weinberg ME, et al. Effect of a High-Fructose Weight-Maintaining Diet on Lipogenesis and Liver Fat. J. Clin. Endocrinol. Metab. 2015, 100, 2434–2442. [Google Scholar]
- Luukkonen PK, Sädevirta S, Zhou Y, Kayser B, Ali A, Ahonen L, et al. Saturated Fat Is More Metabolically Harmful for the Human Liver Than Unsaturated Fat or Simple Sugars. Diabetes Care 2018, 41, 1732–1739. [Google Scholar]
- Sobrecases H, Lê KA, Bortolotti M, Schneiter P, Ith M, Kreis R, et al. Effects of short-term overfeeding with fructose, fat and fructose plus fat on plasma and hepatic lipids in healthy men. Diabetes Metab. 2010, 36, 244–246. [Google Scholar]
- Schneider BC, Dumith SC, Orlandi SP, Assunção MCF. Diet and body fat in adolescence and early adulthood: a systematic review of longitudinal studies. Ciênc Saúde Coletiva 2017, 22, 1539–1552. [Google Scholar]
- Gómez Candela, C. INDICACIONES DE DIFERENTES TIPOS DE FIBRA EN DISTINTAS PATOLOGÍAS. NUTRICION HOSPITALARIA. 1 de junio de 2015; 2372-83.
- Tao M, Liu J, Chen X, Wang Q, He M, Chen W, et al. Correlation between serum uric acid and body fat distribution in patients with MAFLD. BMC Endocr Disord 2023, 23, 204. [Google Scholar]
- Tacke F, Horn P, Wai-Sun Wong V, Ratziu V, Bugianesi E, Francque S, et al. EASL–EASD–EASO Clinical Practice Guidelines on the management of metabolic dysfunction-associated steatotic liver disease (MASLD). J. Hepatol. 2024, 81, 492–542. [Google Scholar] [CrossRef]
- Weir CB, Jan A. BMI Classification Percentile And Cut Off Points. En: StatPearls [Internet]. Treasure Island (FL): StatPearls Publishing; 2025 [citado 26 de enero de 2025]. Disponible en: http://www.ncbi.nlm.nih.gov/books/NBK541070/.
- Durnin J, Womersley J. Body fat assessement for total body density and its estimation from skinfold thickness: measurements on 481 men and women aged from 16 to 72 years. Br. J. Nutrition. 1974, 32, 77–97.
- Berzigotti A, Tsochatzis E, Boursier J, Castera L, Cazzagon N, Friedrich-Rust M, et al. EASL Clinical Practice Guidelines on non-invasive tests for evaluation of liver disease severity and prognosis – 2021 update. J. Hepatol. 2021, 75, 659–689. [Google Scholar] [CrossRef]
- Younossi ZM, Golabi P, Paik JM, Henry A, Van Dongen C, Henry L. The global epidemiology of nonalcoholic fatty liver disease (NAFLD) and nonalcoholic steatohepatitis (NASH): a systematic review. Hepatology 2023, 77, 1335–1347. [Google Scholar] [CrossRef]
- Willett, W. Issues in analysis and presentation of dietary data. In: Willett W, editor. Nutritional Epidemiology. 3rd ed. New York: Oxford University Press; 2012; 0. [Google Scholar] [CrossRef]
- Organización Mundial de la Salud. Directriz: Ingesta de azúcares para adultos y niños Resumen [Internet]. Organización Mundial de Gastroenterología; 2015. Disponible en: https://iris.who.int/bitstream/handle/10665/154587/WHO_NMH_NHD_15.2_spa.pdf.
- National Cholesterol Education Program. Detection, Evaluation, and Treatment of High Blood Cholesterol in Adults (Adult Treatment Panel III) [Internet]. NCEP; 2001 [citado 22 de octubre de 2024]. Disponible en: https://www.nhlbi.nih.gov/files/docs/guidelines/atp3xsum.pdf.
- Perdomo CM, Frühbeck G, Escalada J. Impact of Nutritional Changes on Nonalcoholic Fatty Liver Disease. Nutrients 2019, 11, 677. [Google Scholar] [CrossRef] [PubMed]
- Berná G, Romero-Gomez M. The role of nutrition in non-alcoholic fatty liver disease: Pathophysiology and management. Liver Int. 2020, 40, 102–108. [Google Scholar]
- Simpson SJ, Raubenheimer D, Cogger VC, Macia L, Solon-Biet SM, Le Couteur DG, et al. The nutritional geometry of liver disease including non-alcoholic fatty liver disease. J. Hepatol. 2018, 68, 316–325. [Google Scholar]
- Betancourt-Nuñez, A. , Márquez-Sandoval, F., González-Zapata, L.I. et al. Unhealthy dietary patterns among healthcare professionals and students in Mexico. BMC Public Health 2018, 18, 1246. [Google Scholar]
Disclaimer/Publisher’s Note: The statements, opinions and data contained in all publications are solely those of the individual author(s) and contributor(s) and not of MDPI and/or the editor(s). MDPI and/or the editor(s) disclaim responsibility for any injury to people or property resulting from any ideas, methods, instructions or products referred to in the content. |
© 2025 by the authors. Licensee MDPI, Basel, Switzerland. This article is an open access article distributed under the terms and conditions of the Creative Commons Attribution (CC BY) license (https://creativecommons.org/licenses/by/4.0/).
Copyright: This open access article is published under a Creative Commons CC BY 4.0 license, which permit the free download, distribution, and reuse, provided that the author and preprint are cited in any reuse.


