
Submitted:
09 September 2025
Posted:
10 September 2025
You are already at the latest version
Abstract
Objectives: To compare body composition, metabolic profile, liver alterations, and dietary patterns in adults stratified by serum ferritin (SF) levels (normal vs. high). Methods: A cross-sectional study was conducted using secondary data from 113 adults (>18 years) of both sexes, who attended a nutrition outpatient clinic in southern Brazil between March 2023 and October 2024. Socioeconomic, anthropometric, blood pressure, dietary, biochemical, and liver parameters were assessed. Statistical analyses included Student's t-test or Mann–Whitney U test, chi-square test, logistic regression, PERMANOVA, and PCoA, with significance set at 5%. Results: Participants with high SF were more frequently male (p< 0.0001), married or in stable relationships (p=0.012), and had lower educational levels (p=0.009). They exhibited higher rates of obesity (p=0.003), cardiovascular risk (p=0.004), and increased body fat percentage (BF%) (p=0.002). Metabolic disturbances included elevated glucose (p=0.023), triglycerides (p=0.003), insulin resistance (p=0.027), hypertension (p=0.001), and metabolic syndrome (MS) (p=0.001). Liver-related findings comprised increased ALT (p=0.008), uric acid (p=0.016), and steatosis indicators (p=0.022). Dietary evaluation showed greater carbohydrate intake (p=0.024). Logistic regression demonstrated a higher likelihood of elevated SF among men (OR=16.82) and individuals with increased BF% (OR=7.5). PCoA analysis distinguished groups according to adiposity, metabolic, and sociodemographic factors. Conclusions: Adults with elevated SF were predominantly obese men with excess adiposity, insulin resistance, and metabolic and hepatic dysfunctions, conditions that increase the risk of MS and liver injury. These findings suggest that SF and other iron biomarkers may serve as valuable tools for diagnosing metabolic dysfunctions and obesity-related liver diseases, particularly Metabolic Dysfunction–Associated Steatotic Liver Disease (MASLD).
Keywords:
adiposity
; insulin resistence
; iron
1. Introduction
Iron is essential for fundamental physiological processes, including oxygen transport, mitochondrial ATP production, enzymatic activity, and redox balance [1]. Maintaining iron homeostasis is therefore critical for health, as disturbances are frequently associated with conditions such as anemia, inflammation, diabetes, and obesity [2,3]. Ferritin, a protein with ferroxidase activity, plays a central role in this regulation by controlling intracellular iron availability. Its heavy-chain subunits oxidize ferrous iron (Fe²⁺) to the less reactive ferric state (Fe³⁺), enabling safe storage in a bioavailable form and preventing oxidative damage [4].
Alterations in serum ferritin (SF) levels are associated with multiple health outcomes [5], and SF is widely used as a biomarker of body iron stores [6,7]. Low SF concentrations typically indicate iron deficiency, whereas elevated SF suggests pathological iron overload [8]. The exact origin of circulating SF is not fully understood, although macrophages are considered the primary source of systemic ferritin [9,10]. In addition, SF is recognized as an acute-phase reactant, as its levels increase during inflammation independently of intracellular iron storage [11].
Overweight and obesity are major risk factors for the development of chronic non-communicable diseases (NCDs), particularly type 2 diabetes mellitus (T2DM) and cardiovascular diseases (CVDs) [12,13]. Interestingly, disturbances in iron metabolism, especially elevated SF, are frequently observed in individuals with T2DM, hypertension, dyslipidemia, increased fasting insulin and glucose levels, and central adiposity [14].
Excessive white adipose tissue (WAT) deposition is a hallmark of obesity, and the immuno-metabolic interface plays a key role in understanding the pathological states associated with obesity and in guiding appropriate treatment strategies [15]. During WAT expansion, particularly in visceral depots, a pro-inflammatory state develops, characterized by increased local (intra-organ) and circulating levels of tumor necrosis factor alpha (TNF-α) and interleukins 1 (IL-1) and 6 (IL-6), which are major contributors to insulin resistance (IR) [16]. Greater visceral adiposity, IR, dyslipidemia, glucose intolerance, and hypertension are common metabolic disturbances that cluster within metabolic syndrome (MS), a recognized risk factor for T2DM, as well as cardiovascular and hepatic diseases [14,17].
The liver plays a central role in iron homeostasis, immune responsiveness, and overall metabolism [18]. Elevated IL-6 stimulates hepatic hepcidin production, which inhibits ferroportin activity, thereby blocking intestinal iron absorption and preventing iron efflux from intracellular depots [1]. Consequently, in obesity and MS, iron overload may occur in several tissues, exceeding ferritin’s storage capacity and resulting in hyperferritinemia [19,20]. Excessive hepatic iron retention enhances reactive oxygen species (ROS) generation, promoting a pro-inflammatory state and hepatic insulin resistance, with deleterious effects on lipid and glucose homeostasis [17,21]. Furthermore, the role of inflammation has not been systematically considered in this context, contributing to conflicting findings in the literature [22,23].
Metabolic Dysfunction–Associated Steatotic Liver Disease (MASLD) is closely linked to obesity and IR, particularly when associated with MS. Iron overload is commonly observed in MASLD and is frequently associated with an increased risk of progression to metabolic dysfunction–associated steatohepatitis (MASH), cirrhosis, hepatocellular carcinoma (HCC), and overall liver-related mortality [24]. Moreover, hepatic iron accumulation can trigger ferroptosis, a recently described form of regulated cell death driven by excessive ROS production and lipid peroxidation [25]. Ferroptosis also reduces insulin secretion by pancreatic β-cells, thereby exacerbating metabolic dysfunction [7,26]. Additionally, experimental models suggest that insulin induces ferritin synthesis at the mRNA level, providing a potential explanation for the hyperferritinemia frequently observed in the context of IR [27]. Therefore, evaluating SF levels and their association with MS is critical for preventing MASH and its deleterious hepatic consequences.
Several studies have suggested that SF may serve as a non-invasive biomarker for assessing different stages of MASLD [11]. However, systematic reviews [28,29] have reported inconsistent associations between SF and MASLD, indicating that further research is needed to establish the definitive clinical utility of SF in this context. Moreover, sex differences influence iron homeostasis, including SF levels, with men generally presenting higher values than women due to variations in iron storage and regulation [27]. In this context, the present study categorized adult subjects of both sexes according to SF levels (normal vs. high) and compared them with respect to body composition, metabolic status, dietary patterns, and liver dysfunction.
2. Materials and Methods
The present study was a cross-sectional, quantitative investigation based on data collected from nutritional assessments performed during the initial consultation of adult individuals (>18 years) of both sexes who attended a nutrition outpatient clinic in southern Brazil between March 2023 and October 2024. The study protocol was approved by the Research Ethics Committee of the Federal University of the Southern Frontier (UFFS; approval number 41154814.7.0000.5564). All participants provided written informed consent for the use of their socioeconomic, lifestyle, anthropometric, dietary, and metabolic data. The nutrition outpatient clinic offers free public services, and laboratory tests were performed within 30 days of the first consultation by the municipal laboratory, which also provided these tests at no cost. The study was conducted in accordance with the Declarations of Helsinki and Istanbul.
From March 2023 to October 2024, the Nutrition outpatient clinic attended 163 individuals, for whom socioeconomic, lifestyle, anthropometric, blood pressure, and dietary data were recorded, along with requested biochemical and metabolic tests, including SF levels and complete blood counts. SF levels were used to classify individuals as having normal SF (15–150 ng/mL for women and 15–200 ng/mL for men) or high SF (>150 ng/mL for women and >200 ng/mL for men), according to World Health Organization (WHO) recommendations [30]. Individuals with iron deficiency anemia (SF <15 ng/mL), hemolytic anemia, or missing SF data were excluded. Pregnant women were also excluded from the study. The flowchart for participant selection is shown in Figure 1.
Socioeconomic Data: Age (years), sex (female and male), marital status, education level, and socioeconomic class were recorded. Family income was categorized according to the criteria of the Brazilian Association of Research Companies [31] as follows: AB (upper and upper-middle class: >R$5,755.23 to 21,826.74 or >USD 1,058.10 to 4,012.85), C (middle class: >R$1,965.87 to <R$5,755.23 or >USD 361.42 to <1,058.10), and DE (lower and lower-middle class: >R$900.60 to <R$1,965.87 or >USD 165.57 to <361.42).
Lifestyle Data: Physical activity, smoking, and alcohol consumption were recorded. During the nutritional assessment, participants were asked about their physical activity, including type, duration (minutes), and frequency per week. Participants were classified as physically active if they engaged in at least 150–300 minutes per week of moderate-intensity, 75–150 minutes per week of vigorous-intensity aerobic activity, or an equivalent combination of moderate- and vigorous-intensity activity, according to WHO guidelines [32]. Alcohol consumption was assessed regarding type and weekly quantity (grams). The average alcohol content of common beverages was considered: beer = 5%, wine = 12%, and distilled spirits = 42% [33]. Alcohol intake was classified according to Cotrim et al. [34], with excessive consumption defined as >70 g/week for women and >140 g/week for men. Smoking status was self-reported. Individuals were considered smokers if they used cigarettes, cigars, cigarillos, pipes, hookahs, or electronic cigarettes, following the criteria of Malta et al. [35].
Anthropometry and Body Composition: Anthropometric measurements included body weight (kilograms, kg) and height (meters, m), performed according to the technique described by Gordon, Chumlea, and Roche [36]. Body mass index (BMI; kg/m²) was calculated from weight and height, and participants were classified according to WHO criteria [37] as underweight (BMI <18.5 kg/m²), normal weight (BMI 18.5–24.99 kg/m²), overweight (BMI 25–29.99 kg/m²), and obesity (BMI ≥30 kg/m²). Waist and hip circumferences (WC and HC, cm) were measured following Callaway [38], and waist-to-hip ratio (WHR) was calculated. WC and WHR were categorized according to WHO recommendations [37]. For women, WC <80 cm and WHR <0.85 were considered no cardiovascular risk, while WC ≥80 cm and WHR ≥0.85 indicated cardiovascular risk. For men, WC <94 cm and WHR <1 indicated no cardiovascular risk, whereas WC ≥94 cm and WHR ≥1 indicated cardiovascular risk. Body composition was assessed using tetrapolar bioelectrical impedance (Biodynamics 450®) according to the manufacturer’s instructions [39]. Body fat percentage (BF%) was recorded and classified according to Lohman [40]: in females, BF% <32% was considered acceptable and BF% ≥32% elevated; in males, BF% <25% was considered acceptable and BF% ≥25% elevated. Lean mass percentage (LM%) was also measured.
Serum Biochemistry Analysis: Laboratory analyses were performed by the municipal clinical laboratory. After a 12-hour fast, blood samples were collected, and serum was used to measure fasting blood glucose (mg/dL), total cholesterol (TC; mg/dL), triglycerides (TG; mg/dL), and high-density lipoprotein (HDL; mg/dL) using enzymatic colorimetric methods on the BIOPLUS-2000® device. Low-density lipoprotein (LDL; mg/dL) was calculated using the formula: LDL=TC−HDL−(TG/5) [41]. Glucose and triglyceride values were used to calculate the TyG index (ln[TG (mg/dL)×glucose (mg/dL)]/2), a marker of IR [42,43]. Uric acid (UA; mg/dL) was also measured using the enzymatic colorimetric method. SF (ng/mL) was assessed by chemiluminescence using the CENTAUR - SIEMENS® system. Complete blood counts, including white blood cell and platelet profiles, were performed using the automated MINDRAY BC-5150® device. Additionally, erythrocyte sedimentation rate (ESR) was determined according to the modified Westergren method [44], and C-reactive protein (CRP) was measured by immunoturbidimetric method using the BIOPLUS-2000® device. Classifications for serum biochemistry analyses are presented in Table 1.
Blood Pressure: Blood pressure was measured using an automatic device (G-Tech, BSP11®, Brazil) with participants seated, feet flat on the floor, left arm relaxed and supported at heart level, palm facing upwards, and bladder empty. Measurements were taken after participants had refrained from moderate or vigorous exercise, smoking, or alcohol consumption for at least 30 minutes prior, according to the protocol proposed by Barroso [33]. The classification of hypertension is presented in Table 1.
Metabolic Syndrome: The frequency of MS was assessed in females and males using the criteria established by the IDF [45]. MS was diagnosed when individuals presented elevated waist circumference (female: >80 cm; male: >90 cm) along with at least two of the following altered parameters: fasting glucose >100 mg/dL or a previous diagnosis of diabetes; TG >150 mg/dL; low HDL cholesterol (female: <50 mg/dL; male: <40 mg/dL) or use of lipid-lowering therapy; systolic blood pressure (SBP) >130 mmHg and/or diastolic blood pressure (DBP) >85 mmHg, or use of antihypertensive treatment.
Liver Analysis and Hepatic Pathology: Serum levels of hepatic enzymes, alanine aminotransferase (ALT) and aspartate aminotransferase (AST), were measured using a UV-optimized method on the BIOPLUS-2000® device. The Hepatic Steatosis Index (HSI) [50] was calculated using the formula: HSI = 8×(ALT/AST ratio)+BMI (+2 if female; +2 if T2DM). Hepatic fibrosis was also assessed using the FIB-4 score, calculated as: FIB-4 = (age× AST)/(platelets×√ALT) [51]. The HSI and FIB-4 classifications are presented in Table 1.
Nutritional Assessment Data: Dietary intake was recorded using 24-hour dietary recall (24HR). The reported amounts were converted to grams using the Table of Reported Measures for Food Consumed in Brazil, based on the 2008–2009 Family Budget Survey [51], or the Table for Evaluating Food Consumption in Household Measures [52]. Per capita consumption of oil, lard, and salt was also recorded. Nutrient intake, including energy, macronutrients (carbohydrates, lipids, and proteins), and micronutrients (vitamin C and iron), was calculated using Nutritional WebDiet® software, which relies on the Brazilian Food Composition Table (TBCA) [53], and expressed in grams (g) and/or percentages (%). Intake of saturated fatty acids (SFA), monounsaturated fatty acids (MUFA), polyunsaturated fatty acids (PUFA), cholesterol, and fiber was also obtained for each participant. Iron bioavailability from the diet was estimated using the method of Monsen et al. [54], which classifies meals according to the absorption potential of iron, considering the content of heme iron (from meat) and vitamin C. Total iron, vitamin C, heme and non-heme iron, and absorption rates for heme (23%) and non-heme iron (3%, 5%, or 8%) were calculated for each meal and summed for daily intake. Additionally, the Food Frequency Questionnaire (FFQ) from the nutritional anamnesis was analyzed, categorizing food groups by daily, weekly, monthly, or rare/never consumption.
Statistical Analysis: In the present study, individuals were compared according to SF levels (normal vs. high), taking into account the nature of the variables (qualitative or quantitative) and the assumptions of each statistical test applied. The normality of quantitative variables was assessed using the Shapiro-Wilk test. For independent samples, the Student’s t-test (parametric) or the Mann-Whitney U test (non-parametric) was applied. For qualitative variables, the chi-square test of independence with adjusted residual analysis was used (p>1.96). When expected frequencies were below five, the Monte Carlo method with 5,000 simulations was applied to obtain more robust p-values. Qualitative variables were expressed as absolute (n) and relative (%) frequencies, whereas quantitative variables were presented as median and interquartile range (Q1–Q3) for non-parametric data, or mean and standard deviation (SD) for parametric data. The significance level was set at 5% for all analyses. Variables with p-values <0.20 in the initial analyses were considered eligible for inclusion in the subsequent multivariate analysis. Considering the sample size of the less frequent outcome event (n = 38) and to maintain an appropriate ratio between the number of events and predictors in the multivariate model—according to the standard recommendation of at least 10 events per independent variable—the final model was limited to a maximum of four variables. The final model included the following independent variables: sex, BF%, HSI (indicative of MASLD), and presence of MS. Due to the small number of cases in some categories and to avoid complete separation issues, model adjustment was performed using Firth’s penalized likelihood method, which corrects estimation bias in models with a small number of events. Individuals, classified according to SF levels (normal or high), were evaluated using multivariate statistical analysis. Variables were grouped as follows: Anthropometric data: BMI, overweight, WC, HC, WHR, BF%, LM%. Biochemical data: glucose, TG, TyG, RI, TC, HDL, LDL, AST, ALT, FIB-4, UA, CRP, ESR, HSI, and presence of MS. Dietary data: energy, carbohydrates, protein, lipids (SFA, MUFAs, PUFAs), cholesterol, fiber, total meat, total iron, total vitamin C, total heme iron, non-heme iron, and iron absorbed. Sociodemographic data: sex, age, marital status, education, income class, smoking, alcohol consumption, and physical activity. Individuals with incomplete data were excluded. For each group of variables, a dissimilarity matrix was constructed based on Gower distance (daisy function, cluster package). Differences between ferritin groups (normal vs. high) were assessed using permutational multivariate analysis of variance (PERMANOVA) via the adonis2 function in the vegan package. Results were visualized with Principal Coordinate Analysis (PCoA) plots using ggplot2, where each point represents an individual and the distance between points reflects calculated dissimilarity; closer points indicate greater similarity in the analyzed data (anthropometric, biochemical, etc.). Statistical analyses were performed using XLSTAT software (version 2019.2.2.59614, Addinsoft, Paris, France) within the Microsoft Excel 2016 environment, with the advanced statistical analysis module, and in R software (version 4.5.1).
3. Results
Comparative sociodemographic characteristics between individuals with normal and high SF levels are presented in Table 2. Sex distribution differed significantly between groups (χ² = 19.2; gl = 1; p < 0.0001), with a higher proportion of men in the high SF group compared to the normal SF group (47.4% vs. 10.7%, respectively). Median age was similar between groups, with 31 years (23–41.5) in the normal SF group and 41 years (31.2–49.8) in the high SF group.
Marital status also differed between groups (χ² = 10.9; gl = 3; p = 0.012), with single status being predominant in the normal SF group (53.3%) and married/stable union more frequent in the high SF group (65.7%). Similarly, education level differed between groups (χ² = 15.9; gl = 6; p = 0.009), with a higher proportion of individuals with completed high school in the high SF group (42.1%), whereas incomplete higher education was more common in the normal SF group (36%). However, family income, smoking, alcohol consumption, and physical activity did not differ significantly between normal and high SF subjects (Table 2).
Anthropometric and adiposity variables are presented in Table 3 for individuals with normal and high SF. BMI distribution differed between groups (χ² = 13.1; gl= 3; p = 0.003), with the high SF group showing a higher prevalence of obesity (55.3%) compared to the normal SF group (28%). In contrast, normal-weight individuals were more prevalent in the normal SF group than in the high SF group (41.1% vs. 13.2%, respectively). Waist circumference (WC) classification also differed between groups (χ² = 8.4; gl = 1; p = 0.004), with a greater proportion of individuals at cardiovascular risk in the high SF group compared to the normal SF group (78.9% vs. 50.7%). BF% classification was likewise different (χ² = 9.2; gl = 1; p = 0.002), with a higher proportion of elevated BF% in the high SF group compared to normal SF individuals (75.7% vs. 45.2%). However, classifications for WHR and LM% did not differ between groups (Table 3).
In Table 4, the classification of fasting biochemical variables, blood pressure measurements, and the frequency of MS are presented, comparing groups with normal versus high SF. Individuals with high SF values showed a higher frequency of elevated fasting blood glucose (χ² = 5.1; gl = 1; p = 0.023; normal SF: 8.2% vs. high SF: 23.7%), TG (χ² = 8.3; gl = 1; p = 0.003; normal SF: 13.3% vs. high SF: 36.8%), IR (χ² = 4.9; gl = 1; p = 0.027; normal SF: 28.8% vs. high SF: 50%), and hypertension (χ² = 9.6; gl = 1; p = 0.001; normal SF: 21.3% vs. high SF: 50%). Consequently, the frequency of MS was significantly higher in individuals with high SF (52.6%) compared to those with normal SF (21.3%; χ² = 11.4; gl = 1; p = 0.001). In contrast, the classification of TC, LDL, HDL, CRP, and ESR did not differ between normal and high SF individuals (Table 4). The medians of participants’ biochemical parameters according to SF classification (normal vs. high) did not show statistically significant differences (Data Supplemental, Table A1).
Enzyme biomarkers, UA, and indices of MASLD and liver fibrosis were used to evaluate liver function in individuals with normal versus high SF (Table 5). Significant differences were observed in ALT (χ² = 8.3; gl= 2; p = 0.008), with high SF subjects showing elevated values compared to normal SF subjects (21.6% vs. 4.3%, respectively), and UA (χ² = 6.43; gl = 2; p = 0.016, Monte Carlo method; normal SF: 10.3% vs. high SF: 29%). The HSI, an indicator of MASLD, also differed significantly between groups (χ² = 5.3; gl = 1; p = 0.022), with higher HSI values in high SF individuals compared to those with normal SF (67.6% vs. 44.3%, respectively). In contrast, FIB-4 and AST did not differ between groups (Table 5).
The 24HR was used to compare dietary intake between normal and high SF subjects (Table 6). Only carbohydrate consumption differed significantly (U = 26; p = 0.024), with high SF subjects presenting higher intake (212.2 g) compared to normal SF individuals (189.5 g). In the high SF group, there was also a trend toward higher fiber intake compared to the normal SF group (U = 24; p = 0.073). Energy, protein, lipids—including SFA, MUFAs, and PUFAs—cholesterol, and per capita oil and lard consumption did not differ between groups. Additionally, food parameters related to iron intake and bioavailability were similar between normal and high SF subjects (Table 6). Analysis of the participants’ FFQ revealed a significant difference between groups only for monthly sugar consumption (normal SF: 0% vs. high SF: 8.1%, p = 0.024) (Data supplemental, Table A2).
The influence of variables on elevated SF levels was analyzed using odds ratios (OR) obtained from logistic regression (Table 7). Males exhibited a higher risk of elevated SF values (OR = 16.82) compared to females. Similarly, adiposity also influenced this risk, with individuals having increased BF% showing a higher likelihood of elevated SF (OR = 7.5). Other conditions, such as HSI and MS, did not significantly affect this risk (Table 7).
Finally, we clustered the participants’ data (anthropometric, biochemical and liver indices, and sociodemographic) to perform a PCoA, comparing individuals with normal and high SF levels (Figure 2). This analysis clearly demonstrated that normal and high SF individuals differ in terms of adiposity (Figure 2A; F₁,₁₀₇ = 12.8; p = 0.001), metabolism (Figure 2B; F₁,₈₂ = 3.79; p = 0.008), and sociodemographic characteristics (Figure 2D; F₁,₁₁₀ = 6.53; p = 0.001).
According to PCoA, anthropometric data explained 60.36% of the variation, with BMI, WC, and BF% classification being the primary contributing variables. As a result, subjects in the high SF group exhibited higher adiposity, reflected in elevated values for these measures. Biochemical and liver indices (Figure 2B) accounted for 26.69% of the total variation on PCoA, primarily influenced by TyG, TG, and HSI. Elevated values of these variables indicated a profile associated with IR and MASLD. Additionally, the presence of MS also contributed to PCoA, with high SF individuals showing an increased risk of MS. Interestingly, sociodemographic data (Figure 2D) accounted for 24.62% of the variability on PCoA and was primarily influenced by physical activity. In this regard, individuals with normal SF values were more physically active than those with high SF levels. On the other hand, these differences did not appear to be related to dietary profile, as shown in Figure 2C (F₁,₁₀₆ = 0.89; p = 0.562).
4. Discussion
Altered SF is an important clinical biomarker for evaluating iron status and is especially useful for detecting iron deficiency [8]. However, growing evidence has shown that SF can also indicate metabolic abnormalities, such as those associated with obesity, diabetes, and liver diseases, including MASLD [7,55,56]. Circulating SF levels are influenced by sex, age, adiposity, inflammation, and race [1,11,57,58]. Therefore, it is important to characterize the SF profile of a population to determine its potential in identifying metabolic abnormalities and to better tailor dietary and therapeutic interventions aimed at preventing chronic disease over the lifespan [59,60]. To the best of our knowledge, this is the first study conducted with subjects living in southern Brazil categorized according to normal and high SF levels, comparing their anthropometric, metabolic, dietary, and liver function parameters.
In our sample, individuals in the high SF group had lower educational levels, were more frequently in a stable union or married, and were predominantly male. It has been shown that socioeconomic status modulates iron homeostasis [61,62,63]. Moreover, we also demonstrated that men had a higher risk of elevated SF values compared to women. Our results are consistent with a study conducted in southern Brazil, which reported that hyperferritinemia is common in Gaucher disease (GD), particularly in untreated, older male individuals with higher BMI [64].
A prospective cohort study including more than 13,000 middle-aged Korean men showed that baseline elevation of SF levels was positively and significantly associated with the development of MS during a 5-year follow-up [65]. According to Park et al. [65], elevated SF values were significantly higher, or tended to be higher, in men who met the TG criterion for MS, either resolved or developed, over the follow-up period. In agreement with these findings, in our sample, subjects in the high SF group exhibited a higher prevalence of altered TG levels compared to individuals with normal SF.
Obesity has been associated with elevated circulating SF levels and worsening metabolic status [12,14]. Consistent with this, our results showed that individuals in the high SF group had a higher frequency of obesity and a greater percentage of visceral adiposity, as indicated by elevated WC and BF%. Similar findings were reported in the European Prospective Investigation into Cancer and Nutrition (EPIC) study, which analyzed iron and SF levels in 828 individuals from seven of the ten participating countries (Germany, Spain, France, Italy, the United Kingdom, Sweden, and the Netherlands) [66].
In a large population-based Chinese study, income, smoking, and alcohol consumption were associated with altered circulating SF levels, particularly in men [67]. However, in the present study, we did not find significant differences in these variables when comparing normal and high SF subjects.
Our data also demonstrated that participants in the high SF group more frequently exhibited altered fasting blood glucose, TG, and IR (evaluated by the TyG index), as well as hypertension, resulting in a higher prevalence of MS in this group. These findings are consistent with a meta-analysis showing that SF is positively associated with MS, with high TG and glucose being the components most strongly linked to SF [68]. It is important to note that the high SF group had increased visceral adiposity, which is closely related to glucose intolerance and dyslipidemia [14]. Visceral adiposity and the associated pro-inflammatory state have been linked to disrupted iron homeostasis, leading to elevated IL-6 levels, increased hepcidin production, and intracellular iron overload [1].
Moreover, some studies have reported a relationship between elevated SF and T2DM. In this context, high SF levels promote IR and impair β-cell function, leading to reduced insulin secretion, and may also stimulate ferroptosis, a novel mechanism of cell death [7,69,70]. Consequently, altered SF levels are associated with disruptions in glycemic and lipid control [14].
The liver is a central organ for iron, glucose, and lipid homeostasis, and all of these processes are negatively affected by obesity and IR [26,71]. In the present study, we evaluated enzymatic biomarkers and hepatic indices to determine whether SF levels could be associated with liver injury. Our results showed alterations in liver disease biomarkers, such as ALT and MASLD, in individuals of the high SF group. In MASLD, UA is considered a marker of oxidative stress and a pathogenic factor associated with MS and CVD [72]. Consistently, in the present study, a higher frequency of elevated UA was observed in the high SF group. This finding aligns with a population-based study including healthy subjects of both sexes from the National Health and Nutrition Examination Survey III, which demonstrated a positive correlation between UA and SF [73]. Serum UA is increasingly recognized as a determinant of fatty liver disease due to its association with metabolic disorders [74,75]. Elevated serum UA is also linked to inflammation, IR, and atherosclerosis [76].
ALT is an enzyme predominantly found in the liver, and elevated serum ALT levels indicate liver injury from various causes, including iron deposition [77]. In our study, we observed a higher frequency of ALT alterations in the high SF group. Similarly, He et al. [78] reported that elevated SF levels were positively associated with ALT and MASLD.
In our study, individuals in the high SF group exhibited elevated HSI values, which is a valuable biomarker for MASLD [79]. Similarly, Shah and Kowdley [80] reported that participants in the highest quartile of SF levels were more likely to have MASLD based on HSI. A follow-up study showed that hyperferritinemia was associated with a 50% increased risk of liver-related events and a 27% increase in all-cause mortality. These authors also demonstrated that serum SF improved the predictive performance for liver-related events and mortality when combined with non-invasive scoring systems, such as FIB-4 [81]. In contrast, we did not find differences in the FIB-4 index in our study, suggesting that the participants had a milder degree of liver injury. Importantly, studies with liver biopsy specimens have shown that a mixed pattern of hepatic iron deposition is associated with the presence of nonalcoholic steatohepatitis (NASH), while SF levels increase with worsening fibrosis up to a pre-cirrhotic stage but are not independent predictors of advanced fibrosis [82].
Hepatocyte iron overload is involved in several liver-associated diseases [83]. However, hyperferritinemia may or may not be associated with increased hepatic iron in MASLD individuals. These findings suggest that the liver abnormalities observed in our high SF participants could be related to obesity and its associated comorbidities. Elevated pro-inflammatory cytokines, such as TNF-α, IL-1β, and IL-6, upregulate ferritin synthesis. Moreover, SF levels have been associated with the degree of hepatic fat accumulation and the severity of liver damage. Oxidative stress, resulting from the accumulation of harmful intermediates of fatty acids due to incomplete intracellular oxidation (lipotoxicity), may directly enhance ferritin transcription [11,55].
Several factors associated with obesity can influence diet and nutrient absorption, including iron and SF [1,84]. Therefore, in the present study, we applied 24HRs, a well-recognized tool for analyzing dietary intake and estimating iron consumption [54].
In our sample, participants in the normal and high SF groups had similar iron intake and absorption. For adult men and women (aged 18–50 years), the recommended daily intake of iron is 8 mg and 18 mg, respectively [85]. Dietary iron is present in two forms—heme and non-heme iron—which differ in bioavailability, absorption, and dietary sources [86]. Average daily iron intake is 10–15 mg in humans, of which only 1–2 mg is absorbed through the intestinal system [87]. Furthermore, in healthy young women, heme iron has been identified as an independent predictor of SF, suggesting that the consumption of foods such as meat (beef, veal, lamb, poultry, and fish) contributes to maintaining adequate SF levels [88]. In our study, none of these dietary nutrients differed between groups.
Ascorbic acid (vitamin C) is the most efficient enhancer of non-heme iron absorption and must be obtained from the diet [89]. In our participants, dietary vitamin C intake was similar between groups. Some studies have suggested that iron absorption may be influenced by total caloric intake, as more calorically dense meals may contain a higher proportion of iron absorption inhibitors, such as calcium and phytates, and a lower proportion of enhancers, such as vitamin C, potentially reducing non-heme iron bioavailability [87]. However, this parameter did not differ between groups in our study.
The role of dietary iron in obesity remains controversial, as highlighted by a recent review [90]. As previously mentioned, pro-inflammatory processes associated with obesity increase hepcidin, a protein that regulates intestinal iron absorption [1]. Additionally, excessive caloric intake may induce intestinal inflammation and reduce iron absorption [91]. In this context, we found that high SF subjects consumed more carbohydrates compared to individuals with normal SF. In athletes, carbohydrate intake has been shown to modulate iron levels without affecting SF [92]. Furthermore, energy-deficient diets or low carbohydrate availability may increase hepcidin in the absence of inflammation and elevate circulating iron and SF levels [93]. Therefore, it is unlikely that the higher carbohydrate consumption observed in high SF individuals contributed to their elevated SF levels.
On the other hand, altered glycemia, TG, and IR—especially when associated with elevated adiposity—are clearly linked to hyperferritinemia [94], particularly in men. Men and women differ in adipose tissue distribution: men tend to accumulate more visceral fat, resulting in the classic android body shape, which is highly correlated with increased cardiovascular risk. Conversely, women accumulate more fat in the subcutaneous compartment before menopause, a characteristic that provides protection against the negative consequences associated with obesity and MS. After menopause, however, fat deposition shifts toward the visceral compartment [95]. It is important to note that in our study, the median ages were 31 years (23–41.5) in the normal SF group and 41 years (31.2–49.8) in the high SF group, suggesting an age range unlikely to be significantly influenced by menopause, which occurs on average between 48 and 50 years in women [96].
In the present study, individuals with high SF clustered multiple abnormalities, including obesity, hyperglycemia, IR, and liver injury, predominantly in men. This pattern is clearly highlighted by the PCoA analysis, which showed that high SF individuals differed in terms of adiposity, metabolism, and physical activity, without differences in dietary intake, compared to normal SF subjects.
Regarding the limitations of our study, we note the small sample size, which may influence statistical analyses, particularly logistic regression. To address this, we applied the PCoA method, which is useful for reconciling multivariate data and establishing relationships based on similarities or dissimilarities. This approach is particularly advantageous when dealing with complex relationships among multiple variables, as in our dataset. Additionally, 24HR analysis has limitations, especially for assessing micronutrient intake, as noted by Raina [97]. Nevertheless, dietary data collection was of secondary importance in this study, and 24HR is a method widely used in clinical practice. Finally, measuring serum IL-6, serum iron, and transferrin would be valuable to further consolidate our findings. Despite these limitations, our results are consistent with other studies that used larger sample sizes [81] and more specific clinical and molecular biomarkers [98,99].
5. Conclusions
In conclusion, individuals with high SF levels are predominantly male, obese, and exhibit increased fat deposition, IR, higher carbohydrate intake, and metabolic abnormalities, leading to a higher prevalence of MS and liver injury. We suggest that SF levels, along with other iron-related biomarkers, could be used as diagnostic indicators for obesity-associated conditions, particularly liver dysfunction such as MASLD.
Author Contributions
Conceptualization, K.Z. and S.G.; investigation, K.Z. and S.G..; validation, K.Z. and S.G.; writing—original draft, K.Z and S.G..; writing—review and editing, K.Z., M.F.N.; E.A.K and S.G. All authors have read and agreed to the published version of the manuscript.
Funding
CNPq Nº 4/2021 - Research Productivity Grants–PQ. Universidade Estadual do Oeste do Paraná (UNIOESTE). CNPJ: 78680337000184. Splenic and vagal participation in the anti-obesity effects of physical exercise: a possible role in iron homeostasis. Process: 314626/2021-2.
Institutional Review Board Statement
The study was conducted in accordance with the Declaration of Helsinki, and approved by or Ethics Committee of Universidade Federal da Fronteira Sul (UFFS) (41154814.7.0000.5564; 01 Dec 2022).
Informed Consent Statement
Informed consent was obtained from all subjects involved in the study.
Data Availability Statement
The original contributions presented in this study are included in the article. Further inquiries can be directed to the corresponding author(s).
Conflicts of Interest
The authors declare no conflicts of interest.
Appendix A
Appendix A.1
Data supplemental.

Table A1.
Distribution of participants' biochemical parameters according to SF classification (normal vs. high). Brazil, 2023-2024.
Table A1.
Distribution of participants' biochemical parameters according to SF classification (normal vs. high). Brazil, 2023-2024.
| Variable | Category | SF Normal | SF High | p- value |
|---|---|---|---|---|
| SBP (mmHg) | - | 117.5 (107.2–127) | 132 (113.2–140.2) | 0.952b |
| DBP (mmHg) | - | 74.5 (68.2–80.8) | 81 (68.5–86.8) | 0.394b |
| Glucose (mg/dL) | - | 77 (72–89) | 87 (80.2–97) | 0.127b |
| TG (mg/dL) |
- | 86 (61.5–117) | 114.5 (88.2–190.2) | 0.788b |
| TyG | - | 4.4 (4.2–4.6) | 4.6 (4.5–4.9) | 0.927b |
| TC (mg/dL) | - | 170.8 (147–192.5) | 185 (156.2–203) | 0.788b |
| HDL (mg/dL) | - | 45 (41–48) | 40 (38–44.8) | 0.909b |
| LDL (mg/dL) | - | 105.4 (81.9–124.7) | 105.7 (90.2–128.2) | 0.927b |
| AST (U/L) | - | 27 (21–34) | 29 (22–38) | 0.679b |
| ALT (U/L) | - | 20 (15–25.8) | 26 (20–35.6) | 0.630b |
| FIB4 | - | 0.7 (0.5–1.2) | 0.9 (0.7–1.1) | 0.315b |
| UA (mg/dl) | - | 4.2 (3.2–4.9) | 4.8 (3.6–6.1) | 0.648b |
| ESR (mm) | - | 15 (10–24.8) | 12 (10–16) | 0.206b |
| Platelets (mil/mm3) | - | 235 (209–283) | 249 (221–266) | 0.436b |
| Leukocytes (mm3) | - | 6400 (5550–7800) | 6400 (5599.8–8950) | 0.788b |
| Rod neutrophils (mm3) | - | 57 (40–72) | 61 (0–75) | 0.836b |
| Eosinophils(mm3) | - | 144 (104–226.5) | 137 (69.2–191.2) | 0.648b |
| Segmented neutrophils (mm3) | - | 3510 (3000–4298) | 3650 (2669–4929) | 0.788b |
| Monocytes (mm3) | - | 300 (220–388) | 312 (252–456) | 0.527b |
| Lymphocytes (mm3) | - | 2280 (1912–2668.5) | 2171.,5 (2018–2606.8) | 0.927b |
| HSI | - | 34.2 (30.9–38.6) | 39.9 (35.5–45.4) | 0.788b |
Note: SF (serum ferritin); SBP (systolic blood pressure); DBP (diastolic blood pressure); TG (triglycerides); TC (total cholesterol); HDL (high density lipoprotein); LDL (low density lipoprotein); AST (aspartate transaminase), ALT (alanine aminotransferase); FIB 4 (hepatic fibrose fator); UA (uric acid); ESR (erythrocyte sedimentation rate); HSI (hepatic steatosis index). Median (Quartile 1–Quartile 3). bMann-Whitney U test. Bold values indicate statistically significant contribution (p<0.05).
Table A2.
Distribution of food groups from the participants' Food Frequency Questionnaire (FFQ) according to the SF classification (normal vs. high). Brazil. 2023-2024.
Table A2.
Distribution of food groups from the participants' Food Frequency Questionnaire (FFQ) according to the SF classification (normal vs. high). Brazil. 2023-2024.
| Variable | Category | SF Normal | SF High | p- value |
|---|---|---|---|---|
| Cookies, cakes | Never or rarely | 15 (20.8%) | 7 (18.4%) | 0.744a |
| Monthly | 12 (16.7%) | 4 (10.5%) | ||
| Weekly | 34 (47.2%) | 19 (50%) | ||
| Daily | 11 (15.3%) | 8 (21.1%) | ||
| Masses | Never or rarely | 5 (6.9%) | 4 (10.5%) | 0.534b |
| Monthly | 9 (12.5%) | 5 (13.2%) | ||
| Weekly | 55 (76.4%) | 25 (65.8%) | ||
| Daily | 3 (4.2%) | 4 (10.5%) | ||
| Whole grains | Never or rarely | 32 (44.4%) | 13 (34.2%) | 0.257b |
| Monthly | 3 (4.2%) | 3 (7.9%) | ||
| Weekly | 26 (36.1%) | 11 (28.9%) | ||
| Daily | 11 (15.3%) | 11 (28.9%) | ||
| Candy | Never or rarely | 12 (16.7%) | 6 (16.2%) | 0.091b |
| Monthly | 5 (6.9%) | 6 (16.2%) | ||
| Weekly | 31 (43.1%) | 20 (54.1%) | ||
| Daily | 24 (33.3%) | 5 (13.5%) | ||
| Butter, bacon, lard, lard | Never or rarely | 29 (40.8%) | 11 (29.7%) | 0.212b |
| Monthly | 3 (4.2%) | 3 (8.1%) | ||
| Weekly | 17 (23.9%) | 15 (40.5%) | ||
| Daily | 22 (31%) | 8 (21.6%) | ||
| Margarine, mayonnaise | Never or rarely | 34 (47.2%) | 14 (37.8%) | 0.428b |
| Monthly | 3 (4.2%) | 0 (0%) | ||
| Weekly | 20 (27.8%) | 13 (35.1%) | ||
| Daily | 15 (20.8%) | 10 (27%) | ||
| Snacks | Never or rarely | 13 (18.1%) | 7 (18.9%) | 0.426b |
| Monthly | 29 (40.3%) | 9 (24.3%) | ||
| Weekly | 28 (38.9%) | 19 (51.4%) | ||
| Daily | 2 (2.8%) | 2 (5.4%) | ||
| Preserved food | Never or rarely | 46 (63.9%) | 21 (56.8%) | 0.8b |
| Monthly | 13 (18.1%) | 6 (16.2%) | ||
| Weekly | 12 (16.7%) | 9 (24.3%) | ||
| Daily | 1 (1.4%) | 1 (2.7%) | ||
| Fried foods | Never or rarely | 28 (38.9%) | 11 (29.7%) | 0.675b |
| Monthly | 10 (13.9%) | 8 (21.6%) | ||
| Weekly | 29 (40.3%) | 16 (43.2%) | ||
| Daily | 5 (6.9%) | 2 (5.4%) | ||
| Vegetables | Never or rarely | 4 (5.6%) | 2 (5.4%) | 0.663b |
| Monthly | 1 (1.4%) | 1 (2.7%) | ||
| Weekly | 25 (34.7%) | 17 (45.9%) | ||
| Daily | 42 (58.3%) | 17 (45.9%) | ||
| Beans | Never or rarely | 3 (4.2%) | 0 (0%) | 0.287b |
| Monthly | 2 (2.8%) | 3 (7.9%) | ||
| Weekly | 23 (31.9%) | 15 (39.5%) | ||
| Daily | 44 (61.1%) | 20 (52.6%) | ||
| Leafy greens | Never or rarely | 3 (4.2%) | 2 (5.4%) | 1b |
| Monthly | 1 (1.4%) | 0 (0%) | ||
| Weekly | 20 (27,8%) | 11 (29.7%) | ||
| Daily | 48 (66.7%) | 24 (64.9%) | ||
| Tubers | Never or rarely | 3 (4.2%) | 1 (2.7%) | 0.702b |
| Monthly | 2 (2.8%) | 2 (5.4%) | ||
| Weekly | 55 (76.4%) | 25 (67.6%) | ||
| Daily | 12 (16.7%) | 9 (24.3%) | ||
| Fruits | Never or rarely | 1 (1.4%) | 3 (8.1%) | 0.376b |
| Monthly | 1 (1.4%) | 1 (2.7%) | ||
| Weekly | 21 (29.2%) | 9 (24.3%) | ||
| Daily | 49 (68.1%) | 24 (64.9%) | ||
| Soft drinks, juices | Never or rarely | 28 (38.9%) | 18 (48.6%) | 0.557b |
| Monthly | 6 (8.3%) | 1 (2.7%) | ||
| Weekly | 30 (41.7%) | 13 (35.1%) | ||
| Daily | 8 (11.1%) | 5 (13.5%) | ||
| Sweetener | Never or rarely | 66 (91.7%) | 33 (89.2%) | 1b |
| Weekly | 1 (1.4%) | 1 (2.7%) | ||
| Daily | 5 (6.9%) | 3 (8.1%) | ||
| Diet e light | Never or rarely | 69 (95.8%) | 31 (83.8%) | 0.073b |
| Monthly | 2 (2.8%) | 2 (5.4%) | ||
| Weekly | 1 (1.4%) | 2 (5.4%) | ||
| Daily | 0 (0%) | 2 (5.4%) | ||
| Ready-made seasonings | Never or rarely | 53 (73.6%) | 28 (75.7%) | 0.681b |
| Monthly | 1 (1.4%) | 2 (5.4%) | ||
| Weekly | 6 (8.3%) | 3 (8.1%) | ||
| Daily | 12 (16.7%) | 4 (10.8%) | ||
| Sugar | Never or rarely | 21 (29.2%) | 15 (40.5%) | 0.024b |
| Monthly | 0 (0%) | 3 (8.1%)# | ||
| Weekly | 18 (25%) | 4 (10.8%) | ||
| Daily | 33 (45.8%) | 15 (40.5%) | ||
| Oilseeds | Never or rarely | 36 (50%) | 16 (43.2%) | 0.857a |
| Monthly | 9 (12.5%) | 6 (16.2%) | ||
| Weekly | 16 (22.2%) | 10 (27%) | ||
| Daily | 11 (15.3%) | 5 (13.5%) |
Note: SF (Serum Ferritin). Absolute frequency (Relative frequencies %). aChi-square for independence. bMonte Carlo method. Bold values indicate statistically significant contribution (p<0.05). #represent categories with significant differences based on adjusted residuals (p>1.96).
References
- Alshwaiyat, N.; Ahmad, A.; Wan Hassan, W. M. R.; Al-Jamal, H. Association between obesity and iron deficiency (Review). Exp. Ther. Med. 2021, 22, 1–7. [Google Scholar] [CrossRef] [PubMed]
- Jomova, K.; Valko, M. Importance of iron chelation in free radical-induced oxidative stress and human disease. Curr. Pharm. Des. 2011, 17, 3460–3473. [Google Scholar] [CrossRef] [PubMed]
- Nairz, M.; Weiss, G. Iron in health and disease. Mol. Asp. Med. 2020, 75, 1–2. [Google Scholar] [CrossRef]
- Knovich, M. A.; Storey, J. A.; Coffman, L. G.; Torti, S. V.; Torti, F. M. Ferritin for the clinician. Blood Rev. 2009, 23, 95–104. [Google Scholar] [CrossRef] [PubMed]
- Sandnes, M.; Ulvik, R.J.; Vorland, M.; Reikvam, H. Hyperferritinemia-A Clinical Overview. J Clin Med. 2021, 7, 10–2008. [Google Scholar] [CrossRef]
- Ding, X.; Bian, N.; Wang, J.; Chang, X.; An, Y.; Wang, G.; Liu. J. Serum Ferritin Levels Are Associated with Adipose Tissue Dysfunction-Related Indices in Obese Adults. Biol Trace Elem Res. 2023, 201, 636–643. [Google Scholar] [CrossRef]
- Liu, J.; Li, Q.; Yang, Y.; Ma, L. Iron metabolism and type 2 diabetes mellitus: A meta-analysis and systematic review. J Diabetes Investig. 2020, 11, 946–955. [Google Scholar] [CrossRef]
- Fonseca, Ó.; Ramos, A.S.; Gomes, L.T.S.; Gomes, M.S.; Moreira, A.C. New Perspectives on Circulating Ferritin: Its Role in Health and Disease. Molecules 2023, 28, 7707. [Google Scholar] [CrossRef]
- Ganz, T. Macrophages and Iron Metabolism. Microbiol. Spectr. 2016, 4, 1–10. [Google Scholar] [CrossRef]
- Cohen, L.A.; Gutierrez, L.; Weiss, A.; Leichtmann-Bardoogo, Y.; Zhang, D. L.; Crooks, D. R.; Sougrat, R.; Morgenstern, A.; Galy, B.; Hentze, M. W.; Lazaro, F. J.; Rouault, T. A.; Meyron-Holtz, E. G. Serum ferritin is derived primarily from macrophages through a nonclassical secretory pathway. Blood. 2010, 116, 1574–84. [Google Scholar] [CrossRef]
- Valenti, L.; Corradini, E.; Adams, L.A.; Aigner, E.; Alqahtani, S.; Arrese, M.; et al. Consensus Statement on the definition and classification of metabolic hyperferritinaemia. Nat Rev Endocrinol. 2023, 19, 299–310. [Google Scholar] [CrossRef] [PubMed]
- Caputo, T.; Gilardi, F.; Desvergne, B. From chronic overnutrition to metaflammation and insulin resistance: adipose tissue and liver contributions. FEBS Lett. 2017, 591, 3061–3088. [Google Scholar] [CrossRef] [PubMed]
- NCD Risk Factor Collaboration (NCD-RisC). Worldwide trends in underweight and obesity from 1990 to 2022: a pooled analysis of 3663 population-representative studies with 222 million children, adolescents, and adults. Lancet. 2024, 403, 1027–1050. [Google Scholar] [CrossRef] [PubMed]
- González-Domínguez, Á.; Visiedo-Garcí, F. M.; Domínguez-Riscart, J.; González-Domínguez, R.; Mateos, R. M.; Lechuga-Sancho, A. M. Iron Metabolism in Obesity and Metabolic Syndrome. Int J Mol Sci. 2020, 21, 5529. [Google Scholar] [CrossRef]
- Rubino, F.; Cummings, D. E.; Eckel, R. H.; Cohen, R.V.; Wilding, J. P. H.; Bown, W. A.; et al. Definition and diagnostic criteria of clinical obesity. Lancet Diabetes Endocrinol. 2025, 13, 221–262. [Google Scholar] [CrossRef]
- Kawai, T.; Autieri, M. V, Scalia, R. Adipose tissue inflammation and metabolic dysfunction in obesity. Am J Physiol Cell Physiol. 2021, 320, C375–C391. [Google Scholar] [CrossRef]
- Eslam, M.; Newsome, P. N.; Sarin, S. K.; Anstee, Q. M.; Targher, G.; Romero-Gomez, M.; et al. A new definition for metabolic dysfunction-associated fatty liver disease: An international expert consensus statement. J Hepatol. 2020, 73, 202–209. [Google Scholar] [CrossRef]
- Anderson, E. R.; Shah, Y. M. Iron homeostasis in the liver. Compr Physiol. 2013, 3, 315–30. [Google Scholar] [CrossRef]
- Purdy, J. C.; Shatzel, J. J. The hematologic consequences of obesity. Eur J Haematol. 2021, 106, 306–319. [Google Scholar] [CrossRef]
- Camaschella, C.; Nai, A.; Silvestri, L. Iron metabolism and iron disorders revisited in the hepcidin era. Haematologica. 2020, 105, 260–272. [Google Scholar] [CrossRef]
- Sakurai, Y.; Kubota, N.; Yamauchi, T.; Kadowaki, T. Role of Insulin Resistance in MAFLD. Int J Mol Sci. 2021, 22, 4156. [Google Scholar] [CrossRef] [PubMed]
- Jehn, M.; Clark, J. M, Guallar, E. Serum ferritin and risk of the metabolic syndrome in U.S. adults. Diabetes Care. 2004, 27, 2422–2428. [Google Scholar] [CrossRef] [PubMed]
- Chang, J. S.; Lin, S. M.; Huang, T. C.; Chao, J.C.; Chen, Y. C.; Pan, W. H.; Bai, C. H. Serum ferritin and risk of the metabolic syndrome: a population-based study. Asia Pac J Clin Nutr. 2013, 22, 400–407. [Google Scholar] [CrossRef] [PubMed]
- Yu, Y.; Jiang, L.; Wang, H.; Shen, Z.; Cheng, Q.; Zhang, P.; Wang, J.; Wu, Q.; Fang, X.; Duan, L.; Wang, S.; Wang, K.; An, P.; Shao, T.; Chung, R. T.; Zheng, S.; Min, J.; Wang, F. Hepatic transferrin plays a role in systemic iron homeostasis and liver ferroptosis. Blood. 2020, 136, 726–739. [Google Scholar] [CrossRef]
- Ru, Q. , Li, Y., Chen, L. Iron homeostasis and ferroptosis in human diseases: mechanisms and therapeutic prospects. Sig Transduct Target Ther. [CrossRef]
- Mo, M.; Pan. L.; Deng, L.; Liang. M.; Xia, N.; Liang, Y. Iron Overload Induces Hepatic Ferroptosis and Insulin Resistance by Inhibiting the Jak2/stat3/slc7a11 Signaling Pathway. Cell Biochem Biophys. 2024, 82, 2079–2094. [Google Scholar] [CrossRef]
- Sandnes, M.; Ulvik, R.J.; Vorland, M.; Reikvam, H. Hyperferritinemia-A Clinical Overview. J Clin Med. 2021, 10, 2008. [Google Scholar] [CrossRef]
- Wang, H.; Sun, R.; Yang, S.; Ma, X.; Yu, C. Association between serum ferritin level and the various stages of non-alcoholic fatty liver disease: a systematic review. Front Med (Lausanne) 2022, 9, 1–25. [Google Scholar] [CrossRef]
- Yoon, S. U.; Cho, H. J. Body iron, serum ferritin, and nonalcoholic fatty liver disease. Korean J Hepatol, 2012, 18, 105–107. [Google Scholar] [CrossRef]
- WHO. Guideline on Use of Ferritin Concentrations to Assess Iron Status in Individuals and Populations; World Health Organization: Geneva, 2020. [Google Scholar]
- ABEP. Critério de Classificação Econômica Brasil [Internet]; Associação Brasileira de Empresas de Pesquisa: São Paulo, 2022. [Google Scholar]
- WHO. Guidelines on Physical Activity and Sedentary Behaviour [Internet]; World Health Organization: Geneva, 2020. [Google Scholar]
- Barroso, W. K. S.; et al. Diretrizes Brasileiras de Hipertensão Arterial – 2020. Arq. Bras. Cardiol. 2021, 116, 516–658. [Google Scholar] [CrossRef]
- Cotrim, H. P.; Parise, E. R.; Figueiredo-Mendes, C.; Galizzi-Filho, J.; Porta, G.; Oliveira, C. P. Nonalcoholic fatty liver disease Brazilian society of hepatology consensus. Arq Gastroenterol. 2016, 53, 118–22. [Google Scholar] [CrossRef]
- Malta, D. C.; Gomes, C. S.; Almeida Alves, F. T.; Vasconcelos de Oliveira, P. P.; de Freitas, P. C.; Andreazzi, M. O uso de cigarro, narguilé, cigarro eletrônico e outros indicadores do tabaco entre escolares brasileiros: dados da Pesquisa Nacional de Saúde do Escolar 2019. Rev. Bras. Epidemiol. 2022, 25, e220014. [Google Scholar] [CrossRef] [PubMed]
- Gordon, C. C.; Chumlea, W. C.; Roche, A. F. Weight. In Anthropometric Standardization Reference Manual; Lohman, T. G., Roche, A. F., Martorell, R., Eds.; Human Kinetics Books: Champaign, IL, 1988. [Google Scholar]
- WHO. Obesity: Preventing and Managing the Global Epidemic. Report of a WHO Consultation. World Health Organization Technical Report Series 2000, 894, 1–253.
- Callaway, C. W. Anthropometric Measurements. In Anthropometric Standardization Reference Manual; Lohman, T. G., Roche, A. F., Martorell, R., Eds.; Human Kinetics Books: Champaign, IL, 1988. [Google Scholar]
- Biodynamics Corporation. Manual de Instrução do Monitor de Composição Corporal Biodynamics Modelo 450, Version v.5.1, International; TBW: São Paulo, 2007. [Google Scholar]
- Lohman, T. G. Advances in Body Composition Assessment: Current Issues in Exercise Science; Human Kinetics Publishers: Champaign, IL, 1992. [Google Scholar]
- Friedewald, W. T.; Levy, R. I.; Fredrickson, D. S. Estimation of the Concentration of Low-Density Lipoprotein Cholesterol in Plasma, without Use of the Preparative Ultracentrifuge. Clin. Chem. 1972, 18, 499–502. [Google Scholar] [CrossRef] [PubMed]
- Guerrero-Romero, F.; Villalobos-Molina, R.; Jiménez-Flores, J. R.; Simental-Mendía, L. E.; Méndez-Cruz, R.; Murguía-Romero, M.; Rodríguez-Morán, L. Fasting Triglycerides and Glucose Index as a Diagnostic Test for Insulin Resistance in Young Adults. Arch. Med. Res. 2016, 47, 382–387. [Google Scholar] [CrossRef]
- Simental-Mendía, L. E.; Guerrero-Romero, F. The Correct Formula for the Triglycerides and Glucose Index. Eur. J. Pediatr. 2020, 179, 1171. [Google Scholar] [CrossRef]
- Kratz, A.; Plebani, M.; Peng, M.; Lee, Y. K.; McCafferty, R.; Machin, S. J.; et al. ICSH Recommendations for Modified and Alternate Methods Measuring the Erythrocyte Sedimentation Rate. Int. J. Lab. Hematol. 2017, 39, 448–457. [Google Scholar] [CrossRef]
- International Diabetes Federation (IDF). The IDF Consensus Worldwide Definition of the Metabolic Syndrome; IDF Communications: Belgium, 2006. [Google Scholar]
- Précoma, D. B.; Oliveira, G. M. M.; Simão, A. F.; Dutra, O. P.; Coelho, O. R.; Izar, M. C. O.; et al. Updated Cardiovascular Prevention Guideline of the Brazilian Society of Cardiology - 2019. Arq Bras Cardiol. 2019, 113, 787–891. [Google Scholar] [CrossRef]
- Wetteland, P.; Roger, M.; Solberg, H. E.; Iversen, O. H. Population-Based Erythrocyte Sedimentation Rates in 3,910 Subjectively Healthy Norwegian Adults: A Statistical Study Based on Men and Women from the Oslo Area. J. Intern. Med. 1996, 240, 125–131. [Google Scholar] [CrossRef]
- Khedr, D.; Nabil, S.; Abdulrazek, A. A.; Abdelnaby, A.; Lotfy, S. The C-Reactive Protein/Albumin Ratio as an Early Diagnostic Marker of Neonatal Sepsis in Preterm Neonates: A Case-Control Study. Pediatr. Sci. J. 2024, 4, 103–110. [Google Scholar] [CrossRef]
- Lee, J. H.; Kim, D.; Kim, H. J.; Lee, C. H.; Yang, J. I.; Kim, W.; et al. Hepatic Steatosis Index: A Simple Screening Tool Reflecting Nonalcoholic Fatty Liver Disease. Dig. Liver Dis. 2010, 42, 503–508. [Google Scholar] [CrossRef]
- Shah, A. G.; Lydecker, A.; Murray, K.; Tetri, B. N.; Contos, M. J.; Sanyal, A. J.; et al. Use of the FIB-4 Index for Non-Invasive Evaluation of Fibrosis in Nonalcoholic Fatty Liver Disease. Clin. Gastroenterol. Hepatol. 2009, 7, 7–1104. [Google Scholar] [CrossRef]
- Instituto Brasileiro de Geografia e Estatística (IBGE). Pesquisa de Orçamentos Familiares (POF 2008-2009): tabela de medidas referidas para os alimentos consumidos no Brasil; Rio de Janeiro, 2011. https://biblioteca.ibge.gov.br/visualizacao/livros/liv50000.pdf (accessed , 2023). 20 May.
- Pinheiro, A. B. V.; Lacerda, E. M.; Benzecry, E. H.; et al. Tabela para Avaliação Alimentar em Medidas Caseiras, 5th ed.; Atheneu: São Paulo, 2008. [Google Scholar]
- Tabela Brasileira de Composição de Alimentos (TBCA); Universidade de São Paulo (USP), Food Research Center (FoRC): São Paulo, 2023. Available online: http://www.fcf.usp.br/tbca (accessed on day month year).
- Monsen, E. R.; Hallberg, L.; Layrisse, M.; Hegsted, M. D.; Cook, J. D.; Mertz, W.; Finch, C. A. Estimation of Available Dietary Iron. Am. J. Clin. Nutr. 1978, 31(1), 134–141. [Google Scholar] [CrossRef]
- Datz, C.; Müller, E.; Aigner, E. Iron overload and non-alcoholic fatty liver disease. Minerva Endocrinol. 2016, 42, 173–183. [Google Scholar] [CrossRef]
- Shang, X.; Zhang, R.; Wang, X.; Yao, J.; Zhao, X.; Li, H. The relationship of hyperferritinemia to metabolism and chronic complications in type 2 diabetes. Diabetes Metab. Syndr. Obes.: Targets Ther. 2022, 15, 175–182. [Google Scholar] [CrossRef]
- Huenur, J. F.; Parodi Cruzat, M.; Aravena González, C.; Eymin Lago, G.; Triantafilo Cerda, N.; Walkowiak Navas, S.; Valenzuela Suárez, A.; Corsi Sotelo, O. Hyperferritinemia in a Chilean Academic Healthcare Network: A Retrospective Study. Rev. Méd. Chile 2023, 151, 412–419. [Google Scholar] [CrossRef]
- Akgun, Y. Association Between Race and Blood Ferritin Level of Whole Blood Donors. Cureus. 2025, 17, e82926. [Google Scholar] [CrossRef] [PubMed]
- Shang, X.; Zhang, R.; Wang, X.; Yao, J.; Zhao, X.; Li, H. The Relationship of Hyperferritinemia to Metabolism and Chronic Complications in Type 2 Diabetes. Diabetes Metab. Syndr. Obes.: Targets Ther. 2022, 15, 175–182. [Google Scholar] [CrossRef] [PubMed]
- Ding, J.; Xu, Z.; Liang, R.; Xie, S. Association Between Dietary Inflammatory Index and Triglyceride Glucose-Body Mass Index with Iron Deficiency in Reproductive Age Women: Evidence from NHANES 2005–2018. Int. J. Women's Health 2025, 17, 355–367. [Google Scholar] [CrossRef]
- Thiele, S.; Mensink, G. B.; Beitz, R. Determinants of Diet Quality. Public Health Nutr. 2004, 7, 29–37. [Google Scholar] [CrossRef]
- Hiza, H. A.; Casavale, K. O.; Guenther, P. M.; Davis, C. A. Diet Quality of Americans Differs by Age, Sex, Race/Ethnicity, Income, and Education Level. J. Acad. Nutr. Diet. 2013, 113, 297–306. [Google Scholar] [CrossRef]
- Milman, N.; Kirchhoff, M. Relationship Between Serum Ferritin, Alcohol Intake, and Social Status in 2235 Danish Men and Women. Ann. Hematol. 1996, 72, 145–151. [Google Scholar] [CrossRef]
- Koppe, T.; Doneda, D.; Siebert, M.; Paskulin, L.; Camargo, M.; Tirelli, K. M.; Vairo, F.; Daudt, L.; Schwartz, I. V. The Prognostic Value of the Serum Ferritin in a Southern Brazilian Cohort of Individuals with Gaucher Disease. Genet. Mol. Biol. 2016, 39, 30–34. [Google Scholar] [CrossRef] [PubMed]
- Park, S. K.; Ryoo, J. H.; Kim, M. G.; Shin, J. Y. Association of Serum Ferritin and the Development of Metabolic Syndrome in Middle-Aged Korean Men: A 5-Year Follow-Up Study. Diabetes Care 2012, 35, 2521–2526. [Google Scholar] [CrossRef] [PubMed]
- Iglesias-Vázquez, L.; Arija, V.; Aranda, N.; et al. Factors Associated with Serum Ferritin Levels and Iron Excess: Results from the EPIC-EurGast Study. Eur. J. Nutr. 2022, 61, 101–114. [Google Scholar] [CrossRef] [PubMed]
- Hu, P. J.; Ley, S. H.; Bhupathiraju, S. N.; Li, Y.; Wang, D. D. Associations of Dietary, Lifestyle, and Sociodemographic Factors with Iron Status in Chinese Adults: A Cross-Sectional Study in the China Health and Nutrition Survey. Am. J. Clin. Nutr. 2017, 105, 503–512. [Google Scholar] [CrossRef]
- Suárez-Ortegón, M. F.; Ensaldo-Carrasco, E.; Shi, T.; McLachlan, S.; Fernández-Real, J. M.; Wild, S. H. Ferritin, Metabolic Syndrome and Its Components: A Systematic Review and Meta-Analysis. Atherosclerosis 2018, 275, 97–106. [Google Scholar] [CrossRef]
- Miao, R.; Fang, X.; Zhang, Y.; Wei, J.; Zhang, Y.; Tian, J. Iron Metabolism and Ferroptosis in Type 2 Diabetes Mellitus and Complications: Mechanisms and Therapeutic Opportunities. Cell Death Dis. 2023, 14, 186. [Google Scholar] [CrossRef]
- Stockwell, B. R.; Friedmann Angeli, J. P.; Bayir, H.; Bush, A. I.; Conrad, M.; Dixon, S. J.; Fulda, S.; Gascón, S.; Hatzios, S. K.; Kagan, V. E.; et al. Ferroptosis: A Regulated Cell Death Nexus Linking Metabolism, Redox Biology, and Disease. Cell 2017, 171, 273–285. [Google Scholar] [CrossRef]
- Tsuchiya, H.; Ebata, Y.; Sakabe, T.; Hama, S.; Kogure, K.; Shiota, G. High-Fat, High-Fructose Diet Induces Hepatic Iron Overload via a Hepcidin-Independent Mechanism Prior to the Onset of Liver Steatosis and Insulin Resistance in Mice. Metabolism 2013, 62, 62–69. [Google Scholar] [CrossRef]
- Chen, S. C. C.; Huang, Y. F.; Wang, J. D. Hyperferritinemia and Hyperuricemia May Be Associated with Liver Function Abnormality in Obese Adolescents. PLoS ONE 2012, 7, e48645. [Google Scholar] [CrossRef]
- Ghio, A. J.; Ford, E. S.; Kennedy, T. P.; Hoidal, J. R. The Association Between Serum Ferritin and Uric Acid in Humans. Free Radic. Res. 2005, 39, 337–342. [Google Scholar] [CrossRef] [PubMed]
- Lombardi, R.; Pisano, G.; Fargion, S. Role of Serum Uric Acid and Ferritin in the Development and Progression of NAFLD. Int. J. Mol. Sci. 2016, 17, 548. [Google Scholar] [CrossRef]
- Bae, M.; Kim, K. M.; Jin, M. H.; Yoon, J. H. Synergistic Impact of Serum Uric Acid and Ferritin on MAFLD Risk: A Comprehensive Cohort Analysis. Sci. Rep. 2025, 15, 18936. [Google Scholar] [CrossRef] [PubMed]
- Mota, J. F.; Medina, W. L.; Moreto, F.; Burini, R. C. Influência da Adiposidade Sobre o Risco Inflamatório em Pacientes com Glicemia de Jejum Alterada. Rev. Nutr. 2009, 22, 351–357. [Google Scholar] [CrossRef]
- Moriles, K. E.; Zubair, M.; Azer, S. A. Alanine Aminotransferase (ALT) Test. In StatPearls [Internet]; StatPearls Publishing: Treasure Island (FL), 2025. [Google Scholar]
- He, A.; Zhou, Z.; Huang, L.; Yip, K. C.; Chen, J.; Yan, R.; Li, R. Association Between Serum Iron and Liver Transaminases Based on a Large Adult Women Population. J. Health Popul. Nutr. 2023, 42, 69. [Google Scholar] [CrossRef]
- Priego-Parra, B. A.; Triana-Romero, A.; Martínez-Pérez, G. P.; Reyes-Díaz, S. A.; Ordaz-Álvarez, H. R.; Bernal-Reyes, R.; et al. Hepatic Steatosis Index (HSI): A Valuable Biomarker in Subjects with Metabolic Dysfunction-Associated Fatty Liver Disease (MAFLD). Ann. Hepatol. 2024, 29, 101391. [Google Scholar] [CrossRef]
- Shah, R. A.; Kowdley, K. V. Serum Ferritin as a Biomarker for NAFLD: Ready for Prime Time? Hepatol. Int. 2019, 13, 110–112. [Google Scholar] [CrossRef]
- Armandi, A.; Sanavia, T.; Younes, R.; Caviglia, G. P.; Rosso, C.; Govaere, O.; et al. Serum Ferritin Levels Can Predict Long-Term Outcomes in Individuals with Metabolic Dysfunction-Associated Steatotic Liver Disease. Gut 2024, 73, 825–834. [Google Scholar] [CrossRef]
- Buzzetti, E.; Petta, S.; Manuguerra, R.; Luong, T. V.; Cabibi, D.; Corradini, E.; Craxì, A.; Pinzani, M.; Tsochatzis, E.; Pietrangelo, A. Evaluating the Association of Serum Ferritin and Hepatic Iron with Disease Severity in Non-Alcoholic Fatty Liver Disease. Liver Int. 2019, 39, 1662–1670. [Google Scholar] [CrossRef]
- Pietrangelo, A. Iron and the Liver. Liver Int. 2016, 36, 116–123. [Google Scholar] [CrossRef]
- Pellegrini, M.; Rahimi, F.; Boschetti, S.; Devecchi, A.; De Francesco, A.; Mancino, M. V.; Toppino, M.; Morino, M.; Fanni, G.; Ponzo, V.; Bo, S. Pre-operative Micronutrient Deficiencies in Individuals with Severe Obesity Candidates for Bariatric Surgery. J. Endocrinol. Investig. 2021, 44, 1413–1423. [Google Scholar] [CrossRef] [PubMed]
- Institute of Medicine. Dietary Reference Intakes: The Essential Guide to Nutrient Requirements; National Academies Press: Washington, DC, 2006. [Google Scholar] [CrossRef]
- Dutt, S.; Hamza, I.; Bartnikas, T. B. Molecular Mechanisms of Iron and Heme Metabolism. Annu. Rev. Nutr. 2022, 42, 311–335. [Google Scholar] [CrossRef] [PubMed]
- Piskin, E.; Cianciosi, D.; Gulec, S.; Tomas, M.; Capanoglu, E. Iron Absorption: Factors, Limitations, and Improvement Methods. ACS Omega 2022, 7, 20441–20456. [Google Scholar] [CrossRef] [PubMed]
- Young, I.; Parker, H. M.; Rangan, A.; Prvan, T.; Cook, R. L.; Donges, C. E.; Steinbeck, K. S.; O’Dwyer, N. J.; Cheng, H. L.; Franklin, J. L.; O’Connor, H. T. Association between Haem and Non-Haem Iron Intake and Serum Ferritin in Healthy Young Women. Nutrients 2018, 10, 81. [Google Scholar] [CrossRef]
- Teucher, B.; Olivares, M.; Cori, H. Enhancers of Iron Absorption: Ascorbic Acid and Other Organic Acids. Int. J. Vitam. Nutr. Res. 2004, 74, 403–419. [Google Scholar] [CrossRef]
- Weschenfelder, C.; Berryman, C. E.; Hennigar, S. R. Dietary Iron Intake and Obesity-Related Diseases. Curr. Diab. Rep. 2025, 25, 34. [Google Scholar] [CrossRef]
- Li, H. Iron and the Intestinal Microbiome. Adv Exp Med Biol. 2025, 1480, 345–360. [Google Scholar] [CrossRef]
- Badenhorst, C. E.; Dawson, B.; Cox, G. R.; Laarakkers, C. M.; Swinkels, D. W.; Peeling, P. Acute Dietary Carbohydrate Manipulation and the Subsequent Inflammatory and Hepcidin Responses to Exercise. Eur. J. Appl. Physiol. 2015, 115, 2521–2530. [Google Scholar] [CrossRef]
- Hayashi, N.; Ishibashi, A.; Iwata, A.; Yatsutani, H.; Badenhorst, C.; Goto, K. Influence of an Energy Deficient and Low Carbohydrate Acute Dietary Manipulation on Iron Regulation in Young Females. Physiol. Rep. 2022, 10, e15351. [Google Scholar] [CrossRef]
- Ludwig, D. S.; Ebbeling, C. B. The Carbohydrate-Insulin Model of Obesity: Beyond “Calories In, Calories Out.” JAMA Intern. Med. 2018, 178, 1098–1103. [CrossRef]
- Palmer, B. F.; Clegg, D. J. The Sexual Dimorphism of Obesity. Mol. Cell. Endocrinol. 2015, 402, 113–119. [Google Scholar] [CrossRef]
- Brasil. Ministério da Saúde. Manual de Atenção à Mulher no Climatério/Menopausa; Editora do Ministério da Saúde: Brasília, 2008. [Google Scholar]
- Raina, S. K. Limitations of 24-Hour Recall Method: Micronutrient Intake and the Presence of the Metabolic Syndrome. N. Am. J. Med. Sci. 2013, 5, 498. [Google Scholar] [CrossRef]
- Mörwald, K.; Aigner, E.; Bergsten, P.; Brunner, S. M.; Forslund, A.; Kullberg, J.; Ahlström, H.; Manell, H.; Roomp, K.; Schütz, S.; Zsoldos, F.; Renner, W.; Furthner, D.; Maruszczak, K.; Zandanell, S.; Weghuber, D.; Mangge, H. Serum Ferritin Correlates With Liver Fat in Male Adolescents With Obesity. Front. Endocrinol. (Lausanne) 2020, 18, 340. [Google Scholar] [CrossRef]
- Aguree, S.; Reddy, M. B. Inflammatory Markers and Hepcidin are Elevated but Serum Iron is Lower in Obese Women of Reproductive Age. Nutrients 2021, 13, 217. [Google Scholar] [CrossRef]
Figure 1.
Flowchart of study participant selection. SF (Serum Ferritin). Illustration created using Canva graphic software.
Figure 1.
Flowchart of study participant selection. SF (Serum Ferritin). Illustration created using Canva graphic software.
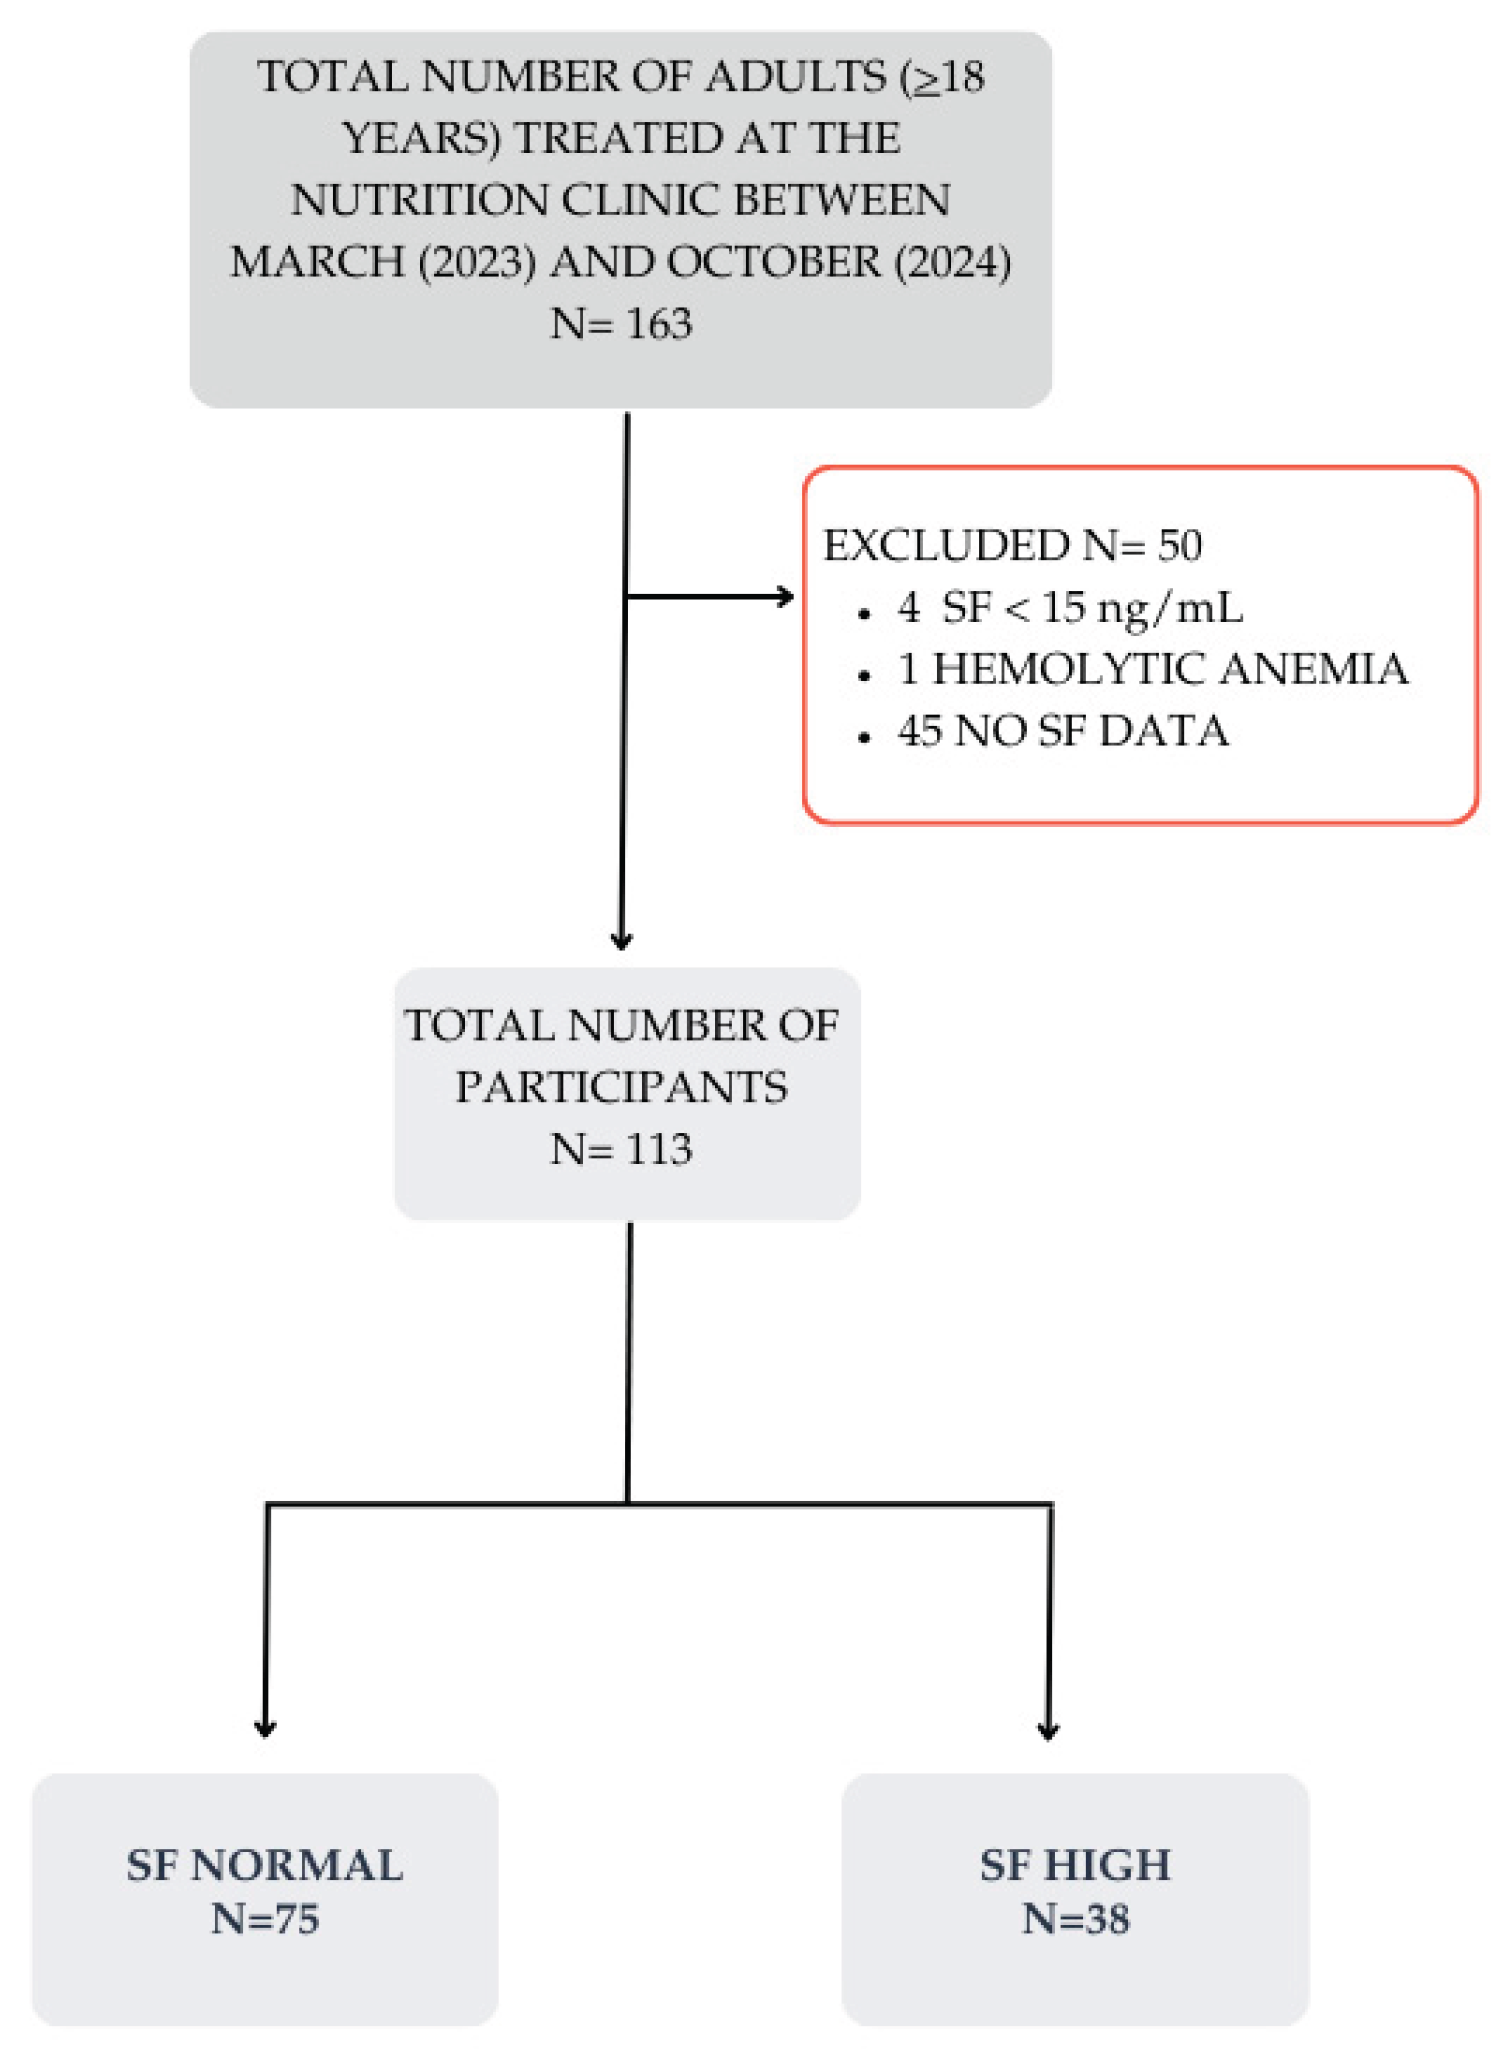
Figure 2.
Principal Coordinate Analysis (PCoA) plots representing the dissimilarity between individuals with normal (blue) and high (pink) ferritin based on four groups of variables: (A) Anthropometric, (B) Biochemical, (C) Dietary, and (D) Socioeconomic. PERMANOVA p-values less than 0.05 indicate statistically significant differences between groups.
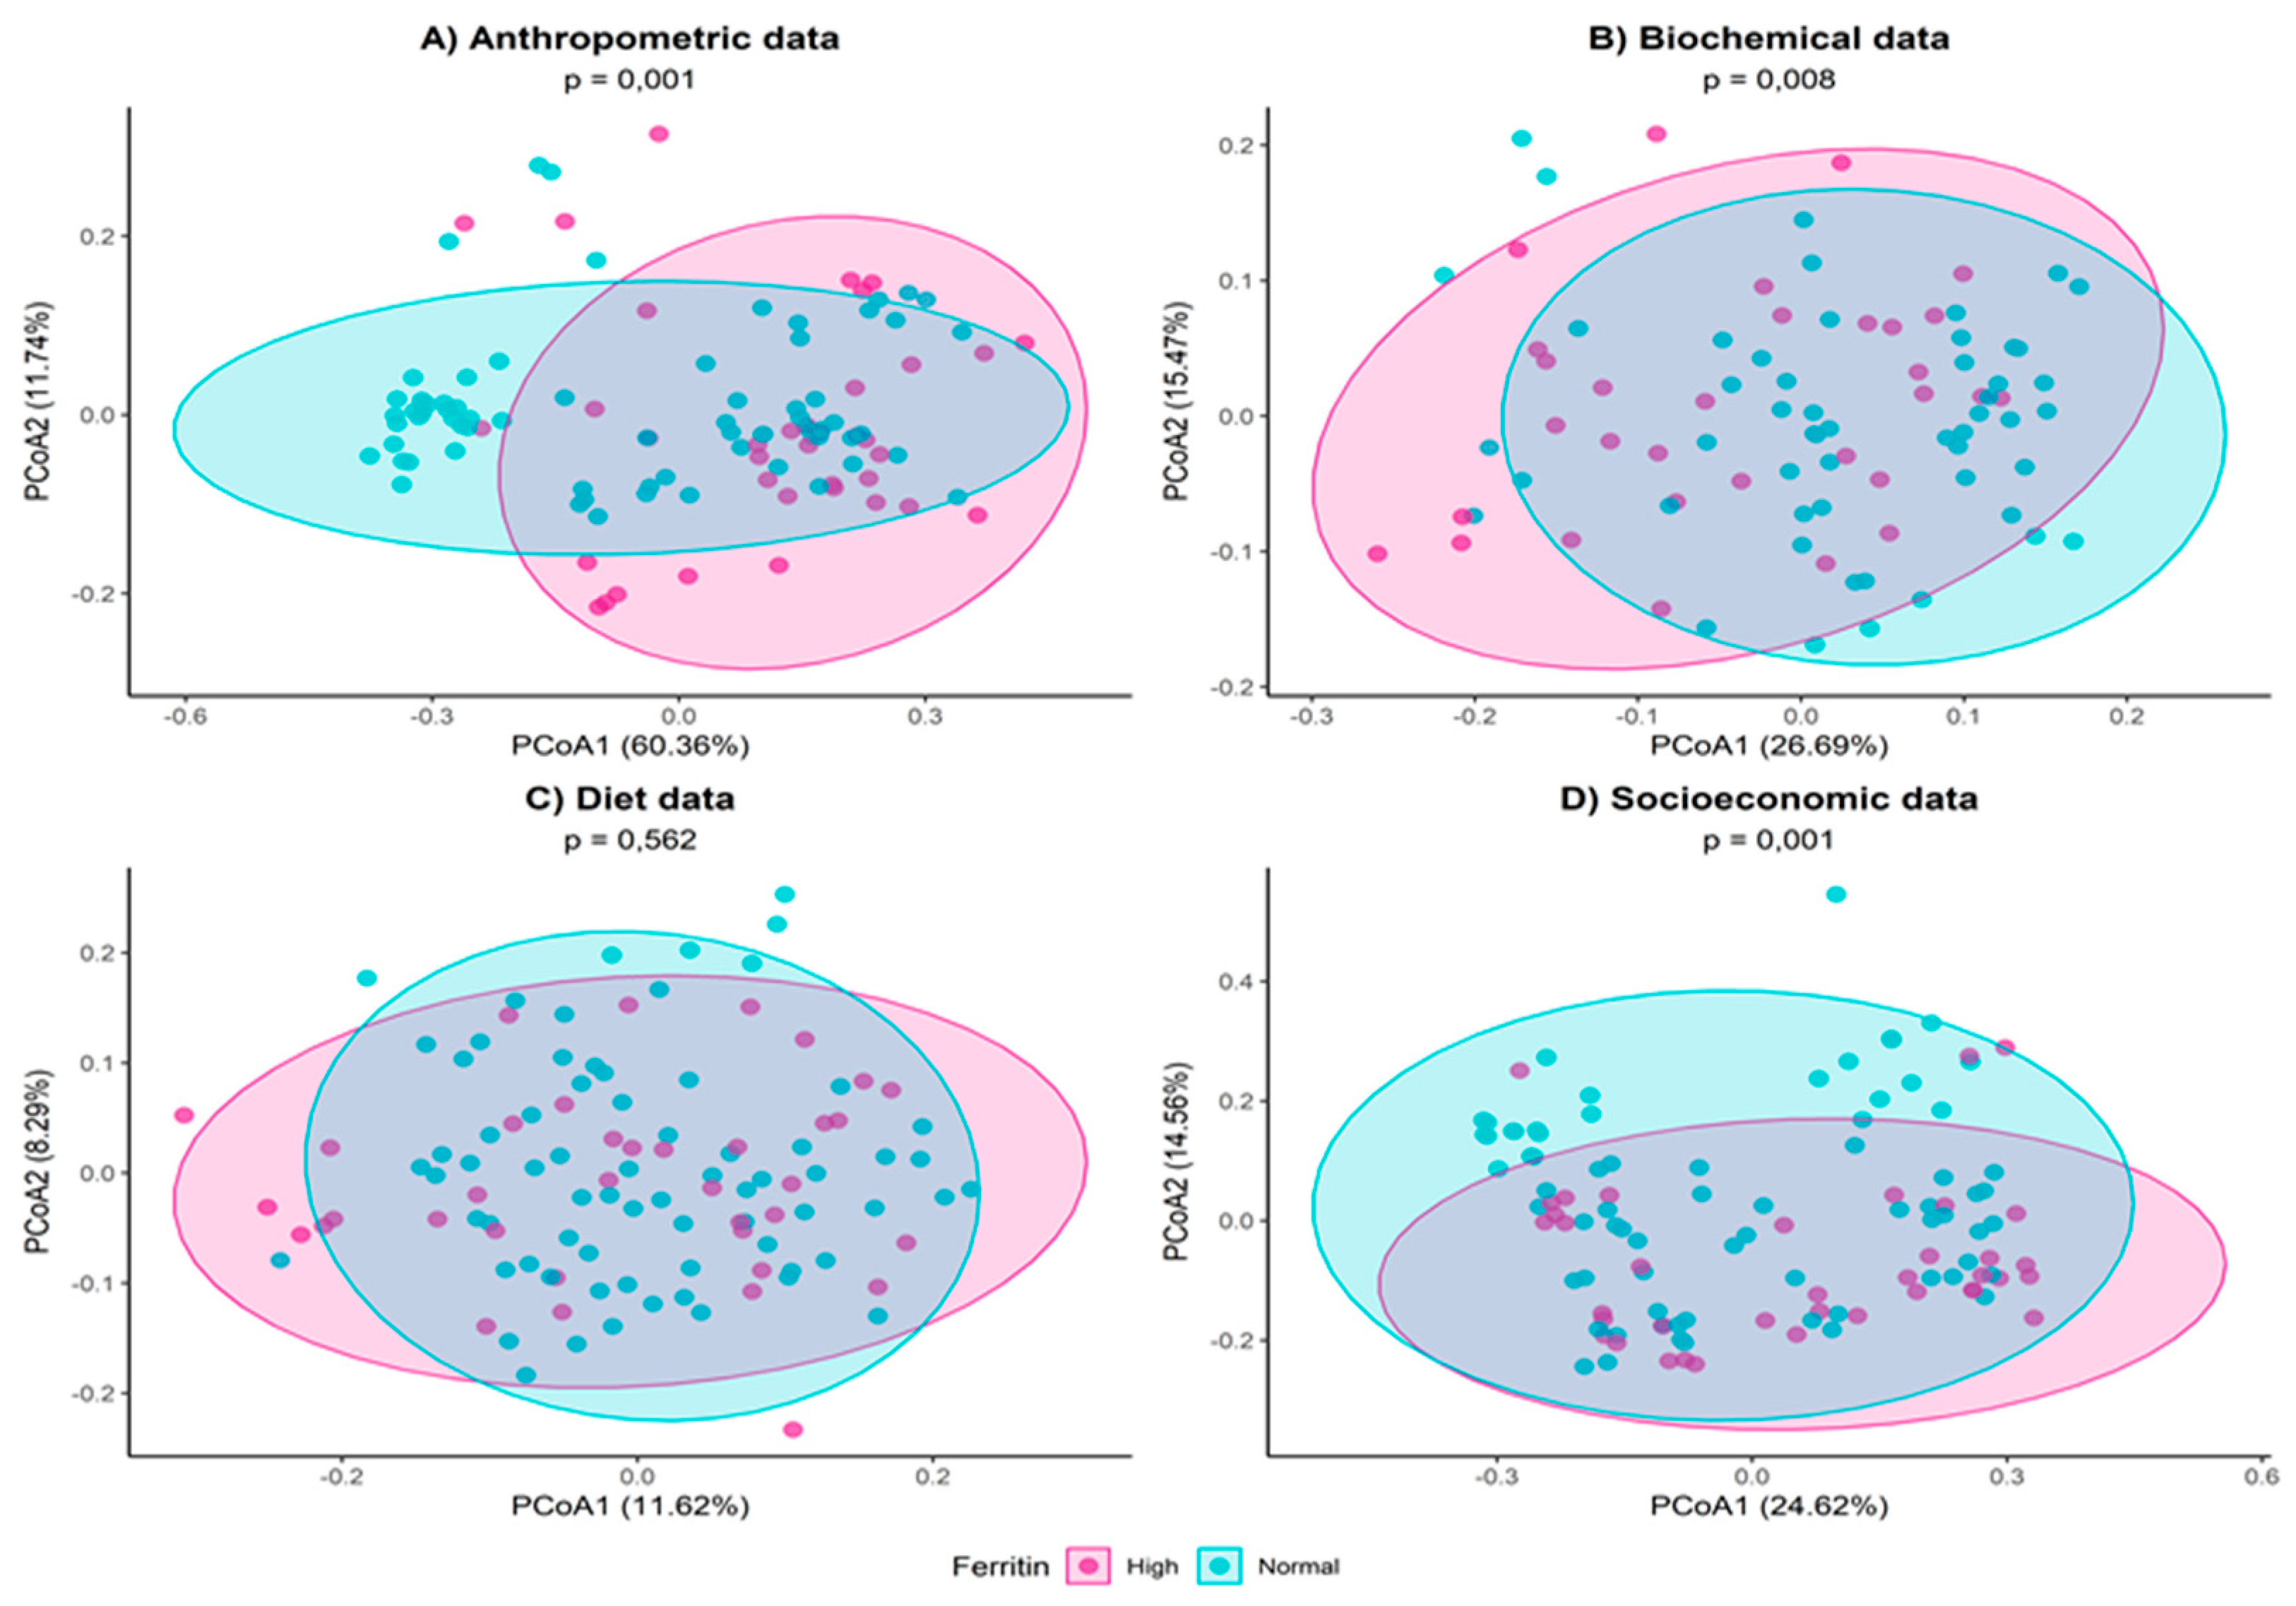
Table 1.
Serum biochemistry analyses classifications.
| Serum Biochemistry | Classification | Reference |
|---|---|---|
| SF | Normal (15 a 150 ng/mL for female and 15 a 200 ng/mL for male) Hight SF (>150 ng/mL for female and >200 ng/mL for male). |
WHO [30]. |
| Glucose | Normal (<100 mg/dL); High (>100 mg/dL), for both sexes. |
International Diabetes Federation (IDF) [45]. |
| TG | Normal (<150 mg/dL); High (>150 mg/dL), for both sexes. |
IDF [45]. |
| TC | Normal (<190 mg/dL); High (>190 mg/dL), for both sexes. |
Précoma et al. [46]. |
| HDL | Normal (female>50 mg/dL and male>40 mg/dL); Decreased (<50 mg/dL female and <40 mg/dL male). |
IDF [45]. |
| LDL | Normal (<130 mg/dL); High (>130 mg/dL), for both sexes. |
Précoma et al. [46]. |
| TyG | >4.55 to female and >4.68 to male were indicative of IR. | Guerrero-Romero et al. [42]. |
| ESR | Normal (female < 20 mm and High >20 mm); Normal (male < 10 mm and High >10 mm). |
Wetteland et al. [47]. |
| CRP | < 5mg/dL (Negative); >5 mg/dL (Positive). |
Khedr et al. [48]. |
| UA | Decreased (<1.5 mg/dL); Normal (1.5 to 6 mg/dL); High (>6 mg/dL), for both sexes. |
Laboratory |
| Hypertension | No (SBP: <130 mmHg and DBP <85 mmHg; Yes (SBP: > 130 mmHg and DBP > 85 mmHg) or in hypertension treatment, for both sexes. |
IDF [45]. |
| AST and ALT | Decreased (<10U/L); Normal (10 a 37 U/L); High (>37 U/L), for both sexes. |
Laboratory. |
| HSI | Yes (>36) No (<36) |
Lee et al. [49]. |
| FIB-4 | No risk of fibrosis (escore <1.3); Risk of fibrosis (>1.3), for both sexes. |
Shah et al. [50]. |
Note: SF (serum ferritin); tryglicerídes (TG); TC (total cholesterol); HDL (high density lipoprotein); LDL (low density lipoprotein); TyG (glucose and triglycerides index); IR (insulin resistence); ESR (erythrocyte sedimentation rate); CRP (c-reactive protein), UA (uric acid); SBP (systolic blood pressure); DPB (diastolic blood pressure); ALT (alanine transaminase); AST (aspartate transaminase HSI (hepatic steatosis index); FIB-4 (hepatic fibrose fator score).
Table 2.
Distribution of socioeconomic and lifestyle characteristics of participants according to SF classification (normal vs. high). Brazil, 2023-2024.
Table 2.
Distribution of socioeconomic and lifestyle characteristics of participants according to SF classification (normal vs. high). Brazil, 2023-2024.
| Variable | Category | SF Normal | SF High | p- value |
|---|---|---|---|---|
| Sex | Female | 67 (89.3%)# | 20 (52.6%) | < 0.0001a |
| Male | 8 (10.7%) | 18 (47.4%)# | ||
| Age | - | 31 (23–41.5) | 41 (31.2–49.8) | 0.315c |
| Marital Status | Single | 40 (53.3%)# | 8 (21.1%) | 0.012b |
| Married/Stable Union | 28 (37.4%) | 25 (65.7%)# | ||
| Divorced | 4 (5.3%) | 3 (7.9%) | ||
| Widower | 3 (4%) | 2 (5.3%) | ||
| Education | Incomplete Elementay Education | 6 (8%) | 6 (15.8%) | 0.009b |
| Complete Elementay Education | 1 (1.3%) | 0 (0%) | ||
| Incomplete High School | 2 (2.7%) | 1 (2.6%) | ||
| Complete High School | 15 (20%) | 16 (42.1%)# | ||
| Incomplete Higher Education | 27 (36%)# | 2 (5.3%) | ||
| Complete Higher Education | 19 (25.3%) | 11 (28.9%) | ||
| Posgraduate | 5 (6.7%) | 2 (5.3%) | ||
| Family Income Class | AB | 14 (26.3%) | 10 (18.9%) | 0.387a |
| C | 43 (60.5%) | 23 (58.1%) | ||
| DE | 17 (13.2%) | 5 (23%) | ||
| Smoker | No | 69 (92%) | 35 (92.1%) | 0.984a |
| Yes | 6 (8%) | 3 (7.9%) | ||
| Alcohol Consuption | No | 41 (54.7%) | 20 (52.6%) | 0.838a |
| Yes | 34 (45.3%) | 18 (47.4%) | ||
| Classification of Alcohol Consuption | Not Excessive | 68 (90.7%) | 37 (97.4%) | 0.189a |
| Excessive | 7 (9.3%) | 1 (2.6%) | ||
| Physical Activity | No | 27 (36%) | 16 (42.1%) | 0.528a |
| Yes | 48 (64%) | 22 (57.9%) | ||
| Minutes per week | - | 150 (0–300) | 120 (0–281.2) | 0.661c |
| Active | No | 36 (48%) | 22 (57.9%) | 0.320a |
| Yes | 39 (52%) | 16 (42.1%) |
Note: SF (serum ferritin); AB (upper and upper-middle class: >R$5,755.23 to 21,826.74 or >USD 1,058.10 to 4,012.85); C (middle class: >R$1,965.87 to <R$5,755.23 or >USD 361.42 to <1,058.10); DE (lower and lower-middle class: >R$900.60 to <R$1,965.87 or >USD 165.57 to <361.42). Absolute frequency (Relative frequencies %). Median (Quartile 1–Quartile 3). aChi-square for independence. bMonte Carlo method. cMann-Whitney-U test. Bold values indicate statistically significant contribution (p <0.05). #represents category with significant difference by adjusted residuals (p>1.96).
Table 3.
Distribution of participants’ anthropometric parameters according to SF classification (normal vs. high). Brazil, 2023-2024.
Table 3.
Distribution of participants’ anthropometric parameters according to SF classification (normal vs. high). Brazil, 2023-2024.
| Variable | Category | SF Normal | SF High | p- value |
|---|---|---|---|---|
| BMI | Underweight | 3 (4%) | 0 (0%) | 0.003b |
| Normal-weight | 31 (41.3%)# | 5 (13.2%) | ||
| Overweight | 20 (26.7%) | 12 (31.6%) | ||
| Obesity | 21 (28%) | 21 (55.3%)# | ||
| WC | No Risk | 37 (49.3%)# | 8 (21.1%) | 0.004a |
| With Risk | 38 (50.7%) | 30 (78.9%)# | ||
| WHR | No Risk | 57 (77%) | 28 (73.7%) | 0.874a |
| With Risk | 17 (23%) | 10 (26.3%) | ||
| BF% | Acceptable | 40 (54.8%)# | 9 (24.3%) | 0.002a |
| High | 33 (45.2%) | 28 (75.7%)# | ||
| LM% | - | 70±8.1 | 68,4±6.8 | 0.301c |
Note: SF (serum ferritin); BMI (body mass index); WC (waist circumference); WHR (waist-to-hip ratio); BF (body fat); LM (lean mass). Absolute Frequency (Relative Frequency %). Mean ± Standard Deviation. aChi-square test for independence. bMonte Carlo method. cStudent's t-test. p-value. Bold values indicate statistically significant contribution (p<0.05). #represent categories with significant differences based on adjusted residuals (p>1.96).
Table 4.
Distribution of biochemical parameters, insulin resistance, hypertension and presence of MS of participants according to the SF classification (normal vs. high). Brazil, 2023-2024.
Table 4.
Distribution of biochemical parameters, insulin resistance, hypertension and presence of MS of participants according to the SF classification (normal vs. high). Brazil, 2023-2024.
| Variable | Category | SF Normal | SF High | p- value |
|---|---|---|---|---|
| Glucose | Normal | 67 (91.8%)# | 29 (76.3%) | 0.023a |
| High | 6 (8.2%) | 9 (23.7%)# | ||
| TG |
Normal | 65 (86.7%)# | 24 (63.2%) | 0.003a |
| High | 10 (13.3%) | 14 (36.8%)# | ||
| TC | Normal | 54 (70.1%) | 21 (58.3%) | 0.216a |
| High | 23 (29.9%) | 15 (41.7%) | ||
| HDL |
Normal | 13 (17.3%) | 9 (23.7%) | 0.420a |
| Decreased | 62 (82.7%) | 29 (76.3%) | ||
| LDL |
Normal | 58 (77.3%) | 28 (73.7%) | 0.667a |
| High | 17 (22.7%) | 10 (26.3%) | ||
| IR |
No | 52 (71.2%)# | 19 (50%) | 0.027a |
| Yes | 21 (28.8%) | 19 (50%)# | ||
| CRP | Negative | 40 (66.7%) | 24 (68.6%) | 0.849a |
| Positive | 20 (33.3%) | 11 (31.4%) | ||
| ESR | Normal | 31 (53.4%) | 20 (57.1%) | 0.729a |
| High | 27 (46.6%) | 15 (42.9%) | ||
| Hypertension | Yes | 16 (21.3%) | 19 (50%)# | 0.001a |
| No | 59 (78.7%)# | 19 (50%) | ||
| MS | No | 59 (78.7%)# | 18 (47.4%) | 0.001a |
| Yes | 16 (21.3%) | 20 (52.6%)# |
Note: SF (serum ferritin); TG (triglycerides); TC (total cholesterol); HDL (high density lipoprotein); LDL (low density lipoprotein); IR (insulin resistance); CRP (c-reactive protein); ESR (erythrocyte sedimentation rate); MS (metabolic syndrome). Absolute frequency (Relative frequencies %). aChi-square for independence. bMonte Carlo method. Bold values indicate statistically significant contribution (p<0.05). #represent categories with significant differences based on adjusted residuals (p>1.96).
Table 5.
Distribution of participants’ liver parameters according to SF classification (normal vs. high). Brazil, 2023-2024.
Table 5.
Distribution of participants’ liver parameters according to SF classification (normal vs. high). Brazil, 2023-2024.
| Variable | Category | SF Normal | SF High | p- value |
|---|---|---|---|---|
| UA | Decreased | 1 (1.5%) | 0 (0%) | 0.016b |
| Normal | 60 (88.2%)# | 27 (71%) | ||
| High | 7 (10.3%) | 11 (29%)# | ||
| AST |
Normal | 58 (82.8%) | 27 (73%) | 0.228a |
| High | 12 (17.2%) | 10 (27%) | ||
| ALT | Decreased | 1 (1,4%) | 0 (0%) | 0.008b |
| Normal | 66 (94.3%)# | 29 (78.4%) | ||
| High | 3 (4.3%) | 8 (21.6%)# | ||
| FIB4 | No Risk fibrosis | 56 (83,6%) | 30 (83.3%) | 0.974a |
| With Risk fibrosis | 11 (16,4%) | 6 (16,7%) | ||
| HSI >36 | No | 39 (55.7%)# | 12 (32.4%) | 0,022a |
| Yes | 31 (44.3%) | 25 (67.6%)# |
Note: SF (serum ferritin); UA (uric acid); AST (aspartate transaminase); ALT (alanine transaminase); FIB-4 (hepatic fibrose fator); HSI (hepatic steatosis index). Absolute frequency (Relative frequencies %). aChi-square for independence. bMonte Carlo method. Bold values indicate statistically significant contribution (p<0.05). #represent categories with significant differences based on adjusted residuals (p>1.96).
Table 6.
Distribution of participants’ 24HR dietary data according to SF classification (normal vs. high). Brazil, 2023-2024.
Table 6.
Distribution of participants’ 24HR dietary data according to SF classification (normal vs. high). Brazil, 2023-2024.
| Variable | SF Normal | SF High | p- value |
|---|---|---|---|
| Energy (kcal) | 1692 (1315–1995) | 1718 (1076.2–2411.2) | 0.412a |
| Carbohydrate (g) | 189.5 (146.7–278.5) | 212.2 (129.9–287.1) | 0.024a |
| Protein (g) | 68.6 (52.3–97.2) | 79.5 (60.7–107) | 0.788a |
| Lipids (g) | 55.7 (40–74.8) | 64.3 (36–88.1) | 0.164a |
| SFA (g) | 17.8 (11.8–25) | 18.2 (12.6–28) | 0.315a |
| MUFA (g) | 15.6 (11.2–22.9) | 18.4 (11.4–24.7) | 0.412a |
| PUFA (g) | 12.3 (9.2–17.6) | 12.9 (9.3–18.4) | 0.927a |
| Cholesterol (mg) | 261.9 (167.8–426.9) | 270.1 (178.3–477.3) | 0.527a |
| Fibers (g) | 18.3 (10.9–25.4) | 22.7 (15.8–30.4) | 0.073a |
| Per capita oil (ml) | 10 (6.6–15) | 10 (6.1–15) | 0.97a |
| Per capita lard (g) | 5.5 (2.6–14.7) | 5.6 (4.2–8.3) | 0.558a |
| Total vitamin C (mg) | 49.2 (20.4–119) | 57,1 (25.5–137.3) | 0.648a |
| Total meet (g) | 120 (60–217.5) | 150 (100.5–200) | 0.927a |
| Total iron (mg) | 10,9 (7.5–14.4) | 10.1 (6.5–13.1) | 0.164a |
| Total heme iron (mg) | 0,9 (0.3–1.8) | 0.8 (0.3–1.9) | 0.788a |
| Total non-heme iron (mg) | 9.3 (6.8–12.5) | 9.2 (5.6–12.6) | 0.164a |
| Total iron absorbed (mg) | 0.7 (0.5–1.1) | 0.6 (0.5–0.9) | 0.315a |
Note: 24HR (24-hour diet recall); SF (serum ferritin); kcal (kilocalories); g (grams); SFA (saturated fatty acid); MUFA (monounsaturated fatty acid); PUFA (polyunsaturated fatty acid); mg (milligrams); ml (milliliter). Median (Quartile 1–Quartile 3). aMann-Whitney-U test. Bold values indicate statistically significant contribution (p<0.05).
Table 7.
Logistic regression model parameters. Brazil, 2023-2024.
| Source | value | Pr > Qui² | OR [IC 95 %] * |
|---|---|---|---|
| Intercept | -2.46 | < 0.0001 | |
| Sex-Female | 0.00 | ||
| Sex-Male | 2.82 | < 0.0001 | 16.82 [4.48-63.1] |
| BF% - Acceptable | 0.00 | ||
| BF% - Elevated | 2.02 | 0.004 | 7.5 [1.94-29.03] |
| HSI <36 – No | 0.00 | ||
| HSI >36 – Yes | -0.43 | 0.47 | 0.65 [0.20-2.11] |
| MS-No | 0.00 | ||
| MS-Yes | 0.55 | 0.29 | 1.74 [0.62-4.84] |
Note: BF (body fat); HSI (hepatic steatosis index); MS (metabolic syndrome). * OR = Odds Ratio. *95%CI = Lower limit and upper limit of the 95% confidence interval. Bold values indicate statistically significant contribution (p <0.05).
Disclaimer/Publisher’s Note: The statements, opinions and data contained in all publications are solely those of the individual author(s) and contributor(s) and not of MDPI and/or the editor(s). MDPI and/or the editor(s) disclaim responsibility for any injury to people or property resulting from any ideas, methods, instructions or products referred to in the content. |
© 2025 by the authors. Licensee MDPI, Basel, Switzerland. This article is an open access article distributed under the terms and conditions of the Creative Commons Attribution (CC BY) license (http://creativecommons.org/licenses/by/4.0/).
Copyright: This open access article is published under a Creative Commons CC BY 4.0 license, which permit the free download, distribution, and reuse, provided that the author and preprint are cited in any reuse.


