1. Introduction
Camel milk, with its similar composition to human milk, is a good source of nutrition and health products for residents of arid or semi-arid regions [
1]. Its unique nutritional composition also gives it a wide range of medicinal uses, such as treating autism, controlling diabetes, preventing cirrhosis, and replacing cow’s milk to avoid allergic reactions in infants [
2]. In recent years, the demand for camel milk has been growing, but the production of camel milk products is still insufficient. Because camel farming is still carried out in a traditional extensive farming method, it is difficult to achieve large-scale production, and the quality of dairy products is difficult to meet uniform standards [
3]. Currently, lactating camel farming in China is mainly distributed in arid desert grassland regions such as Inner Mongolia, Gansu, Xinjiang, Qinghai, and Ningxia. Among them, the camels in Xinjiang are mainly Bactrian camels, and the milk production of camels is generally low. The main reasons include internal factors such as genetics and physiology, and external factors such as feeding management, environment, and diet nutrition. The influence of feed additives cannot be ignored. Current nutritional studies of ruminants show that adding feed additives to the diet can effectively improve the production performance, rumen fermentation and milk production of ruminants, reduce the use of antibiotics, and has a significant antioxidant effect [
4].
Sallam [
5] significantly improved milk production and dry matter digestibility in female camels and significantly reduced the number of rumen protozoa after adding a mixture of brewer’s yeast and rumen cocci to the camel diet. Adding date seed-derived biochar to camel diets by Ghazzawy [
6] can significantly reduce CH4 emissions in camels and improve nutrient digestibility. Studies have shown that the main mechanism of action of sodium diacetate (SDA) is that sodium diacetate is easily ionized to form acetic acid, which interferes with the interaction process between enzymes in the cell wall of fungal tissues, reduces the activity of harmful microorganisms [
7], and when used as a feed additive, it can improve the milk fat conversion efficiency of dairy animals[
8]. Aspergillus oryzae (AO), as a prebiotic additive, can improve feed intake, dry matter and fiber digestibility in ruminants, and increase rumen fiber-decomposing bacteria. It has been widely used in ruminant feed [
9]. Studies by Ekin [
10] and Sallam [
11] showed that adding koji mold extract to the diets of Holstein dairy cows significantly increased milk production and feed intake without affecting the health of the cows. In summary, current research on the nutrition of lactating camels shows that commonly used feed additives are regionally specific, and there is no single feed additive that is suitable for use in multiple regions. Furthermore, SOD and AO, which are commonly used feed additives for dairy cows, have not been studied in camel production.
In summary, this experiment investigated whether different types of feed additives affect milk yield and quality in lactating camels by selecting sodium diacetate and Aspergillus oryzae as feed additives, thereby clarifying a camel feed additive that can be used on a large scale without regional specificity.
2. Materials and Methods
2.1. Test Materials
Sodium diacetate and Aspergillus oryzae were purchased from Dahan Enzyme Biotechnology Co., Ltd., and the Aspergillus oryzae had a live bacteria count of 12 billion/gram.
2.2. Test Time and Location
The experiment was conducted from July 1 to August 14, 2023, at the camel breeding base of Keping County Livestock Technology Development Co., Ltd., Aksu City, Xinjiang Uygur Autonomous Region.
2.3. Experimental Animals and Experimental Design
Thirty lactating camels of similar parity and lactation stage were randomly divided into three groups: a control group (TMR), a sodium diacetate group (SDA), and an omethoate enzyme group (AO). The TMR group was fed a total mixed ration (TMR), while the SDA group received a TMR diet supplemented with 150 g/d of sodium diacetate, and the AO group received a TMR diet supplemented with 40 g/d of omethoate enzyme. Each group consisted of 10 lactating camels. The experiment lasted 45 days, including a 15-day pre-feeding period and a 30-day trial period.
2.4. Basal Diet and Nutritional Requirements
Since there are no feeding standards for lactating camels, based on the characteristics of Bactrian camels to tolerate roughage, and with reference to the NRC (2007) standard for dairy cows, a diet for lactating camels was formulated. The roughage consisted of hydroponic wheat seedlings, wheat straw, and alfalfa, which were crushed to 2-3 cm using a TMR machine and then mixed with concentrate to form the TMR diet. The composition and nutritional levels of the diet are shown in
Table 1. The dry matter (DM) of the feed was determined according to GB/T 6435-2014 Determination of Moisture in Feed; crude protein (CP) was determined according to GB/T 6432 Determination of Crude Protein in Feed - Kjeldahl Method; crude fat (EE) was determined according to GB/T 6433 Determination of Crude Fat in Feed; crude ash (Ash) was determined according to GB/T 6438 Determination of Crude Ash in Feed; calcium (Ca) was determined according to GB/T 13885 Determination of Calcium, Copper, Iron, Magnesium, Manganese, Potassium, Sodium and Zinc Content in Feed - Atomic Absorption Spectrometry; phosphorus (P) was determined according to GB/T 6437 Determination of Total Phosphorus in Feed - Spectrophotometry; neutral detergent fiber (NDF) was determined according to GB/T 20806 Determination of Neutral Detergent Fiber (NDF) in Feed; and acid detergent fiber (ADF) was determined according to NY/T The determination was performed according to the “1459 Determination Method of Acidic Detergent Fiber in Feed”. The SOD addition amount is 1000 mg/kg according to EU standards [
12] and the AO addition amount is 40 g/day based on previous research progress [
13,
14,
15,
16,
17].
2.5. Feeding and Management
The experimental camels were kept in the same enclosures, and the temperature and humidity of the enclosures were recorded daily (
Supplementary Table S1). They were allowed free access to food and water in their groups and were fed twice a day at 09:00 and 19:30, with 15% of the feed remaining each day.
2.6. Sample Collection and Methods
2.6.1. Lactation performance
The milk yield of the experimental camels was measured at 0d, 10d, 20d and 30d during the trial period. On the 30th day of the trial period, 50ml of milk sample was collected (n=10). Milk protein, milk fat, lactose, non-fat, freezing point, ash content, conductivity and temperature were detected using a milk composition analyzer.
2.6.2. Detection of 16S and ITS in Fecal Microbiota
After the experiment, three lactating camels were randomly selected from each group to collect fecal samples over three days (n=3). The samples were thoroughly mixed, stored at -80 degrees Celsius, and sent to Suzhou Nomi Metabolic Biotechnology Co., Ltd. for bacterial 16S and fungal ITS microbial flora analysis. DNA was purified from rumen fluid using the cetyltrimethylammonium bromide (CTAB) method and then amplified by PCR using specific primers as templates [
18]. After quantification of the PCR products using quantitative real-time PCR (Qubit 3.0), they were sequenced on the Illumina PE300 platform of Suzhou Nomi Metabolic Biotechnology Co., Ltd. The raw data from 16S rRNA gene sequencing were processed using QIIME2 software for quality control to remove low-quality sequences and potential contaminants. The SILVA database was selected for sequence alignment. Usearch software was used to cluster [
19] Reads at a similarity level of 97.0% to obtain OUT. The Alpha diversity index of the samples was evaluated using QIIME2 2020.6 software [
20]. Beta diversity analysis was performed using QIIME software to compare the similarity of different samples in terms of species diversity, and PCA [
21] analysis plots were generated using R language tools. Using PICRUSt2, a phylogenetic tree was constructed by aligning the characteristic sequence (16S rRNA) with the reference sequence of the Integrated Microbial Genomes (IMG) database. The “nearest species” of the characteristic sequence were found, and the gene information of unknown species was predicted based on the gene types and abundance information of known species. Thus, the pathway information of the entire community was predicted by combining the KEGG pathway information of genes [
22]. No LEfse differentially expressed microorganisms were detected in this experiment. The fungal flora was determined using the ITS method, and the analytical method was the same as that for bacteria.
2.6.3. Serum Biochemical Indicators and Detection Methods
After the initial testing period, fasting blood was collected from the anterior vena cava using a disposable vacuum blood collection device. After collection, the blood was centrifuged at 3500 rpm, and the serum was transferred to a 1.5 ml EP tube using a 1 ml pipette and stored in a refrigerator (-20 ℃). The levels of SOD (superoxide dismutase), MDA (malondialdehyde), GSH-PX (glutathione peroxidase), CAT (catalase), and T-AOC (total antioxidant capacity) in serum were measured.
2.6.4. Dairy Quality Testing
On day 30, the sample was sent to Novogene Biotechnology Co., Ltd. to determine the content of camel milk fatty acids, minerals (Na, Mg, K, Ca, Fe), vitamin E, insulin and vitamin C.
2.6.5. Fatty Acid Detection
Total fatty acids (FAs) were extracted from frozen meat samples following the procedure of Liang et al. FA separation was performed using gas chromatography (GC-450; Varian Co., Walnut Creek, CA, USA), with peaks identified based on retention time. Individual FA concentrations were quantified against standard curves prepared from a known methyl ester mixture (C4–C24; Sigma-Aldrich, St. Louis, MO, USA)
2.7. Data Analysis
The experimental data were initially processed using Excel 2016, and then a two-way ANOVA was performed using SPSS 26.0 statistical analysis software. Multiple comparisons were then performed using Duncan’s method. P < 0.01 indicated extremely significant differences, P < 0.05 indicated significant differences, and P > 0.05 indicated no significant differences.
3. Results and Analysis
3.1. Effects of Different Feed Additives on Milk Production Performance In Lactating Camels
As shown in
Table 3, the addition of sodium diacetate and kojiase to the camel diet had no significant effect on the milk production of lactating camels (P>0.05).
3.2. Effects of Different Feed Additives on the Quality of Milk from Lactating Camels
As shown in
Table 4, the addition of sodium diacetate and kojimaase to the diet had no significant effect on any of the indicators in the morning and evening milk of lactating camels after 30 days (p>0.05).
3.3. Effects of Different Feed Additives on the Composition of Milk from Lactating Camels
As shown in
Table 5, the vitamin E content in the milk of the sodium diacetate group was significantly higher than that of the basal diet TMR group and the kojimab group (P < 0.01), and the vitamin E content in the milk of the kojimab group was significantly higher than that of the basal TMR group (P < 0.01); the vitamin C content in the milk of the sodium diacetate group was significantly higher than that of the basal TMR group (P < 0.01); there was no significant difference in insulin content among the three groups (P > 0.05).
As shown in
Table 6, there were no significant differences in the content of sodium, magnesium, potassium, calcium and iron in camel milk among the three groups (P>0.05).
As shown in
Table 7, the C21:0 content in the milk of the SDA group was significantly higher than that of the basal diet group and the kojimab group (P < 0.01), and the C22:6N3 content was significantly higher than that of the basal diet group and the kojimab group (P < 0.05). The C20:3N6 content in the milk of the sodium diacetate group and the basal TMR group was significantly higher than that of the kojimab group (P < 0.01), and the C20:5N3 content was significantly higher than that of the kojimab group (P < 0.05). The C24:1N9 content in the milk of the basal TMR group and the kojimab group was significantly higher than that of the sodium diacetate group (P < 0.01).
3.4. Effects of Different Feed Additives on Antioxidant Indices in Lactating Camels
As shown in
Table 8, the addition of different types of additives to the feed had no significant effect on the antioxidant indicators in the serum of lactating camels (p>0.05).
3.5. Effects of Different Feed Additives on the Fecal Microbiota of Lactating Camels
As shown in
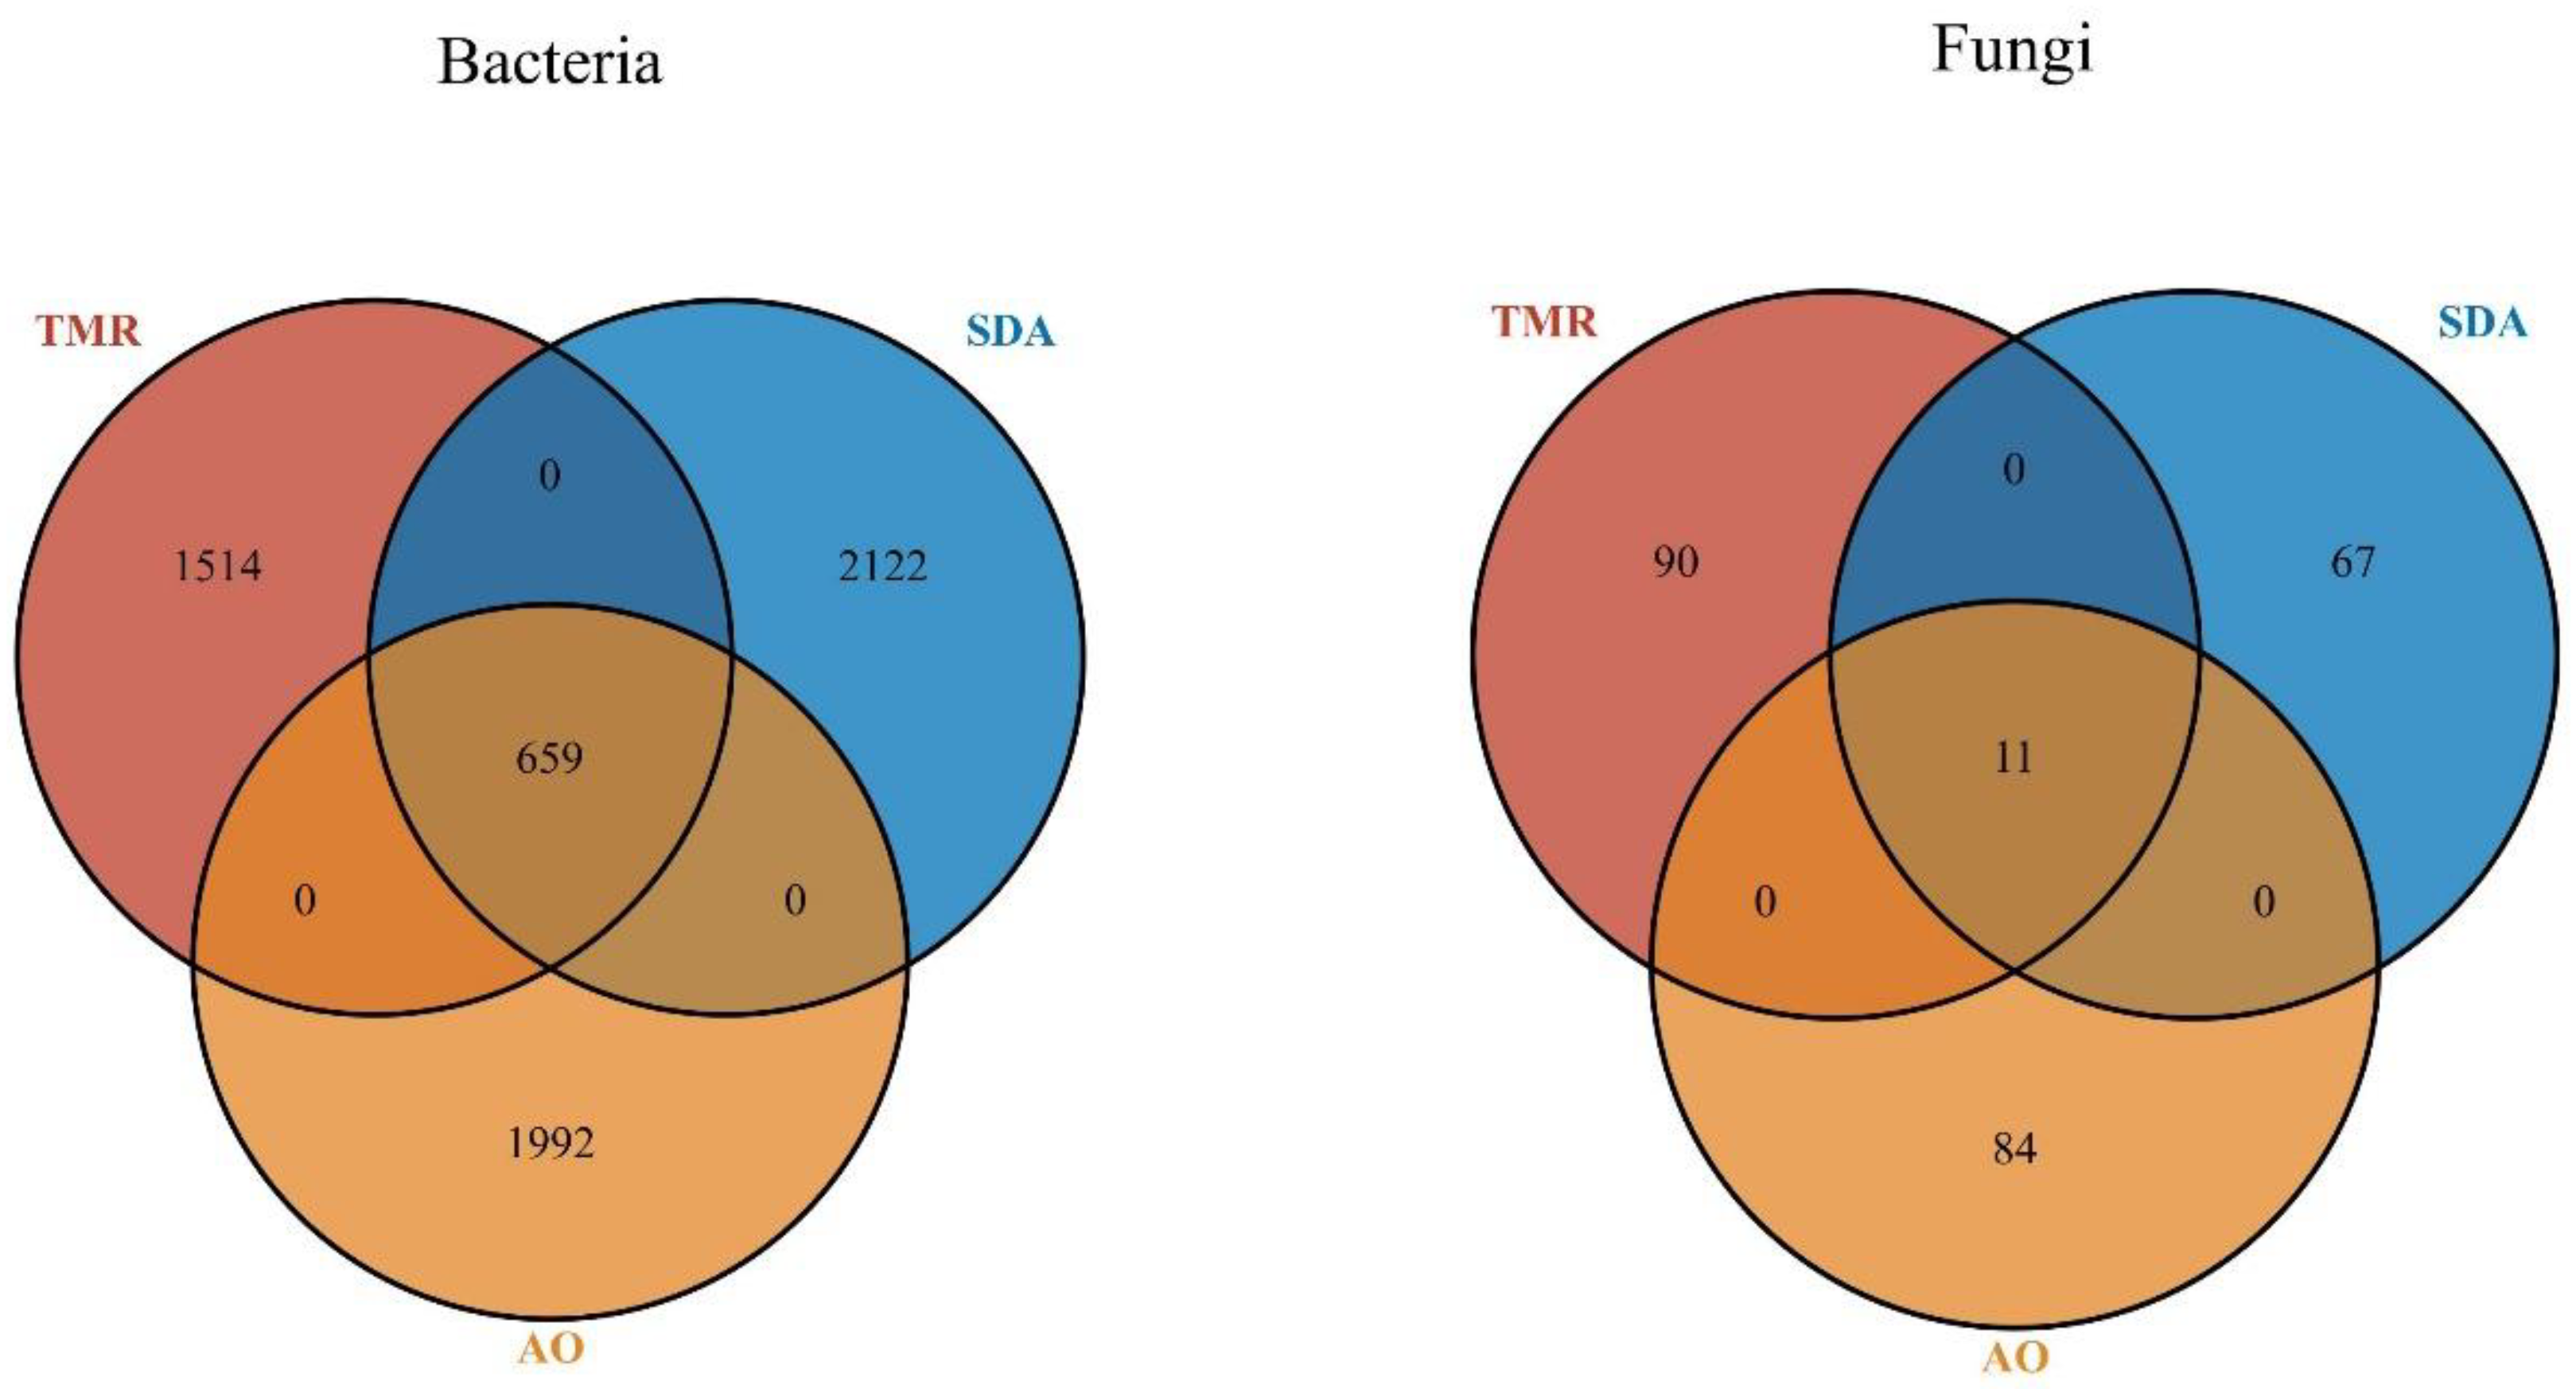
Figure 1A, there are 1514 unique bacterial microorganisms in the TMR group, 2122 in the SDA group, and 1992 in the AO group, for a total of 659 microorganisms across the three groups. As shown in
Figure 1B, there are 90 unique fungal microorganisms in the TMR group, 67 in the SDA group, and 84 in the AO group, for a total of 11 fungal microorganisms across the three groups.
As shown in
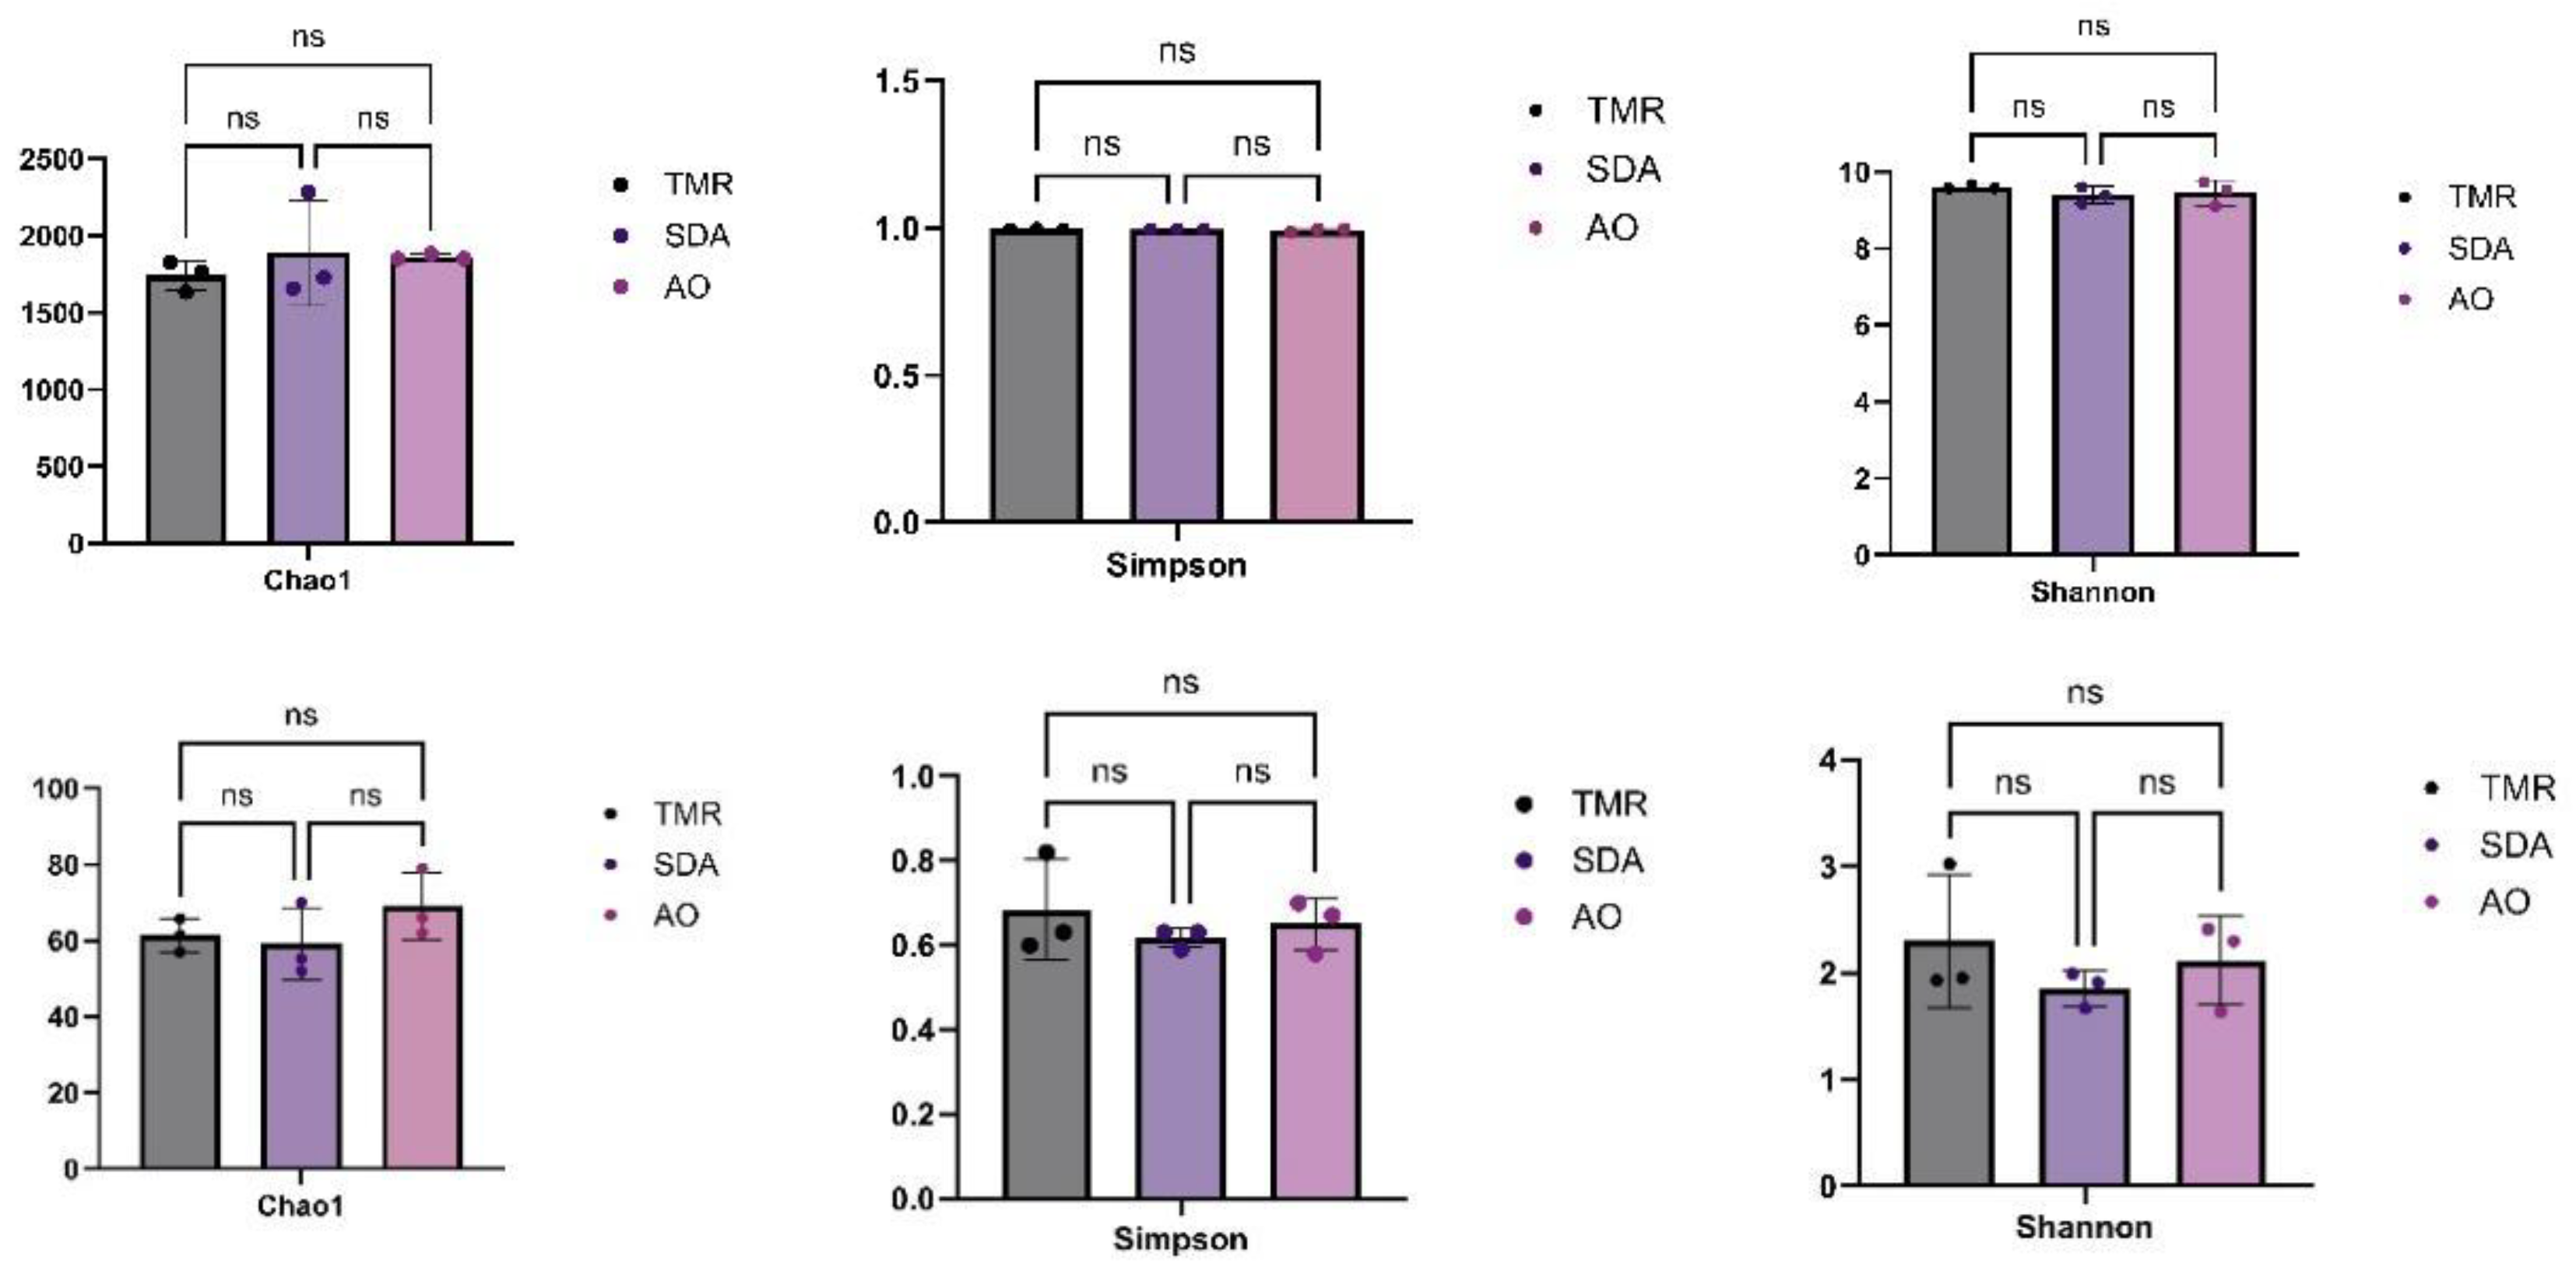
Figure 2, there were no significant differences in Alpha diversity among the three groups of bacteria and fungi (P>0.05).
As shown in
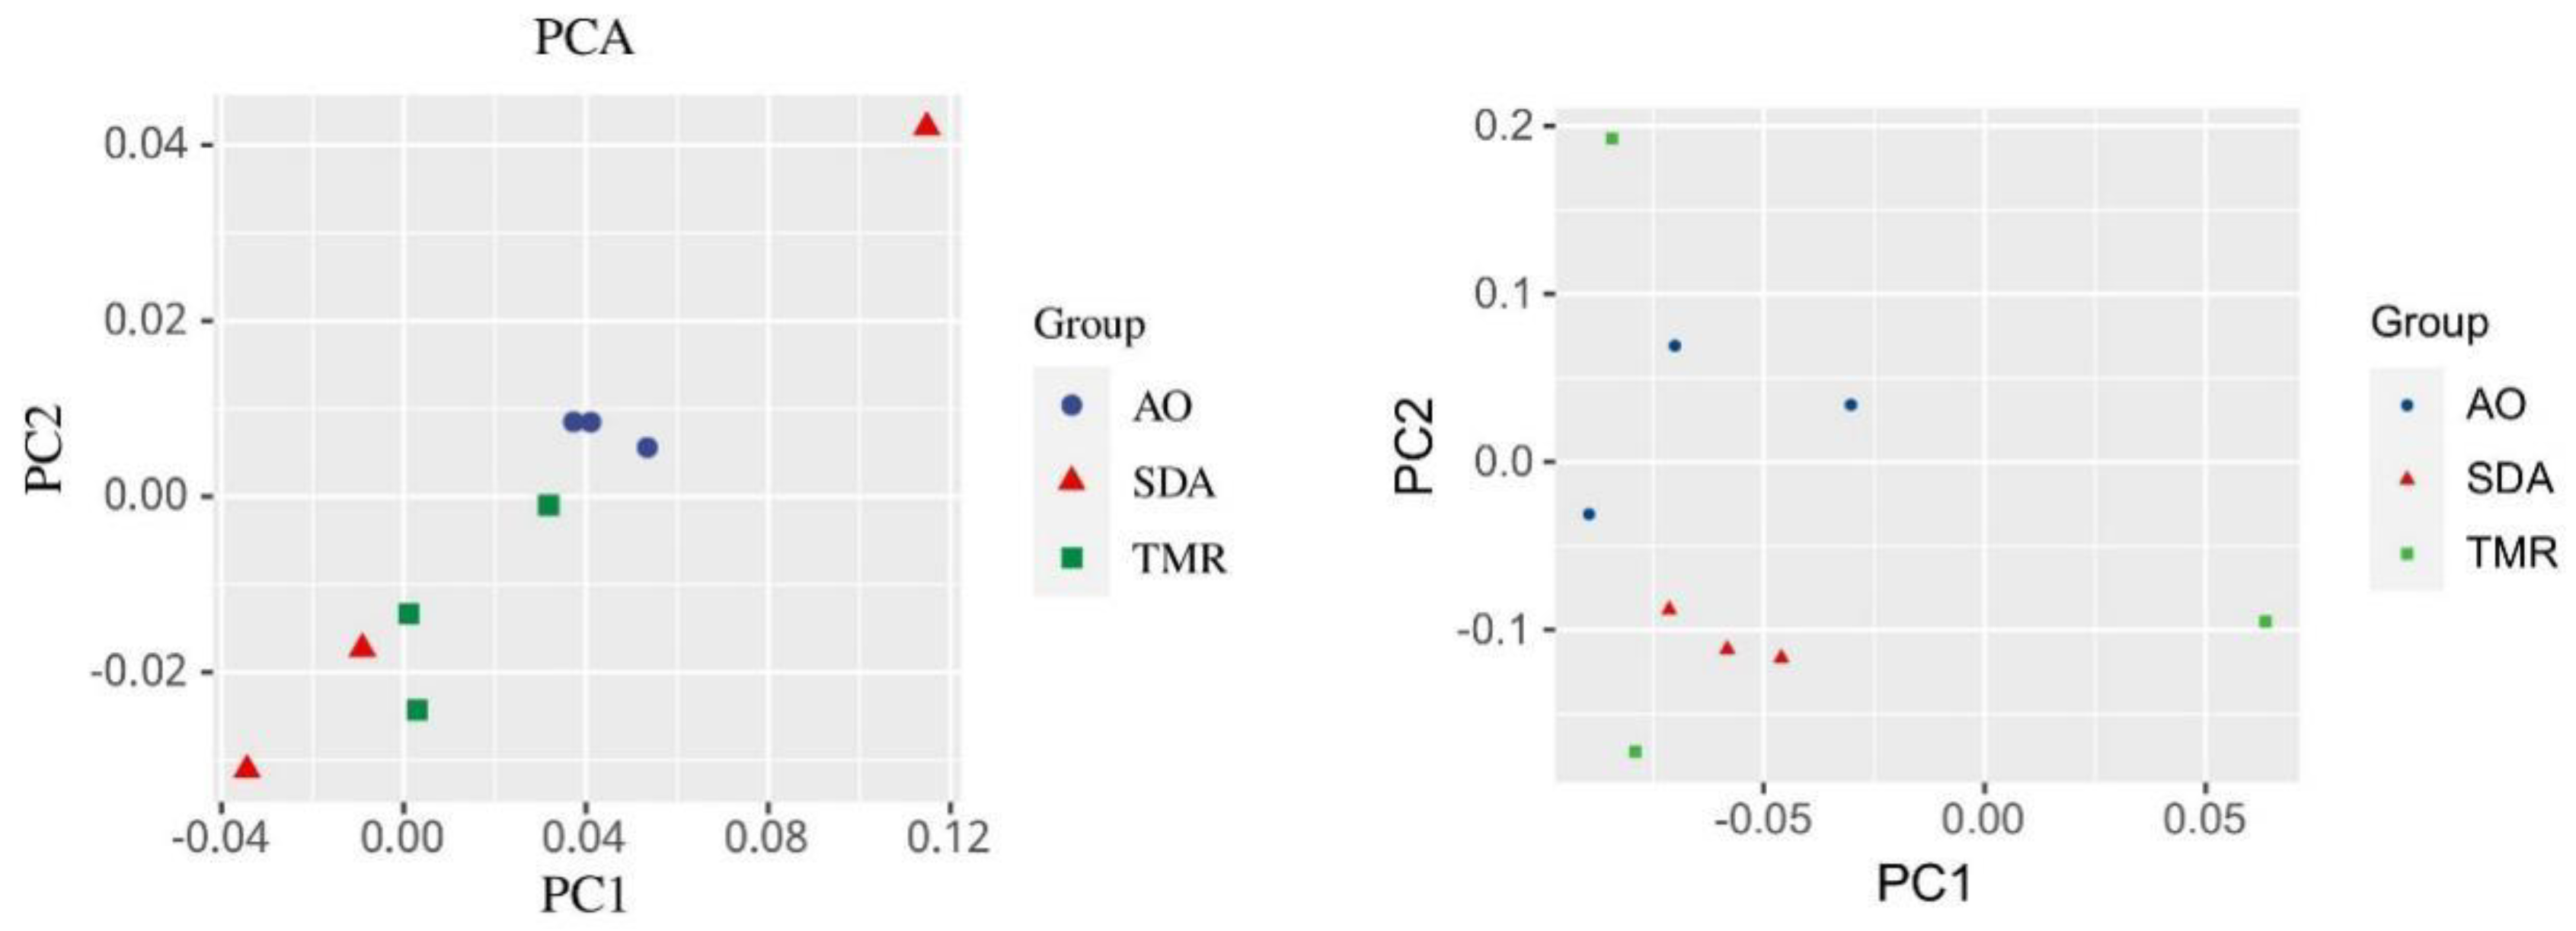
Figure 3a, there is a clear separation between the bacterial microbial communities in the AO group and the TMR group; as shown in
Figure 3), there is a clear separation between the fungal microbial communities in the AO group and the SDA group.
As shown in
Table 9 and
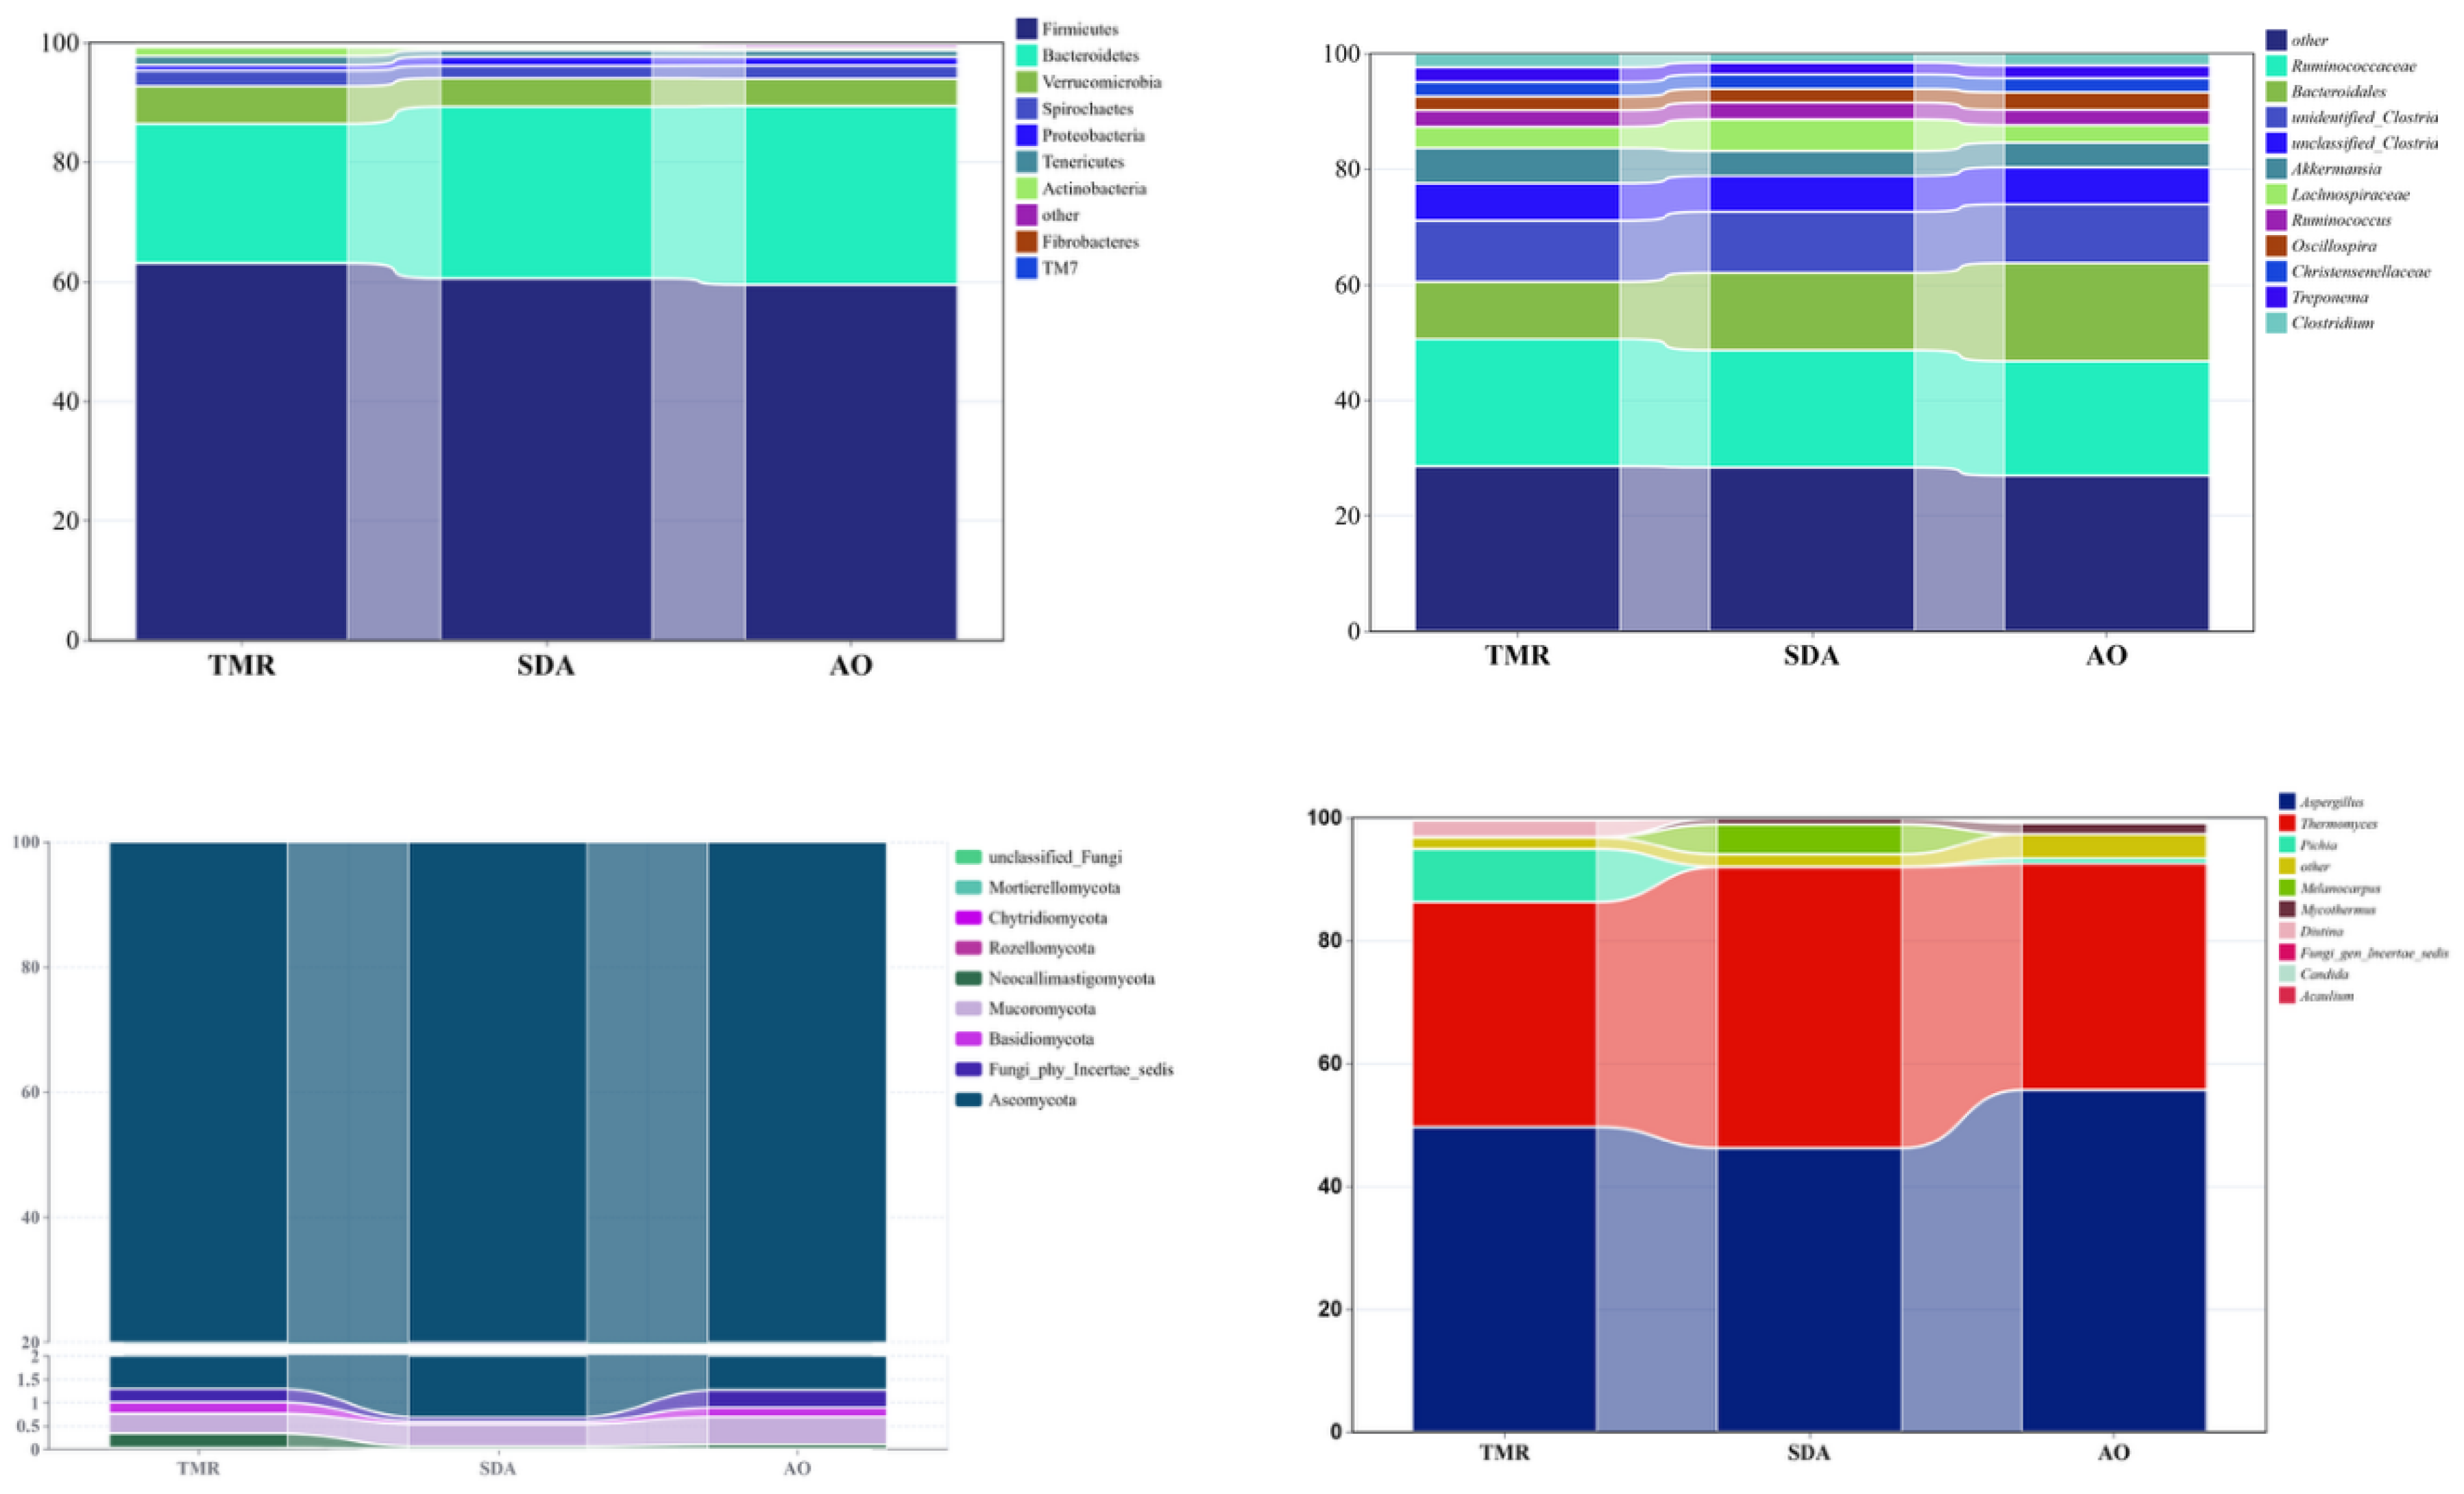
Figure 4a, the Actinobacteria phylum in the TMR group was significantly higher than that in the other two groups (P<0.01), while there were no significant differences among the groups in other bacterial phyla (P>0.05). As shown in
Table 10 and
Figure 4b, there were no significant differences among the groups in any bacterial genus (P>0.05). As shown in
Table 11 and
Figure 4c, there were no significant differences among the three groups in any fungal phylum (P>0.05). As shown in
Table 12 and
Figure 4d, the Melanocarpus genus in the SDA group was significantly higher than that in the other two groups (P<0.01), while there were no significant differences among the other fungal genera.
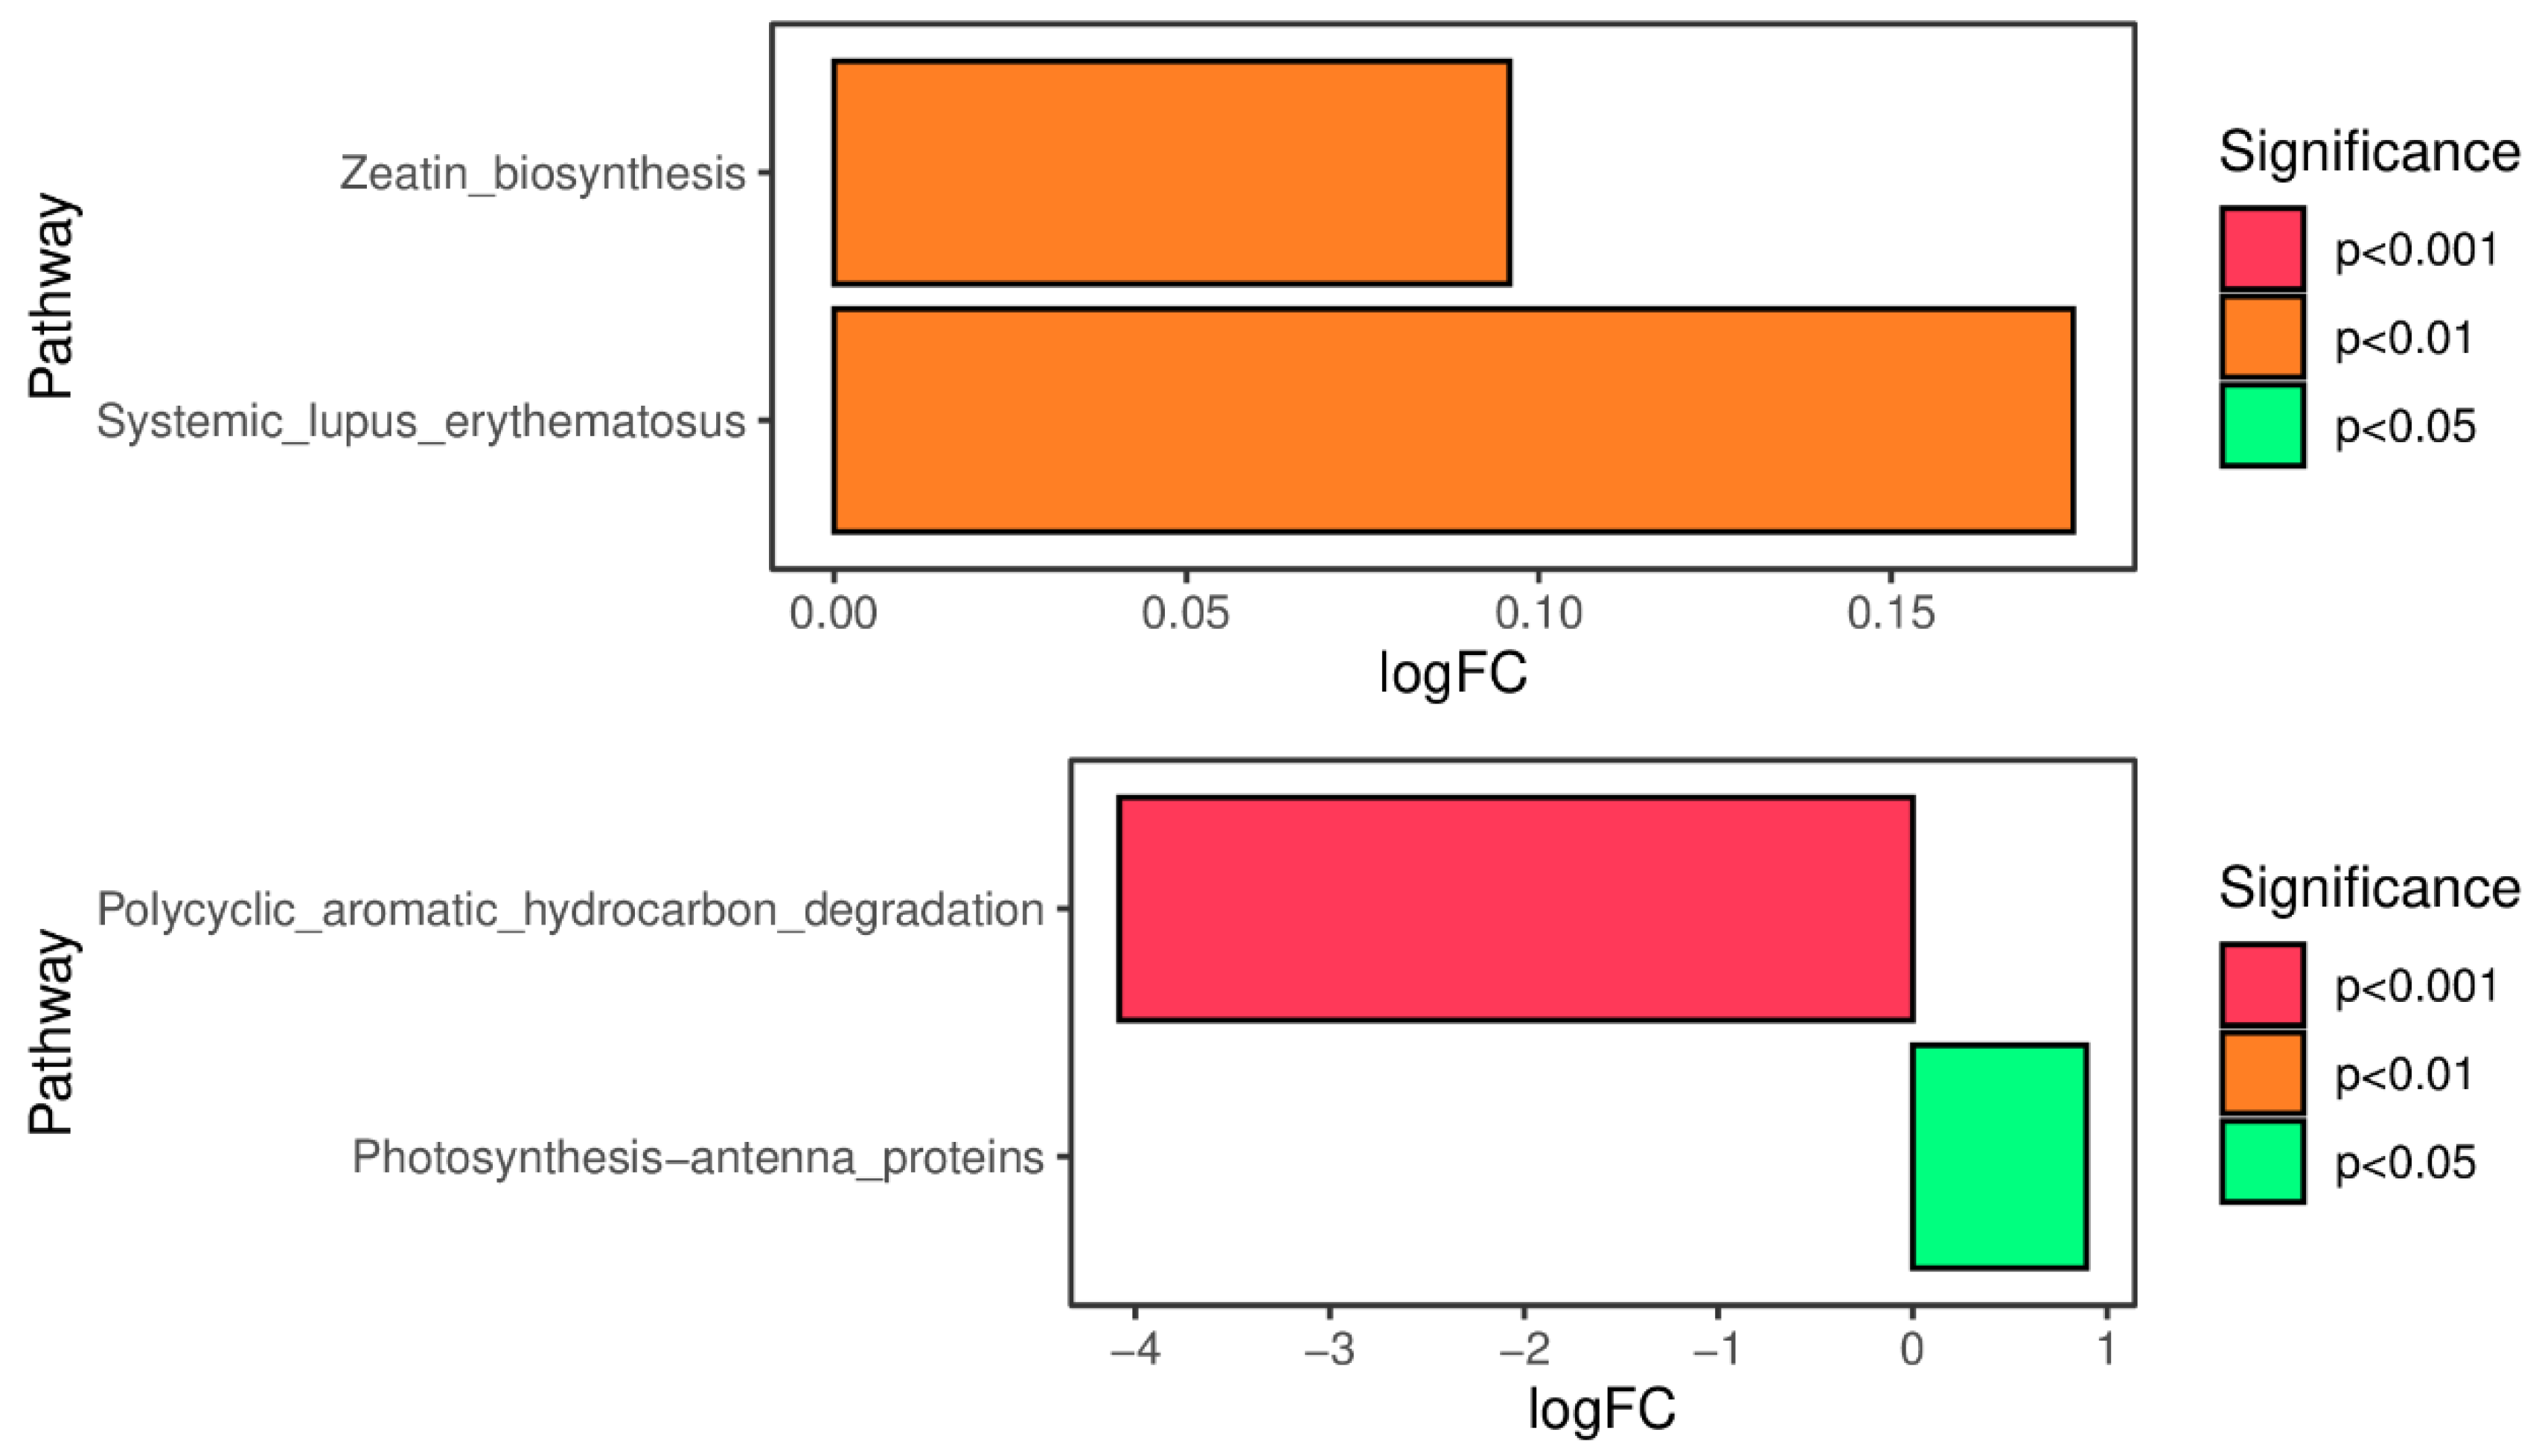
As shown in
Figure 5a, compared with the SDA group, the Zeatin_biosynthesis pathway and Systemic_lupus_erythematosus pathway were significantly upregulated in the TMR group (P<0.01); as shown in
Figure 5b, compared with the AO group, the Photosynthesis_antenna-proteins pathway was significantly upregulated in the TMR group (P<0.05), and the Polycyclic_aromatic_hydrocarbon_degeadation pathway was significantly downregulated (P<0.001).
As shown in
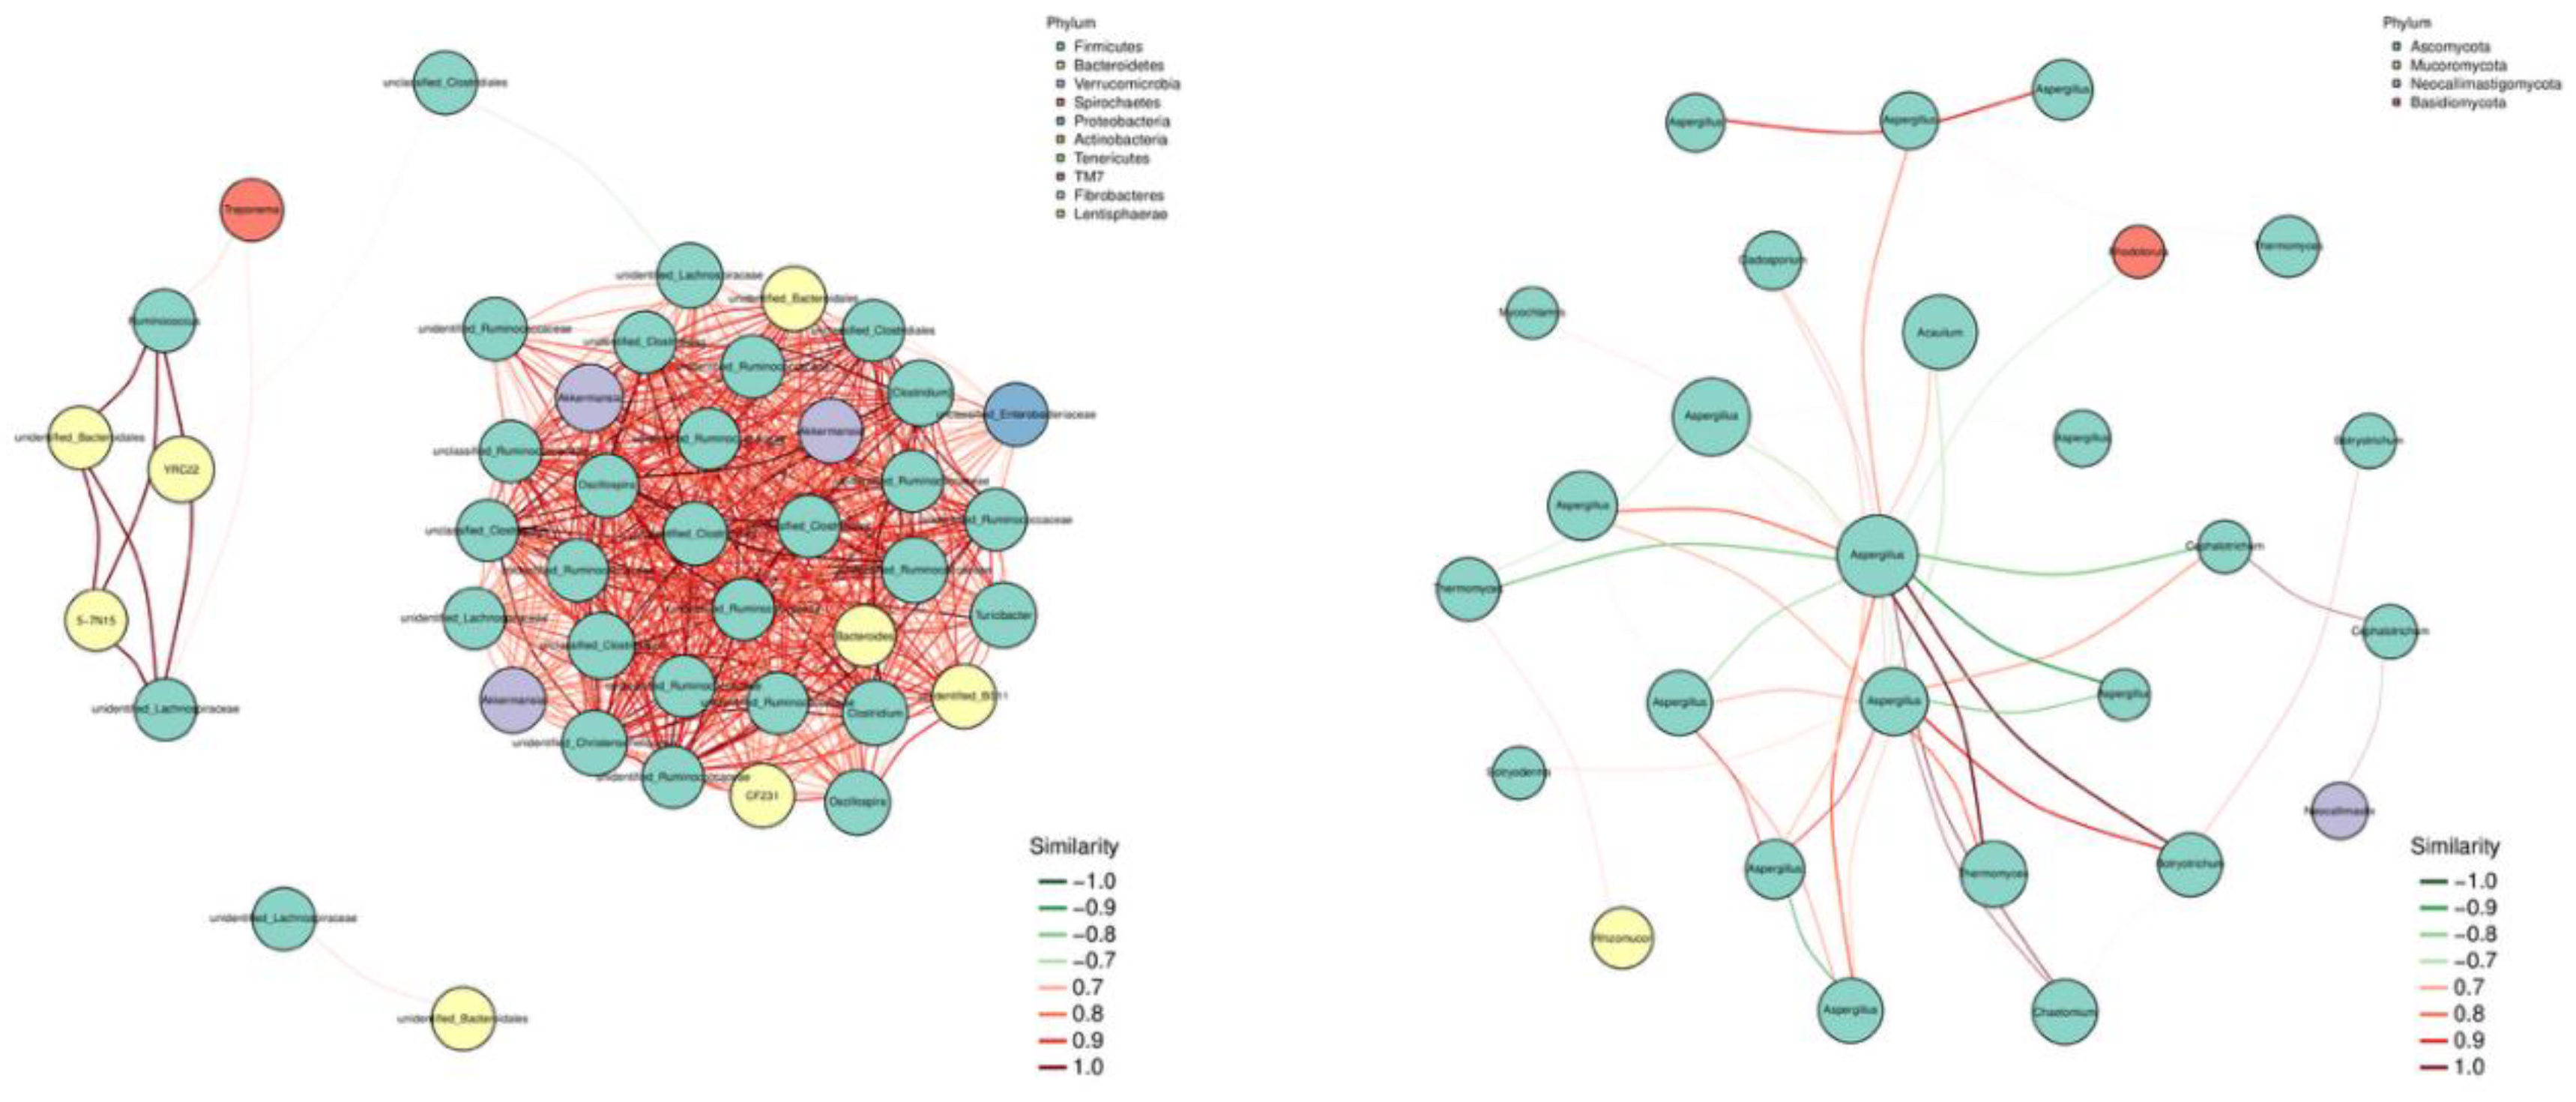
Figure 6a, at the bacterial level, there are significant positive correlations among the Firmicutes, Bacteroidetes, Verrucomicrobia, and Proteobacteria phyla, indicating a strong synergistic effect in the rumen of lactating camels.
Figure 6b shows that at the fungal level, there are high levels of synergistic and antagonistic effects among the Ascomycota phyla. Ascomycota is significantly positively correlated with Neocallimastigomycota and Mucoromycota phyla, and significantly negatively correlated with Basidiomycota phylum.
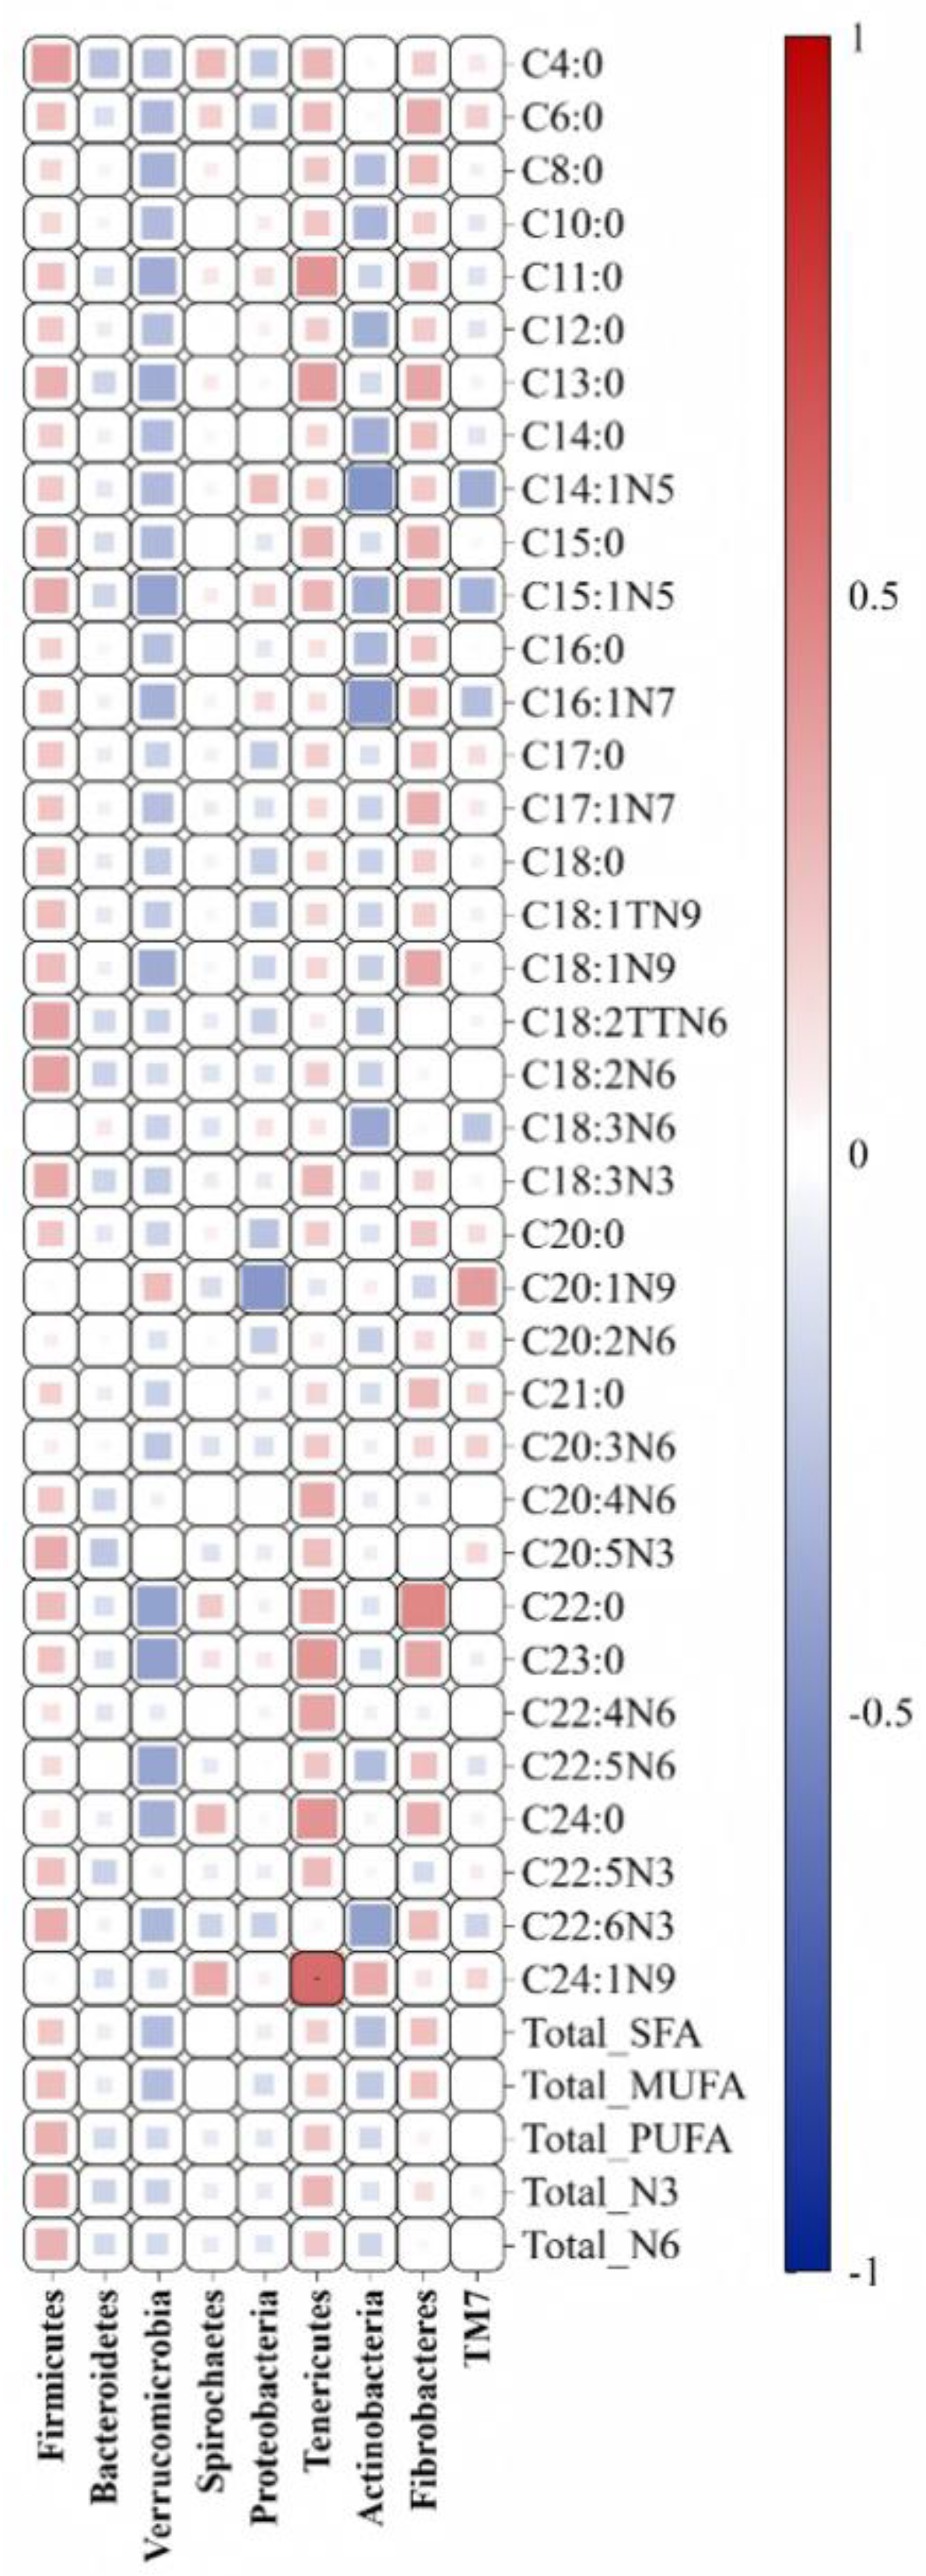
As shown in
Figure 7, the C24:1N9 content in camel milk was significantly positively correlated with the abundance of Tenericutes bacteria (P<0.05).
4. Discussion
Camels, due to their unique physiological structure, can survive for a long time in arid conditions, and their milk provides a good source of nutrition for local herders. Currently, common camel diet additives mainly include enzyme preparations and probiotic preparations. Adding feed additives to the diet can significantly improve the camel’s productivity, improve the rumen environment, and reduce acidosis [
5]. Sodium diacetate, as a common feed additive and preservative, is widely used in the production and preservation of silage for ruminants and has the effect of improving the nutritional value and aerobic stability of silage [
23]. The addition of sodium diacetate in this experiment had no significant effect on milk yield or routine milk quality in lactating camels, which is consistent with the results of Shockey’s study in dairy cows [
24]. Aspergillus oryzae, a fungal enzyme, has been widely used in dairy production. Adding aspergillus oryzae to the diet can significantly increase cellulose-decomposing bacteria in the rumen and improve the apparent digestibility of dry matter [
15]. Zhang [
25] research shows that adding kojimab to dairy cow diets can significantly increase milk yield, milk protein and lactose content, and alter the composition of the hindgut microbiota. This differs from some of the results of this experiment. In this experiment, the addition of kojimab did not significantly affect the milk yield and routine milk production of lactating camels, but the microbiological results were more consistent. There was a clear separation of the fungal flora among the different groups in the feces. This may be related to the fungal properties of kojimab. Camels themselves have a strong ability to digest fiber and abundant fiber-digesting bacteria. The addition of kojimab has little effect on the fiber-digesting ability of bacteria [
26]. In this experiment, although the addition of sodium diacetate and kojimab had no significant effect on the milk yield and conventional milk quality of lactating camels, the addition of kojimab and sodium diacetate significantly increased the vitamin E and vitamin C content in camel milk, and there were significant differences in the content of polyunsaturated fatty acids (
Table 7), with the addition of sodium diacetate showing the best effect. However, there is currently limited research on the deposition mechanisms of vitamin E, vitamin C, and fatty acids in camel milk, which could be the focus of future research. The correlation analysis showed a high positive correlation between Tenericutes phylum and C24:1N9. While the exact nature of Tenericutes phylum is still unclear, it is believed to be a potential mutualistic symbiotic organism in the host gut, increasing lignin digestibility[
27]. However, there was no significant difference in Tenericutes phylum among the three groups, suggesting that the mechanism of action of adding sodium diacetate and kojimab is not to directly affect microbial abundance, but rather to further increase C24:1n9 content through synergistic effects between microorganisms. In the fatty acid results (
Table 7), the C24:1n9 content in camel milk was significantly higher in the TMR and AO groups than in the SOD group. Therefore, we can speculate that Tenericutes phylum may have an antagonistic effect with sodium diacetate but a synergistic effect with kojimab.
Analysis of the fecal microbiota in this experiment showed that the abundance of Melanocarpus in the fecal fungi of the SOD group was significantly higher than that of the TMR and AO groups. Current research on Melanocarpus shows that as a xylanase-producing microorganism, it can effectively decompose arabinoxylan in the diet, reduce feed viscosity, and improve the digestibility of ruminant feed [
28]. This indicates that adding SOD can improve the ability of bacteria in the camel’s gastrointestinal tract to digest fiber, thereby promoting feed digestion and metabolism. KEGG analysis of the gut microbiota revealed that the expression of the zeatin biosynthesis pathway and Systemic_lupus_erythematosus pathway was significantly lower in the SOD group compared to the TMR group. The zeatin biosynthesis pathway can regulate the utilization of carbohydrates by the microbial community [
29]. The Systemic_lupus_erythematosus pathway is closely related to the gastrointestinal microbiota [
30]. Differences in the gastrointestinal flora led to metabolic dysfunction, affecting local gastrointestinal function, which in turn affects the expression of the Systemic_lupus_erythematosus pathway [
31]. This reduces the animal’s immune system capacity. Therefore, we can infer that adding sodium diacetate to the diet can effectively improve the stability of the gastrointestinal flora in lactating camels and improve the utilization efficiency of carbohydrates. The comparison of KEGG differential pathways between the AO group and the TMR group shows that the Photosynthesis_antenna-proteins pathway was significantly upregulated in the TMR group and significantly downregulated in the Photosynthesis_antenna-proteins pathway. Polycyclic aromatic hydrocarbons (PAHs) are dangerous environmental pollutants that have been classified as carcinogens and affect several diseases in humans [
32]. Current research shows that when dairy cows are exposed to PAH contamination, PAH residues remain in their milk, posing a significant risk of transfer from dairy products to humans [
33]. However, in this study, the PAH degradation pathway was significantly enhanced in the AO group, indicating that adding kojimab to the diet can effectively improve the degradation rate of PAH in camels, thereby improving the safety of camel milk.
The fecal microbial network analysis results showed that Firmicutes were the central phylum in the bacterial network, which may mean that Firmicutes plays a major core role in the three groups of lactating camel fecal bacteria. There was also a significant positive correlation between Firmicutes and Bacteroidetes. Currently, Firmicutes and Bacteroidetes are the main phyla in ruminant microbiology research in lignin decomposition and carbohydrate binding [
34]. This is consistent with the results of this experiment, indicating that there is a high degree of synergy among lactating camel microbes and that they may produce the same metabolites. Fungal results showed that Asomycota plays a major core role in fungal communities and is crucial in cellulose degradation [
35]. Asomycota, along with Basidiomycota, is typically a major fungal community in the gastrointestinal tract of ruminants. However, in the expression network of this study, Asomycota and Basidiomycota exhibited some antagonistic activity. Both Asomycota and Basidiomycota are non-anaerobic fungi and were previously considered dominant fungi in the gastrointestinal tract of ruminants[
36].The antagonistic activity between Asomycota and Basidiomycota in this study may be related not only to competition for rumen oxygen, but also to competition between the addition of sodium diacetate and fungal kojimaase to the diet, leading to niche competition between the two fungal communities.
Therefore, this experiment used sodium diacetate and kojimab as feed additives to study their effects on milk yield, milk quality, and fecal microbiota in lactating camels. However, the experiment still has limitations. The optimal ratio of the two additives and the main metabolic differences between the additives are not yet clear. But the main purpose is to provide ideas for future research to find the metabolic mechanisms of sodium diacetate and kojimab, as well as their optimal feeding amounts, and thus improve the quality of camel milk from lactating camels.
5. Conclusions
The results of this study show that, under the same feed conditions, adding sodium diacetate or kojimab to the diet can improve the quality of camel milk to a certain extent without affecting milk yield, and adding 1000 mg of sodium diacetate has the best effect.
Supplementary Materials
The following supporting information can be downloaded at the website of this paper posted on Preprints.org.
Author Contributions
Conceptualization, Zhijun Zhang, Wenxin Zheng; methodology, Ziting Wang; software, Ziting Wang; validation, Qiyuan Deng, and Jingjing Wu; formal analysis, Ziting Wang; investigation, Ziting Wang; resources, Ziting Wang; data curation, Weiting Xing, Yong Tuo; writing—original draft preparation, Ziting Wang; writing—review and editing,Dehang Song; visualization, Har Ali; supervision, Zhijun Zhang; project administration, Zhijun Zhang; funding acquisition, Wenxin Zheng. All authors have read and agreed to the published version of the manuscript.
Funding
This research was funded by Technology Integration and Demonstration for Efficient Conversion and Utilization of Cotton Straw and Coordinated Development of Grass-Livestock Industry (AKS-2025-AGTI-F09); Sub-task of the 6th major special project of the autonomous region: “Investigation and basic parameter collection of rapid detection instruments for pesticide and veterinary drug residues” (2022A02006-6-2).
Institutional Review Board Statement
The animal study protocol was approved by the Ethics Committee of Institute of Feed Research, Xinjiang Academy of Animal Science (protocol code NO. 11 20231228 and 11 November 2023 date of approval).
Informed Consent Statement
Informed consent was obtained from all subjects involved in the study.
Data Availability Statement
The original contributions presented in this study are included in the article/supplementary material. Further inquiries can be directed to the corresponding authors.
Conflicts of Interest
The authors declare no competing financial interests or personal relationships that could have influenced the work reported in this paper.
References
- Muthukumaran, MS; Mudgil, P; Baba, WN; Ayoub, MA; Maqsood, S. A comprehensive review on health benefits, nutritional composition and processed products of camel milk. Food Rev Int. 2023, 39(6), 3080–3116. [Google Scholar] [CrossRef]
- Vincenzetti, S; Cammertoni, N; Rapaccetti, R; et al. Nutraceutical and Functional Properties of Camelids’ Milk. Beverages 2022, 8(1), 12. [Google Scholar] [CrossRef]
- Ait El Alia, O; Zine-Eddine, Y; Chaji, S; Boukrouh, S; Boutoial, K; Faye, B. Global camel milk industry: A comprehensive overview of production, consumption trends, market evolution, and value chain efficiency. Small Rumin Res. 2025, 243, 107441. [Google Scholar] [CrossRef]
- Nastoh, NA; Waqas, M; Çınar, AA; Salman, M. The impact of phytogenic feed additives on ruminant production: A review. [CrossRef]
- Sallam, SMA; Abo-Baker, FA; Attia, MFA; et al. Effect of microbial feed additives on performance of Maghrebian she-camels under Egyptian conditions. Small Rumin Res. 2025, 252, 107574. [Google Scholar] [CrossRef]
- Ghazzawy, HS; Alqahtani, NK; Sheikh, A; et al. Phoenix dactylifera seed-derived biochar as a sustainable and environmentally feed supplement in camel: impacts gas production, methane emissions, nutrient degradability and fermentation parameters, performance predictions. Front Vet Sci. 2025, 12. [Google Scholar] [CrossRef]
- Wang, S; Liu, H; Zhao, J; Dong, Z; Li, J; Shao, T. Influences of Organic Acid Salts and Bacterial Additives on Fermentation Profile, Aerobic Stability, and In Vitro Digestibility of Total Mixed Ration Silage Prepared with Wet Hulless Barley Distillers’ Grains. Agronomy 2023, 13(3), 672. [Google Scholar] [CrossRef]
- 添加双乙酸钠对裹包TMR贮存效果及奶牛生产性能的影响.
- Uwineza, C; Parchami, M; Bouzarjomehr, M; Taherzadeh, MJ; Mahboubi, A. Recent Developments in the Application of Filamentous Fungus Aspergillus oryzae in Ruminant Feed. Animals 2024, 14(16), 2427. [Google Scholar] [CrossRef]
- Effects of feeding Aspergillus oryzae fermentation product to transition Holstein cows on performance and health. Accessed. (accessed on 3 December 2025). [CrossRef]
- Sallam, SMA; Abdelmalek, MLR; Kholif, AE; et al. The effect of Saccharomyces cerevisiae live cells and Aspergillus oryzae fermentation extract on the lactational performance of dairy cows. Anim Biotechnol. 2020, 31(6), 491–497. [Google Scholar] [CrossRef]
- EFSA Panel on Additives and Products or Substances used in Animal Feed (FEEDAP). Scientific Opinion on the safety and efficacy of acetic acid, sodium diacetate and calcium acetate as preservatives for feed for all animal species. EFSA J 2012, 10(2), 2571. [CrossRef]
- Tricarico, JM; Johnston, JD; Dawson, KA. Dietary supplementation of ruminant diets with an Aspergillus oryzae α-amylase. Anim Feed Sci Technol. 2008, 145(1), 136–150. [Google Scholar] [CrossRef]
- Guo, L; Zhang, D; Du, R; Li, F; Li, F; Ran, T. Supplementation of Aspergillus oryzae Culture Improved the Feed Dry Matter Digestibility and the Energy Supply of Total Volatile Fatty Acid Concentrations in the Rumen of Hu Sheep. Front Nutr. 2022, 9. [Google Scholar] [CrossRef] [PubMed]
- Higginbotham, GE; Santos, JEP; Juchem, SO; DePeters, EJ. Effect of feeding Aspergillus oryzae extract on milk production and rumen parameters. Livest Prod Sci. 2004, 86(1), 55–59. [Google Scholar] [CrossRef]
- Chiquette, J. Saccharomyces cerevisiae and Aspergillus oryzae, used alone or in combination, as a feed supplement for beef and dairy cattle. Can J Anim Sci. 1995, 75(3), 405–415. [Google Scholar] [CrossRef]
- Gomez-Alarcon, RA; Dudas, C; Huber, JT. Influence of Cultures of Aspergillus oryzae on Rumen and Total Tract Digestibility of Dietary Components1. J Dairy Sci. 1990, 73(3), 703–710. [Google Scholar] [CrossRef]
- Terzi, V; Infascelli, F; Tudisco, R; Russo, G; Stanca, AM; Faccioli, P. Quantitative detection of Secale cereale by real-time PCR amplification. LWT - Food Sci Technol. 2004, 37(2), 239–246. [Google Scholar] [CrossRef]
- UPARSE: highly accurate OTU sequences from microbial amplicon reads | Nature Methods. Available online: https://www.nature.com/articles/nmeth.2604 (accessed on 3 December 2025).
- Bolyen, E; Rideout, JR; Dillon, MR; et al. Reproducible, interactive, scalable and extensible microbiome data science using QIIME 2. Nat Biotechnol. 2019, 37(8), 852–857. [Google Scholar]
- Multiple common variants for celiac disease influencing immune gene expression | Nature Genetics. Available online: https://www.nature.com/articles/ng.543 (accessed on 3 December 2025).
- STAMP: statistical analysis of taxonomic and functional profiles | Bioinformatics | Oxford Academic. Available online: https://academic.oup.com/bioinformatics/article/30/21/3123/2422240 (accessed on 3 December 2025).
- Li, YF; Wang, LL; Jeong, EC; Kim, HJ; Ahmadi, F; Kim, JG. Effects of sodium diacetate or microbial inoculants on aerobic stability of wilted rye silage. Anim Biosci. 2022, 35(12), 1871–1880. [Google Scholar] [CrossRef]
- Shockey, WL; Heinrichs, AJ; Weiss, WP; Conrad, HR. Evaluation of Sodium Diacetate-Treated Alfalfa Silage for Lactating Dairy Cows. J Prod Agric. 1990, 3(3), 381–385. [Google Scholar] [CrossRef]
- Response of Milk Performance, Rumen and Hindgut Microbiome to Dietary Supplementation with Aspergillus oryzae Fermentation Extracts in Dairy Cows | Current Microbiology. Available online: https://link.springer.com/article/10.1007/s00284-022-02790-z (accessed on 3 December 2025).
- Rabee, AE; Forster, R; Sabra, EA. Lignocelluloytic activities and composition of bacterial community in the camel rumen. AIMS Microbiol. 2021, 7(3), 354–367. [Google Scholar] [CrossRef] [PubMed]
- Exploring age-related changes in gut bacterial community composition of yak: insights from different age groups | BMC Microbiology. Available online: https://link.springer.com/article/10.1186/s12866-025-04011-6 (accessed on 3 December 2025).
- Phuyal, M; Budhathoki, U; Bista, D; Shakya, S; Shrestha, R; Shrestha, AK. Xylanase-Producing Microbes and Their Real-World Application. Int J Chem Eng. 2023, 2023(1), 3593035. [Google Scholar] [CrossRef]
- Zhang, R; Bao, X; Shi, X; et al. In Vitro Evaluation of Enzymatically Transformed Alfalfa Saponins on Methane Reduction, Rumen Microbes and Metabolomics in Goats. Animals 2025, 15(11), 1516. [Google Scholar] [CrossRef]
- Wang, J; Fan, H; Li, M; et al. Integration of Non-Coding RNA and mRNA Profiles Reveals the Mechanisms of Rumen Development Induced by Different Types of Diet in Calves. Genes 2023, 14(5), 1093. [Google Scholar] [CrossRef] [PubMed]
- Effect of Zanthoxylum bungeanum essential oil on rumen enzyme activity, microbiome, and metabolites in lambs | PLOS One. Available online: https://journals.plos.org/plosone/article?id=10.1371/journal.pone.0272310 (accessed on 3 December 2025).
- Straif, K; Baan, R; Grosse, Y; Secretan, B; Ghissassi, FE; Cogliano, V. Carcinogenicity of polycyclic aromatic hydrocarbons. Lancet Oncol. 2005, 6(12), 931–932. [Google Scholar] [CrossRef]
- Evaluation of the Risk of PAHs and Dioxins Transfer to Humans via the Dairy Ruminant | SpringerLink. Available online: https://link.springer.com/chapter/10.1007/3-540-26531-7_38 (accessed on 3 December 2025).
- da Silva Pereira, M; Alcantara, LM; de Freitas, LM; de Oliveira Ferreira, AL; Leal, PL. Microbial Rumen proteome analysis suggests Firmicutes and Bacteroidetes as key producers of lignocellulolytic enzymes and carbohydrate-binding modules. Braz J Microbiol. 2025, 56(2), 817–833. [Google Scholar] [CrossRef]
- Li, Y; Li, X; Liu, Y; et al. Comparison of Bacterial and Fungal Community Structure and Potential Function Analysis of Yak Feces before and after Weaning. BioMed Res Int. 2022, 2022(1), 6297231. [Google Scholar] [CrossRef]
- Cui, X; Liu, Y; Wu, H; et al. Dynamic changes in the yak rumen eukaryotic community and metabolome characteristics in response to feed type. Front Vet Sci. 2022, 9. [Google Scholar] [CrossRef]
Figure 1.
Venn diagram of the microbial flora of lactating camels with different feed additives. (a) Bacteria, (b) Fungi.
Figure 1.
Venn diagram of the microbial flora of lactating camels with different feed additives. (a) Bacteria, (b) Fungi.
Figure 2.
Alpha diversity analysis of microorganisms in feces of lactating camels with different feed additives. (a) Bacterial Chao1 index, (b) Bacterial Simpson index, (c) Bacterial Shannon index, (d) Fungal Chao1 index, (e) Fungal Simpson index, (f) Fungal Shannon index.
Figure 2.
Alpha diversity analysis of microorganisms in feces of lactating camels with different feed additives. (a) Bacterial Chao1 index, (b) Bacterial Simpson index, (c) Bacterial Shannon index, (d) Fungal Chao1 index, (e) Fungal Simpson index, (f) Fungal Shannon index.
Figure 3.
PCA diagram of fecal microorganisms in lactating camels with different feed additives. (a) Bacteria, (b) Fungi.
Figure 3.
PCA diagram of fecal microorganisms in lactating camels with different feed additives. (a) Bacteria, (b) Fungi.
Figure 4.
Microbial abundance in feces of lactating camels with different feed additives. (a) Phylum level, (b) Genus’s level, (c) Phylum level, (d) Genus’s level.
Figure 4.
Microbial abundance in feces of lactating camels with different feed additives. (a) Phylum level, (b) Genus’s level, (c) Phylum level, (d) Genus’s level.
Figure 5.
Differential metabolic pathways of microorganisms in feces of lactating camels with different feed additives. (a) Bacterial TMR vs SDA, (b) Bacterial TMR vs AO.
Figure 5.
Differential metabolic pathways of microorganisms in feces of lactating camels with different feed additives. (a) Bacterial TMR vs SDA, (b) Bacterial TMR vs AO.
Figure 6.
Co-expression network of microorganisms in feces of lactating camels with different feed additives. (a) Bacteria, (b).
Figure 6.
Co-expression network of microorganisms in feces of lactating camels with different feed additives. (a) Bacteria, (b).
Figure 7.
Association analysis of fatty acids and bacterial microorganisms in lactating camels with different feed additives.
Figure 7.
Association analysis of fatty acids and bacterial microorganisms in lactating camels with different feed additives.
Table 1.
Feed formula and nutritional composition.
Table 1.
Feed formula and nutritional composition.
| Item |
TMR |
SDA |
AO |
| Corn |
10.98 |
10.98 |
10.98 |
| Bran |
6.34 |
6.34 |
6.34 |
| Soybean meal |
2.44 |
2.44 |
2.44 |
| Cottonseed meal |
2.68 |
2.68 |
2.68 |
| Camel premix1
|
1.22 |
1.22 |
1.22 |
| Salt |
0.73 |
0.73 |
0.73 |
| Wheat straw |
34.9 |
34.9 |
34.9 |
| Alfalfa |
23.26 |
23.26 |
23.26 |
| Hydroponic fodder |
17.45 |
17.45 |
17.45 |
| total |
100 |
100 |
100 |
| Nutritional Information |
| Energy(MJ/kg) |
14.71 |
14.71 |
14.71 |
| Crude protein% |
12.63 |
12.63 |
12.63 |
| Crude fat% |
3.25 |
3.25 |
3.25 |
| Neutral detergent fiber |
45.12 |
45.12 |
45.12 |
| Acid detergent fiber |
30.02 |
30.02 |
30.02 |
| Calcium% |
1.07 |
1.07 |
1.07 |
| Phosphorus% |
0.57 |
0.57 |
0.57 |
| Aspergillus oryzae(g/d) |
0 |
|
40 |
| Sodium diacetate(mg/kg) |
|
1000 |
|
Table 3.
Differences in milk production performance of lactating camels with different additive groups(n=10).
Table 3.
Differences in milk production performance of lactating camels with different additive groups(n=10).
| Time |
Group |
SEM |
p-Value |
| TMR |
AO |
SDA |
| 0d |
2.71 |
2.74 |
2.66 |
0.124 |
0.99 |
| 10d |
2.78 |
2.47 |
2.67 |
0.129 |
0.28 |
| 20d |
2.43 |
2.57 |
2.73 |
0.124 |
0.48 |
| 30d |
2.46 |
2.67 |
2.56 |
0.128 |
0.29 |
Table 4.
Effects of different feed additives on milk quality.
Table 4.
Effects of different feed additives on milk quality.
| Item (%) |
Time |
Group |
SEM |
p-Value |
| TMR |
AO |
SDA |
| Fat |
Morning |
4.85 |
5.09 |
5.31 |
0.10 |
0.39 |
| Night |
5.37 |
5.3 |
5.54 |
0.14 |
0.93 |
| Non-fat |
Morning |
9.52 |
9.67 |
9.57 |
0.10 |
0.16 |
| Night |
10.14 |
9.64 |
9.84 |
0.11 |
0.41 |
| Lactose |
Morning |
5.2 |
5.29 |
5.23 |
0.05 |
0.15 |
| Night |
5.53 |
5.27 |
5.37 |
0.06 |
0.41 |
| Conductivity |
Morning |
2.6 |
2.5 |
2.43 |
0.51 |
0.48 |
| Night |
2.58 |
2.52 |
2.42 |
0.04 |
0.49 |
| Milk Protein |
Morning |
3.6 |
3.66 |
3.62 |
0.04 |
0.19 |
| Night |
3.83 |
3.64 |
3.72 |
0.04 |
0.43 |
| pH |
Morning |
4.04 |
4.05 |
4.04 |
0.00 |
0.98 |
| Night |
4.04 |
4.03 |
4.04 |
0.00 |
0.57 |
| Freezing Point |
Morning |
61.27 |
62.01 |
61.38 |
0.54 |
0.12 |
| Night |
64.17 |
59.47 |
62.39 |
0.85 |
0.28 |
| Ash |
Morning |
0.72 |
0.73 |
0.73 |
0.01 |
0.14 |
| Night |
0.77 |
0.73 |
0.75 |
0.01 |
0.44 |
Table 5.
Effects of different feed additives on bioactive substances in lactating camel milk.
Table 5.
Effects of different feed additives on bioactive substances in lactating camel milk.
| Item |
Group |
SEM |
p-Value |
| TMR |
AO |
SDA |
| VE |
5.28Cc
|
6.69Bb
|
7.61Aa
|
0.22 |
0.001 |
| Insulin |
2.23 |
3.49 |
3.10 |
0.29 |
0.494 |
| VC |
90.89Bb
|
101.82AaBb
|
106.32Aa
|
3.17 |
0.001 |
Table 6.
Effects of different feed additives on trace elements in lactating camel milk.
Table 6.
Effects of different feed additives on trace elements in lactating camel milk.
| Item |
Group |
SEM |
p-Value |
| TMR |
AO |
SDA |
| Na |
775.02 |
703.78 |
721.31 |
17.7 |
0.55 |
| Mg |
137.10 |
140.66 |
140.23 |
3.51 |
0.38 |
| K |
2120.06 |
1987.92 |
1850.58 |
53.42 |
0.32 |
| Ca |
1122.70 |
1213.14 |
1205.38 |
43.73 |
0.89 |
| Fe |
1.62 |
1.20 |
1.69 |
0.11 |
0.19 |
Table 7.
Effects of different feed additives on fatty acid content in lactating camel milk.
Table 7.
Effects of different feed additives on fatty acid content in lactating camel milk.
| Item |
Group |
SEM |
p-Value |
| TMR |
AO |
SDA |
| C18:0 |
99 |
98.81 |
113.07 |
5.54 |
0.79 |
| C18:1TN9 |
426.95 |
424.82 |
486.17 |
23.78 |
0.80 |
| C18:1N9 |
187.99 |
168.05 |
212.26 |
9.49 |
0.39 |
| C18:2TTN6 |
2.03 |
1.85 |
2.01 |
0.15 |
0.78 |
| C18:2N6 |
47.6 |
41.96 |
50.65 |
2.41 |
0.37 |
| C18:3N6 |
1.73 |
1.86 |
1.83 |
0.03 |
0.40 |
| C18:3N3 |
15.24 |
12.31 |
15.93 |
1.15 |
0.14 |
| C20:0 |
3.24 |
3.01 |
3.65 |
0.23 |
0.81 |
| C20:1N9 |
2.48 |
2.04 |
2.38 |
0.25 |
0.62 |
| C20:2N6 |
5.43 |
5.07 |
5.97 |
0.34 |
0.46 |
| C21:0 |
0.84Bb
|
0.75Bb
|
1.06Aa
|
0.07 |
0.006 |
| C20:3N6 |
5.21Aa
|
4.37Bb
|
5.09Aa
|
5.74 |
0.007 |
| C20:4N6 |
7.61 |
6.49 |
7.37 |
0.46 |
0.33 |
| C20:5N3 |
0.69a
|
0.55b
|
0.68a
|
0.04 |
0.05 |
| C22:0 |
3.37 |
3.24 |
4.00 |
0.2 |
0.46 |
| C23:0 |
8.98 |
9.25 |
9.8 |
0.66 |
0.13 |
| C22:4N6 |
1.82 |
1.65 |
1.62 |
0.17 |
0.17 |
| C22:5N6 |
0.24 |
0.23 |
0.31 |
0.02 |
0.70 |
| C24:0 |
13.92 |
13.62 |
14.85 |
1.00 |
0.45 |
| C22:5N3 |
1.8 |
1.62 |
1.95 |
0.15 |
0.19 |
| C22:6N3 |
0.22b
|
0.25b
|
0.39a
|
0.03 |
0.07 |
| C24:1N9 |
24.97Aa
|
21.53Aa
|
15.88Bb
|
1.97 |
0.007 |
Table 8.
Effects of different feed additives on serum antioxidant levels in lactating camels.
Table 8.
Effects of different feed additives on serum antioxidant levels in lactating camels.
| Item |
Group |
SEM |
P-Value |
| TMR |
SDA |
AO |
| SOD |
196.58 |
187.17 |
91.97 |
3.96 |
0.65 |
| MDA |
1.76 |
1.76 |
1.48 |
0.10 |
0.46 |
| GSH-PX |
127.57 |
118.83 |
124.27 |
7.19 |
0.89 |
| CAT |
0.97 |
1.07 |
0.82 |
0.07 |
0.12 |
| T-AOC |
1.47 |
1.47 |
1.50 |
0.02 |
0.86 |
Table 9.
Differences in the level of bacterial phylum in feces of lactating camels with different feed additives.
Table 9.
Differences in the level of bacterial phylum in feces of lactating camels with different feed additives.
| Item |
Group |
SEM |
p-Value |
| TMR |
SDA |
AO |
| Firmicutes |
0.63 |
0.61 |
0.59 |
0.02 |
0.70 |
| Bacteroidetes |
0.23 |
0.29 |
0.08 |
0.05 |
0.39 |
| Verrucomicrobia |
0.06 |
0.05 |
0.05 |
0.01 |
0.43 |
| Spirochaetes |
0.03 |
0.02 |
0.02 |
0.003 |
0.84 |
| Proteobacteria |
0.01 |
0.01 |
0.01 |
0.003 |
0.80 |
| Tenericutes |
0.01 |
0.01 |
0.01 |
0.001 |
0.57 |
| Actinobacteria |
0.02Aa |
0.005Bb |
0.005Bb |
0.002 |
0.01 |
| Fibrobacteres |
0.001 |
0.003 |
0.002 |
0.001 |
0.76 |
| TM7 |
0.002 |
0.002 |
0.001 |
0.0002 |
0.09 |
| other |
0.004 |
0.004 |
0.006 |
0.001 |
0.35 |
Table 10.
Differences in bacterial genera and microorganism levels in feces of lactating camels with different feed additives.
Table 10.
Differences in bacterial genera and microorganism levels in feces of lactating camels with different feed additives.
| Item |
Group |
SEM |
p-Value |
| TMR |
SDA |
AO |
| Ruminococcaceae |
0.22 |
0.20 |
0.20 |
0.010 |
0.43 |
| Bacteroidales |
0.10 |
0.13 |
0.17 |
0.180 |
0.31 |
| unidentified_Clostridiales |
0.10 |
0.11 |
0.10 |
0.002 |
0.86 |
| unclassified_Clostridiales |
0.06 |
0.06 |
0.06 |
0.002 |
0.90 |
| Akkermansia |
0.06 |
0.04 |
0.04 |
0.010 |
0.40 |
| Lachnospiraceae |
0.04 |
0.06 |
0.03 |
0.010 |
0.63 |
| Christensenellaceae |
0.03 |
0.02 |
0.02 |
0.002 |
0.99 |
| Ruminococcus |
0.03 |
0.02 |
0.02 |
0.003 |
0.93 |
| Treponema |
0.03 |
0.02 |
0.02 |
0.003 |
0.84 |
| other |
0.33 |
0.32 |
0.32 |
0.010 |
0.91 |
Table 11.
Differences in the level of fungi in feces from lactating camels with different feed additives.
Table 11.
Differences in the level of fungi in feces from lactating camels with different feed additives.
| Item |
Group |
SEM |
p-Value |
| TMR |
SDA |
AO |
| Ascomycota |
0.99 |
0.99 |
0.99 |
0.003 |
0.64 |
| Fungi_phy_Incertae_sedis |
0.003 |
0.001 |
0.004 |
0.001 |
0.62 |
| Mucoromycota |
0.004 |
0.005 |
0.006 |
0.001 |
0.91 |
| Basidiomycota |
0.002 |
0.001 |
0.002 |
0.001 |
0.73 |
| Neocallimastigomycota |
0.003 |
0.001 |
0.001 |
0.001 |
0.36 |
| unclassified_Fungi |
0.0003 |
0.00 |
0.00004 |
0.0001 |
0.39 |
| Mortierellomycota |
0.00 |
0.00 |
0.00001 |
0.000003 |
0.42 |
| Chytridiomycota |
0.000006 |
0.00 |
0.00 |
0.000002 |
0.42 |
| Rozellomycota |
0.00 |
0.000006 |
0.00 |
0.000002 |
0.42 |
| Ascomycota |
0.99 |
0.99 |
0.99 |
0.003 |
0.64 |
Table 12.
Differences in the level of fungal genera in feces of lactating camels with different feed additives.
Table 12.
Differences in the level of fungal genera in feces of lactating camels with different feed additives.
| Item |
Group |
SEM |
p-Value |
| TMR |
SDA |
AO |
| Aspergillus |
0.49 |
0.46 |
0.56 |
0.03 |
0.57 |
| Thermomyces |
0.37 |
0.46 |
0.37 |
0.03 |
0.44 |
| Acaulium |
0.00 |
0.00 |
0.0009 |
0.0003 |
0.42 |
| Pichia |
0.09 |
0.0007 |
0.008 |
0.03 |
0.39 |
| Melanocarpus |
0.0008Bb |
0.05Aa |
0Bb |
0.009 |
0.002 |
| Mycothermus |
0.00 |
0.01 |
0.02 |
0.006 |
0.59 |
| Fungi_gen_Incertae_sedis |
0.003 |
0.001 |
0.004 |
0.001 |
0.62 |
| Diutina |
0.03 |
0.00 |
0.00 |
0.009 |
0.42 |
| other |
0.02 |
0.02 |
0.04 |
0.008 |
0.48 |
| Aspergillus |
0.49 |
0.46 |
0.56 |
0.03 |
0.57 |
|
Disclaimer/Publisher’s Note: The statements, opinions and data contained in all publications are solely those of the individual author(s) and contributor(s) and not of MDPI and/or the editor(s). MDPI and/or the editor(s) disclaim responsibility for any injury to people or property resulting from any ideas, methods, instructions or products referred to in the content. |
© 2025 by the authors. Licensee MDPI, Basel, Switzerland. This article is an open access article distributed under the terms and conditions of the Creative Commons Attribution (CC BY) license (http://creativecommons.org/licenses/by/4.0/).