Submitted:
05 December 2025
Posted:
07 December 2025
You are already at the latest version
Abstract
Regular health screenings has not yet been widely recognized among pet owners. Thus, we aimed to establish clinical health diagnostic criteria for cats and develop objective, easy-to-use methods for calculating the obesity index and assessing body composition. This review focuses on body composition measurement techniques and introduces evaluation methods for animals. The Body and Muscle Condition Score were used to assess nutritional status. Although easy to measure, these techniques are subjective and dependent on the operator’s skills. Although objective methods for assessing obe-sity and body fat percentage, such as several body mass index and bioelectrical im-pedance analysis, have been established, they have not been widely adopted owing to complexity. The gold standard for body composition evaluation includes several tech-niques; however, their invasiveness and cost make them challenging to use in clinical settings. Consequently, we established a method for assessing body fat percentage and muscle mass using feline body mass index (fBMI) based on skeletal zoometry meas-urements, subcutaneous fat and specific muscle thickness measured by ultrasonogra-phy was established. These techniques are objective obesity evaluation methods that can be easily and stably used in clinical veterinary practice.
Keywords:
body composition
; body mass index
; ultrasonography
; zoometry measurement
; adiposity
; muscularity
; obesity
; sarcopenia
; frailty
1. Introduction
Daily health monitoring at home and veterinary care are important for assessing an animal’s health. Cat owners typically rely on signs, such as appetite, behavior, and stool consistency. However, these may not reveal all the health issues.
Regular health screening is recommended to assess animal health status accurately. In humans, the World Health Organization (WHO) has established guidelines and action plans, such as the “Global Action Plan for Prevention and Control of non-communicable diseases (NCDs) 2023–2030,” for the early detection and prevention of NCDs, such as cardiovascular diseases, diabetes, cancer, and chronic respiratory diseases [1]. Contrastingly, the AAHA’s “Nutritional Assessment Guidelines for Dogs and Cats” designates nutritional assessment as the “fifth vital sign” after body temperature, pulse rate, respiratory rate, and blood pressure, and incorporates nutritional screening assessments into regular health screenings [2]. Additionally, this is applied by WASAVA, which recommends it as part of a standard physical assessment [3]. Based on these guidelines, screening assessments focusing on visual inspection and palpation are routinely conducted alongside interviews in general veterinary practice.
However, health screenings for small animals are voluntary and not widely valued among pet owners, partly due to the lack of standardized packages for health screening and inconsistent testing in primary care. Moreover, objective and reliable diagnostic techniques are still underdeveloped, and screening accuracy remains lower than that in human medicine.
In Sweden, where pet insurance originated and enrollment is the highest, 90% of dogs are insured by law, but only 50% of cats are insured [4]. Moreover, the cost of health screenings and the stress caused by hospital visits to the cats are the key barriers to their widespread availability. Although the IFSM has created a guide for cat owners on veterinary visits, health screenings for cats remain limited, even globally, due to these challenges.
Obesity and frailty are gaining attention, and the value of health screening in veterinary practice is increasingly being recognized. Although body weight is the simplest measure of nutritional status, it cannot distinguish between alterations in body fat, muscle mass, and bone mass. In human health screening, body mass index (BMI), calculated from height and weight, is commonly used. Obesity is linked to increased ectopic fat accumulation in organs, elevated triglyceride levels, high cholesterol levels, and sustained increases in plasma non-esterified fatty acid (NEFA) concentrations [5,6,7,8]. Consequently, it induces lipid toxicity in tissues, resulting in increased insulin secretion and impaired function of pancreatic beta cells, thereby contributing to the onset of severe metabolic disorders, such as diabetes [5,9,10,11].
Waist circumference is a recognized indicator of obesity, as it reflects abdominal ectopic fat accumulation and is useful for tracking changes within individuals [12]. Recently, advances in body composition analyzers have made the routine measurement of body fat percentage and muscle mass possible.
Similar to human obesity indicators, efforts have been made to assess obesity and fat accumulation in cats. However, due to limited accuracy and insufficient data, these methods are not widely adopted in veterinary practice [13,14,15,16,17,18]. Consequently, there is a need for objective, user-friendly methods for cat owners and more accurate body composition assessment methods for clinical use.
Thus, our research group aimed to establish health diagnostic criteria for cats and develop objective, easy-to-use methods for calculating the obesity index and body composition assessment. This review highlights the morphology-based body composition measurement techniques reported to date and introduces evaluation methods relevant to veterinary practice.
2. Previous Approaches
2.1. Simple Evaluation Technique for Adiposity
2.1.1. Body Condition Score (BCS)
The Body Condition Score (BCS) is a diagnostic criterion for obesity based on visual inspection and palpation. Here, the visibility of the chest and spine, the presence of an abdominal waist, and palpation of abdominal fat accumulation are assessed. The WSAVA guidelines use the 9-point scale developed by Laflamme [19]. This technique is cost-effective and easy to perform by veterinary professionals and pet owners. However, this is a subjective method, and the results may differ depending on the operator’s skill and experience, making it challenging to achieve consistently reliable diagnoses.
Thus, efforts have been made to establish an objective method to evaluate obesity based on skeletal zoometric measurements.
2.1.2. Body Mass Index (BMI)
In humans, the body mass index (BMI = BW/(height)2 (kg/m2)), established by Matsuzawa et al. (1990), is commonly adopted [20]. Moreover, this has been incorporated into diabetes screening guidelines recommended by the WHO. Additionally, the Ministry of Health, Labour, and Welfare of Japan has adopted it in the health examination implementation standards established under the Labor Safety and Health Act. BMI is strongly associated with disease incidence, and ideal BMI values have been proposed. Furthermore, it is highly correlated with body fat percentage, abdominal fat accumulation (waist circumference), and hypertension [21,22,23,24]. Additionally, dyslipidemia prevalence (TG/HDL/LDL) increases with increasing BMI [24]. A BMI of 22 is considered appropriate based on disease prevalence [20]. The World Health Organization (WHO) defines a BMI of ≥ 25 as overweight and ≥ 30 as obese and classifies obesity into three categories: Class I (30–35), Class II (35–40), and Class III (40 or higher) [25].
Therefore, height, which is based on external skeletal length, is less affected by weight fluctuations and can be used as an indicator of basic body size. Based on human BMI, several reports on cat BMI based on skeletal length have been published.
Nelson et al. [18] were the first to report cat BMI based on external measurements. The calculation formula is shown:[18]
However, the relevance of blood metabolites, accumulated fat, and metabolic syndrome remains unproven, and their validity has not been confirmed. Moreover, the measurement points for body length and height (including the joints) are unclear, and because cats lack a consistent upright posture like dogs, obtaining stable measurements in a standing position is challenging. Therefore, their clinical application is challenging. Consequently, external measurements for assessing feline obesity are not yet clinically practical or routinely used.
2.1.3. Feline Body Fat Index (FBMI)
Currently, FBMI is used in some veterinary clinics. Howthorine and Butterwick (2000) developed an indirect method for calculating the body fat percentage using external measurements based on skeletal length. In particular, they developed an FBMI table using chest circumference and leg index measurements (LIM: from the middle of the patella to the dorsal tip of the calcaneal process) [15]. This technique involves measuring the ninth rib circumference (chest circumference) and LIM using a standard measuring tape and subsequently estimating the body fat percentage indirectly based on these values. The formula for calculating the body fat percentage is described in the section on evaluation techniques for fat accumulation. This is considered an objective method for evaluating obesity. However, this study has several limitations. For instance, the calculation formula is complex, and the position of the ninth rib cannot be determined in cases of severe obesity, making it challenging to accurately measure chest circumference. Additionally, cats, being carnivorous animals, exhibit higher mobility than other animals, and their chest circumference can differ owing to breathing and posture, making it challenging to obtain stable measurements. Thus, some experience is necessary to obtain accurate measurements. However, owing to the complexity of the calculation formula, it is rarely used in clinical practice.
When considering the BMI of cats, the effects of body composition, such as fat accumulation and muscle mass, are crucial. Recent findings link ectopic fat accumulation in organs and muscles to metabolic syndrome, increasing interest in body composition assessment. The following section introduces methods for evaluating body fat accumulation.
2.2. Evaluation Method for Fat Accumulation
Methods for evaluating body composition based on the morphometric measurements in mammals, including humans, have been investigated for several years. Most of these methods were designed to assess subcutaneous fat accumulation.
Skinfold calipers have been used since the 1950s, when body composition measurement gained importance [26]. It measures skin thickness by sandwiching it between two calipers and was once the most commonly used method for evaluating fat accumulation in humans.
2.2.1. Impedance Method
Body composition analyzers based on bioelectrical impedance analysis are commonly used in humans. To evaluate body composition, bioelectrical impedance analysis uses the characteristics of fat tissue, which demonstrates a lower electrical conductivity and fewer conduction pathways than other tissues. Moreover, it is noninvasive and combines safety and convenience. The assessment of body fat percentage using this method in cats has been reported by Stanton et al. (1992) [27]. Additionally, the following formula for calculating body fat percentage and fat mass in cats has been proposed:
▪Percentage body fat
▪Fat mass (kg)
BW, body weight; L, body length; RF, right forelimb length; PC, pelvic circumference; CTC, cranial thoracic circumference
However, considering that this study used euthanized cats of normal weight, whether obesity or cachexia can be accurately evaluated in living cats has not yet been verified. Additionally, this method is impractical because it requires electrode insertion.
In dogs, a noninvasive bioelectrical impedance-based body fat meter has been commercialized (Health Lab, Kao, Tokyo, Japan). However, the skin has a greater range of motion in cats due to their carnivorous defensive characteristics, making it challenging to obtain stable measurement values. Thus, bioelectrical impedance-based body fat monitoring in cats has not yet been commercialized.
2.2.2. Evaluation method for fat accumulation by FBMI
As mentioned in the BMI section, the FBMI charts were based on the following body fat percentage calculation formula:
Additionally, German and Martin (2010) introduced the following equation:[28]
These methods are indirect but can be utilized as objective methods to evaluate a cat’s body fat percentage. However, cats demonstrate a greater range of motion than other animals, and respiratory movements considerably affect their chest circumference, making it challenging to reliably measure them in a veterinary clinic [29]. Furthermore, these techniques require complex calculations. These limitations hinder their widespread adoption in veterinary practice. Thus, developing simple, reliable, and stable methods is necessary for assessing body fat in cats.
2.3. Simple Evaluation Method for Muscularity
The accumulated fat can mask the reduction in muscle mass in aging cats with sarcopenic obesity, resulting in an assessment that appears to indicate a normal weight. Thus, evaluating muscle mass along with a simple nutritional status assessment in aging animals is important.
2.3.1. Muscle Condition Score (MCS)
Dual-energy X-ray absorptiometry (DEXA), CT, and MRI are considered the gold standards for muscle mass assessment, but are impractical for clinical practice due to similar limitations as fat measurements. To address this, the WSAVA introduced the MCS, a simple, globally recognized method [30]. MCS is a 4-point feline muscle mass scoring system defined as follows: 3, normal muscle mass; 2, slight wasting; 1, moderate wasting; 0, severe wasting [29].
Similar to BCS, it is a subjective method based on visual inspection and palpation. Although pet owners can evaluate this, variations in judgment may exist depending on the evaluator’s skill. Similar to body fat assessment methods, establishing a muscle mass assessment method that is easy and clinically stable is necessary.
2.4. Assessment of the Direct Body Composition
2.4.1. DEXA, CT, and MRI
DEXA, CT, and MRI are considered the gold standards for body composition evaluation. DEXA uses two photon types with different energy levels. It emits radiation into the body and helps estimate the type and quantity of each tissue based on the differences in its radiation attenuation characteristics. Speakman et al. (2001) reported the use of DEXA in cats [31]. DEXA can accurately evaluate accumulated fat mass, lean body mass (such as muscle), and bone mineral content with high accuracy. Furthermore, CT and MRI can distinguish between fat and lean body mass using two-dimensional cross-sectional images of the trunk and can quantify each tissue area.
However, these methods have limitations, including radiation exposure, requirement for anesthesia, and high invasiveness. Moreover, these devices are expensive. Given the high invasiveness of these techniques, our research team attempted to develop a clinically feasible approach for evaluating animal body composition.
3. Development of a New Nutritional Assessment Method
Our research team attempted to establish an objective obesity assessment method based on the skeletal zoometry measurements and a body composition assessment method that can be easily and stably measured in clinical veterinary practice. In this study, some unpublished figures and tables are reported using data from Iwazaki et al. (2022) [32].
4. Materials and Methods
Ovariectomy, food intake, BW, BCS, blood collection, DEXA analysis, ultrasonography, and skeletal zoometry measurements were performed as described in a previous report [32]. All animal procedures were approved by the University of Illinois Institutional Animal Care and Use Committee prior to experimentation (IACUC #17264).
4.1. Statistical Analysis
To evaluate the relationship between body composition measured using DEXA scanning and ultrasonography, linear regression analysis was performed to obtain a regression equation and the R value. Linear regression analyses were performed using R (version 2.8.1). Statistical significance was set at P < 0.05, with trends set at P < 0.10.
5. Results
Total fat mass was significantly correlated with fBMI, 13th BF, CFP1, CFP2, and BCS (R = 0.91, 0.80, 0.74, 0.77, and 0.89) (P < 0.001) (Figure 1).
Body fat percentage was significantly correlated with fBMI, 13th BF, CFP1, CFP2, and BCS (R = 0.77, 0.84, 0.63, 0.62, and 0.79) (P < 0.001) (Figure 2).
The LBM was significantly associated with the 13th EM and 6th-7th EM (R = 0.79 and 0.84) (P<0.001) (Figure 3).
Total fat mass was significantly correlated with the 13th and 6th-7th EM (R = 0.49 and 0.62) (P < 0.001) (Figure 4). Additionally, the fat percentage was significantly associated with the 13th and 6th-7th EM (R = 0.31 and 0.43) (P < 0.01 and P < 0.001, respectively) (Figure 4).
The regression formula ( and ) allowed for the estimation of the approximate total fat mass (Figure 1). Additionally, the regression formula ( and ) facilitated the estimation of the approximate body fat percentage (Figure 1).
The regression formula () facilitated the estimation of the approximate LBM (g) (Figure 3).
FM, total fat mass; fBMI, feline body mass index; 13th BF, back fat thickness on the 13th rib; CBF, calculated fat percentage; BCS, body condition score
FP, fat percentage; fBMI, feline body mass index; 13th BF, back fat thickness on the 13th rib; CBF, calculated fat percentage; BCS, body condition score
LBM, lean body mass; 13th EM, epaxial muscle thickness on the 13th rib
FM, total fat mass; FP, fat percentage; 13th EM, epaxial muscle thickness on the 13th rib, 6th-7th EM, epaxial muscle on the 6–7th EM
6. Discussion
Adiposity and muscularity evaluation has gained traction for the early diagnosis of several nutritional conditions, such as obesity and sarcopenia, in veterinary practice.
The results of this study demonstrated that fBMI and ultrasonography for adiposity and muscularity evaluation reflected total fat mass, fat percentage, and LBM using DEXA (Figure 1 and 2).
In fBMI, R was higher than the R from conventional BCS, CFP1, and CFP2 (Figure 1), suggesting that fBMI allows for an accurate evaluation of body fat accumulation.
fBMI is a new objective method for assessing nutritional status based on the skeletal length derived from zoometric measurement methods. Given that it does not include joints in skeletal length, it is less influenced by posture and is largely unaffected by fluctuations in body weight [33,34]. Additionally, it does not require blood sampling or anesthesia and has low invasiveness. Furthermore, it reflects alterations in blood lipids (TG and NEFA) during the early obesity stages (fBMI = 28.0) before metabolic syndrome onset, enabling precise evaluation of early-stage obesity [33,34].
The temporarily established evaluation criteria for fBMI in a previous study were updated based on these findings (Table 1) [33,34]. Each level of the FM criterion was calculated using the formula shown in Figure 1. Furthermore, given that the FP values for cats in the fBMI range of 23.0–27.9 were 13.0–27.9; this range was temporarily designated as the appropriate FP range. This is typically consistent with the BCS criteria [35]. As the LBM values for cats in the fBMI range of 23.0–27.9 were approximately 2000–3100, this range was provisionally set as the appropriate LBM range.
However, the 13th BF revealed a higher R value than the conventional BCS, CFP1, 2, and fBMI (Figure 2), suggesting that the 13th BF can estimate body fat percentage with higher accuracy. Furthermore, the 13th EM demonstrated a high R with the LBM (Figure 3), suggesting that it can estimate muscle mass with high accuracy.
Ultrasonography is expected to replace DEXA, computed tomography, and magnetic resonance imaging. It has been confirmed to be accurate and reliable in bovines, sheep, rabbits, swine, dogs, and humans [36,37,38]. Moreover, ultrasonography availability and repeatability for feline adiposity and muscularity evaluation were confirmed in our previous study [39,40]. Additionally, three regression formulae to calculate the approximate total fat mass, body fat percentage, and LBM (g) were developed based on the relationship between DEXA and ultrasonography in our current study. This method facilitates a simple estimation of the approximate total fat mass, fat percentage, and LBM in veterinary clinics with higher accuracy than that of CFP1 and CFP2.
Although the 6th-7th EM revealed a slightly higher regression coefficient than the 13th EM, it was more influenced by fat accumulation (Figure 4). This coincides with the differences observed in the beef grading systems between the Japan Meat Grading Association and the United States Department of Agriculture [41,42]. The Japan Meat Grading Association assesses intramuscular fat marbling using cross-sectional images of the longissimus muscle between the 6th and 7th ribs. Contrastingly, the grading system of the United States Department of Agriculture assesses muscularity and maturity more than intramuscular fat marbling using the muscles between the 13th rib. This suggests that the 6th-7th EM is more influenced by overfeeding and adiposity than the 13th EM. The 13th rib measurement facilitates adiposity and muscularity evaluation in a single procedure, contributing to a decrease in animal and veterinarian stress. Therefore, the 13th rib, rather than the 6–7th ribs, is considered a suitable site for estimating adiposity and muscularity in cats using ultrasonography. This ultrasonographic method can be used to assess subcutaneous adiposity and longissimus muscularity when DEXA is unavailable in veterinary clinical practice.
The criteria for the ideal 13th BF were calculated using the formula shown in Figure 2 by comparing it with the FP (Table 1). The criteria for the ideal 13th EM were calculated using the formula shown in Figure 3 by comparing it with the LBM.
The maximum ratio of total fat mass was 30.8% at the end of the study, suggesting that most female cats exhibited early-stage obesity. Thus, blood lipid levels and hepatic injury markers were within the normal range, and no symptoms of ectopic fat accumulation were observed in the liver.
Our study did not include lean or cachectic cats. Various body composition levels should be examined to improve the detection limit of ultrasonography.
Criteria for the fBMI were determined similarly to those used in a previous study [33].
Criteria for the 13th BF were determined using the FP.
Criteria for the 13th EM were determined using the LBM.
Criteria for the FM were determined using the fBMI.
The FP criteria were determined based on the ideal fBMI range of cats in this study.
The criteria for LBM were determined based on the range of ideal fBMI cats demonstrated in this study.
6.1. Key Points for Measurement as per the New Nutritional Status Assessment Method
6.1.1. Key Points for fBMI Measurement
The following points describe the measurement of the PCL required for fBMI.
① The cat was placed in the left lateral recumbent position.
② To prevent the patella from moving owing to changes in the knee angle, the knee was bent at approximately 90°. At this point, the patella should be located on the tibial extension.
③ The distance from the patella to the calcaneus was measured using a caliper or measuring tape. An extended caliper was placed against the patella, and the movable part of the caliper was gradually shortened for optimal measurement, given that applying pressure may cause discomfort.
6.1.2. Key Points for Echo Measurement
The following section describes the echo scanning procedure used to measure the subcutaneous fat and muscle thickness in cats.
① The cat was placed in a left lateral recumbent position.
② To the dorsal side of the 13th rib, 70% ethanol was applied, hair in the measurement area was combed, and a horizontal division line parallel to the rib was created.
③ A linear probe was attached to the ultrasound device and set to 8–10 MHz.
④ As a couplant, 70% ethanol was used and sufficiently applied to the division line. The probe was positioned on the hair division line so that it was horizontal to the ribs.
⑤ The position was adjusted such that the longissimus dorsi muscle was fully visible on the screen and is subsequently stopped.
⑥ The following subcutaneous fat and muscle thicknesses were measured using the built-in ruler of the ultrasound device or image measurement software.
⑦ Subcutaneous fat thickness was measured as the maximum diameter between the dermis and upper fascia of the posterior serratus muscle.
⑧ The thickness of the longissimus dorsi muscle was measured as the maximum diameter at the border between the dorsal and ventral sides.
7. Conclusion
In conclusion, an objective technique for assessing obesity and body composition in veterinary practice was established.
Significant reliability was observed between the 13th BF and total fat mass and between the 13th EM and LBM. Additionally, calculation formulae using subcutaneous adiposity and longissimus muscularity were developed to estimate the total fat mass, body fat percentage, and LM level. These methods may contribute to the diagnosis of body composition in veterinary clinical practice when DEXA is unavailable.
Author Contributions
Conceptualization, E.I. and A.M; methodology, E.I.; software, E.I.; validation, E.I. and A.M.; formal analysis, E.I.; investigation, E.I.; resources, E.I.; data curation, E.I.; writing—original draft preparation, E.I.; writing—review and editing, A.M.; visualization, E.I.; supervision, A.M.; project administration, E.I. and A.M.; funding acquisition, E.I. All authors have read and agreed to the published version of the manuscript.
Funding
Funding for this study was provided in part by Nippon Pet Food Co. Ltd.
Institutional Review Board Statement
The work described in this manuscript involved the use of experimental animals, and the study received previous ethical approval from an established (or ad hoc) committee, as stated in the manuscript.
Informed Consent Statement
Informed consent (verbal or written) was obtained from the owners or legal custodians of all animals (s) described in this study (experimental or non-experimental animals, including cadavers, tissues, and samples) for all procedures (s) undertaken (prospective or retrospective studies). No animals or people were identifiable in this study; therefore, additional informed consent was not required.
Data Availability Statement
The datasets presented in this article are not readily available because the data are part of an ongoing research project. Requests to access the datasets should be directed to the corresponding author (E.I.).
Acknowledgments
All authors thank Dr. Kelly S. Swanson, Department of Animal Sciences, University of Illinois, Urbana, IL 61801, USA, for his consideration and support.
Conflicts of Interest
E.I. is employed by Nippon Pet Food Co. Ltd. All other authors have no conflicts of interest.
Abbreviations
The following abbreviations are used in this manuscript:
| BMI | Body Mass Index |
| BCS | Body Condition Score |
| CT | Computed Tomography |
| DEXA | Dual-energy X-ray absorptiometry |
| FBMI | Feline Body Fat Index |
| MCS | Muscle Condition Score |
| NCDs | Non-Communicable Diseases |
| NEFA | Non-Esterified Fatty Acid |
References
- Banatvala, N.; Akselrod, S.; Bovet, P.; et al. The WHO global action plan for the prevention and control of NCDs 2013–2030. In Noncommunicable Diseases; Banatvala, N., Akselrod, S., Bovet, P., Mendis, S., Eds.; Routledge: UK, London, 2023. [Google Scholar]
- Cline, M.G.; Burns, K.M.; Coe, J.B.; Downing, R.; Durzi, T.; Murphy, M.; Parker, V. 2021 AAHA nutrition and weight management guidelines for dogs and cats. J Am Anim Hosp Assoc 2021, 57, 153–178. [Google Scholar] [CrossRef]
- WSAVA Nutritional Assessment Guidelines Task Force Members. WSAVA nutritional assessment guidelines. J Feline Med Surg 2011, 13, 516–525. [CrossRef]
- The landscape of pet insurance in the Nordics. Available online: https://globalpetindustry.com/news/the-pet-industry-in-the-nordics/ (accessed on 15 April 2025).
- Arai, T.; Ishikawa, S.; Mori, N.; Yamamoto, I.; Kawasumi, K. Obesity and lipotoxicity in dogs and cats. Jpn J Prophylactic Vet Med 2012, 4, 1–12. [Google Scholar]
- Swarbrick, M.M.; Stanhope, K.L.; Austrheim-Smith, I.T.; Van Loan, M.D.; Ali, M.R.; Wolfe, B.M.; Havel, P.J. Longitudinal changes in pancreatic and adipocyte hormones following Roux-en-Y gastric bypass surgery. Diabetologia 2008, 51, 1901–1911. [Google Scholar] [CrossRef] [PubMed]
- Mori, N.; Lee, P.; Kondo, K.; Kido, T.; Saito, T.; Arai, T. Potential use of cholesterol lipoprotein profile to confirm obesity status in dogs. Vet Res Commun 2011, 35, 223–235. [Google Scholar] [CrossRef] [PubMed]
- Mori, N.; Lee, P.; Muranaka, S.; Sagara, F.; Takemitsu, H.; Nishiyama, Y.; Yamamoto, I.; Yagishita, M.; Arai, T. Predisposition for primary hyperlipidemia in Miniature Schnauzers and Shetland sheepdogs as compared to other canine breeds. Res Vet Sci 2010, 88, 394–399. [Google Scholar] [CrossRef]
- DeFronzo, R.A. Insulin resistance, lipotoxicity, type 2 diabetes and atherosclerosis: the missing links. The Claude Bernard Lecture 2009. Diabetologia 2010, 53, 1270–1287. [Google Scholar] [CrossRef]
- Gehrmann, W.; Elsner, M.; Lenzen, S. Role of metabolically generated reactive oxygen species for lipotoxicity in pancreatic β-cells. Diabetes Obes Metab 2010, 12 supplement 2, 149–158. [Google Scholar] [CrossRef]
- Giacca, A.; Xiao, C.; Oprescu, A.I.; Carpentier, A.C.; Lewis, G.F. Lipid-induced pancreatic β-cell dysfunction: focus on in vivo studies. Am J Physiol Endocrinol Metab 2011, 300, E255–E262. [Google Scholar] [CrossRef]
- Chan, D.C.; Watts, G.F.; Barrett, P.H.; Burke, V. Waist circumference, waist-to-hip ratio and body mass index as predictors of adipose tissue compartments in men. Qjm 2003, 96, 441–447. [Google Scholar] [CrossRef]
- Appleton, D.J.; Rand, J.S.; Sunvold, G.D. Insulin sensitivity decreases with obesity, and lean cats with low insulin sensitivity are at greatest risk of glucose intolerance with weight gain. J Feline Med Surg 2001, 3, 211–228. [Google Scholar] [CrossRef]
- Butterwick, R. How fat is that cat? J Feline Med Surg 2000, 2, 91–94. [Google Scholar] [CrossRef]
- Hawthorne, A.J.; Butterwick, R.F. The feline body mass index—a simple measure of body fat content in cats. Waltham Focus 2000, 10, 32–33. [Google Scholar]
- Hoenig, M.; Jordan, E.T.; Glushka, J.; Kley, S.; Patil, A.; Waldron, M.; Prestegard, J.H.; Ferguson, D.C.; Wu, S.; Olson, D.E. Effect of macronutrients, age, and obesity on 6- and 24-h postprandial glucose metabolism in cats. Am J Physiol Regul Integr Comp Physiol 2011, 301, R1798–R1807. [Google Scholar] [CrossRef]
- Hoenig, M.; Wilkins, C.; Holson, J.C.; Ferguson, D.C. Effects of obesity on lipid profiles in neutered male and female cats. Am J Vet Res 2003, 64, 299–303. [Google Scholar] [CrossRef]
- Nelson, R.W.; Himsel, C.A.; Feldman, E.C.; Bottoms, G.D. Glucose tolerance and insulin response in normal-weight and obese cats. Am J Vet Res 1990, 51, 1357–1362. [Google Scholar] [CrossRef]
- LaFlamme, D. Development and validation of a body condition score system for cats: a clinical tool. Feline Pract 1997, 25, 13–18. [Google Scholar]
- Matsuzawa, Y.; Tokunaga, K.; Kotani, K.; Keno, Y.; Kobayashi, T.; Tarui, S. Simple estimation of ideal body weight from body mass index with the lowest morbidity. Diabetes Res Clin Pract 1990, 10 supplement 1, S159–S164. [Google Scholar] [CrossRef] [PubMed]
- Gallagher, D.; Visser, M.; Sepúlveda, D.; Pierson, R.N.; Harris, T.; Heymsfield, S.B. How useful is body mass index for comparison of body fatness across age, sex, and ethnic groups? Am J Epidemiol 1996, 143, 228–239. [Google Scholar] [CrossRef]
- Goulding, A.; Gold, E.; Cannan, R.; Taylor, R.W.; Williams, S.; Lewis-Barned, N.J. DEXA supports the use of BMI as a measure of fatness in young girls. Int J Obes Relat Metab Disord 1996, 20, 1014–1021. [Google Scholar] [PubMed]
- Pischon, T.; Boeing, H.; Hoffmann, K.; Bergmann, M.; Schulze, M.B.; Overvad, K.; van der Schouw, Y.T.; Spencer, E.; Moons, K.G.; Tjønneland, A. General and abdominal adiposity and risk of death in Europe. N Engl J Med 2008, 359, 2105–2120. [Google Scholar] [CrossRef]
- Yamada, T.; Kimura-Koyanagi, M.; Sakaguchi, K.; Ogawa, W.; Tamori, Y. Obesity and risk for its comorbidities diabetes, hypertension, and dyslipidemia in Japanese individuals aged 65 years. Sci Rep 2023, 13, 2346. [Google Scholar] [CrossRef]
- Lim, Y.; Boster, J. Obesity and Comorbid Conditions; StatPearls Publishing: Treasure Island, FL, 2024. [Google Scholar]
- Booth, R.A.; Goddard, B.A.; Paton, A. Measurement of fat thickness in man: a comparison of ultrasound, Harpenden calipers and electrical conductivity. Br J Nutr 1966, 20, 719–725. [Google Scholar] [CrossRef]
- Stanton, C.A.; Hamar, D.W.; Johnson, D.E.; Fettman, M.J. Bioelectrical impedance and zoometry for body composition analysis in domestic cats. Am J Vet Res 1992, 53, 251–257. [Google Scholar] [CrossRef] [PubMed]
- German, A.; Martin, L. Feline obesity. In Encyclopedia of Feline Clinical Nutrition; France, *!!! REPLACE !!!*, Royal Canin, A, Pibot, P., Biourge, V., Elliott, D., Eds.; 2010. [Google Scholar]
- Freeman, L.; Becvarova, I.; Cave, N.; MacKay, C.; Nguyen, P.; Rama, B.; Takashima, G.; Tiffin, R.; Tsjimoto, H.; WSAVA Nutritional Assessment Guidelines Task Force Members. WSAVA nutritional assessment guidelines. J Small Anim Pract 2011, 52, 385–396. [Google Scholar] [CrossRef]
- Michel, K.E.; Anderson, W.; Cupp, C.; Laflamme, D.P. Correlation of a feline muscle mass score with body composition determined by dual-energy x-ray absorptiometry. Br J Nutr 2011, 106 supplement 1, S57–S59. [Google Scholar] [CrossRef]
- Speakman, J.R.; Booles, D.; Butterwick, R. Validation of dual energy X-ray absorptiometry (DXA) by comparison with chemical analysis of dogs and cats. Int J Obes Relat Metab Disord 2001, 25, 439–447. [Google Scholar] [CrossRef]
- Iwazaki, E.; Lee, A.H.; Kruis, A.M.; Phungviwatnikul, T.; Valentine, H.; Arend, L.S.; Knox, R.V.; de Godoy, M.R.C.; Swanson, K.S. Effects of a high-protein, high-fiber diet rich in antioxidants and l-carnitine on body weight, body composition, metabolic status, and physical activity levels of cats after spay surgery. J Anim Sci 2022, 100, skac104. [Google Scholar] [CrossRef] [PubMed]
- Iwazaki, E. Changes in Diagnostic Markers and Their Clinical Application to Obese Cats, 2016.
- Iwazaki, E.; Kimura, N.; Kawasumi, K.; Tatsuta, Y.; Arai, T. Development of new feline body mass index and its clinical application. J Vet Sci 2015, 1, 61–69. [Google Scholar]
- Bjornvad, C.R.; Nielsen, D.H.; Armstrong, P.J.; McEvoy, F.; Hoelmkjaer, K.M.; Jensen, K.S.; Pedersen, G.F.; Kristensen, A.T. Evaluation of a nine-point body condition scoring system in physically inactive pet cats. Am J Vet Res 2011, 72, 433–437. [Google Scholar] [CrossRef]
- Stouffer, J.R. History of ultrasound in animal science. J Ultrasound Med 2004, 23, 577–584. [Google Scholar] [CrossRef]
- Yamka, R. M.; Friesen, K. G.; Stiers, C. A.; Stone, B. A. Using ultrasound as an alternative method for determining body fat content in beagles. J Anim Sci 2007, 85, 266. [Google Scholar]
- Hutchinson, D.; Sutherland-Smith, J.; Watson, A.L.; Freeman, L.M. Assessment of methods of evaluating sarcopenia in old dogs. Am J Vet Res 2012, 73, 1794–1800. [Google Scholar] [CrossRef] [PubMed]
- Iwazaki, E.; Hirai, M.; Tatsuta, Y.; Nade, T. The relationship among ultrasound measurements, body fat ratio, and feline body mass index in aging cats. Jpn J Vet Res 2018, 66, 273–279. [Google Scholar] [CrossRef]
- Iwazaki, E.; Nade, T. Evaluation of ultrasound assessments of subcutaneous adiposity and epaxial muscularity in cats: a preliminary study. Jpn J Vet Res 2020, 68, 35–45. [Google Scholar] [CrossRef]
- Japan Meat Grading Association. Beef carcass grading standard; Japan Meat Grading Association T, Japan, 2000. [Google Scholar]
- USDA. United States Standards for Grades of Carcass Beef; United States Department of Agriculture: Washington, DC, 2016. [Google Scholar]
Figure 1.
Relationships between fat mass (g) and each parameter in cats. Values are presented as the regression coefficients (R), and the relevant formula has been used. FM (g) was considered the dependent variable. The other parameters were set as independent variables. Statistical significance between fat mass and other parameters was set at P < 0.05 (the regression analysis).
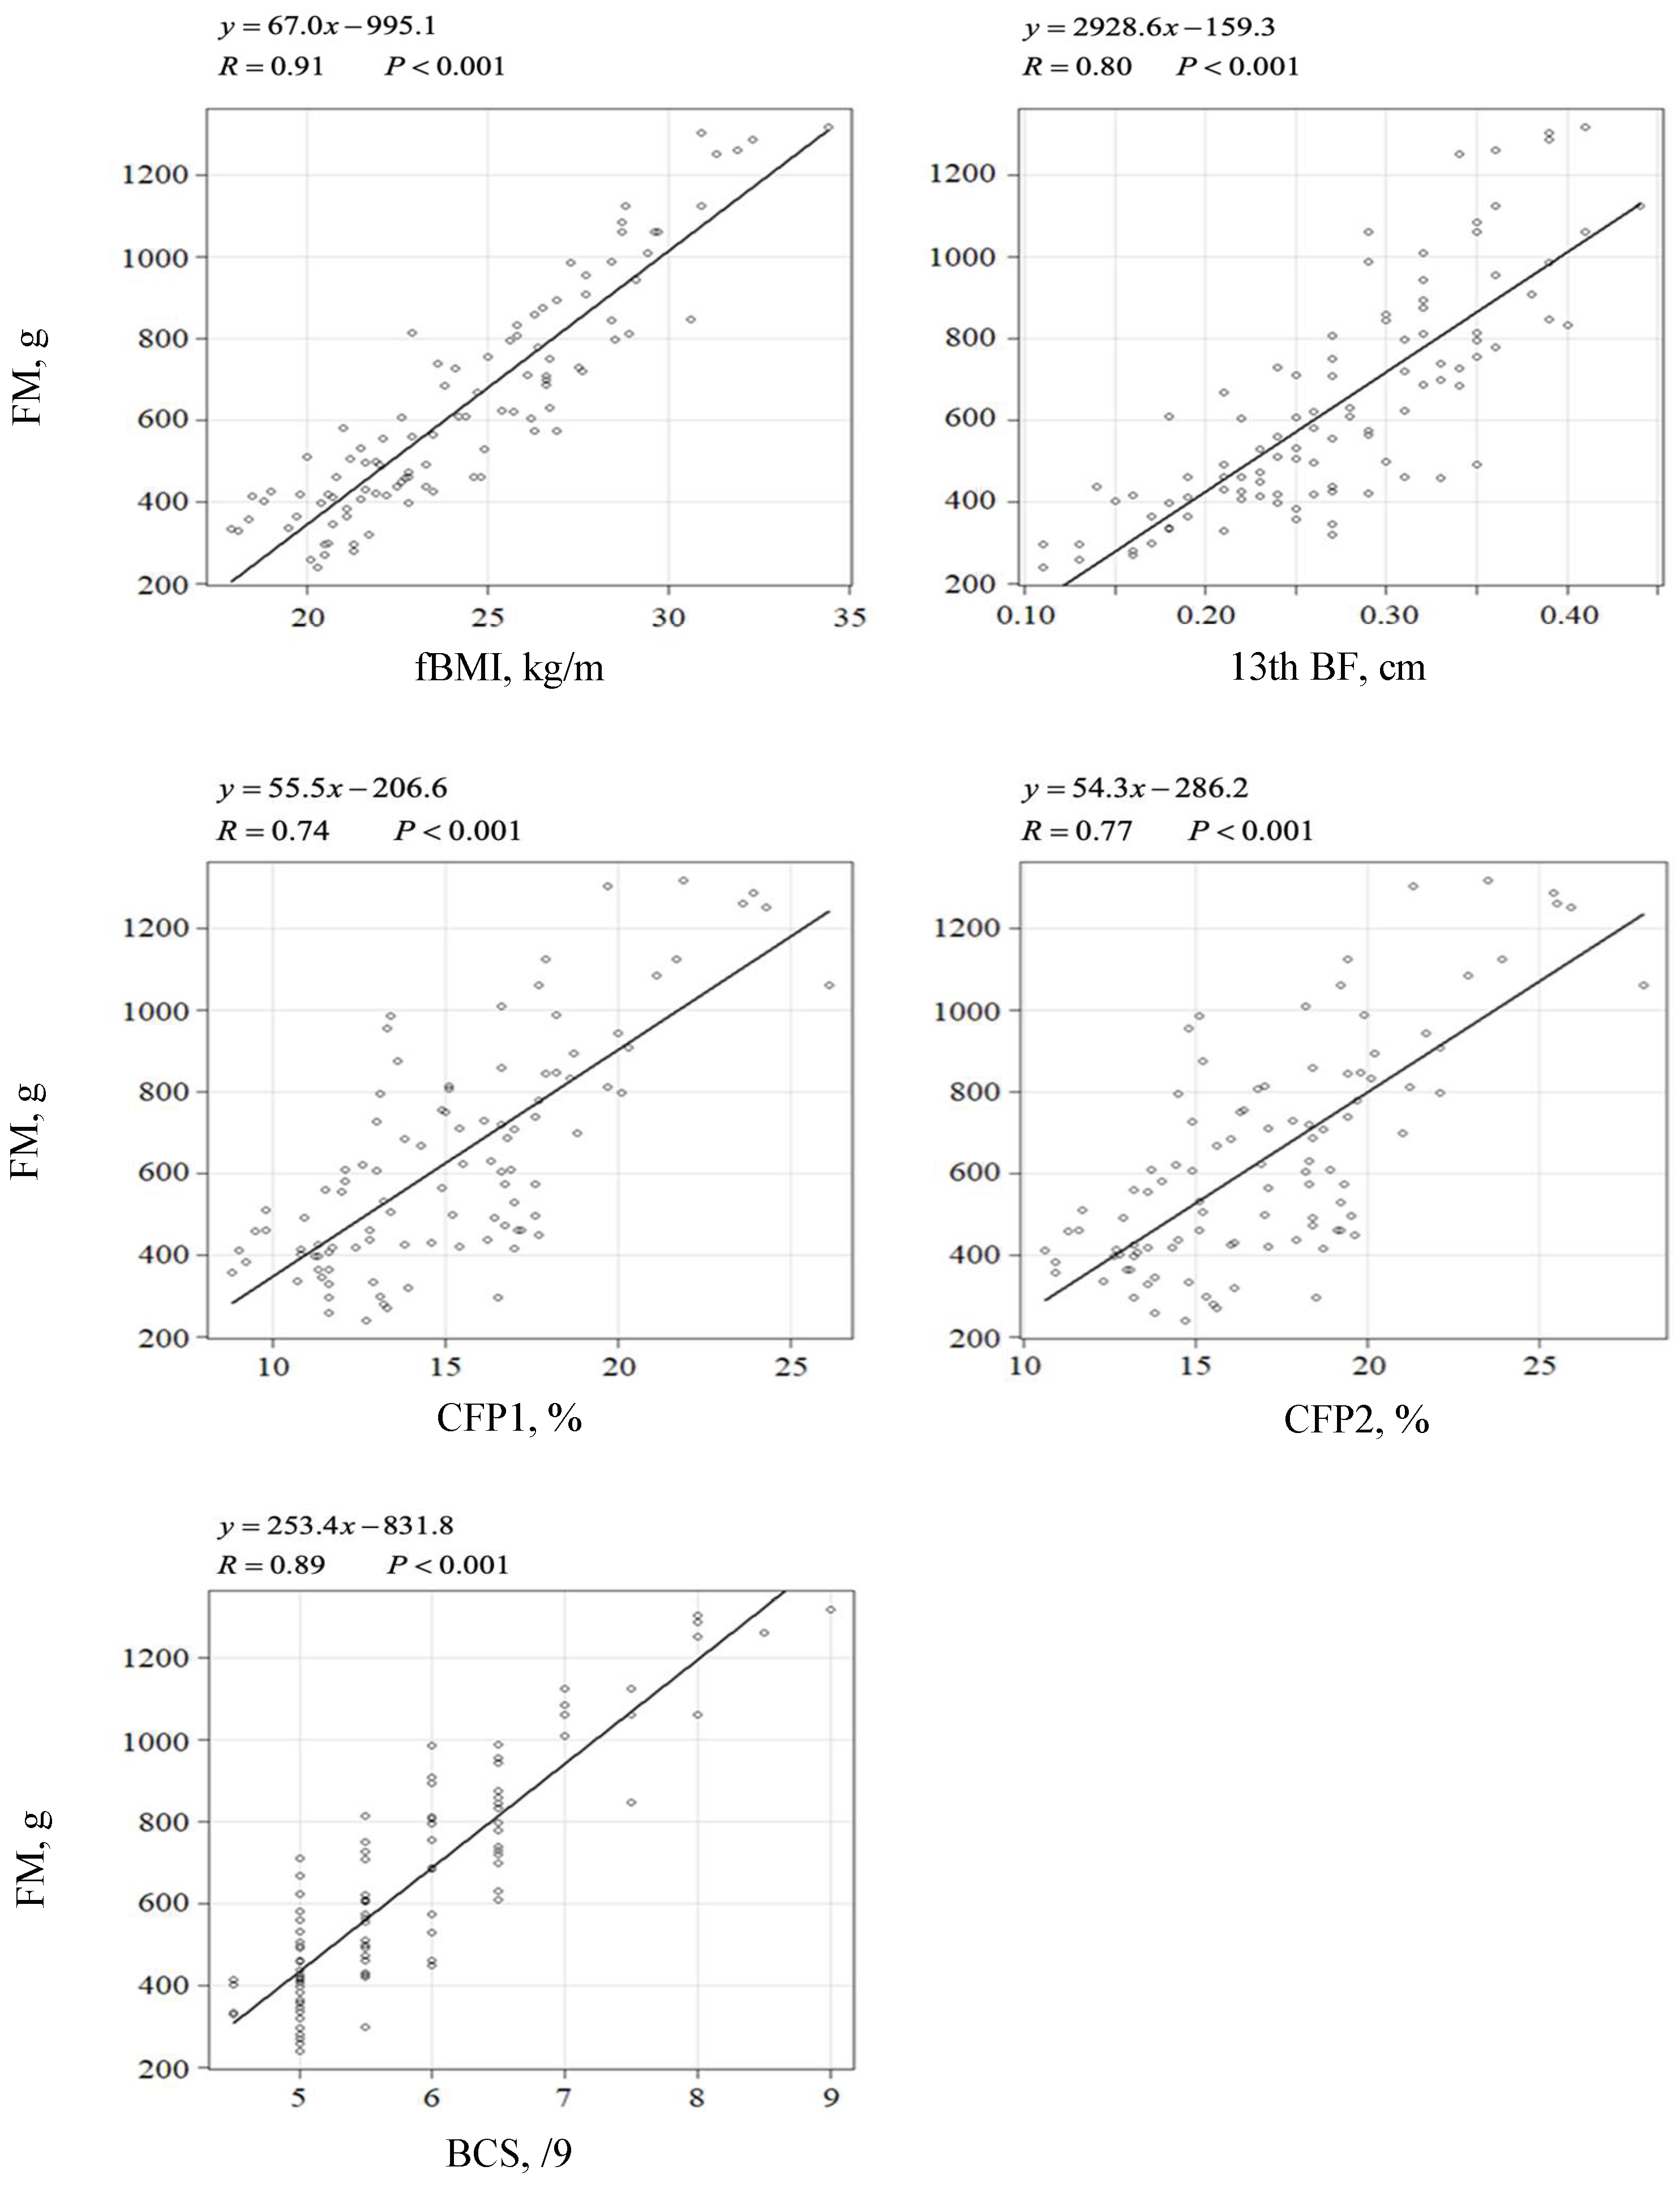
Figure 2.
Relationships between fat percentage (%) and each parameter in cats. Values are presented as the regression coefficients (R), and the relevant formula has been used. FP (%) was set as the dependent variable. The other parameters were set as the independent variables. Statistical significance between fat mass and other parameters was set at P<0.05 (the regression analysis).
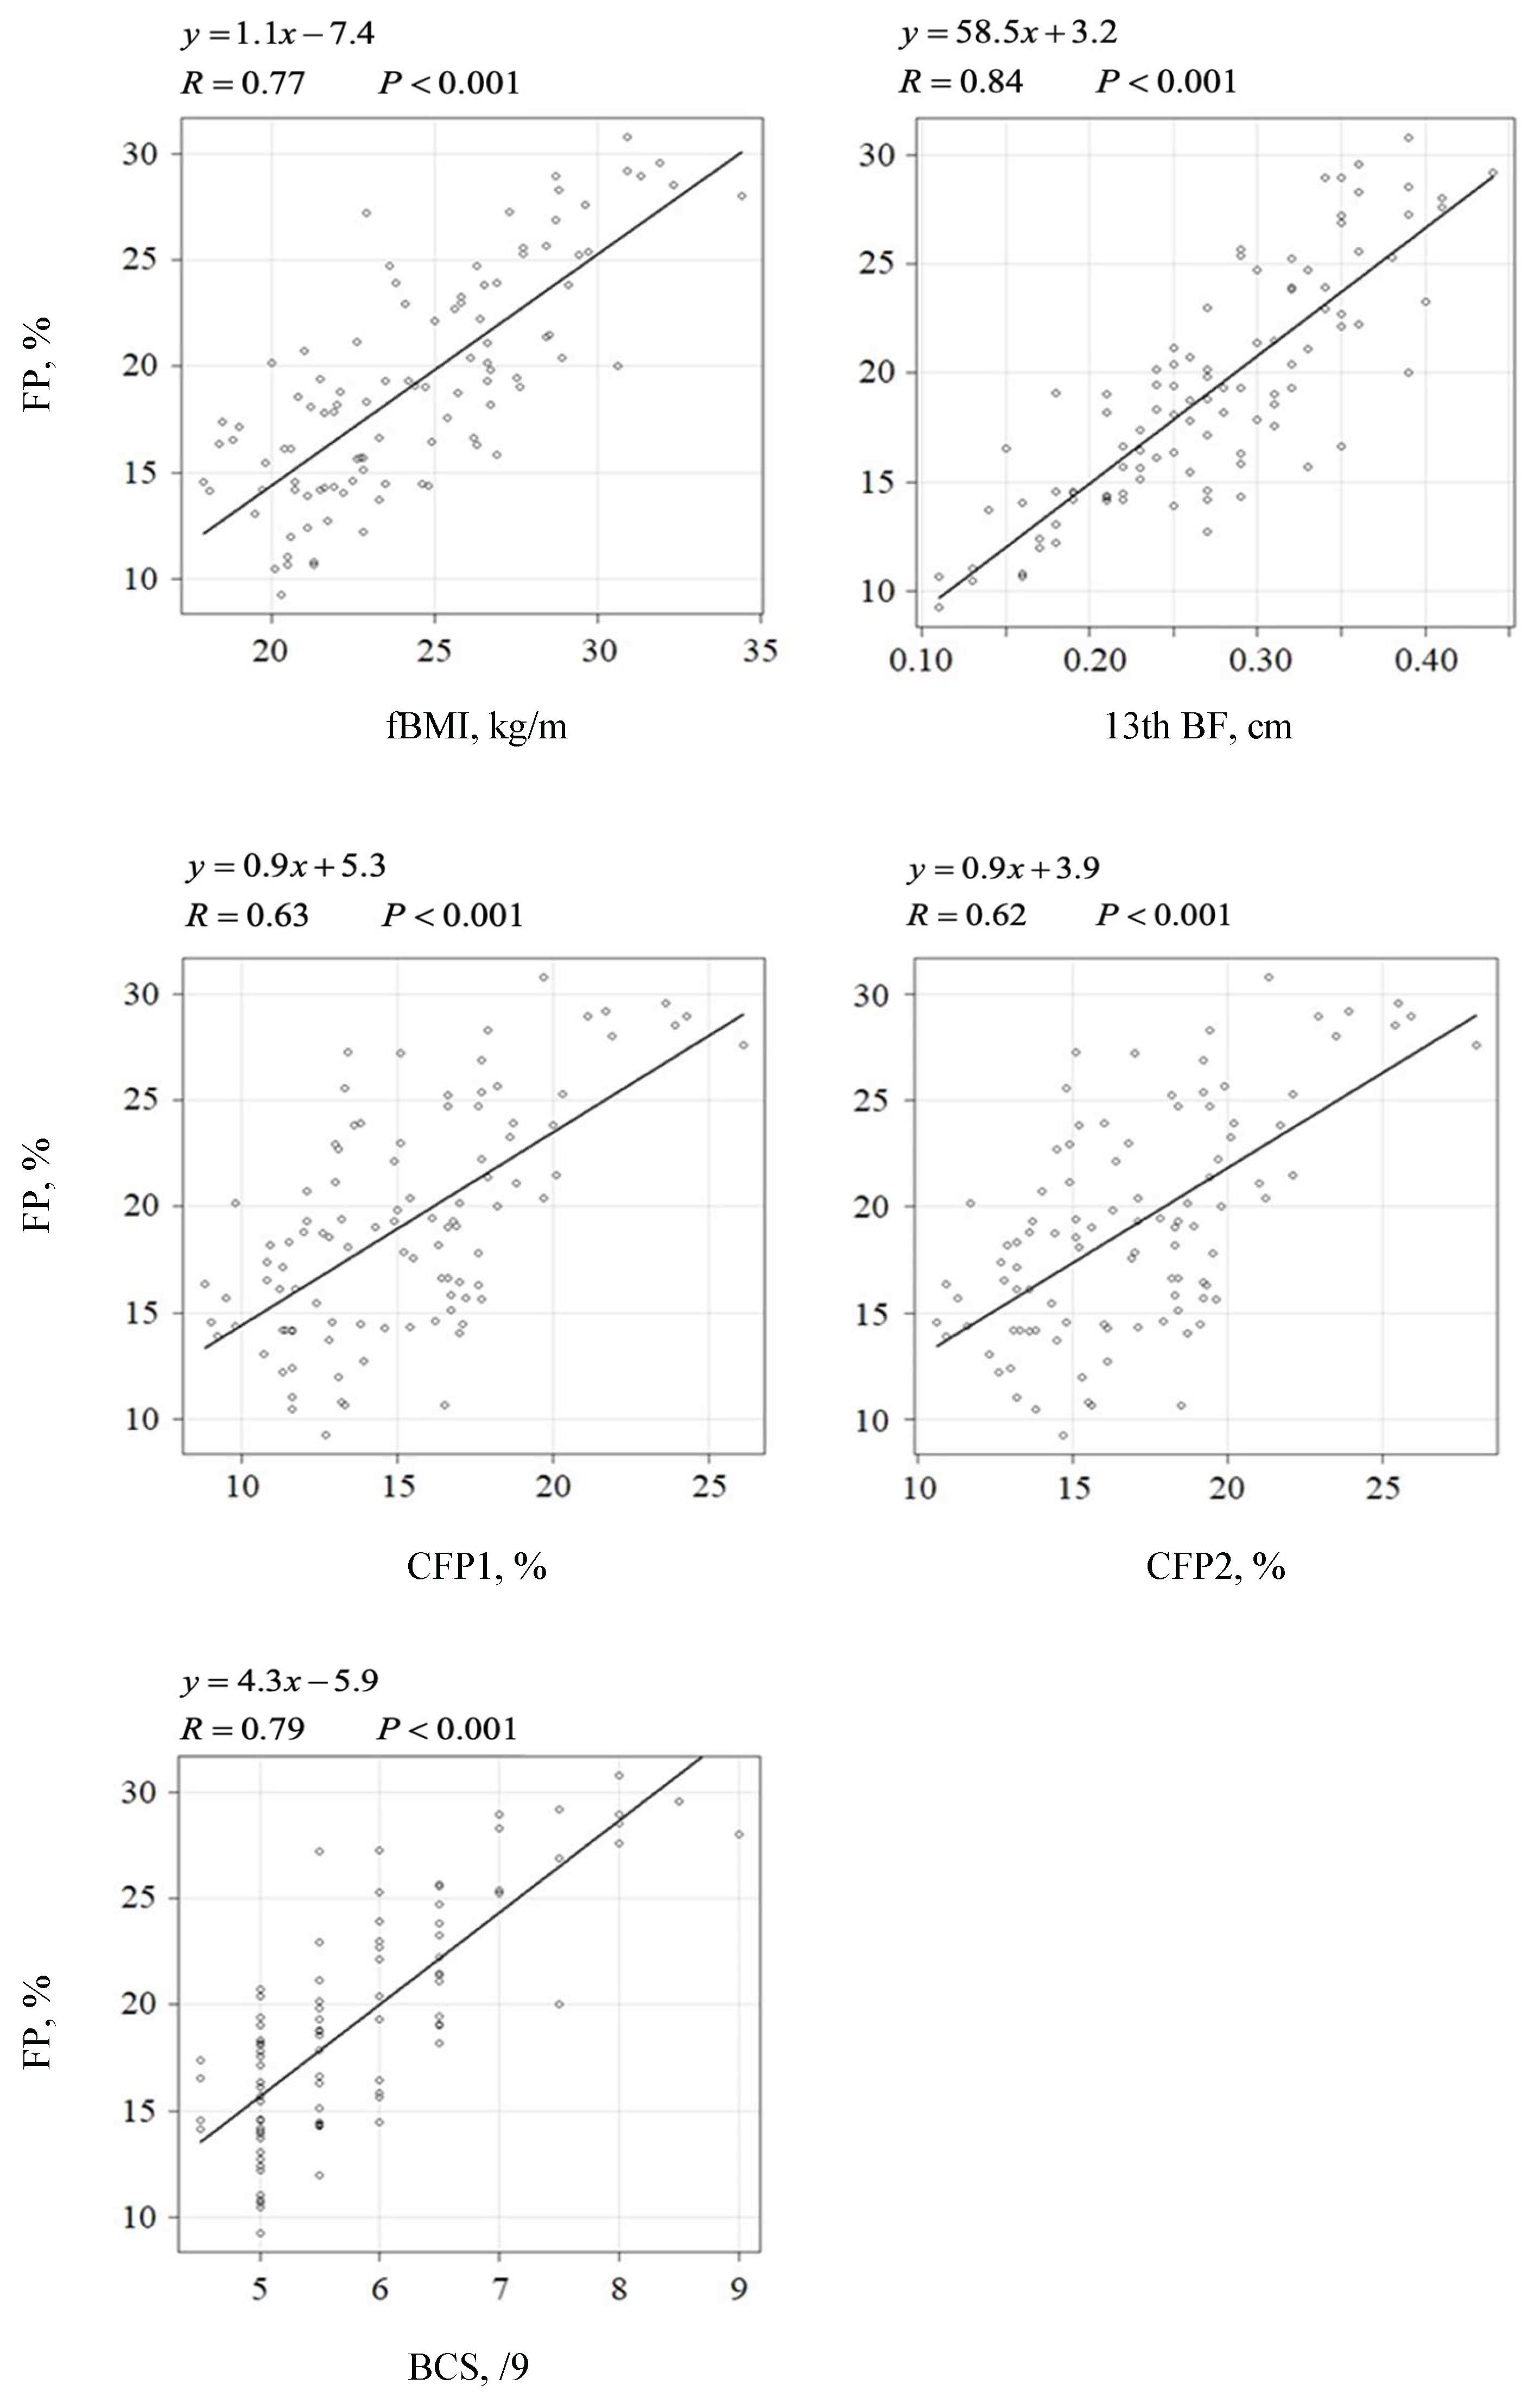
Figure 3.
Relationships between lean body mass (g) and each parameter in cats. Values are presented as regression coefficients (R), and the relevant formula has been used. LBM (g) was set as the dependent variable. The other parameters were set as the independent variables. Statistical significance between fat mass and other parameters was set at P < 0.05 (the regression analysis).
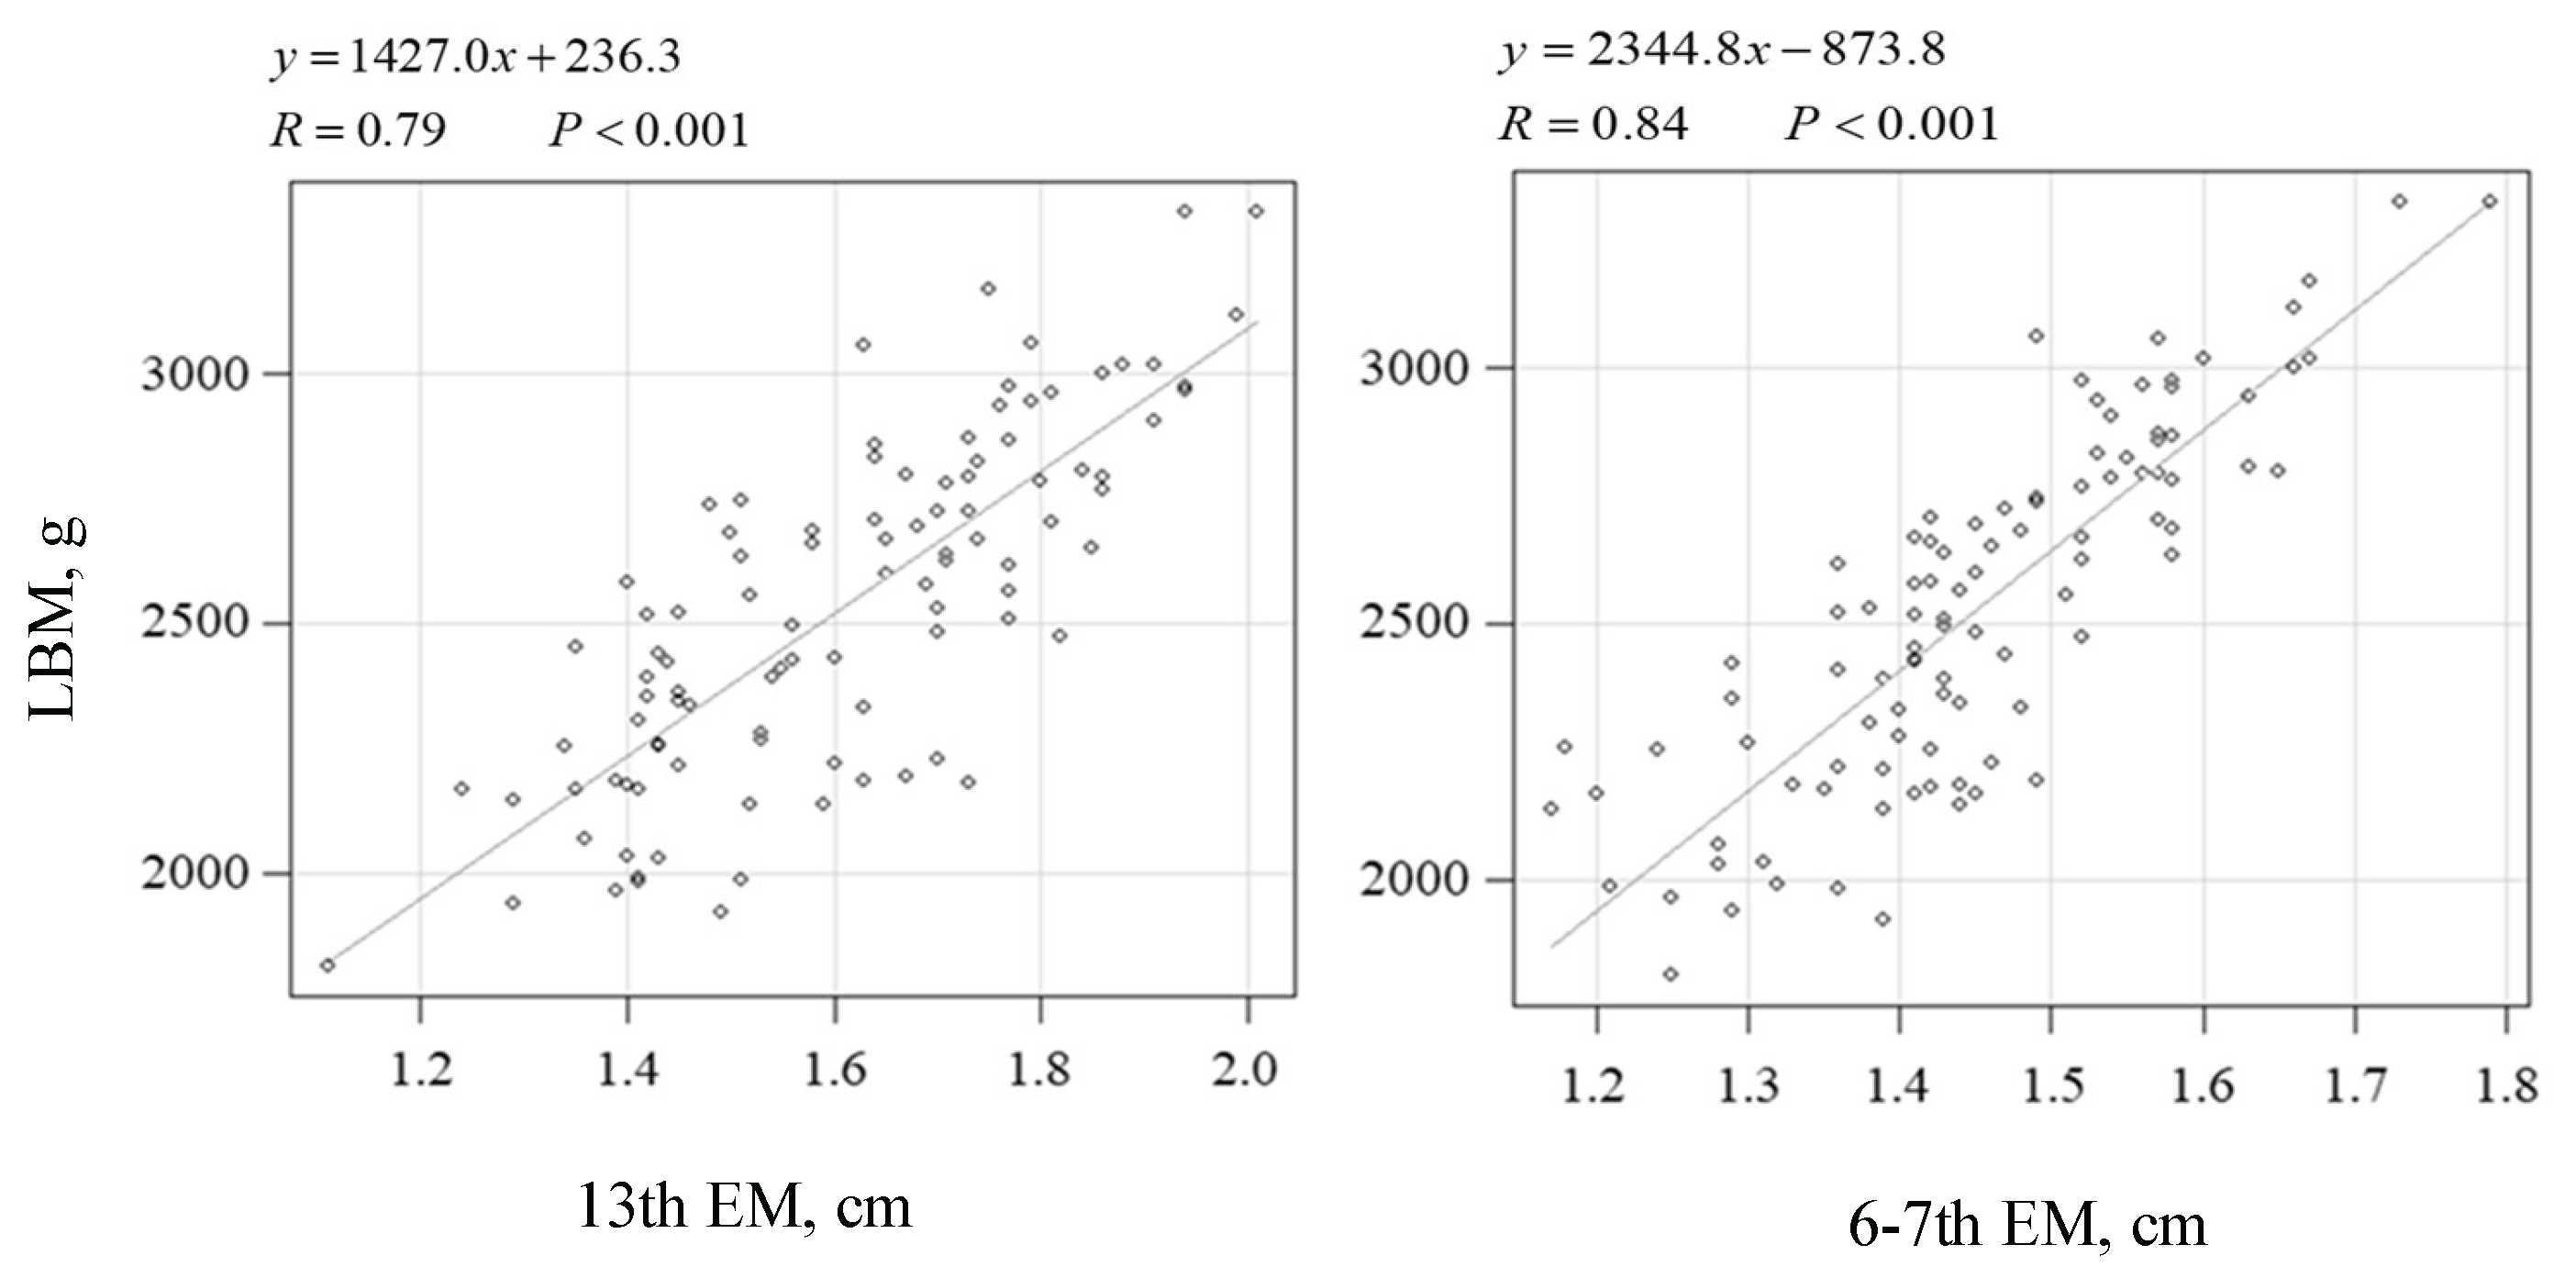
Figure 4.
Comparison of the fat mass, fat percentage, and epaxial muscle on the 13th or 6–7th rib. Values are presented as the regression coefficients (R), and the relevant formula has been used. Fat mass (g) and fat percentage (%) were the dependent variables. The epaxial muscle thickness of the 13th or 6–7th rib was set as the independent variable. Statistical significance between fat mass and other parameters was set at P < 0.05 (the regression analysis).
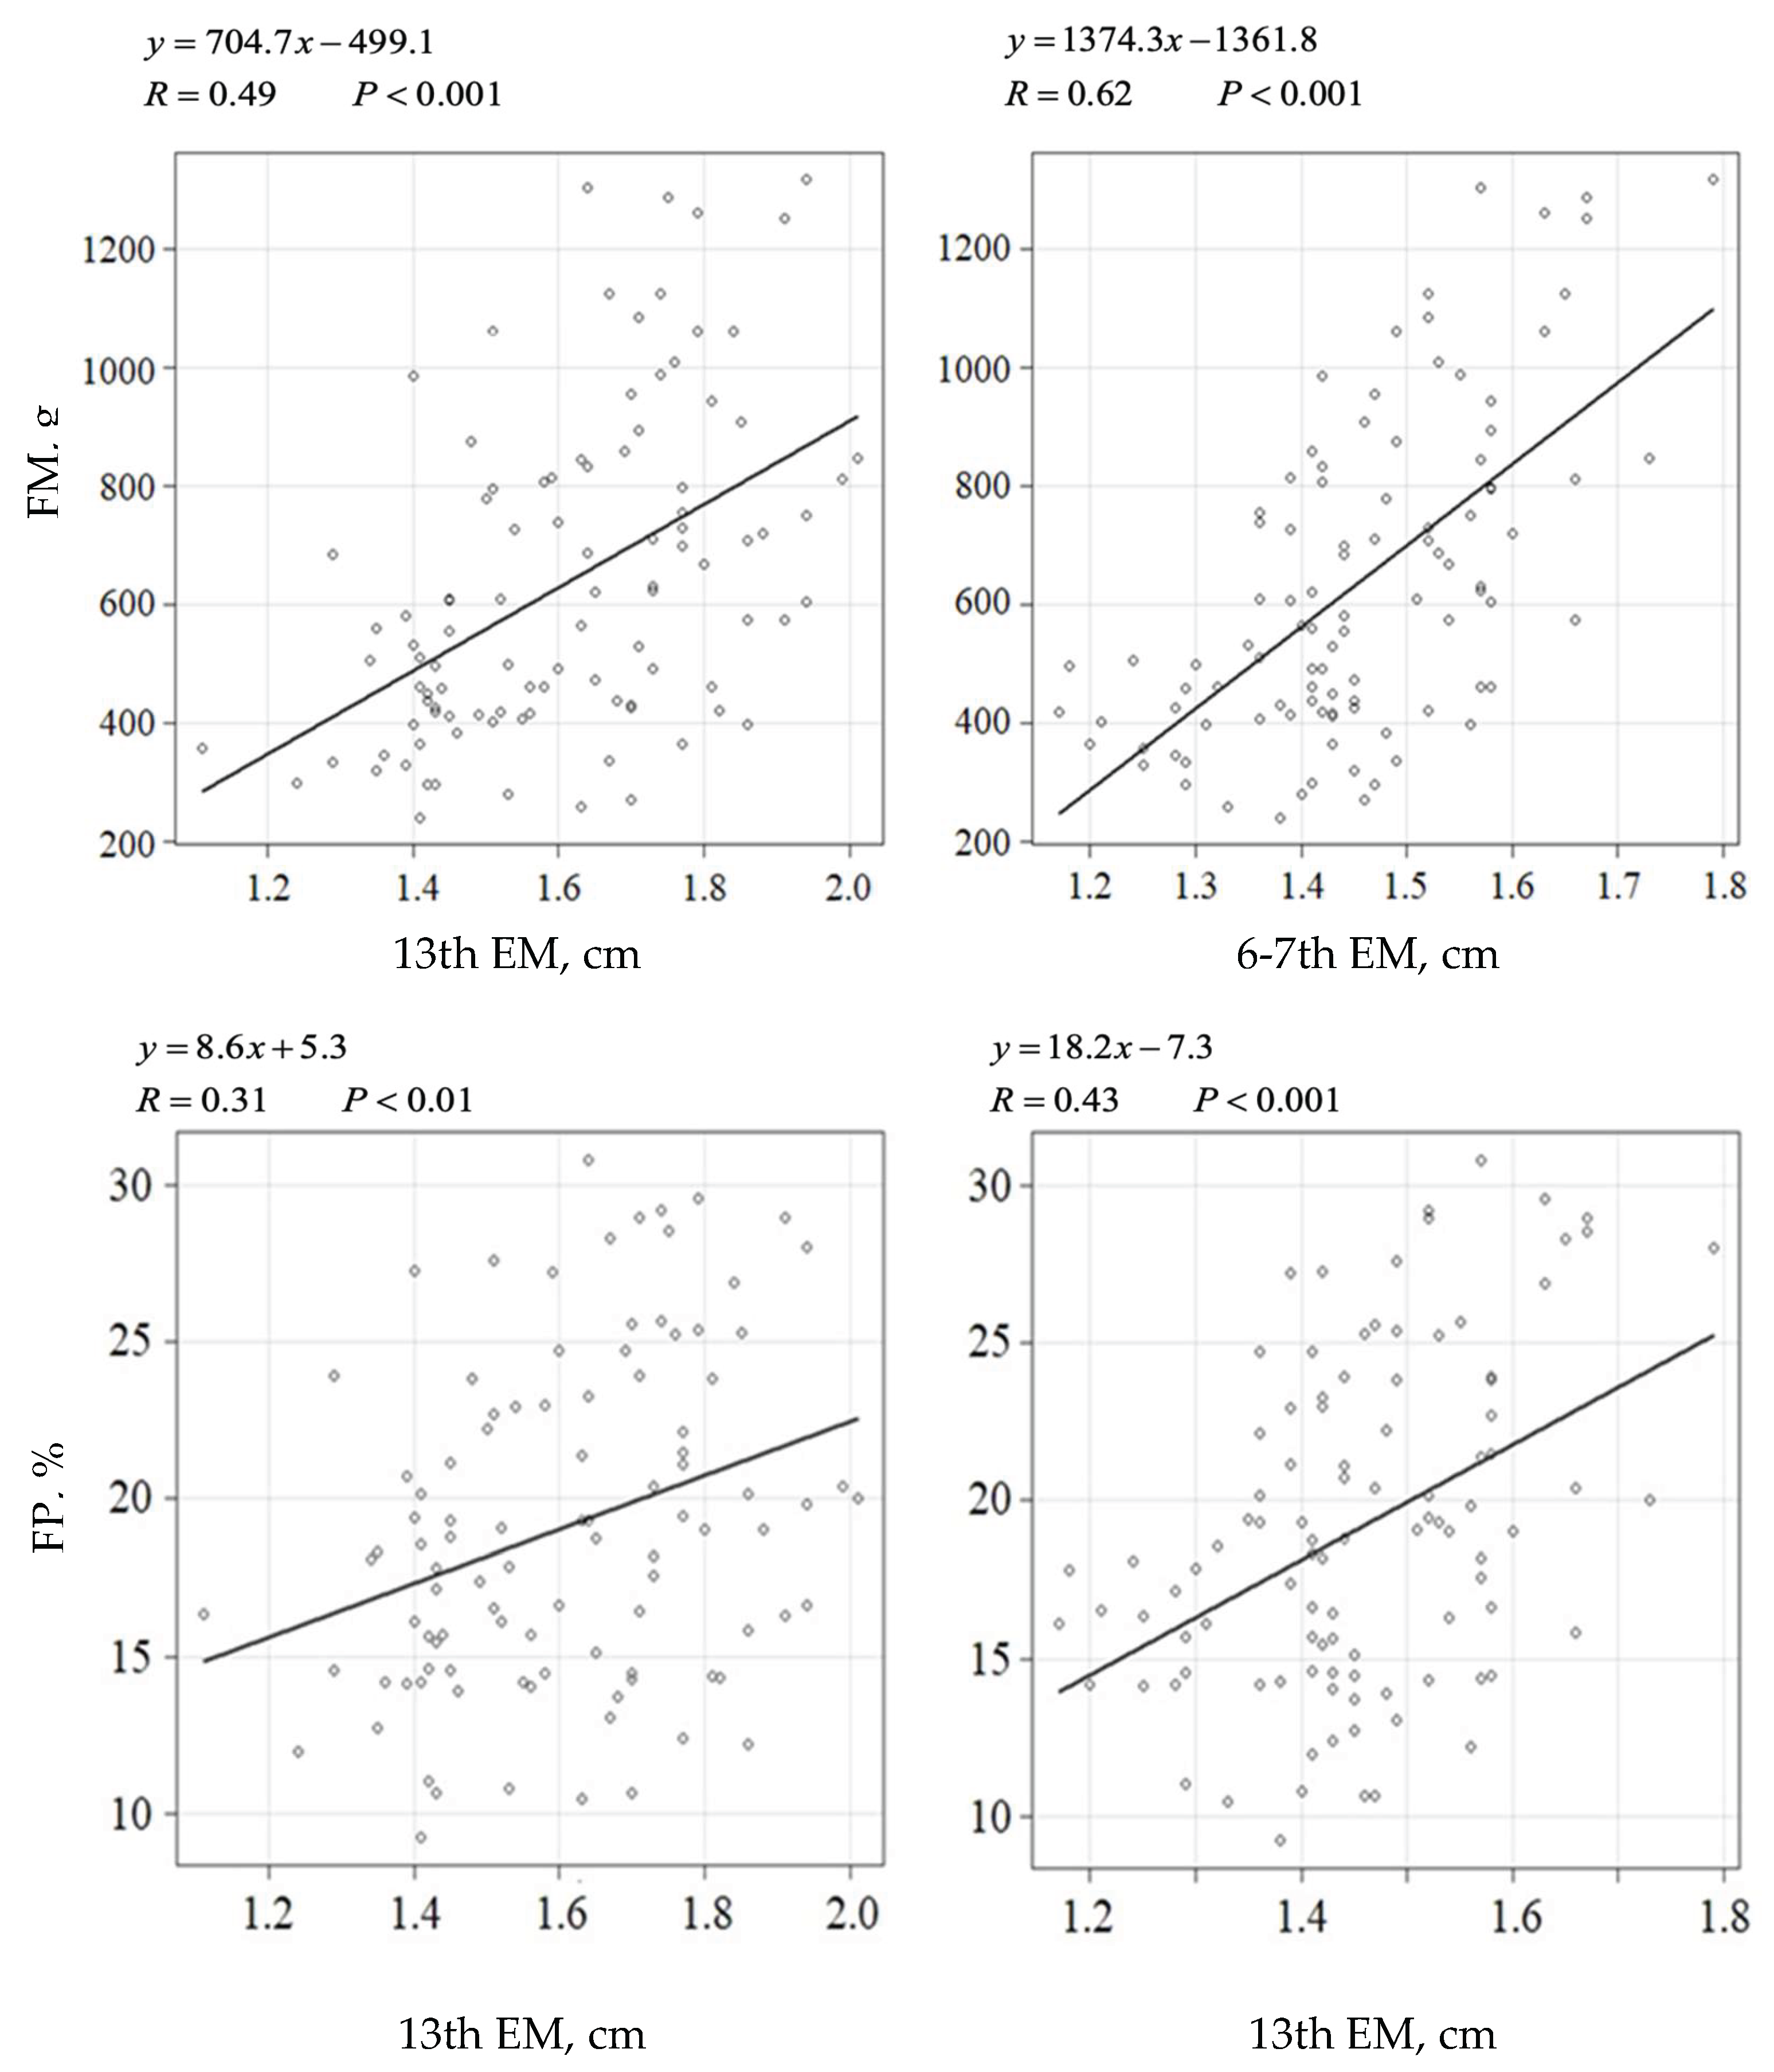

Table 1.
Comparison of new criteria for the nutritional status in cats.
| BCS | fBMI | 13thBF | 13thEM | FM | FP | LBM | |
| (/9) | (kg/m) | (cm) | (cm) | (g) | (%) | (g) | |
| Moderate lean | ≤4 | ≤22.9 | ≤0.16 | ≤1.24 | ≤545.8 | ≤12.9 | ≤1999 |
| Ideal | 5–6 | 23.0–27.9 | 0.17–0.42 | 1.25–2.00 | 545.9–880.9 | 13–27.9 | 2000–3100 |
| Overweight | 7–8 | 28.0–33.9 | 0.43≤ | - | 881.0–1282.8 | 28.0≤ | - |
| Obese | 9≤ | 34.0≤ | - | - | 1282.9≤ | - | - |
BCS, body condition score; fBMI, feline body mass index, 13th BF; back fat thickness on the 13th rib, 13thEM: epaxial muscle thickness on the 13th rib; FM, fat mass; PF, fat percentage; LBM, lean body mass
Disclaimer/Publisher’s Note: The statements, opinions and data contained in all publications are solely those of the individual author(s) and contributor(s) and not of MDPI and/or the editor(s). MDPI and/or the editor(s) disclaim responsibility for any injury to people or property resulting from any ideas, methods, instructions or products referred to in the content. |
© 2025 by the authors. Licensee MDPI, Basel, Switzerland. This article is an open access article distributed under the terms and conditions of the Creative Commons Attribution (CC BY) license (http://creativecommons.org/licenses/by/4.0/).
Copyright: This open access article is published under a Creative Commons CC BY 4.0 license, which permit the free download, distribution, and reuse, provided that the author and preprint are cited in any reuse.


