
Submitted:
04 December 2025
Posted:
05 December 2025
You are already at the latest version
Abstract
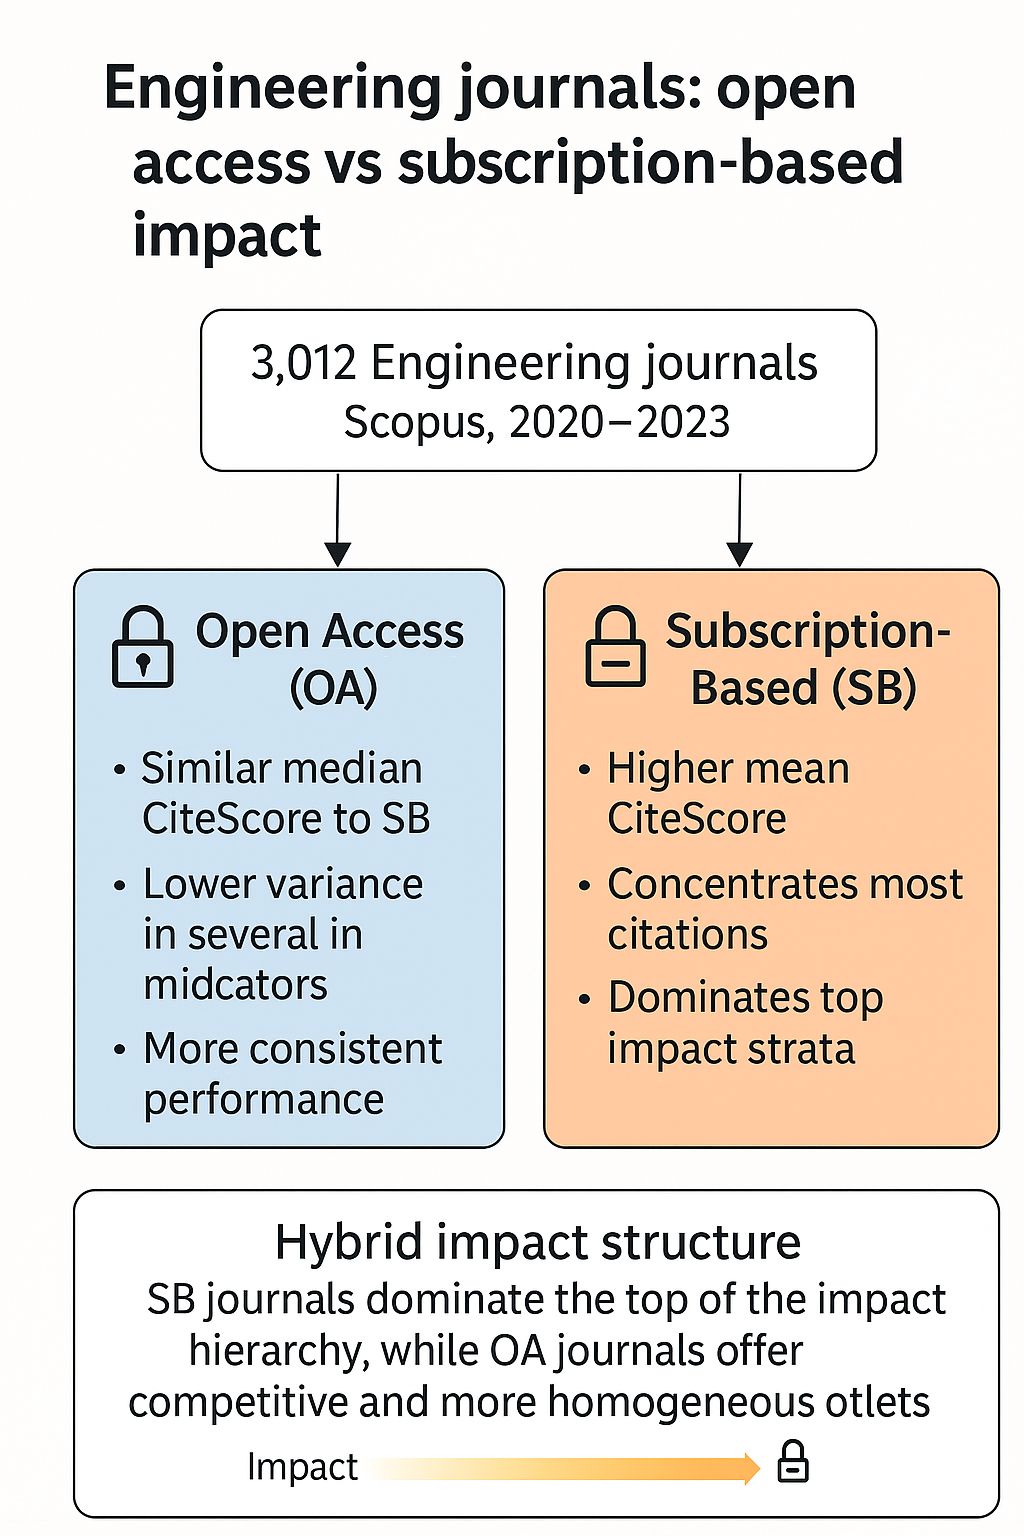
This study compares the publication performance of Open-Access (OA) and subscrip-tion-based (SB) journals in Engineering, using bibliometric indicators from Scopus (2023 view). A total of 3012 active Engineering journals were analysed, of which 757 are OA, and 2255 are SB. Four metrics were examined for the period 2020–2023: CiteScore, total citations, number of published documents, and the percentage of cited articles, stratified by CiteScore quartiles (Q1–Q4) and the top 10% CiteScore group. SB journals concentrate most citations and tend to achieve higher mean CiteScores, larger publication volumes, and higher percentages of cited articles in the upper strata, with statistically significant differences on several indicators. At the same time, OA journals display CiteScore medians that are very similar to those of SB journals and lower var-iance for several indicators, particularly within the top 10% group, indicating more consistent performance among well-established OA titles. OA journals represent around one quarter of Engineering journals in Scopus, but remain underrepresented in the most highly cited segment. These findings suggest a hybrid configuration in which SB journals retain dominance at the top of the impact hierarchy. In contrast, OA jour-nals offer competitive and more homogeneous outlets with implications for publication strategies and open-access policies in Engineering.
Keywords:
open access
; subscription-based journals
; impact metrics
; bibliometrics
; engineering
1. Introduction
The Open Access (OA) movement became consolidated in the early twenty-first century, particularly following the Budapest Open Access Initiative in 2002 and the Bethesda and Berlin Declarations, which defined OA as the free and unrestricted availability of scientific knowledge for reading, downloading, copying, distributing, and legitimate use (Brown et al., 2003; Max-Planck-Gesellschaft, 2003). Since then, different publication models have become established, including Gold OA with Article Processing Charges (APCs), hybrid and transformative models, Green OA in institutional repositories, and Diamond OA, which imposes no fees on either authors or readers (Ancion et al., 2022; Borrego, 2023; Rooryck et al., 2024; Suber, 2012). In parallel, a growing body of literature has examined whether, and to what extent, OA is associated with citation and visibility advantages when compared with subscription-based (SB) journals (Huang et al., 2024; Laakso & Björk, 2012; Langham-Putrow et al., 2021).
The expansion of OA has taken place in a context in which large commercial publishers and scholarly societies retain strategic positions in high-prestige journals, frequently either closed-access or associated with high APCs, which tends to reinforce asymmetries between countries and institutions with different funding capacities (Haug, 2019; May, 2020; McCabe & Mueller-Langer, 2024; Rodrigues et al., 2022). In Engineering, a field that is strongly associated with technological innovation, intellectual property, and large-scale infrastructure projects, this tension becomes evident. Many of the most influential journals are linked to professional societies and commercial publishers that operate SB, hybrid, or high-APC OA models, while a smaller fraction of Diamond OA journals seeks to reconcile free access for authors and readers with high editorial and scientific standards (Borrego, 2023; Laakso & Björk, 2012; Miranda & Garcia-Carpintero, 2019).
This article positions itself within this debate from an explicit perspective of bibliometrics and the evaluation of publication models, rather than an analysis of thematic content in Engineering. The focus is on how different access models, namely open-access journals and SB journals, are distributed across prestige strata in the Scopus database, as well as on the patterns of impact, editorial volume, and visibility associated with each group. Engineering is treated as a privileged observational field for investigating the extent to which the expansion of OA has been able to reconfigure consolidated prestige structures, traditionally anchored in SB journals, or whether these structures remain largely intact (DORA, 2013; Hicks et al., 2015; Wilsdon et al., 2015).
Recent studies have mapped the growth of OA and discussed inequalities associated with APC-based models, highlighting that fee-based publication can create additional barriers for researchers in countries and institutions with more limited funding capacity (Haug, 2019; May, 2020; Oliveira et al., 2023; Rodrigues et al., 2022). At the same time, analyses of the distribution of documents and citations across quartiles suggest that the concentration of prestige in a relatively small set of high-impact journals remains a robust feature of the scientific system (Miranda & Garcia-Carpintero, 2019). Despite these advances, systematic comparisons between open-access and SB journals in Engineering remain relatively scarce, particularly those that articulate established bibliometric indicators such as CiteScore, citation counts, article volume, and the percentage of cited articles with stratification by quartile and the top 10 percent CiteScore segment in Scopus.
In previous work, From Fees to Free: Comparing APC-Based and Diamond Open Access Journals in Engineering, Pilatti et al. (2025) analysed OA Engineering journals exclusively, comparing APC-based titles with those operating under the Diamond OA model, using bibliometric data collected between 2020 and 2023. That study showed that APC-based journals tend to dominate the upper strata in terms of absolute citation counts, partly due to the presence of mega-journals. In contrast, Diamond journals are able, in specific segments, to maintain competitive proportions of cited articles. However, the analysis was restricted to the universe of OA journals and did not include the large majority of Engineering journals that follow SB or hybrid models. The present article builds upon Pilatti et al. (2025) by incorporating, alongside OA journals, SB journals in Engineering, analyzing their distribution across prestige strata, namely Scopus quartiles and the top 10 percent CiteScore segment, and comparing performance patterns across different access models. In doing so, it seeks to clarify whether the adoption of OA has, in fact, reshaped patterns of impact and productivity in Engineering, or whether the dynamics of concentration in SB journals remain predominant.
Drawing on a set of 3,012 active Engineering journals indexed in Scopus, of which 757 are open-access journals with an assigned quartile, this study compares open-access and SB journals in terms of CiteScore, total citation counts, article volume, and the percentage of cited articles in the period from 2020 to 2023. More specifically, it asks the following questions. How are open-access and SB journals distributed across quartiles (Q1 to Q4) and within the top 10 percent CiteScore segment in Scopus? Are there systematic differences between these groups in terms of impact, measured by citations, editorial volume, and visibility, expressed as the percentage of cited articles? To what extent do such differences reinforce or mitigate asymmetries between centres and peripheries in the scientific system, particularly for graduate programmes and research groups in countries facing budgetary constraints? By combining established bibliometric indicators with the evaluation of various publication models, the article aims to provide empirical evidence that informs the design of open-access policies in technical fields and the formulation of more realistic and equitable publication strategies in Engineering.
2. Materials and Methods
2.1. Data Source and Sample Selection
This exploratory, quantitative study is based on secondary data retrieved from the Scopus database (2023 view), with data collection carried out on December 2, 2024. The focus was the “Engineering” subject area (code 22), which comprises 18 sub-areas, including Aerospace Engineering, Architecture, Automotive Engineering, Biomedical Engineering, Building and Construction, Civil and Structural Engineering, Computational Mechanics, Control and Systems Engineering, Electrical and Electronic Engineering, Engineering (miscellaneous), General Engineering, Industrial and Manufacturing Engineering, Mechanical Engineering, Mechanics of Materials, Media Technology, Ocean Engineering and Safety, Risk, Reliability and Quality.
From an initial set of 6,442 results, a source-type filter narrowed the sample to scientific journals, resulting in 5,162 records. Among these, 803 titles were identified as OA journals via the “Open Access” label in Scopus. Next, only journals assigned to at least one CiteScore quartile (Q1–Q4) were retained; titles with “N/A” quartile status or inactive journals were excluded. This procedure resulted in 3,012 journals, of which 757 were OA.
To capture the upper prestige stratum, an additional filter identified journals in the top 10% of the CiteScore within the Engineering field. This group comprised 486 journals, of which 126 were OA. SB journals were obtained by subtracting OA titles from the total in each stratum.
2.2. Grouping by Access Model and Impact Strata
Journals were grouped into two categories: OA and SB, to enable direct comparisons between access models across different levels of editorial prestige. The final distribution by quartile in Engineering was as follows:
- Q1: 1,003 journals, of which 264 OA;
- Q2: 857 journals, of which 234 OA;
- Q3: 661 journals, of which 180 OA;
- Q4: 491 journals, of which 79 are OA.
Journals without a quartile classification (N/A) were excluded from all analyses. In the top 10% CiteScore stratum, 126 of the 486 journals were OA, and the remainder were classified as SB.
This sampling design enables a systematic comparison of the performance of OA and SB journals, both across the full prestige distribution (Q1–Q4) and within the elite core of the field (top 10% in CiteScore).
2.3. Variables and Analysis Period
The analysis focused on four bibliometric indicators chosen to capture complementary dimensions of editorial performance and academic impact in Engineering journals:
- CiteScore 2023 – used as a measure of journal prestige in Scopus.
- Number of citations (2020–2023) – an indicator of cumulative impact or academic attention received by journal outputs in the period.
- Number of documents published (2020–2023) – a measure of editorial output volume.
- Percentage of cited articles (% Cited, 2020–2023) – a visibility indicator, representing the share of articles that received at least one citation in the period.
All four indicators were extracted from Scopus metric reports for the 2020–2023 window, ensuring temporal comparability between OA and SB journals in every analysis stratum (quartiles and top 10%).
2.4. Statistical Procedures
Descriptive statistical analyses were first conducted for all variables within each combination of impact stratum (Q1–Q4 and top 10% CiteScore) and access model (OA and SB). The following descriptive measures were computed: mean, median, variance, standard deviation, coefficient of variation, confidence intervals, range, and quartile values. These statistics provide an overview of average performance, dispersion, and consistency within each group, and allow the identification of concentration patterns and heterogeneity between OA and SB journals.
Subsequently, independent samples t-tests were performed to assess whether differences in performance indicators between OA and SB journals were statistically significant. The tests were applied separately for each quartile (Q1–Q4) and for the top 10% CiteScore group, comparing the means of OA and SB for the four variables of interest: CiteScore, number of citations, number of documents published, and percentage of cited articles. Statistical significance was set at the 5% level (p < 0.05), with a 95% confidence level used to interpret the results. All statistical analyses were carried out using IBM SPSS Statistics, version 28.
Given that citation and publication counts in bibliometric studies tend to display right-skewed distributions, the t-test results are interpreted in conjunction with descriptive measures (especially medians, quartiles, and coefficients of variation), with emphasis on the magnitude of differences and variability patterns between OA and SB journals, rather than on statistical significance alone.
2.5. Study Limitations
This methodological design entails some inherent limitations. First, the results depend exclusively on the coverage and classification provided by Scopus, which may exclude relevant journals indexed in other databases or not yet assigned to a CiteScore quartile. Second, the analysis is conducted at the journal level and relies on aggregated indicators for 2020–2023, without distinguishing between individual articles, document types, or specific subtopics within the Engineering sub-areas. Finally, the statistical tests are based on raw citation and publication metrics, which can be highly skewed. However, the relatively large sample sizes and the combined use of descriptive statistics help mitigate this issue; the findings should be interpreted as evidence at an aggregate level rather than as causal estimates of the effect of the access model on impact.
3. Results
3.1. General Characteristics of the Sample
The analyzed sample comprises 3,012 Engineering journals indexed in the Scopus database, distributed across 18 sub-areas (e.g., Electrical and Electronic Engineering, Mechanical Engineering, Civil and Structural Engineering, Control and Systems Engineering, among others). Filtering by source type (journals only) and by the availability of a quartile classification resulted in 757 OA journals and 2,255 SB journals.
Of these, 486 journals are located within the top 10% of CiteScore in the field, 126 of which are OA and 360 SB, which already indicates a more substantial presence of SB journals at the top of the impact distribution.
3.2. CiteScore Across Quartiles and in the Top 10% Stratum
Table 1 presents the descriptive statistics for CiteScore (mean, median, standard deviation, variance, confidence interval, and sample size) for OA and SB journals in each quartile (Q1–Q4). CiteScore medians are very similar between OA and SB journals in all strata, suggesting a comparable level of typical impact across most of the distribution. In Q1, however, SB journals display a higher mean CiteScore than OA journals, reflecting the weight of very high-impact titles among SB journals. In the lower quartiles, mean differences become less pronounced, indicating greater heterogeneity in editorial trajectories across both access models.
When attention shifts to the group of journals in the top 10% of CiteScore in Engineering, Table 2 shows that SB journals maintain a slightly higher mean CiteScore, albeit with higher variance and a higher coefficient of variation. OA journals, in turn, exhibit lower dispersion, which suggests more consistent performance within this stratum, albeit with a slightly lower mean.
3.3. Total Citations (2020–2023)
Table 3 presents the total number of citations received by journals between 2020 and 2023, by quartile and access model. Although OA and SB journals show similar medians in several strata, SB journals concentrate the majority of total citations in the field, accounting for a substantial share of accumulated impact. In Q1, the difference is particularly pronounced, with SB journals displaying a significantly higher mean number of citations than OA journals. In the remaining quartiles, discrepancies in total citations are minor in absolute terms, although the general trend of SB predominance is maintained.
3.4. Volume of Documents Published (2020–2023)
Table 4 summarizes the mean number of documents published per journal in the period 2020–2023, by quartile and access model. Overall, SB journals tend to publish slightly higher volumes; however, this difference becomes statistically significant only in specific strata, such as the third quarter (Q3). In Q1, both OA and SB journals exhibit high publication volumes, with similar means, which indicates the presence of prominent journals in both access models. Taken together, these results suggest that SB journals tend to concentrate higher output in some segments, which enhances the accumulation of citations, but does not exclude the presence of highly productive OA journals in the upper strata.
3.5. Percentage of Cited Articles (% Cited)
Table 5 reports the percentage of articles that received at least one citation (% Cited) in the period 2020–2023, by quartile. Across the sample as a whole, both OA and SB journals exhibit high percentages of cited articles, indicating consistent integration into the citation networks of the Engineering field. In Q1, SB journals show a moderate advantage in % Cited, with a statistically significant difference compared with OA journals. In the other strata, differences are minor and not always significant, suggesting that, in terms of the probability that an article will be cited, both access models can offer relatively similar conditions, especially outside the upper tail of the distribution.
3.6. Summary of Observed Patterns
Taken together, the results indicate a scenario in which SB journals maintain a leading position in terms of mean impact, total citations, and, in some strata, volume of published documents, especially in Q1 and in the top 10% CiteScore group. At the same time, OA journals display medians close to those of SB journals and lower variability in some indicators, suggesting more consistent performance among well-established OA titles. This hybrid pattern suggests the coexistence of a prestige hierarchy that remains strongly associated with SB journals and a growing presence of competitive OA journals in the upper echelons of Engineering.
4. Discussion
The results of this study show that, in Engineering, the expansion of OA has not decisively reshaped the prestige and impact hierarchy historically occupied by SB journals. Overall, SB journals display higher mean CiteScores, concentrate the majority of total citations, and, in some strata, publish larger volumes of documents, especially in Q1 and in the group of journals in the top 10% of CiteScore. At the same time, OA journals exhibit medians that are very close to those of SB journals and, in some cases, lower variability in key indicators, suggesting more consistent performance among well-established OA titles. This configuration points to a hybrid scenario. The prestige structure remains strongly associated with SB journals, but it coexists with a growing presence of competitive OA journals in the upper strata of the field.
4.1. A Citation Advantage for Open Access?
The literature on the so-called “citation advantage” of OA reports heterogeneous findings. Studies, such as those by Davis (2011), suggest that open availability can increase downloads and immediate visibility, but does not necessarily translate into a higher number of citations in the long term. In contrast, large-scale analyses, such as those by Piwowar et al. (2018) and Langham-Putrow et al. (2021), indicate that OA articles tend, on average, to receive more citations than closed articles, particularly in Green and Hybrid OA models.
In the specific context of Engineering, the results of this study suggest a more nuanced situation. On the one hand, the close similarity between CiteScore medians and the percentages of cited articles indicates that a well-established OA journal can reach levels of “typical” impact similar to those of SB journals. On the other hand, the fact that SB journals account for most of the total citations and exhibit statistically significant differences in citations and the percentage of cited articles in Q1 indicates that the structural advantage in terms of accumulated visibility largely remains on the side of SB titles. In other words, in this setting, OA does not emerge as a generalised superiority, but rather as a combination of equilibrium in central tendency measures and disadvantage in volume and accumulation metrics.
4.2. Prestige Concentration and Editorial Oligopolies
The predominance of SB journals in the upper impact strata is consistent with literature that discusses the concentration of prestige in a small number of publishing groups and scholarly societies. Bibliometric studies across various fields have shown that a relatively small fraction of journals, often affiliated with large commercial publishers or long-established professional societies, concentrates both production and citations, thereby reinforcing an oligopolistic editorial structure.
By explicitly incorporating SB journals into the analysis, this study demonstrates that, despite the diffusion of OA, this hierarchical structure persists. The combination of high means and greater variance in CiteScore and citations among SB journals in the top 10% stratum suggests that an important part of this advantage stems from the presence of a few very high-volume and high-impact titles, in line with the role of mega-journals identified in the authors’ previous study on APC-based and Diamond OA journals in Engineering. Although the present work does not formally isolate these titles, the dispersion pattern observed reinforces the hypothesis that accumulated reputation, consolidated citation networks, and large editorial capacity continue to favour SB journals, even in the context of OA expansion.
4.3. Implications for Peripheral Countries and Graduate Programmes
In peripheral countries, such as Brazil, characterized by budget constraints, the precarization of higher education, and intense pressure to publish in high-impact journals, the continued centrality of SB titles in the upper stratum has significant implications. For many research groups and graduate programmes, access to these journals depends on library consortia or significant investments in subscription packages, while publishing in OA journals financed by APCs can impose prohibitive costs.
The results of this study indicate that, as it is currently configured in Engineering, the adoption of OA does not automatically eliminate these asymmetries. In terms of the probability that an article will be cited and of median impact, OA journals can offer good conditions for visibility. However, the large-scale accumulation of impact and presence in the field’s “elite” remains predominantly associated with SB titles. For graduate programmes in Engineering, this means that publication strategies need to balance, in a realistic way, expectations of impact with funding limitations and with the design of national research assessment policies.
4.4. Metrics, Evaluation, and Open Science Policies
The findings also contribute to the debate on the responsible use of metrics in research assessment, as synthesized in documents such as the Leiden Manifesto, DORA, and the Metric Tide report. The observation that OA and SB journals exhibit similar medians in indicators such as CiteScore and the percentage of cited articles, while SB journals receive the majority of total citations, reinforces the need to avoid decisions based solely on aggregated indicators that can be inflated by a small number of highly cited titles.
From the perspective of open science policies, the results suggest that the simple expansion of OA, without changes in how metrics are used in evaluation processes, is not sufficient to alter the prestige structure in Engineering. On the contrary, there is a risk of maintaining or even reinforcing inequalities if metrics such as quartiles and ranking positions are used mechanically. Open-access policies in technical fields, therefore, need to articulate widening access, financial sustainability, and a critical review of assessment criteria, so that openness does not become merely an additional layer on top of an already consolidated hierarchy.
4.5. Advances Relative to the Literature and to Previous Work
Compared to the authors’ previous study, “From Fees to Free: Comparing APC-Based and Diamond OA Journals in Engineering,” this article makes at least three main advances. First, it broadens the scope of publishing models under analysis. Instead of comparing only OA journals (APC-based versus Diamond), it also includes SB journals, thereby enabling an assessment of the relative performance of OA in relation to the complete set of relevant channels in Engineering. Second, by working with CiteScore quartiles and the top 10% stratum, the study provides a stratified view of the prestige hierarchy, illustrating how OA and SB journals are distributed along the impact pyramid and where the most pronounced differences are concentrated. Third, the analysis emphasizes not only means but also patterns of variability and consistency, distinguishing between absolute impact (total citations, number of documents) and relative impact (CiteScore, percentage of cited articles).
In relation to the international literature on OA, the study contributes by showing that, in Engineering, the advantage of OA does not manifest as a generalised superiority. Instead, it appears as a capacity to compete in typical impact, while SB journals retain the lead in citation accumulation and publication volume. This combination helps to qualify the debate on OA in technical and scientific fields, suggesting that open science policies and assessment criteria need to account not only for the open/closed dichotomy, but also for the forms of concentration and dispersion patterns that are reproduced within each access model.
5. Conclusions
This study analysed the performance of OA and SB journals in the field of Engineering, using data from the Scopus database for the period 2020–2023. Based on 3,012 active journals, distributed across 18 sub-areas and stratified by CiteScore quartiles and by the group of journals in the top 10% of CiteScore, four bibliometric indicators were compared: CiteScore, total number of citations, volume of published documents, and percentage of cited articles.
The results show, first, that SB journals maintain a central position in the prestige and impact hierarchy of Engineering. They concentrate most of the total citations, display higher mean CiteScores, and, in certain strata, publish larger volumes of documents, with statistically significant differences in citations in Q1, in document volume in Q3, and in the percentage of cited articles in Q1. Second, CiteScore medians and the percentage of cited articles are very similar between OA and SB journals, and OA titles exhibit lower variability in some indicators, especially in the top 10% CiteScore stratum, suggesting a more consistent performance pattern among well-established OA journals.
Third, the findings indicate that the expansion of OA in Engineering has not, so far, resulted in a reversal of the existing concentration structure of impact, but rather in the coexistence of (i) a core of SB journals that continues to dominate the accumulation of citations and publication volume and (ii) a group of OA journals that can compete in terms of typical impact and relative visibility. In this sense, OA appears less as a direct substitute for SB journals and more as a complement within an editorial ecology that remains strongly hierarchical.
From a practical standpoint, the results provide evidence for different stakeholders in the Engineering research system. For libraries and subscription consortia, the need is highlighted to negotiate collections that simultaneously secure access to the highest-impact SB journals and incorporate OA titles with strong performance in CiteScore, as measured by the percentage of cited articles and consistency of indicators. For funding agencies, they underscore the importance of designing OA support policies that do not reinforce inequalities, balancing APC funding with the strengthening of sustainable OA models, including Diamond, and with assessment criteria that recognise both absolute and relative impact. For graduate programmes in Engineering, the findings reinforce the need for realistic publication strategies that take into account funding constraints, evaluation requirements, and opportunities for visibility in both OA and SB journals.
This study has limitations that should be acknowledged. The analysis is based exclusively on the Scopus database, which implies dependence on its coverage and classification criteria. Relevant journals indexed in other databases, or not yet assigned to a CiteScore quartile, are excluded. Additionally, the indicators used are aggregated at the journal level for the period 2020–2023, which hinders the identification of internal differences between document types, collaboration profiles, or specific subtopics within each Engineering sub-area. Finally, the results are observational and do not allow causal inferences about the relationship between the access model and impact; they should therefore be interpreted as descriptive evidence at an aggregate level.
Despite these limitations, the study contributes to the debate on OA in technical and scientific fields by showing that, in Engineering, OA has the capacity to compete in terms of median impact and visibility, but still coexists with an intense concentration of prestige and citations in SB journals. Future research may deepen these findings by exploring differences between specific sub-areas, the role of mega-journals, interactions with national assessment and funding policies, and the temporal evolution of these patterns as new open science policies are implemented.
Author Contributions
L.E.P.: Investigation, Formal analysis, Writing—original draft preparation; L.A.P.: Conceptualization, Methodology, Validation, Writing—review and editing; G.D.G.d.C.: Supervision, Validation; L.M.M.d.R.: Supervision, Validation. All authors have read and agreed to the published version of the manuscript.
Funding
This research received no external funding.
Data Availability Statement
The data that support the findings of this study were obtained from the Scopus database (Elsevier). Restrictions apply to the availability of these data, which were used under license. Aggregated data derived from the Scopus records may be available from the corresponding author upon reasonable request and with permission of Elsevier.
Acknowledgments
L.A.P. acknowledges support from a research productivity fellowship from the Brazilian National Council for Scientific and Technological Development (CNPq). During the preparation of this manuscript, the authors used ChatGPT (OpenAI, GPT-5.1) to assist with language editing and revision of the English text. The authors have reviewed and edited the output of this tool and take full responsibility for the content of this publication.
Conflicts of Interest
The authors declare no conflict of interest.
Abbreviations
The following abbreviations are used in this manuscript:
| APC | Article Processing Charge |
| APCs | Article Processing Charges |
| CNPq | Brazilian National Council for Scientific and Technological Development |
| DORA | San Francisco Declaration on Research Assessment |
| OA | Open Access |
| SB | Subscription-Based (journal or publication model) |
| Q1–Q4 | CiteScore quartiles 1 to 4 |
| SPSS | Statistical Package for the Social Sciences |
| UTFPR | Federal University of Technology – Paraná |
References
- Ancion, Z., Borrell-Damián, L., Mounier, P., Rooryck, J., & Saenen, B. (2022). Action plan for diamond open access. Zenodo. [CrossRef]
- Borrego, A. (2023). Article processing charges for open access journal publishing: A review. Learned Publishing, 36(3), 359–378. [CrossRef]
- Brown, P. O., Cabell, D., Chakravarti, A., Cohen, B., Delamothe, T., Eisen, M., Grivell, L., Guédon, J.-C., Hawley, R. S., Johnson, R. K., Kirschner, M. W., Lipman, D., Lutzker, A. P., Marincola, E., Roberts, R. J., Rubin, G. M., Schloegl, R., Siegel, V., So, A. D., Suber, P., Varmus, H. E., Velterop, J., Walport, M. J., & Watson, L. (2003). Bethesda Statement on Open Access Publishing. Howard Hughes Medical Institute. Available online: https://dash.harvard.edu/handle/1/4725199 (accessed on 1 December 2025).
- Davis, P. M. (2011). Open access, readership, citations: A randomized controlled trial of scientific journal publishing. The FASEB Journal, 25(7), 2129–2134. [CrossRef]
- DORA. (2013). San Francisco Declaration on Research Assessment. Available online: https://sfdora.org/ (accessed on 1 December 2025).
- Haug, C. J. (2019). No free lunch: What price is Plan S for scientific publishing? The New England Journal of Medicine, 380(12), 1181–1185. [CrossRef]
- Hicks, D., Wouters, P., Waltman, L., de Rijcke, S., & Rafols, I. (2015). Bibliometrics: The Leiden Manifesto for research metrics. Nature, 520(7548), 429–431. [CrossRef]
- Huang, C.-K., Neylon, C., Montgomery, L., Hosking, R., Diprose, J. P., Handcock, R. N., & Wilson, K. (2024). Open access research outputs receive more diverse citations. Scientometrics, 129(2), 825–845. [CrossRef]
- Laakso, M., & Björk, B. C. (2012). Anatomy of open access publishing: A study of longitudinal development and internal structure. BMC Medicine, 10, 124. [CrossRef]
- Langham-Putrow, A., Bakker, C., & Riegelman, A. (2021). Is the open access citation advantage real? A systematic review of the citation of open access and subscription-based articles. PLoS ONE, 16(6), e0253129. [CrossRef]
- Max-Planck-Gesellschaft. (2003). Berlin Declaration on Open Access to Knowledge in the Sciences and Humanities. Munich, Germany. Available online: http://openaccess.mpg.de/286432/Berlin-Declaration (accessed on 1 December 2025).
- May, C. (2020). Academic publishing and open access: Costs, benefits, and options for publishing research. Politics, 40(1), 120–135. [CrossRef]
- McCabe, M. J., & Mueller-Langer, F. (2024). Open access is shaping scientific communication: Funders and publishers should roll out policies in ways to support their evaluation. Science, 385(6714), 1170–1172. [CrossRef]
- Miranda, R., & Garcia-Carpintero, E. (2019). Comparison of the share of documents and citations from different quartile journals in 25 research areas. Scientometrics, 121(1), 479–501. [CrossRef]
- Oliveira, A. L. de, Santos, M. G., Ostermann, A. C., & Bortoluzzi, V. L. (2023). Pagamento de taxas (exorbitantes) em periódicos científicos internacionais de grande visibilidade. Boletim de Conjuntura (BOCA), 14(40), 333–350. [CrossRef]
- Pilatti, L. E., Pilatti, L. A., Carvalho, G. D. G. de, & Resende, L. M. M. de. (2025). From fees to free: Comparing APC-based and diamond open access journals in engineering. Publications, 13(2), 16. [CrossRef]
- Piwowar, H., Priem, J., Larivière, V., Alperin, J. P., Matthias, L., Norlander, B., Farley, A., West, J., & Haustein, S. (2018). The state of OA: A large-scale analysis of the prevalence and impact of open access articles. PeerJ, 6, e4375. [CrossRef]
- Rodrigues, M. L., Savino, W., & Goldenberg, S. (2022). Article-processing charges as a barrier for science in low-to-medium income regions. Memórias do Instituto Oswaldo Cruz, 117, e220064. [CrossRef]
- Rooryck, J., Rico Castro, P., & de Pablo Llorente, V. (2024). Quality as a public good: The Diamond Open Access Standard (DOAS) and its role in the Global Diamond Open Access Alliance. Septentrio Conference Series, 1. Available online: https://septentrio.uit.no/index.php/SCS/article/view/7770 (accessed on 1 December 2025). [CrossRef]
- Suber, P. (2012). Open access. Cambridge, MA, USA: MIT Press.
- Wilsdon, J., Allen, L., Belfiore, E., Campbell, P., Curry, S., Hill, S., Jones, R., Kain, R., Kerridge, S., Thelwall, M., Tinkler, J., Viney, I., Wouters, P., Hill, J., & Johnson, B. (2015). *The metric tide: Report of the independent review of the role of metrics in research assessment and management*. Higher Education Funding Council for England (HEFCE), London, UK. Available online: https://www.researchgate.net/publication/279402178_The_Metric_Tide_Report_of_the_Independent_Review_of_the_Role_of_Metrics_in_Research_Assessment_and_Management (accessed on 1 December 2025). [CrossRef]

Table 1.
CiteScore of journals by Scopus quartile (Engineering subject area).
| STATISTIC | Q1 OA | Q1 SB | Q2 OA | Q2 SB | Q3 OA | Q3 SB | Q4 OA | Q4 SB |
| Sample Size (n) | 264 | 736* | 234 | 623 | 180 | 481 | 79 | 412 |
| Mean | 8.92 | 9.73 | 3.57 | 3.55 | 1.74 | 1.62 | 0.61 | 0.58 |
| Midrange | 21.55 | 40.40 | 3.85 | 3.70 | 2.25 | 2.20 | 0.75 | 0.90 |
| Root Mean Square (RMS) | 10.31 | 12.27 | 3.80 | 3.76 | 1.91 | 1.72 | 0.73 | 0.69 |
| Variance (s²) | 26.92 | 56.09 | 1.68 | 1.57 | 0.61 | 0.36 | 0.16 | 0.14 |
| Standard Deviation (s) | 5.19 | 7.49 | 1.30 | 1.25 | 0.78 | 0.60 | 0.40 | 0.37 |
| Mean Absolute Deviation | 3.66 | 4.54 | 1.02 | 0.98 | 0.60 | 0.45 | 0.33 | 0.31 |
| Range | 41.70 | 79.60 | 7.10 | 6.80 | 4.10 | 4.20 | 1.50 | 1.80 |
| Coefficient of Variation (%) | 58.19 | 76.99 | 36.3 | 35.36 | 44.82 | 37.30 | 64.52 | 63.64 |
| Minimum | 0.7 | 0.6 | 0.3 | 0.3 | 0.2 | 0.1 | 0 | 0 |
| 1st Quartile (Q1) | 5.80 | 5.90 | 2.80 | 2.80 | 1.30 | 1.20 | 0.20 | 0.30 |
| 2nd Quartile (Median/Q2) | 7.70 | 7.80 | 3.60 | 3.60 | 1.80 | 1.60 | 0.70 | 0.60 |
| 3rd Quartile (Q3) | 10.70 | 11.10 | 4.40 | 4.40 | 2.20 | 1.90 | 0.90 | 0.90 |
| Maximum | 42.4 | 80.2 | 7.4 | 7.1 | 4.3 | 4.3 | 1.5 | 1.8 |
| Sum | 2354.10 | 7159.80 | 836.30 | 2210.80 | 313.70 | 776.90 | 48.40 | 240.20 |
| Sum of Squares | 28072.15 | 110875.20 | 3381.43 | 8824.50 | 655.93 | 1429.07 | 41.84 | 196.62 |
| 95% Confidence Interval (CI) for Mean | 8.29 <mean< 9.55 | 9.19 <mean< 10.27 | 3.41 <mean< 3.74 | 3.45 <mean< 3.65 | 1.63 <mean< 1.86 | 1.56 <mean< 1.67 | 0.52 <mean< 0.70 | 0.55 <mean< 0.62 |
| 95% CI for Standard Deviation (SD) | 4.78 <SD< 5.67 | 7.13 <SD< 7.89 |
1.19 <SD< 1.43 | 1.19 <SD< 1.33 | 0.71 <SD< 0.87 | 0.57 <SD< 0.64 | 0.34 <SD< 0.47 | 0.35 <SD< 0.40 |
| 95% CI for Variance (VAR) | 22.85 <VAR< 32.19 | 50.77 <VAR< 62.30 | 1.42 <VAR< 2.04 | 1.41 <VAR< 1.76 | 0.50 <VAR< 0.76 | 0.32 <VAR< 0.41 | 0.12 <VAR< 0.22 | 0.12 <VAR< 0.16 |
Note: OA = Open Access; SB = subscription-based. * Three records were omitted due to the limit of 1,000 results per query imposed by Scopus.
Table 2.
Total citations of journals in the top 10% impact percentile.
| STATISTIC | Q1 OA | Q1 SB | Q2 OA | Q2 SB | Q3 OA | Q3 SB | Q4 OA | Q4 SB |
| Sample Size (n) | 264 | 736* | 234 | 623 | 180 | 481 | 79 | 412 |
| Mean | 9456.38 | 14388.90 | 1903.74 | 1978.11 | 413.57 | 636.30 | 90.80 | 179.08 |
| Midrange | 242391 | 255949.5 | 38398.5 | 22178 | 2335 | 4859 | 418 | 1040 |
| Root Mean Square (RMS) | 40551.43 | 37003.55 | 6359.03507 | 3961.02 | 728.43 | 1110.45 | 164.11 | 320.64 |
| Variance (s²) | 1560908061.80 | 1163803700.60 | 36971116.09 | 11795690.99 | 361584.05 | 829951.71 | 18929.09 | 70901.00 |
| Standard Deviation (s) | 39508.33 | 34114.57 | 6080.39 | 3434.46 | 601.32 | 911.02 | 137.58 | 266.29 |
| Mean Absolute Deviation | 12871.00 | 15504.66 | 2179.57 | 1791.21 | 340.99 | 559.81 | 82.56 | 175.74 |
| Range | 484704.00 | 511869.00 | 76749.00 | 44340.00 | 4660.00 | 9710.00 | 836.00 | 2080.00 |
| Coefficient of Variation (%) | 417.80 | 237.09 | 319.39 | 173.62 | 145.40 | 143.18 | 151.53 | 148.70 |
| Minimum | 39 | 15 | 24 | 8 | 5 | 4 | 0 | 0 |
| 1st Quartile (Q1) | 842.50 | 1673.00 | 294.00 | 390.00 | 123.00 | 151.00 | 14.00 | 16.50 |
| 2nd Quartile (Median/Q2) | 1790.50 | 5004.00 | 566.00 | 1008.00 | 234.00 | 306.00 | 49.00 | 76.50 |
| 3rd Quartile (Q3) | 3790.00 | 14153.00 | 1357.00 | 2174.00 | 480.50 | 748.00 | 112.00 | 240.50 |
| Maximum | 484743 | 511884 | 76773 | 44348 | 4665 | 9714 | 836 | 2080 |
| Sum | 2496484 | 10590227 | 445474 | 1232360 | 74443 | 306058 | 7173 | 73782 |
| Sum of Squares | 434126518594 | 1007777388301 | 9462334514 | 9774658432 | 95511101 | 593120064 | 2127759 | 42357076 |
| 95% Confidence Interval (CI) for Mean | 4668.56 <mean< 14244.20 | 11920.22 <mean< 16857.58 | 1120.61 <mean< 2686.86 | 1707.89 <mean< 2248.32 | 325.13 <mean< 502.02 | 554.67 <mean< 717.92 | 59.98 <mean< 121.61 | 153.29 <mean< 204.87 |
| 95% CI for Standard Deviation (SD) | 36401.18 <SD< 43199.93 | 32456.36002 <SD< 35952.67 | 5574.87 <SD< 6687.51 | 3253.79 <SD< 3636.59 | 544.96 <SD< 670.79 | 856.86 <SD< 972.54 | 118.97 <SD< 163.15 | 249.26 <SD< 285.83 |
| 95% CI for Variance (VAR) | 1325045884.13 <VAR< 1866233599.40 | 1053415305.78 <VAR< 1292594774.55 | 31079216.13 <VAR< 44722749.94 | 10587149.61 <VAR< 13224793.32 | 296977.39 <VAR< 449953.60 | 734200.69 <VAR< 945838.45 | 14153.83 <VAR< 26619.51 | 62132.35 <VAR< 81698.87 |
Note: OA = Open Access; SB = subscription-based. * Three records were omitted due to the limit of 1,000 results per query imposed by Scopus.
Table 3.
Total citations (2020–2023) for journals by Scopus quartile.
| STATISTIC | Q1 OA | Q1 SB | Q2 OA | Q2 SB | Q3 OA | Q3 SB | Q4 OA | Q4 SB |
| Sample Size (n) | 264 | 736* | 234 | 623 | 180 | 481 | 79 | 412 |
| Mean | 1193.18 | 1254.55 | 455.099 | 498.96 | 217.62 | 374.88 | 124.67 | 266.25 |
| Midrange | 24851 | 11811.5 | 7259 | 4449 | 1149 | 2198 | 342.5 | 1792.5 |
| Root Mean Square (RMS) | 5269.77 | 2408.81 | 1282.91 | 893.20 | 338.21 | 614.74 | 174.64 | 439.93 |
| Variance (s²) | 26446929.39 | 4234224.85 | 1444919.86 | 549728.96 | 67404.11 | 237857.33 | 15147.30 | 122946.93 |
| Standard Deviation (s) | 5142.66 | 2057.72 | 1202.05 | 741.44 | 259.62 | 487.71 | 123.07 | 350.64 |
| Mean Absolute Deviation | 1663.08 | 1170.60 | 474.38 | 409.59 | 154.51 | 306.20 | 81.00 | 213.45 |
| Range | 49672.00 | 23609.00 | 14490.00 | 8888.00 | 2258.00 | 4374.00 | 655.00 | 3573.00 |
| Coefficient of Variation (%) | 431.01 | 164.02 | 264.13 | 148.60 | 119.30 | 130.10 | 98.72 | 131.70 |
| Minimum | 15 | 7 | 14 | 5 | 20 | 11 | 15 | 6 |
| 1st Quartile (Q1) | 112.00 | 230.00 | 95.00 | 127.00 | 84.00 | 96.00 | 46.00 | 71.50 |
| 2nd Quartile (Median/Q2) | 203.00 | 567.00 | 164.50 | 275.00 | 138.00 | 207.00 | 90.00 | 157.50 |
| 3rd Quartile (Q3) | 465.00 | 1413.00 | 341.00 | 585.00 | 252.50 | 467.00 | 162.00 | 350.50 |
| Maximum | 49687 | 23616 | 14504 | 8893 | 2278 | 4385 | 670 | 3579 |
| Sum | 314999 | 923346 | 106493 | 310851 | 39171 | 180319 | 9849 | 109693 |
| Sum of Squares | 7331392315 | 4270535476 | 385131109 | 497033091 | 20589599 | 181770151 | 2409373 | 79736419 |
| 95% Confidence Interval (CI) for Mean | 569.96 <mean< 1816.39 | 1105.64 <mean< 1403.45 | 300.28 <mean< 609.92 | 440.62 <mean< 557.29 | 179.43 <mean< 255.80 | 331.19 <mean< 418.58 | 97.10 <mean< 152.24 | 232.29 <mean< 300.20 |
| 95% CI for Standard Deviation (SD) | 4738.21 <SD< 5623.18 | 1957.70 <SD< 2168.59 | 1102.11 <SD< 1322.07 | 702.43 <SD< 785.068 | 235.29 <SD< 289.62 | 458.71 <SD< 520.64 | 106.42 <SD< 145.95 | 328.22 <SD< 376.37 |
| 95% CI for Variance (VAR) | 22450646.38 <VAR< 31620150.75 | 3832602.75 <VAR< 4702800.75 | 1214650.28 <VAR< 1747872.29 | 493405.84 <VAR< 616331.16 | 55360. 57 <VAR< 83877. 39 |
210415.88 <VAR< 271069.52 | 11326. 08 <VAR< 21301. 28 |
107727.85 <VAR< 141653.17 |
Note: OA = Open Access; SB = subscription-based. * Three records were omitted due to the limit of 1,000 results per query imposed by Scopus.
Table 4.
Documents published (2020–2023) for journals by Scopus quartile.
| STATISTIC | Q1 OA | Q1 SB | Q2 OA | Q2 SB | Q3 OA | Q3 SB | Q4 OA | Q4 SB |
| Sample Size (n) | 264 | 736* | 234 | 623 | 180 | 481 | 79 | 412 |
| Mean | 78.03 | 81.50 | 66.97 | 68.04 | 51.75 | 50.82 | 28.75 | 27.98 |
| Midrange | 65 | 61.5 | 56 | 56.5 | 46 | 52 | 28.5 | 31.5 |
| Root Mean Square (RMS) | 78.72 | 82.08 | 67.92 | 69.24 | 53.53 | 52.17 | 32.37 | 31.36 |
| Variance (s²) | 108.35 | 94.36 | 129.23 | 164.56 | 188.07 | 139.68 | 224.09 | 200.90 |
| Standard Deviation (s) | 10.41 | 9.71 | 11.37 | 12.83 | 13.71 | 11.82 | 14.97 | 14.17 |
| Mean Absolute Deviation | 7.65 | 6.70 | 8.25 | 8.97 | 10.24 | 8.68 | 12.63 | 11.76 |
| Range | 68.00 | 77.00 | 72.00 | 87.00 | 70.00 | 89.00 | 57.00 | 63.00 |
| Coefficient of Variation (%) | 13.34 | 11.92 | 16.97 | 18.85 | 26.50 | 23.26 | 52.07 | 50.66 |
| Minimum | 31 | 23 | 20 | 13 | 11 | 8 | 0 | 0 |
| 1st Quartile (Q1) | 73.00 | 78.00 | 62.00 | 64.00 | 45.00 | 45.00 | 13.00 | 19.00 |
| 2nd Quartile (Median/Q2) | 79.00 | 83.00 | 68.00 | 71.00 | 54.00 | 52.00 | 33.00 | 30.00 |
| 3rd Quartile (Q3) | 85.00 | 87.00 | 74.00 | 76.00 | 61.00 | 58.00 | 40.00 | 39.00 |
| Maximum | 99 | 100 | 92 | 100 | 81 | 97 | 57 | 63 |
| Sum | 20599 | 59985 | 15671 | 42390 | 9315 | 24444 | 2271 | 11528 |
| Sum of Squares | 1635763 | 4958215 | 1079599 | 2986646 | 515715 | 1309270 | 82763 | 405132 |
| 95% Confidence Interval (CI) for Mean | 76.77 <mean< 79.29 | 80.80 <mean< 82.20 | 65.51 <mean< 68.43 | 67.03 <mean< 69.05 | 49.73 <mean< 53.77 | 49.76 <mean< 51.88 | 25.39 <mean< 32.10 | 26.61 <mean< 29.35 |
| 95% CI for Standard Deviation (SD) | 9.59 <SD< 11.38 | 9.24 <SD< 10.24 | 10.42 <SD< 12.50 | 12.15 <SD< 13.58 | 12.43 <SD< 15.298 | 11.12 <SD< 12.62 | 12.94 <SD< 17.75 | 13.27 <SD< 15.21 |
| 95% CI for Variance (VAR) | 91.97 <VAR< 129.54 | 85.41 <VAR< 104.80 | 108.64 <VAR< 156.33 | 147.70 <VAR< 184.50 | 154.46 <VAR< 234.03 | 123.57 <VAR< 159.19 | 167.56 <VAR< 315.13 | 176.04 <VAR< 231.47 |
Note: OA = Open Access; SB = subscription-based. * The value 736 reflects the records available in the Scopus database. The correct number is 739, because three records were not displayed.
Table 5.
Percentage of cited articles (2020–2023) for journals by Scopus quartile.
| STATISTIC | Show only titles in the top 10 percent of OA | Show only titles in the top 10 percent of SB |
| Sample Size (n) | 126 | 360 |
| Mean | 12.03 | 13.43 |
| Midrange | 22.00 | 40.75 |
| Root Mean Square (RMS) | 13.33 | 16.24 |
| Variance (s²) | 33.27 | 83.71 |
| Standard Deviation (s) | 5.76 | 9.15 |
| Mean Absolute Deviation | 4.18 | 5.76 |
| Range | 40.80 | 78.90 |
| Coefficient of Variation (%) | 47.95 | 68.12 |
| Minimum | 1.6 | 1.3 |
| 1st Quartile (Q1) | 8.60 | 8.70 |
| 2nd Quartile (Median/Q2) | 10.80 | 11.20 |
| 3rd Quartile (Q3) | 14.30 | 15.95 |
| Maximum | 42.4 | 80.2 |
| Sum | 1515.80 | 4835.40 |
| Sum of Squares | 22394.50 | 94999.84 |
| 95% Confidence Interval (CI) for Mean | 11.01 <mean< 13.05 | 12.48 <mean< 14.38 |
| 95% CI for Standard Deviation (SD) | 5.13 <SD< 6.58 | 8.53 <SD< 9.87 |
| 95% CI for Variance (VAR) | 26.35 <VAR< 43.35 | 72.70 <VAR< 97.45 |
Note: OA = Open Access; SB = subscription-based.
Disclaimer/Publisher’s Note: The statements, opinions and data contained in all publications are solely those of the individual author(s) and contributor(s) and not of MDPI and/or the editor(s). MDPI and/or the editor(s) disclaim responsibility for any injury to people or property resulting from any ideas, methods, instructions or products referred to in the content. |
© 2025 by the authors. Licensee MDPI, Basel, Switzerland. This article is an open access article distributed under the terms and conditions of the Creative Commons Attribution (CC BY) license (http://creativecommons.org/licenses/by/4.0/).
Copyright: This open access article is published under a Creative Commons CC BY 4.0 license, which permit the free download, distribution, and reuse, provided that the author and preprint are cited in any reuse.


