Preprint
Article

This version is not peer-reviewed.

DC and AC Conductivity of CoFe2O4/BaTiO3 Bilayers Deposited Over Nb-Doped SrTiO3(100) Substrates

Submitted:

03 December 2025

Posted:

05 December 2025

You are already at the latest version

Abstract

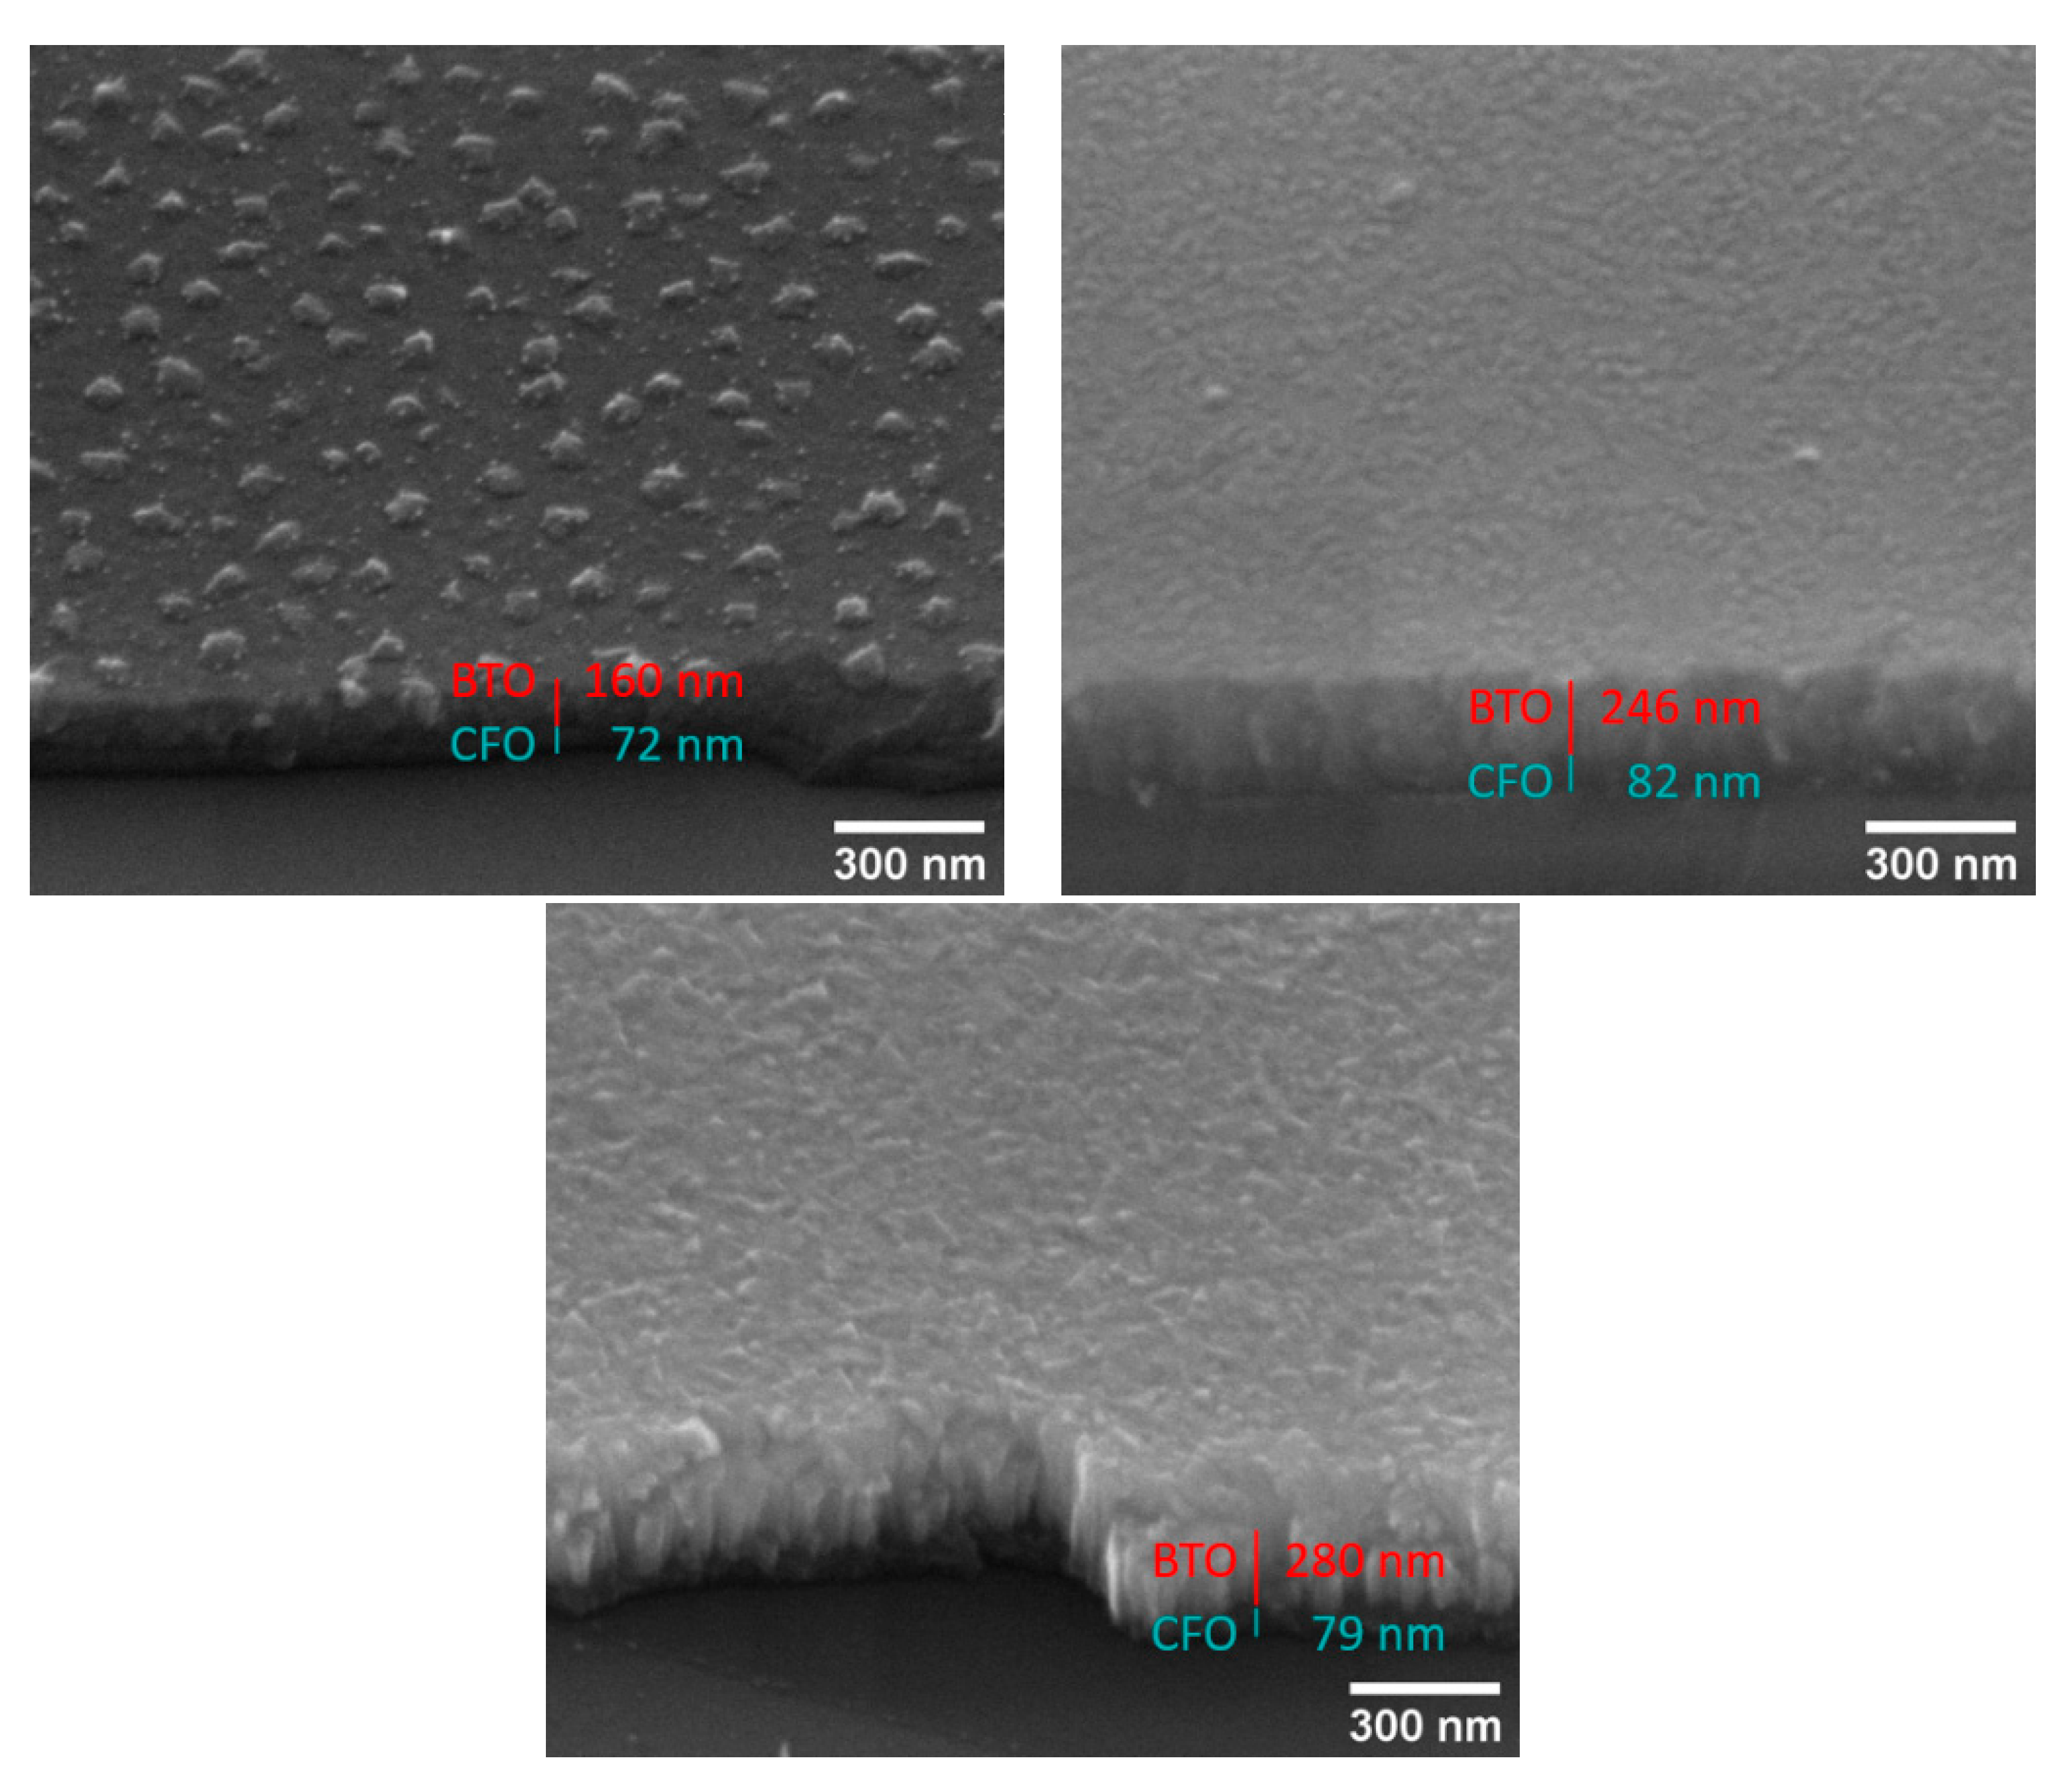
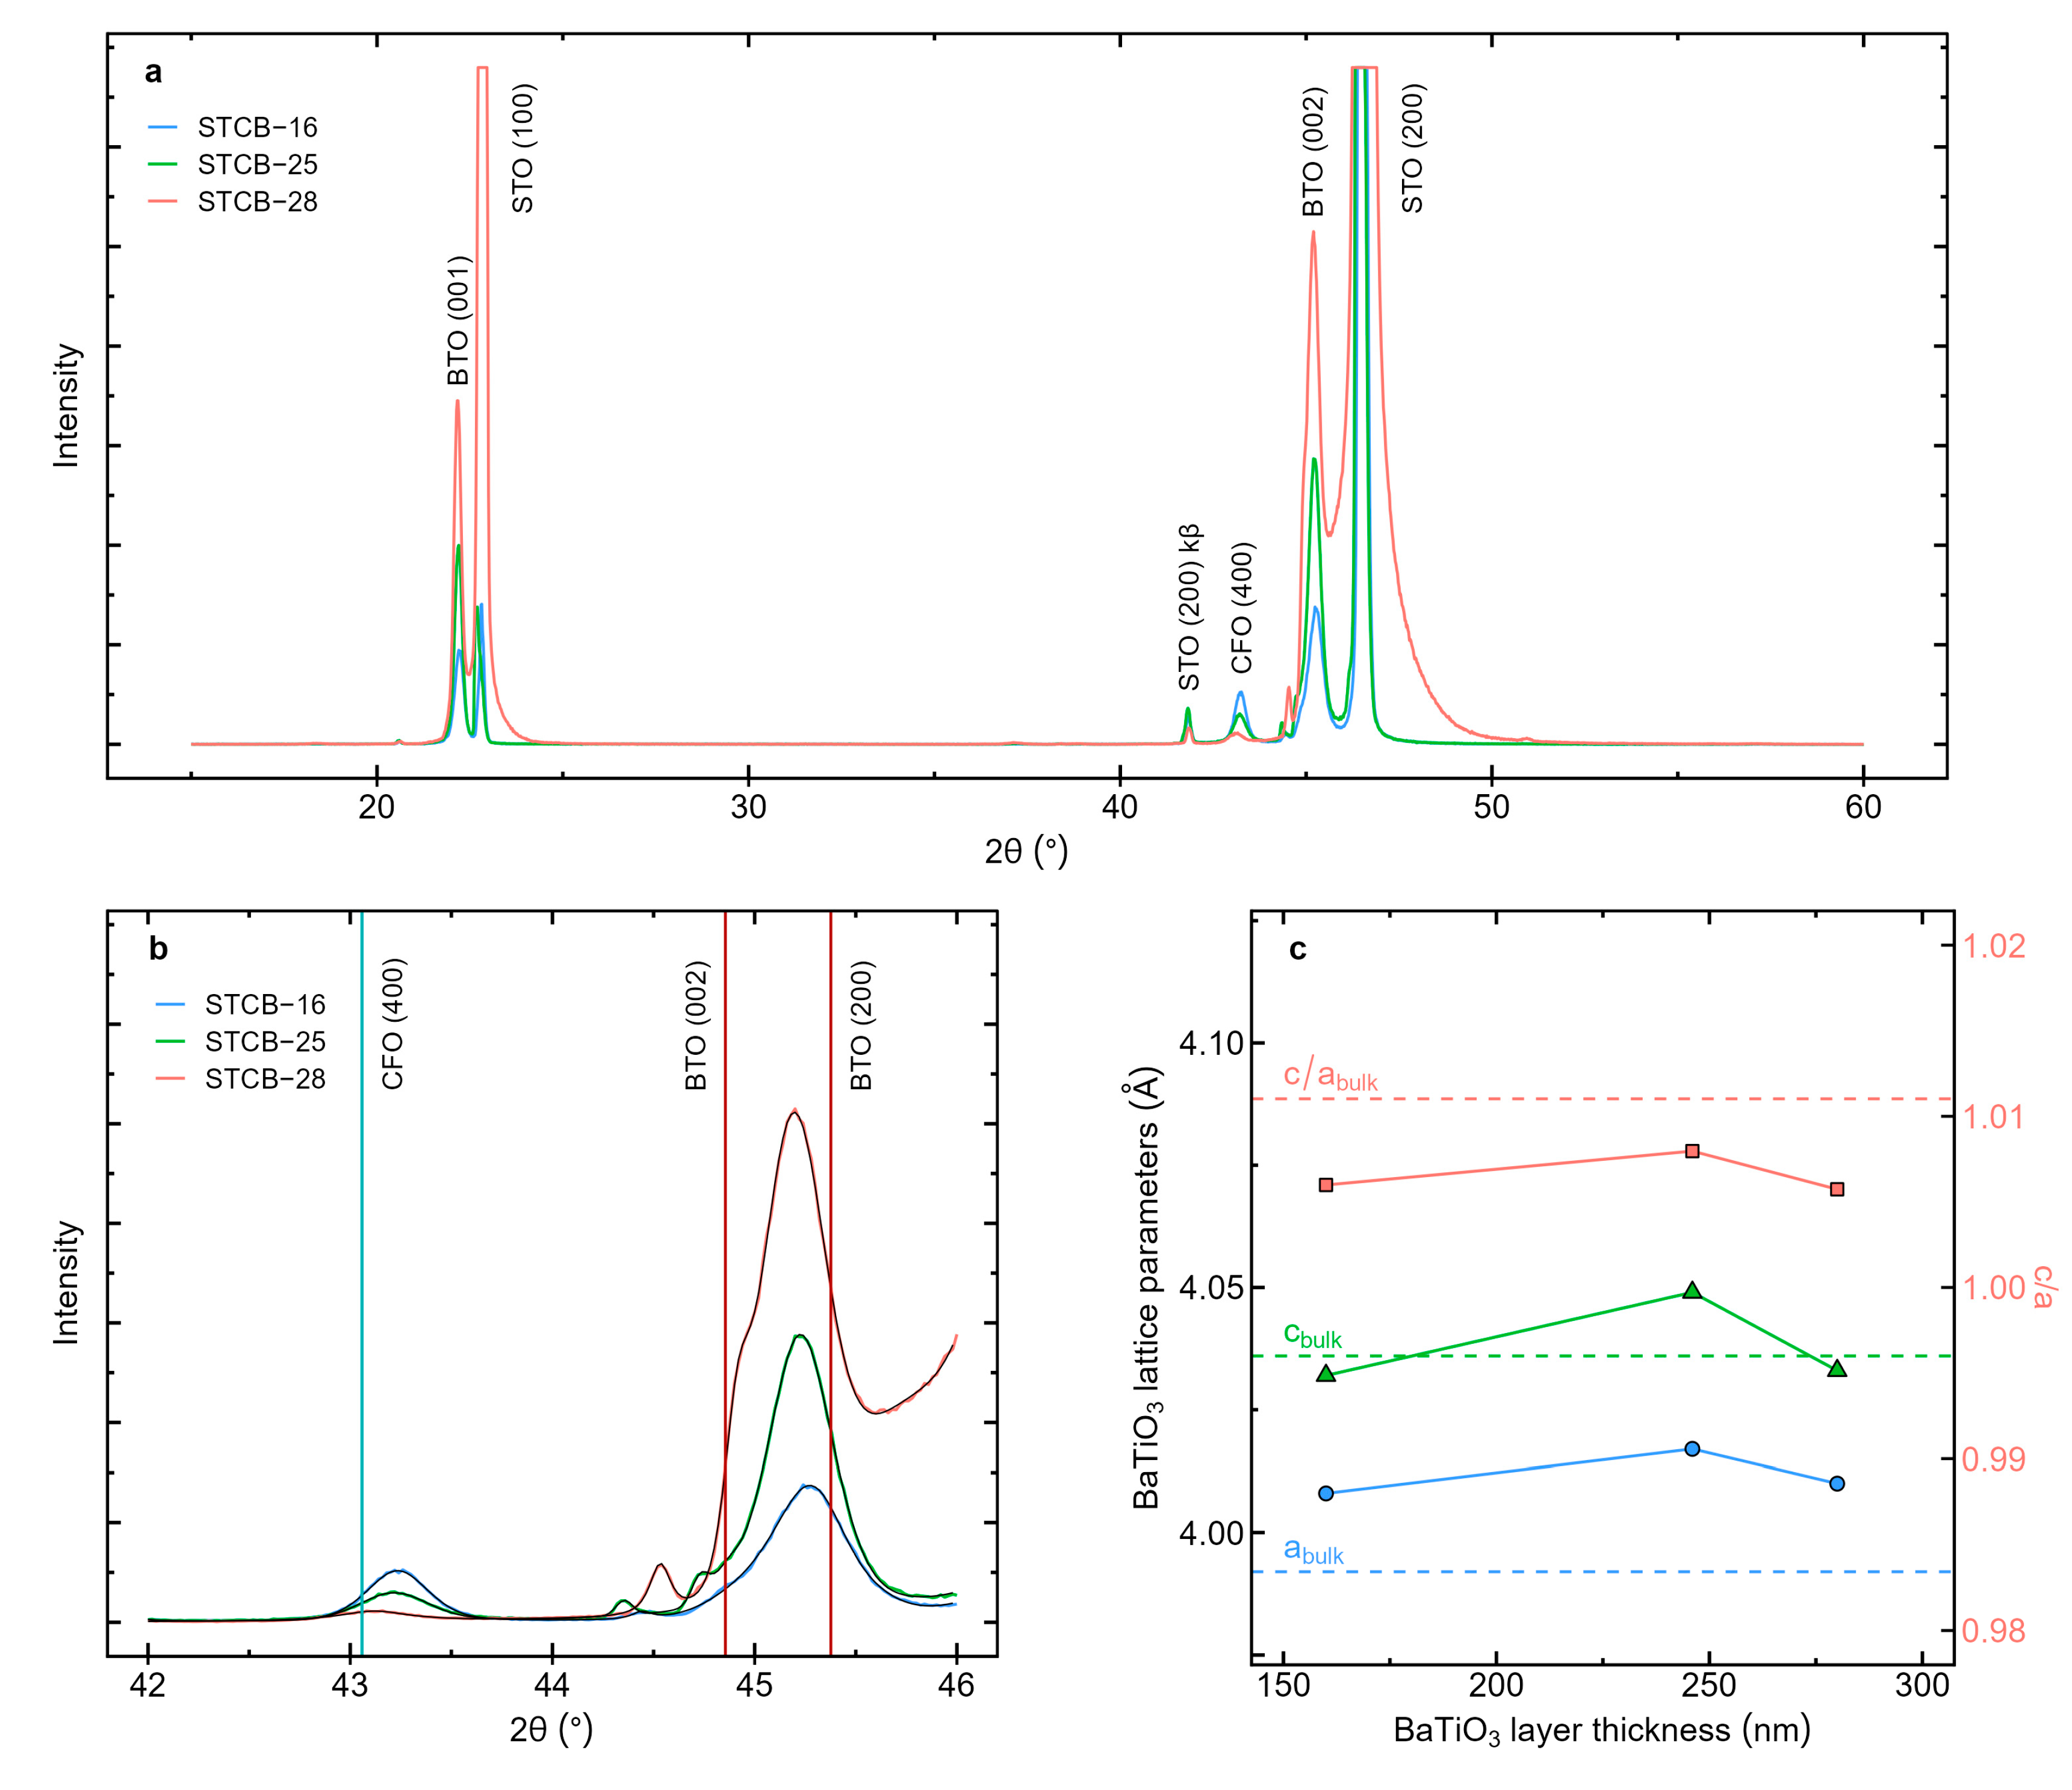
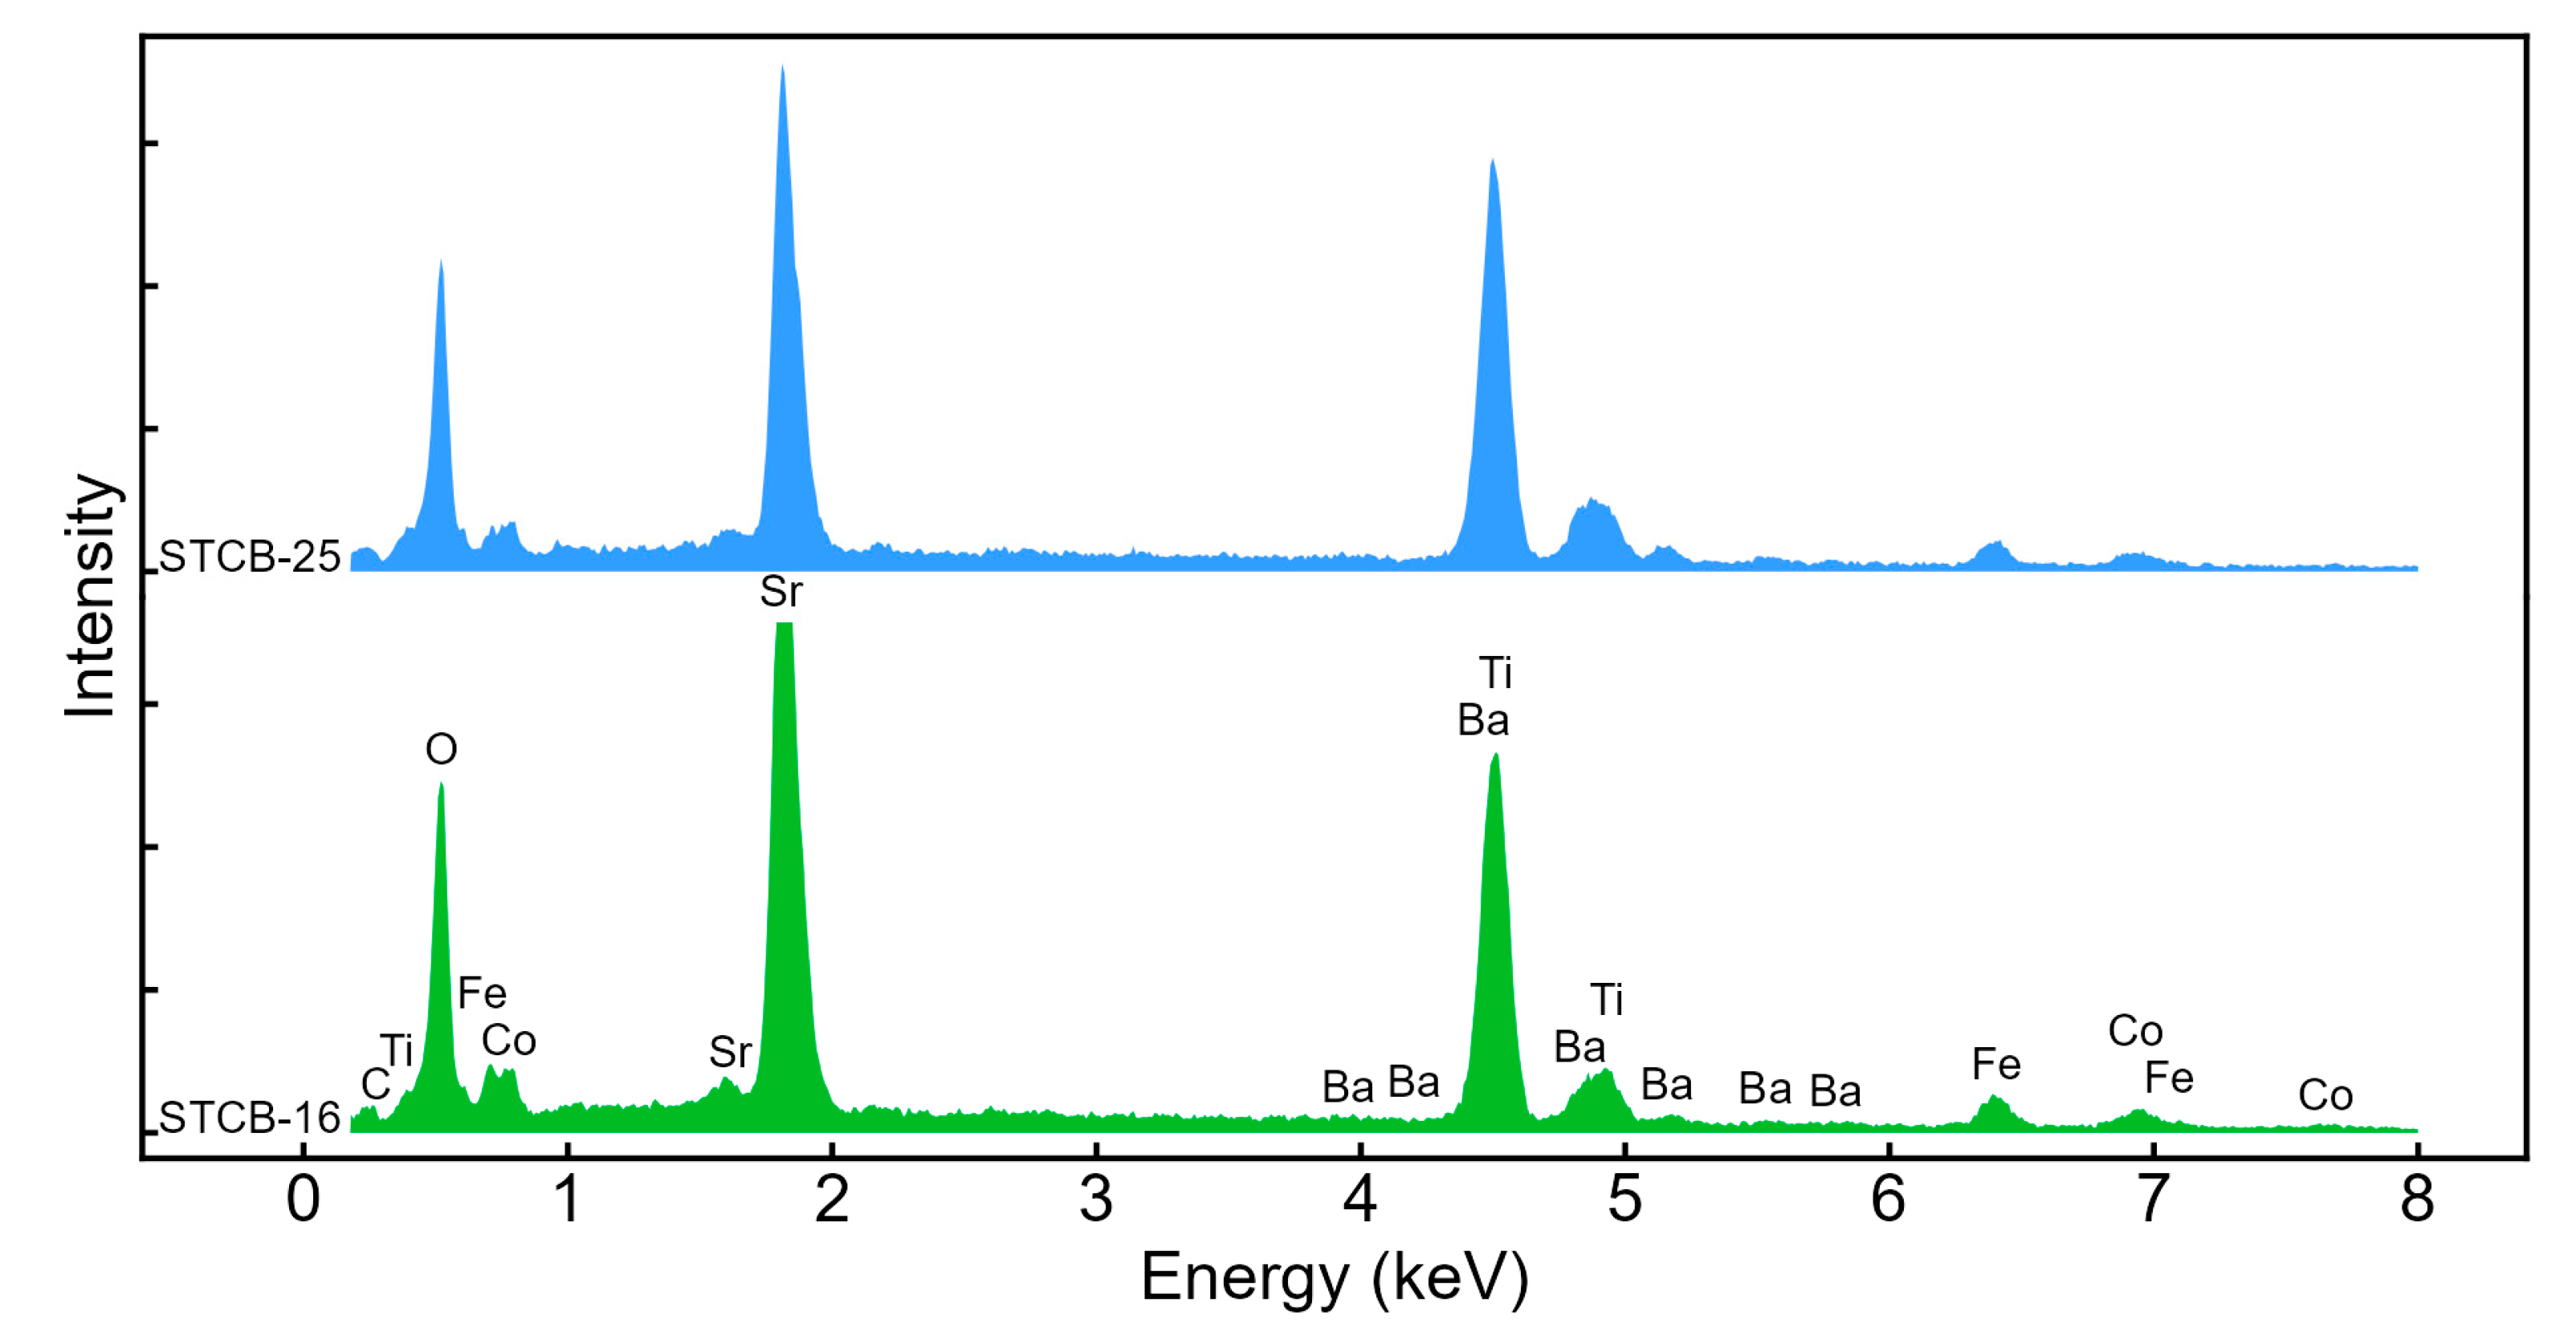
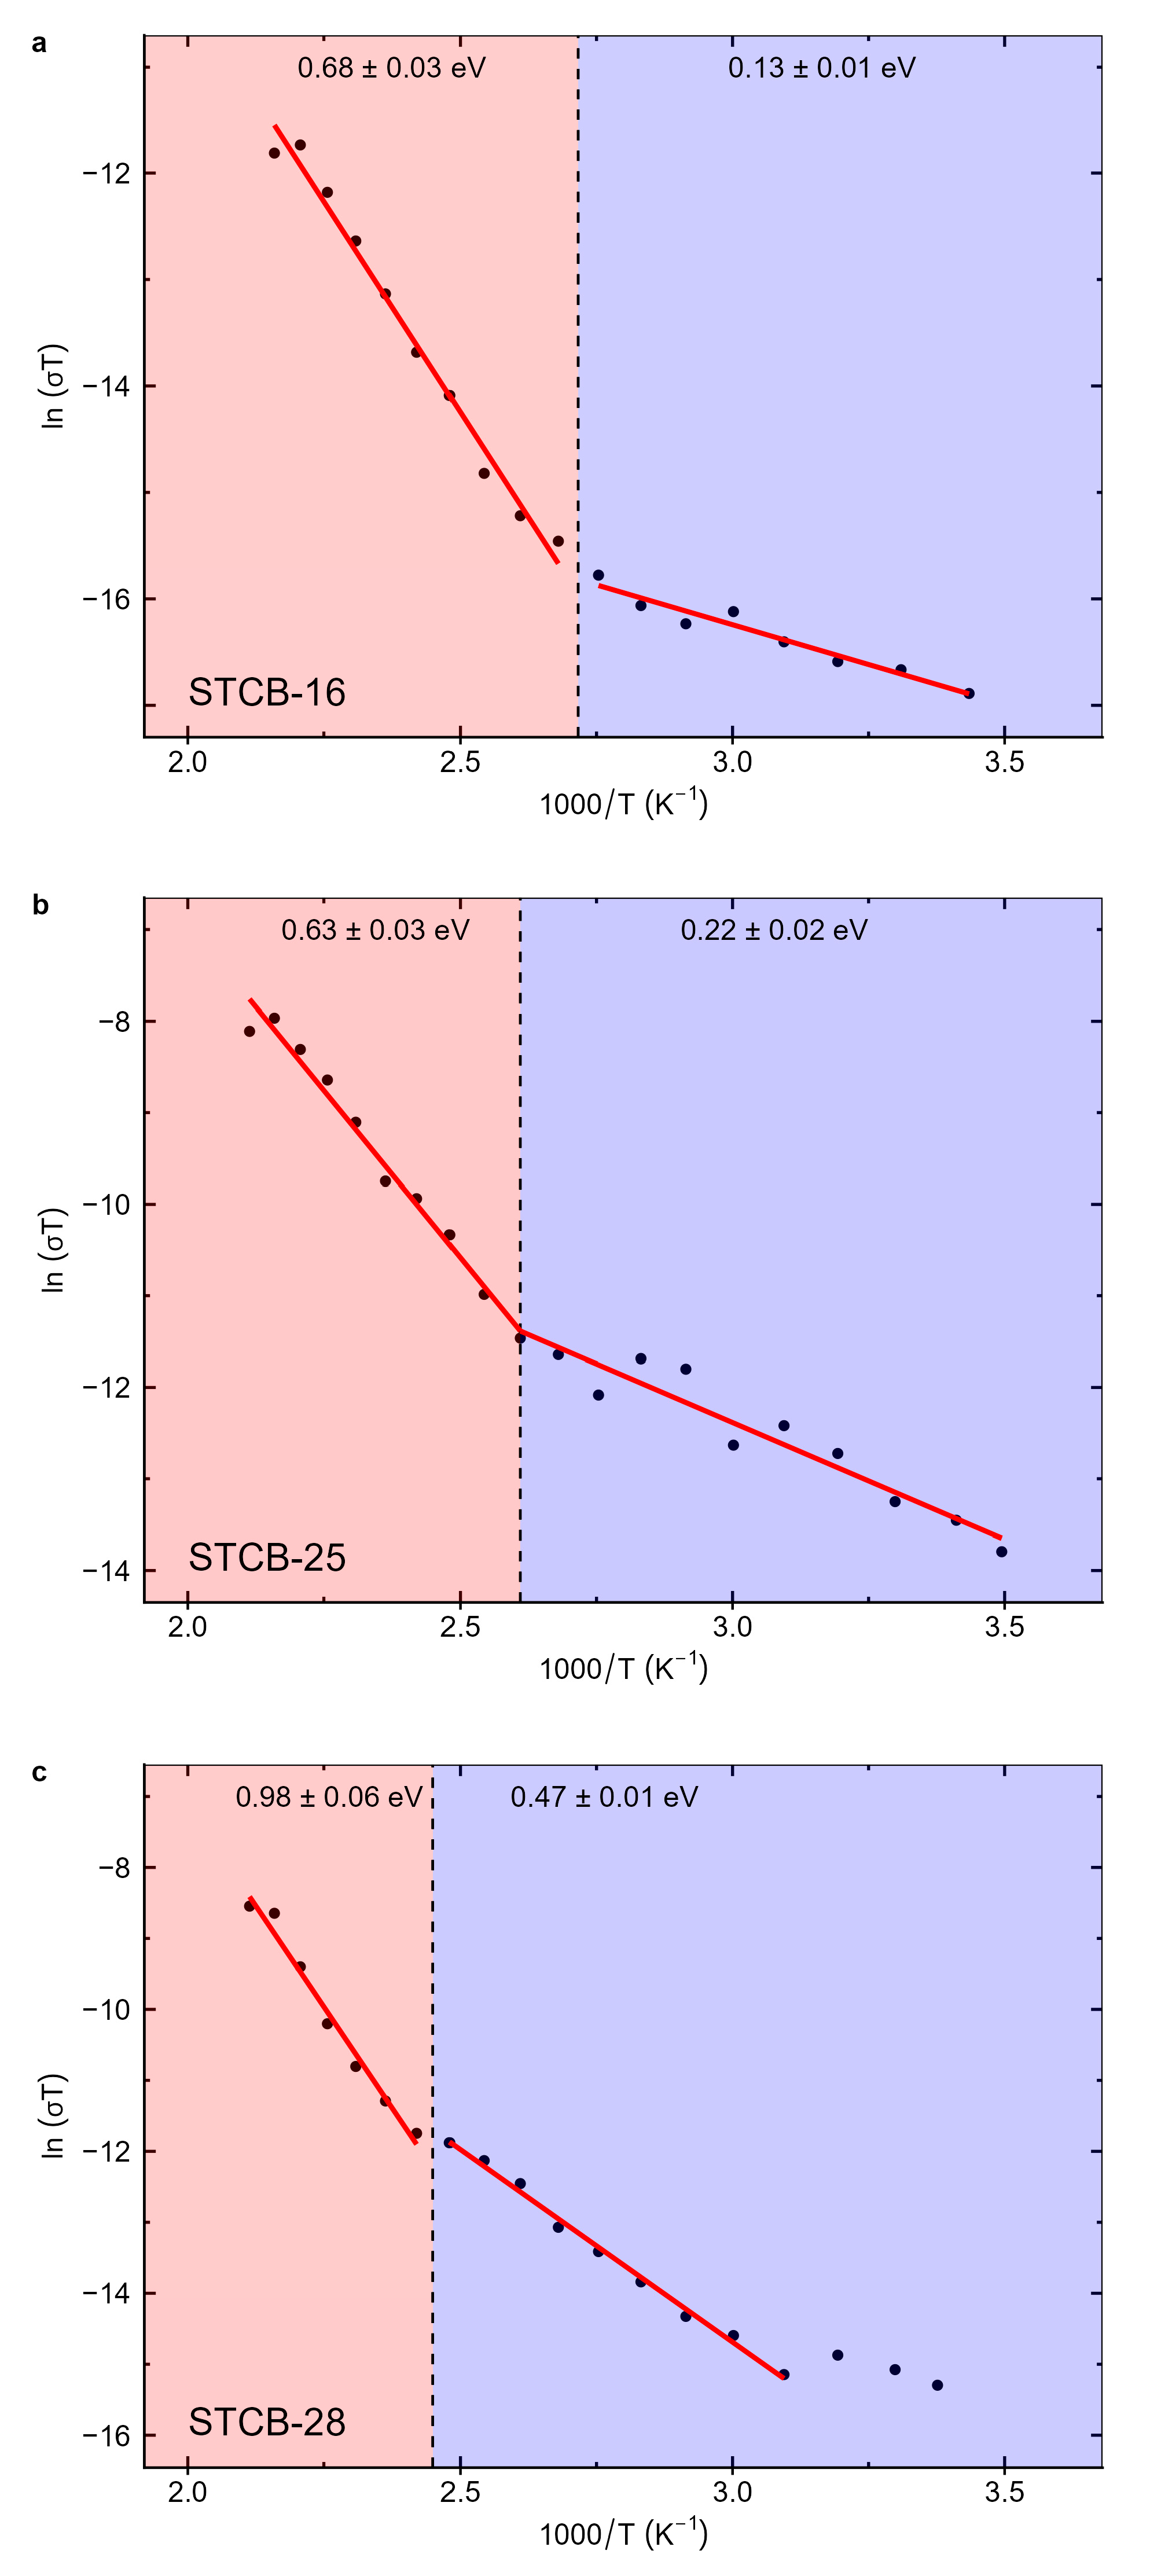
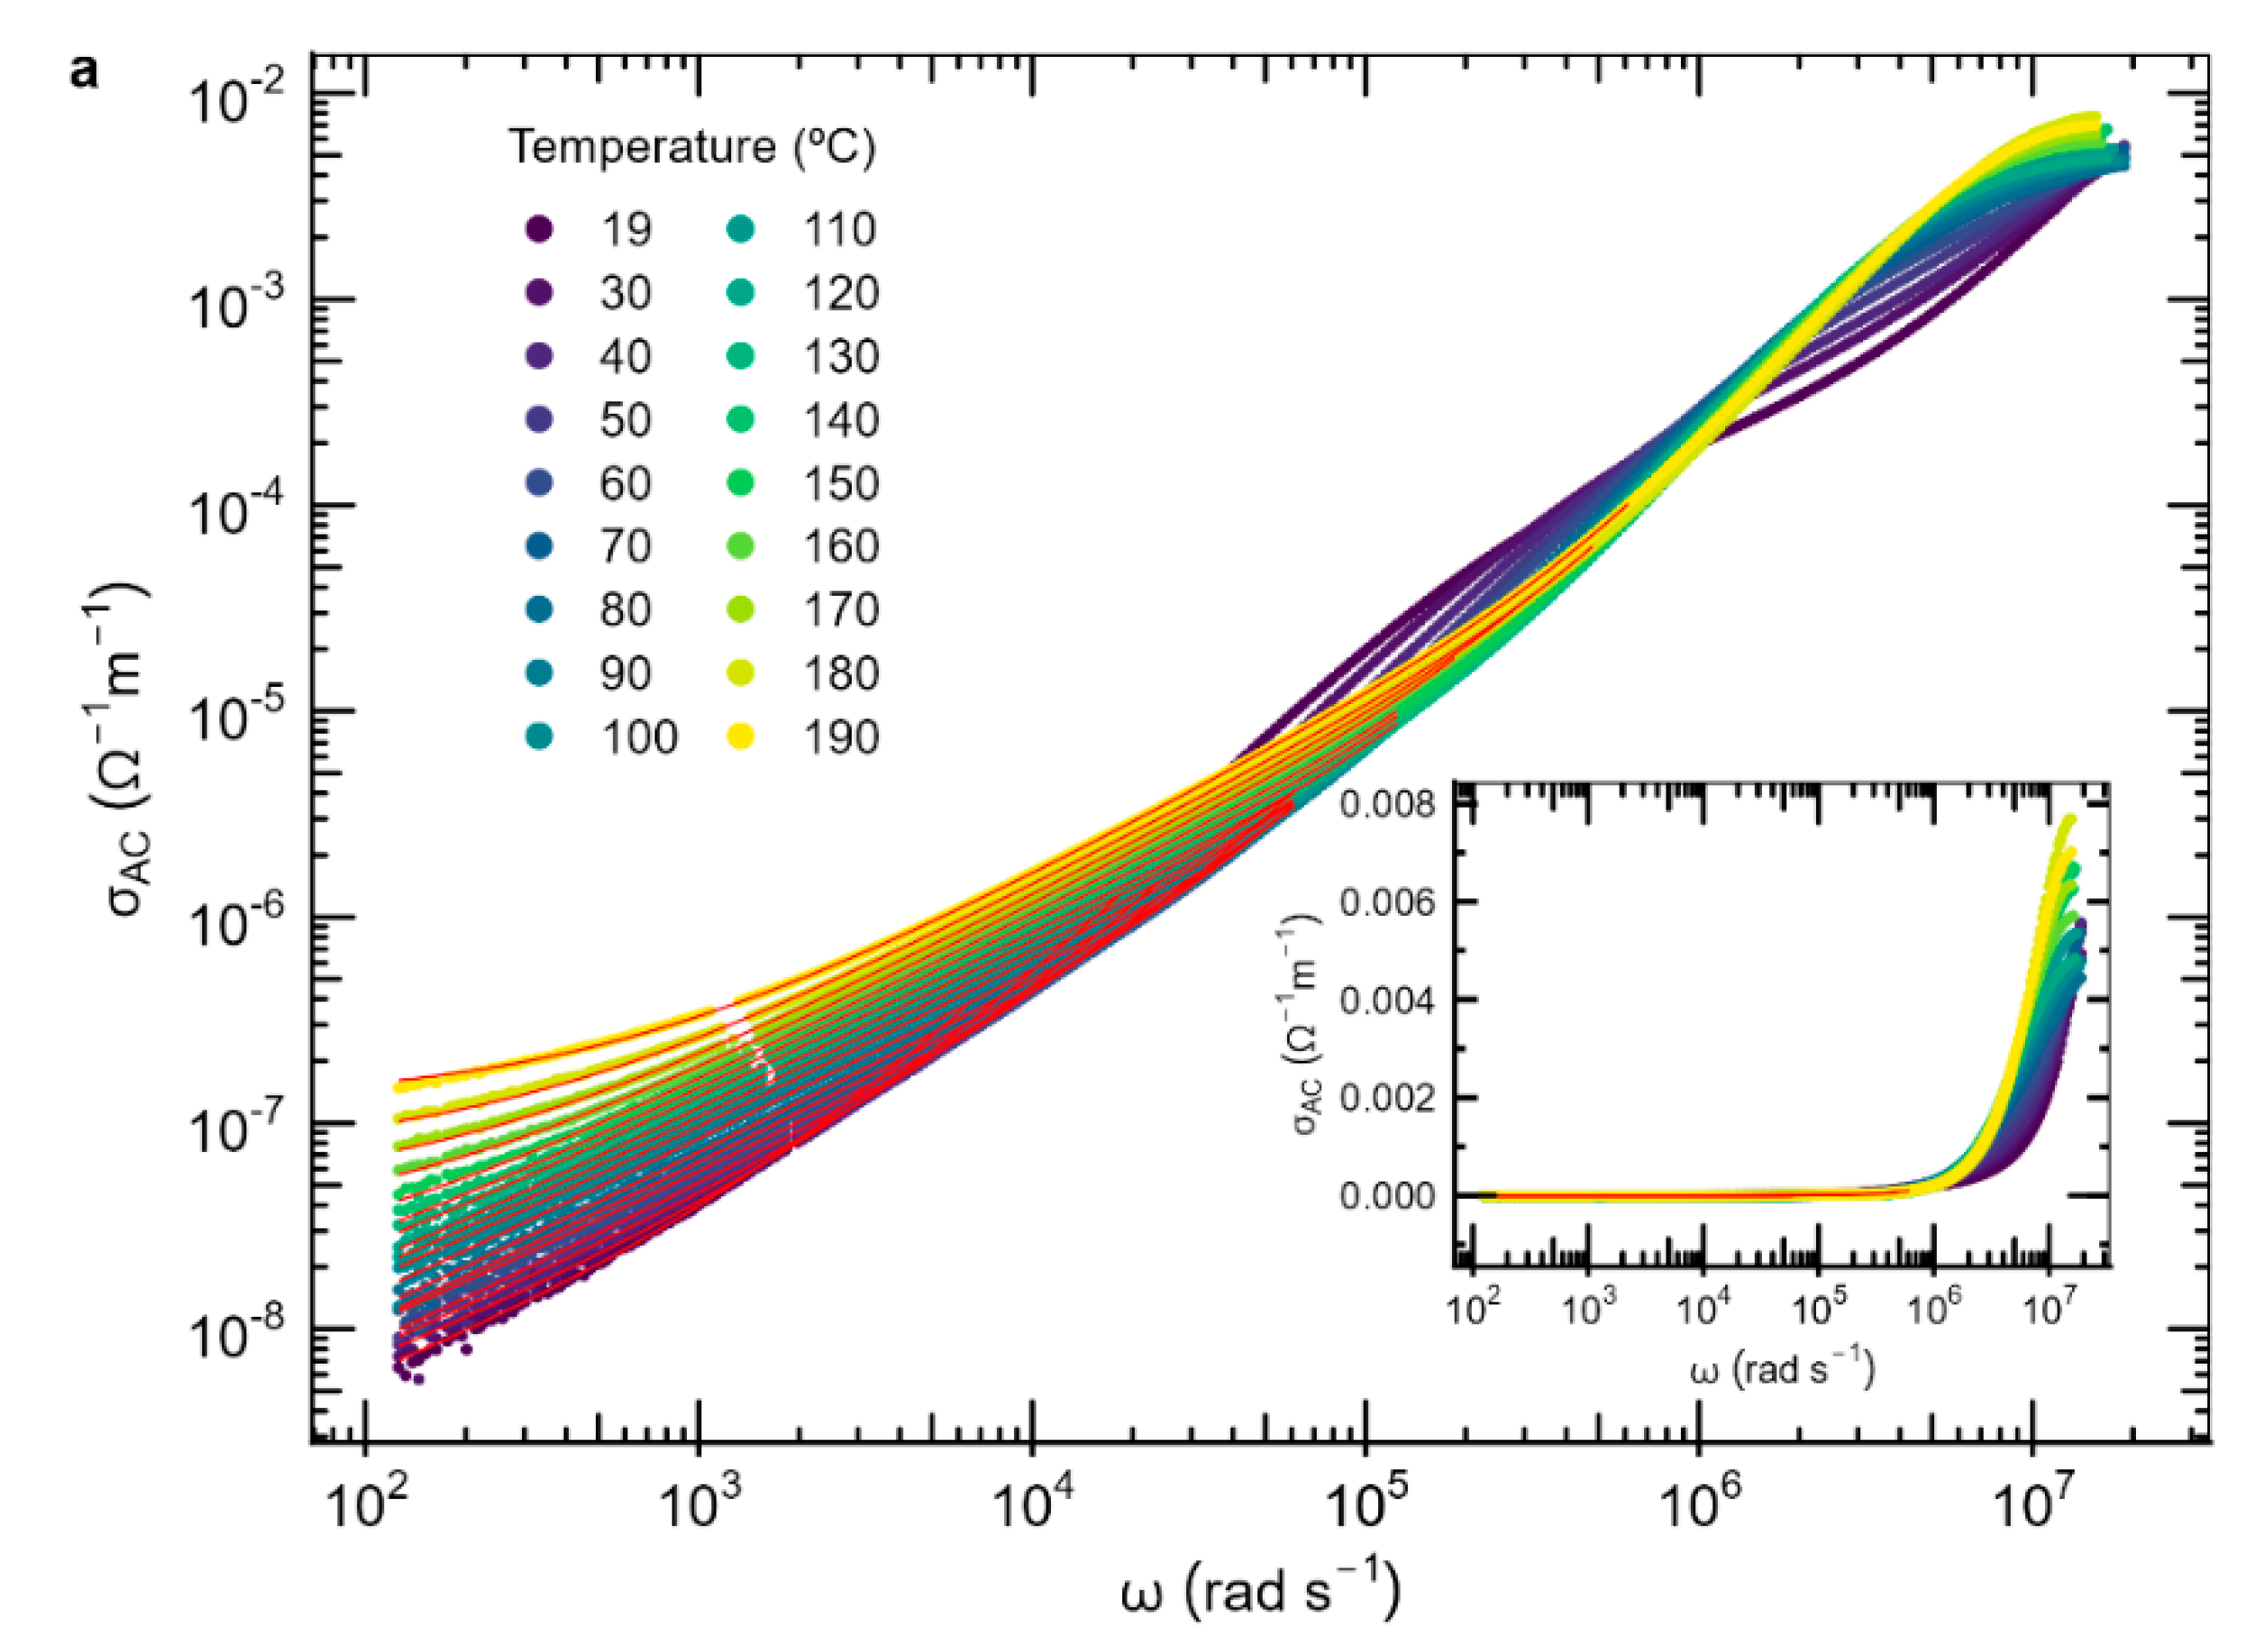
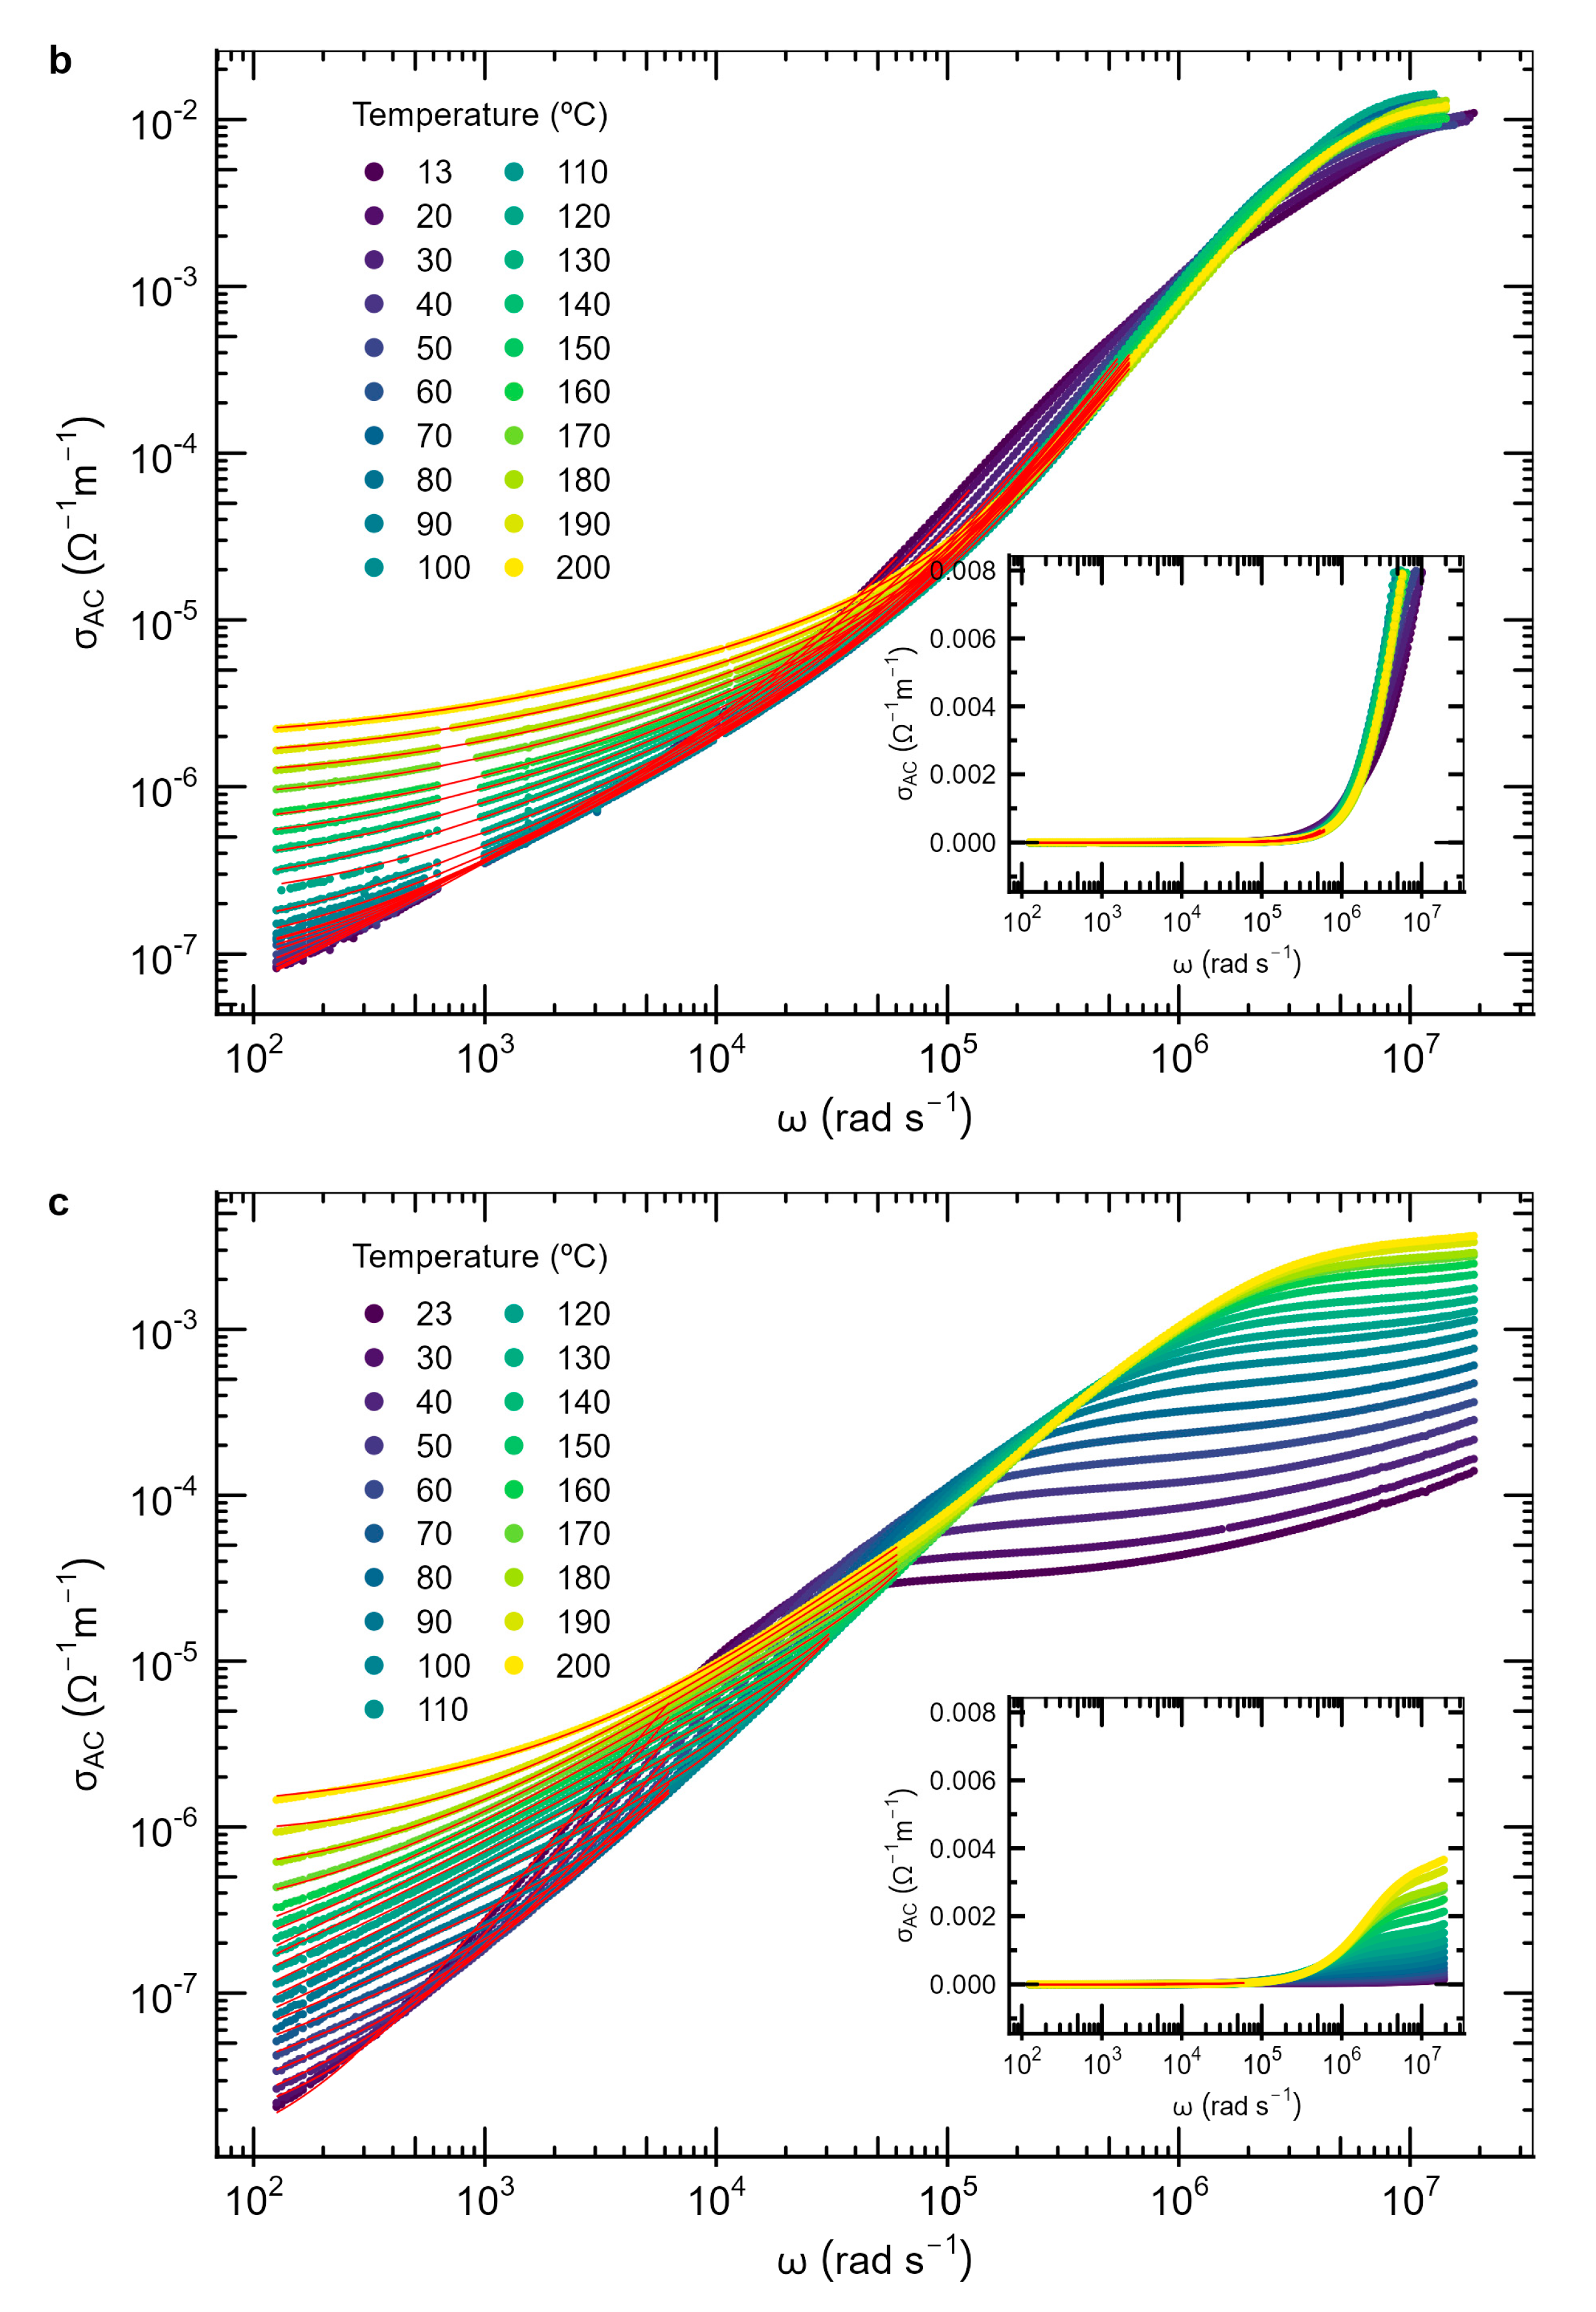
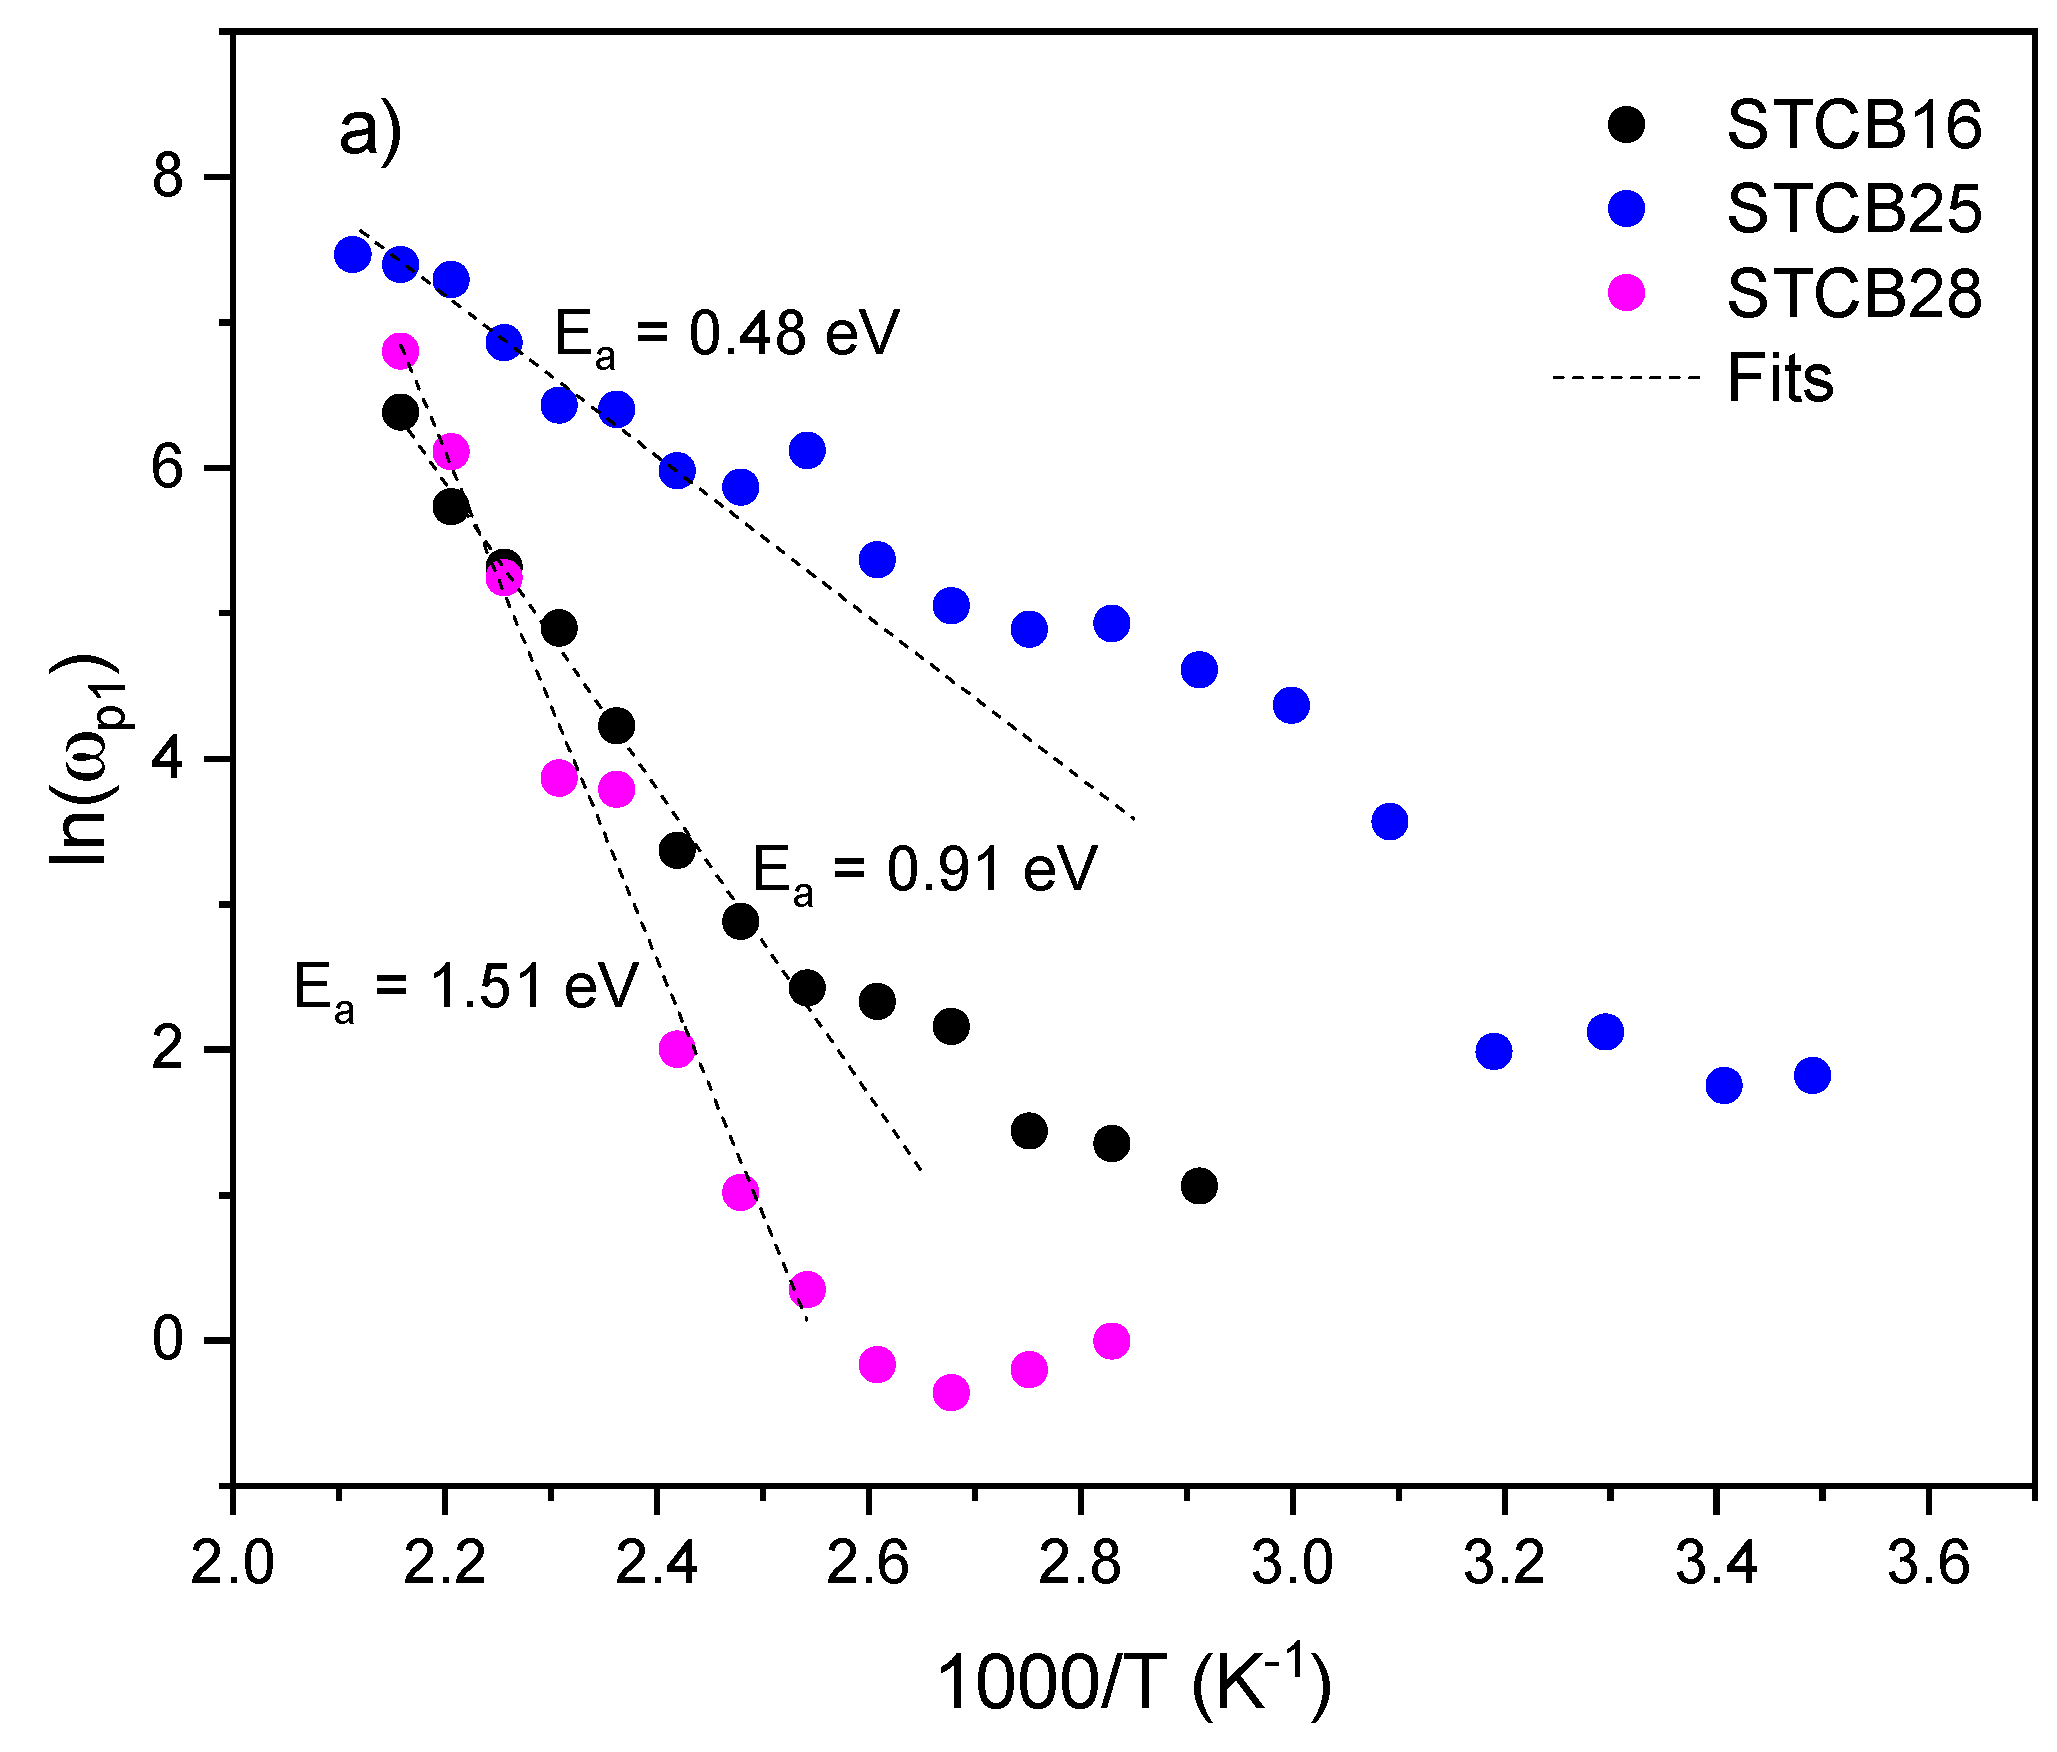
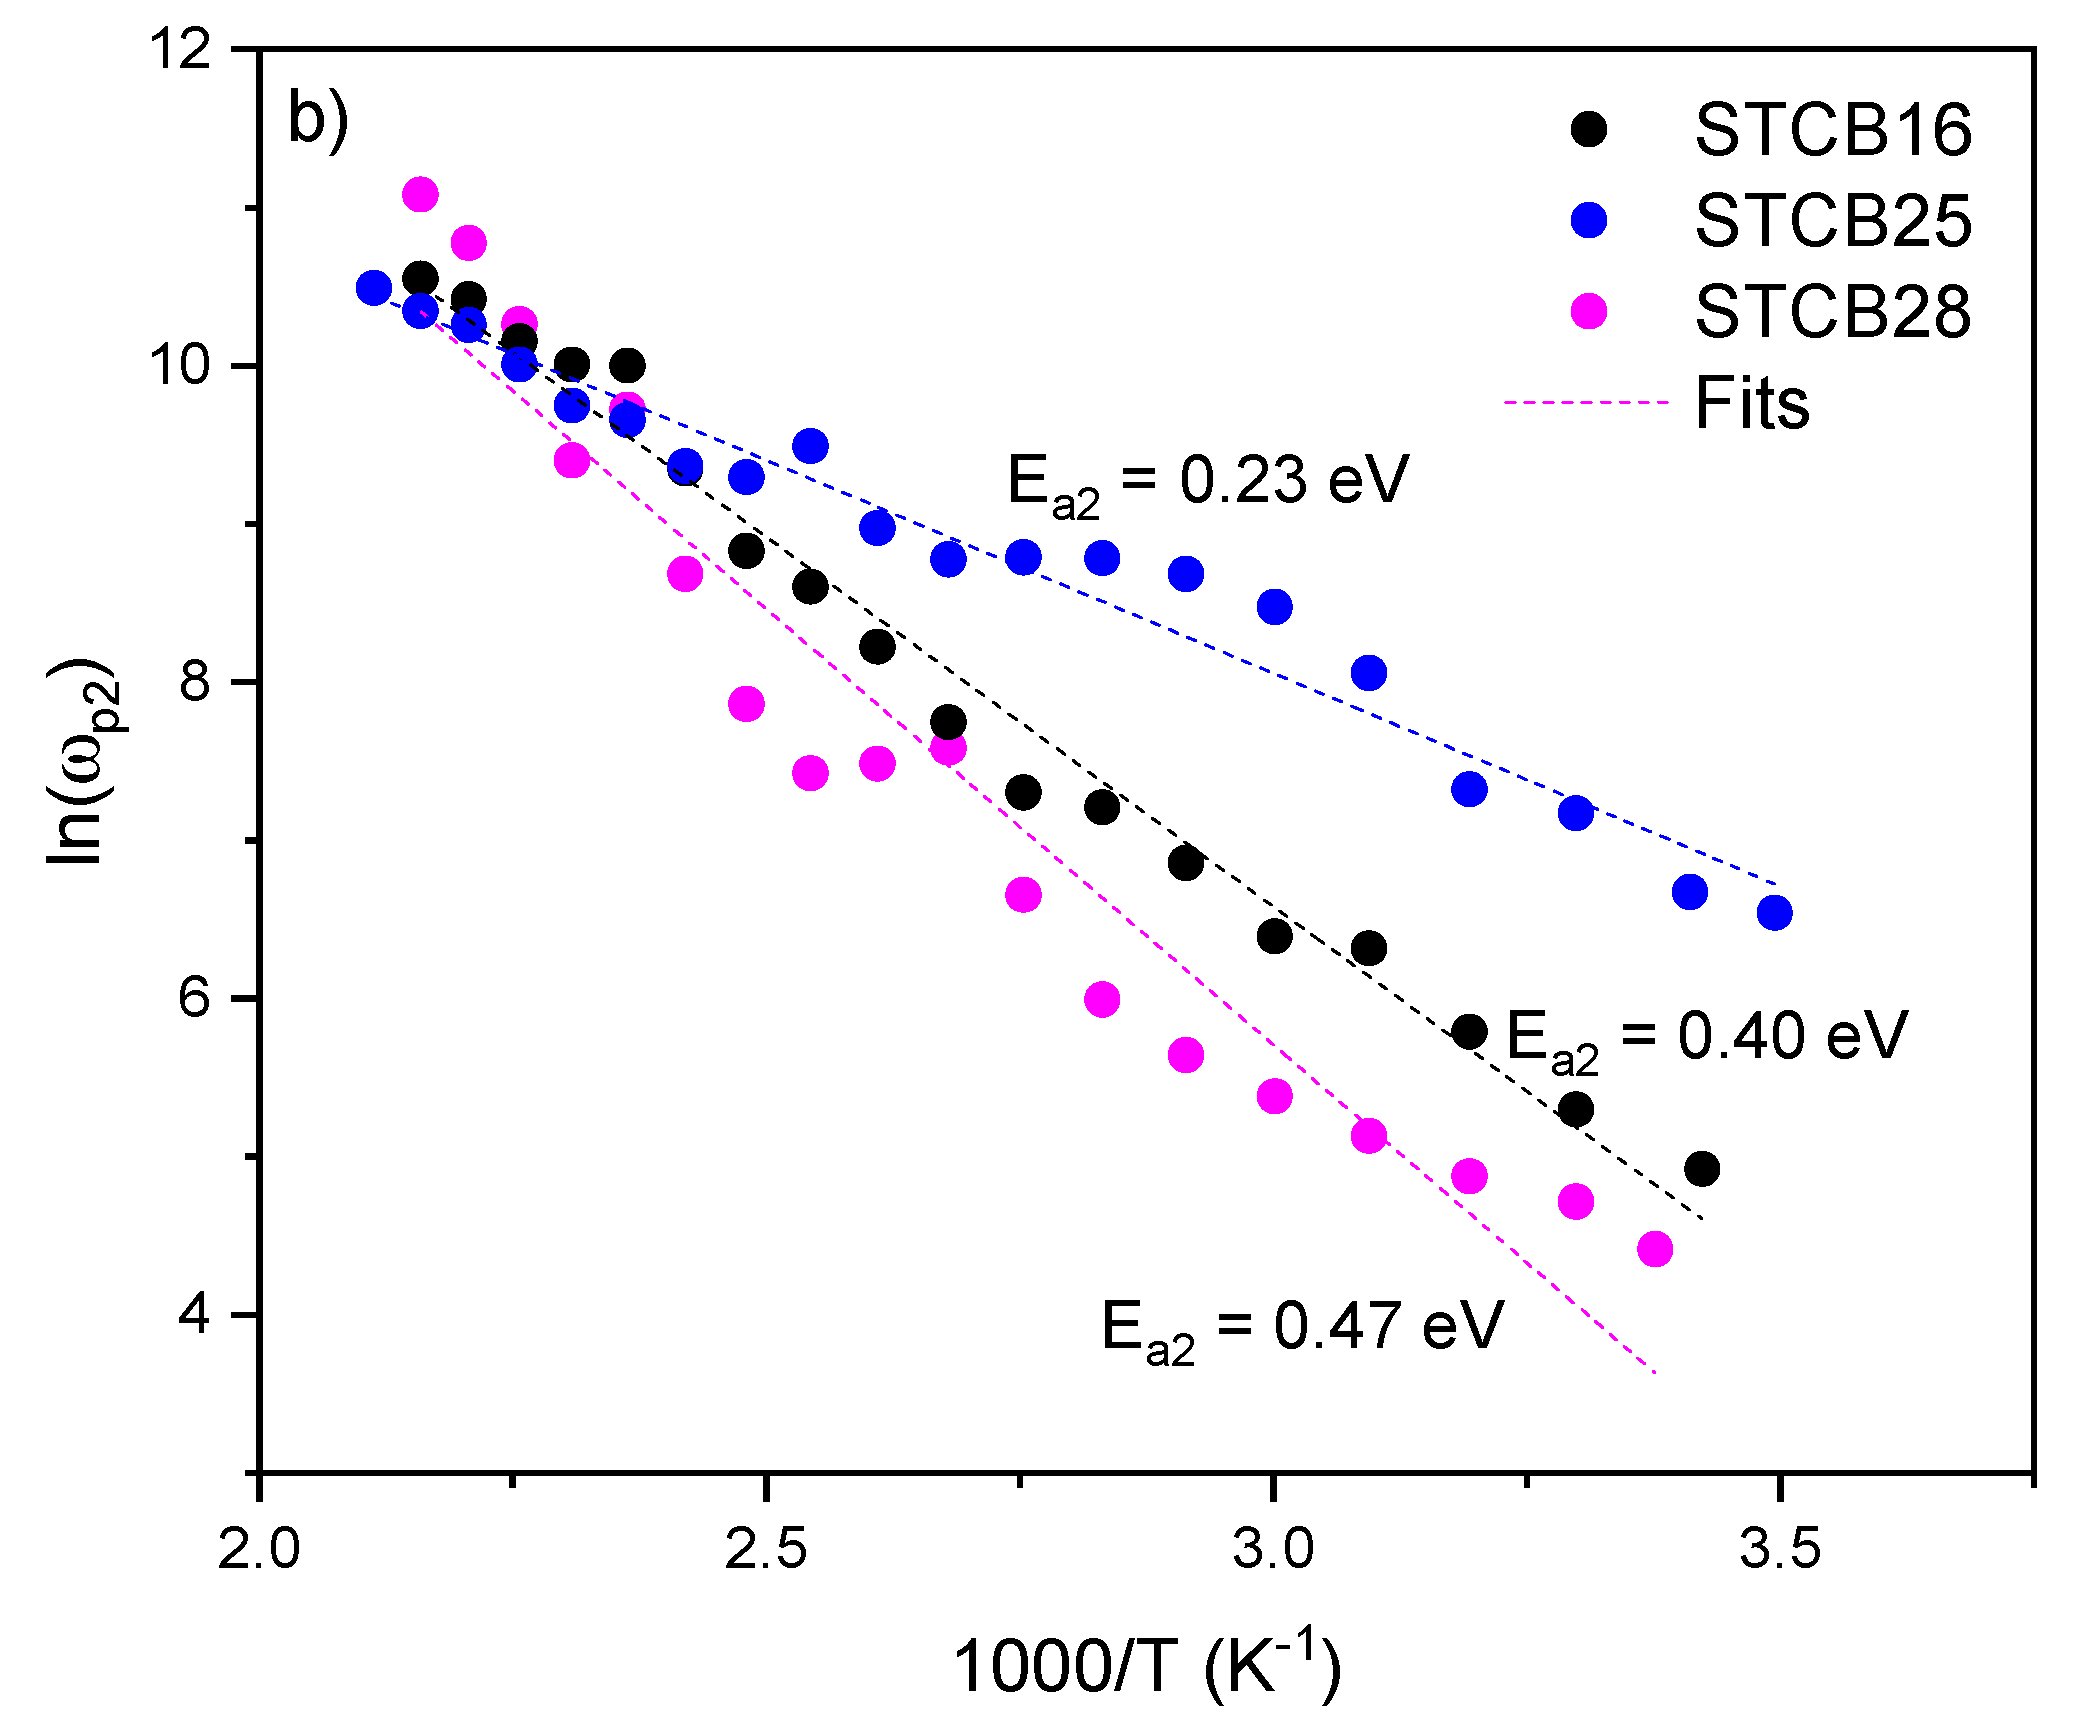
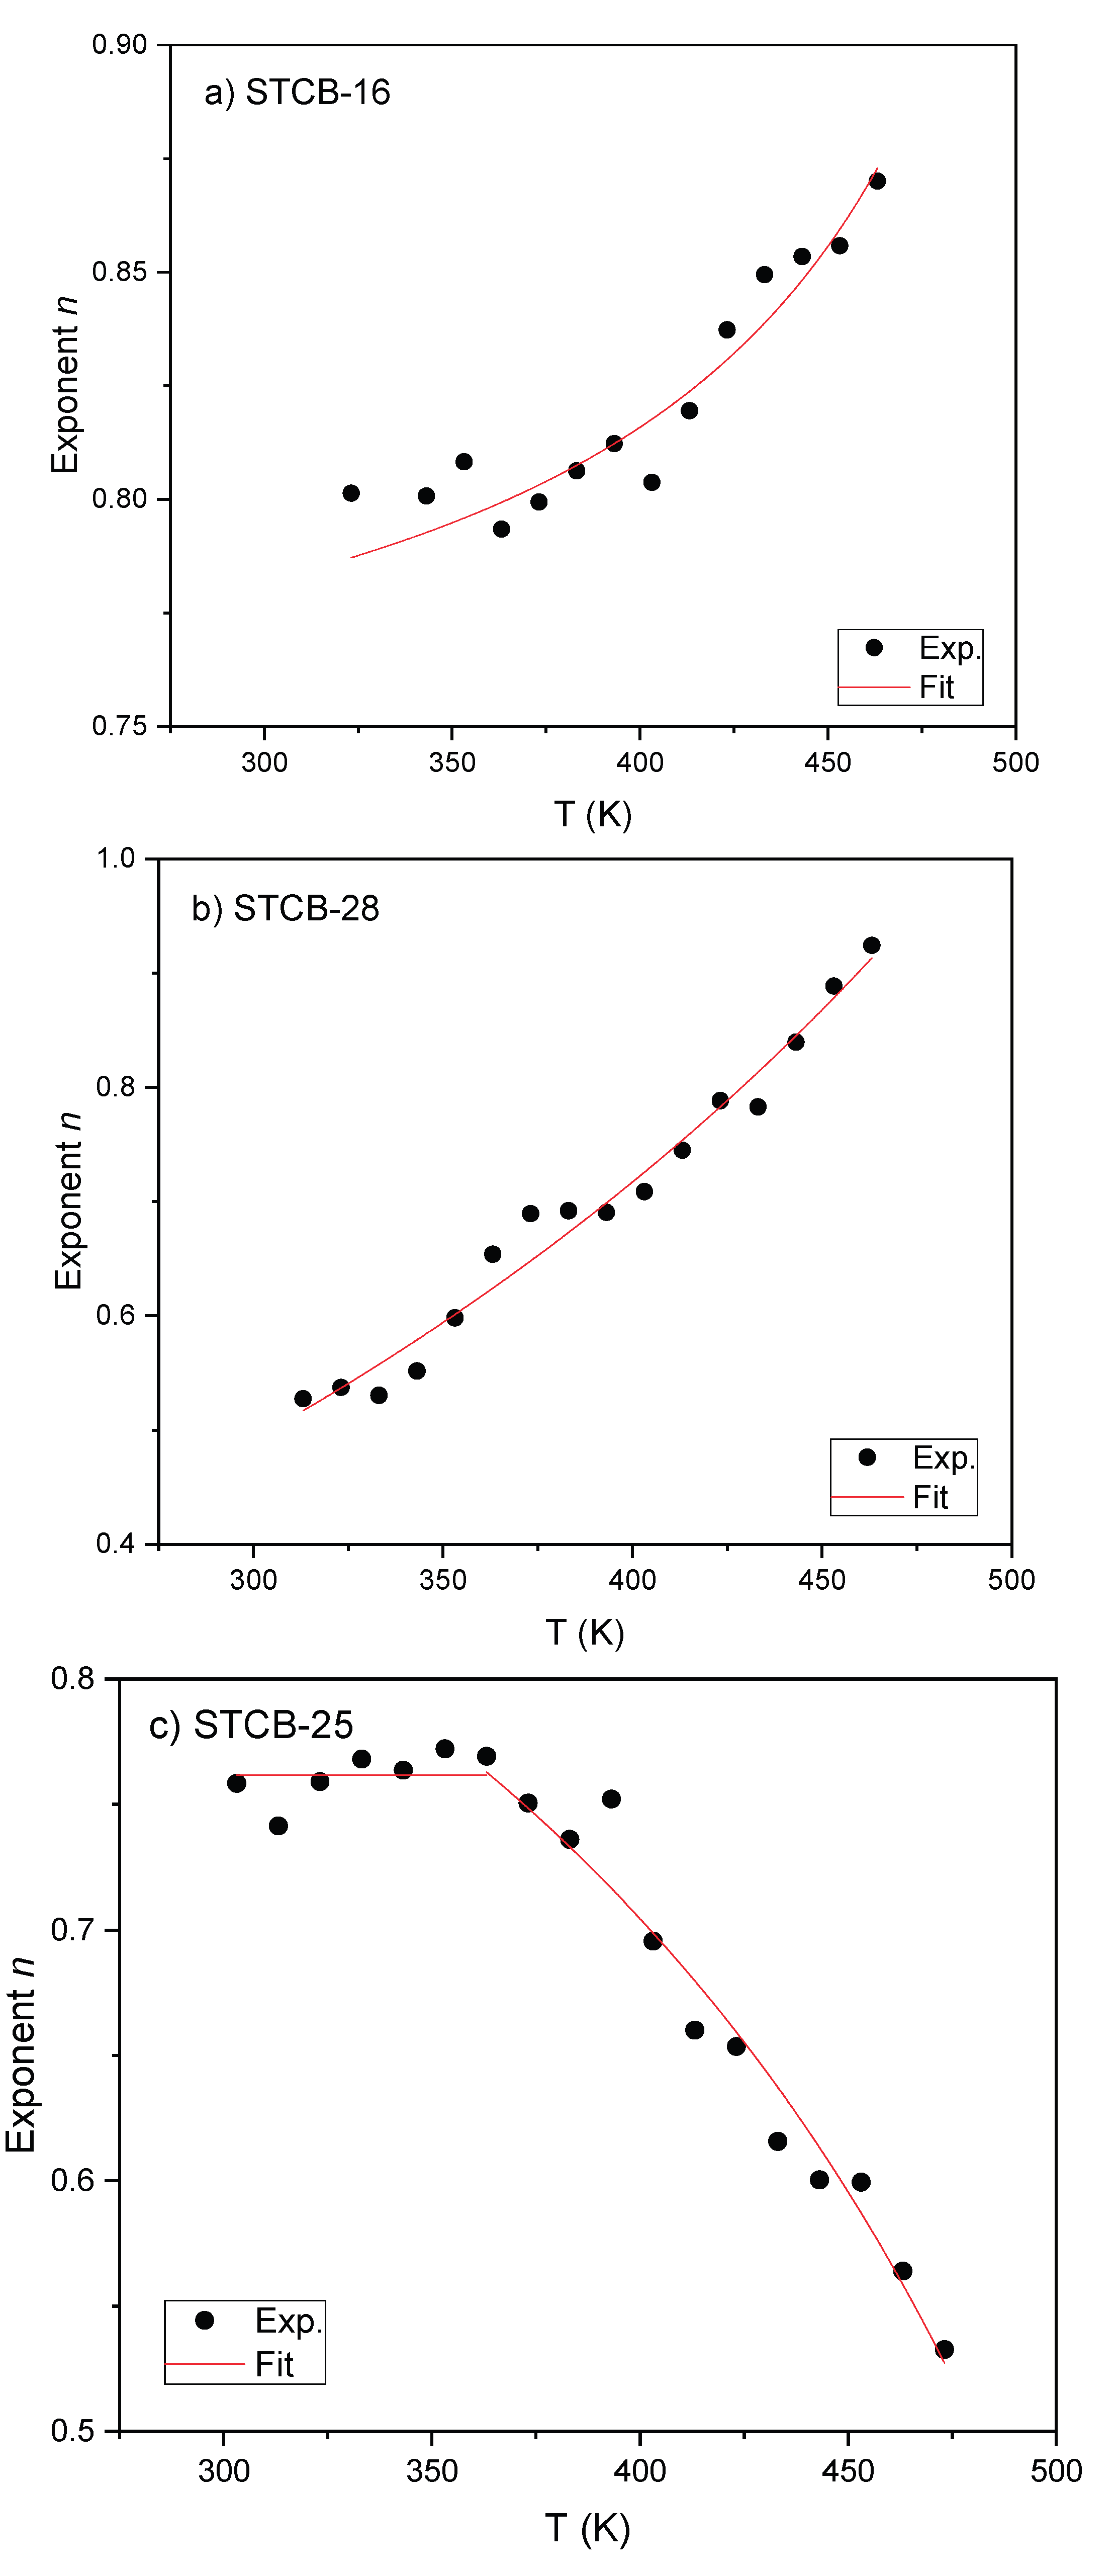
Multiferroic BaTiO3 (BTO, piezoelectric)/CoFe2O4 (CFO, magnetostrictive) bilayer thin films were prepared by laser ablation on conductive Nb-doped SrTiO3 (100) substrates to investigate the influence of BTO layer thickness on their structural, microstructural, dielectric, and electrical (DC and AC) properties. X-ray diffraction confirmed the coexistence of the cubic spinel CoFe2O4 phase and the tetragonal ferroelectric BaTiO3 phase. The films exhibit preferred orientation, with CFO showing the [400] direction along the growth axis and BTO displaying (100)/(001) planes stacked parallel to it. The CFO unit cell is compressed along the growth direction, while BTO presents the ferroelectric distortion with a tetragonality ratio (c/a) slightly below, but close to, the bulk value. Second harmonic generation studies further verified the non-centrosymmetric ferroelectric nature of BTO at room temperature. The temperature-dependent dielectric permittivity was modeled using the Havriliak–Negami function with an additional conductivity term to extract relaxation dynamics, DC conductivity, Curie temperature (Tc), and activation energies. The Curie temperature increases with BTO thickness, approaching the bulk value for thicker layers. DC conductivity activation energies exhibit a change at Tc, from below 0.5 eV for T < Tc to above 0.5 eV for T > Tc, consistent with small-polaron tunneling. The AC conductivity follows a Jonscher-type frequency dependence with two power-law contributions reflecting the behavior of both layers. Temperature-dependent analysis of the power-law exponents reveals that small-polaron tunneling dominates conduction in BTO, while ion hopping between octahedral sites governs conduction in CFO. Underoxidation leads to a more complex transport regime in BTO, showing a transition from quantum-mechanical tunneling below Tc to correlated barrier hopping above it. By revealing how transport processes operate within multiferroic oriented bilayer systems, these findings advance our understanding of material interactions and pave the way for the design of innovative multifunctional platforms optimized for spintronic technologies.

Keywords: 
;  ;  ;  ;  ;  ;  ;  

1. Introduction

Magnetoelectric (ME) multiferroic materials, which present simultaneous magnetic and electric ordering, have been the subject of much scientific and technological interest [1,2]. They have shown to be promising candidates for applications in the fields of information storage, sensors, actuators, and low-power energy-efficient electronics [3,4,5,6,7]. However, in single-phase multiferroics, the microscopic mechanisms underlying ME coupling have been challenging to unravel, hindering the development of strong ME responses at useful temperatures [2]. Artificial multiferroic composites [1,8,9] have offered an appealing alternative, in which the ME coupling can be engineered by properly choosing the interface geometry and constituent materials. For this purpose, several approaches to achieve ME coupling have been proposed, including strain-mediated [1,3,8], magnetic exchange interactions [9], and charge carrier density [9]. Of these mechanisms, strain-coupled layered nanostructures, containing ferromagnets (magnetostrictive) and ferroelectrics (piezoelectrics), are particularly attractive [2,3,4,9,10]. In these nanocomposite multiferroics, a ferroelectric with strong piezoelectricity is combined with a high magnetostriction ferromagnet. The exhibited strong ME coupling arises from the mechanical interaction between the two phases, with the electric, magnetic, and elastic fields all coupled together [1].
Despite significant progress in understanding multiferroics, one crucial aspect has remained relatively understudied—their dynamic properties [11,12,13,14,15]. The influence of strain on the dynamical behavior of multiferroics, in particular, remains largely unexplored. For instance, it remains an open question whether magnetoelectric coefficients can be optimized through coupling with mechanical resonances [16]. This underscores the necessity for comprehensive frequency-dependent investigations, such as those employing impedance spectroscopy [14,15]. Broadband frequency-dependent complex impedance spectroscopy is a powerful technique that can distinguish the intrinsic dielectric signal from the extrinsic ones (defects (such as oxygen vacancies), grain boundaries, conductivity, and/or electrode contacts). A detailed quantitative analysis using impedance/dielectric spectroscopy can separate the leakage, inhomogeneity, and parasitic capacitance effects, shedding light on the intrinsic interlayer interaction mechanisms underlying the behavior of composite multiferroic nanostructures, including their magnetocapacitance.
BaTiO3–Co2FeO4 composite multiferroic materials represent a prototypical system for studying multiferroics. BaTiO3 (BTO) is a well-known perovskite oxide, with a Curie temperature of 130 °C [17] and strong ferroelectric polarization and piezoelectric response at room temperature [18,19]. Co2FeO4 is a cubic spinel ferrite, displaying robust magnetostrictive and ferrimagnetic properties [20]. Composite BaTiO3 – CoFe2O4 systems have been produced mainly in bulk form [21,22,23], but also in thin films [24,25,26]. However, most investigations into their dielectric and impedance characteristics have concentrated on bulk materials, leaving the dynamic electrical and dielectric behavior at the nanoscale—in nanostructured bilayer or multilayer thin films—largely unexplored. Moreover, previous studies in thin films have primarily used mixtures of CoFe2O4 in a BaTiO3 matrix [24] and/or polycrystalline samples [25]. However, they tend to average out and diminish the intrinsic dielectric properties and to have higher dielectric losses through the more conductive ferromagnetic phase. Oriented bilayer and multilayer samples, on the other hand, are better for dielectric applications as they possess more ordered crystalline structures and well-aligned domains, higher permittivity, lower losses (as the ferroelectric layer isolates the more conductive magnetic phase), and enhanced tunability [27]. In this respect, studies on the DC and AC conductivity of layered nanostructured BaTiO3–Co2FeO4 composites need to be further explored.
Thus, here, bilayer composite films composed of BaTiO3 and CoFe2O4 have been prepared on (100) oriented Nb-doped SrTiO3 substrates. Their structural, morphological, spectroscopic, nonlinear optical, dielectric, and conductive properties were characterized. The Nb:SrTiO3 substrate was used, as it has the same crystalline properties as SrTiO3, but its conductivity allows it to serve as an electrode for dielectric and DC and AC conductivity studies. The films present the ferroelectric tetragonal structure of the BTO layer and the cubic spinel structure of CFO. The electrical permittivity of the bilayer films was modeled and fitted to obtain characteristic temperatures, activation energies, relaxations, and DC and AC conductivity behavior. The results provide insights into small-polaron, quantum mechanical tunneling, correlated barrier hopping, and the role of oxygen vacancies in the relaxation and transport properties of the BTO layer, along with their influence on the DC and AC conductivity behavior of the films.

2. Materials and Methods

Nanocomposite bilayer thin films composed of a barium titanate (BaTiO3 – BTO) film deposited over a cobalt ferrite (CoFe2O4 – CFO) layer were prepared by pulsed laser ablation on SrTiO3 (100) substrates doped with 1.4% niobium – Nb:SrTiO3 (Crystal GmbH, Berlin, Germany). The BTO ceramic target was produced using a BaTiO3 nanoparticle powder (SIGMA-ALDRICH, Saint Louis, MI, USA), with particle sizes below 100 nm and a purity of at least 99.0%. The CFO ceramic target was produced from a CoFe2O4 nanoparticle powder (Nanostructured and Amorphous Materials, Katy, TX, USA) with particle sizes between 35 nm and 55 nm and a purity of 98%. The powders were placed into a pellet die (PerkinElmer, Waltham, MA, USA) and pressed using a Carver hydraulic press (model 4350 L, Wabash, IN, USA) at a pressure of 220 MPa, forming cylindrical targets with a diameter of 13 mm and a thickness of 3 mm. The targets were then annealed in a Carbolite MTF 12/38/250 tube furnace (Hope, Derbyshire, United Kingdom) at 1000 °C—held for 18 h for BTO and 24 h for CFO. The temperature was ramped up and down at a rate of 2 °C/min.
The depositions were performed with a KrF excimer laser LPX PRO 210 (Lambda Physik—Coherent, Saxonburg, PA, USA) with a wavelength λ of 248 nm at a fluence of 2 J/cm2. The samples were produced with varying layer deposition times, while the other preparation conditions were kept constant. The deposition parameters for each layer are summarized in Table 1. They were based on previous results for laser-ablated films of both materials [10,28,29].
The pressure inside the deposition chamber was initially lowered to 5 × 10⁻² mBar using a rotary vacuum pump Pascal 2010 I (Alcatel, Annecy, France). The pressure was further reduced to 10−5 mBar using the turbomolecular vacuum pump ATP 80 (Adixen—Alcatel, Annecy, France). Pressures above 10−2 mBar were measured with a Pirani gauge (PGC1, AML, Arundel, United Kingdom), while pressures below 10−2 mBar were measured with a cold-cathode vacuum gauge, model 943 (MKS, Andover, MA, USA). The substrate temperature was increased to the target temperature at a rate of 10 °C/min using a resistive-heating substrate holder (TSST, Enschede, Netherlands), with the temperature measured with a type K thermocouple probe (Omega, Norwalk, CT, USA). Before deposition, the substrates were kept at 650 °C for 30 min to promote the evaporation of residuals from the substrate surface. After deposition, the samples were cooled down to room temperature at a rate of 10 °C/min, with an oxygen pressure of 1 mbar to prevent under-oxidation of the films [30,31]. Under these conditions, the deposition rates determined from cross-sectional scanning electron microscopy micrographs were 2 nm/min for cobalt ferrite and 10 nm/min for barium titanite. Three bilayer samples were produced under these conditions, with approximately the same CoFe2O4 thickness and varying BaTiO3 deposition times.
The structural analysis of the samples was conducted using X-ray diffraction (XRD), with a D8 Discover (Bruker, Billerica, MA, USA) diffractometer, using Cu-Kα radiation (λ = 1.54060 Å). Each sample was scanned with θ-2θ mode in the 2θ range from 15° to 60°, with an angular step size of 0.02°.
The morphology was characterized by scanning electron microscopy (SEM) with a Quanta 650 FEG (FEI, Hillsboro, OR, USA) with an acceleration voltage of 20 keV. Cross-sectional scanning electron micrographs of the bilayer thin films were obtained at a 45° tilt. Microanalysis to determine the chemical composition of the samples was performed by energy-dispersive X-ray spectroscopy (EDX) using a Flat Quad 5060F (Bruker, United States of America, Billerica) detector at an acceleration voltage of 20 kV.
Impedance spectroscopy was used to measure the dielectric properties of the samples. In these measurements, the sample was treated as a parallel-plate capacitor included in an LCR network [32]. Circular gold electrodes with a diameter of approximately 1 mm were sputtered onto the sample surfaces. The highly conductive Nb:SrTiO3 (100) substrates, where the samples were deposited, served as the bottom electrode for the bilayer films, while a gold (Au) contact was used as the top electrode. The capacitance was measured using a model 6440A (Wayne Kerr, Bognor Regis, UK) precision component analyzer in the frequency range of 20 Hz to 3 MHz. Three measurements were made on each sample to ensure reproducibility. The complex permittivity, expressed as = ε ' i ε ' ' , where ε ' ′ and ε ' ' are the real and imaginary parts, respectively, were calculated from the measured capacitance (C) and loss tangent ( tan δ ), using the following equations:
C   =   ε ' ε 0 A d ,   br to break tan δ   =   ε ' ' ε '
where d is the thickness of the thin film, A is the area of the electrode, and ε 0 is the vacuum permittivity. The temperature-dependent dielectric measurement was conducted from room temperature to 200 °C at a rate of 0.5 °C/min, using a PL 706 PID (Polymer Laboratories—Thermal Sciences, Epsom, UK) controller and furnace for temperature control. The temperature was measured using a PT100 resistance model 1PT100FR828 (Omega, Manchester, UK), with the voltage measured by a voltmeter model 182 (Keithley, Cleveland, OH, USA). Shielded test leads were used to prevent parasitic impedances from the connecting cables.
The second-order nonlinear optical response of the bilayer films was investigated using a mode-locked Ti:Sapphire laser Mira 900 (Coherent, Saxonburg, PA, USA) that operated with a pulse repetition rate of 76 MHz. This laser system produced pulses with a central wavelength of 795 nm and a duration of approximately 120 fs at the sample location. The laser output was typically attenuated to around 1.3 nJ per pulse. The measurements were carried out using a custom-built microscope with a Nikon plan-fluorite 10× objective (with an effective focal length of 20 mm and numerical aperture of 0.3). The focused laser spot size was estimated to be approximately 5 microns in diameter, which resulted in incident fundamental fluxes of roughly 13 mJ/cm2.
A reflection geometry was employed to measure the second harmonic signal due to the opacity of the substrates. Fixed calcite polarizers and half-wave plates controlled the polarization of the fundamental light and the detected second harmonic light. A combination of low-pass and band-pass filters effectively reduced the reflected fundamental light. The filtered signals were then focused into a multimode fiber connected to a 0.3 m spectrophotometer Shamrock 303i (Andor—Oxford Instruments, Belfast, UK) to further isolate the second harmonic signal. Finally, a cooled CCD camera Newton 920 (Andor—Oxford Instruments, Belfast, UK) was used to capture the isolated second harmonic signals digitally, integrating them over a time window ranging from 1 to 60 s.

3. Results and Discussion

3.1. Structural and Morphological Properties

Figure 1 displays scanning electron micrographs of the heterostructures, illustrating a pronounced columnar growth morphology.
For samples with thinner BaTiO₃ layers, the surface topography reflects the terminations of individual columnar grains, whereas thicker BTO layers exhibit a comparatively smoother and more coalesced surface. Film thicknesses were quantified from cross-sectional micrographs (Figure 1) and are compiled in Table 2. The samples are designated using the nomenclature STCB-thickness, where "ST" corresponds to the Nb-doped SrTiO₃ (Nb:SrTiO₃) substrate, "CB" represents the CoFe₂O₄ and BTO layers, and "thickness" denotes the BTO film thickness in units of tens of nanometers. As anticipated, the CFO interlayer thickness remained approximately constant across all samples, within the range of 72–82 nm. In contrast, the BTO layer thickness was systematically varied from 160 nm to 280 nm to study its influence on the overall BaTiO3 layer dielectric and conductivity properties.
The structure of the samples was studied by X-ray diffraction, and the results are presented in Figure 2a. The observed diffraction peaks were indexed in accordance with the reference ICDD PDF patterns 05-0626 for BaTiO3 and 22-1086 for CoFe2O4.
In the case of the CoFe₂O₄ layer, only the (400) diffraction peak is detected, indicating a strong preferential orientation with the (100) planes aligned parallel to the sample surface. This preferred alignment is promoted by the (100) orientation of the underlying Nb-doped SrTiO₃ (Nb:SrTiO₃) (100) substrate. With increasing BaTiO₃ layer thickness, a systematic decrease in the intensity of the CFO (400) diffraction peak is observed, attributed to the reduced relative volume fraction of the CFO layer beneath the growing BTO overlayer.
For the BTO phase, X-ray diffraction patterns exhibit diffraction peaks corresponding to the (100)/(001) and (200)/(002) planes, confirming that the BTO layer also exhibits oriented growth on top of the CFO film. Figure 2b presents a magnified view of the angular region surrounding the (200) and (002) BTO diffractions from Figure 2a. Due to the lattice mismatch between CFO and BTO layers (5.1 %), BTO exhibits a broad diffraction peak owing to the presence of (002) and (200) mixed domains. As the samples were measured with the θ-2θ mode, where the angle of incidence and the angle of diffraction relative to the sample surface are equal, the observed peaks correspond to the structure measured along the growth direction. They indicate the stabilization of the polar tetragonal phase of BTO at room temperature.
The X-ray diffraction peaks were fitted with pseudo-Voigt functions to deconvolute and extract their angular positions and full width at half maximum (FWHM). From the angular positions, the interplanar spacings dhkl were calculated using Bragg’s law. For the CFO cubic spinel structure, the lattice parameter a was derived from the (400) peak using the relation for cubic materials d h k l   =   a / h 2 + k 2 + l 2 [33]. For the tetragonal BTO phase, the lattice parameters a and c were determined from the (200) and (002) peaks, respectively, using the expression d h k l   =   a / h 2 + k 2 + l 2 ( a 2 / c 2 ) for a tetragonal system [33].
Bulk CoFe2O4 has a cubic spinel structure with a lattice parameter of 8.3919 Å [34]. In the films, the lattice parameter of the CoFe2O4 layer is always below the corresponding bulk value, as shown in Table 2. This indicates the presence of contraction strain along the growth direction of the CFO layer, due to the mechanical interaction with the substrate and the BTO layer in the films. On the other hand, bulk tetragonal BTO has lattice parameter values of a = 3.992 Å and c = 4.036 Å [35] and a tetragonality c/a parameter of 1.011. Figure 2c presents the lattice parameters of the BaTiO3 layer, as extracted from the XRD measurements. The lattice parameter aBTO fluctuates between 4.01 Å and 4.02 Å, slightly exceeding the bulk value, while the c-lattice parameter is similar to the bulk value. Thus, the c/a tetragonality parameter is slightly below, but near the bulk value, for all the samples, suggesting that the BTO phase retain ferroelectric character at room temperature. The grain sizes of the layers were calculated using the Scherrer equation expressed as L   =   0.9 λ / ( B c o s ( θ ) ) , where L is the grain size, B is the full width at half maximum of the peak, and θ is the peak angle [33]. The equation was applied to the diffraction peaks: (002)/(200) for the BaTiO3 and (400) for the CoFe2O4. The obtained grain sizes are similar on both layers, as seen in Table 2, with values around 30 nm.
Figure 3 illustrates the energy-dispersive X-ray spectroscopy (EDX) analysis of the samples STCB-16 and STCB-25, revealing the presence of all atomic elements in the thin films. The atomic percentages of Co and Fe in the samples are 20.4 % and 35.2 % for sample STCB-16 and 15.0 % and 24.5 % for sample STCB-25. They are close to the expected relative Co/Fe composition in the CFO layer. The oxygen and titanium content are not included, as these values are affected by their presence in both the substrate and the BTO layer in the films.

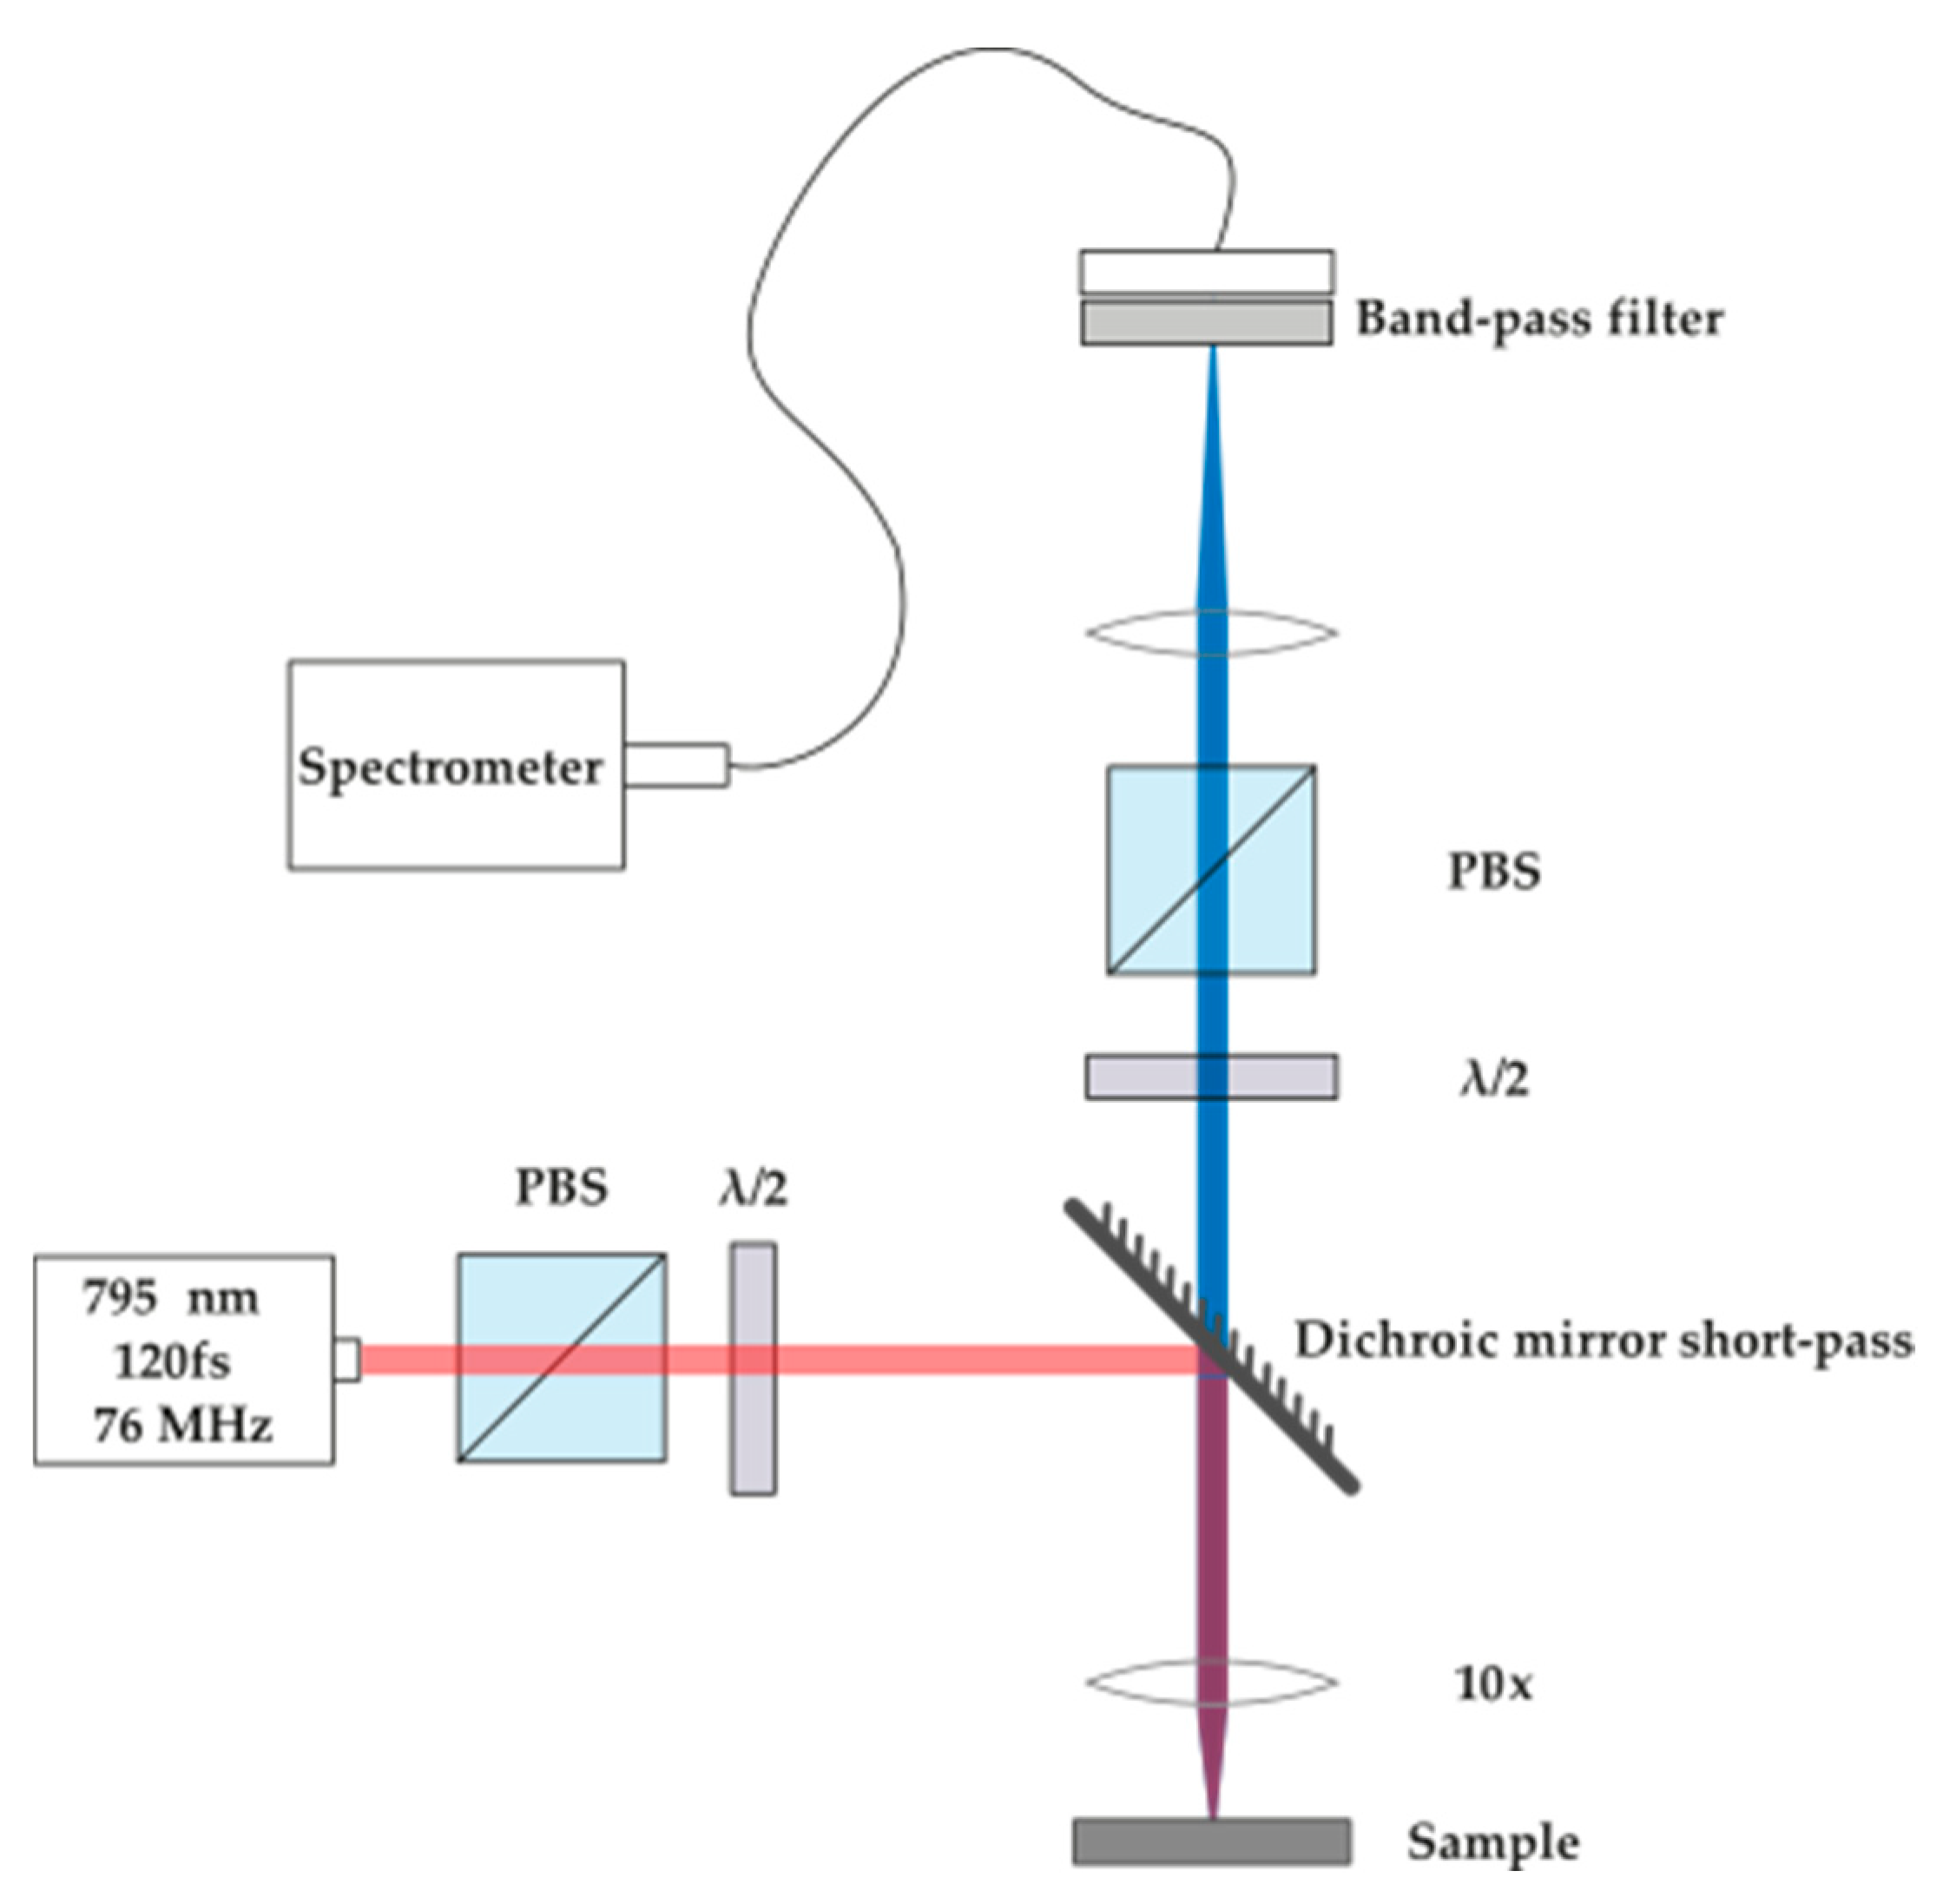
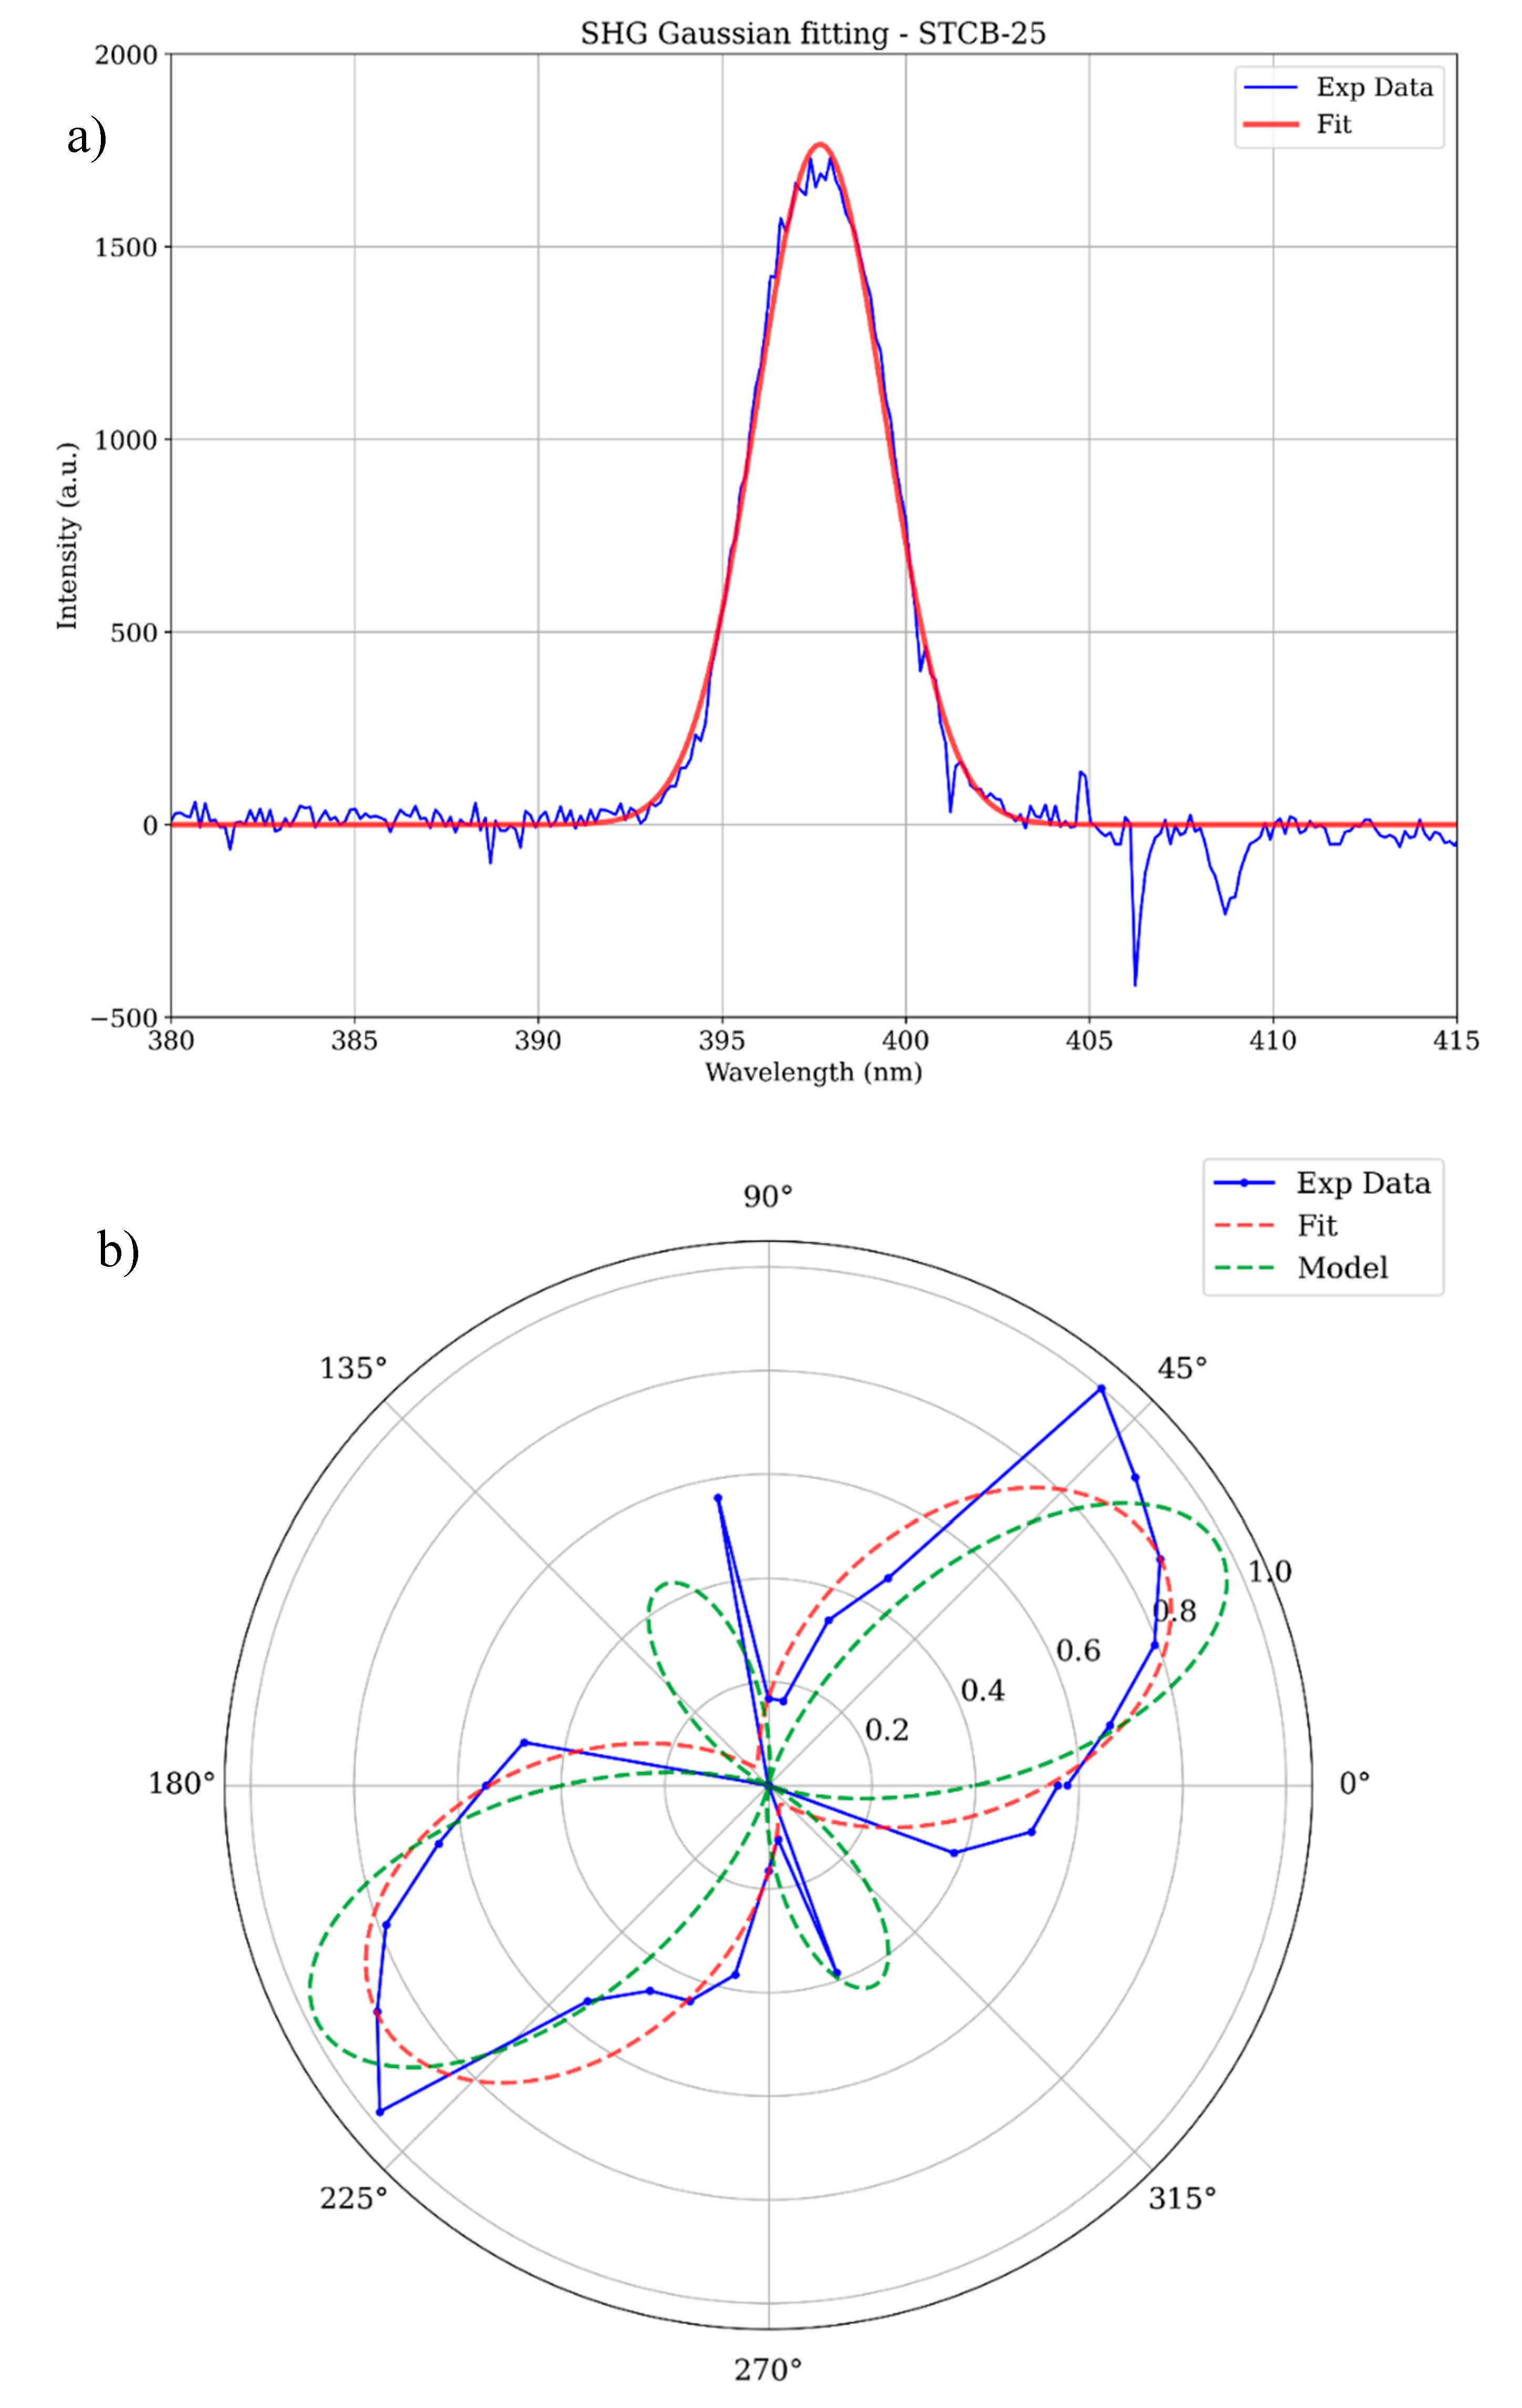
3.2. Second Harmonic Generation

Optical second harmonic generation (SHG) measurements were conducted to further confirm the non-centrosymmetric nature of the BaTiO3 phase in the produced bilayers. Given the opaque nature of the substrate, the experimental setup was assembled in a reflection configuration (Figure 4). The input half-waveplate defines the incident linear polarization of the fundamental beam, whilst the generated SHG signal is analyzed by the half-waveplate placed after the collecting lens, which projects the polarization of the SHG field onto a polarizing beamsplitter (PBS). The light collected by the optical fiber is the p-polarized component (transmitted) through the PBS.
The three samples under study (STCB 16, 25, and 28) were tested in the polarization-resolved SHG microscope and all of them showed SHG signal. This observation confirms the presence of the non-centrosymmetric (ferroelectric) structure of the barium titanate phase at room temperature. The acquired signal was fitted to a Gaussian function (Figure 5a), and the resulting amplitude was taken as the SHG signal magnitude reference for each dataset.
After a full sweep of incident linear polarizations orientations of the fundamental beam, we were able to construct the full material’s SHG polarization response. These results are shown in Figure 5b, for STCB-25, with the sample measurements represented by the blue data points. The ferroelectric phase of BTO belongs to the P4mm, tetragonal, space group. Materials that possess such a crystalline structure have the following non-vanishing second-order nonlinear susceptibility ( χ ( 2 ) ) tensor elements: xzx=yzy, xxz=yyz, zxx=zyy, zzz. Assuming Kleinman’s symmetry condition is valid, in the contracted notation, the resulting nonlinear susceptibility matrix d i l (rank-2 tensor) has five non-zero elements: d 15 , d 24 , d 31 , d 32 , d 33 . [37] Since our samples display both (100) and (001) growth orientations, the analytical formula (Equation 2) for the SHG response ( I 2 ω ) depends on all these elements, effectively being a sum (A and Β coefficients) of individual SHG signal contributions of regions of the sample with each orientation ( I 2 ω   100 and I 2 ω   001 ). For clarity, this approach considers that the region the fundamental beam illuminates contain grains with different orientations, but along the propagation direction there is no change of crystalline structure. If the crystalline structure varies, the modelling of SHG will be considerably more complex.
I 2 ω A × I 2 ω   100 + Β × I 2 ω   001 br - to - break   I 2 ω   100 d 15 sin 2 θ + d 31 cos θ 2 + d 33 sin θ 2 2 br - to - break   I 2 ω   001 d 24 sin 2 θ + d 32 cos θ 2 + d 33 sin θ 2 2
In Figure 5b, the red curve is the result of a least-squares fitting of Equation 2 to our data with the nonlinear susceptibility coefficients as free parameters. Additionally, we explored another possible set of values for the nonlinear coefficients. This leads to the green curve in Figure 5b with a four-lobed pattern that might explain the two experimental points that emerge close to 90 degrees from the maxima of the two-lobed response in the blue curve.
In an effort to estimate the effective second-order nonlinear susceptibility ( d e f f ) of BTO we used a beta-barium borate (BBO) crystal as reference, with known nonlinear coefficients. For our experimental conditions, the focused beam has a diameter ( 2 w 0 ) around 5 μm and a Rayleigh length ( Ζ R ) of 25 μm. The BBO crystal size is 1 mm, and the refractive indices for the fundamental and for the second harmonic wavelength are n ω = 1.66 and n 2 ω = 1.56 , respectively, as provided by the supplier (Eksma Optics, UAB, Vilnius, Lithuania). Assuming strong spatial walk-off but no temporal dispersion, due to the strong-focusing of a Gaussian beam, under phase-matching conditions, the second harmonic energy ( U 2 ω ) generated in the BBO can be modelled after Equation 3 [38]:
U 2 ω = 2 ln 4 d e f f 2 π w 0 3 c 3 λ ω   ρ   τ   ε 0   n ω   n 2 ω U ω 2 br - to - break   η B B O = U 2 ω U ω
where c is the speed of light in vacuum and ε 0 is the vacuum permittivity. To simplify the analysis, we take as a figure of merit the efficiency of SHG generation of the BBO crystal ( η B B O ). The supplier indicates a value of close to d e f f = 2.2   p m / V for the highest nonlinear tensor coefficient. The parameter ρ is the walk-off angle, which in our case is 69 mrad. The pulse width is taken as the FWHM and is equal to τ = 120 fs [39].
In the case of the BTO sample, we consider the plane-wave approximation in the phase-matching condition. SHG efficiency can then be described as in Equation 4 [38]:
η B T O = 2 ln 4 π d e f f 2   w 0 2   L 2   U ω c 3 λ ω   τ   ε 0   n ω   n 2 ω   Ζ R  
where L represents the thickness of the sample. To better understand the SHG signal being generated in reflection, we consider a simple multilayer configuration where a portion of the forward-generated bulk SHG is reflected at the interfaces between the different media that compose the samples. We assumed that the backward SHG generated at the surface is negligible, with its intensity being several orders of magnitude lower than that of the forward SHG generated by the bulk of the sample [40].
In the case of BBO, we consider the reflection from the interface BBO-Air occurring at the second surface of the crystal and the subsequent transmission through the first surface. The supplier states that at the wavelength of the SHG signal, which is 397.5 nm, around 2.8% of the light is reflected at the interface BBO-Air. This leads then to the backward (reflected) signal being about 2.7% of the total SHG intensity generated in the crystal.
For the BTO samples, we have additional interfaces. The SHG beam passes through the BTO-CFO interface and then through the CFO-STO one. To simplify calculations, and since the refractive indices of CFO and STO are very similar, we can consider the two materials as one effective layer with a refractive index of n 2 ω = 2.68 [41,42]. The resulting portion of SHG light reflected is approximately 17% of the total signal generated.
Finally, considering the ratio between the maximum count rates for the SHG from BTO and from the BBO crystal, both obtained from the amplitude of the Gaussian fit as shown in Figure 5a, we can estimate the effective nonlinear coefficients for BTO. The calculated values are: d e f f = 0.18   p m / V for STCB-16, d e f f = 0.07   p m / V for STCB-25 and d e f f = 0.03   p m / V for STCB-28.
The nonlinear coefficients vary with the materials' thicknesses. The thicker the BTO layer in the sample, the smaller the d e f f . A potential cause can be the fact that, as the sample grows, its crystalline structure becomes less regular, potentially losing its non-centrosymmetric nature and moving away from the ferroelectric phase. However, the structural results showed that the tetragonality of the BTO layer is similar in the different films. On the other hand, as the BTO thickness increases, light is scattered by the dense grain structure of the sample, and less of the generated light returns to the first surface after reflection from the STO substrate.
The polar plot shows that the points follow a different behavior from the rest of the dataset, suggesting the presence of additional lobes. Although it is argued that, depending on the growth orientation, the polarization dependence can have a 4-lobe response - as shown by the green curve in Figure 5b - it is also possible that multiple grains are being probed simultaneously, with the SHG signal being the sum of all their individual contributions. Bearing in mind the small grain size of the samples (on the order of a few tens of nm), this is highly plausible. Moreover, considering the coarse rotation step used in Figure 5b, the origin of these two apparent outliers can be attributed to grains oriented differently from a more ordered group of crystals in the probed region, and whose signal is comparatively weaker.
Overall, these results not only confirm the non-centrosymmetric nature of the BTO phase but also suggest the potential for tailoring the second-order nonlinear optical properties of these bilayer structures through precise control of layer thickness.

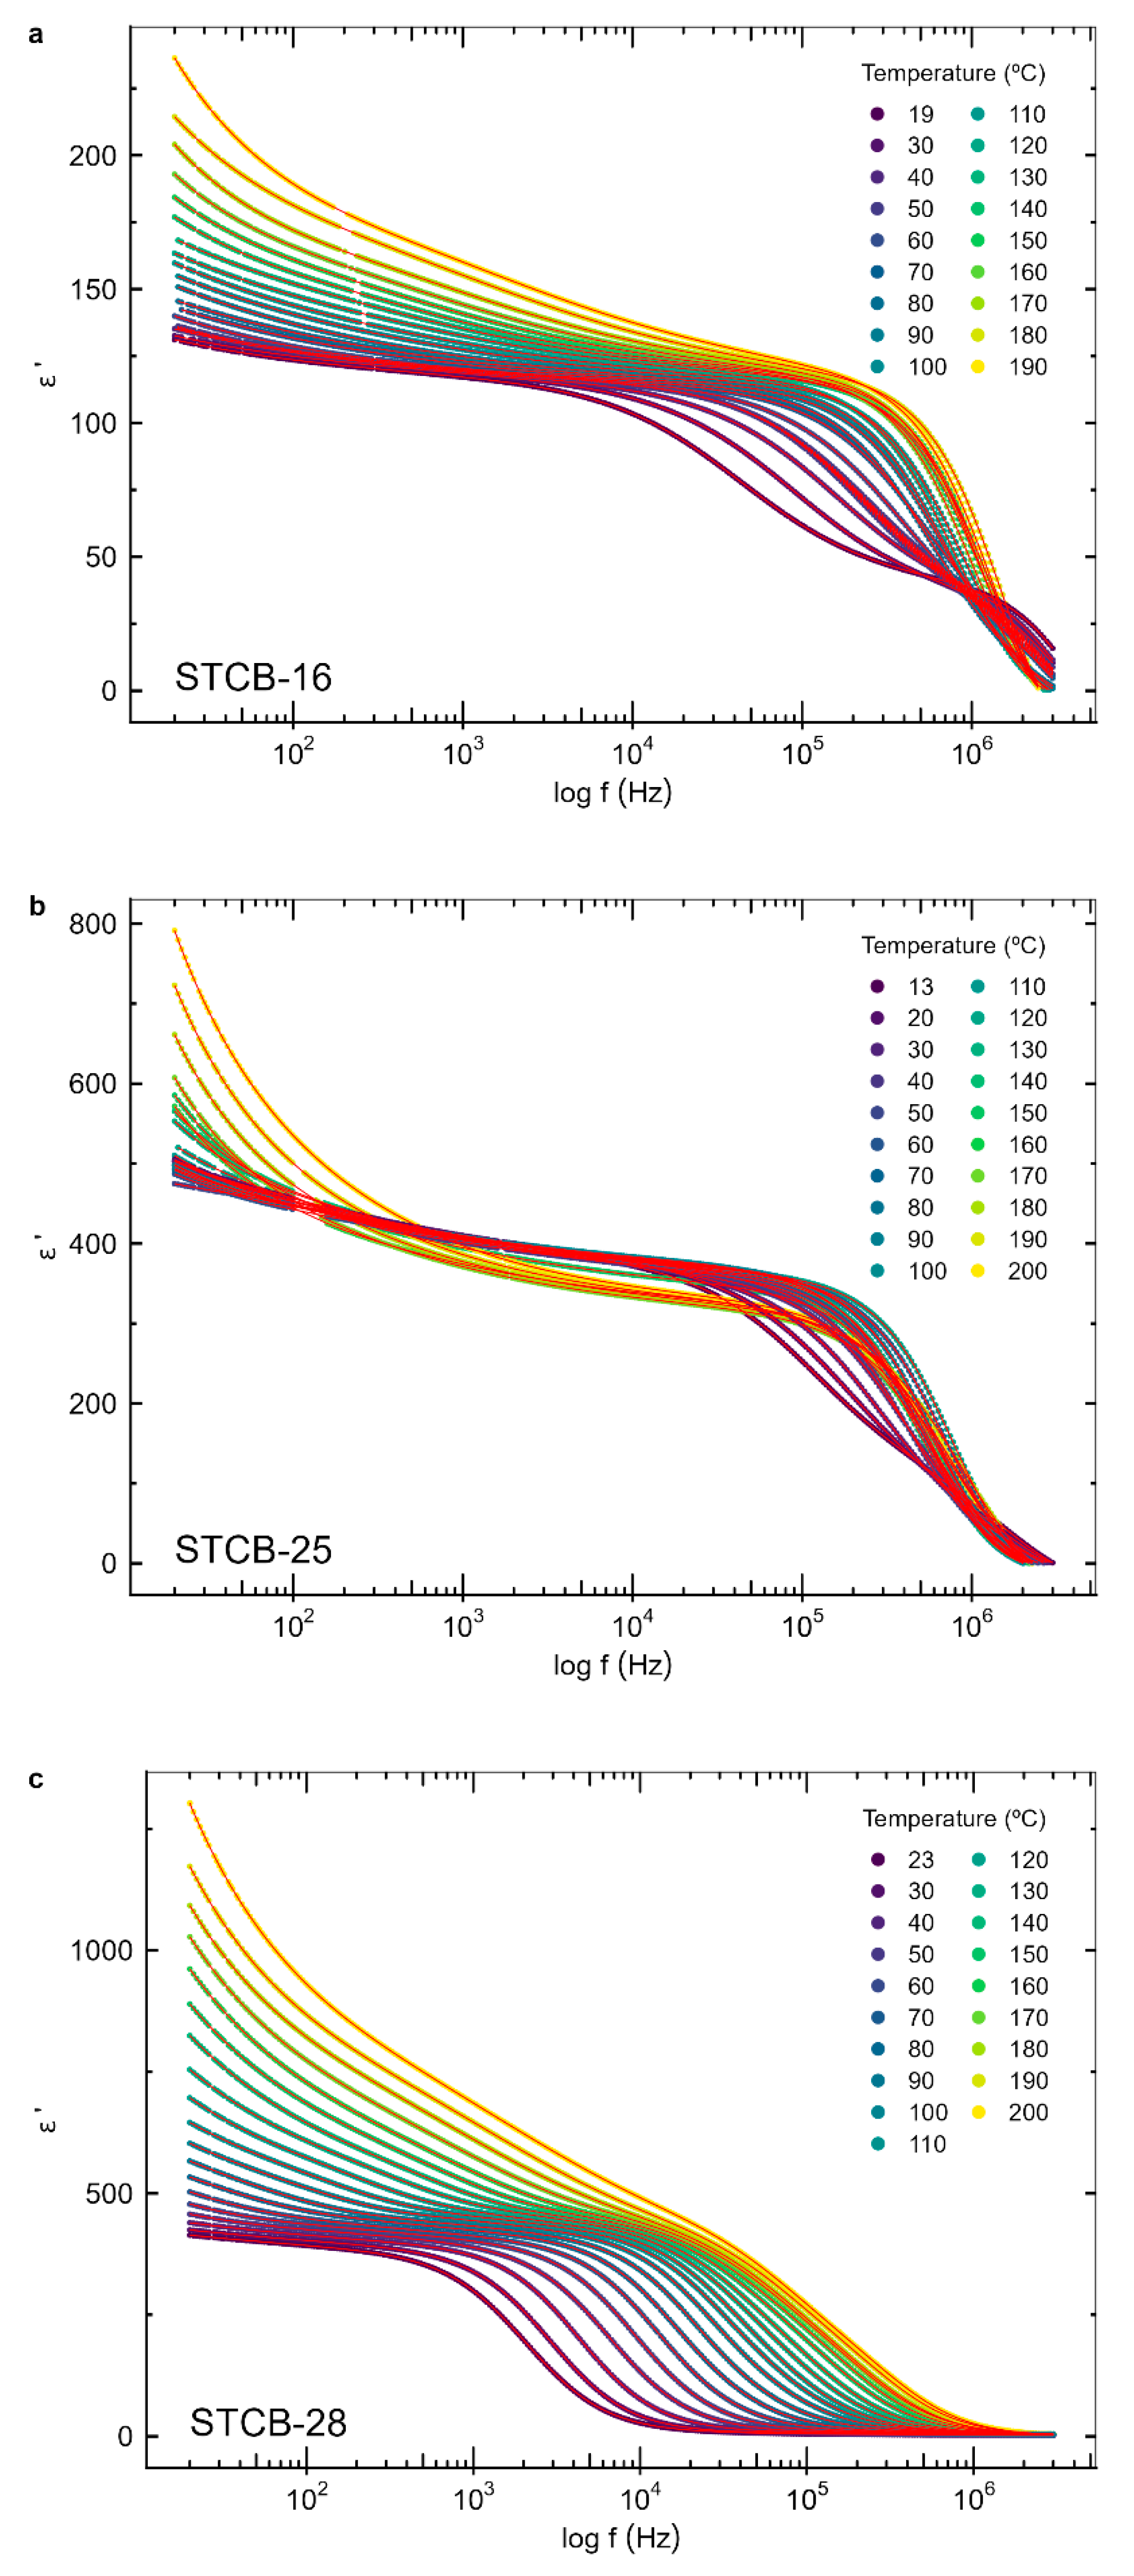
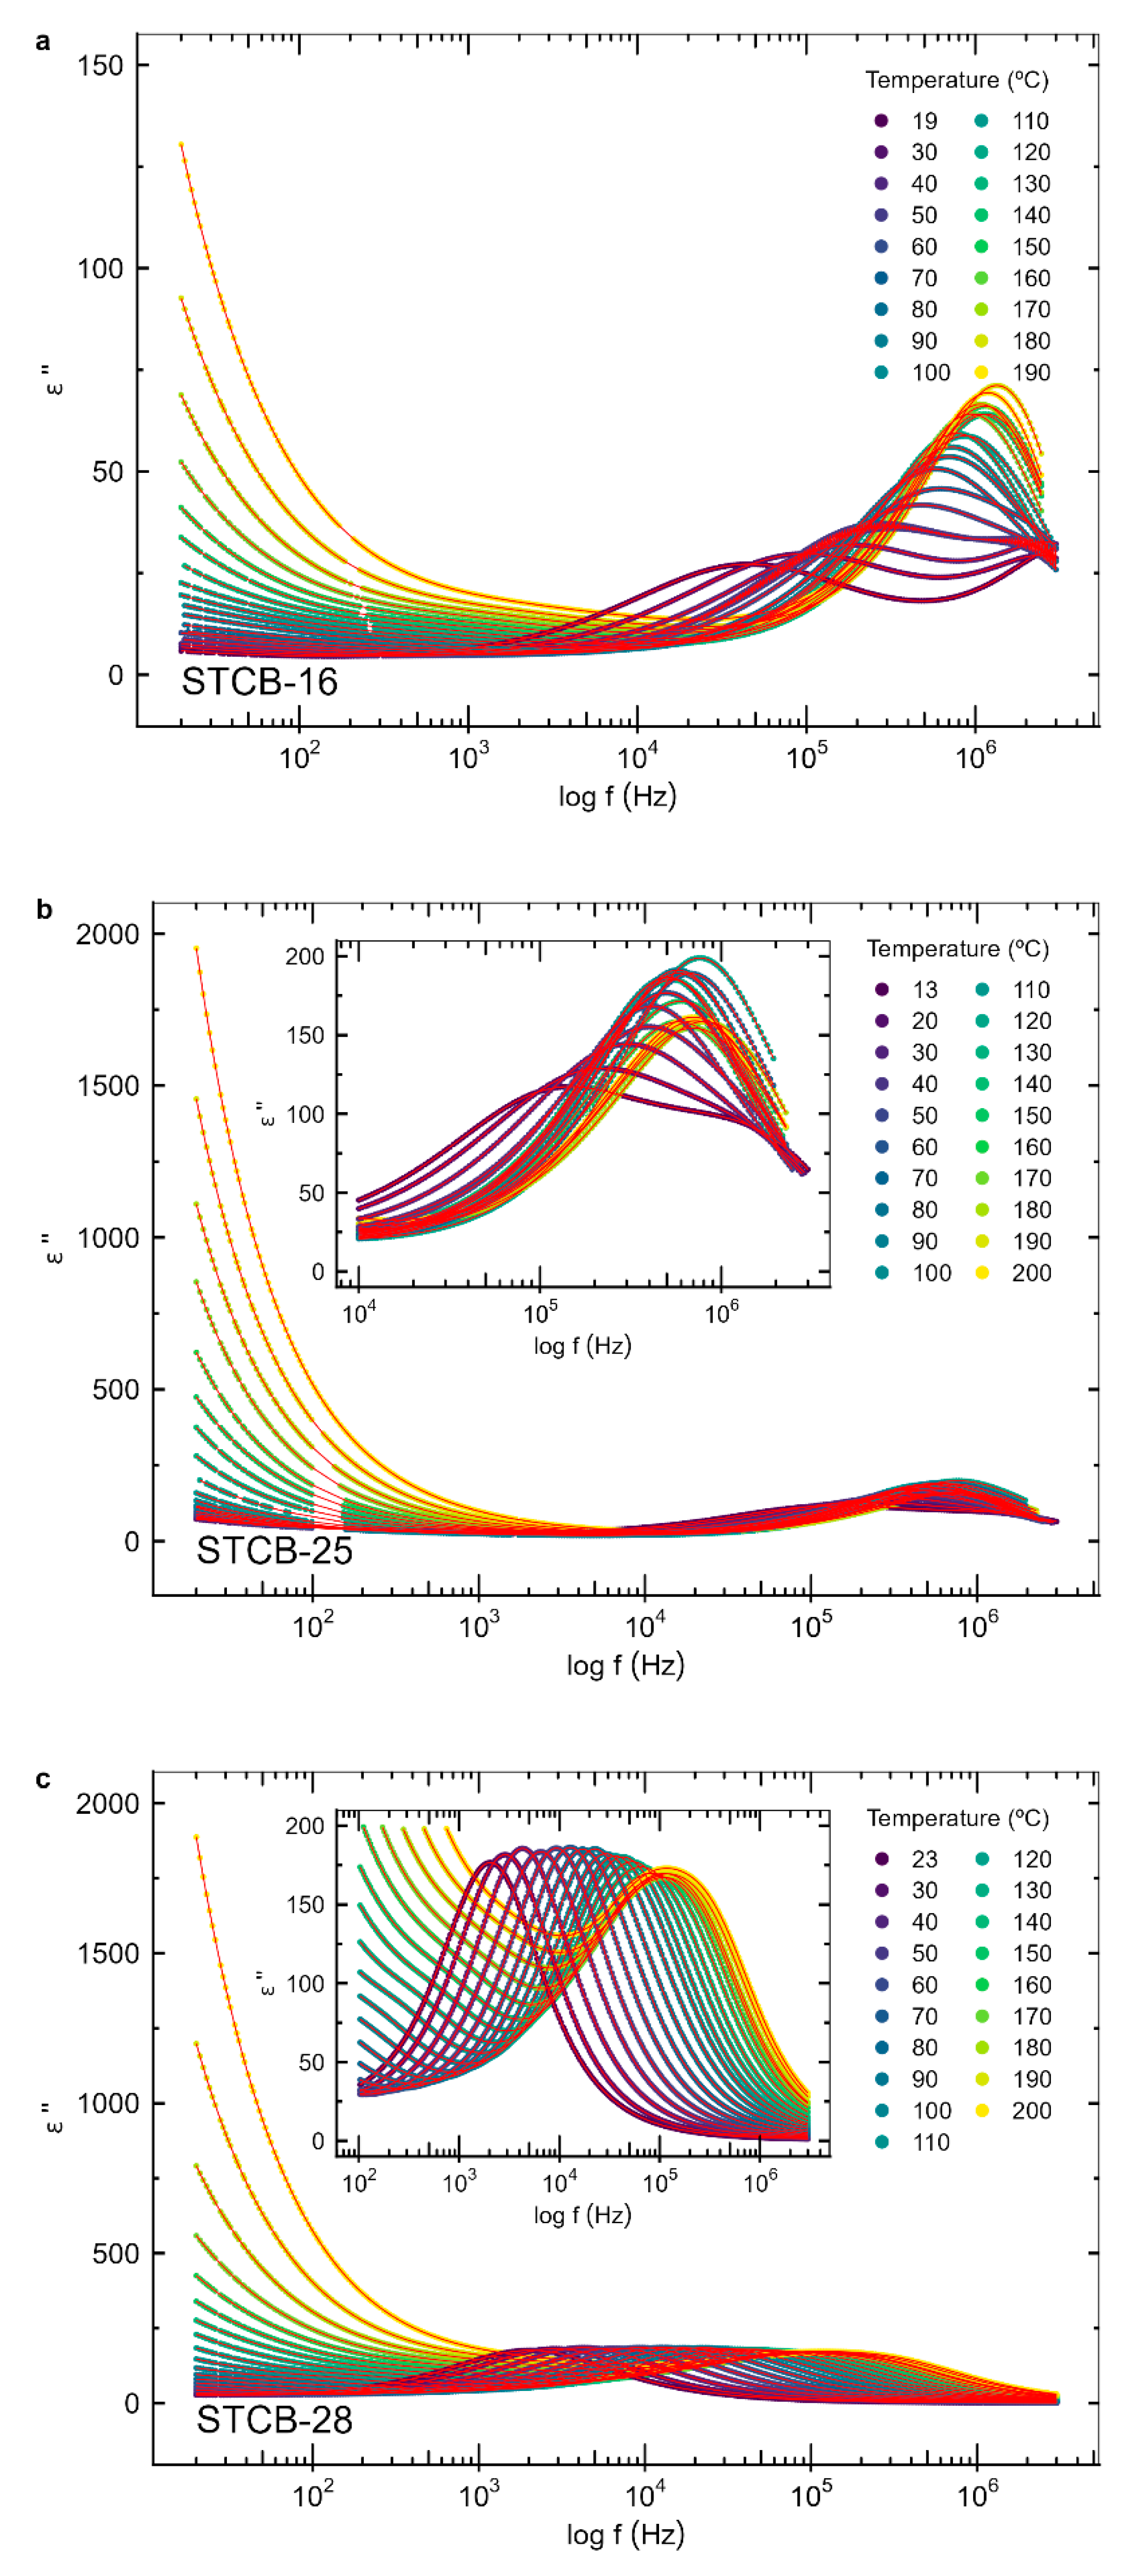
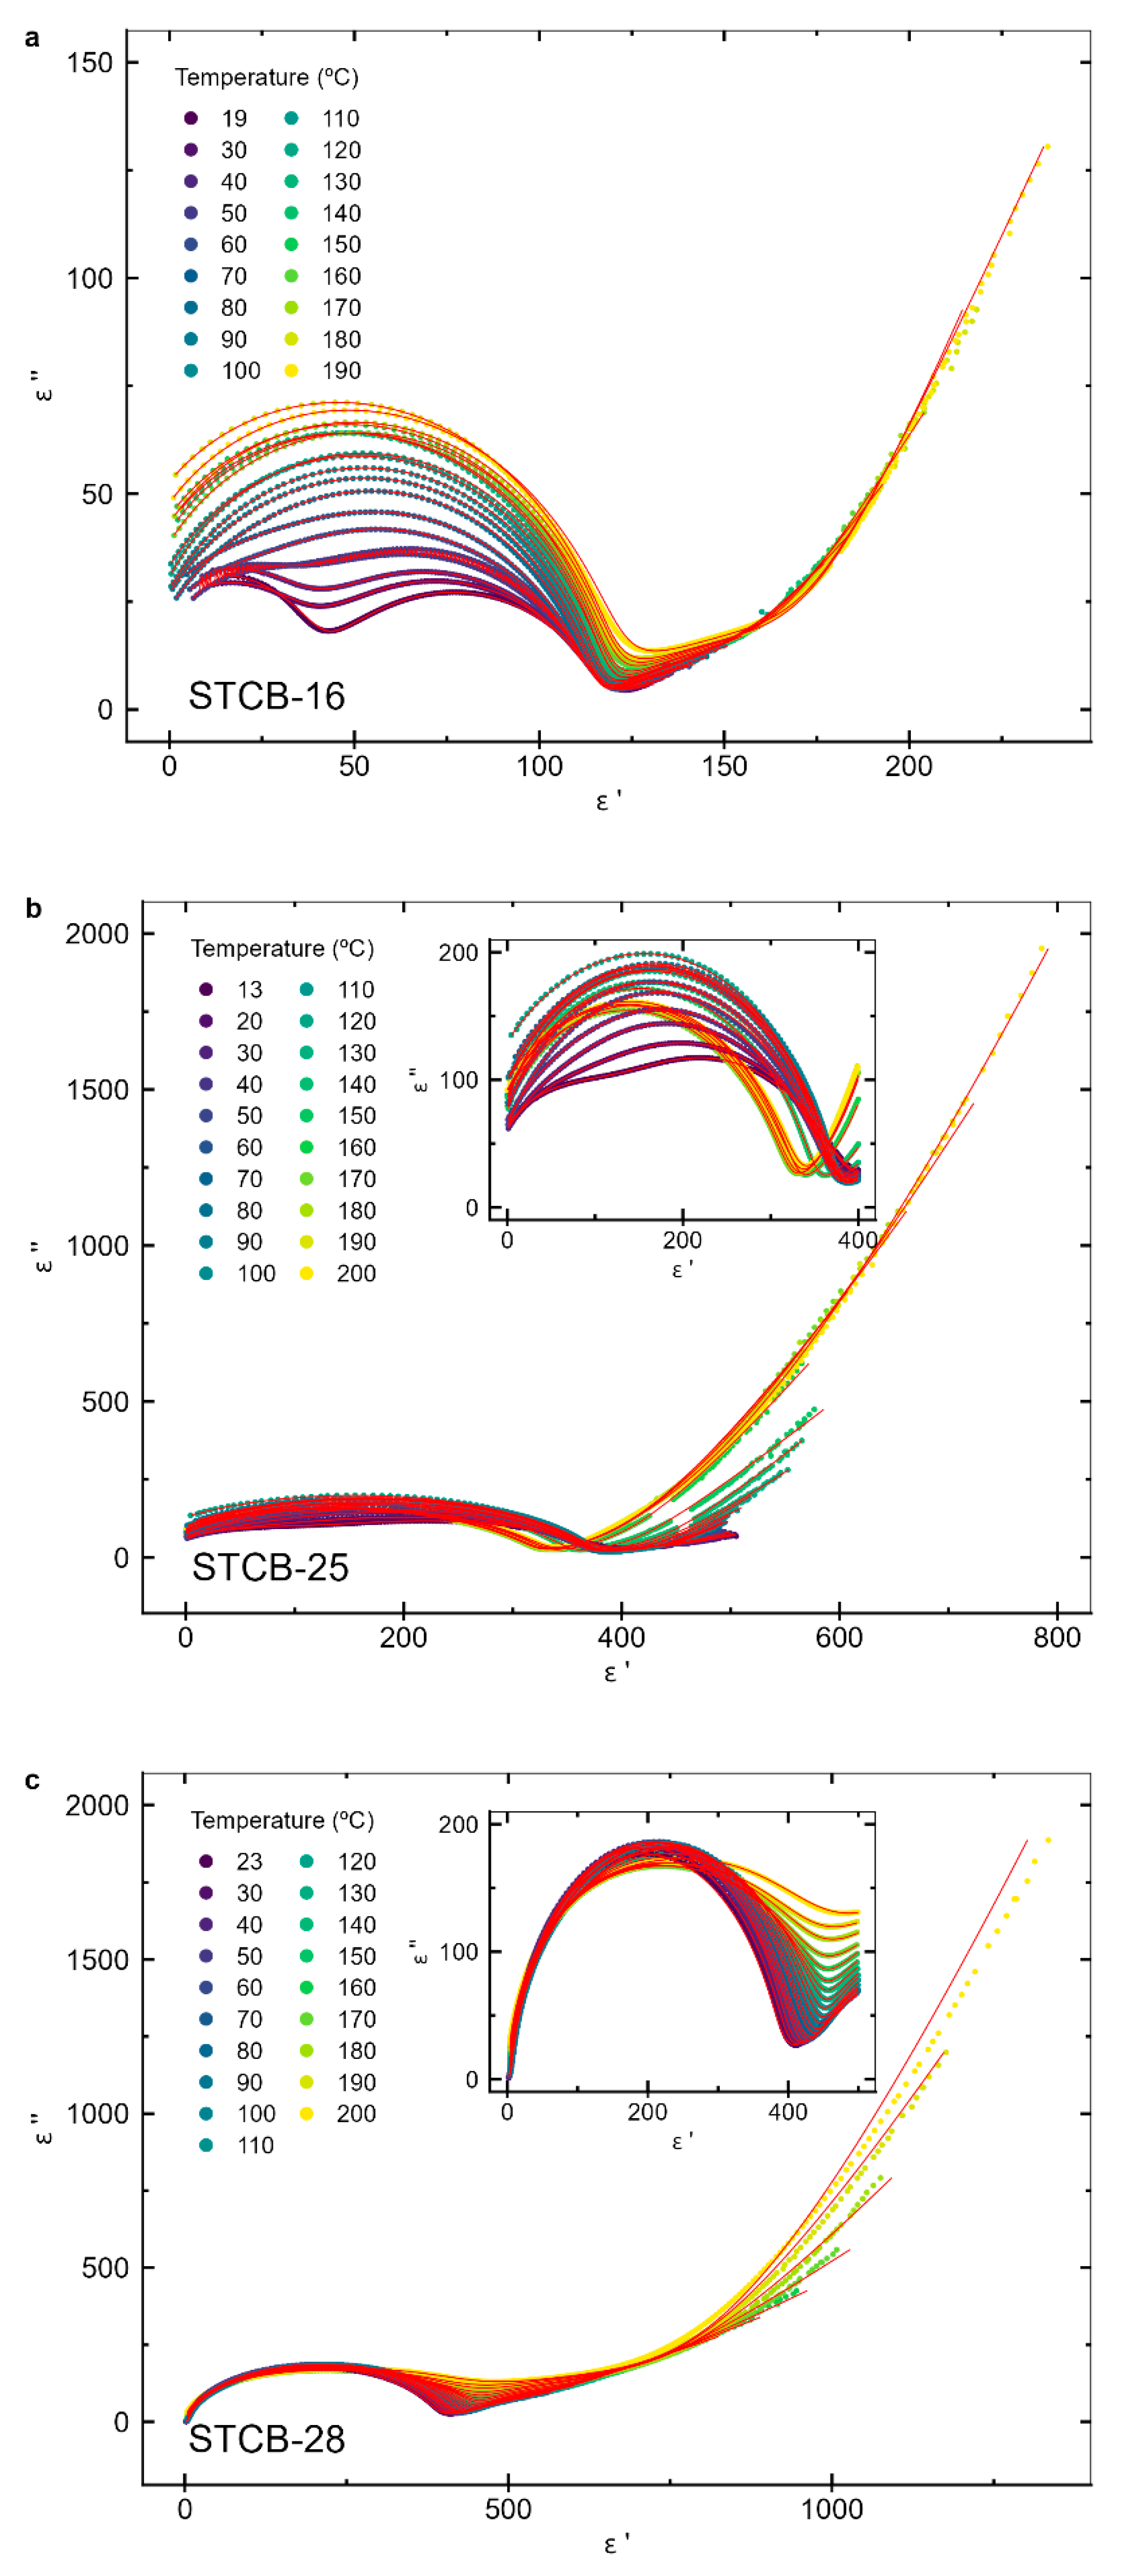
3.3. Dielectric Properties

Figure 6 and Figure 7 present the frequency-dependent real (ε’) and imaginary (ε’’) components of the electric permittivity, respectively, for the bilayer samples with varying barium titanate layer thicknesses, measured over the temperature range of ~18 °C to 200 °C. Figure 8 displays the corresponding Nyquist plots, representing ε’’ versus ε’.
Two distinct dielectric relaxations are evident in the spectra, as indicated by the presence of two peaks in ε’’ and two semicircular arcs in the Nyquist plots. The higher-frequency relaxation becomes more prominent at lower temperatures. Its peak frequency exhibits thermally activated behavior, shifting to higher frequencies with increasing temperature and eventually exceeding the measurable frequency window at higher temperatures.
At low frequencies, the real part of the permittivity (ε’) exhibits significantly elevated values, particularly at higher temperatures, and decreases with increasing frequency. This behavior is attributed to interfacial polarization effects, specifically the Maxwell–Wagner–Sillars (MWS) mechanism, which becomes prominent at the nanoscale. In this process, charge carrier movements are hindered at internal dielectric interfaces or at interfacial regions between layers, leading to space charge accumulation. This interfacial polarization contributes an additional component to the overall dielectric response, thereby enhancing the low-frequency permittivity [43].
Regarding the imaginary component of electric permittivity, a sharp increase in ε’’ is observed at low frequencies (< 102 Hz) as the frequency decreases (Figure 7), and this effect becomes more pronounced with rising temperature. This behavior indicates a contribution from electrical conductivity due to the presence of free charges [43,44], particularly at elevated temperatures. At high frequencies, the charge carriers are unable to follow the rapidly oscillating electric field, and the system behaves like two insulating capacitors in series, corresponding to the BTO and CFO layers. Conversely, at low frequencies, the charge carriers can respond to the applied field, leading to a significant enhancement in the measured permittivity of the films. For purely electronic conduction, the imaginary part of the permittivity is expressed as ε c o n d ω   =   i σ ε 0 ω [43,44], where ε0 is the vacuum permittivity, ω is the angular frequency, and σ is the DC conductivity. In cases involving ionic or polaronic charge carriers - which can induce electrode polarization or Maxwell–Wagner effects - the equation is generalized to ε c o n d ω   =   i σ ε 0 ω s , where s is an exponent with s 1 [43].
On the other hand, the observed broad relaxation peaks suggest a distribution of relaxation times and indicate correlated dipolar behavior. To model the permittivity response, the Havriliak–Negami (HN) function was employed [32,43,45], incorporating two relaxation times, along with terms accounting for both conductivity and high-frequency contributions:
ε ω     =     ε + j = 1 2 ε j 1 + i ω τ j β j γ j i σ ε 0 ω s
where ε j is the intensity associated with each HN component, ε is the high-frequency dielectric constant, ω is the angular frequency, τ j are the relaxation times, and β j and γ j are parameters that define, respectively, the asymmetry and broadness of the dispersion of each HN function, with the constraints 0 < β j 1 and 0 < β j γ j 1 . When γ = β = 1, the Havriliak–Negami model simplifies to the Debye function. The last term on the right of Equation 5 is the conductivity contribution to the dielectric permittivity of the films.
The real and imaginary components of the permittivity were fitted using Equation 5, as shown by the red continuous curves in Figure 6 and Figure 7, respectively, to determine the function parameters at each measured temperature. The corresponding Nyquist plot data, along with fits based on the Havriliak–Negami (HN) model, are presented in Figure 8. The temperature-dependent DC electrical conductivity, extracted from these fits using the combined HN model and the conductivity term in Equation 5, displays thermally activated behavior, as described by Equation 6 [46].
σ T = σ 0 T e E σ k B T
where σ0 is a constant, and Eσ is the activation energy associated with the DC conductivity. Figure 9 shows the logarithm of σ × T as a function of the inverse of the temperature. Table 3 presents the corresponding activation energies.
Figure 9 displays two distinct regimes: one occurring at temperatures below a characteristic temperature Tc, where the activation energies are less than 0.5 eV, and another at higher temperatures, where the activation energies exceed 0.5 eV. This characteristic temperature lies between 95 °C and 135 °C, aligning closely with the ferroelectric Curie temperature of bulk BaTiO3 (Tc ~ 130 °C) [17]. Consequently, the observed change in activation energy is attributed to the behavior of the BTO layer, which undergoes a paraelectric–ferroelectric phase transition in this temperature range.
The Tc values obtained from dielectric measurements are lower than the bulk Curie temperature for samples with the smallest BaTiO3 layer thickness (dBTO) and progressively increase with dBTO, approaching the bulk value at greater thicknesses. According to finite-size scaling theory, the Curie temperature shifts to lower values relative to the bulk when one or more dimensions of the material are reduced in size. This shift is described by the relation [47,48,49]:
t   =   T C T C T C   =   ξ 0 d B T O 1 / ν
where TC∞ is the Curie temperature of the bulk crystal, ξ0 is the correlation length at T=0 K, and ν is a critical exponent that characterizes the material's universality class (e.g., 3D Heisenberg, 3D Ising) [50].
The critical exponent ν can be determined using Equation 7 applied to the first two Tc data points in Table 3, yielding ν=0.76. This value is consistent with the 3D random Ising universality class, which has a reported exponent of ν=0.71 [50]. A comparable result was previously observed in polycrystalline BaTiO3–CoFe2O4 thin films deposited on highly doped silicon substrates [51]. The agreement with the 3D random Ising model - as opposed to the pure 3D Ising model, which has ν=0.627 [50] - suggests the presence of local disorder and inhomogeneities within the films. Such disorder is likely associated with the nanoscale dimensions of the layers, where surface effects become increasingly significant. Contributing factors may include the presence of grain boundaries, which in BaTiO3 are typically non-ferroelectric and sensitive to stoichiometry, as well as strain at the interface with the CoFe2O4 layer, particularly in samples with thinner BaTiO3 layers.
In terms of activation energies, oxygen vacancies (VO) are known to significantly affect the physical properties of BaTiO3, particularly its electrical conductivity and dielectric relaxation behavior. However, in BaTiO3, the migration of oxygen vacancies and their associated relaxation processes typically occur at higher temperatures, near approximately 200 °C or above, and with activation energies of ~1 eV [52,53,54]. At lower temperatures, below ~200 °C, small polarons are known to play a dominant role in the optical and electric properties of BaTiO3 [55,56,57]. These polarons consist of self-trapped electrons, primarily localized at Ti ion sites. The localization of electrons may be enhanced in the presence of oxygen vacancies, as well as promoted by ferroelectric polarization or lattice strain [58]. The corresponding polaron hopping activation energies are generally around 0.5 eV or lower [59]. Notably, these activation energies increase with temperature, showing a significant change around the Curie temperature (Tc) - rising from approximately 0.1–0.2 eV near room temperature to about 0.5–0.6 eV above Tc [59]. This variation, which was also observed in our films (Table 3), is attributed to the structural phase transition from a ferroelectric tetragonal phase (present at room temperature) to a cubic paraelectric phase at higher temperatures. This transition affects spontaneous polarization, lattice structure, phonon frequencies, and electron–phonon coupling in BaTiO3. Consequently, these changes in the local environment lead to variations in the polaron activation energies, as observed in our thin films.

3.4. AC Conductivity

The frequency-dependent conductivity (AC conductivity) of the films was measured over the temperature range from room temperature to 200 °C. The AC conductivity (σAC) was calculated from the imaginary part of the dielectric permittivity ( ε ' ' ) using the relation σ A C = ω ε 0 ε ' ' [43], where ω is the angular frequency and ε0 is the vacuum permittivity. Figure 10 presents the angular frequency dependence of σAC at various temperatures, showing a clear overall increase in conductivity with rising temperature.
At low frequencies, the AC conductivity (σAC) tends to a nearly constant behavior, especially at higher temperatures, due to the DC conductivity. Above a critical threshold frequency, ω p , all samples show a pronounced increase in σAC. This effect is more visible at higher temperatures because the onset frequency increases with temperature. At the highest frequencies, σAC tends to saturate, reaching a plateau attributed to relaxation phenomena also observed in the Nyquist plots of the electric permittivity. To elucidate the mechanisms governing this behavior, we analyzed the AC conductivity below the plateau region using a modified Jonscher model [44,60], which incorporates two power-law terms [61,62] to account for the AC conductivity contributions of the bilayer materials:
σ A C = σ D C 1 + ω ω p 1 n + ω ω p 2 m
where σ D C is the DC conductivity, n and m are exponents that represent the degree of interaction between the mobile ions and the environment surrounding them and ωp1 and ωp2 are the onset frequencies for AC-dependent conductivity [63]. The exponent n (0<n<1) characterizes the low-frequency region and corresponds to the translational hopping motion [62]. The exponent m is due to the localized or reorientational behavior that occurs at higher frequencies and has 0<m<2 [64].
Figure 10 presents the fitted frequency-dependent σ A C curves (using Equation 8) alongside the experimental data. From the fits, the parameters n, m, ω p 1 ,  ω p 2 , and σ D C were determined. The obtained DC conductivities are close to the values obtained from the imaginary component of the electric permittivity (Figure 7).
Regarding the onset frequencies ω p 1 and ω p 2 , their temperature dependence follows a thermally activated Arrhenius-like behavior, with ω p = ω p 0   e E a p k B T , where ω p 0 is a constant and E a p 1 and E a p 2 are the corresponding activation energies. Figure 11 displays the logarithm of ω p 1 and ω p 2 as a function of the inverse of the temperature.
The dependence of ω p 1 with the inverse of T shows a distinct change in behavior at T* ~ 119 °C, for all three samples. This temperature is close to the ferroelectric phase transition temperature of BaTiO3 and is consistent with the values obtained from the dielectric properties (Table 3). Above T*, ln( ω p 1 ) exhibits a linear relationship with 1/T, with activation energies of 0.91 eV, 0.48 eV, and 1.51 eV, for STCB-16, STCB-25, and STCB-28, respectively. These activation energies are of the order of 0.5 eV or higher, characteristic of the high-temperature paraelectric phase of BaTiO3. This indicates that the AC conductivity behavior in the low-frequency region predominantly originates from the BaTiO3 layer.
For ω p 2 , the plot ln( ω p 2 ) versus 1/T exhibits a linear trend across the entire temperature range (Figure 11b), contrasting with the behavior of ω p 1 (Figure 11a) associated with the BaTiO3 layer. This indicates a single dominant process operating throughout the measured temperatures, suggesting that the AC conductivity in the intermediate frequency region primarily reflects the contribution of the CoFe2O4 layer. At room temperature, electrical transport and polarization in bulk ferrite are linked to electron hopping between Fe2+ and Fe3+ ions and hole hopping between Co3+ and Co2+ ions at octahedral B sites [51,65,66,67], typically characterized by activation energies around 0.45 eV [68]. In this respect, the activation energies Ea2 derived here are 0.23 eV, 0.40 eV, and 0.47 eV (Figure 11b), suggesting that conductivity in the ferrite layer is dominated by hopping between ions located at octahedral sites within the cobalt ferrite phase of the films.
The temperature dependence of the exponent n in Equation 8 gives information about the dominant conduction mechanism in the samples [69,70,71,72]. Figure 12 illustrates how n varies with temperature for all three bilayer samples.
In a material, a polaron forms when the addition of a charge carrier to a site induces a local lattice distortion, lowering the total system energy (including both the electronic and the distortion components) by an amount Wp, which is the polaron energy. For small polarons, which are approximately the size of a unit cell, the distortion clouds do not overlap. In this case, the activation energy for non-overlapping small polaron tunneling (NSPT) between sites does not depend on the intersite separation and is given by WH = Wp/2. For NSPT, the exponent n is given by Equation 9 and, as such, is predicted to increase with increasing temperature [69,70,73]:
n = 1 4 ln 1 ω τ 0 W H k B T
where τ0 is the characteristic relaxation time, ω is the angular frequency, kB is the Boltman constant, and T is the temperature. According to Figure 12a,b, the AC conductivity exponent n increases with increasing temperature for samples SCBT-16 and SCBT-28, indicating that the dominant conduction mechanism corresponds to the NSPT model. This is consistent with the obtained dielectric results, which show that small polarons play an important role in the electrical properties of the BaTiO3 layer in the films. In the NSPT mechanism, the AC conductivity is predicted to follow the equation [70]:
σ A C = π 4 24 e 2 k B T N 2 ( E F ) ω R ω 4 α
where e is the electron charge, α is the spatial decrease rate of the polaron's wavefunction (related with its localization degree, typically α~1 Å−1 [73]), N(EF) is the density of states at the Fermi level, and Rω is the tunneling distance, which is given by [70]:
R ω = 1 2 α ln 1 ω τ 0 W H k B T
Figure 12a,b show the temperature dependence of the exponent n for samples STCB-16 and STCB-28, along with fits to the model described by Equation 9 at 10 kHz. From these fits, the activation energies WH and relaxation times τ0 were extracted, with results summarized in Table 4. Using Equations 10 and 11, the corresponding density of states and tunneling distances at room temperature were also calculated and listed in Table 4. The activation energies for small polaron tunneling are below 0.5 eV (0.27 eV for STCB-16 and 0.35 eV for STCB-28), consistent with the DC conductivity activation energies measured in the ferroelectric phase (Figure 9 and Table 2), where T < TC. The relaxation times are 7.0×10⁻¹² s for STCB-16 and 1.4×10⁻⁸ s for STCB-28, indicating slower polaron dynamics as the BaTiO3 layer thickness increases towards bulk values.
On the other hand, sample STCB-25 presents a different behavior, as shown in Figure 12c. The exponent n remains approximately constant from room temperature (~30 °C) up to about 100 °C, near the ferroelectric phase transition temperature TC of STCB-25 (Table 2). This suggests that the conductivity arises from phonon-assisted electronic tunneling between defect states without polaron formation, a phenomenon known as the quantum mechanical tunneling (QMT) mechanism [74,75]. In the QMT model, the exponent n is temperature independent and is expressed by the following relation:
n = 1 4 ln 1 ω τ 0
The temperature independence of the exponent n observed for sample STCB-25 is the consistent with the QMT model (Equation 12), indicating that this mechanism dominates in this temperature range. The AC conductivity of the QMT model follows the same equation as for the NSPT model, Equation 10. However, for the QMT case, Rω does not depend on temperature and is given by the equation:
R ω = 1 2 α ln 1 ω τ 0
Table 4 presents the relaxation times extracted from fitting the data in Figure 12c using Equation 12 at 10 kHz, along with the density of states and tunneling distances calculated at room temperature using Equations 10 and 13 within the framework of the QMT model. In barium titanate, intrinsic relaxation processes occur up to the GHz range, with relaxation times approximately between 10−9 and 10−13 s, attributed to polar fluctuations and Ti-ion hopping [76]. Since the relaxation times τ0 obtained from both the QMT and NSPT models fall within the gigahertz frequency range, they reflect the dielectric behavior of the BaTiO3 layer.
At sufficiently high temperatures, charge carriers can hop over the energy barrier separating two sites rather than tunnel through it. Each site possesses a Coulomb potential well, and in correlated barrier hopping (CBH), these wells overlap, reducing the effective barrier energy to W = W M e 2 / π ε ε 0 R , where e is the electron charge, ε is the real part of the dielectric permittivity, ε0 is the vacuum permittivity, and R is the intersite separation. Here, W is lower than WM, the barrier height at infinite site separation. For the CBH conduction mechanism, the AC conductivity exponent n is expected to decrease with increasing temperature, following the expression [73,74,77]:
n = 1 6 W M k B T ln 1 ω τ 0
This behavior is observed in sample STCB-25 (Figure 12c), where near Tc, the temperature dependence of the exponent n shifts to a decreasing trend with increasing temperature, consistent with Equation 14. Figure 12c also shows the fit of the n exponent using the correlated barrier hopping (CBH) model in the high-temperature region. From this fit, the barrier height at infinite intersite separation WM was determined, and the effective barrier energy W was subsequently calculated. The obtained effective barrier height, W=1.39 eV (Table 4), exceeds the activation energies found above for the BaTiO3 phase in the films. This value is consistent with hopping conduction through oxygen vacancies, rather than polaron or charge tunneling, since oxygen vacancies in BaTiO3 have activation energies around 1 eV [78]. This shows that they play an important role in the conducting mechanism at high temperatures in the STCB-25 film. This also suggests that the STCB-25 sample may have experienced partial underoxidation during deposition, resulting in a higher concentration of oxygen vacancies compared to the other bilayer thin films.

4. Conclusions

Bilayer composite multiferoic thin films consisting of a BaTiO3 (BTO) layer deposited over a CoFe2O4 (CFO) film were fabricated by laser ablation on conductive Nb-doped SrTiO3 (100) substrates. Their structural, microstructural, dielectric, and electrical (DC and AC) properties were comprehensively characterized. The electrical permittivity and AC conductivity were modeled and fitted to extract relaxation behavior, DC and AC activation energies, conductivity mechanisms, and characteristic frequencies. X-ray diffraction results reveal that the samples exhibit a tetragonal ferroelectric BaTiO3 phase and a cubic spinel CoFe2O4 phase. The films grew with a preferred orientation, with the CFO layer displaying the [400] direction along the growth axis, and the BaTiO3 layer exhibiting (100)/(001) planes aligned parallel to it. DC and AC conductivity analyses indicate that small-polaron tunneling dominates the electrical behavior of BTO, while ion hopping between octahedral sites governs conduction in CFO. The thickness-dependent Curie temperature of BTO follows critical exponents consistent with the 3D random Ising universality class. The AC conductivity fits a Jonscher-type dependence with two power-law components that represent the distinct contributions from the bilayer materials. Analysis of the temperature dependence of the power-law exponents confirms that small polaron tunneling is the prevailing transport mechanism in BTO, whereas CFO conduction arises from hopping through octahedral ion sites. Furthermore, underoxidized samples show a more complex BTO transport behavior, featuring a transition from quantum mechanical tunneling below the Curie temperature to correlated barrier hopping above it. These results provide valuable insight into the transport mechanisms in multiferroic bilayer systems and contribute to the rational design of next-generation multifunctional devices for fast spintronic applications.

Author Contributions

Conceptualization, J.O. and B.G.A.; investigation, J.O., B.M.S., T.R,, M.R., M.B., J.A.M., F.L.D., and B.G.A.; data curation J.O., M.R., F.L.D., and B.G.A.; writing—original draft preparation, J.O. and B.G.A.; writing—review and editing, J.O., B.G.A., M.R., and M.B.; resources, BGA, MB and F.L.D.; supervision, B.G.A., and F.L.D.; project administration, B.G.A.; funding acquisition, B.G.A, M.B. and F.L.D. All authors have read and agreed to the published version of the manuscript.

Funding

This work was supported by the Portuguese Foundation for Science and Technology (FCT), through the projects FEDER-COMPETE-QREN-EU (ref. UID/FIS/04650/2013 and UID/FIS/04650/2019), PTDC/NAN-MAT/0098/2020, and 2022.03564.PTDC and Cost Chiromag Action CA23136. B. M. Silva and J. Oliveira acknowledge their Ph.D. grants from FCT, with references 2021.07277.BD and SFRH/BD/146886/2019, respectively.

Institutional Review Board Statement

Not applicable.

Informed Consent Statement

Not applicable.

Data Availability Statement

The original contributions presented in the study are included in the article, further inquiries can be directed to the corresponding authors.

Conflicts of Interest

The authors declare no conflicts of interest.

References

  1. Taniyama, T.; Gohda, Y.; Hamaya, K.; Kimura, T. Artificial Multiferroic Heterostructures—Electric Field Effects and Their Perspectives. Sci. Technol. Adv. Mater. 2024, 25, 2412970. [Google Scholar] [CrossRef]
  2. Spaldin, N.A.; Ramesh, R. Advances in Magnetoelectric Multiferroics. Nat. Mater. 2019, 18, 203–212. [Google Scholar] [CrossRef] [PubMed]
  3. Leung, C.M.; Li, J.; Viehland, D.; Zhuang, X. A Review on Applications of Magnetoelectric Composites: From Heterostructural Uncooled Magnetic Sensors, Energy Harvesters to Highly Efficient Power Converters. J. Phys. D. Appl. Phys. 2018, 51, 263002. [Google Scholar] [CrossRef]
  4. Wang, J.; Chen, A.; Li, P.; Zhang, S. Magnetoelectric Memory Based on Ferromagnetic/Ferroelectric Multiferroic Heterostructure. Materials (Basel) 2021, 14. [Google Scholar] [CrossRef]
  5. Yu, P. Revolutions of Multiferroic Materials. npj Spintron. 2025, 3, 9. [Google Scholar] [CrossRef]
  6. Manipatruni, S.; Nikonov, D.E.; Young, I.A. Beyond CMOS Computing with Spin and Polarization. Nat. Phys. 2018, 14, 338–343. [Google Scholar] [CrossRef]
  7. Ghidini, M.; Mansell, R.; Maccherozzi, F.; Moya, X.; Phillips, L.C.; Yan, W.; Pesquera, D.; Barnes, C.H.W.; Cowburn, R.P.; Hu, J.-M.; et al. Shear-Strain-Mediated Magnetoelectric Effects Revealed by Imaging. Nat. Mater. 2019, 18, 840–845. [Google Scholar] [CrossRef]
  8. Chu, Z.; Pourhosseiniasl, M.; Dong, S. Review of Multi-Layered Magnetoelectric Composite Materials and Devices Applications. J. Phys. D. Appl. Phys. 2018, 51, 243001. [Google Scholar] [CrossRef]
  9. Gupta, R.; Kotnala, R.K. A Review on Current Status and Mechanisms of Room-Temperature Magnetoelectric Coupling in Multiferroics for Device Applications. J. Mater. Sci. 2022, 57, 12710–12737. [Google Scholar] [CrossRef]
  10. Barbosa, J.; Almeida, B.; Mendes, J.A.; Rolo, A.G.; Araújo, J.P. X-Ray Diffraction and Raman Study of Nanogranular BaTiO3–CoFe2O4 Thin Films Deposited by Laser Ablation on Si/Pt Substrates. Phys. status solidi 2007, 204, 1731–1737. [Google Scholar] [CrossRef]
  11. Juraschek, D.M.; Fechner, M.; Balatsky, A. V; Spaldin, N.A. Dynamical Multiferroicity. Phys. Rev. Mater. 2017, 1, 14401. [Google Scholar] [CrossRef]
  12. Sayedaghaee, S.O.; Xu, B.; Prosandeev, S.; Paillard, C.; Bellaiche, L. Novel Dynamical Magnetoelectric Effects in Multiferroic BiFeO3. Phys. Rev. Lett. 2019, 122, 97601. [Google Scholar] [CrossRef] [PubMed]
  13. Paiva, C.; Fechner, M.; Juraschek, D.M. Dynamically Induced Multiferroic Polarization. Phys. Rev. Lett. 2025, 135, 66702. [Google Scholar] [CrossRef] [PubMed]
  14. Bai, W.; Chen, C.; Yang, J.; Zhang, Y.; Qi, R.; Huang, R.; Tang, X.; Duan, C.G.; Chu, J. Dielectric Behaviors of Aurivillius Bi5 Ti3Fe0.5Cr0.5O15 Multiferroic Polycrystals: Determining the Intrinsic Magnetoelectric Responses by Impedance Spectroscopy. Sci. Rep. 2015, 5, 17846. [Google Scholar] [CrossRef]
  15. Kumar, M.; Arora, M.; Chauhan, S.; Pandey, H. Structural, Magnetic, Dielectric, Vibrational and Optical Properties of Zr Substituted Bi0.90Gd0.10FeO3 Multiferroics. J. Alloys Compd. 2018, 735, 684–691. [Google Scholar] [CrossRef]
  16. Sayedaghaee, S.O.; Paillard, C.; Prosandeev, S.; Xu, B.; Bellaiche, L. Strain-Induced Resonances in the Dynamical Quadratic Magnetoelectric Response of Multiferroics. npj Comput. Mater. 2020, 6, 60. [Google Scholar] [CrossRef]
  17. Li, Y.; Liao, Z.; Fang, F.; Wang, X.; Li, L.; Zhu, J. Significant Increase of Curie Temperature in Nano-Scale BaTiO3. Appl. Phys. Lett. 2014, 105, 182901. [Google Scholar] [CrossRef]
  18. Acosta, M.; Novak, N.; Rojas, V.; Patel, S.; Vaish, R.; Koruza, J.; Rossetti, G. A.; Rödel, J.J. BaTiO3-Based Piezoelectrics: Fundamentals, Current Status, and Perspectives. Appl. Phys. Rev. 2017, 4, 041305. [Google Scholar] [CrossRef]
  19. Buscaglia, V.; Randall, C.A. Size and Scaling Effects in Barium Titanate. An Overview. J. Eur. Ceram. Soc. 2020, 40, 3744–3758. [Google Scholar] [CrossRef]
  20. Jasrotia, R.; Prakash, J.; Saddeek, Y.B.; Alluhayb, A.H.; Younis, A.M.; Lakshmaiya, N.; Prakash, C.; Aly, K.A.; Sillanpää, M.; Ismail, Y.A.M.; et al. Cobalt Ferrites: Structural Insights with Potential Applications in Magnetics, Dielectrics, and Catalysis. Coord. Chem. Rev. 2025, 522, 216198. [Google Scholar] [CrossRef]
  21. Buscaglia, V.; Buscaglia, M.T. Core-Shell Heterostructures: From Particle Synthesis to Bulk Dielectric, Ferroelectric, and Multiferroic Composite Materials. Nanoscale Ferroelectr. Multiferroics Key Process. Charact. Issues, Nanoscale Eff. 2016, 72–99. [Google Scholar] [CrossRef]
  22. Shankar, S.; Thakur, O.P.; Jayasimhadri, M. Conductivity Behavior and Impedance Studies in BaTiO3–CoFe2O4 Magnetoelectric Composites. Mater. Chem. Phys. 2019, 234, 110–121. [Google Scholar] [CrossRef]
  23. Raza, S.A.; Awan, S.U.; Hussain, S.; Shah, S.A.; Iqbal, A.M.; Khurshid Hasanain, S. Structural, Ferromagnetic, Electrical, and Dielectric Relaxor Properties of BaTiO3 and CoFe2O4 Bulk, Nanoparticles, and Nanocomposites Materials for Electronic Devices. J. Appl. Phys. 2020, 128, 124101. [Google Scholar] [CrossRef]
  24. Zheng, H.; Wang, J.; Lofland, S.E.; Ma, Z.; Mohaddes-Ardabili, L.; Zhao, T.; Salamanca-Riba, L.; Shinde, S.R.; Ogale, S.B.; Bai, F.; et al. Multiferroic BaTiO3-CoFe2O4 Nanostructures. Science (80-. ) 2004, 303, 661–663. [Google Scholar] [CrossRef]
  25. Barbosa, J.; Almeida, B.; Pereira, A.M.; Araújo, J.P.; Gomes, I.; Mendes, J. Stress Induced Magnetic Anisotropy on BaTiO3-CoFe2O4 Nanogranular Composite Thin Films. J. Non. Cryst. Solids 2008, 354, 5250–5252. [Google Scholar] [CrossRef]
  26. Kim, D.; Rossell, M.D.; Campanini, M.; Erni, R.; Puigmartí-Luis, J.; Chen, X.-Z.; Pané, S. Magnetoelectric Coupling in Micropatterned BaTiO3/CoFe2O4 Epitaxial Thin Film Structures: Augmentation and Site-Dependency. Appl. Phys. Lett. 2021, 119, 12901. [Google Scholar] [CrossRef]
  27. Zhang, W.; Cheng, H.; Yang, Q.; Hu, F.; Ouyang, J. Crystallographic Orientation Dependent Dielectric Properties of Epitaxial BaTiO3 Thin Films. Ceram. Int. 2016, 42, 4400–4405. [Google Scholar] [CrossRef]
  28. Barbosa, J.G.; Gomes, I.T.; Pereira, M.R.; Moura, C.; Mendes, J.A.; Almeida, B.G. Structural and Dielectric Properties of Laser Ablated BaTiO3 Films Deposited over Electrophoretically Dispersed CoFe2O4 Grains. J. Appl. Phys. 2014, 116, 164112. [Google Scholar] [CrossRef]
  29. Araújo, C.; Almeida, B.G.; Aguiar, M.; Mendes, J.A. Structural and Magnetic Properties of CoFe2O4 Thin Films Deposited by Laser Ablation on Si (001) Substrates. Vacuum 2008, 82, 1437–1440. [Google Scholar] [CrossRef]
  30. Gomes, I.T.; Almeida, B.G.; Lopes, A.M.L.; Araújo, J.P.; Barbosa, J.; Mendes, J.A. Structural and Magnetic Characterization of LaSrMnO3 Thin Films Deposited by Laser Ablation on MgO Substrates. J. Magn. Magn. Mater. 2010, 322, 1174–1177. [Google Scholar] [CrossRef]
  31. Baghizadeh, A.; Vaghefi, P.M.; Huang, X.; Borme, J.; Almeida, B.; Salak, A.N.; Willinger, M.G.; Amaral, V.B.; Vieira, J.M. Interplay of Magnetic Properties and Doping in Epitaxial Films of H-REFeO3 Multiferroic Oxides. Small 2021, 17, 2005700. [Google Scholar] [CrossRef] [PubMed]
  32. Silva, B.M.; Oliveira, J.; Rebelo, T.; Isfahani, V.B.; Rocha-Rodrigues, P.; Lekshmi, N.; Belo, J.H.; Deepak, F.L.; Lopes, A.M.L.; Araújo, J.P.; et al. Synthesis, Structural and Dielectric Properties of Ca3Mn2O7 Thin Films Prepared by Pulsed Laser Deposition. Mater. Res. Bull. 2023, 158, 112066. [Google Scholar] [CrossRef]
  33. Cullity, B.D. Elements of X-Ray Diffraction; Addison Wesley Publishing Company: Reading, Massachusetts, 1978; Vol. 1, ISBN 0-201-01174-3. [Google Scholar]
  34. JCPDS-ICDD PDF: 22-1086. Natl. Bur. Stand. (U.S.) Monogr. 1971, 25, 9 22.
  35. Wang, J.J.; Meng, F.Y.; Ma, X.Q.; Xu, M.X.; Chen, L.Q. Lattice, Elastic, Polarization, and Electrostrictive Properties of BaTiO3 from First-Principles. J. Appl. Phys. 2010, 108, 034107. [Google Scholar] [CrossRef]
  36. Wang, J.J.; Meng, F.Y.; Ma, X.Q.; Xu, M.X.; Chen, L.Q. Lattice, Elastic, Polarization, and Electrostrictive Properties of BaTiO3 from First-Principles. J. Appl. Phys. 2010, 108, 034107. [Google Scholar] [CrossRef]
  37. Boyd, R.W. Nonlinear Optics, 2nd ed.; Academic Press: San Diego, 2003; ISBN 978-0-12-121682-5. [Google Scholar]
  38. Wang, H.; Weiner, A.M. Efficiency of Short-Pulse Type-I Second-Harmonic Generation with Simultaneous Spatial Walk-off, Temporal Walk-off, and Pump Depletion. IEEE J. Quantum Electron. 2003, 39, 1600–1618. [Google Scholar] [CrossRef]
  39. Smith, A. V SNLO Nonlinear Optics Code Available from AS-Photonics; Albuquerque, NM.
  40. Shen, Y.-R. Principles of Nonlinear Optics, 1st ed.; Wiley-Interscience: New York, NY, USA, 1984; ISBN 9780471889984. [Google Scholar]
  41. Chernova, E.; Brooks, C.; Chvostova, D.; Bryknar, Z.; Dejneka, A.; Tyunina, M. Optical NIR-VIS-VUV Constants of Advanced Substrates for Thin-Film Devices. Opt. Mater. Express 2017, 7, 3844–3862. [Google Scholar] [CrossRef]
  42. Kekesi, R.; Royer, F.; Jamon, D.; Blanc Mignon, M.F.; Abou-Diwan, E.; Chatelon, J.P.; Neveu, S.; Tombacz, E. 3D Magneto-Photonic Crystal Made with Cobalt Ferrite Nanoparticles Silica Composite Structured as Inverse Opal. Opt. Mater. Express 2013, 3, 935–947. [Google Scholar] [CrossRef]
  43. Kremer, F.; Schönhals, A. Broadband Dielectric Spectroscopy, 1st ed.; Kremer, F., Schönhals, A., Eds.; Springer Berlin: Heidelberg, 2002; ISBN 978-3-642-62809-2. [Google Scholar]
  44. Silva, B.M.; Oliveira, J.; Rebelo, T.; Calianguila, A.; Silva, D.; Mendes, J.; Almeida, B.G. Influence of LiNbO3 Layer Thickness on Structural and Dielectric Properties of CoFe2O4\LiNbO3 Multiferroic Bilayers Prepared by Laser Ablation. Mater. Chem. Phys. 2023, 307, 128198. [Google Scholar] [CrossRef]
  45. Górska, K.; Horzela, A.; Penson, K.A. The Havriliak-Negami and Jurlewicz-Weron-Stanislavsky Relaxation Models Revisited: Memory Functions Based Study. J. Phys. A Math. Theor. 2023, 56, 313001. [Google Scholar] [CrossRef]
  46. Nuernberg, R.B. Numerical Comparison of Usual Arrhenius-Type Equations for Modeling Ionic Transport in Solids. Ionics (Kiel) 2020, 26, 2405–2412. [Google Scholar] [CrossRef]
  47. Almahmoud, E.; Kornev, I.; Bellaiche, L. Dependence of Curie Temperature on the Thickness of an Ultrathin Ferroelectric Film. Phys. Rev. B 2010, 81, 64105. [Google Scholar] [CrossRef]
  48. Li, Y.; Baberschke, K. Dimensional Crossover in Ultrathin Ni(111) Films on W(110). Phys. Rev. Lett. 1992, 68, 1208–1211. [Google Scholar] [CrossRef]
  49. Deger, A.; Flindt, C. Determination of Universal Critical Exponents Using Lee-Yang Theory. Phys. Rev. Res. 2019, 1, 23004. [Google Scholar] [CrossRef]
  50. Almahmoud, E.; Kornev, I.; Bellaiche, L. Critical Behavior in Ferroelectrics from First Principles. Phys. Rev. Lett. 2009, 102, 105701. [Google Scholar] [CrossRef]
  51. Oliveira, J.; Silva, B.M.; Rebelo, T.; Rodrigues, P. V.; Baptista, R.M.F.; Rodrigues, M.J.L.F.; Belsley, M.; Lekshmi, N.; Araújo, J.P.; Mendes, J.A.; et al. Structural, Magnetic, and Dielectric Properties of Laser-Ablated CoFe2O4/BaTiO3 Bilayers Deposited over Highly Doped Si(100). Materials (Basel) 2024, 17, 5707. [Google Scholar] [CrossRef]
  52. Li, M.D.; Tang, X.G.; Zeng, S.M.; Jiang, Y.P.; Liu, Q.X.; Zhang, T.F.; Li, W.H. Oxygen-Vacancy-Related Dielectric Relaxation Behaviours and Impedance Spectroscopy of Bi(Mg1/2Ti1/2)O3 Modified BaTiO3 Ferroelectric Ceramics. J. Mater. 2018, 4, 194–201. [Google Scholar] [CrossRef]
  53. Cha, S.H.; Han, Y.H. Effects of Oxygen Vacancies on Relaxation Behavior of Mg-Doped BaTiO3. Japanese J. Appl. Physics, Part 1 Regul. Pap. Short Notes Rev. Pap. 2006, 45, 7797–7800. [Google Scholar] [CrossRef]
  54. Choi, M.; Oba, F.; Tanaka, I. Electronic and Structural Properties of the Oxygen Vacancy in BaTiO3. Appl. Phys. Lett. 2011, 98, 172901. [Google Scholar] [CrossRef]
  55. Hwang, J.; Kolodiazhnyi, T.; Yang, J.; Couillard, M. Doping and Temperature-Dependent Optical Properties of Oxygen-Reduced BaTiO3-δ. Phys. Rev. B - Condens. Matter Mater. Phys. 2010, 82, 214109. [Google Scholar] [CrossRef]
  56. Schrader, M.; Mienert, D.; Oh, T.S.; Yoo, H.I.; Becker, K.D. An Optical, EPR and Electrical Conductivity Study of Blue Barium Titanate, BaTiO3-δ. Solid State Sci. 2008, 10, 768–775. [Google Scholar] [CrossRef]
  57. Jing, X.; Xu, W.; Yang, C.; Feng, J.; Zhang, A.; Zeng, Y.; Qin, M.; Zeng, M.; Fan, Z.; Gao, J.; et al. Tuning Electrical Conductivity, Charge Transport, and Ferroelectricity in Epitaxial BaTiO3 Films by Nb-Doping. Appl. Phys. Lett. 2017, 110, 182903. [Google Scholar] [CrossRef]
  58. Tyunina, M.; Savinov, M.; Dejneka, A. Small-Polaron Conductivity in Perovskite Ferroelectric BaTiO3 Films. Appl. Phys. Lett. 2022, 121, 202901. [Google Scholar] [CrossRef]
  59. Tyunina, M.; Savinov, M.; Dejneka, A. Small-Polaron Conductivity in Perovskite Ferroelectric BaTiO3 Films. Appl. Phys. Lett. 2022, 121, 202901. [Google Scholar] [CrossRef]
  60. El Bachiri, A.; F., B.; Bousselamti, M. Dielectric and Electrical Properties of LiNbO3 Ceramics. J. Asian Ceram. Soc. 2016, 4, 46–54. [Google Scholar] [CrossRef]
  61. Ortega, N.; Kumar, A.; Bhattacharya, P.; Majumder, S.B.; Katiyar, R.S. Impedance Spectroscopy of Multiferroic PbZrxTi1−xO3/CoFe2O4 Layered Thin Films. Phys. Rev. B 2008, 77, 14111. [Google Scholar] [CrossRef]
  62. Dam, T.; Jena, S.S.; Pradhan, D.K. The Ionic Transport Mechanism and Coupling between the Ion Conduction and Segmental Relaxation Processes of PEO20-LiCF3SO3 Based Ion Conducting Polymer Clay Composites. Phys. Chem. Chem. Phys. 2016, 18, 19955–19965. [Google Scholar] [CrossRef]
  63. Macdonald, J.R. Comparison of the Universal Dynamic Response Power-Law Fitting Model for Conducting Systems with Superior Alternative Models. Solid State Ionics 2000, 133, 79–97. [Google Scholar] [CrossRef]
  64. Gopalakrishnan, S.; Müller, M.; Khemani, V.; Knap, M.; Demler, E.; Huse, D.A. Low-Frequency Conductivity in Many-Body Localized Systems. Phys. Rev. B 2015, 92, 104202. [Google Scholar] [CrossRef]
  65. Gillot, B.; Jemmali, F. Dependence of Electrical Properties in Iron-Cobalt, Iron-Zinc Ferrites near Stoichiometry on Firing Temperature and Atmosphere. Phys. Status Solidi 1983, 76, 601–608. [Google Scholar] [CrossRef]
  66. George, M.; Nair, S.S.; Malini, K.A.; Joy, P.A.; Anantharaman, M.R. Finite Size Effects on the Electrical Properties of Sol–Gel Synthesized CoFe2O4 Powders: Deviation from Maxwell–Wagner Theory and Evidence of Surface Polarization Effect. J. Phys. D. Appl. Phys. 2007, 40, 1593–1602. [Google Scholar] [CrossRef]
  67. Zhang, R.; Sun, L.; Wang, Z.; Hao, W.; Cao, E.; Zhang, Y. Dielectric and Magnetic Properties of CoFe2O4 Prepared by Sol-Gel Auto-Combustion Method. Mater. Res. Bull. 2018, 98, 133–138. [Google Scholar] [CrossRef]
  68. Ponpandian, N.; Balaya, P.; Narayanasamy, A. Electrical Conductivity and Dielectric Behaviour of Nanocrystalline NiFe2O4 Spinel. J. Phys. Condens. Matter 2002, 14, 3221. [Google Scholar] [CrossRef]
  69. Elliott, S.R. A.c. Conduction in Amorphous Chalcogenide and Pnictide Semiconductors. Adv. Phys. 1987, 36, 135–217. [Google Scholar] [CrossRef]
  70. Karmakar, S.; Behera, D. Non-Overlapping Small Polaron Tunneling Conduction Coupled Dielectric Relaxation in Weak Ferromagnetic NiAl2O4. J. Phys. Condens. Matter 2019, 31, 245701. [Google Scholar] [CrossRef] [PubMed]
  71. Long, A.R. Frequency-Dependent Loss in Amorphous Semiconductors. Adv. Phys. 1982, 31, 553–637. [Google Scholar] [CrossRef]
  72. Yadav, A.; Jha, P.A.; Jha, P.K.; Jha, N.; Singh, P. Overlapping Large Polaron Tunnelling in Lanthanum Silicate Oxyapatite. J. Phys. Condens. Matter 2023, 35, 95702. [Google Scholar] [CrossRef]
  73. Sahu, S.; Dobbidi, P. Unlocking the Impact of Layer Configuration on Dielectric Relaxation and Conduction Mechanisms in Bilayer Ni0.5Co0.5Fe2O4/BaTiO3 and BaTiO3/Ni0.5Co0.5Fe2O4 Multiferroic Films. Appl. Surf. Sci. 2026, 715, 164591. [Google Scholar] [CrossRef]
  74. Ghosh, A. Frequency-Dependent Conductivity in Bismuth-Vanadate Glassy Semiconductors. Phys. Rev. B 1990, 41, 1479–1488. [Google Scholar] [CrossRef]
  75. Karoui, S.; Kamoun, S. Study of Dielectric Relaxation and Polaron Conductivity Mechanism in Sodium Nitroprusside (SNP): Na2[Fe(CN)5(NO)]·2H2O. Phys. E Low-dimensional Syst. Nanostructures 2021, 132, 114771. [Google Scholar] [CrossRef]
  76. Lisenkov, S.; Ladera, A.; Ponomareva, I. Ba(Ti_1-x,Zr_x)O3 Relaxors: Dynamic Ferroelectrics in the Gigahertz Frequency Range. Phys. Rev. B 2020, 102, 224109. [Google Scholar] [CrossRef]
  77. Meena, R.; Dhaka, R.S. Dielectric Properties and Impedance Spectroscopy of NASICON Type Na3Zr2Si2PO12. Ceram. Int. 2022, 48, 35150–35159. [Google Scholar] [CrossRef]
  78. Chun, J.; Heo, J.; Lee, K.; Ye, B.U.; Kang, B.S.; Yoon, S.-H. Thermal Activation Energy on Electrical Degradation Process in BaTiO3 Based Multilayer Ceramic Capacitors for Lifetime Reliability. Sci. Rep. 2024, 14, 616. [Google Scholar] [CrossRef]
Figure 1. Scanning electron micrographs of the cross-sections of the samples (a) SCB-16, (b) SCB-25, and (c) SCB-28 with the measured thickness of the CoFe2O4 and BaTiO3 layers.
Preprints 188023 g001
Figure 2. X-ray diffractograms of the bilayer samples STCB-16, STCB-25, and SCB-28 are shown in (a). An enlargement of (a) is displayed in (b), focusing on the 2θ region between 42° and 46°. The vertical lines mark the peak positions of the cubic CoFe2O4 and tetragonal BaTiO3 phases. In (c), the lattice parameters of the BaTiO3 layer (left axis) and the c/a ratio (right axis) are shown. The bulk lattice parameter values, a = 3.992 Å and c = 4.036 Å, were taken from reference [36].
Preprints 188023 g002
Figure 3. Energy-dispersive X-ray spectrograms of the samples STCB-16 and STCB-25.
Preprints 188023 g003
Figure 4. Experimental setup for the polarized second harmonic generation. PBS - Polarized beam splitter; λ/2 - half-waveplate.
Preprints 188023 g004
Figure 5. Second harmonic generation (SHG) signal for a) STCB-25 sample. Data acquired for a fundamental average power of 50 mW (corresponding to 660 pJ/pulse) and an integration time of 60. In b) is the polar plot for the STCB-28 sample SHG signal as a function of the fundamental beam polarization orientation. In blue is the experimental data. In red, the fitted model. In green, the same model but with different values chosen for the second-order nonlinear coefficients.
Preprints 188023 g005
Figure 6. Frequency dependence of the real components of the electric permittivity of the samples (a) STCB-16, (b) STCB-25, and (c) STCB-28. The red lines are fits with the model of Equation 5.
Preprints 188023 g006
Figure 7. Frequency dependence of the Imaginary components of the electric permittivity of the samples (a) STCB-16, (b) STCB-25, and (c) STCB-28. The red lines are fits with Equation 5.
Preprints 188023 g007
Figure 8. Nyquist plots of the permittivity at temperatures between 18 °C and 200 °C for the samples (a) STCB-16, (b) STCB-25, and (c) STCB-28. The red lines are fits with Equation 5.
Preprints 188023 g008
Figure 9. Logarithm of the conductivity times temperature as a function of the inverse of temperature, with the corresponding linear fits, for samples (a) STCB-16, (b) STCB-25, and (c) STCB-28.
Preprints 188023 g009
Figure 10. Logarithm of the AC conductivity as a function of angular frequency, for different temperatures, along with the corresponding fits with Equation 8, for the samples (a) STCB-16, (b) STCB-25, and (c) STCB-28. The insets present the corresponding angular frequency-dependent AC conductivity, without the logarithmic scale.
Preprints 188023 g010aPreprints 188023 g010b
Figure 11. Logarithm of the onset frequencies a) ω p 1 and b) ω p 2 as a function of the inverse of temperature, with the corresponding linear fits, for the samples STCB-16, STCB-25, and STCB-28.
Preprints 188023 g011aPreprints 188023 g011b
Figure 12. Temperature dependence of the exponent n for the samples a) STCB-16, b) STCB-28, and c) STCB-25. The red lines are fits with the NSTP (STCB-16 and STCB-28) and QMT and CBH (STCB-25) models described in the main text.
Preprints 188023 g012
Table 1. Pulsed laser-ablation deposition conditions used for each layer. Parameters are abbreviated as follows: oxygen atmosphere pressure (P); pulse frequency (f); target-substrate distance (d); and substrate temperature (T).
Material P (mbar) f (Hz) d (cm) T (°C)
CoFe2O4 0.1 10 3.5 650
BaTiO3 0.03 5 5.0 700
Table 2. Thickness of the layers, determined from the scanning electron micrographs of the sample cross-sections in Figure 1, lattice parameters of the CoFe2O4 layer in the samples, and the grain sizes of the CoFe2O4 and BaTiO3 layers.
Sample Thickness
CoFe2O4 (nm)
Thickness
BaTiO3 (nm)
Latt. Param. CoFe2O4 (Å) Grain Size CoFe2O4 (nm) Grain Size
BaTiO3 (nm)
STCB-16 72 160 8.377 32 32
STCB-25 82 246 8.391 32 30
STCB-28 79 280 8.386 28 33
Table 3. Activation energies Eσ obtained from the conductivity fits in the low-temperature (LT) and high-temperature (HT) regions around the characteristic temperature TC, at which there is a change in the conductivity behavior.
Sample Eσ
LT (eV)
Eσ
HT (eV)
TC
(°C)
STCB-16 0.13 0.68 95
STCB-25 0.22 0.63 110
STCB-28 0.47 0.98 135
Table 4. WH is the activation energy in the non-overlapping small polaron tunneling (NSPT) model, W is the effective barrier height in correlated barrier hopping transport (CBH) model. τ0 is the relaxation time. R is the tunneling distance in the NSPT model (RT) and in the quantum mechanical tunneling (QMT) mechanism (Rω ). N(EF) is the density of states at the Fermi energy.
Sample WH (eV)
NSTP
τ0 (s)
NSTP
N(EF) (eV-1cm-3) NSTP RT (Å)
NSPT
τ0 (s)
QMT
N(EF) (eV-1cm-3) QMT Rω (Å)
QMT
W (eV)
CBH
STCB-16 0.27 7.0×10⁻¹² 2.00×1024 7.3
STCB-25 8.3×10⁻¹³ 1.14×10²² 4.2 1.39
STCB-28 0.35 1.4×10⁻⁸ 3.25×1025 1.2
Disclaimer/Publisher’s Note: The statements, opinions and data contained in all publications are solely those of the individual author(s) and contributor(s) and not of MDPI and/or the editor(s). MDPI and/or the editor(s) disclaim responsibility for any injury to people or property resulting from any ideas, methods, instructions or products referred to in the content.
Copyright: This open access article is published under a Creative Commons CC BY 4.0 license, which permit the free download, distribution, and reuse, provided that the author and preprint are cited in any reuse.
Prerpints.org logo

Preprints.org is a free preprint server supported by MDPI in Basel, Switzerland.

Subscribe

Disclaimer

Terms of Use

Privacy Policy

Privacy Settings

© 2026 MDPI (Basel, Switzerland) unless otherwise stated