
Submitted:
03 December 2025
Posted:
04 December 2025
You are already at the latest version
Abstract
In 2023-2025, a research named “Application of nuclear, seismic and infrasound methods for assessing climate change and mitigating the effects of climate change” was conducted in Kazakhstan under the Targeted Funding Program. The main task of the research was to create an observation network for processes occurring in the glaciers of the high Tien Shan. Seismic and infrasound methods were used for signal recording, and meteorological data was additionally used for the analysis. A network of seismic, infrasound and meteorological stations has been installed near the large glaciers of Tien Shan in Kazakhstan. The paper presents the results of the recorded data in terms of seismic and infrasound noise levels, its daily variations, and the relationship between noise and changes in temperature and wind speed. The threshold of the expected minimal magnitude and energy classes of glacial earthquakes for day and night was assessed. Seismic and infrasound monitoring has proven to be a reliable, all-season and all-weather tool for monitoring the dynamics of glacial processes. Among huge number of recorded glacial events, more than 4,000 have been located, and a seismic bulletin that includes information on location, magnitude and energy class of each even has been compiled.
Keywords:
glacier
; earthquake
; seismic station
; infrasound
; wind
; magnitude
; Data Centre
1. Introduction
The present work is devoted to cryoseismological research in the high Tian Shan glacier zone, which is new for Kazakhstan and Central Asia. The research was conducted between 2023 and 2025 as part of the IRN BR 21881915 Targeted Funding Program (TFP) “Application of nuclear, seismic and infrasound methods for assessing climate change and mitigating the effects of climate change” by the National Nuclear Centre of the Republic of Kazakhstan. The main task was to create a special network of multi-parameter observations for glacial processes and to obtain experimental seismic and infrasound data as a result of joint processing of data from field and permanent stations of the National Nuclear Centre (NNC) network of the Republic of Kazakhstan. It was necessary to study the capabilities of such a system as a tool for monitoring the dynamics of glacial processes. The results of the assessment of the capabilities of the created system for monitoring glacial seismic activity are presented, seismic and infrasound noise and its connection with meteorological and other factors are studied, and estimates of the representative magnitude and energy class of recorded glacial earthquakes are calculated.
In recent years, due to the great interest in global warming and its impact on the climate, active research of glaciers has begun both in the Arctic zone and in mountainous regions on the continents. A detailed review of global and local sources on the study of seismic processes in glaciers under the influence of climate change is given in work [1]. It shows that the worldwide interest in cryoseismological research increased in 2016 after the discovery of glacial earthquakes by Ekström et al. [2,3]. The results of subsequent studies by various scientists have shown that changes in daily air temperature generate glacial seismicity. The crevasses and cracks appearing in the ice are fundamental components of the mass balance of glaciers; they serve as pathways for meltwater into the glacial water-bearing system and provide a huge amount of latent heat into glaciers. This causes shifts in the glacial mass and its movement that can be recorded by seismic methods. The arrangement of long-term continuous monitoring will make it possible to assess and predict changes in the dynamics of glacial processes as a result of global climate change.
Why is this issue so important and relevant for Kazakhstan? Let us refer to the data published in a new report by an international organization (IKI global programme) [4], published in 2025. It is very important for Kazakhstan to have a comprehensive understanding of the risks associated with water. Water is a key resource and the basis for the social and economic stability of key economic sectors, including agriculture, industry and energy production. Kazakhstan is experiencing a significant impact from climate change as it influences on its environmental and social and economic landscape.
Over the past six decades, the average annual temperature in Kazakhstan has risen by 0.3 °C per decade. Forecasts indicate a further increase in average annual temperatures. These temperature changes are accompanied by changes in precipitation patterns, exacerbating water-related risks in Kazakhstan, a country that already struggles with water scarcity and uneven distribution of water resources. The water situation in the country is further aggravated by the melting of glaciers in the Tien Shan mountains. In 2020, Kazakhstan experienced record high temperatures, exceeding the climatic norm by 1.92 °C, which surpassed the previous record in 2013 of 1.89 °C. Glaciers in the Tien Shan and Pamir mountains are melting at an accelerated rate. These are sources of water for major rivers such as the Amu Darya and Syr Darya. These changes have contributed to an increase in natural disasters such as droughts, floods, mudflows and landslides, leading to land degradation, damage to infrastructure and loss of life. We are witnessing the gradual disappearance of glaciers in the mountains of the Northern Tien Shan, for example, near Almaty city in Kazakhstan. The water demand for agriculture needs is predicted to increase. This is despite the fact that the productivity of irrigation water in Kazakhstan is 6-8 times lower than in other countries.
Temperature rise have led to more frequent and intense heat waves across the country, especially in the south, south-west and west regions. This has affected precipitation patterns, water resources and agriculture. The warming trend will, probably, exacerbate the existing problems. Long-term water availability will decline due to the continuing retreat of glaciers and reduction of snow cover in mountainous areas. Measures to adapt to climate change need to be developed. Water resource monitoring systems are being introduced. The set of measures may also include the creation of monitoring and warning systems on glacier dynamics based on multi-parameter monitoring of glacial earthquakes.
2. Materials and Methods
To study the glacial earthquakes, the region of high Tien Shan where the borders of three countries – Kazakhstan, Kyrgyzstan, and China converge, was chosen. This area contains the main large-scale glaciers of the high mountainous part of the Tien Shan. The highest mountain peaks of the Tien Shan are located here: Khan Tengri Peak (7,010 m), and Pobeda Peak (7,439 m). This area is known to seismologists as seismically active. All recorded earthquakes are up to 60 km depth, i.e., its epicenters are located in the Earth’s crust. The largest known earthquake in this area occurred in 1716 in China and had a magnitude of M = 7.5. However, no large earthquakes were recorded within the glacier zone. Figure 1 shows an overview map of the of the high-mountain Tien Shan glaciers research area.
A detailed study of the seismicity in this zone was planned, as well as determination of the epicenter field structure and seismic mode. Probably, the seismic activity of this zone could be an indicator of glacier destruction as a result of climate change. The main research tool will be a network of seismic, infrasound and meteorological monitoring stations.
Site selection for instruments installation and arrangement of observation using field network stations
To start the cryoseismological monitoring of the selected area, first it was necessary to carry out reconnaissance studies to select sites for three observation stations installation. This work was carried out from the end of 2023. The sites were selected based on a set of criteria. On the one hand, the stations had to be located as close as possible to glaciers located on the territory of the Republic of Kazakhstan. On the other hand, it was necessary to follow the safety measures to protect the equipment from vandalism, thus the opportunity of placing the stations on private land was assessed. The sites for the stations’ installation must be characterized by low level of seismic noise (both natural and man-made), the presence of dense ground, the absence of swampy or water-saturated soil, and areas affected by tectonic faults. The Kazakhstan National Data Centre (KNDC) analyzed the initial reconnaissance data and studied the comparative possibilities of installing stations in different locations for an extended period. The results were summarized as follows. Seismic stations at all three selected sites are sensitive to events generated by glaciers. No infrasound events associated with glacial earthquakes were detected. Negotiations were held and agreements were concluded with security guards and landowners.
The sites for three stations were selected:
- Karkara (KRK) is located 400 m away from Karkara-Tyup highway, 180 m away from the winter camp. The selected site is the lower part of the south-eastern slope of gentle hills range formed by Neogene deposits (Figure 2, Table 1).
- Bayankol (BNK) is located in the Bayankol Gorge, Akkol area. The site is a small intermountain valley where two mountain gorges converge. In the northern part of the valley, filled with loose sediments, there is a gentle elevation, like a remnant with fragments and outcrops of coarse-grained quartz-feldspar granites (Figure 2, Table 1);
- Shynybek (SHN) is located 200 m northeast of the winter camp. The selected site consists of Neogene sedimentary deposits; no bedrock outcrops were found. The soil consists of dense greyish-brown clay, at a depth of 0.5 m, there is a heavily gypsum-rich clayey-gravelly weathering crust of greyish-yellowish color with large, up to 20 cm, angular fragments of gypsum-rich tuffs of mixed composition and dark grey color (Figure 2, Table 1).
The seismic equipment set, consisting of a DR 4040 recorder, a CMG 40T seismometer, a CMG 5T accelerometer, and an electronic thermometer additionally installed at each station, has been installed at all three stations since the time of installation. Unfortunately, the insufficient amount of available equipment did not allow us to install microbarometers for recording infrasound signals at all stations from the beginning of the observations. At the beginning, there was only one MB 2005 microbarometer at our disposal, but later a second MB 3a microbarometer was purchased and installed. During the course of the work, one GMX weather station was purchased; it was moved sequentially between stations to study wind roses, weather conditions and the potential for recording infrasound signals generated by the high-mountain glaciers of the Tien Shan.
Figure 3 shows a diagram of the field stations operation period and its equipment to study seismic, infrasound, and meteorological parameters. The diagram shows the periods and stations at which comprehensive studies of seismic, infrasound and meteorological data are possible.
Before installing the equipment at all stations, some preparatory work was carried out by KNDC: diagnostics of the equipment, testing of a complete set of seismic stations consisting of a DR 4040 digitizer, a GURALP CMG 40T seismometer, a CMG 5T accelerometer, microbarometers, and a weather station. The following parameters were set for recording seismic oscillations:
- Sample rate – 100 sample/sec.
- Amplification – 1.
- Recording parameter – ground oscillation velocity (nm/s), acceleration of ground oscillations (nm/s2).
- Recording format – CSS3.0
Upon completion of the preparation work (site selection, equipment preparation, coordination with local executive bodies, border service, forestry), the work on recording equipment installation was carried out, including the preparation of seismic vaults, pedestals, fences, and the equipment run.
Figure 4 shows photographs of the installation of the autonomous power supply system, protective fencing, and a set of seismic recording equipment. The installation of infrasound stations at an altitude of over 1000 m above sea level required changes to the sensitive settings of the MB 2005 microbarometer. The microbarometer housing was opened to access the adjustable elements, and the system was adjusted under the control of a multimeter. Thus, the microbarometer was adjusted to operate under the atmospheric pressure conditions of a specific site while maintaining the dynamic range specified by the manufacturer.
To suppress noise of the MB 2005 microbarometer, a noise suppression system consisting of four orthogonal beams, each 6 m long, made of plastic tubes with air intakes at the ends in the form of funnels with fine-mesh metal screens inside to prevent small insects from entering the system was installed. The microbarometer itself, with the noise reduction system connected, was installed in a prepared pit, covered with a thermal box, a shield with a protective film, and covered with soil.
The stages of preparation, adjustment and installation of the microbarometer are shown in Figure 5.
Station maintenance and data collection were carried out monthly throughout the year. Even during the winter period, there were no failures in station maintenance and data collection. In this regard, it can be stated that seismic and infrasound monitoring is a reliable, stable, year-round and all-weather monitoring for glacial processes dynamics.
In 2025, data from the Merzbacher permanent station [5,6], installed in 2009 near Merzbacher Lake at the junction of the North and South Engilchek glaciers at an altitude of 3,304 meters above sea level, was added to the network data of three field stations in the near zone. The seismic station is only one element of the comprehensive high-mountain geoscience station of Gottfried Merzbacher, established by the Central Asian Institute for Earth Studies (CAIES) in collaboration with the German Helmholtz Centre for Geosciences (GFZ), Potsdam. The station is located in close proximity to the glacier. It is a three-component MRZ1 seismic station, equipped with GEOFON broadband seismometers (GEOFON, 2020), installed in a 2-metre-deep bunker. The sampling frequency is 20 samples per second. For reference: at the base of the Gottfried Merzbacher geoscience station, the CAIES, together with the GFZ, carried out the work on sounding, seismic and glacial monitoring of the Engilchek glacier in the upper reaches of the Sary-Jaz river basin. Airborne radar measurements have determined that the thickness of the Engilchek glacier in the area of Merzbacher Lake is 375 m. In total, the thickness of the glacier mass varies in this area from 250 m to 350 m. The Engilchek Glacier has a layered structure, with the upper layer 44-66 m thick, the middle layer 25-60 m thick, and the lower layer is 60-250 m thick [4]. According to radio probe measurements, the thickness of the South Engilchek glacier varies between 350 and 400 m. [6].
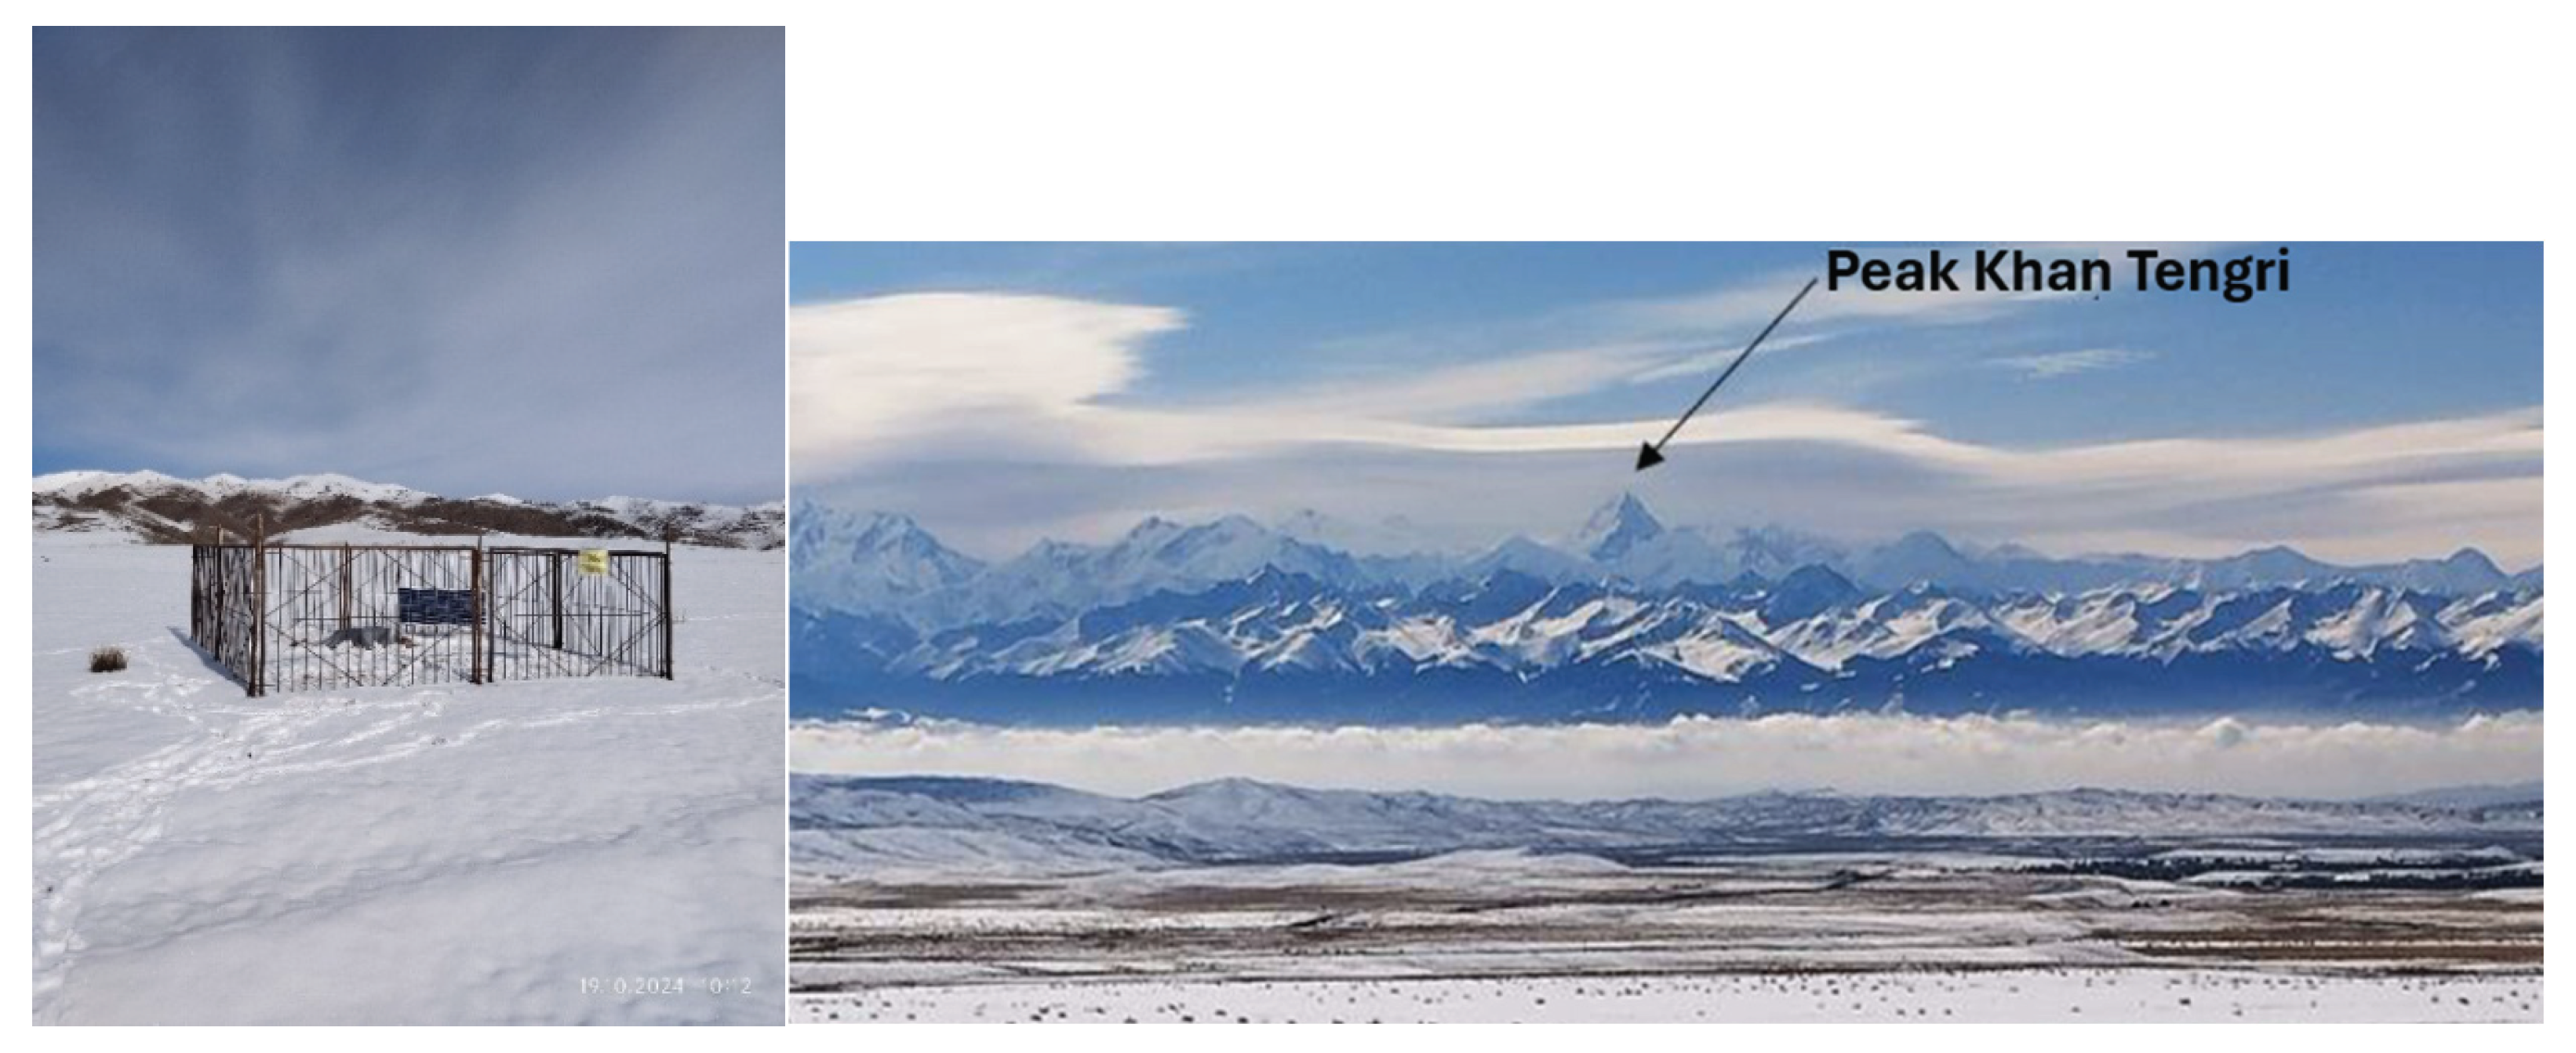
Figure 6.
Winter view of Shynybek station and view from the station to Khan Tengri Peak.
In 2025, data from the Merzbacher permanent station [5,6], installed in 2009 near Merzbacher Lake at the junction of the North and South Engilchek glaciers at an altitude of 3,304 meters above sea level, was added to the network data of three field stations in the near zone. The seismic station is only one element of the comprehensive high-mountain geoscience station of Gottfried Merzbacher, established by the Central Asian Institute for Earth Studies (CAIES) in collaboration with the German Helmholtz Centre for Geosciences (GFZ), Potsdam. The station is located in close proximity to the glacier. It is a three-component MRZ1 seismic station, equipped with GEOFON broadband seismometers (GEOFON, 2020), installed in a 2-metre-deep bunker. The sampling frequency is 20 samples per second. For reference: at the base of the Gottfried Merzbacher geoscience station, the CAIES, together with the GFZ, carried out the work on sounding, seismic and glacial monitoring of the Engilchek glacier in the upper reaches of the Sary-Jaz river basin. Airborne radar measurements have determined that the thickness of the Engilchek glacier in the area of Merzbacher Lake is 375 m. In total, the thickness of the glacier mass varies in this area from 250 m to 350 m. The Engilchek Glacier has a layered structure, with the upper layer 44-66 m thick, the middle layer 25-60 m thick, and the lower layer is 60-250 m thick [4]. According to radio probe measurements, the thickness of the South Engilchek glacier varies between 350 and 400 m. [6].
According to [6], “the data from the Merzbacher stations are freely available for use in environmental research and the provision of public information services, such as hydrometeorological services, as well as to support information-based decision-making, particularly in the areas of water and land resource management and climate change adaptation.” Files from the station are transmitted directly to the open-access Sensor Data Storage System (SDSS) developed and hosted by the CAIES in Bishkek, Kyrgyzstan, and thus become immediately available to the public. Based on the existing Memorandum between our organization and CAIES, while carrying out work on the Targeted Funding Program related to the study of the climate impact on glacial processes, we were given access to the server with data from the Merzbacher seismological station.
The MRZ station data were included into the common database and connected to joint processing with data from three field stations of the IGR NNC RK and two permanent stations in this area – Podgornoye, and Shalkode. Thus, the monitoring network in the zone close to the glaciers included six seismological stations. Additionally, remote data from the Makanchi seismic array, located more than 500 km from the glaciers, was used for analysis.
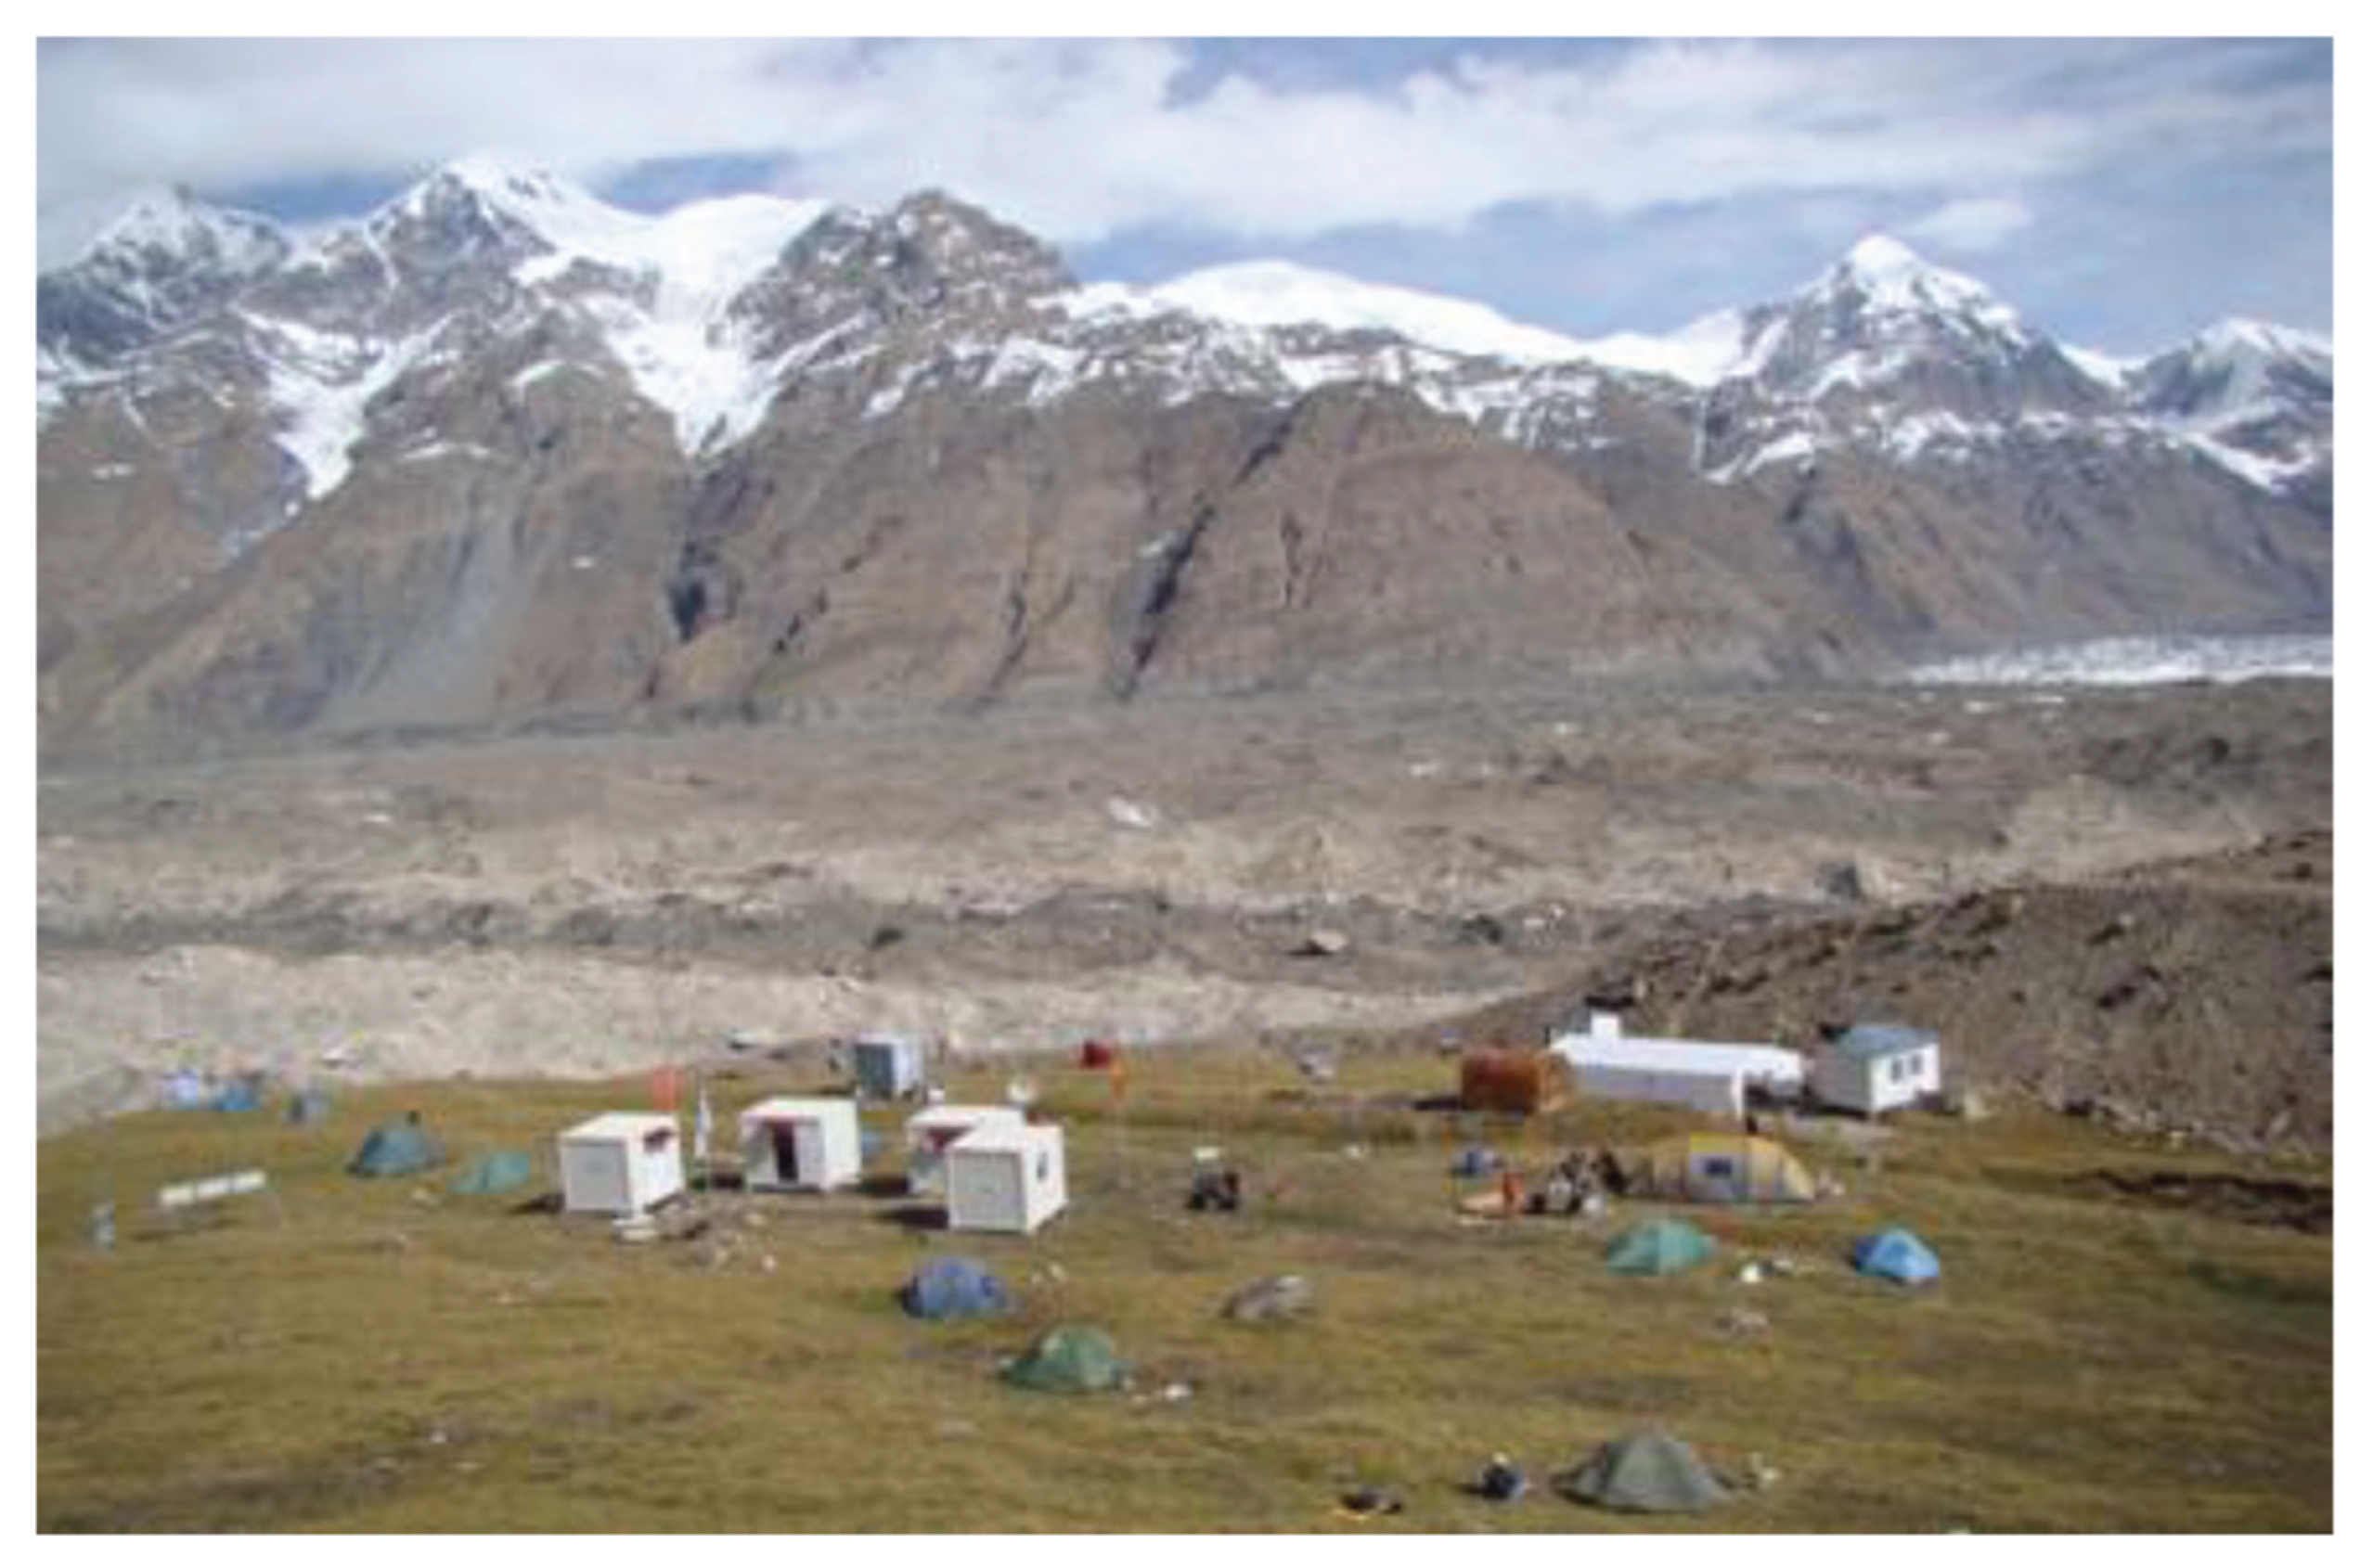
Figure 7.
Gottfried Merzbacher’s high-mountain research station installed on the Engilchek Glacier (absolute value 3600 m) [5].
Figure 7.
Gottfried Merzbacher’s high-mountain research station installed on the Engilchek Glacier (absolute value 3600 m) [5].
3. Results
3.1. Analysis of Seismic Network Sensitivity for Observing Glacial Earthquakes and Factors Affecting Its Variations
When all stations were put into operation, the capability of the network to record glacial seismic events was studied, the predicted representative energy level of recorded events were calculated, and variations of the monitoring sensitivity of stations were assessed. A similar analysis was conducted separately for seismic and infrasound stations.
Seismic data from glacial processes were analyzed using the following stations: three field stations of the NNC RK (Table 1), permanent stations – Pogronoye (PDGK) of KZ NNC RK network, and Shalkode (SHLS) of QZ network (SNECCA Project, the operator is NRCSOR), and one permanent station located directly at the glacial zone – Merzbacher of CAIES [6]. Data from the entire seismic network is transmitted to the KNDC in Almaty via various channels (satellite, internet, delivered by engineers) and converted into a single database for processing (Figure 8 and Figure 9).
Figure 9 shows a chart of data acquisition process in KNDC, Almaty.
The values of approximate distance to the glacial events concentration zone are shown in Table 2.
3.2. Seismic Noise and Its Variation
Seismic noise was analyzed for all six stations installed in the near zone. The calculation method used is described in [7]. The analysis was done by steps:
- selection of recording segments for the same periods of time for day (6-7 a.m. GMT) and night (4-5 p.m. GMT). The segments were 10 minutes long, and records without events were selected, with 10 segments separately for day and night;
- calculation of the spectral characteristics of noise for each station, for each component, separately for daytime and night-time periods;
- calculation of average (median) spectral curves (noise models) for each station, each component, for day and night; - comparison of results with Peterson’s global noise models [8] and between data from all stations in the near zone.
Below are summary graphs of the spectral power density of seismic noise for all stations for night time (Figure 10). The black lines show the standard high-level and low-level seismic noise curves (High Noise Model and Low Noise Model) according to Peterson [7] that allow the noise level to be assessed relative to global models.
A comparison of daytime and night-time noise level shows a clear pattern in noise variations throughout the day. The daytime noise level is higher than the night-time level at frequencies above 5 Hz at all stations except the Merzbacher station. The Merzbacher station also has the lowest noise level (Figure 11). However, a slight increase in daytime noise is noticeable at this station at frequencies close to 1 Hz. A low noise level is also observed at the Podgornoye station. The equipment at these two permanent stations is installed in bunkers on a rock foundation. However, the equipment at the field stations is installed in seismic vaults of 40-50 cm depth.
Figure 12 shows seismograms from field stations for one day, Z components. The station traces in the Figure are arranged from top to bottom according to their distance from the glacial zone (60 km Bayankol, 75 km Shynybek, 135 km Karkara).
The analysis of diurnal seismic records from three field stations clearly shows, even without any processing, a difference in seismic noise levels between day and night hours. Approximately at 13-14 hours GMT (18-19 hours local time), the noise level changes significantly: it becomes lower (the width of the dark part of the vibration trace narrows). This effect is more pronounced at the Shynybek and Karkara stations and less at the Bayankol station. The vertical lines on all traces are glacial seismic events, the exact number of which cannot be calculated. The number of seismic events decreases with distance from the glaciers.
Figure 12 shows the similar diurnal seismic oscillations from Merzbacher station. The almost complete absence of visible daily variations in seismic noise is noteworthy. The width of the “dark” band remains almost unchanged throughout the day.
The possible reason is significantly different locations of the stations and different conditions of the equipment installation. Seismic noise level at field stations is affected by increased general noise from transport, operation of various devices, and agricultural activity in villages during daylight hours, which is completely absent at the altitude of the Merzbacher station (3304 m). In addition, at the Merzbacher station, the equipment is installed in a 2 m bunker, while at other stations, the equipment is installed in seismic vaults of 40-50 cm depth. This excludes the influence of wind interference on the seismic noise level.
The data analysis also showed the noticeable increase in glacial events number after 15:00 GMT (evening and night local time). This phenomenon is also confirmed by the results of all network data processing: the diurnal number of glacial earthquakes clearly depends on temperature change.
In cases when actual physical characteristics of the oscillations are known from seismic noise recordings, the minimum expected magnitudes and energy classes of glacial earthquakes can be estimated upon detection. The following well-founded assumptions were used. It was assumed that the amplitude of the signal in P-waves should exceed the amplitude of seismic noise by three times, and the amplitude of S-waves should be approximately twice the amplitude of P-waves. Figure 13 shows the waveforms for all stations in the near zone. However, all stations of the IGR NNC RK network record velocity, while the Merzbacher CAIES station records ground displacement.
Formulas for estimating the regional magnitude mpv [9] and energy class K [10] for Tien Shan earthquakes were used for the calculations. Since significant variations in oscillations during the day have been established, the calculations were performed for day and night. The night records show the smaller earthquakes clearer than the day time records due to the noise variations.
The energy class is calculated using the formula K = 1.8⋅log10 (Ap+As) + Ω(Δ,km), where Ap and As are the maximum amplitudes of longitudinal and transverse seismic waves measured in microns on the SKM channel, Ω is a calibration function describing the attenuation of seismic waves, depending on the epicentral distance. Magnitude mpv = log10(Ap/T)+σ(Δ,km). Ap and T are the amplitude and corresponding period in the displacements of the longitudinal wave of ground vibrations, σ(Δ,km) is the calibration function for Ap/T describing the attenuation of the vibration velocity depending on the epicentral distances. Note that for the Merzbacher station, it is not necessary to convert from velocities to ground displacements when calculating using these formulas, since we had displacement records as input.
The obtained results of predicted sensitivity of the established monitoring network are shown in Table 3 and Table 4.
The analysis of seismic noise records from all stations installed in the near zone allow assuming that the network is capable to detect and locate glacial events of mpv ~2-2.5 and energy class of 5-6.
3.3. Analysis of Meteorological, Infrasound, and Seismic Data
For meteorological observations at the Bayankol (BNK), Karkara (KRK) and Shynybek (SHN) stations, a compact “Gill Maximet GMX 500” weather station able to record five basic parameters was used:
1. Wind speed (LWS), measurement unit – m/s.
2. Wind direction (LWD), measurement unit – ⁰ northward.
3. Temperature (LKO), measurement unit – ⁰С.
4. Relative humidity (LIO), measurement unit – %.
5. Atmospheric pressure (LDO), measurement unit – mm Hg.
Based on meteorological data, wind roses, daily and seasonal changes in wind speed were studied for each station. The results of the meteorological data analysis are shown by the example of the Bayankol (BNK) station. Examination of the combined graphs of wind direction and speed allowed determining regular periodic changes in wind direction, characterized by relative stability in the evening and night-time periods. In most cases, changes in wind direction coincide with an increase in wind speed. The prevailing wind speed ranges from 0.3 to 1.5 m/s, with an increase to 9.6 m/s during changes in direction. This analysis was performed every ten days during the entire observation period.
Then, the wind rose diagrams were constructed and analyzed for the Bayankol (BNK) station. The diagrams are divided into 16 sectors, each covering a direction equal to 22.5°. The prevailing wind direction, for example, in December 2024, is 180–202.5°, followed in intensity by 202.5–225° and 157.5–180°. There is almost no wind from the direction 315–45° to the area of glacial seismicity.
Figure 14 schematically shows the wind direction relative to the station location. Long bold arrows indicate the direction during the night breeze, long thin arrows indicate the wind direction during the daytime breeze, and short thin arrows indicate a light wind during the change of main directions. The background of the figure is a satellite image.
The Figure shows that the prevailing wind direction coincides with the direction of the Akkol Gorge, where the station is located. The azimuth of the Akkol Gorge is 195°, which is consistent with the wind rose diagram. The azimuth of the Bayankol Gorge that adjoins the Akkol Gorge, is 120° at the point of junction, with a further change in azimuth to 355° in a northerly direction and subsequent exit into the foothill valley (not all of the area is shown in the figure).
Basing on the results of the wind regime analysis at the station’s site over the year, the following can be stated:
- In general, the wind regime is relatively stable and predictable, except for periods when there are sudden changes in weather conditions (cyclones, anticyclones, etc.);
- The main direction of air mass movement in the surface layer during night and day breezes coincides with the direction of the gorge.
- Wind speed is mainly within the range of 2–4 meters per second, increasing to 8–10 meters per second during the transition from night breeze to day breeze, with gusts of up to 16 meters per second.
- The daily cycle is roughly as follows: from 4 p.m. to 7:30 a.m. local time the next day (evening, night and early morning), air masses move down along the Akkol Gorge, exiting into the Bayankol Gorge and further into the foothill valley. These are descending flows of air cooled overnight. Then, from 7:30 to 10:00, there is a temporary сфдь, during which the wind direction changes. From 10:00 to 14:00, the air warmed in the valley begins to rise into the mountains, the wind speed increases, and the direction changes to almost the opposite. From 14:00 to 16:00, calm returns, the wind changes speed and direction, and the cycle repeats;
- During sudden weather change (cyclone, anticyclone), the direction and speed of the wind change chaotically;
- There is practically no wind from the north-west and north directions, as there is a dead-end gorge in this direction that only leads to the Akkol Gorge.
A comparison of wind diagrams from all field stations shows that the main direction of surface winds at the Karkara and Bayankol stations is almost perpendicular to the direction of the research object, which makes it unlikely that infrasound signals generated by the glaciers of the central Tien Shan Mountains will be detected. The main wind direction at the Shynybek station not only corresponds well with the direction of the glaciers, but also covers almost the entire area of the high-mountainous Tien Shan. Thus, most probably, the Shynybek station will detect infrasound signals from glacial phenomena not only reflected from the stratosphere, but also directly from glaciers, compared to the Karkara and Bayankol stations.
The analysis of infrasound stations records revealed very intense fluctuations throughout each day. Detailed examination of combined infrasound and meteorological data revealed patterns in the periodicity of acoustic noise. Figure 15 shows a three-day record of microbarometer signals (Bayankol station). The recording began at 00:00 on 30 May 2024 and ended at 23:59 on 1 June 2024 (GMT). The upper trace is the microbarometer record, and the lower trace is the recording from the temperature sensor installed at the same site.
Figure 15 shows that the onset of intense acoustic noise clearly correlates with the air temperature increase at the microbarometer installation site. The time from the temperature rise beginning to the appearance of intense acoustic noise is about two and a half to three hours. The duration of intense acoustic noise is, on average, about nine and a half to eleven hours per day. The average background noise level at night is about 18 mV, and during the day it is 570 mV.
This pattern is observed daily throughout the entire observation period complicating significantly the detection of infrasound events during the daytime against the background of interference. The time of the temperature increase beginning, the strengthening in wind speed, and the time of strong infrasound interference and its duration on the microbarometer records are completely synchronized. Thus, it can be concluded that the increase of the acoustic interference intensity on the microbarometer records is a consequence of meteorological parameters change at the equipment installation site.
Figure 16 and Figure 17, represented below, show that the time of wind speed increase and the time of start and duration of intensive infrasound noise are completely synchronous on the microbarometer records.
Figure 18 shows a summary graph of temporal changes by a set of data from a multi-parameter system. Three components of seismic station records, temperature records, and infrasound station records are shown.
There is a correlation between the occurrence of infrasound and seismic noise and daily temperature changes. For infrasound vibrations, this correlation occurs due to the changes in wind parameters as a result of daily temperature increase; for seismic vibrations, the temperature increase after sunrise determines the overall level of cultural interference increase due to human activity at the station’s location area, increased traffic on the roads, the start of agricultural work in the fields, etc. The wind impact on the field stations equipment installed in seismic vaults also cannot be denied.
Basing on the conducted analysis, an important methodological conclusion was made regarding the detectability of infrasound signals from glaciers: the most promising station for its detection is Shynybek that is characterized by the wind direction directly from the zone of glacial earthquakes. The infrasound signals are better to be searched outside the period of intense daytime noise associated with temperature and wind changes. This period can be predicted quite accurately.
As the number of the infrasound stations used (1 and later 2) did not allow analyzing its data as array and apply, for example, the PMCC technique [11], the azimuth of signal arrival and apparent velocity, all further processing of infrasound data was based on the association of infrasound signals with data from the seismic bulletin of glacial earthquakes. For further monitoring of glaciers, it is recommended to install an infrasound array consisting of at least three microbarometers and apply infrasound wave path modelling to select the best site for infrasound recording.
During the glacial seismicity monitoring network operation, more than 4,000 seismic events have been recorded and processed at the Data Centre. A seismic bulletin has been compiled. A map of the located events epicenters is shown in Figure 19. Within the area of the large-scale glaciers of the High Tien Shan that has linear dimensions of more than 200 km, a zone of high seismic activity with clear boundaries and structure is clearly distinguished. The events with the minimum magnitude mpv were recorded by the Bayankol station – mpv=0.9. Events with mpv=2.0 were detected and located without omission. The analysis of the identified patterns of glacial seismic events is beyond the scope of this paper.
4. Discussion
1.The analysis of the earthquake catalogues compiled by permanent stations data in Kazakhstan has revealed a cluster of numerous small earthquakes in the border region of three neighboring countries: Kazakhstan, Kyrgyzstan, and China. In our work [12], we were the first to suggest that these events may be related to the glaciers of the Tien Shan. And this conclusion was made basing on data from a single permanent seismic array in Makanchi (the primary station of the International Monitoring System, IMS), located 550 km away from the glacier area under the study. For the analysis the PMCC technique [11] was used. In subsequent years, it was not possible to conduct a more detailed study of glacial seismicity in that area. Only in 2023-2025 there was a Targeted Funding Program (TFP) IRN BR 21881915 in Kazakhstan named “Application of nuclear, seismic and infrasound methods for assessing climate change and mitigating the effects of climate change”, one of the tasks was to monitor glaciers using seismic and infrasound stations. To implement the Program, it was necessary to arrange observations in the area close to the glaciers. The sites were selected, new stations were installed, and data acquisition and processing were established. A network of field seismic, infrasound and meteorological stations was created to monitor glacial seismicity. The network operation continues.
2. The data processing, creation of seismic bulletins and databases were carried out at the Data Centre of the Agency for Atomic Energy of the Republic of Kazakhstan in Almaty. Data from field stations and other permanent stations closest to this area were combined into a single database (a total of six stations within a range of 0 km to 150 km from the glaciers). The use of Merzbacher station data located directly in the glacier zone was of great importance. The data of this station allowed increasing the reliability of detection results and the accuracy of event source location.
3. Year-round operation of the network demonstrated stable performance of autonomous stations and almost no interruptions in recording. The integration of different observation technologies made it possible to identify the impact of various factors on recording and to understand the shortcomings of the system. Based on our experience, it can be stated that the multi-parameter system for seismic and infrasound monitoring is a reliable, stable, year-round, and all-weather tool that can be used for monitoring the dynamics of glacial processes. It should be noted that the seismic stations network, relative to the study area, is concentrated in a small azimuth range of less than 90 degrees. Our capabilities were limited, as observations were carried out from the territory of Kazakhstan only. If the forces with other bordering countries – Kyrgyzstan and China are joined to monitor glacial seismicity, this could improve the accuracy of event parameterization estimates and expand the range of methods used. When planning infrasound monitoring work, it is better to install not a single station, but an infrasound array consisting of 3-4 microbarometers, that will allow the recorded signals to be associated with the glacial zone based on its data. In our case, the search for infrasound recordings of glacial events was carried out only through association with seismic events based on the already compiled seismic bulletin.
4. A comprehensive analysis of data from three technologies – seismic, infrasound and meteorological allowed concluding that the system’s detectability of events in the glacial region was inconsistent over time. The study of the spectral characteristics of seismic noise, and joint consideration of meteorological and infrasound data provided a complete picture of the daily temporal variations in noise and interference at all stations and led to an important conclusion about the variable ability of the network to detect signals and the different recording level of minimum representative energies of glacial events at different times of the day and seasons of the year. At night, it is possible to record smaller earthquakes and there is a greater probability of recording infrasound signals than during the day. Calculations of the expected energy levels (magnitude and energy class) of recorded events from the glacial zone for individual stations and the network as a whole were performed based on experimental data on noise levels and formulas that take into account the attenuation of seismic waves.
5. The established in high Tien Shan observation network allowed obtaining a lot of experimental material that now can be used to study the regularities of glaciers seismic mode, the structure of the destruction area, and identifying the connection between the spatial distribution of seismic events and the relief, tectonics, and river network. The nature of the recorded events and its classification into types are yet to be studied. It can already be stated that some of the recorded seismic events are of glacial nature associated with cracking, break-offs and avalanches, the movement of glacial masses through gorges, and others are tectonic events occurring in the earth’s crust of this area.
5. Conclusions
This work is one of the first in Kazakhstan and Central Asia in the field of cryoseismology, to implement which a special observation network was installed. The problem of studying glaciers and the processes occurring in them is acute and relevant for the entire Central Asian region. It has been noted that glaciers in the Tien Shan and Pamir mountains are melting at an increased rate that can lead to an increase in natural disasters such as droughts, floods, mudflows and landslides resulted in land degradation, damage to infrastructure and loss of life. Glaciers are an indicator of climate change associated with global warming. Studying glacier processes is not only an important scientific issue. Research can lead to practical actions on arrangement of continuous monitoring and timely warnings on threats in order to reduce the risk of damage to settlements and people. It should be noted that, at the time of writing, on 25 October 2025, a huge glacier measuring 25 m high, 150-200 m wide and 2 km long broke away from the Ismoili Somoni ridge in Tajikistan, with frightening footage of its movement circulating on social and mass media. The enormous mass broke away from the main glacier and moved down the gorge, posing a direct threat to human life and the destruction of settlements in its path. Fortunately, according to the Tajikistan Emergency Committee, there were no casualties or damage. To study the glaciers of the Tien Shan and Pamir mountains, different countries need to work together to create monitoring systems to improve the ability to warn of glacier-related emergencies.
This research is funded by the Committee of Science of the Ministry of Science and Higher Education of the Republic of Kazakhstan (Grant No. BR21881915).
References
- Mikhailova, N.N.; Mukambaev, A.S.; Kazakov, E.N.; Morozov, V.G.; Igibaev, U.A. Analytical review of global and local sources on research of seismic processes in glaciers under the influence of climate change. Bulletin of the National Nuclear Centre of the Republic of Kazakhstan 2024, 3, 65–74. [Google Scholar]
- Ekström, G.; Nettles, M.; Abers, G.A. Glacial earthquakes. Science 2003, 302(5645), 622–624. [Google Scholar] [CrossRef] [PubMed]
- Ekström, G.; Nettles, M.; Tsai, V. C Seasonality and increasing frequency of Greenland glacial earthquakes. Science 2006, 311(5768), 1756–1758. [Google Scholar] [CrossRef] [PubMed]
- ater-related Climate Hazards and Adaptation Measures in Kazakhstan/ Data and literature analysis. IKI global programme “Policy advice for climate resilient economic development” Germany, 2025. 49pp.
- Usupaev, Sh.E.; Asming, V.Ye.; Sharshebaev, A.K.; Altynbek uulu, T.; Rakhmatilla uulu, Z.; Anarkulov, B.A. On glacial earthquakes in mountainous countries by example of Engilchek glaciers in the basin of Sary-Dzhas river of Kyrgyz Tien Shan. News of Kyrgyzstan Universities 2019, #12, 40–49. [Google Scholar]
- Zech, C.; Schöne, T.; Illigner, J.; Stolarczuk, N.; Queißer, T.; Köppl, M.; Thoss, H.; Zubovich, A.; Sharshebaev, A.; Zakhidov, K.; Toshpulatov, K.; Tillayev, Yu.; Olimov, S.; Paiman, Z.; Unger-Shayesteh, K.; Gafurov, A.; Moldobekov, B. Hydrometeorological data from a Remotely Operated Multi-Parameter Station network in Central Asia. Earth System Science Data 2021, 13(Issue 3), 1289–1306. [Google Scholar] [CrossRef]
- Mikhailova, N.N. Spectral characteristics of seismic noise based on data from Kazakh monitoring stations // Bulletin of the NNC RK, 2006. Issue 2. pp. 19–26.
- Peterson, J. Observation and Modeling of Seismic Background Noise // Open-File Report 93-322, Albuquerque, New Mexico, 1993. Р.42.
- Mikhailova, N.N.; Neverova, N.P. Calibration function () for determining the MPVA of earthquakes in the Northern Tien Shan. In book Comprehensive research at the Alma-Ata prognostic testing ground; Alma-Ata: Nauka, 1986. Pp. 41–48.
- Rautian, T.G. On determining the energy of earthquakes at a distance of up to 3000 km. Experimental Seismology 1964, 199, 88–93. [Google Scholar]
- Cansi, Y. An automatic seismic event processing for detection and location: the P.M.C.C. method. Geophys. Res. Lett. 1995, 22, 1021–1024. [Google Scholar] [CrossRef]
- Mikhailova, N.N.; Komarov, I.I. Glacial earthquakes in the Central Tien Shan. Bulletin of the National Academy of Sciences of Kazakhstan 2009, 3, 120–126. [Google Scholar]
Figure 1.
The overview map of the of the high-mountain Tien Shan glaciers research area. The area of glacial seismicity under research is circled.
Figure 1.
The overview map of the of the high-mountain Tien Shan glaciers research area. The area of glacial seismicity under research is circled.
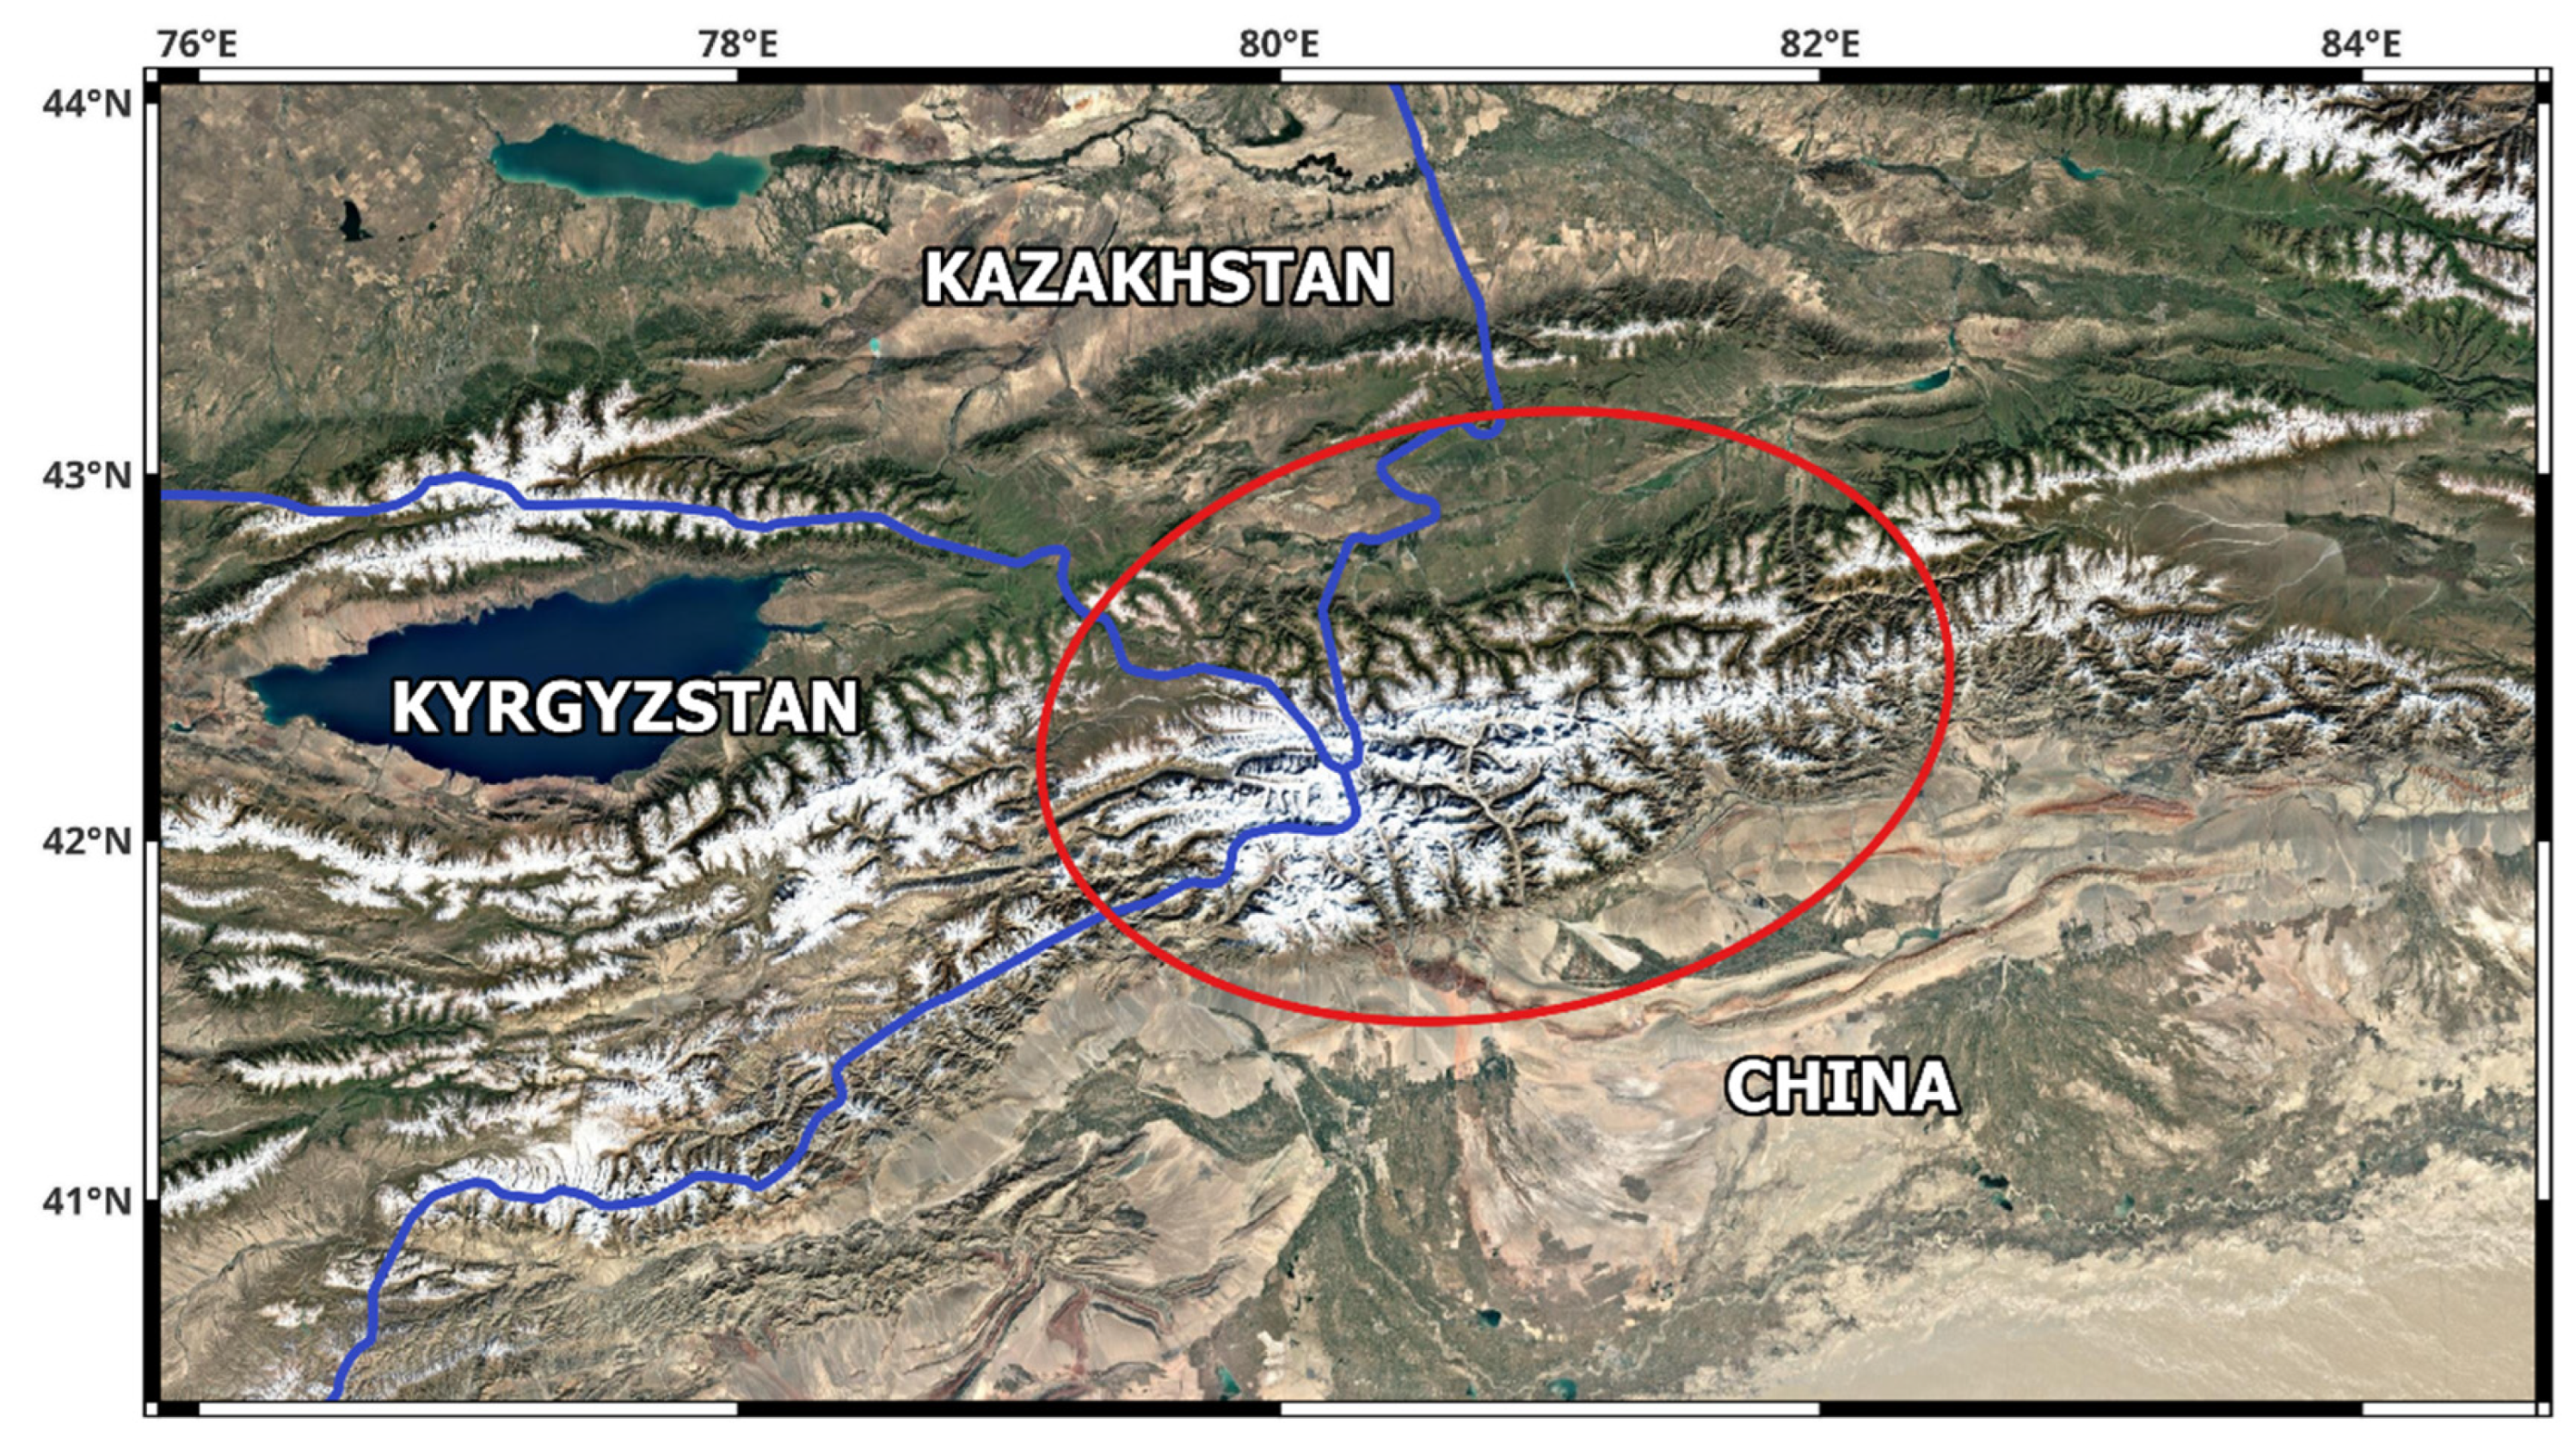
Figure 2.
Location of the recording stations to study glacial seismicity of Tien Shan. Yellow triangles – seismic stations, orange triangle – infrasound station.
Figure 2.
Location of the recording stations to study glacial seismicity of Tien Shan. Yellow triangles – seismic stations, orange triangle – infrasound station.
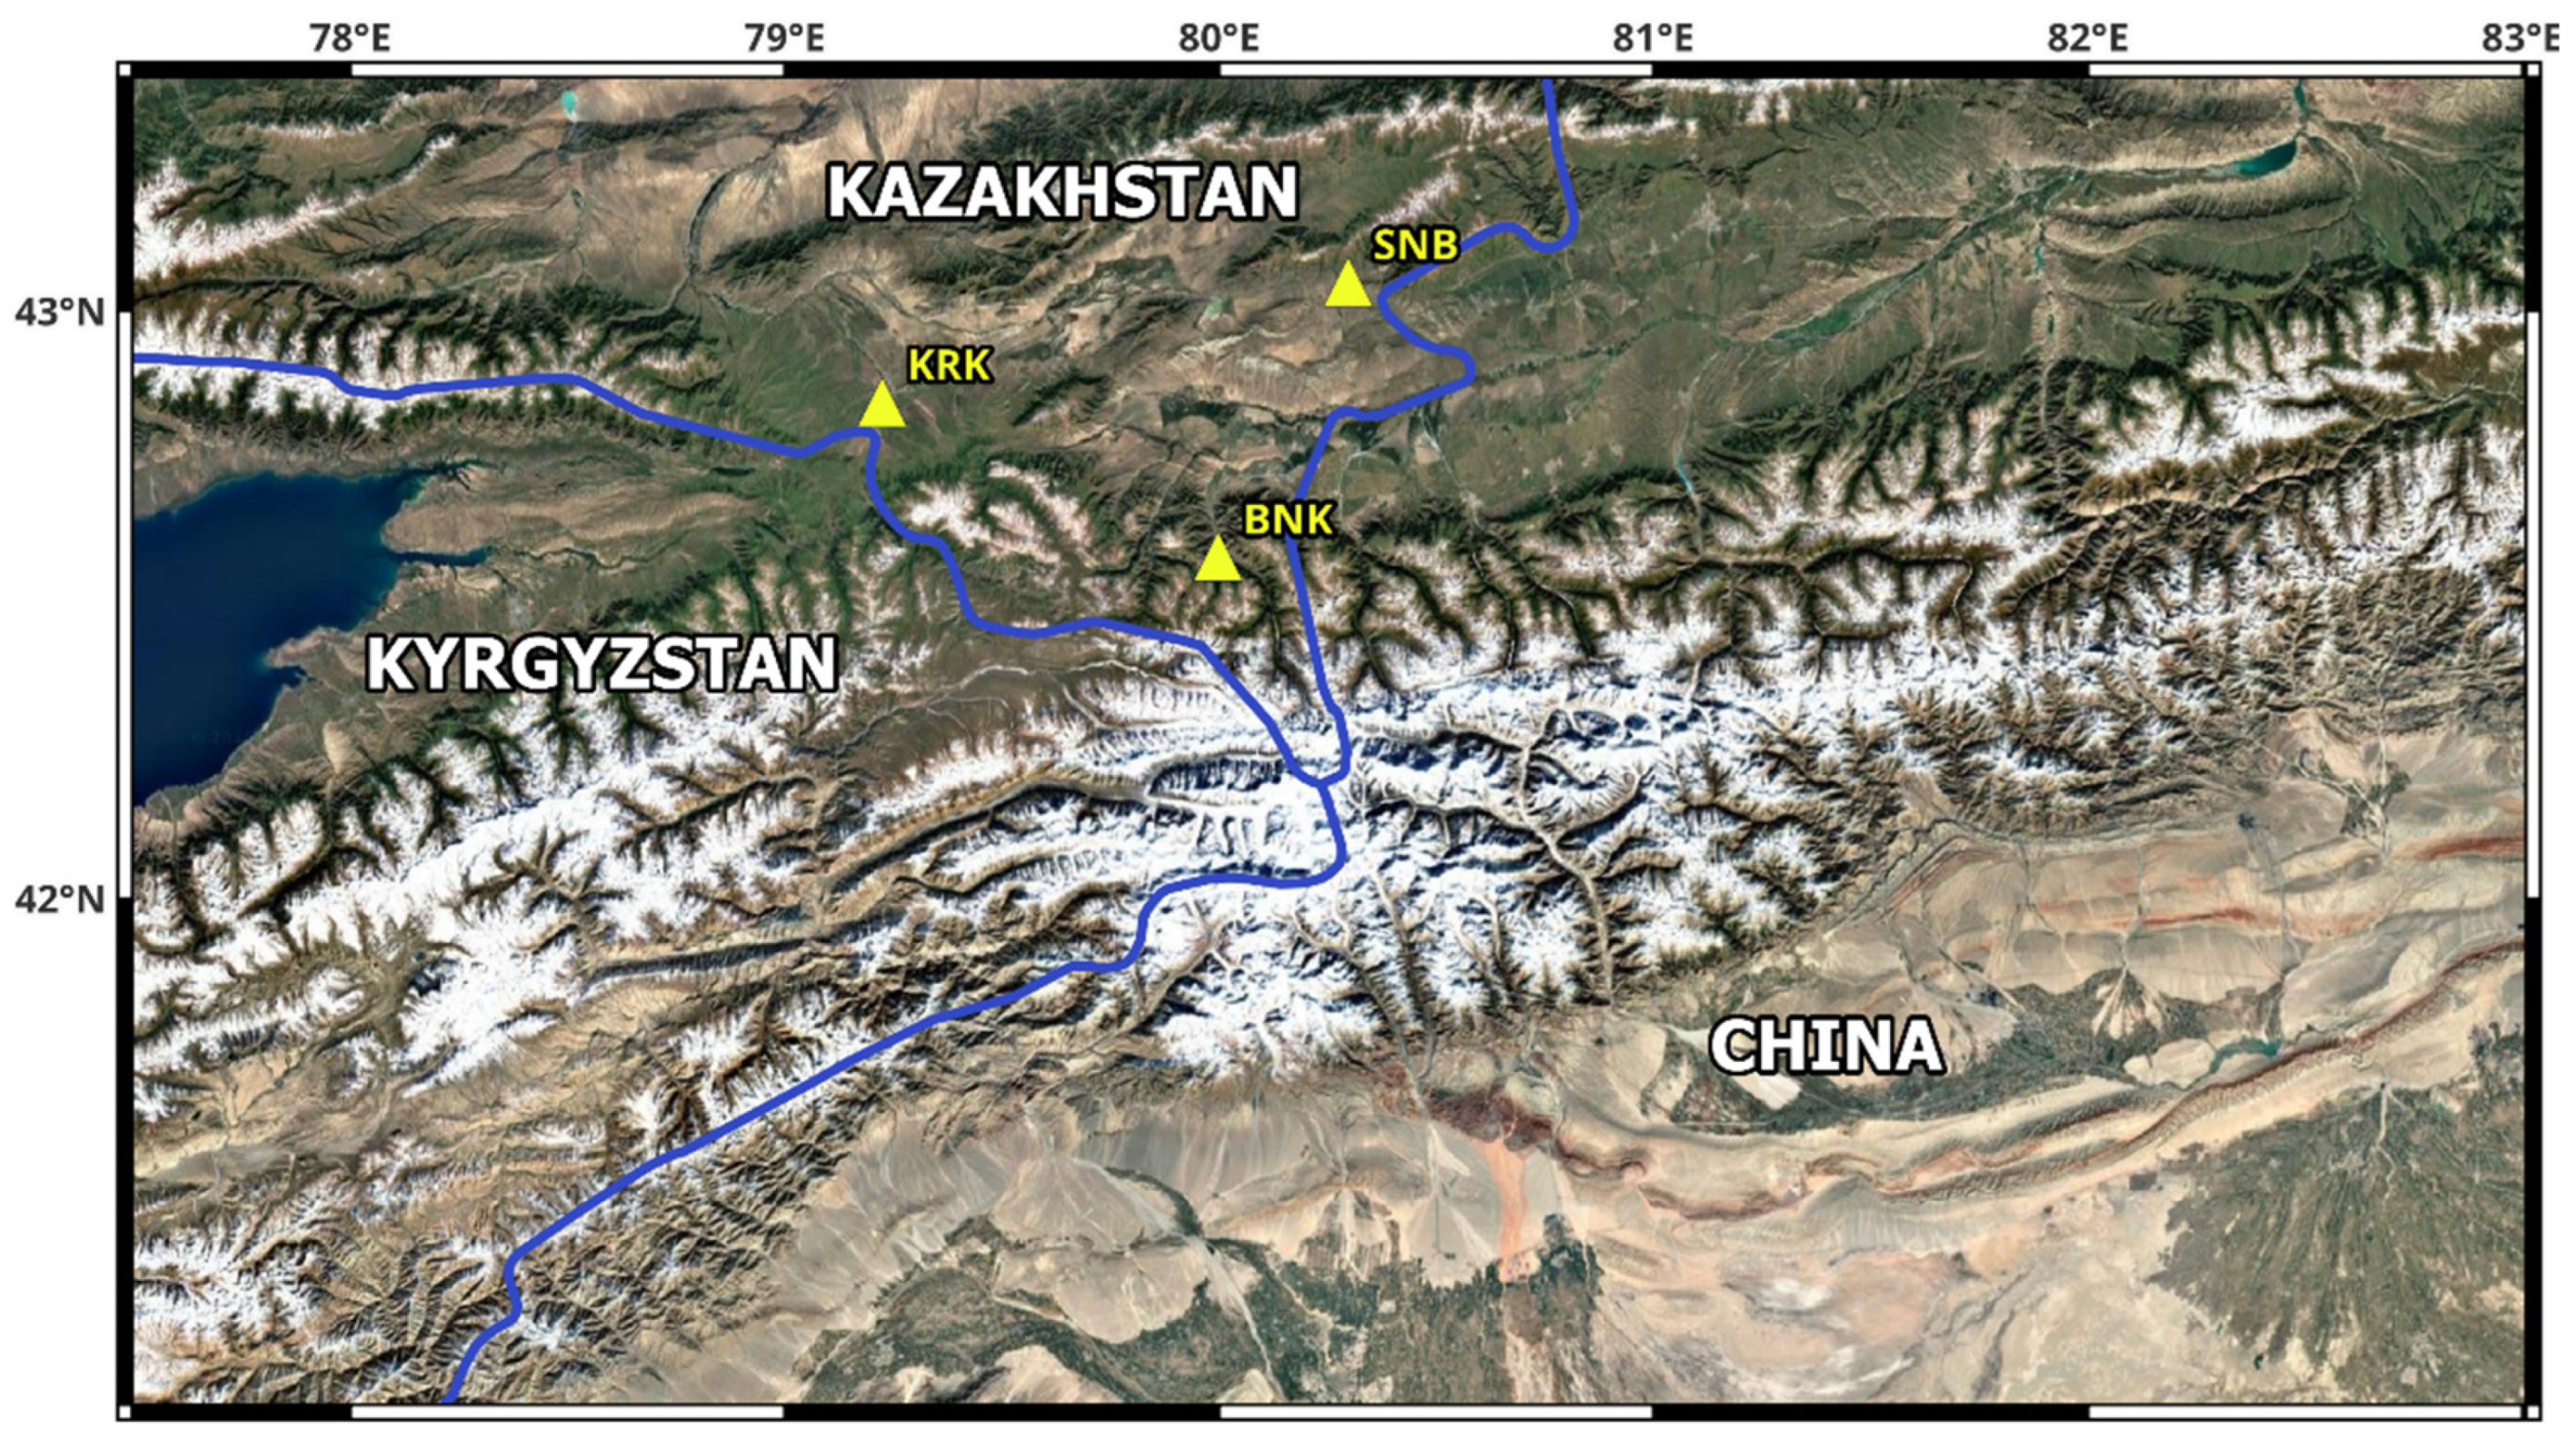
Figure 3.
The diagram of the field network stations operation period and the equipment used.
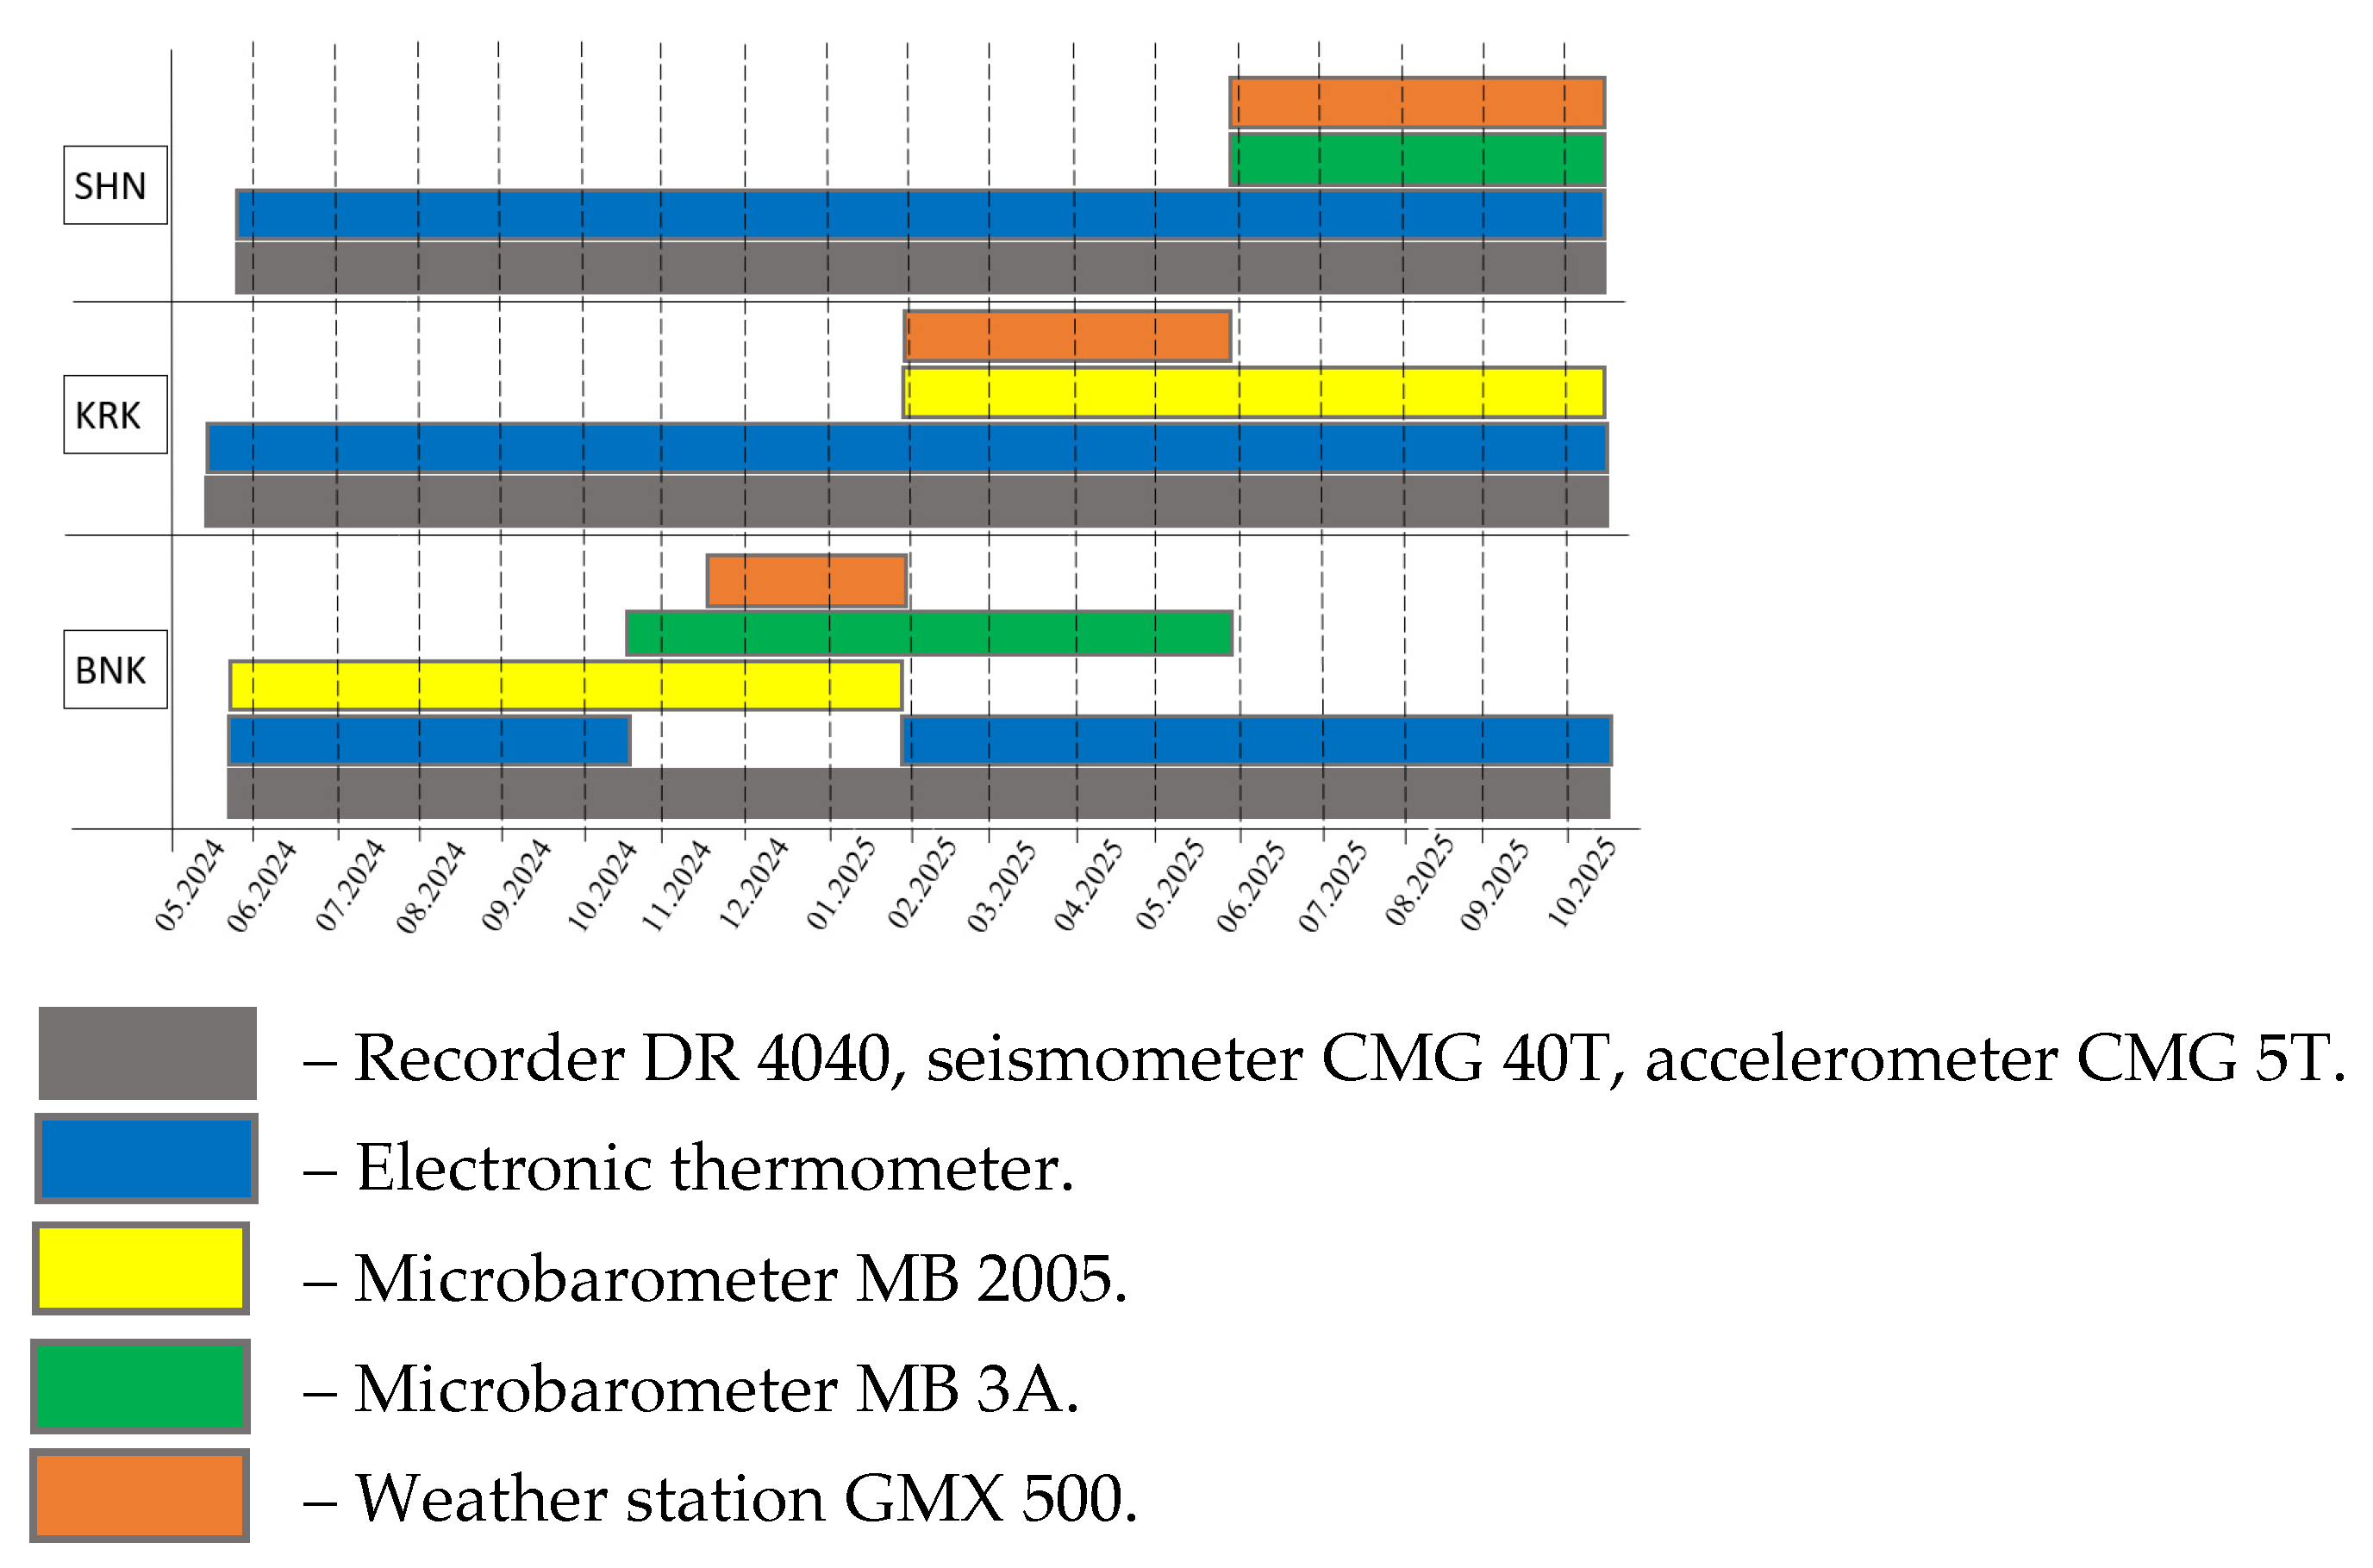
Figure 4.
Work on running Bayankol seismic station. a) installation of an autonomous power supply system, b) installation of protective fencing, c) installation of seismic recording equipment.
Figure 4.
Work on running Bayankol seismic station. a) installation of an autonomous power supply system, b) installation of protective fencing, c) installation of seismic recording equipment.
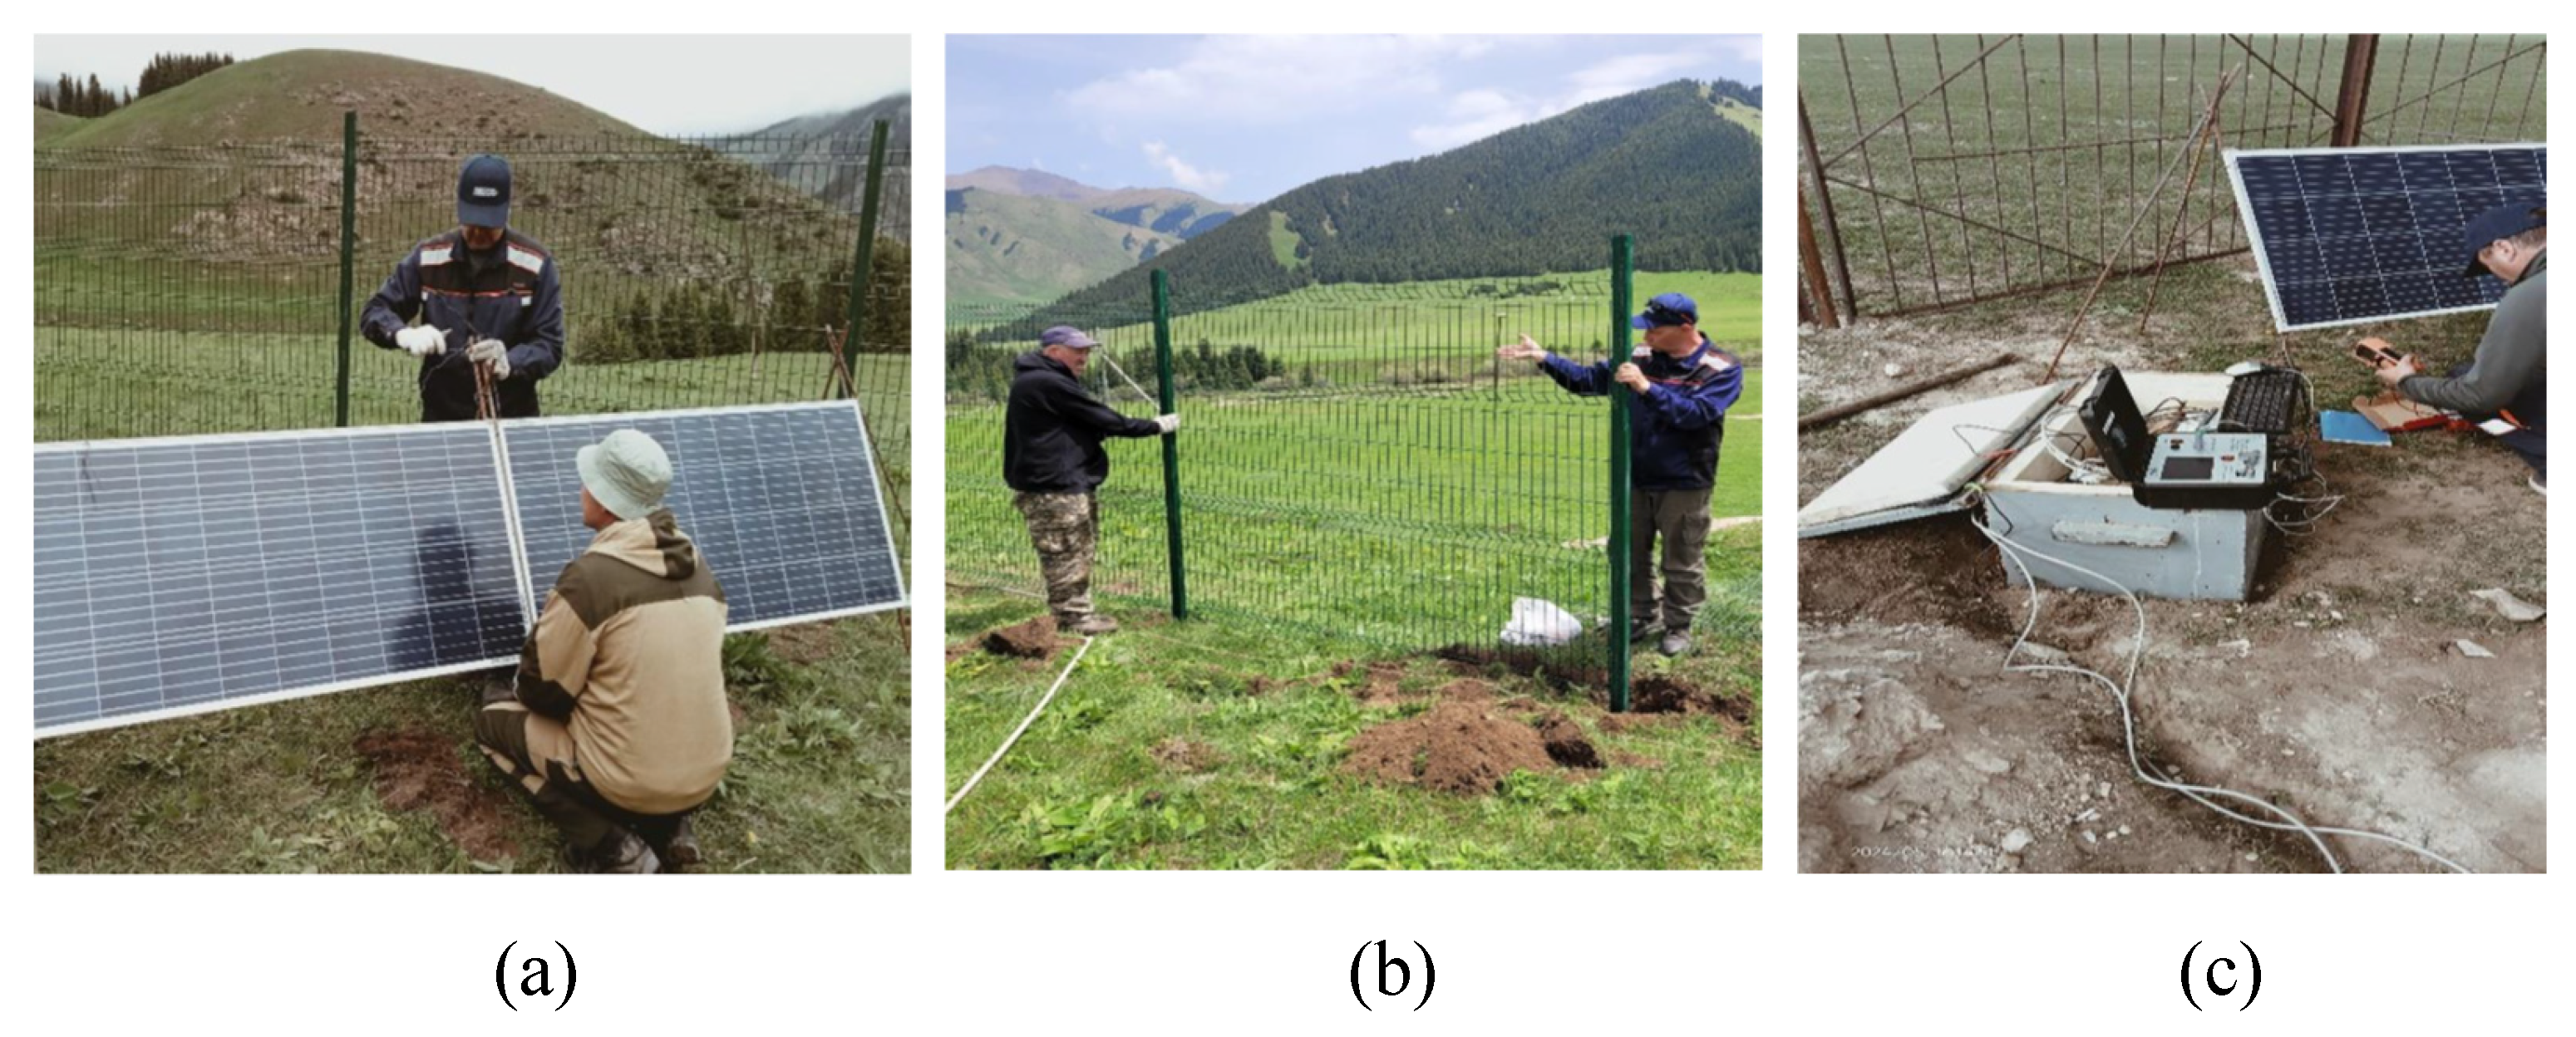
Figure 5.
Work on running Bayankol seismic station. a) installation of a wind interference suppression system, b) installation of an MB 2005 microbarometer, c) microbarometer in a thermal box, d) air intake outlet.
Figure 5.
Work on running Bayankol seismic station. a) installation of a wind interference suppression system, b) installation of an MB 2005 microbarometer, c) microbarometer in a thermal box, d) air intake outlet.
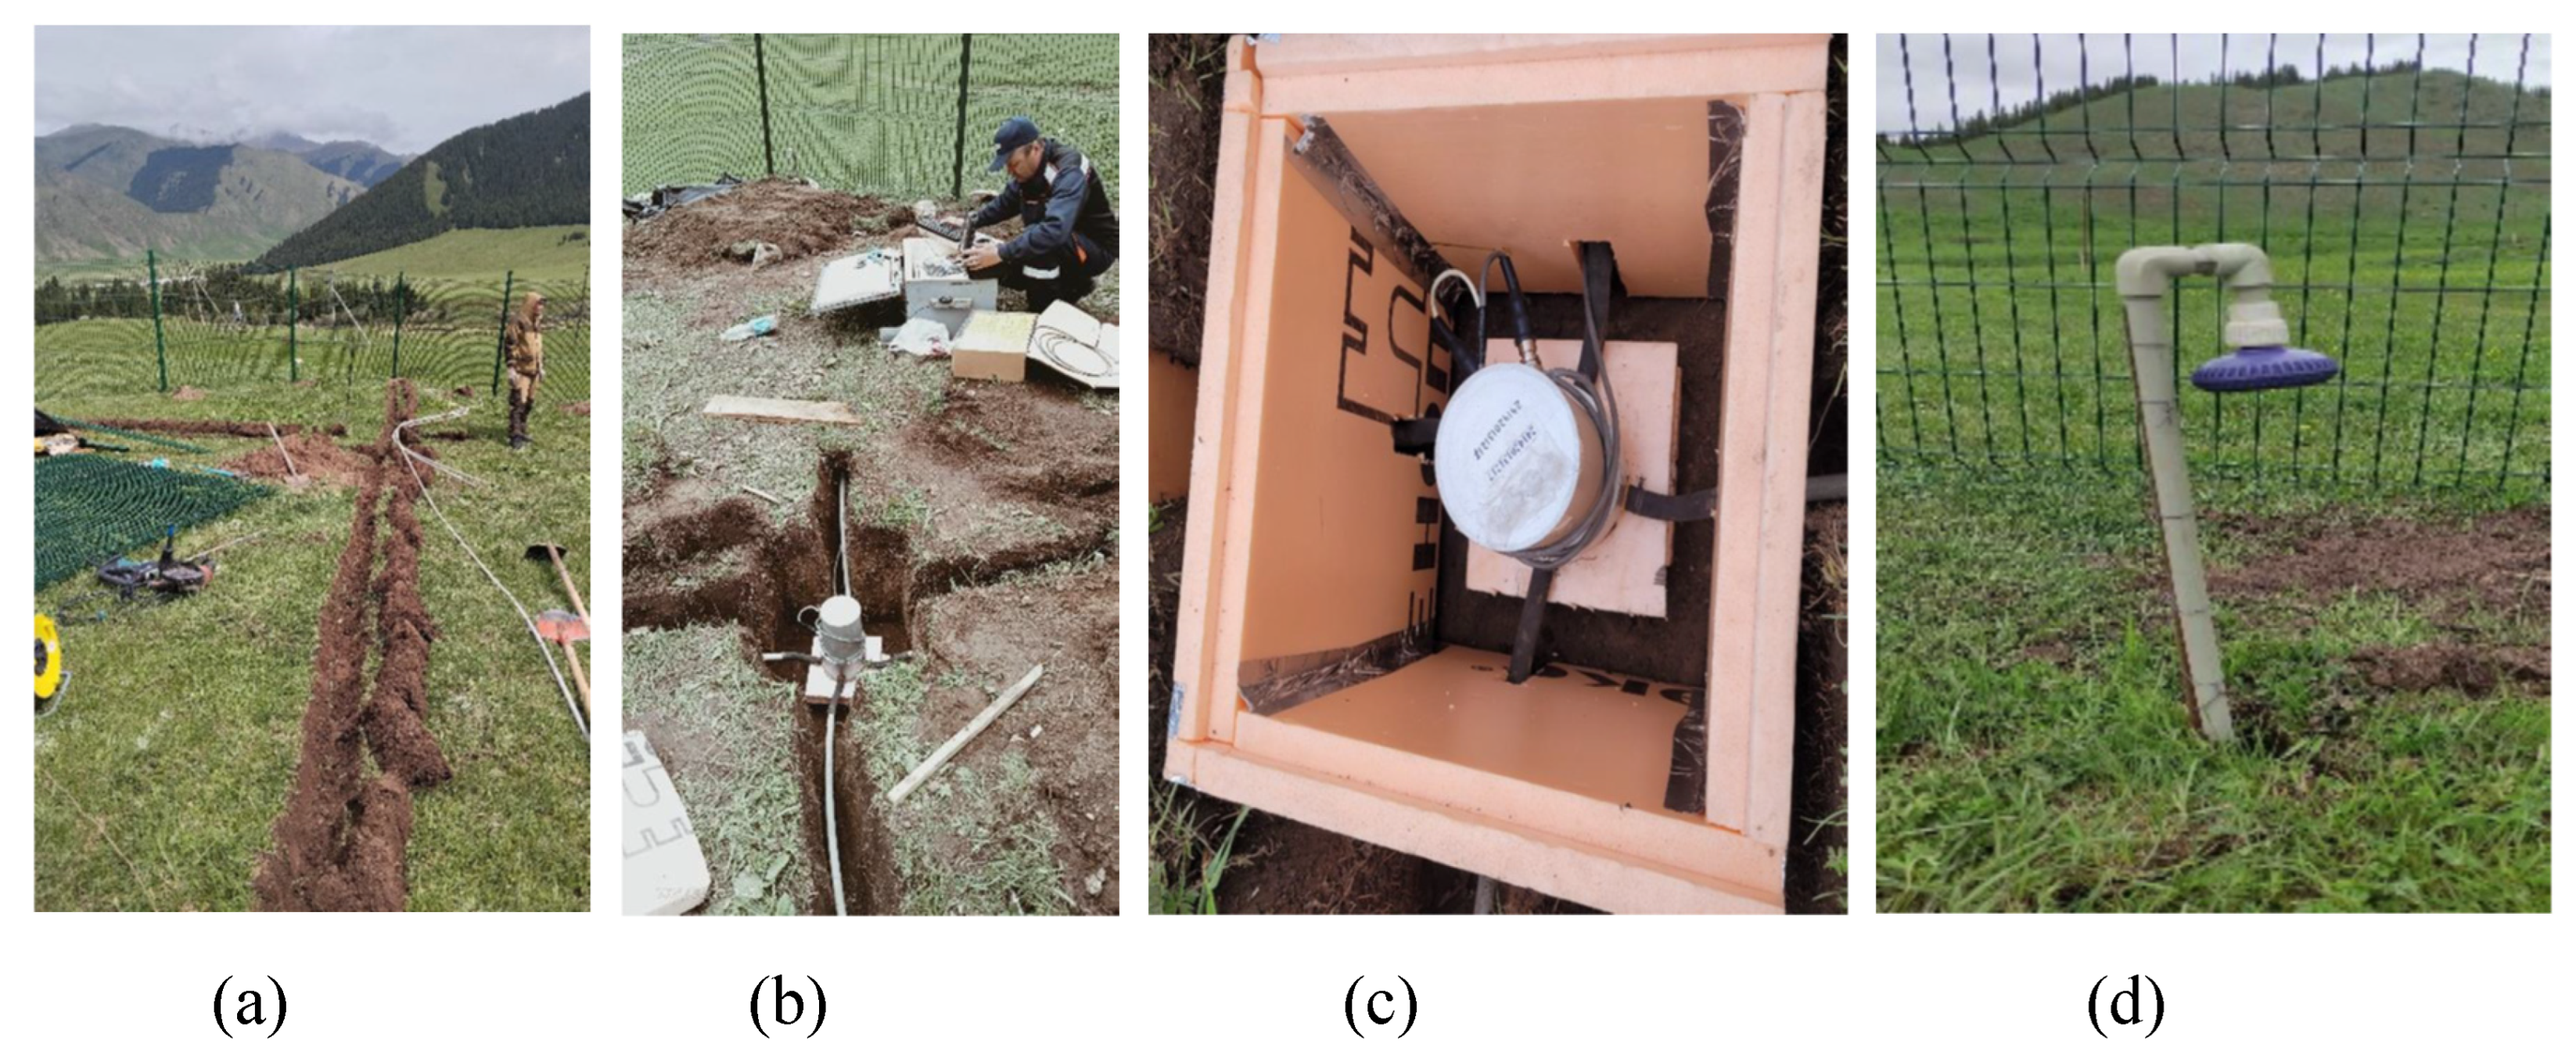
Figure 8.
Monitoring network for glacial seismic events.
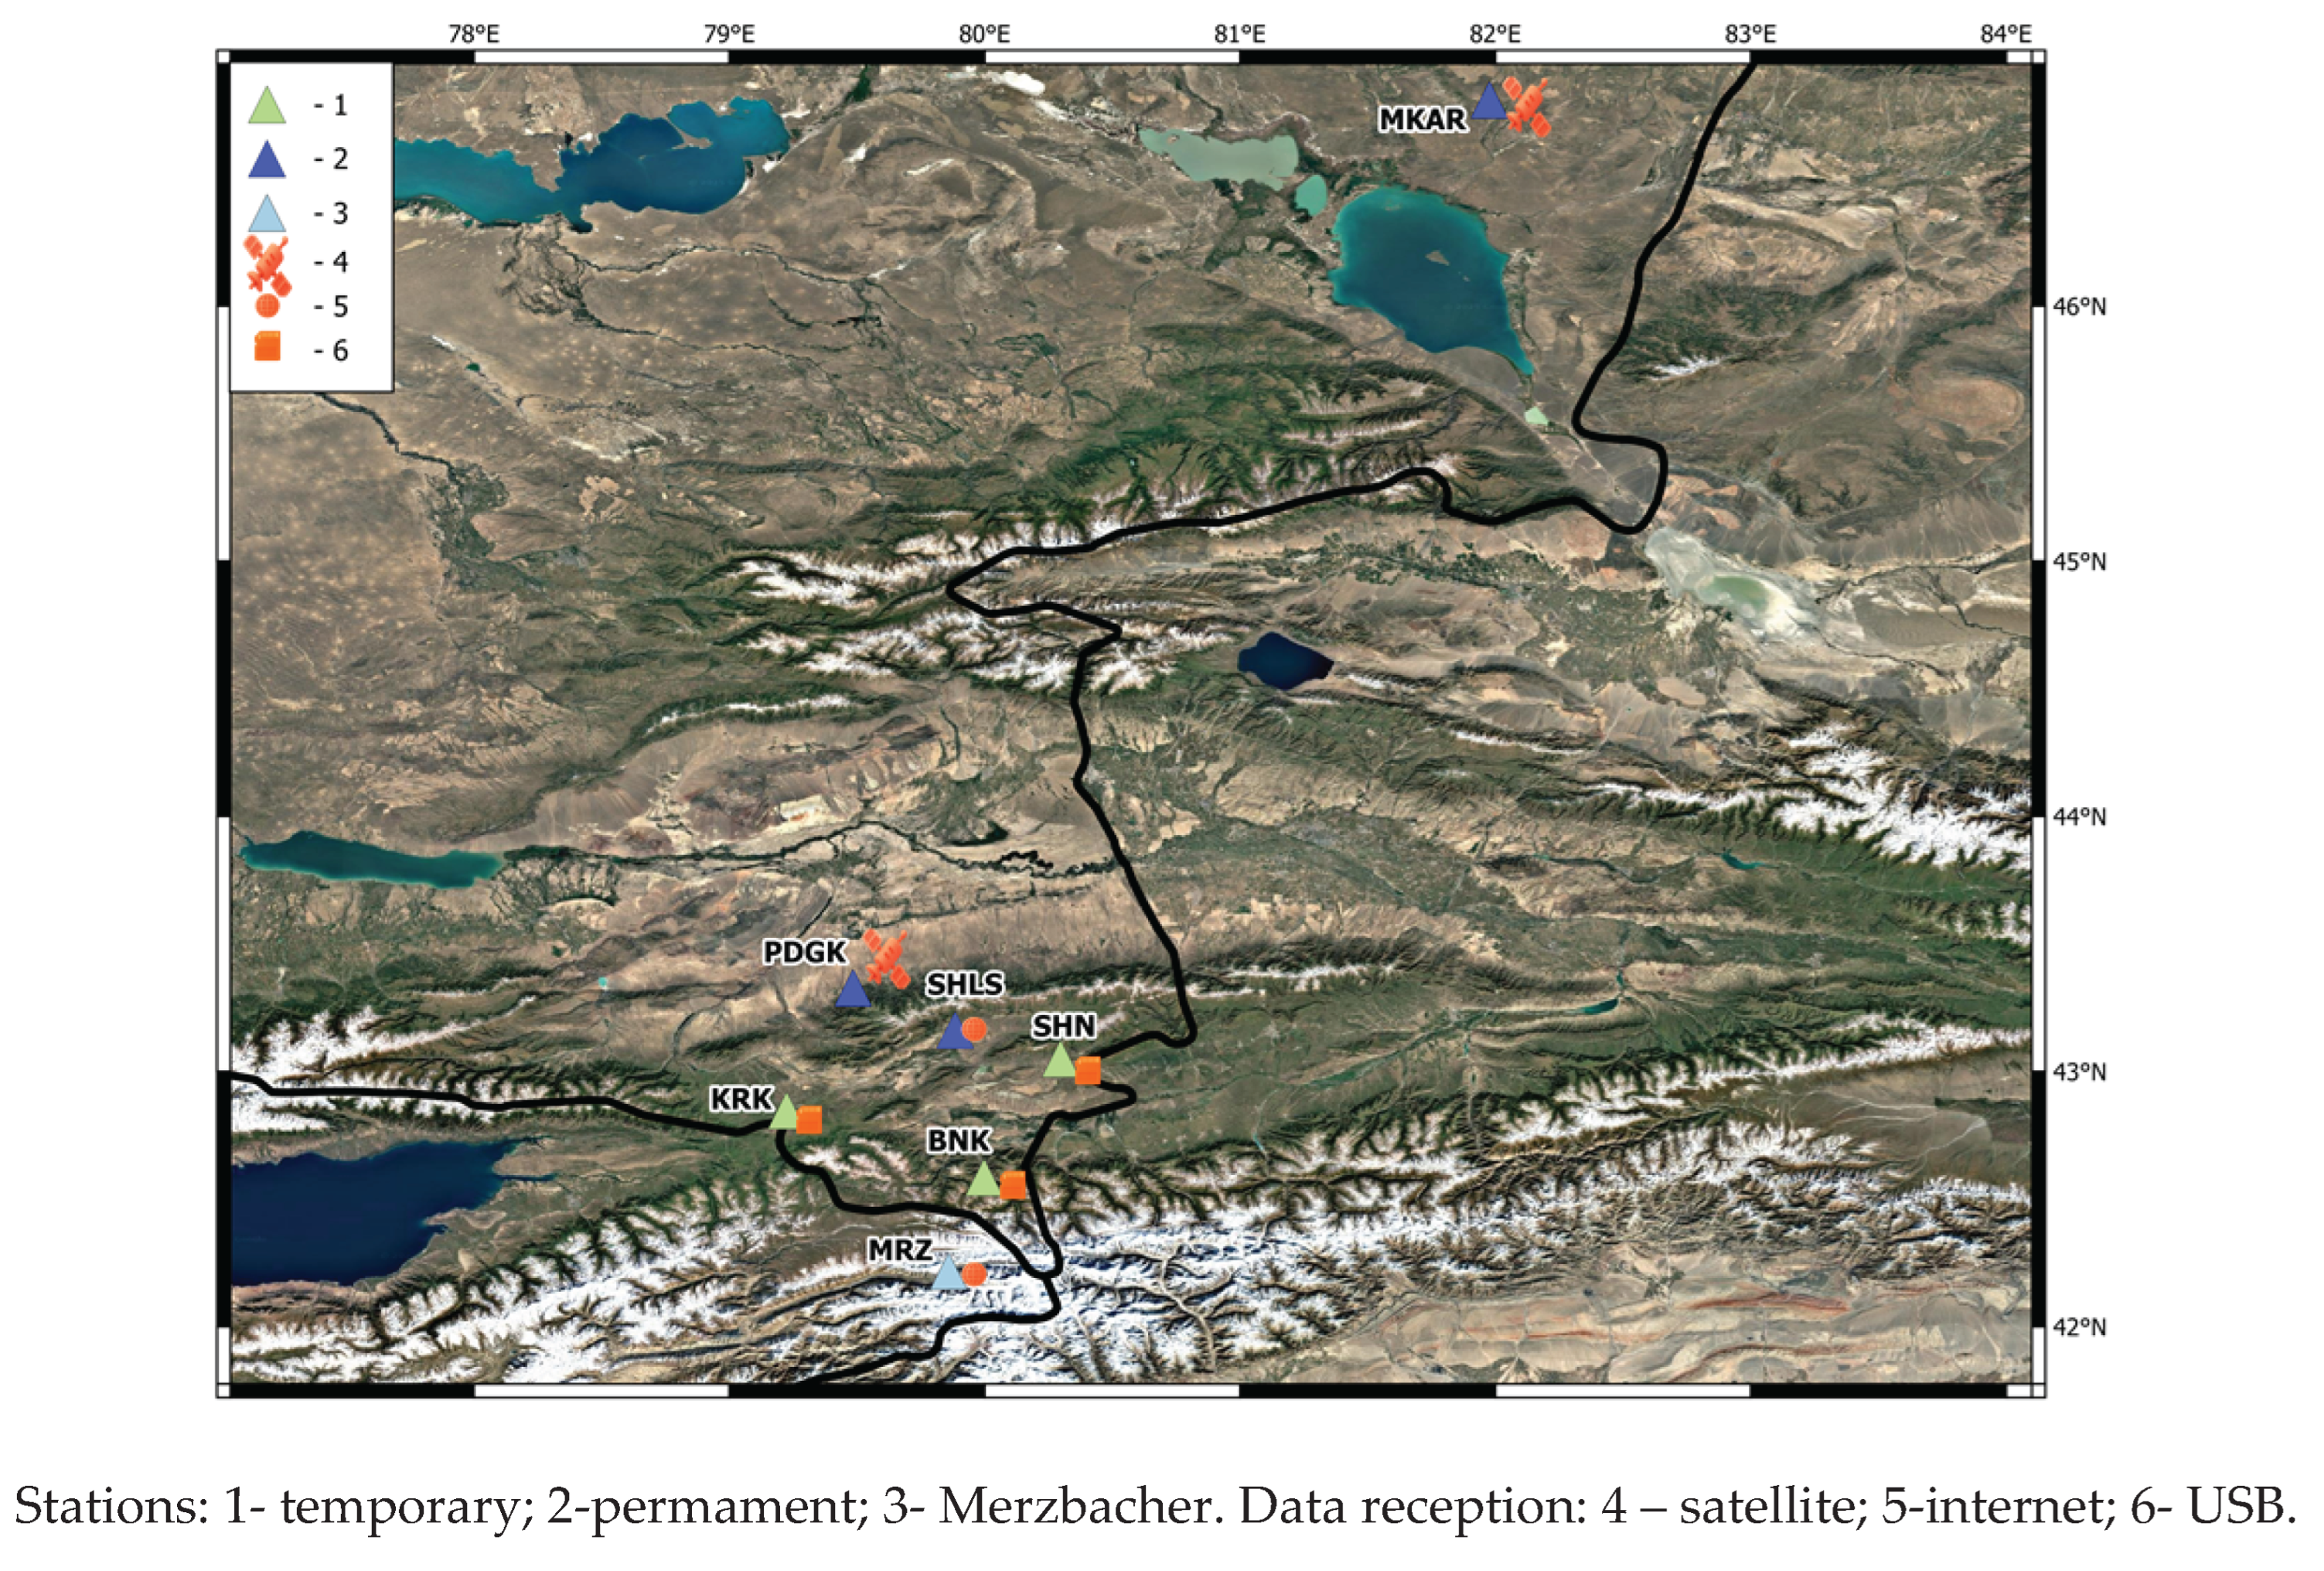
Figure 9.
A chart of data acquisition from the glacier monitoring network in KNDC (Almaty).
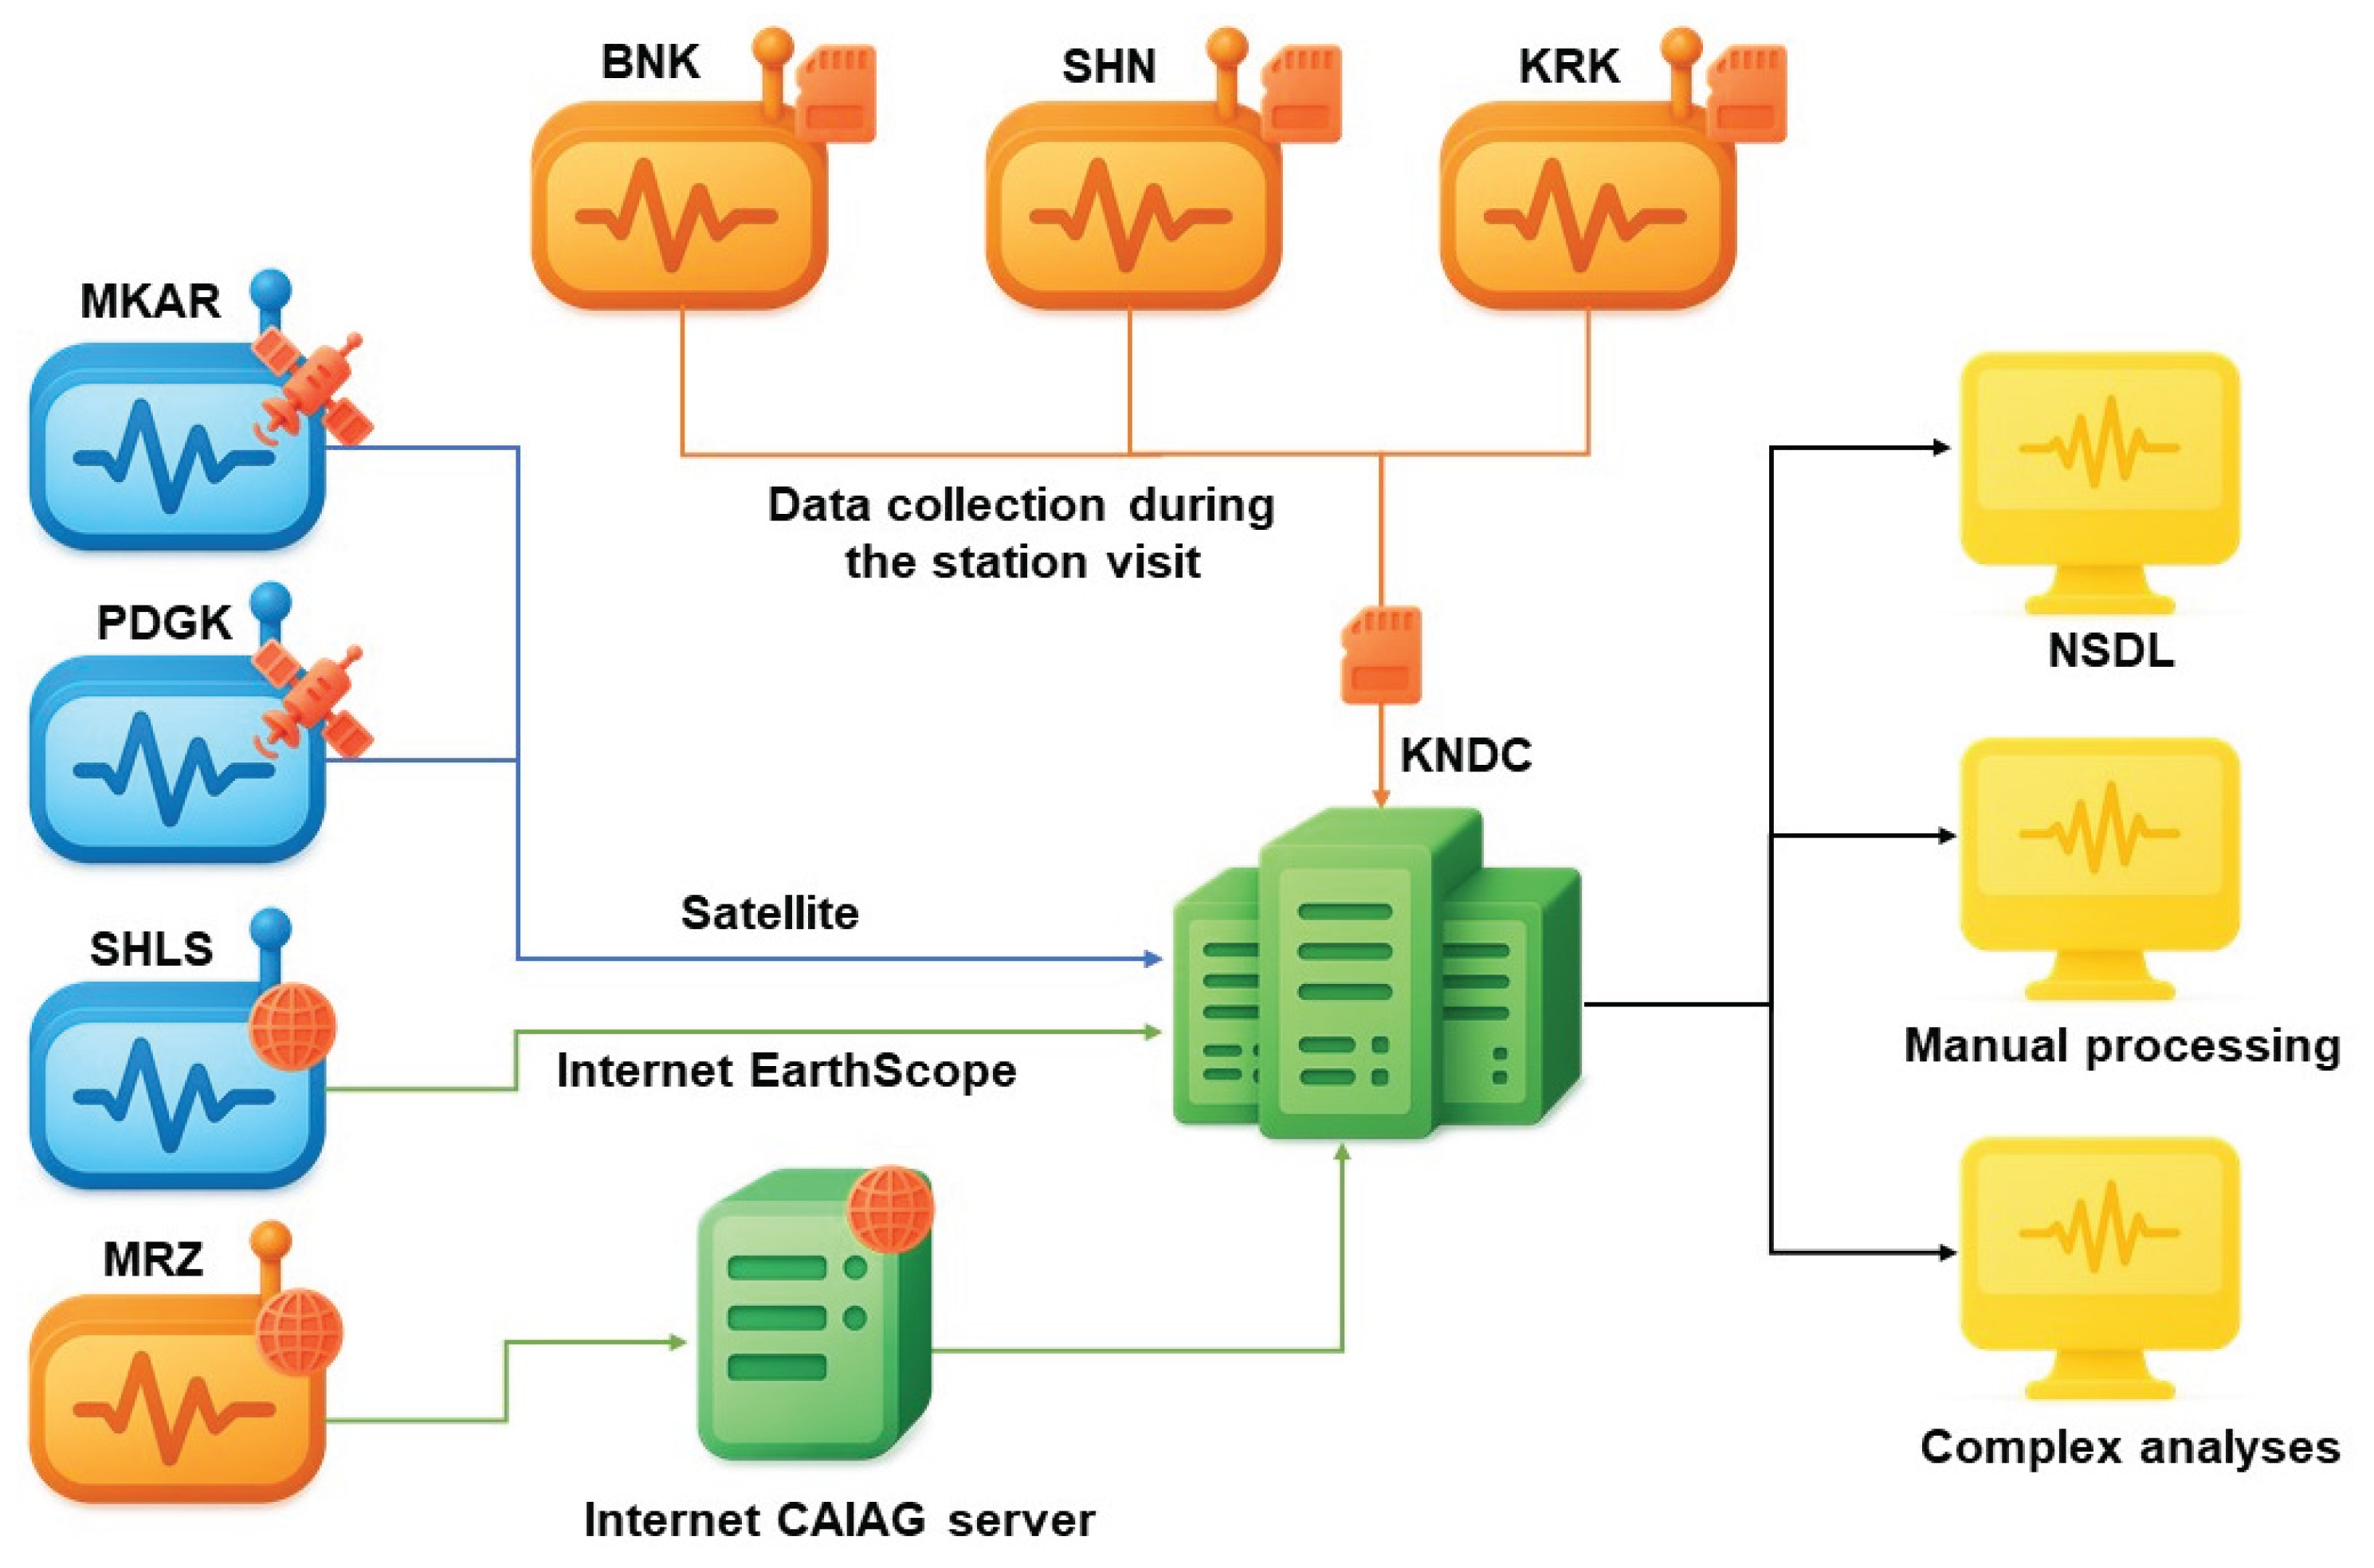
Figure 10.
Spectral density of seismic noise power (night time) by the field and permanent stations in the near zone.
Figure 10.
Spectral density of seismic noise power (night time) by the field and permanent stations in the near zone.
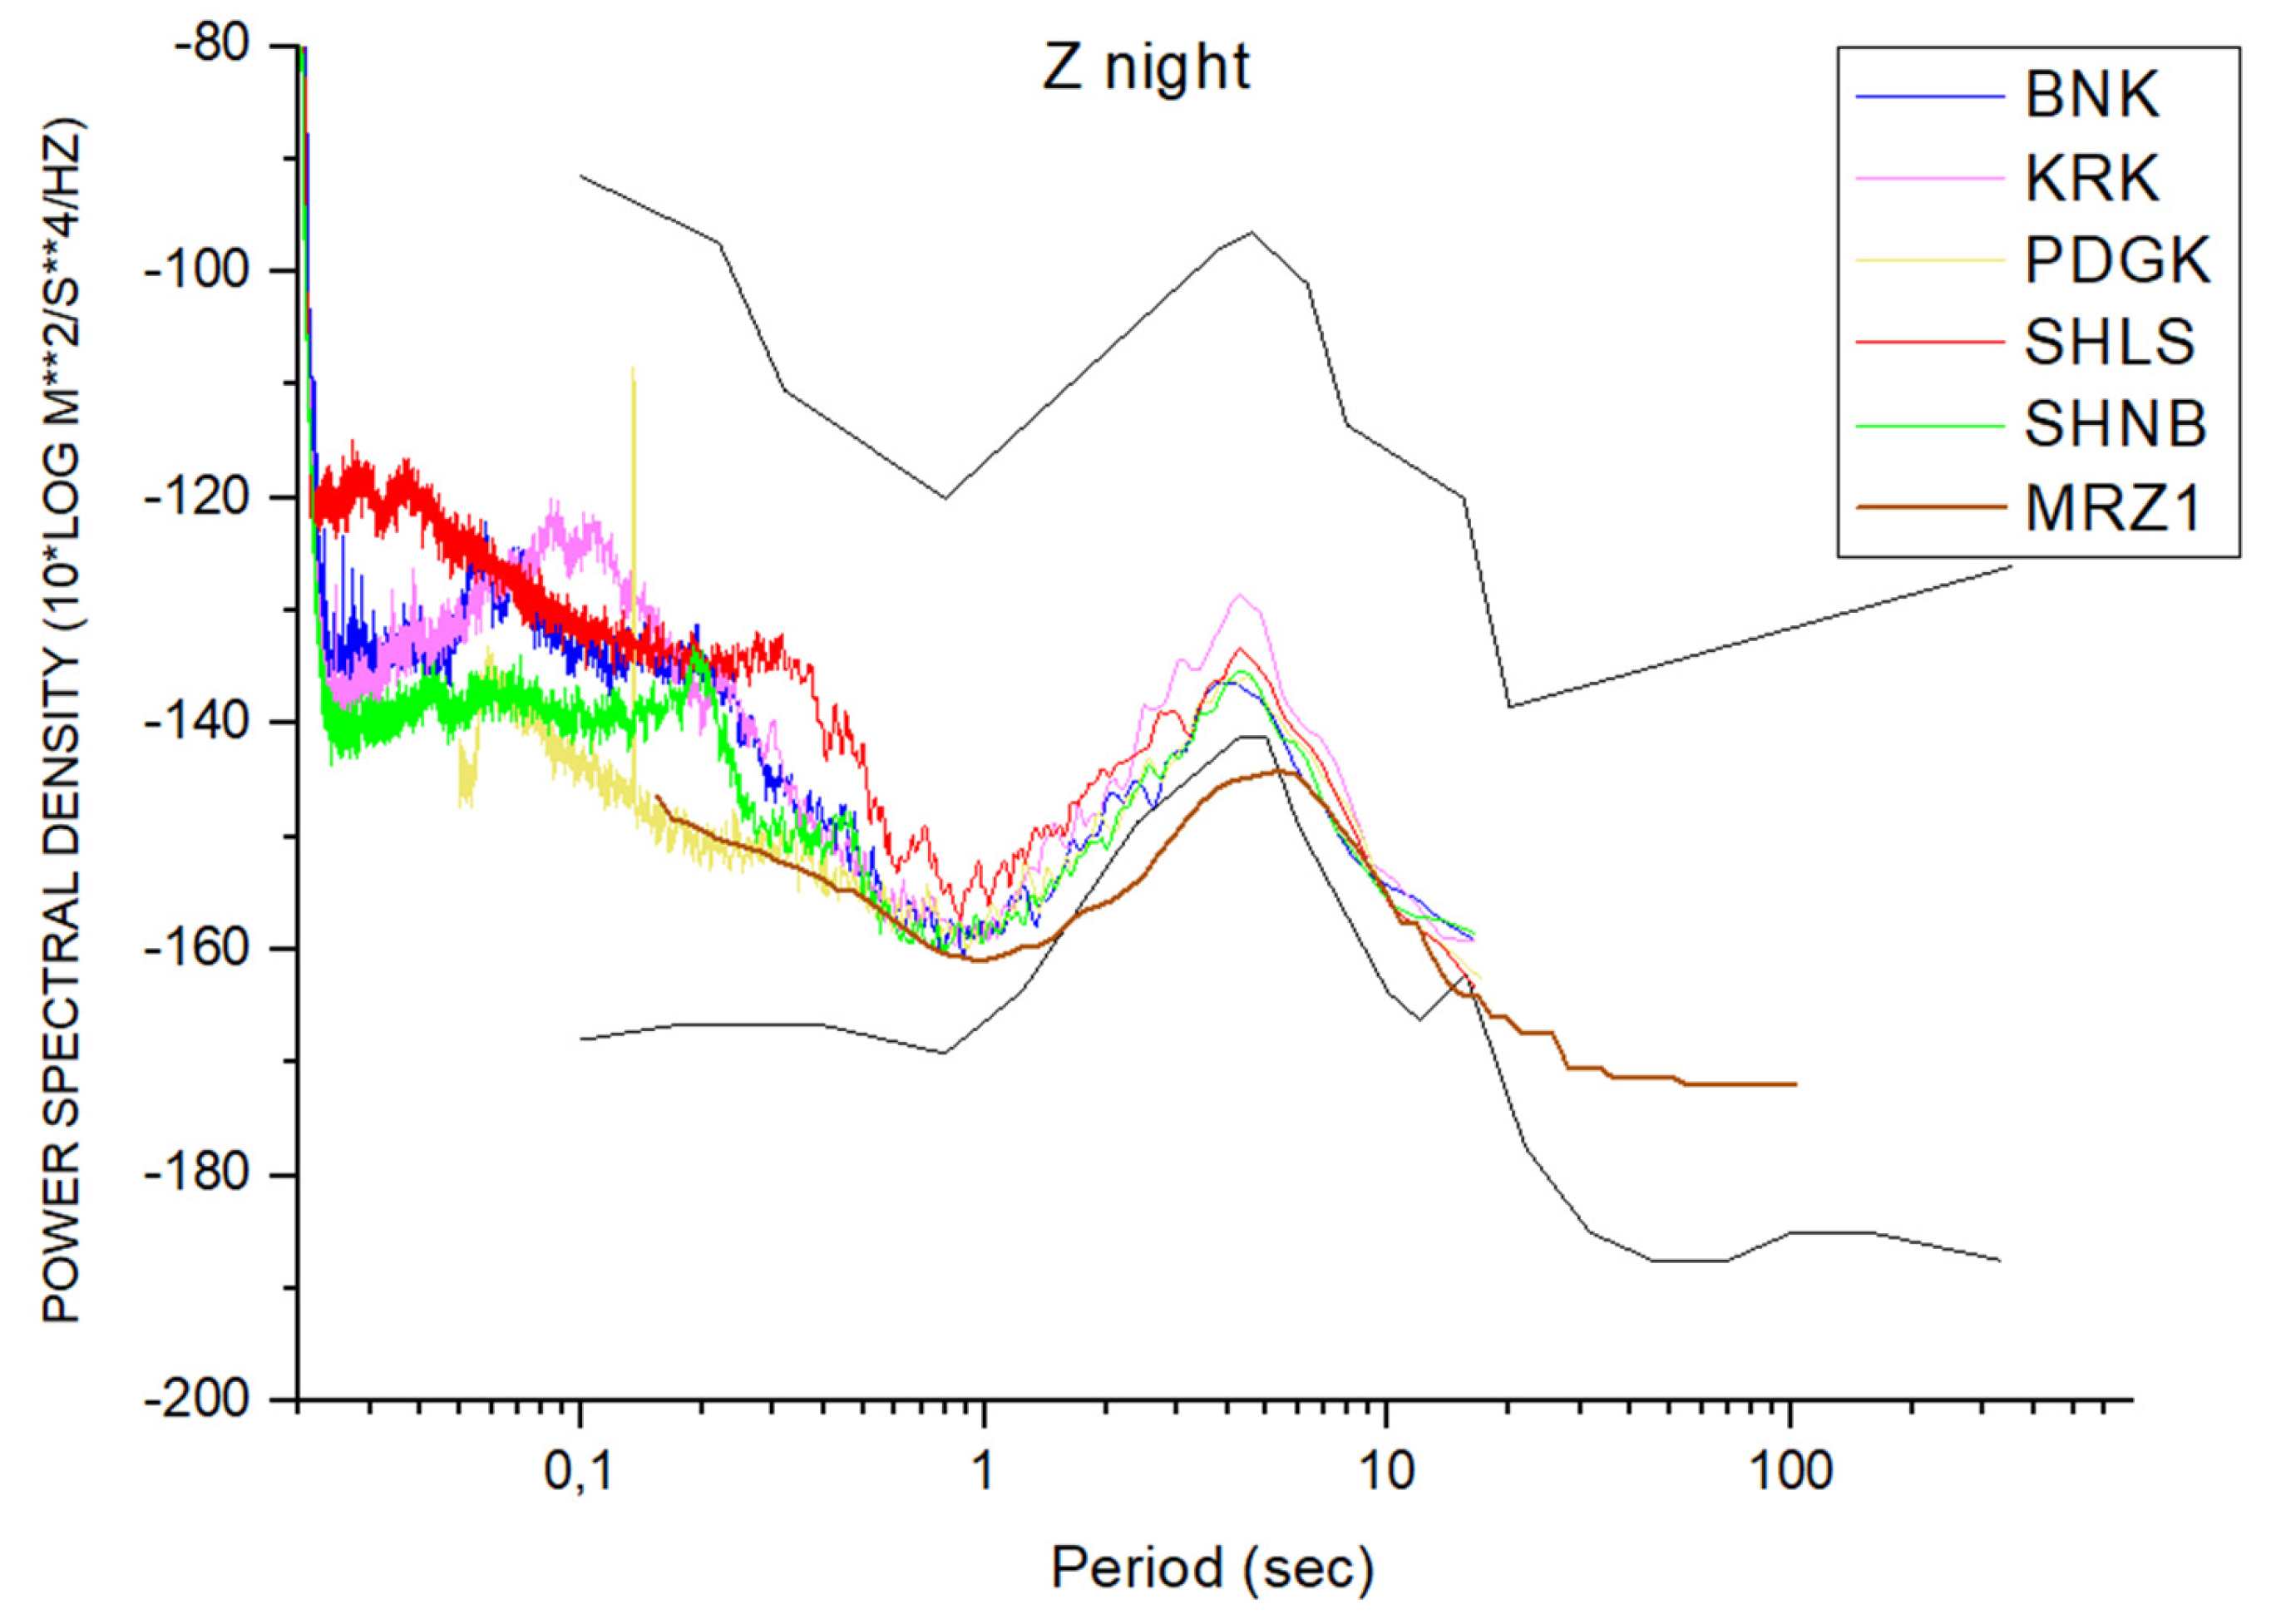
Figure 11.
Diurnal seismograms from three field stations.
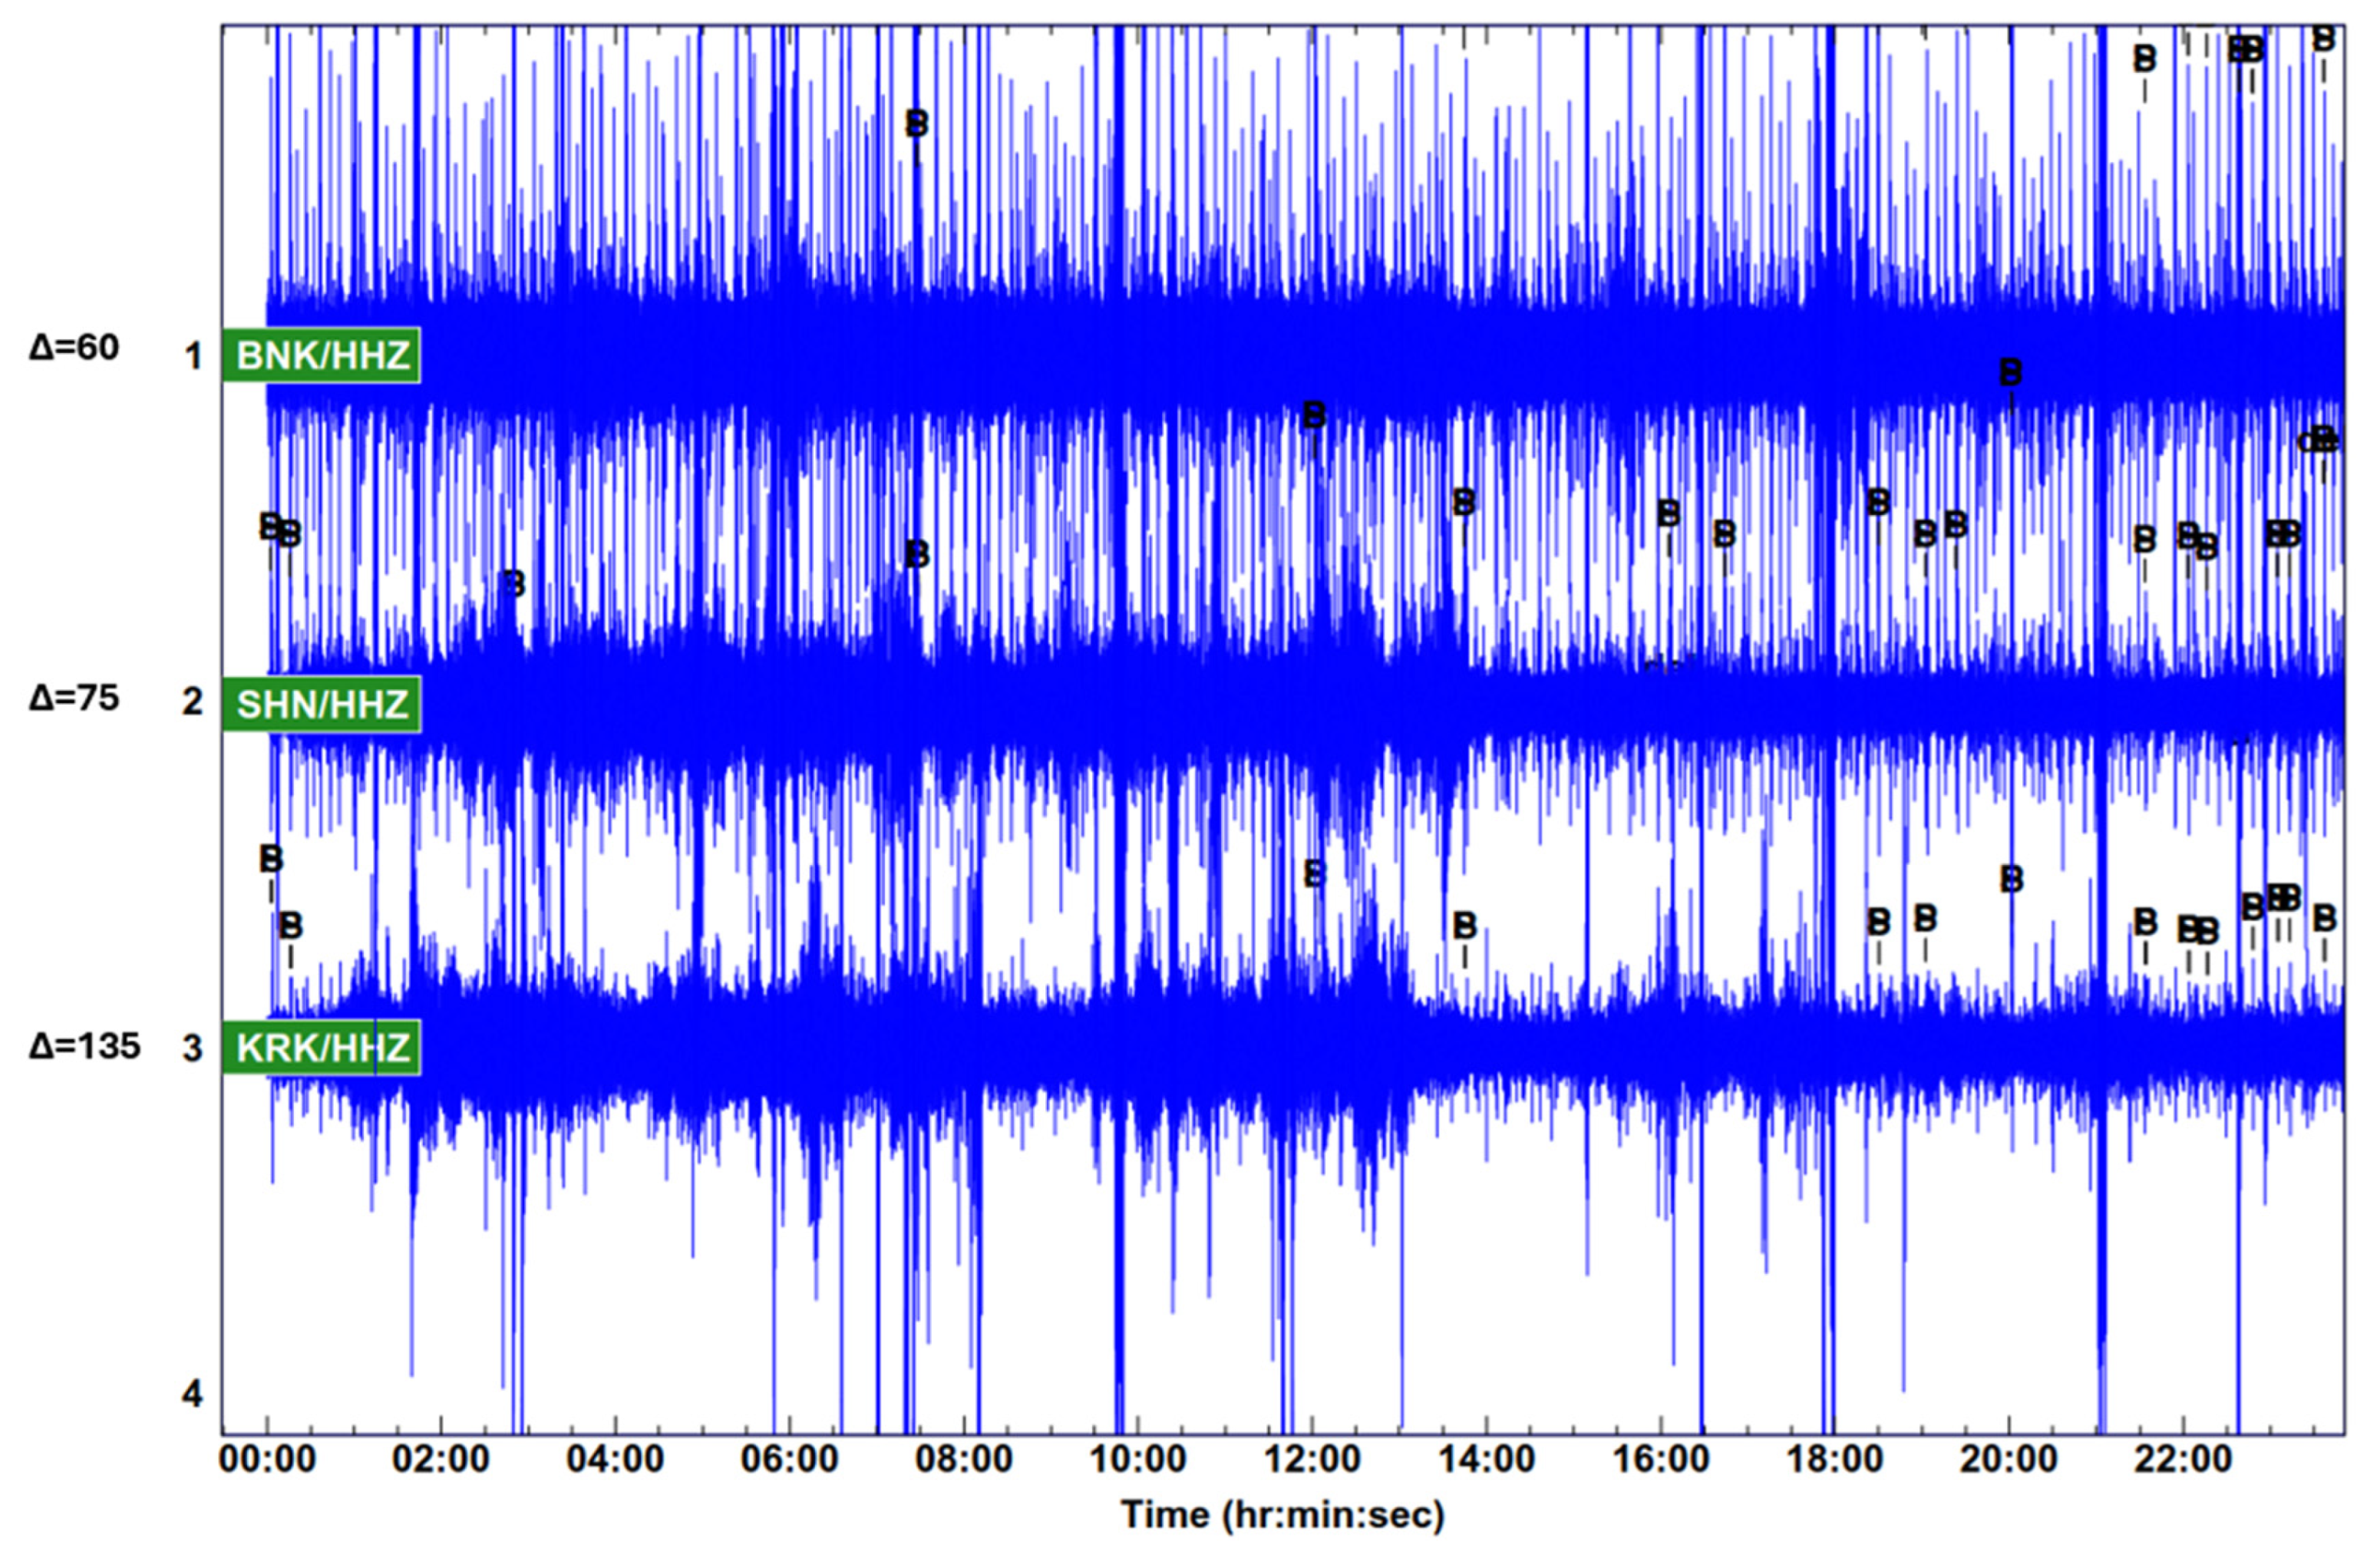
Figure 12.
Diurnal seismic data on three components of Merzbacher station.
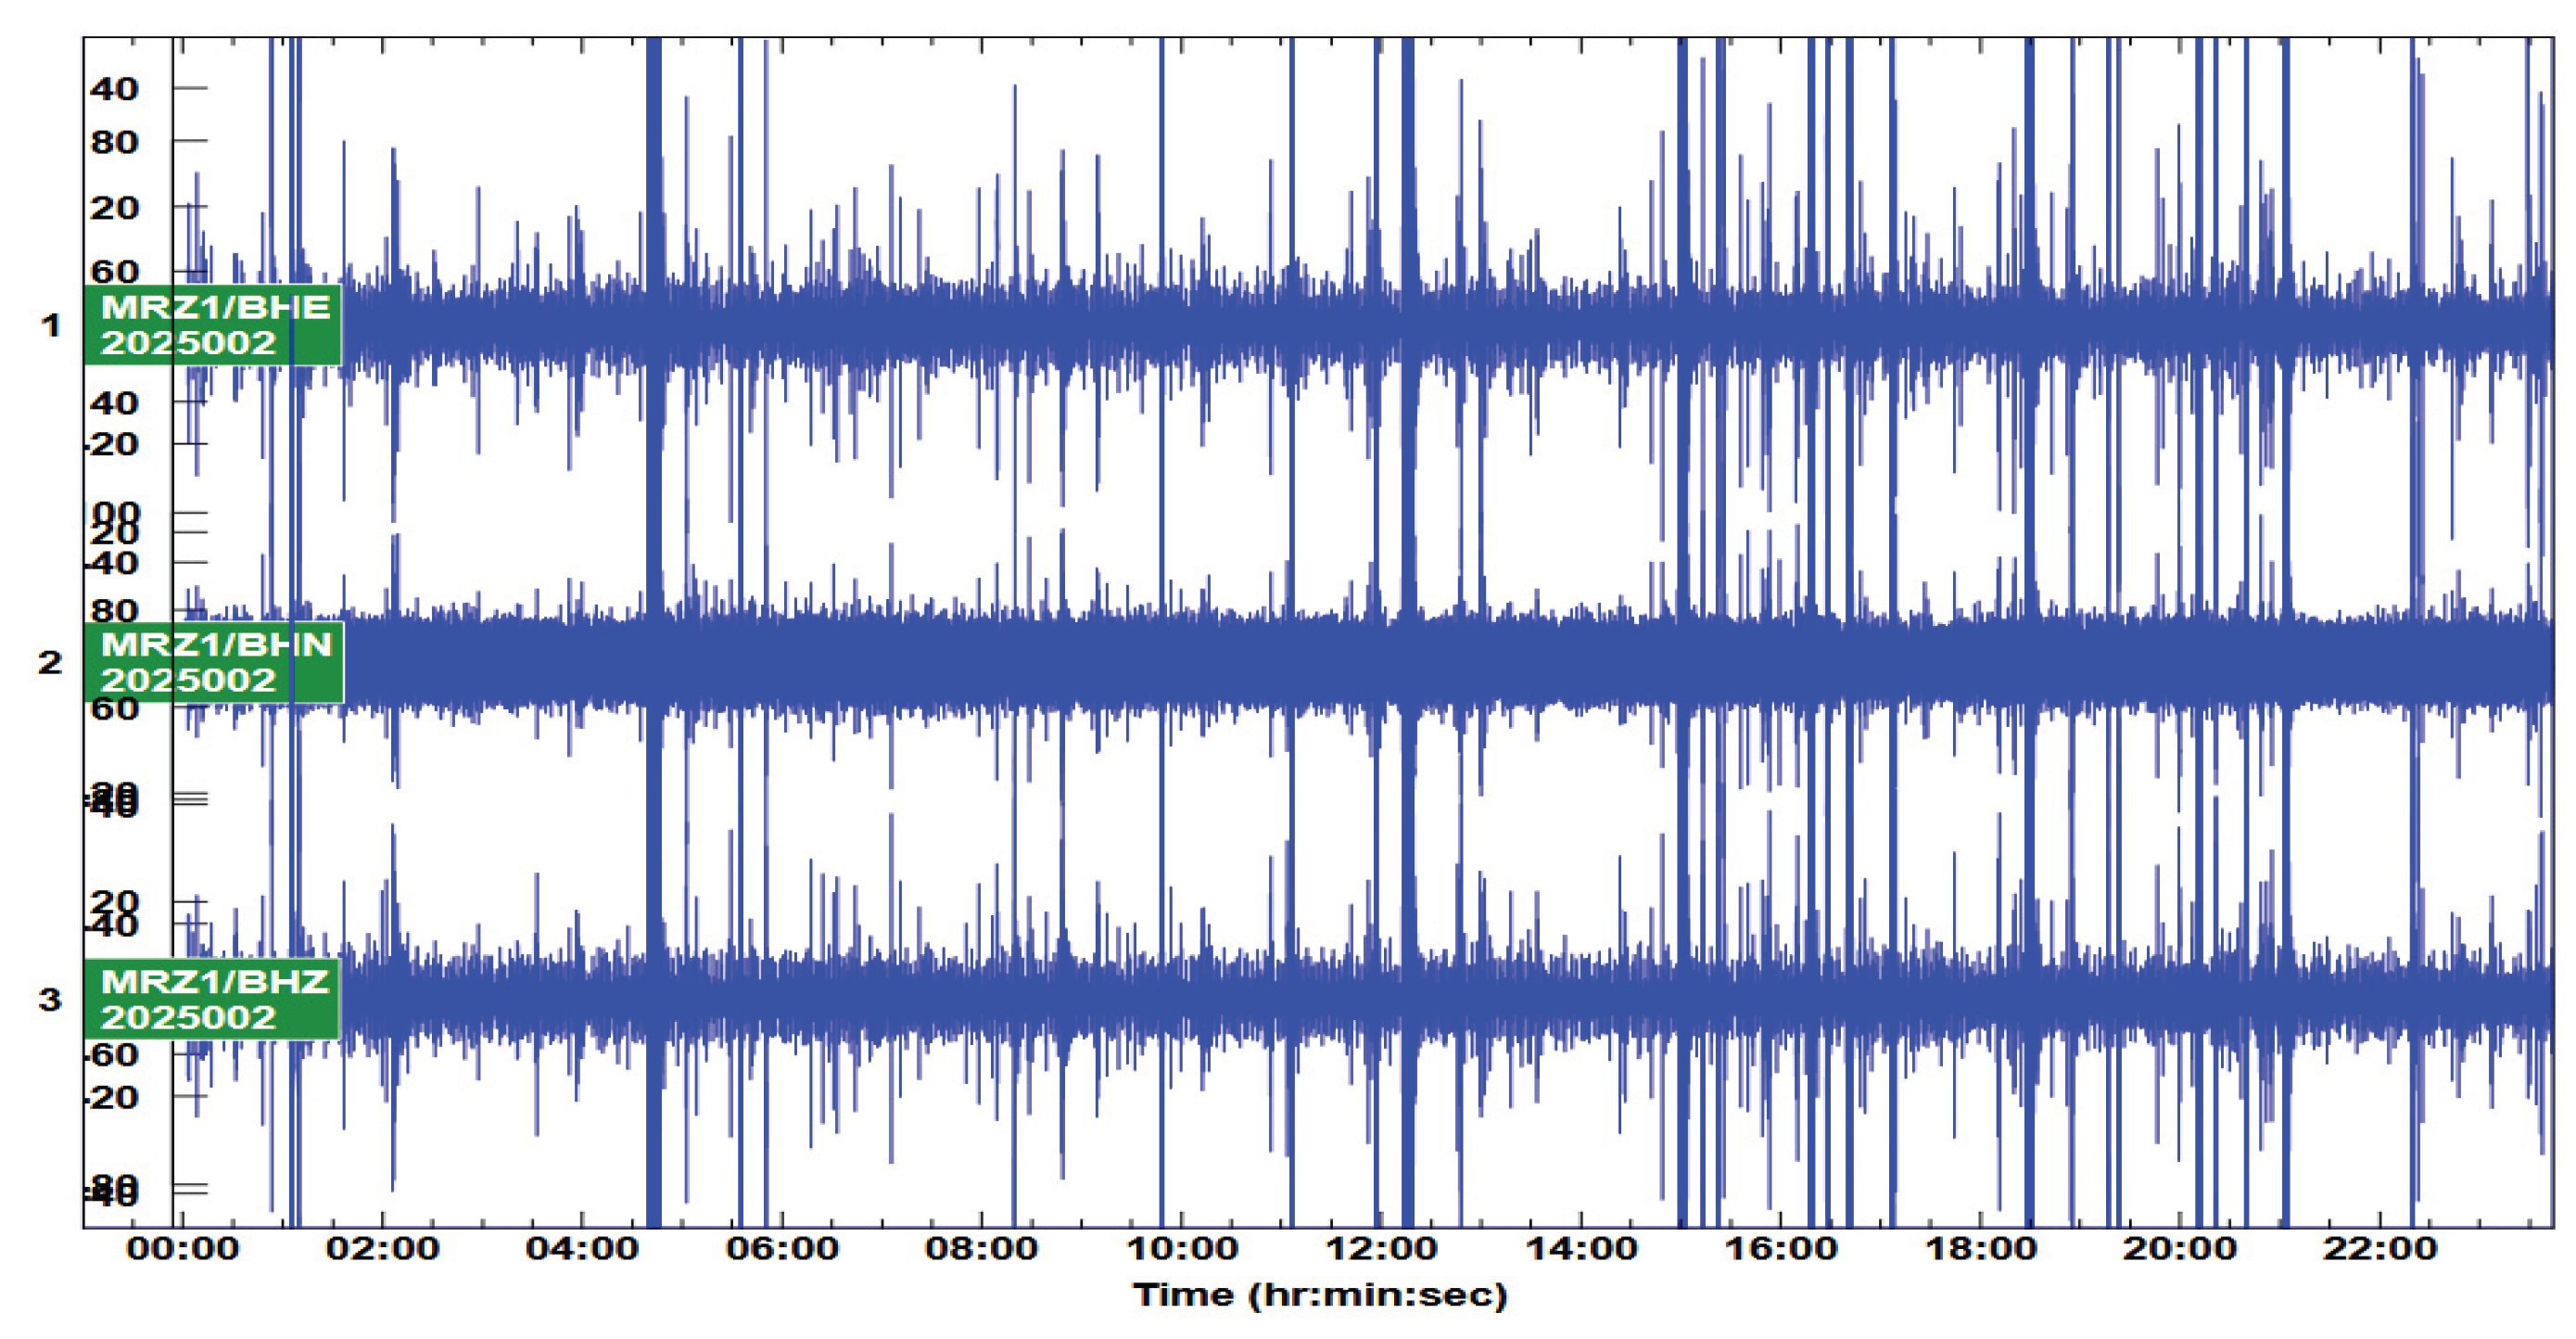
Figure 13.
The seismic records from all stations in the near zone in actual physical characteristics of ground motion.
Figure 13.
The seismic records from all stations in the near zone in actual physical characteristics of ground motion.
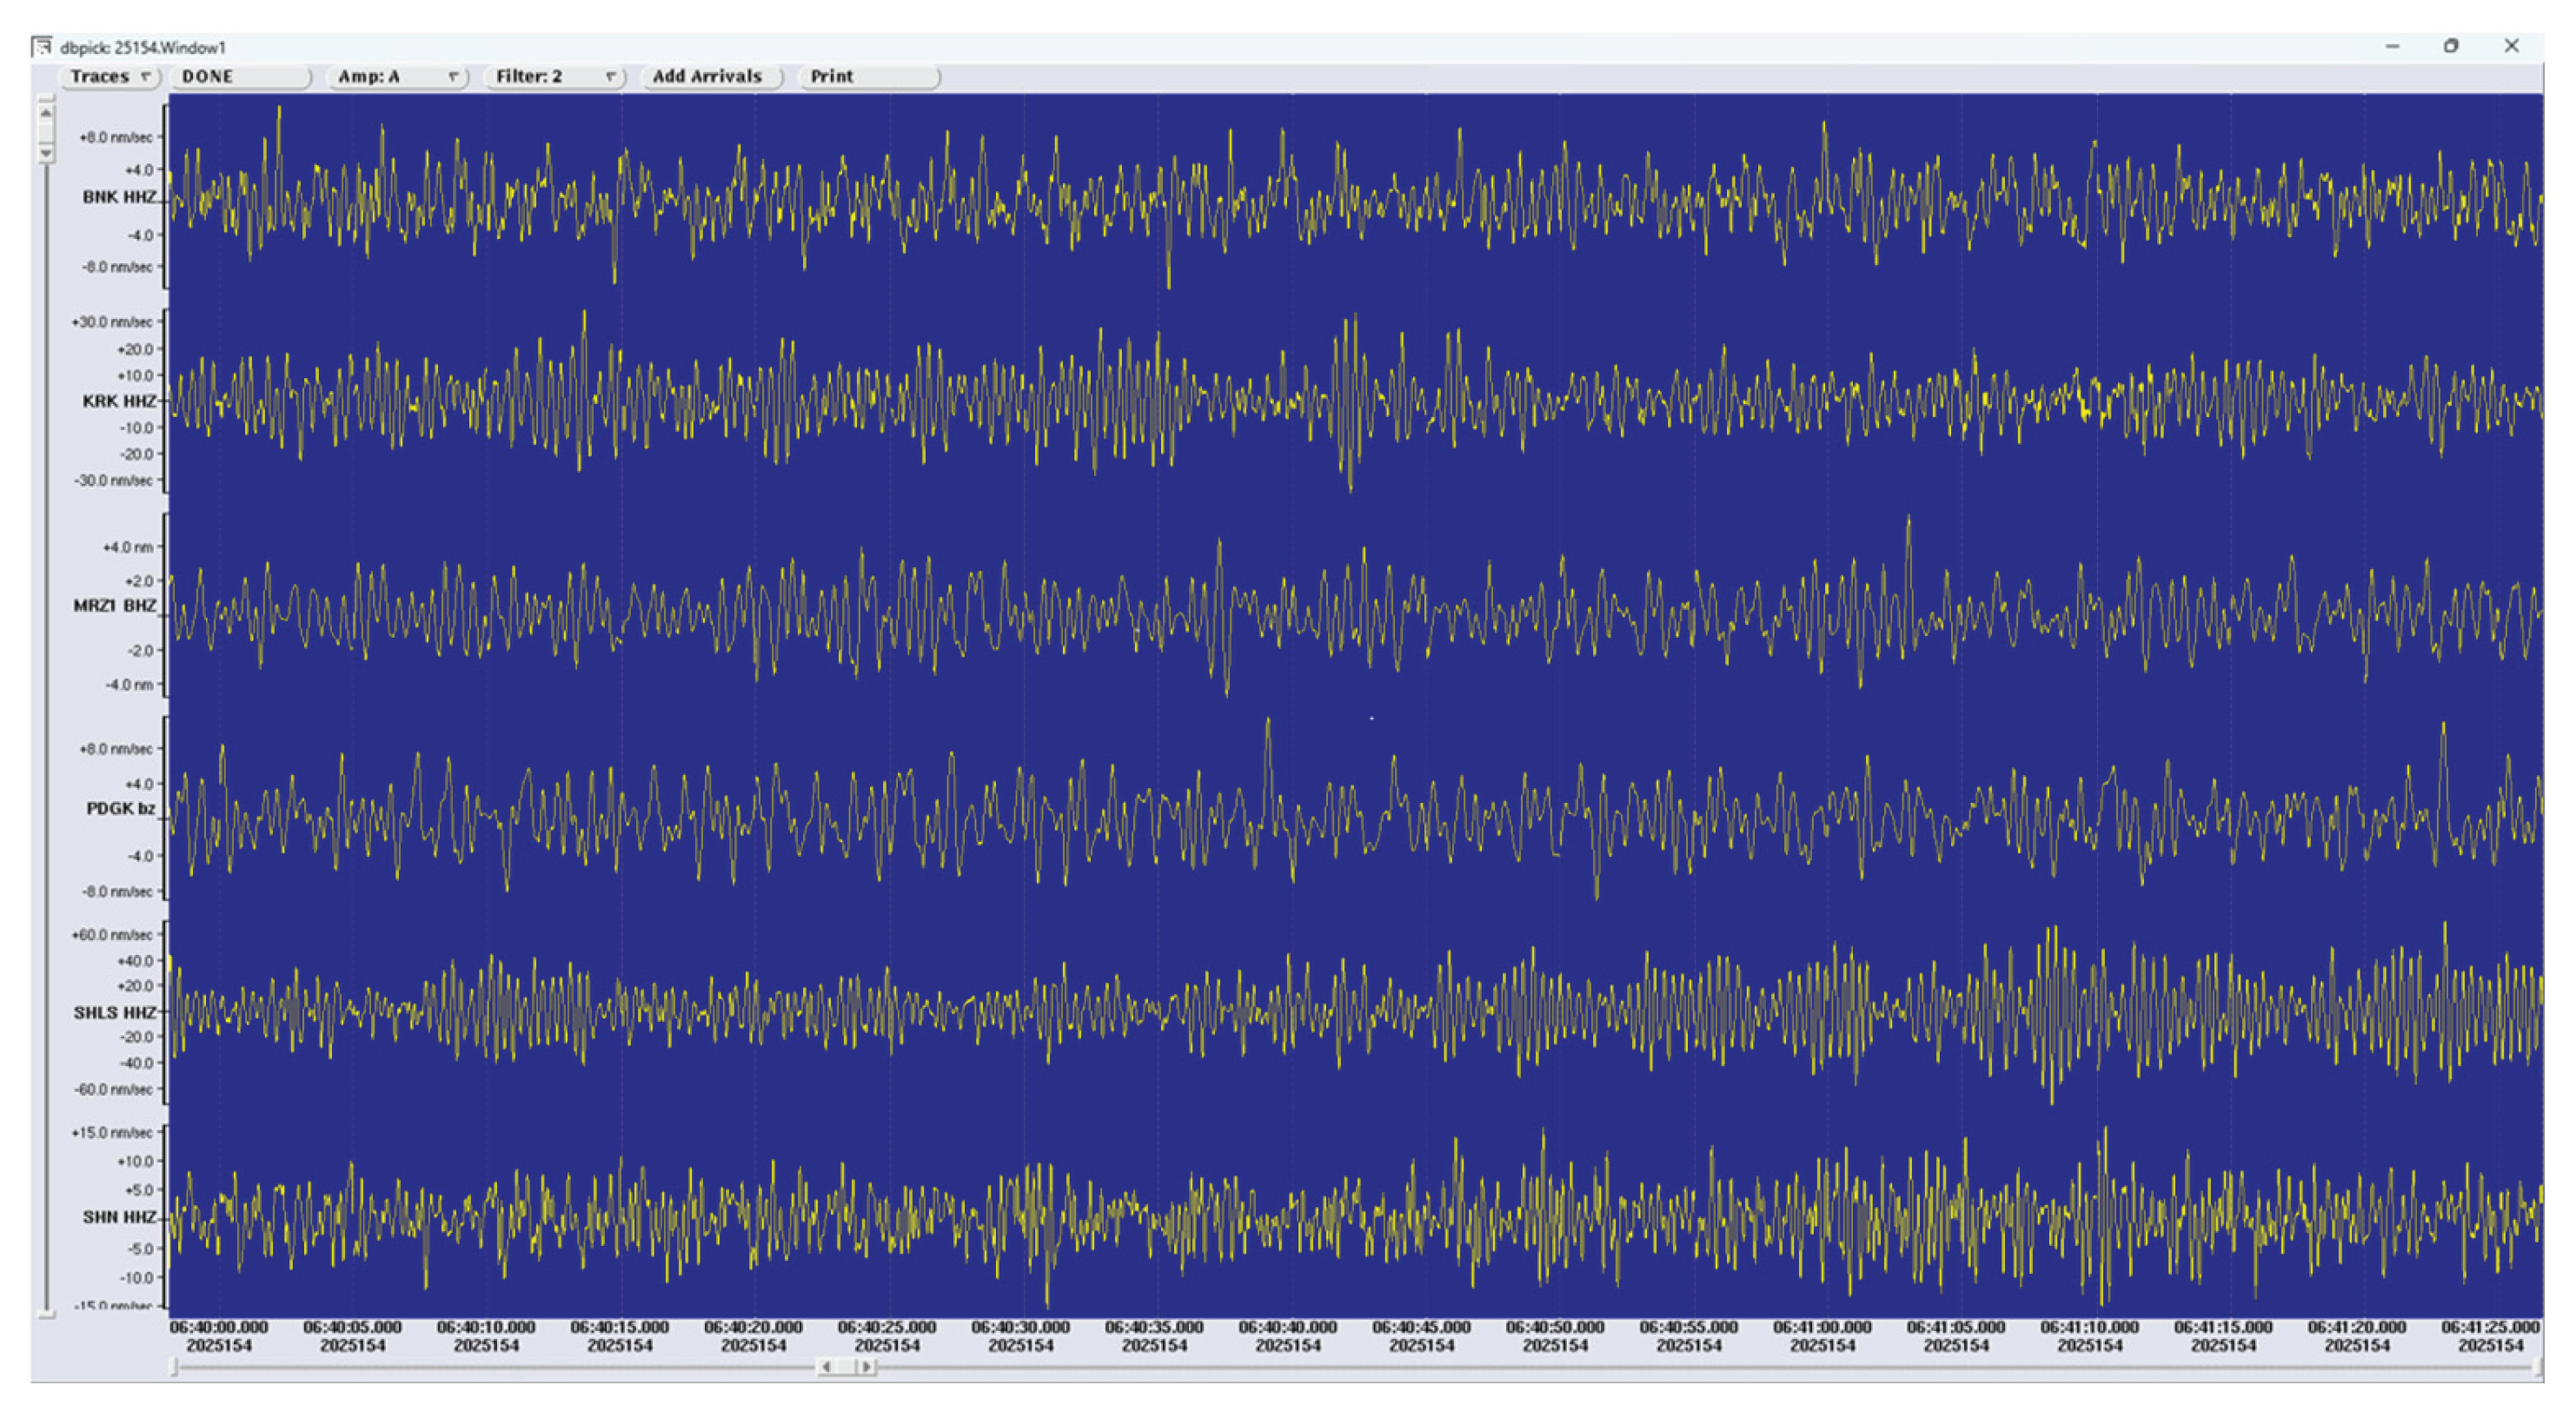
Figure 14.
The prevailing wind direction relative to the station location (red triangle).
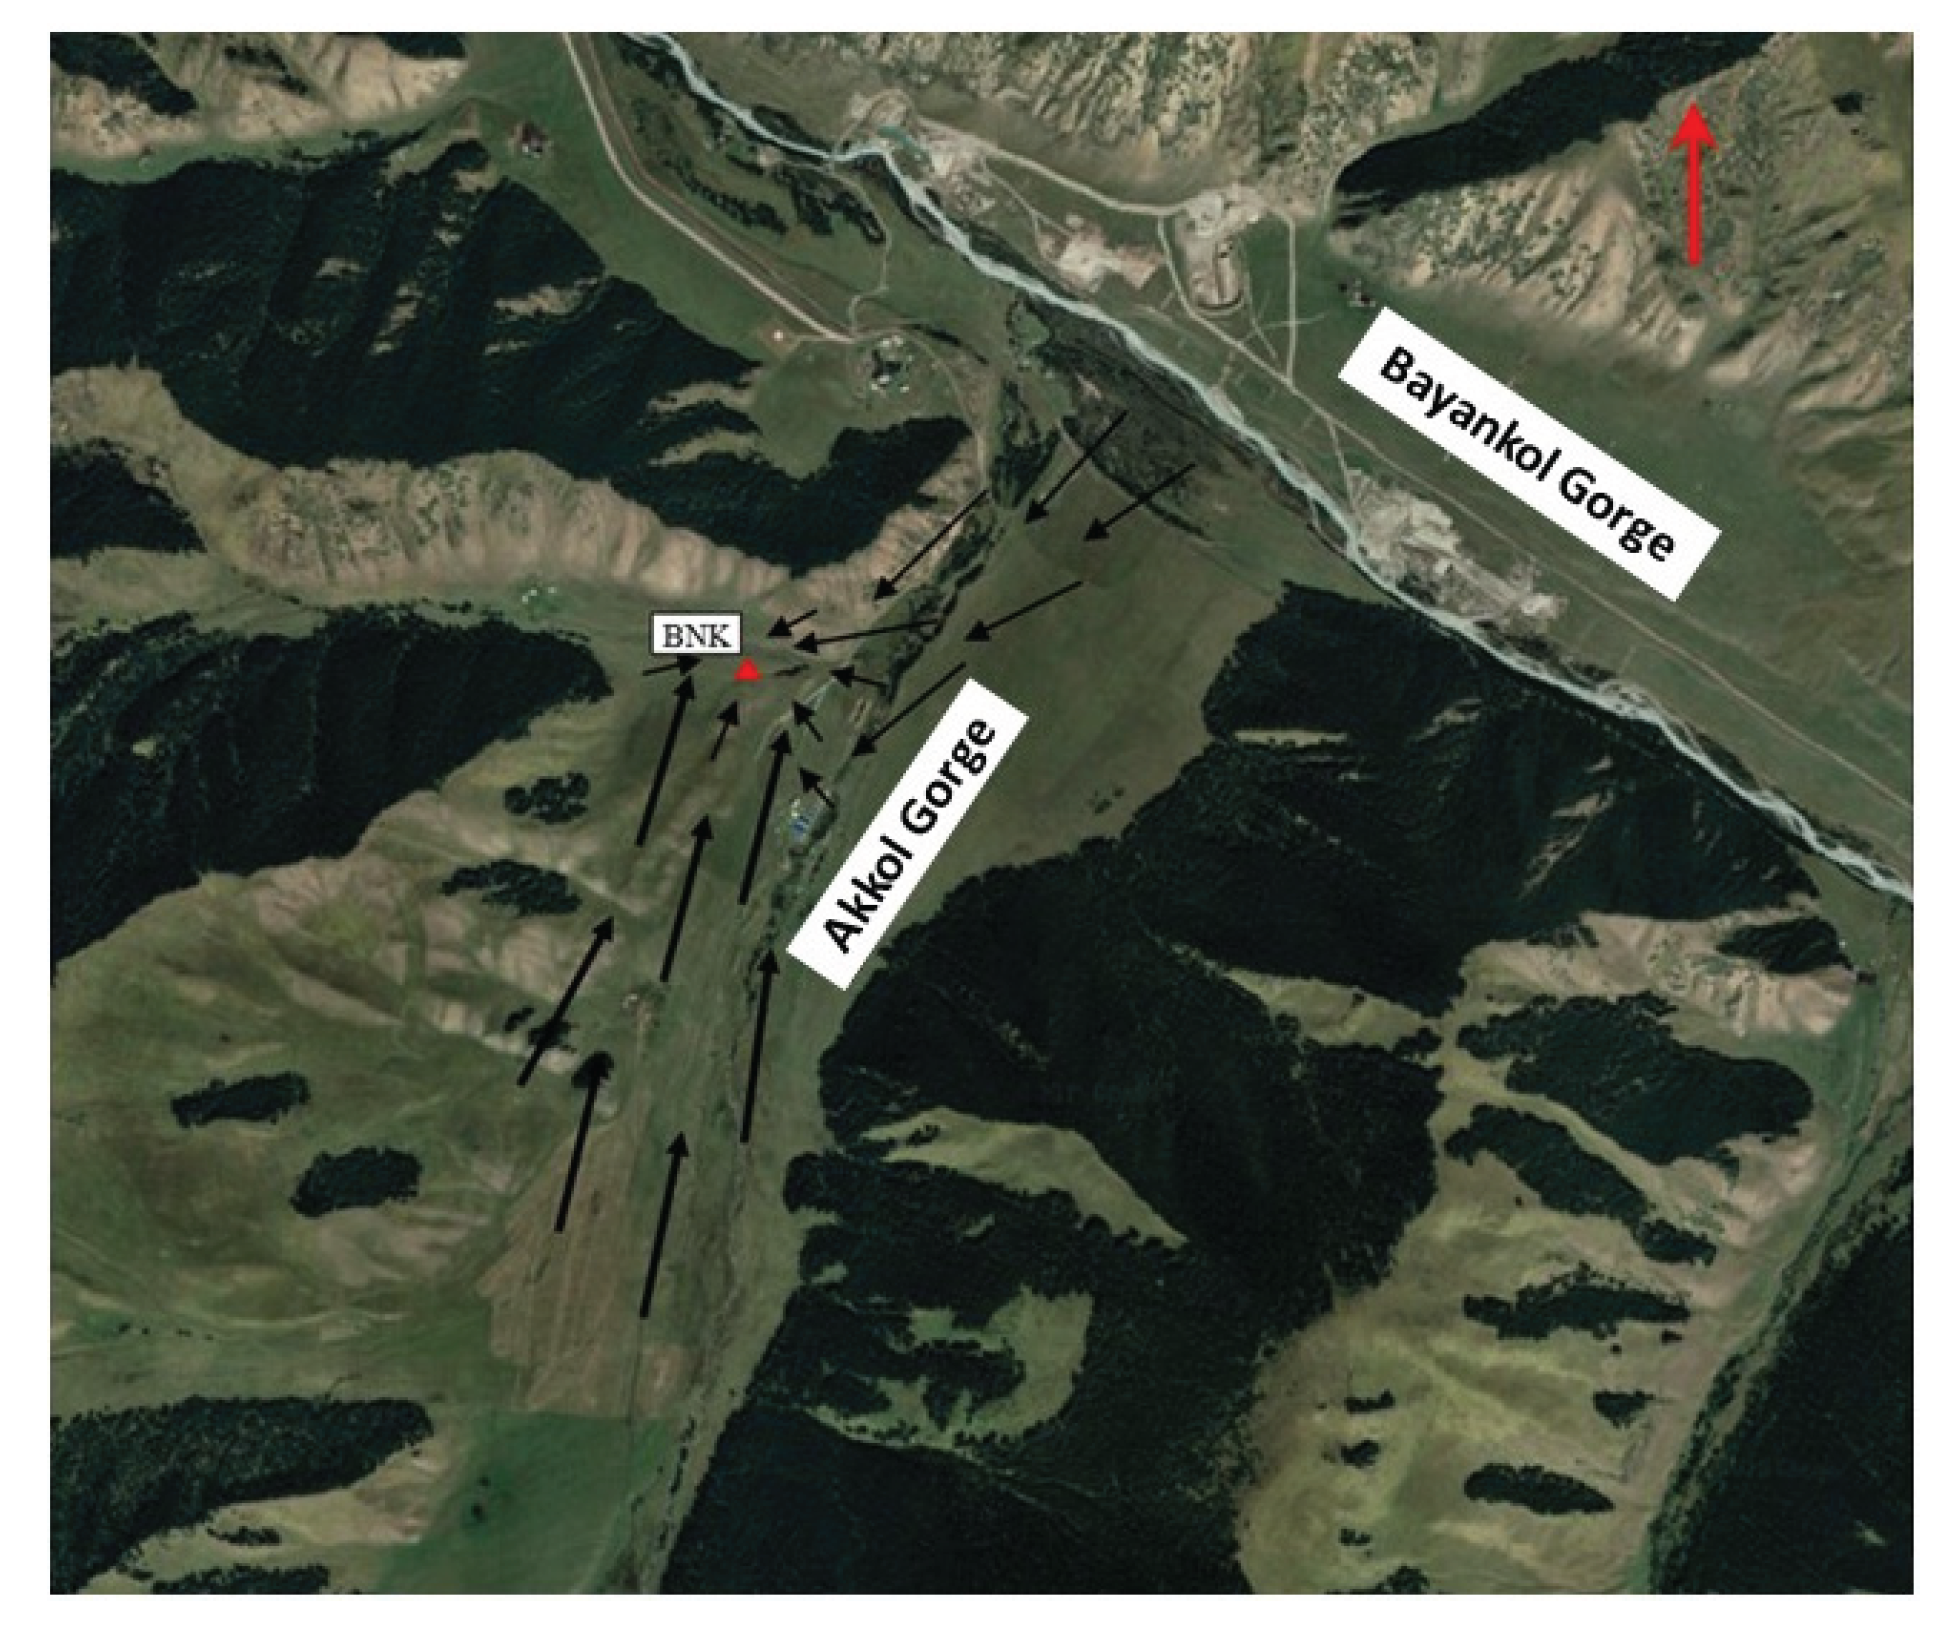
Figure 15.
Infrasound data (upper trace) recorded by the MB 3a microbarometer and temperature change graph (lower trace) over three days (Bayankol station).
Figure 15.
Infrasound data (upper trace) recorded by the MB 3a microbarometer and temperature change graph (lower trace) over three days (Bayankol station).
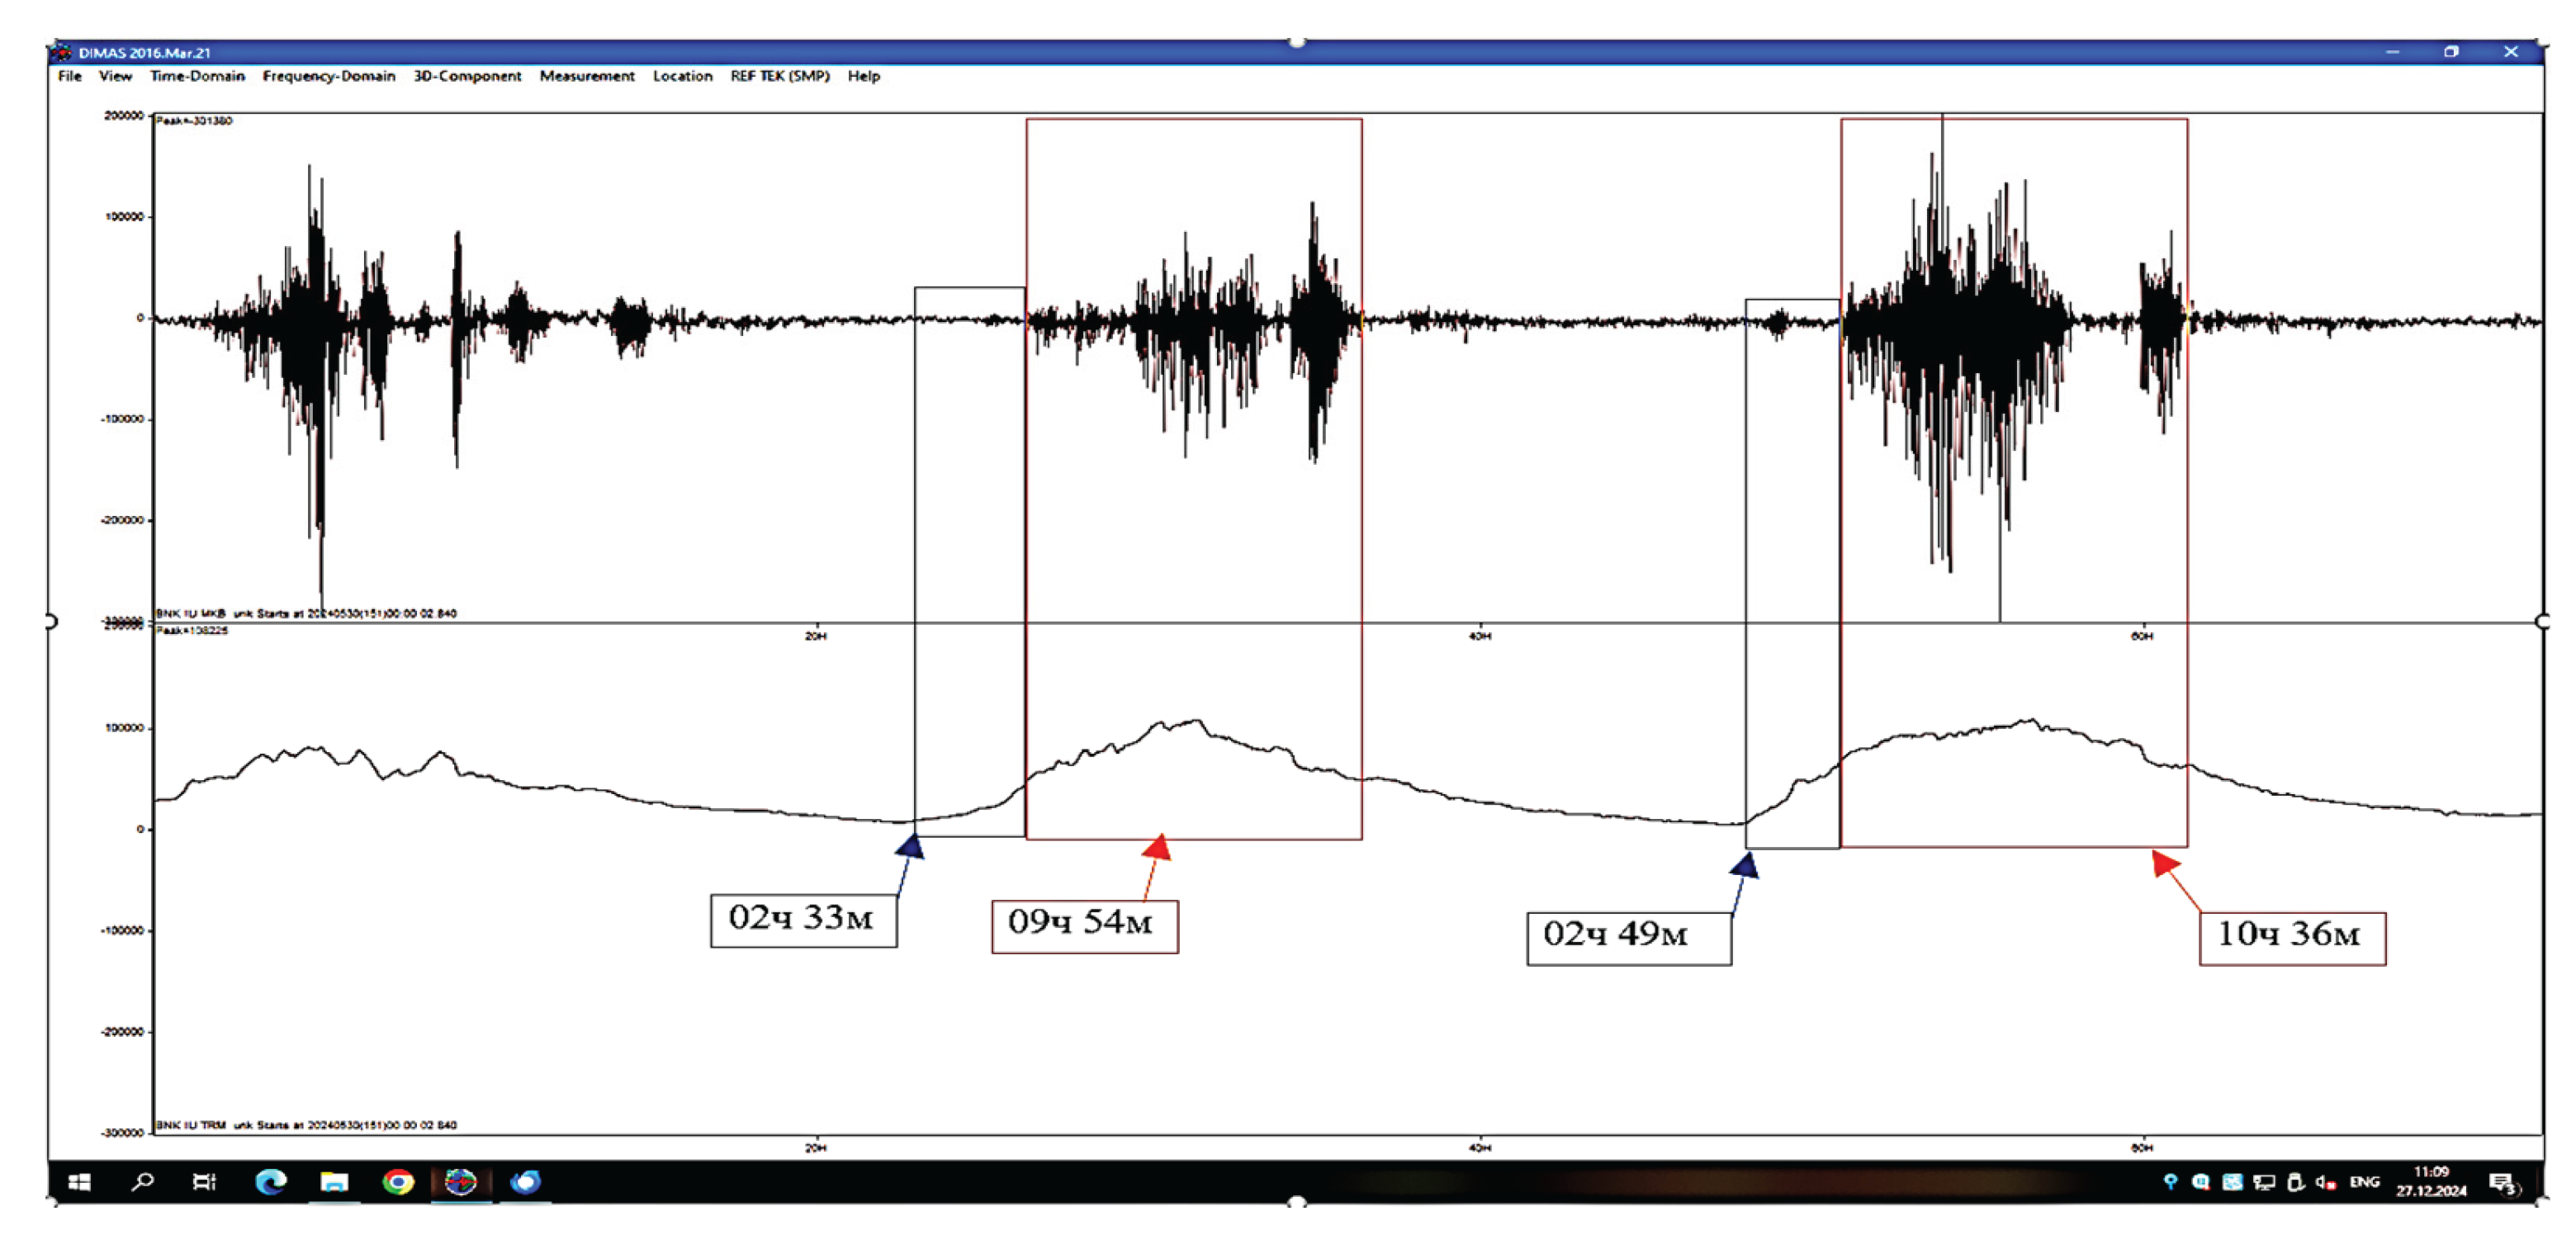
Figure 16.
Bayankol weather station, wind speed. The most intense change in wind speed is on 26 November 2024 at 07:07 GMT.
Figure 16.
Bayankol weather station, wind speed. The most intense change in wind speed is on 26 November 2024 at 07:07 GMT.
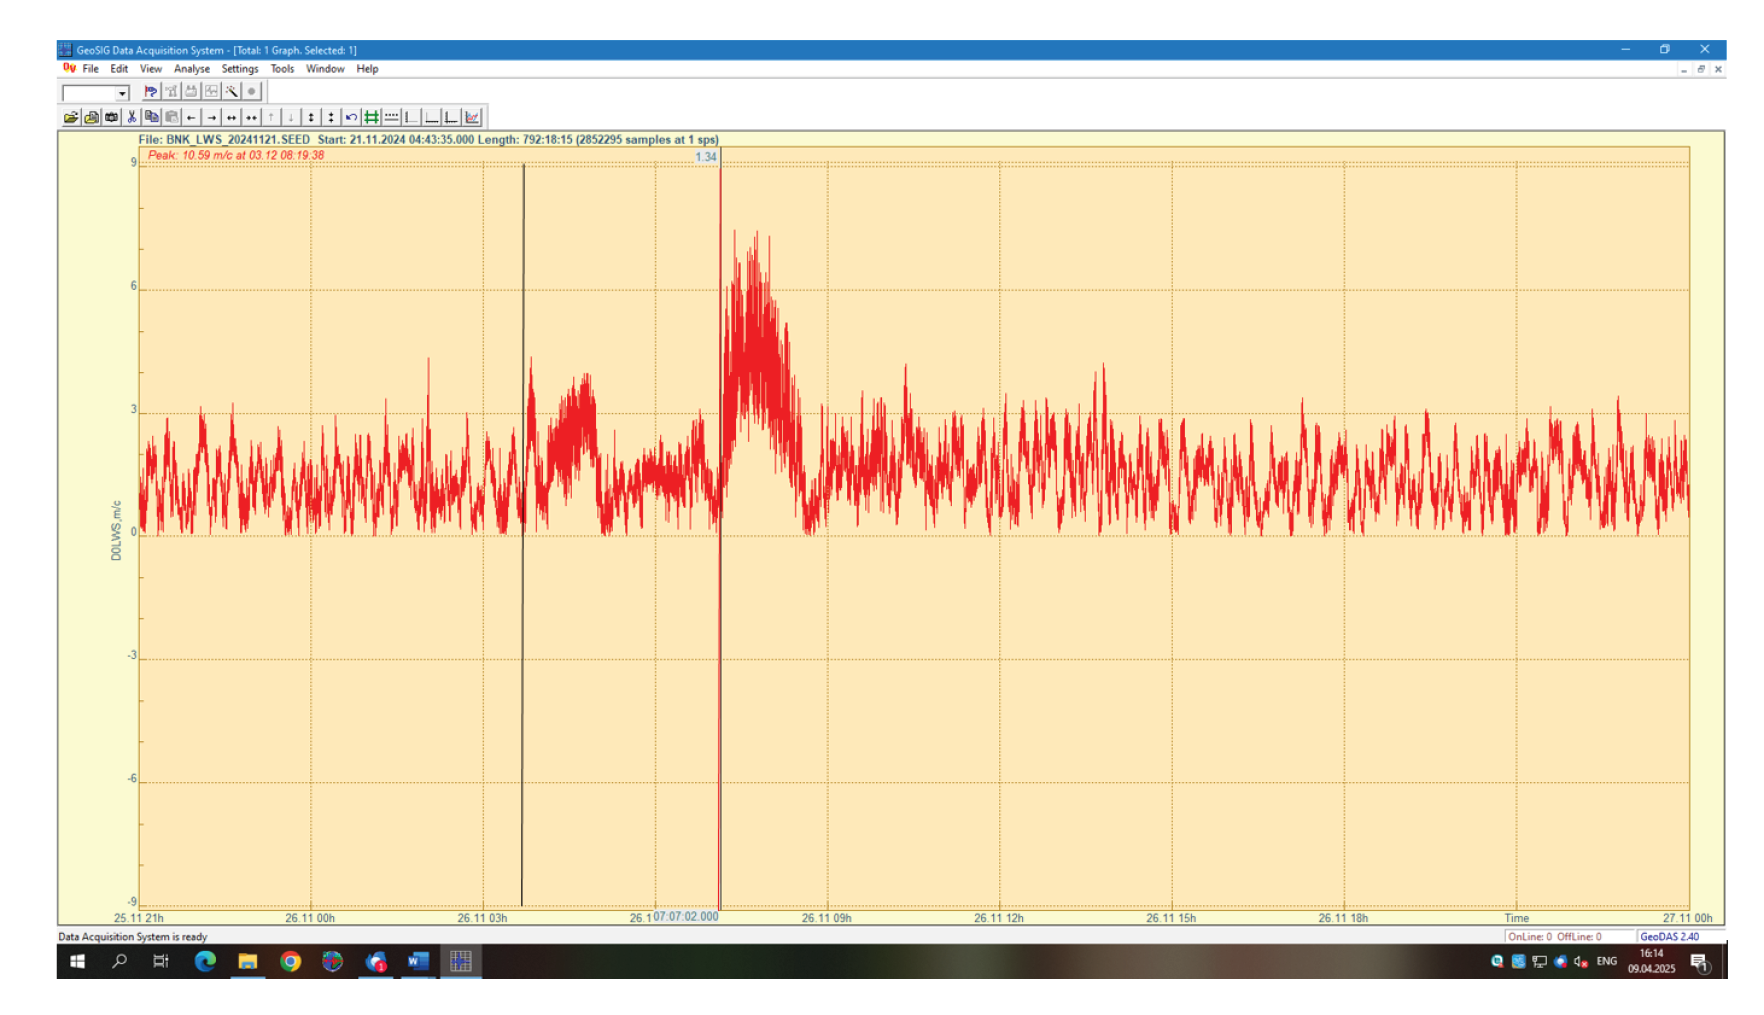
Figure 17.
Microbarometer MB 3a, Bayankol. The most intense change in amplitude is on 26 November 2024 at 07:07 GMT.
Figure 17.
Microbarometer MB 3a, Bayankol. The most intense change in amplitude is on 26 November 2024 at 07:07 GMT.
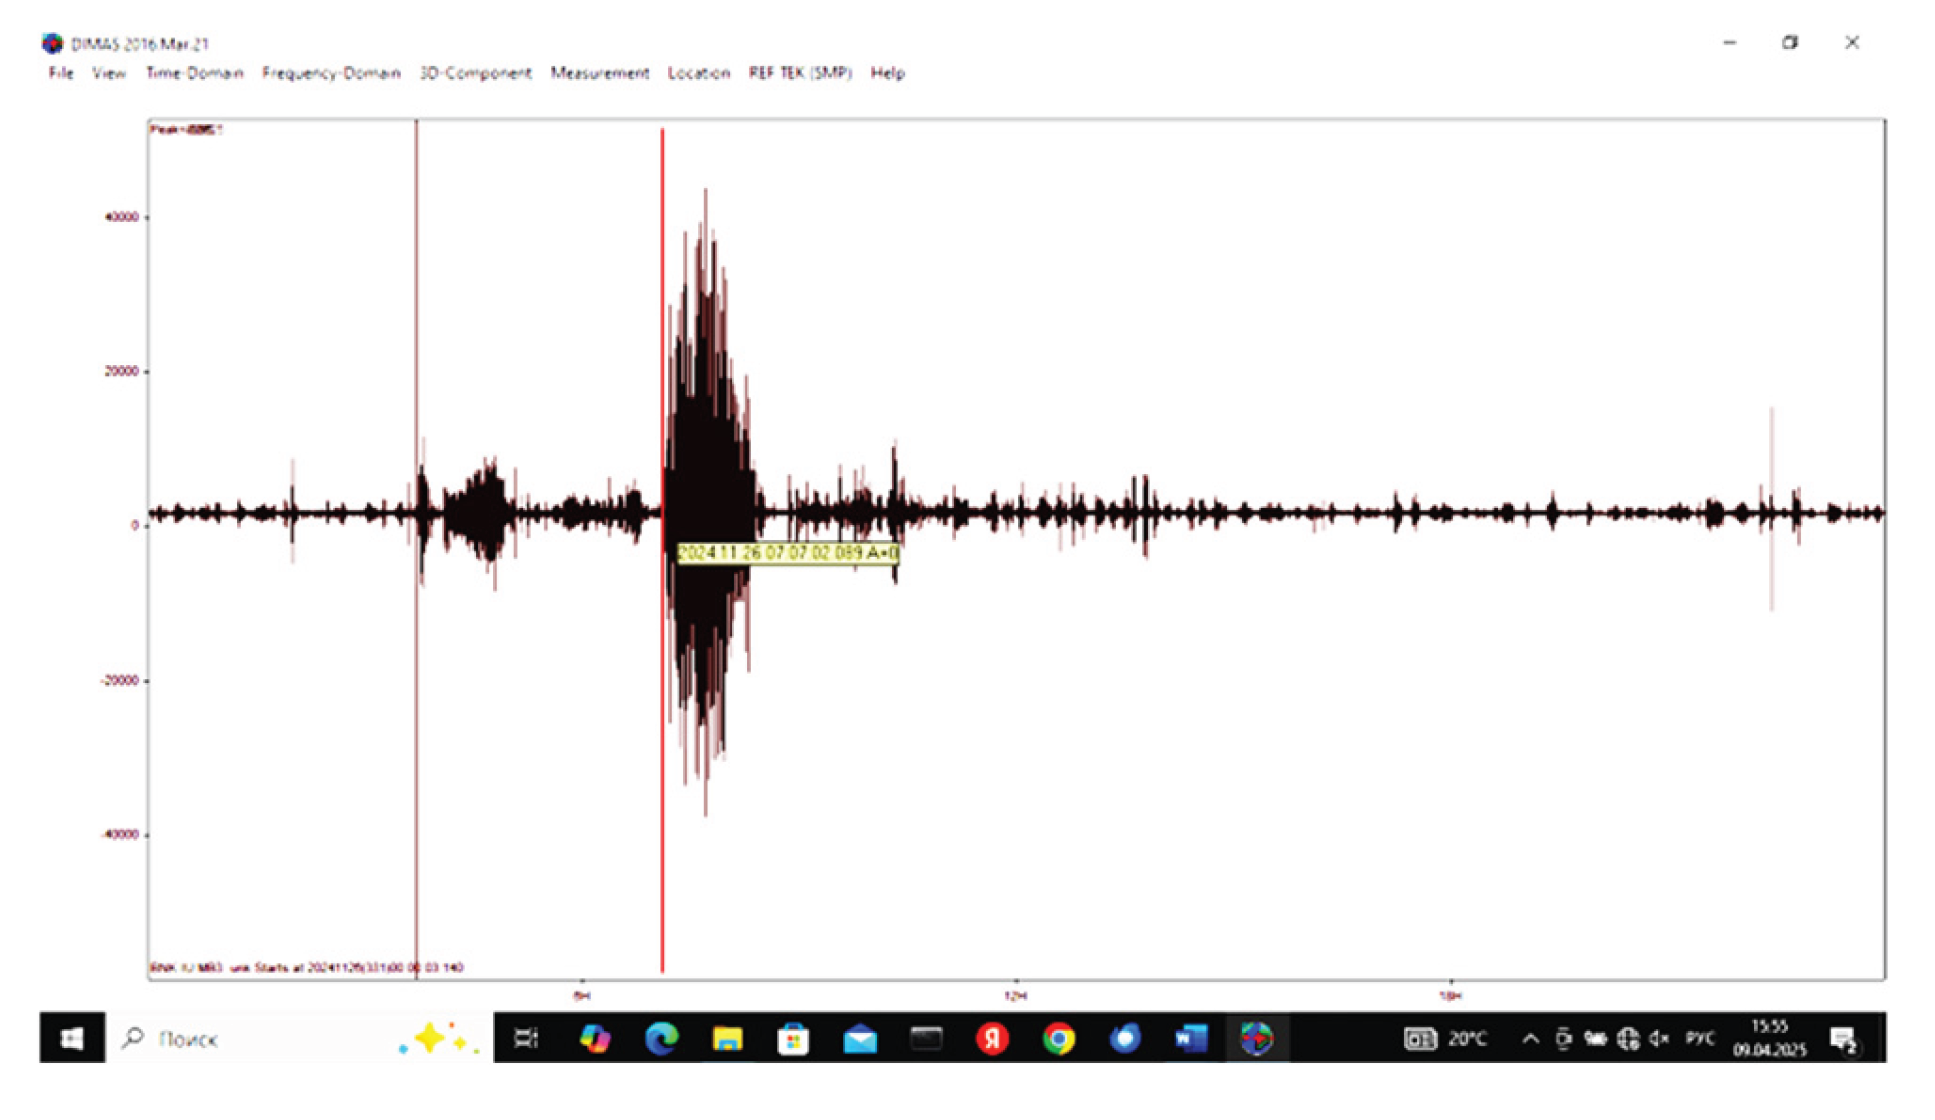
Figure 18.
A summary graph of temporary changes over a day by a set of data from a multi-parameter observation system at the Bayankol site. Top (1,2,3) – three components of seismic vibrations, below (4) – temperature changes, bottom (5) – microbarometer record.
Figure 18.
A summary graph of temporary changes over a day by a set of data from a multi-parameter observation system at the Bayankol site. Top (1,2,3) – three components of seismic vibrations, below (4) – temperature changes, bottom (5) – microbarometer record.
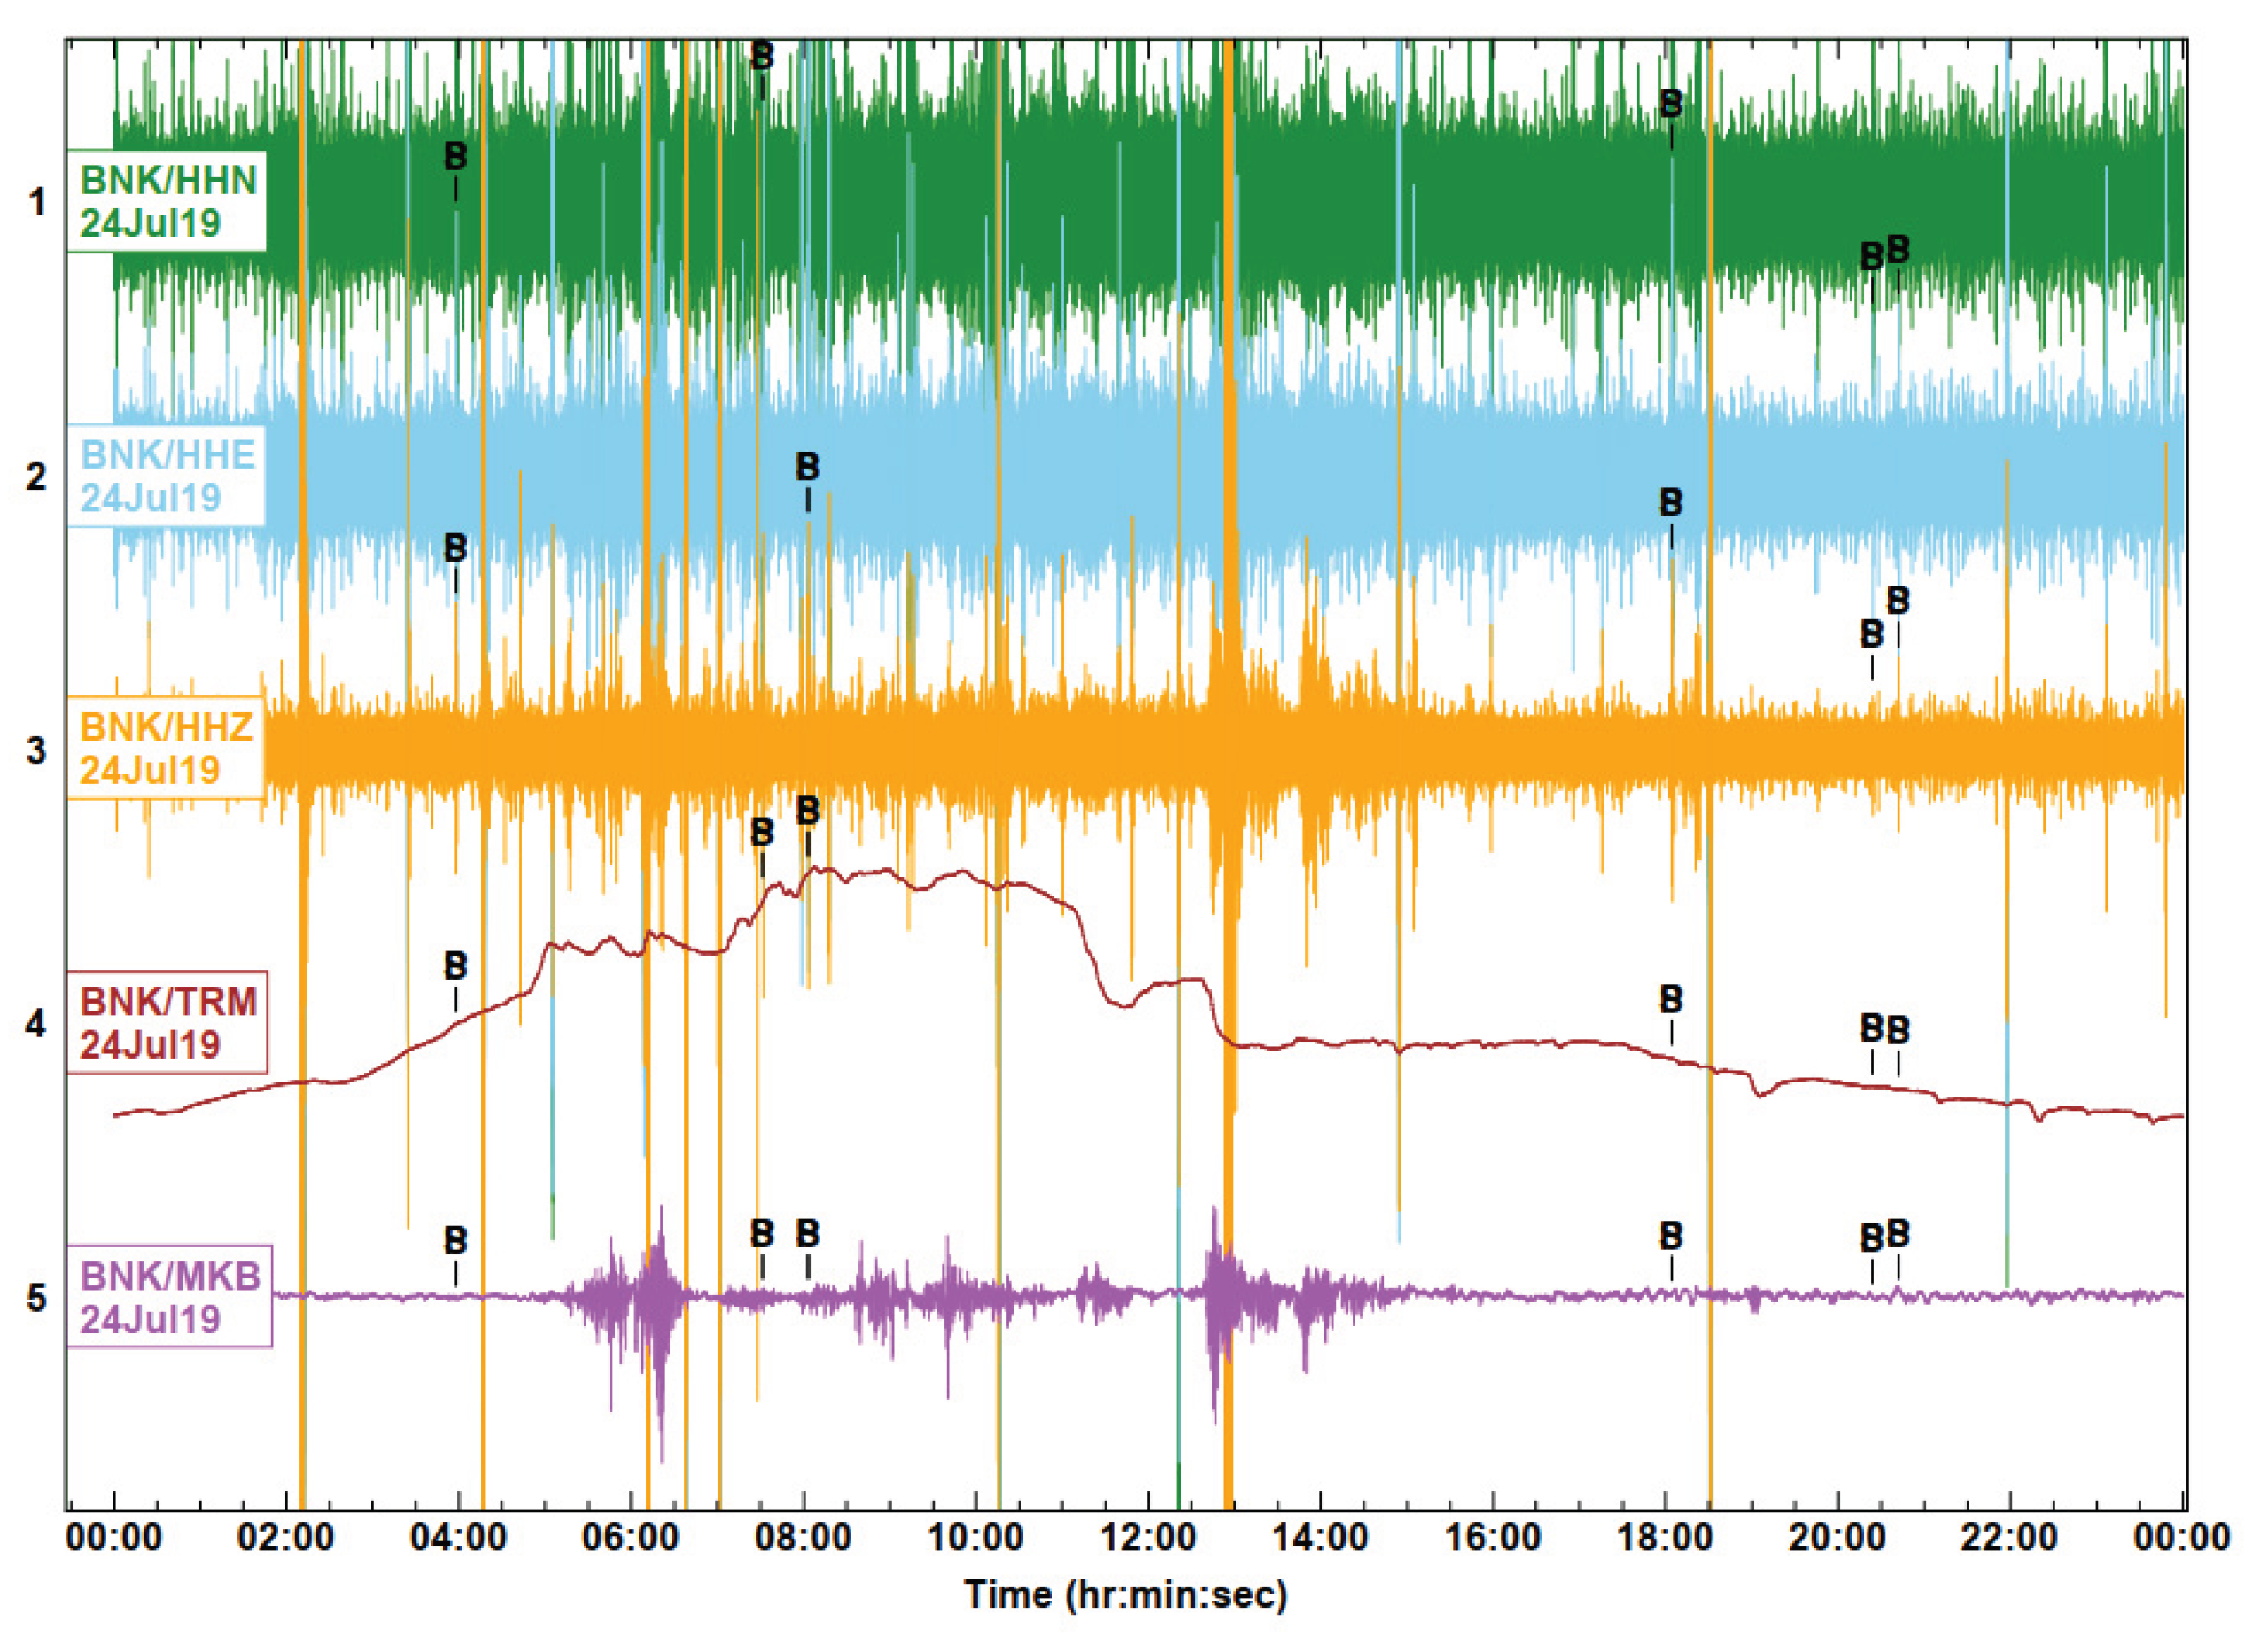
Figure 19.
The map of seismic events epicenters.
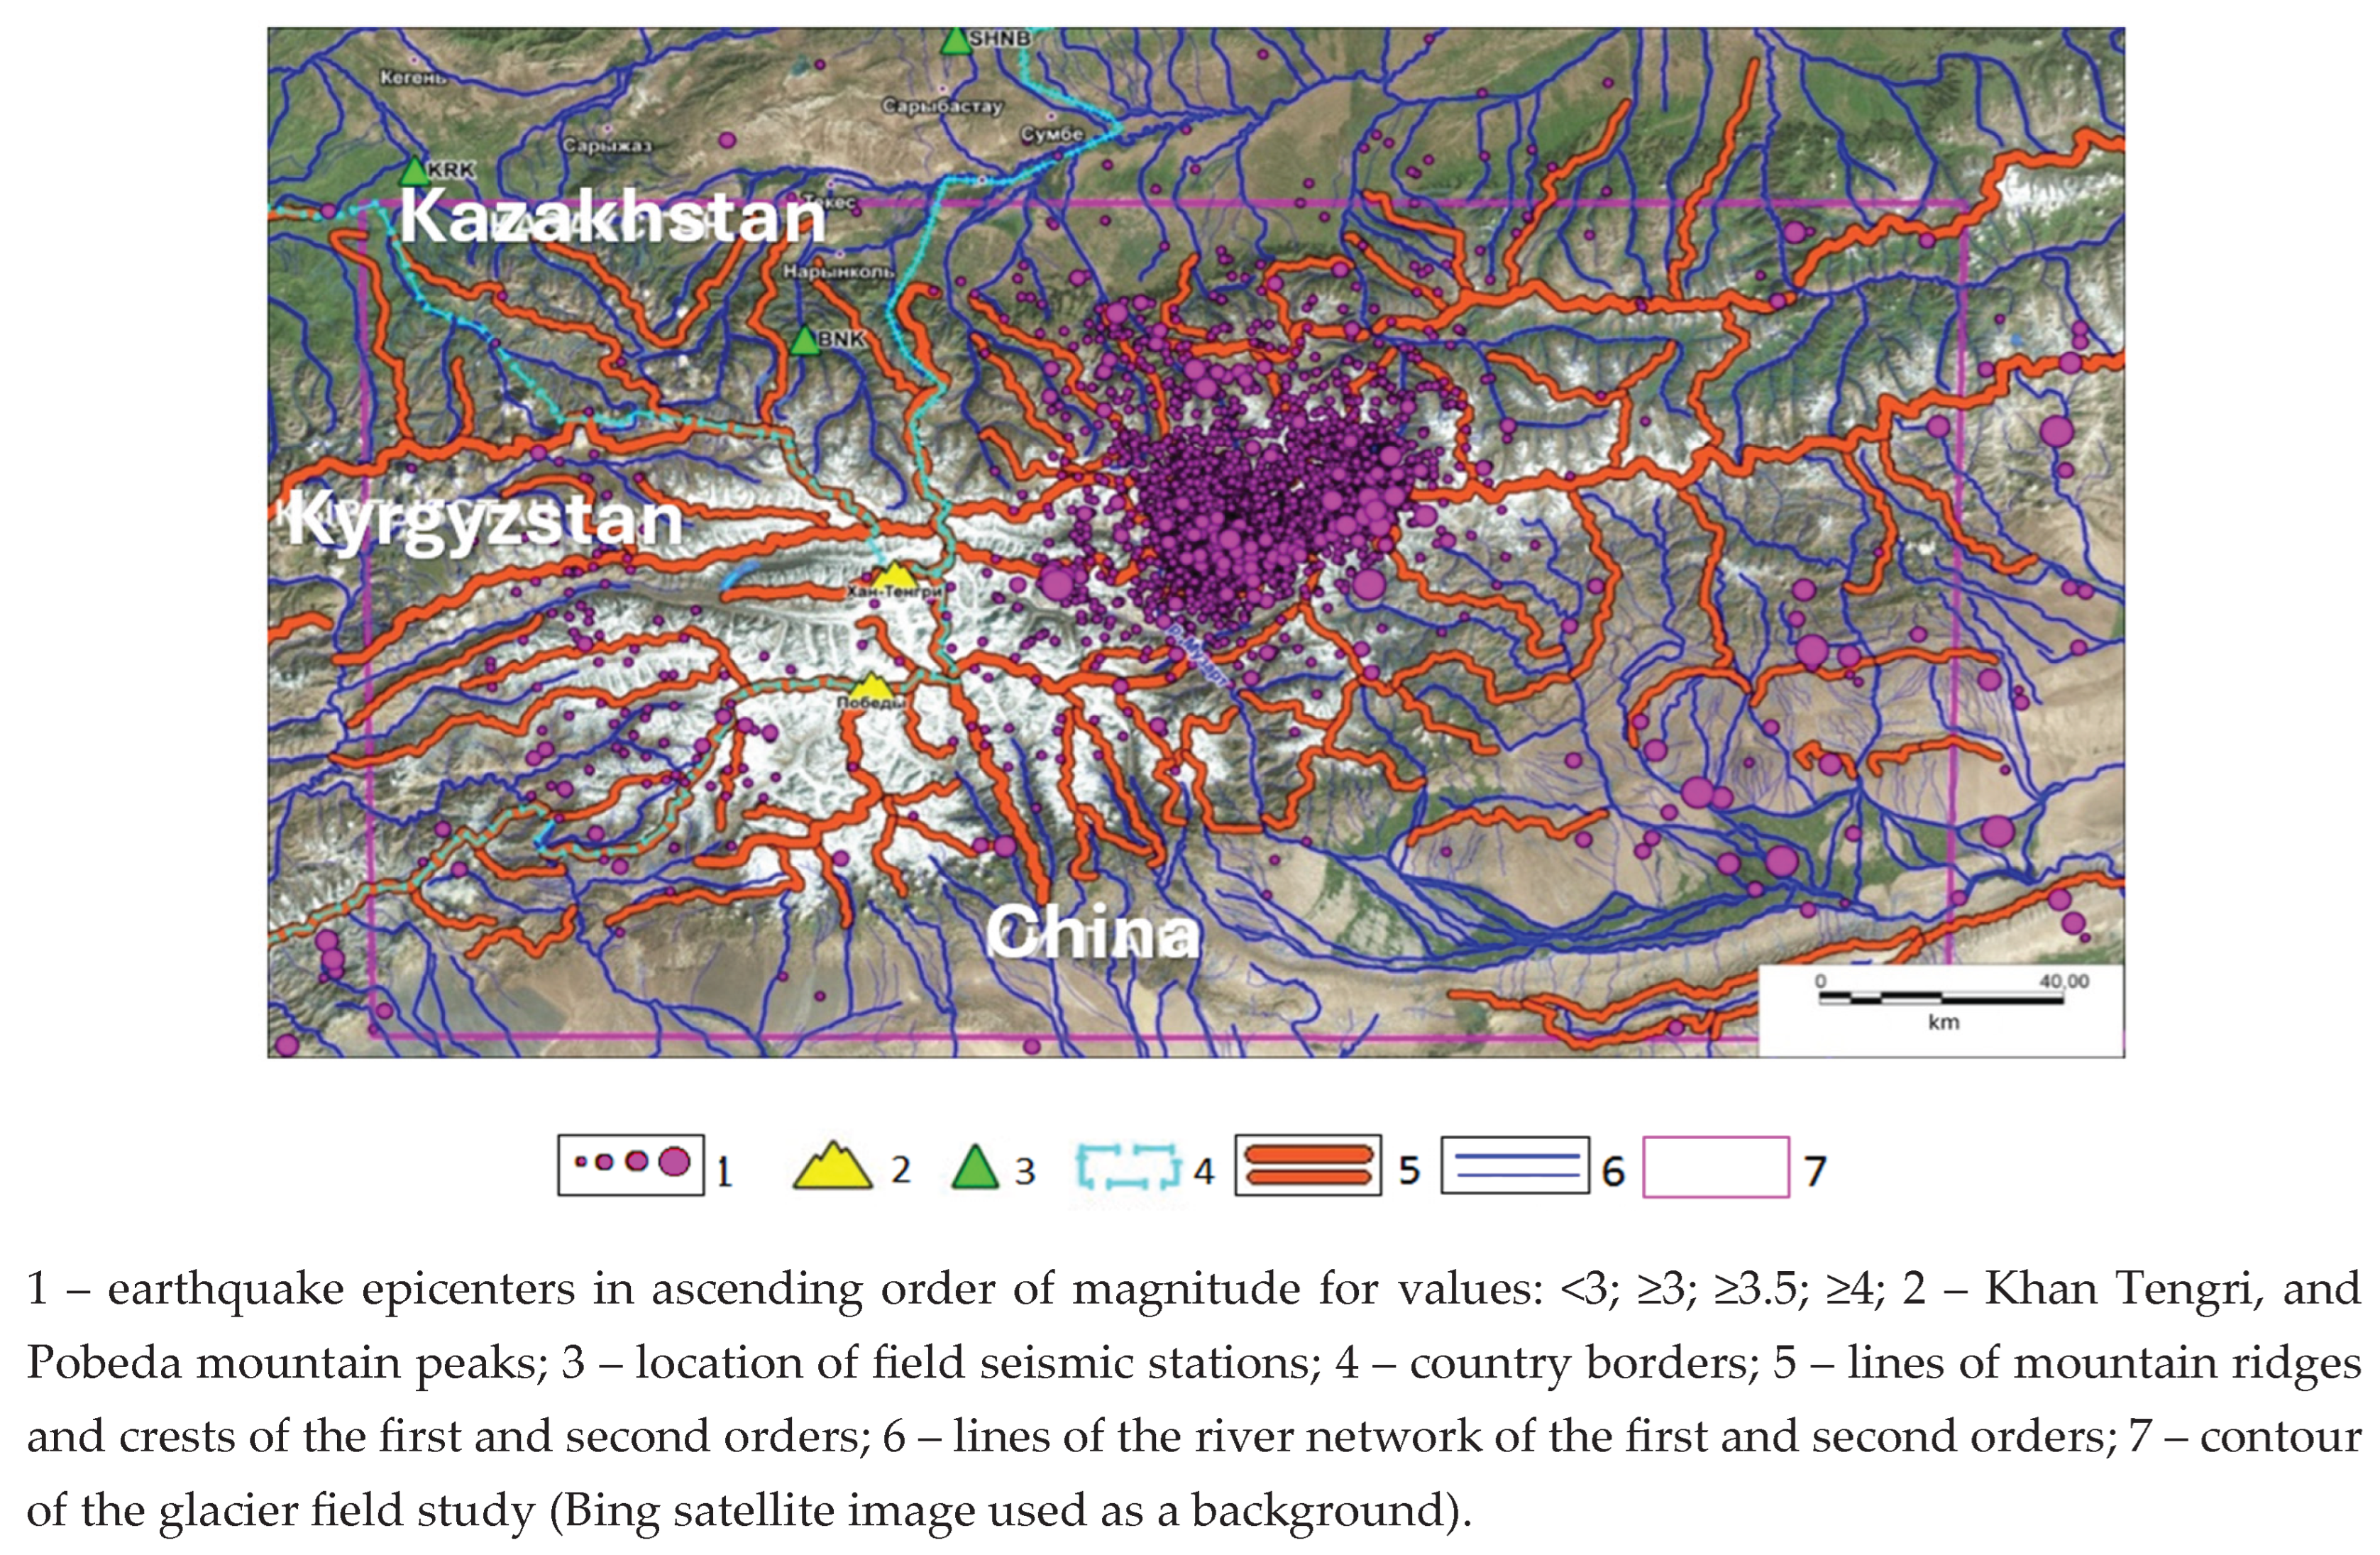

Table 1.
Stations names, codes, coordinates of near zone.
| Station name | Station code | Coordinates | Run date | ||
|---|---|---|---|---|---|
| Latitude φ,N | Lomgitude λ, Е | Elevation above sea level, m | |||
| “Karkara” | KRK | 42,84668° | 79,22432° | 2013 | 13.05.2024 |
| “Shynybek” | SHN | 43,04995° | 80,29720° | 2325 | 23.05.2024 |
| “Bayankol” | BNK | 42,5848° | 79,9976° | 2306 | 20.05.2024 |
Table 2.
The distance from the stations in the near zone to glacial events sources.
| Station name (code) | Epicenter to station distance |
|---|---|
| Shynybek (SHNB) | 75 km |
| Karkara (KRK) | 135 km |
| Bayankol (BNK) | 60 km |
| Podgornoye (PDGK) | 160 km |
| Shalkode (SHLS) | 115 km |
| Merzbacher (MRZ1) | 0-50 km |
Table 3.
Magnitude of longitudinal waves (mpv).
| Station | mpv (night) | mpv (day) | Diurnal difference |
|---|---|---|---|
| BNK | 1.65 | 1.95 | +0.30 |
| KRK | 2.39 | 2.74 | +0.35 |
| PDGK | 2.14 | 2.44 | +0.30 |
| SHN | 2.00 | 2.34 | +0.34 |
| SHLS | 2.56 | 2.86 | +0.30 |
| MRZ1 | 1.65 | 1.75 | +0.10 |
Table 4.
Energy class (K).
| Station | K (night) | K (day) | Difference |
|---|---|---|---|
| BNK | 4.70 | 5.24 | +0.54 |
| KRK | 5.91 | 6.55 | +0.64 |
| PDGK | 5.43 | 5.98 | +0.55 |
| SHN | 5.26 | 5.86 | +0.60 |
| SHLS | 6.31 | 6.85 | +0.54 |
| MRZ1 | 4.96 | 5.50 | +0.54 |
Disclaimer/Publisher’s Note: The statements, opinions and data contained in all publications are solely those of the individual author(s) and contributor(s) and not of MDPI and/or the editor(s). MDPI and/or the editor(s) disclaim responsibility for any injury to people or property resulting from any ideas, methods, instructions or products referred to in the content. |
© 2025 by the authors. Licensee MDPI, Basel, Switzerland. This article is an open access article distributed under the terms and conditions of the Creative Commons Attribution (CC BY) license (http://creativecommons.org/licenses/by/4.0/).
Copyright: This open access article is published under a Creative Commons CC BY 4.0 license, which permit the free download, distribution, and reuse, provided that the author and preprint are cited in any reuse.


