
Submitted:
26 November 2025
Posted:
04 December 2025
You are already at the latest version
Abstract
Oil and gas exploration conducted in the main fault zone of the Fuman Oilfield has yielded large-scale and high-production results. Against this background, the non-fault zone has emerged as a new domain for oil exploration endeavors. Nevertheless, the establishment of a unified sequence division scheme for the study area remains unachieved, primarily constrained by two key factors: first, the high costs associated with ultra-deep high-density coring operations; and second, the inconspicuous response characteristics exhibited by logging curves. This absence of a standardized scheme has further impeded the progress of oil and gas exploration in the non-main fault inter-region within the study area. Consequently, the present study is based on multi-source data, including seismic data, logging data, and field outcrop data. The magnetic susceptibility of the cement plant section and the natural gamma data sequence of the Yangjikan section were measured for cyclostratigraphy analysis. The sedimentary noise model was introduced to reconstruct the sea level, and the sequence division scheme of the Fuman area was discussed. The results show that the Middle-Lower Ordovician Yijianfang Formation-Penglaiba Formation preserves relatively intact astronomical signals. The DYNOT model reconstructs a good correspondence between sea level rise and fall and field characteristics, which can be used as a new method for sequence division in this area. Finally, the third-order and fourth-order sequence division schemes in Fuman area are proposed. The Yijianfang Formation-Penglaiba Formation is divided into 4 third-order sequences and 11 fourth-order sequences, which provides a basis for the characterization of dominant facies belts in Fuman area and regional exploration between non-faults.
Keywords:
Fuman area
; Lower-Middle Ordovician
; sequence stratigraphy
; cyclostratigraphy
; sedimentary noise model
1. Introduction
The Tarim Basin is abundant in ultra-deep marine carbonate oil and gas resources. In recent years, driven by the breakthroughs in exploration practices that go beyond the traditional theoretical framework of “oil control by paleo-uplifts and hydrocarbon enrichment in slope zones”, coupled with the continuous advancement of supporting technologies in seismic exploration, drilling engineering, and oil-gas development, an ultra-deep (>7,500 meters) oilfield controlled by strike-slip faults—the Fuman Oilfield—has been successfully discovered in the depression area of the basin. This oilfield has proven geological resources of 1 billion tons of oil equivalent, making it a key block for the development of fault-controlled fractured-vuggy reservoir oil and gas in the Tarim Basin [1].However, with the continuous advancement of oil and gas exploration in the main strike-slip fault zones, exploring new exploration areas between faults has become a crucial focus for maintaining reserve and production growth of ultra-deep oil and gas [2].The major breakthrough in condensate gas exploration achieved by Well Fudong 1 within the intra-platform shoal of the Ordovician Yingshan Formation in the non-main fault zone has confirmed that the intra-platform shoal sedimentary zone situated between main faults constitutes a key exploration area endowed with oil and gas accumulation potential. Nevertheless, a systematic stratigraphic division scheme for the three-level and four-level sequences of the Ordovician in the Fuman area has not yet been established. This inadequacy has not only restricted the characterization and prediction of favorable facies zones critical to the formation of high-quality reservoirs but also hindered the scientific deployment of oil and gas exploration activities in new areas of non-main fault zones. Based on the theoretical method of sequence stratigraphic division proposed by Vail et al. (1987), the current three-level and four-level sequence stratigraphic division in the Fuman area faces the following difficulties:1.Limited seismic resolution restricts the division of four-level and higher-order sequence stratigraphy;2.Ultra-deep coring is costly, resulting in insufficient core data;3.The logging response characteristics of four-level and higher sequence stratigraphic boundaries are not obvious.In recent years, the development of cyclostratigraphy has provided new ideas for sequence stratigraphic division [3,4,5,6]. This study attempts to identify the astronomical orbital cycle parameter information in the strata based on logging data. Using the sedimentary noise model of orbital parameters [7], it reconstructs high-precision sea-level fluctuations to realize three-level and four-level sequence stratigraphic division. Additionally, the third-level and fourth-level sequences delineated based on field outcrop data are employed to validate this model and demonstrate its reliability. Should the reliability of this methodology be verified, it will enable the “high-efficiency and low-cost” division of third-level and fourth-level sequences that relies exclusively on logging data. This, in turn, will provide a robust scientific foundation for the characterization of favorable sedimentary facies and the advancement of oil-gas exploration endeavors within this region.
2. Geological Setting
The Tarim Basin is located in the southern part of Xinjiang Uygur Autonomous Region, China, between the Tianshan Mountains, Altun Mountains, and Kunlun Mountains. It is a large-scale superimposed composite basin and a relatively stable ancient craton block within the Tarim Plate, with multi-stage plate margin active zones distributed around its periphery [8].The Fuman area is situated in the northern depression zone, a secondary tectonic unit of the Tarim Basin. The study area mainly covers the Aman Transition Zone in the central part of the northern depression (Figure 1A) [9]. The Aman Transition Zone is a transitional area between the Awati Sag and the Manjiaer Sag. It is adjacent to the Manjiaer Sag in the east, connected to the Tazhong Uplift of the Central Uplift in the south, close to the Awati Depression in the west, and gradually transitions to the Tabei Uplift in the north [10].During the Late Cambrian to Early Ordovician, the Tarim Basin was generally in an east-west trending weak extensional stress environment. A large carbonate platform was formed in the western part of the Manjiaer Depression [11,12],with its tectonic-paleogeographic features characterized by higher terrain in the south and west, and lower terrain in the north and east. In the Middle Ordovician, the Tazhong area was gradually uplifted into a large fault-uplift due to north-south compression [13], while a nearly east-west trending subaqueous low uplift was formed in the Tabei area. The overall structure was relatively gentle. The Aman area, located between the two, became part of the extension of the Tabei area and initially formed the prototype of the Aman Transition Zone.By the end of the Ordovician, the Tabei area continued to uplift, further strengthening the slope characteristics of its southern margin. Meanwhile, the Manjiaer Sag developed further, and the Aman Transition Zone gradually took shape [14]. In the Late Caledonian, the Tabei Uplift was uplifted again, and the south-dipping slope characteristics of the vast area of the Aman Transition Zone were strengthened and finalized. During the Himalayan period, the Mesozoic-Cenozoic strata in the Aman Transition Zone generally tilted northward, while the Lower Paleozoic strata still showed a southward tilt. Since then, the current tectonic framework of the Aman Transition Zone has been formed (Figure 1B) [15].The Fuman area has an overall sedimentary setting of a semi-restricted platform [16]. The Ordovician marine lithostratigraphic units in this area, from bottom to top, are the Penglaiba Formation, Yingshan Formation, and Yijianfang Formation. Their lithological characteristics are as follows: ① The Penglaiba Formation is mainly composed of argillaceous micritic dolomite, containing a small amount of sandy dolomite; ② The upper member of the Yingshan Formation is mainly interbedded with sandy limestone and micritic limestone, while the lower member is dominated by the interbedding of sandy limestone and dolomitic micritic limestone; ③ The Yijianfang Formation is mainly sandy limestone, containing some micritic limestone (Figure 1C).
3. Materials and Methods
This study made full use of various types of currently available data, encompassing conventional logging data, carbon isotope data, elemental logging data, field outcrop data, and field-measured magnetic susceptibility (MS) data from the Fuman area. Specifically, the field outcrop data were acquired from the Penglaiba Formation of the Cement Plant Section, the Yingshan Formation of the Yangjikan Section, and the Yijianfang Formation of the Yijianfang Section within the Kalpin-Bachu area. For the collection of MS data, an MS-30 magnetometer was adopted, with samples collected at 5 cm intervals from the Penglaiba Formation of the Kalpin Cement Plant Section. Regarding the gamma ray (GR) data of the Yangjikan Section, an XHG-2000M portable digital multi-channel gamma spectrometer was utilized to conduct point scanning at 20 cm intervals on the fresh surface of the section, thereby obtaining a continuous sequence of natural gamma data.The research theory was mainly based on Fisher’s (1967) sequence stratigraphy for the division of third-order sequences. The methods used for identifying classic sequence boundaries are as follows:
1 Logging curves can identify vertical sedimentary evolution characteristics, among which the GR curve is commonly used to analyze the presence of unconformities. When the sequence boundary is a sedimentary discontinuity, the clay content increases, and the content of radioactive elements increases accordingly. This can cause the GR value at the boundary to increase, showing a serrated peak, and is often accompanied by characteristics such as decreased resistivity [17]. The Th/K ratio can be used to analyze clay types and sedimentary environments, reflecting the relative changes in the sedimentary base level [18]. A high Th/K ratio mainly indicates a weathering and exposure environment, while a low Th/K ratio represents a subaqueous sedimentary environment. The Th/U ratio can effectively indicate changes in redox environments.
2 Carbon isotopes can be used as an indicator of global relative sea-level changes. Generally, a global sea-level rise or high sea level is conducive to the preservation of sedimentary organic matter, corresponding to a heavier or positive shift in inorganic carbon isotopes; conversely, carbon isotopes show a lighter or negative shift [19].
3 Near unconformities, there are often characteristics of inert element enrichment and mobile element loss. Due to the influence of late diagenesis, the elemental characteristics may not reflect the original sedimentary conditions, but they can still be used as one of the auxiliary indicators for judging sequence boundaries. In field outcrops, sequence boundaries are relatively easy to identify. Stratigraphic unconformities are often accompanied by exposure and erosion, leading to identification marks such as dissolved pores, collapsed breccias, and weathering crusts at the boundary. Changes in some lithological and lithofacies assemblages can also serve as marks and bases for sequence division.
Climate proxies in sedimentary rocks preserve a variety of information, including “signals” generated by orbital cycle effects, water depth-related noise (e.g., storms, tides, bioturbation), and factors not controlled by orbits (e.g., dating errors, differential compaction, unstable sedimentation, and diagenesis). In addition, changes in water depth-related noise at a fixed location may be related to sea-level changes. When the relative sea level is high, the water depth-related noise is relatively low, and vice versa.Li et al. (2018) proposed and developed a sedimentary noise model, which is specifically designed to evaluate two key components: the total energy spectrum derived from orbitally tuned data and the energy spectrum corresponding to non-astronomically driven signals. To date, this model has been widely adopted and applied in a multitude of relevant research studies. Empirical evidence from these applications consistently confirms that the sedimentary noise model serves as an effective and reliable method for the reconstruction and numerical simulation of paleo-sea level changes [20,21,22,23,24,25]. Therefore, when effective methods for dividing high-frequency sequences are lacking, this model can be used to restore paleo-water depth as an identification mark.
Based on the Acycle 2.7 software under the MATLAB platform [26], this study selected two paleoclimate proxies that can preserve signals related to climate change—GR data sequences and MS data sequences—to conduct cyclostratigraphic analysis for the division of fourth-order sequences. The main steps are as follows:
1 Preprocessing (including standardizing the data and removing long-term background trends);
2 Performing spectral analysis on the GR and MS data sequences using the multi-taper method (MTM), mainly analyzing peak frequencies with a confidence level of over 95% [27];
3 Conducting Gaussian band-pass filtering on the peaks corresponding to the inferred 405 kyr long eccentricity cycle;
4 Establishing an age model using the filtered 405 kyr long eccentricity cycle and performing tuning;
5 Evaluating the sea-level change trend using the sedimentary noise model on the tuned time-domain data. The study adopted the DYNOT model algorithm proposed by Li et al. (2018), where the cutoff frequencies for total variance (fmin and fmax) were set between 0.001 and 1 kyr. P(e), P(o), and P(p) represent the energy values of eccentricity, obliquity, and precession, respectively.
The data sequences were astronomically tuned to the time domain to mitigate the influence of variable sedimentation rates. Subsequently, the ratio of non-orbital variance to total variance in the power spectrum derived from the DYNOT model was selected as an indicator for quantifying noise in climate and sea-level proxies. Finally, the ratio of non-orbital signal variance to total variance (i.e., the DYNOT value) was calculated within a sliding time window.
The size of the sliding window was 405 kyr, and the number of Monte Carlo simulations for evaluating the confidence interval was 5000. Other parameters used the default values recommended by Li et al. (2018) [28].
4. Division of Third-Order Sequence Stratigraphy
Based on classic sequence division methods, including logging curves, carbon isotopes, and field outcrop observations, this study identified a total of 5 third-order sequence boundaries across Well A1, the Kalpin Cement Plant Section, the Yangjikan Section, and the Yijianfang Section. These boundaries are specified as follows: the unconformity surface at the top of the Cambrian System (T0); the unconformity surface at the top of the Lower Ordovician Penglaiba Formation (T1); the internal unconformity surface within the Middle-Lower Ordovician Yingshan Formation (T2); the unconformity surface at the top of the Middle-Lower Ordovician Yingshan Formation (T3); and the unconformity surface at the top of the Yijianfang Formation (located between the Upper Ordovician and Middle-Lower Ordovician) (T4).
4.1. Characteristics of Third-Order Sequence Boundaries in Well A1 of the Fuman Area
T4 boundary (top of the Yijianfang Formation): There is an abrupt lithological change above and below the boundary (Figure 2). The upper part is in contact with the mudstone of the Tumuxiuke Formation, while the lower part consists of argillaceous limestone. Logging curves show an abnormal sharp increase in GR, reflecting the characteristic of increased radioactivity above this boundary. The values of RS and RD curves are smaller above the boundary and significantly higher below it, indicating a change in the content of sandy clasts in the strata. The carbon isotope values in this stratum range from -0.46‰ to 1.20‰, with an average of 0‰, showing an upward trend from bottom to top with an increase of approximately 1.74‰. A negative shift of 0.5‰ in carbon isotopes occurs at the boundary, reflecting a sea-level fall during the sedimentary period.
T3 boundary (top of the Yingshan Formation): The lower part of the boundary is sandy limestone, and the upper part is in contact with the sandy micritic limestone of the Yijianfang Formation (Figure 2), with a significant decrease in clay content. The carbon isotope values of the first and second members of the Yingshan Formation range from -3.85‰ to -0.52‰, with an average of -1.16‰, showing an upward increasing trend with an increase of approximately 3.33‰. A negative shift of -0.52‰ in carbon isotopes occurs at the boundary, indicating sea-level fluctuations during this period.
T2 boundary (internal to the Yingshan Formation): The upper part of the boundary is sandy micritic limestone, and the lower part is sandy limestone with a significant increase in dolomite content (Figure 2). In terms of logging element responses, major and trace elements show obvious changes above and below the boundary. Terrestrial inert elements such as Fe and Ti are enriched at the boundary, while mobile elements such as K are reduced.
T1 boundary (top of the Penglaiba Formation): The upper part of the boundary is dolomitic sandy limestone, and the lower part is argillaceous micritic dolomite, showing an abrupt lithological change (Figure 2). In terms of logging response at the boundary, the natural gamma curve shows a sharp peak of 144.9 API, increasing from low to high above and below the boundary. The resistivity curve changes from the low-resistivity characteristic of dolomite to the high-resistivity characteristic above the boundary. The corresponding Th/K ratio also shows a sharp peak of 2.732, which is less than 7 and does not meet the standard of a weathering exposure surface. However, the Th/K ratio here varies frequently between 0.007 and 2.732 with a large amplitude, and the corresponding U value reaches the maximum of 15.1, indicating a sea-level fall in this area. The carbon isotope values in this stratum range from -2.28‰ to -1.70‰, with an average of -1.97‰. The carbon isotope value at the boundary is -1.92‰, showing a negative shift of approximately 1.10‰.
Since there are currently no wells in the Fuman area that penetrate the T0 boundary (at the bottom of the Penglaiba Formation), the logging response characteristics at the bottom of the Penglaiba Formation will not be discussed.
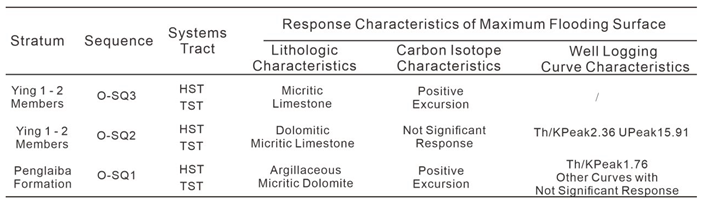
Based on a comprehensive analysis of lithology, carbon isotopes, and logging curves, this study identified the characteristics of maximum flooding surfaces (MFS) within third-order sequences.Among them, due to the long exposure time and large denudation thickness of the O-SQ4 sequence in the Yijianfang Formation, only a lowstand systems tract (LST) remains, and no MFS was identified. At the MFS of the first and second members of the Yingshan Formation, the lithology is micritic limestone, with a positive carbon isotope shift that reaches a sharp peak within these members. For the MFS of the O-SQ2 sequence in the third and fourth members of the Yingshan Formation, the lithology is dolomitic micritic limestone; the carbon isotope shows no obvious response within these members, but Th/K and U values in logging curves reach peaks here. The Penglaiba Formation has a short denudation duration; its MFS is characterized by argillaceous micritic dolomite, and the carbon isotope curve shows a positive shift with the largest amplitude within this formation, while other characteristic responses are not significant.
4.2. Characteristics of Third-Order Sequence Boundaries in the Kalpin-Bachu Area
Based on the characteristics of lithologic-lithofacies transition surfaces, paleoweathering crusts, and stratigraphic contact relationships observed in outcrop sections, this study identified four major third-order sequence boundaries within the Yijianfang Formation, Yingshan Formation, and Penglai Dam Formation in the Kalpin-Bachu area (Figure 3). With respect to the T4 boundary, in the Yijianfang Section, the strata below this boundary are composed of light gray thin-bedded bioclastic micrite limestone, which forms a conformable contact with the thin-bedded red argillaceous limestone at the base of the Tumuxiuke Formation (Figure 3A). Regarding the T3 boundary, the strata deposited in the upper part of the Yangjikan Section belong to the Dawangou Formation.This sequence boundary exhibits a parallel unconformable contact between the overlying and underlying strata. Specifically, the underlying strata of this boundary consist of oolitic limestone belonging to the Yingshan Formation, which is indicative of a high-energy bank depositional environment. In contrast, the overlying strata of the boundary are composed of nodular micrite limestone, bioclastic-bearing micrite limestone, and siliceous bands of the Dawangou Formation.In the Yijianfang Section, the lower part of the T3 boundary is characterized by massive gray-white marble, which forms an angular unconformable contact with the gray medium-bedded micrite limestone at the base of the Yijianfang Formation (Figure 3B).With regard to the T2 boundary, in the Yangjikan Section, the underlying strata of this boundary are composed of medium-thin-bedded micrite limestone interbedded with oolitic limestone of variable thickness. This unit forms a parallel unconformable contact with the overlying strata of the boundary—thin-bedded argillaceous limestone interbedded with thick-bedded oolitic micrite limestone of variable thickness (Figure 3C).For the T1 boundary, in the Cement Plant Section, light gray thin-bedded oolitic limestone establishes an angular unconformable contact with the overlying thick-bedded gray micrite limestone of the Yingshan Formation. Within this interval, the dolomite content decreases gradually until it is completely absent, and the lithology transitions from dolomite and dolomitic limestone to granular limestone. This lithologic variation indicates a significant shift in the depositional environment (Figure 3D).As for the T0 boundary, in the Cement Plant Section, it is manifested as a lithologic transition surface. The overlying strata of this boundary comprise a set of massive gray-white limestone, which forms a conformable contact with the underlying gray dolomite of the Lower Qiulitage Formation of the Cambrian System (Figure 3E).
5. Fourth-Order Sequence Stratigraphic Division
Fourth-order sequences are formed within third-order sequences under the control of secondary sea-level fluctuations caused by eccentricity variations, and they are isochronous in small areas [29]. Their boundary characteristics are short-term weathering exposure surfaces or regressive-transgressive cycle transition surfaces. There are a large number of exposure unconformity surfaces formed by multiple short-term sea-level drops in the Tarim Basin, which are controlled by sequences below the third order [30]. Therefore, based on the previously established framework of third-order sequence division, this study processes various sets of data by separating them at sequence boundaries to divide fourth-order sequences, providing an exploration basis for reservoirs formed by local exposure dissolution. Due to the lack of effective identification markers, a sedimentary noise model is introduced to reconstruct sea levels for identification. However, regarding the study of eccentricity variations, there is no relatively reliable astronomical orbital cycle scheme for the Ordovician System. Nevertheless, since the long eccentricity cycle of 405 kyr is the most stable orbital parameter astronomically, previous researchers have generally selected it as the basic geological time unit for geological age calibration when studying strata with relatively ancient geological ages [31]. Meanwhile, due to the large time span of 400,000 years, it is not easily disturbed by small sedimentary gaps or other noises. Therefore, this study can achieve astronomical calibration by using the stable 405 kyr long eccentricity cycle.
5.1. Cyclostratigraphic Analysis
Based on the identification of third-order sequence boundaries, and for the purpose of mitigating the influence of sedimentary gaps, this study divides the Gamma Ray (GR) data of the Yijianfang Formation-Penglaiba Formation interval in Well A1 into 6 relatively continuously deposited data segments. These segments include the Yijianfang Formation, the Ying 1-2 Members, the Ying 3-4 Members, the Penglaiba Formation, the Magnetic Susceptibility (MS) data of the Penglaiba Formation in the Kalpin Cement Plant Section, and the GR data of the Yingshan Formation in the Yangjikan Section.Subsequent to data preprocessing and the removal of long-term trends, spectral analysis was conducted. The theoretical orbital cycles selected for this analysis were calculated in accordance with the Milankovitch calculator model proposed by Waltham D. (2015), and the corresponding results are presented in Table 1 [32].
The multi-window spectral analysis method was used to conduct depth-domain spectral analysis on the detrended GR data sequence (Figures 6a-d). Among the results:
For the Yijianfang Formation in Well A1, the spectral analysis shows prominent peaks corresponding to cycle thicknesses of 23.8m, 5.4m, 2.5m, and 1.4m, with all confidence levels greater than 90% and some exceeding 99% (Figure 4A-a). Based on the theoretical orbital cycle ratio of 405:100:33:19, these peaks are considered to correspond to the 405 kyr long eccentricity cycle, -100 kyr short eccentricity cycle, 33 kyr obliquity cycle, and -19 kyr precession cycle, respectively;For the Ying 1-2 Members in Well A1, prominent peaks are observed at cycle thicknesses of 57.2m, 11.9m, 3.3m, 1.9m, 1.6m, and 1.4m, with most confidence levels above 99% (Figure 4B-b). Similarly, the 57.2m peak is attributed to the 405 kyr long eccentricity cycle, the 11.9m peak to the -100 kyr short eccentricity cycle, the 3.3m peak to the 33 kyr obliquity cycle, and the 1.9m, 1.6m, and 1.4m peaks to the -19 kyr precession cycle;For the Ying 3-4 Members in Well A1, prominent peaks appear at 31.5m, 6.7m, 2.9m, 2m, 1.4m, 1.2m, and 1.1m, all with confidence levels exceeding 99% (Figure 4C-c). The 31.5m peak corresponds to the 405 kyr long eccentricity cycle, the 6.7m peak to the -100 kyr short eccentricity cycle, the 2.9m and 2m peaks to the 33 kyr obliquity cycle, and the 1.4m, 1.2m, and 1.1m peaks to the -19 kyr precession cycle;For the Penglaiba Formation in Well A1, prominent peaks are found at 21.4m, 5.2m, 1.8m, and 1.1m, with all confidence levels greater than 95% (Figure 4D-d). These are respectively assigned to the 405 kyr long eccentricity cycle, -100 kyr short eccentricity cycle, 33 kyr obliquity cycle, and -19 kyr precession cycle;For the Penglaiba Formation in the Kalpin Cement Plant Section, prominent peaks occur at 18.8m, 4.7m, 3.1m, 2m, 1.6m, and 1.2m, all with confidence levels above 99% (Figure 4E-e). The 18.8m cycle thickness corresponds to the 405 kyr long eccentricity cycle, the 4.7m and 3.1m to the -100 kyr short eccentricity cycle, the 2m and 1.6m to the 33 kyr obliquity cycle, and the 1.2m to the -19 kyr precession cycle;For the Ying 1-2 Members of the Yingshan Formation in the Yangjikan Section, prominent peaks are observed at 12.4m, 3.6m, 0.98m, and 0.55m, with most confidence levels exceeding 99% (Figure 4F-f). The 12.4m cycle thickness corresponds to the 405 kyr long eccentricity cycle, the 3.6m to the -100 kyr short eccentricity cycle, the 0.98m to the 33 kyr obliquity cycle, and the 0.55m to the -19 kyr precession cycle;For the Ying 3-4 Members of the Yingshan Formation in the Yangjikan Section, prominent peaks appear at 15.6m, 3.9m, 1.5m, and 0.75m, all with confidence levels greater than 99% (Figure 4G-g). The 15.6m cycle thickness corresponds to the 405 kyr long eccentricity cycle, the 3.9m to the -100 kyr short eccentricity cycle, the 1.5m to the 33 kyr obliquity cycle, and the 0.75m to the -19 kyr precession cycle.
The frequency band corresponding to the 405 kyr long eccentricity cycle was extracted from the GR data sequence for filtering processing (Figure 4A-D). The results are as follows:
For the Yijianfang Formation in Well A1, filtering analysis yielded 4 cycles of the 405 kyr long eccentricity cycle, which corresponds to a sedimentary duration of 1.6 Ma;For the Ying 1-2 Members in Well A1, 8 cycles of the 405 kyr long eccentricity cycle were identified, with the corresponding sedimentary duration being 3.2 Ma;For the Ying 3-4 Members in Well A1, 12 cycles of the 405 kyr long eccentricity cycle were obtained, and the sedimentary duration corresponding to these cycles is 4.9 Ma;For the Penglaiba Formation in Well A1, 12 cycles of the 405 kyr long eccentricity cycle were detected, with a corresponding sedimentary duration of 4.9 Ma;For the Penglaiba Formation in the Kalpin Cement Plant Section, 15 cycles of the 405 kyr long eccentricity cycle were acquired through analysis, and the sedimentary duration corresponding to these cycles amounts to 6.1 Ma;For the Ying 1-2 Members of the Yingshan Formation in the Yangjikan Section, 7 cycles of the 405 kyr long eccentricity cycle were determined, with the corresponding sedimentary duration reaching 2.8 Ma;For the Ying 3-4 Members of the Yingshan Formation in the Yangjikan Section, 10 cycles of the 405 kyr long eccentricity cycle were identified, and the sedimentary duration corresponding to these cycles is 4.1 Ma.
5.2. Sea-Level Simulation Based on the Sedimentary Noise Model
Based on the stable 405 kyr long eccentricity cycle, the relative sea-level change trends of each geological segment were obtained through comprehensive analytical calculations using the DYNOT model algorithm proposed by Li (2018). The specific variation characteristics of these trends are presented in Figure 5, and the key analytical results are summarized as follows:
The Yijianfang Formation in Well A1 exhibited a sea-level change trend of first falling and then rising within 1.6 Ma;
The Ying 1-2 Members of the Yingshan Formation in both Well A1 and the Yangjikan Section lasted for approximately 3 Ma, while the Ying 3-4 Members lasted for about 4.5 Ma. Cyclostratigraphic analysis of the GR data from these two locations revealed that the sea levels of the Yingshan Formation in the field outcrops and the Fuman Area showed similar characteristics of fluctuation frequency within comparable time scales;
The Penglaiba Formation in both Well A1 and the Kalpin Cement Plant Section had a duration of around 6 Ma. Sea-level simulation using the sedimentary noise model based on the magnetic Susceptibility data from the Kalpin Cement Plant Section showed that the Penglaiba Formation in the field outcrops and the Fuman Area experienced three consistent cycles of sea-level rise and fall within similar time scales.
5.3. Characteristics of Fourth-Order Sequence Boundaries in Field Outcrops and Their Corresponding Relationship with the Fuman Area
Based on the comprehensive analysis of lithological transition surfaces and field unconformity characteristics (Figure 6), the Ying 1-2 Members of the Yingshan Formation in the Yangjikan Section can be divided into 2 fourth-order sequences, and the Ying 3-4 Members into 3 fourth-order sequences; the Ying 1-2 Members of the Yingshan Formation in the Kalpin Cement Plant Section can be divided into 2 fourth-order sequences, the Ying 3-4 Members into 3 fourth-order sequences, and the Penglaiba Formation into 3 fourth-order sequences.
Specifically, above the T41 boundary of the Yijianfang Formation in the Yijianfang Section is dark gray thin-bedded bioclastic limestone, and below the boundary is medium-thick-bedded dark gray bioclastic limestone with a large number of dissolution pores (with a diameter of approximately 5~20 cm) (Figure 6A); the T31 boundary of the Ying 1-2 Members of the Yingshan Formation in the Yangjikan Section is a conformable contact between the upper dark gray medium-thin-bedded micritic limestone and the lower gray-dark gray thin-bedded micritic limestone, showing a lithological transition surface with upward lightening color (Figure 6B); above the T22 boundary of the Ying 3-4 Members is gray thin-bedded micritic limestone with horizontal bedding, and the lower part is interbedded with gray medium-bedded calcarenite, with dissolution pores observed (Figure 6C); above the T21 boundary is interbedded gray medium-thin-bedded micritic limestone and thin-bedded argillaceous limestone, and below the boundary is gray medium-thick-bedded calcarenitic micritic limestone, with dissolution pores present (Figure 6D). In the Kalpin Cement Plant Section, the T31 boundary of the Ying 1-2 Members of the Yingshan Formation is a lithological transition surface, transitioning from dark gray medium-bedded sparry grain limestone to off-white thin-bedded bioclastic limestone; the T22 boundary of the Ying 3-4 Members transitions from interbedded gray thin-bedded algal laminated limestone and grain limestone to gray medium-thick-bedded bioclastic limestone; the T21 boundary is characterized by thin interbedding of gray bioclastic limestone and algal laminated limestone, transitioning to gray medium-thick-bedded bioclastic limestone. In the outcrop of the Penglaiba Formation, the T11 boundary is a lithological transition surface with an abrupt color change from light gray to dark gray; the lithology is conformable contact between off-white massive dolomite and the overlying grayish-black medium-thin-bedded calcarenite (Figure 6E); the strata above and below the T12 boundary show obvious angular unconformity contact, with a paleoweathering crust about 30 cm thick and a significant increase in argillaceous content (Figure 6F); the overall lithology around the T13 boundary is off-white medium-thick-bedded argillaceous limestone, with multiple phases of weathering crusts (about 3-5 cm thick) developed near the boundary, indicating that the Penglaiba Formation underwent multiple frequent and short-term uplift and exposure during this period (Figure 6G).
A comparison between the fourth-order sequence boundaries identified based on field characteristics and the results of cyclostratigraphic analysis and sea-level simulation shows that the sea-level fluctuations reconstructed by the sedimentary noise model are consistent with the field identification markers, confirming that this model can be used for sea-level restoration of the Middle-Lower Ordovician carbonate rocks in the Tarim Basin. In the future, this method can be applied to the sequence stratigraphic division of ultra-deep carbonate rocks in the Fuman Area.
In addition, on the basis of the astronomical chronostratigraphic scales established respectively for the magnetic susceptibility data of the Penglaiba Formation in the Kalpin Cement Plant Section, the GR data of the Yingshan Formation in the Yangjikan Section, and the GR data of Well A1, a chronostratigraphic framework between the field outcrops and the Fuman Area was jointly established by combining sea-level change trends and carbon isotope data. The comparison shows (Figure 7) that the lower part of Well A1, the only well that has drilled through the Penglaiba Formation in the Fuman Area so far, is still missing one third-order sequence and one fourth-order sequence.
6. Discussion
6.1. Sequence Division Scheme of the Fuman Area
Based on fully referencing and absorbing previous research results, this study comprehensively divided the third and fourth-order sequences and proposed a sequence division scheme for the Ordovician carbonate rocks in the Fuman Area (Figure 8). The key third-order sequence boundaries are basin-wide unconformity surfaces, with cross-regional and cross-facies belt comparability. Based on this, combined with the analysis of field outcrop characteristics, seismic response characteristics, and downhole logging response characteristics in the Fuman Area, the Yijianfang Formation is divided into one third-order sequence (O-SQ4), the Yingshan Formation into two third-order sequences (O-SQ2, O-SQ3), and the Penglaiba Formation into one third-order sequence (O-SQ1), which is consistent with most sequence division schemes proposed by previous researchers.
Fourth-order sequences often show significant differences within the basin due to their diverse genetic types, small scale, and high frequency. This study attempts to carry out fourth-order sequence division by combining the classical sequence division method with sea-level reconstruction simulated by the sedimentary noise model. The field sequence boundary characteristics of the Kalpin Cement Plant Section and the Yangjikan Section have a good corresponding relationship with the sea-level fluctuations simulated by the sedimentary noise model based on the measured GR and MS data sequences of the sections (Figure), which verifies the feasibility of the DYNOT model in identifying sea-level change trends in the Middle-Lower Ordovician of the Tarim Basin. Introducing the cyclostratigraphic method into the study of the Fuman Area revealed that the genetic types of fourth-order sequences in the study area are significantly controlled by sea level. Finally, the Yijianfang Formation is divided into two fourth-order sequences (FSQ10-11), the Ying 1-2 Members into two fourth-order sequences (FSQ8-9), the Ying 3-4 Members into three fourth-order sequences (FSQ5-7), and the Penglaiba Formation into four fourth-order sequences (FSQ1-4).
6.2. Coupling Relationship Between Sequence Stratigraphic Division and Reservoir Development
The composition of carbonate sequence systems tracts determines the distribution characteristics of their sedimentary facies belts, and hydrocarbon accumulation is also controlled by systems tracts to varying degrees. For example, favorable source rocks develop in highstand systems tracts, while high-quality reservoirs can form in lowstand systems tracts [33]. Based on the theory of the sedimentary noise model, this study simulated the sea-level changes during the deposition of Middle-Lower Ordovician carbonate rocks in the Fuman Area. According to the reservoir classification standards of PetroChina Tarim Oilfield (Table 2), a comprehensive evaluation of logging porosity and permeability in Well M8-Well A1 was conducted for reservoir grading. It was found that high-quality reservoir intervals are mostly developed in lowstand systems tracts (Figure 9). Therefore, restoring paleowater depth and characterizing the systems tracts within the relative sea-level change cycles in the Fuman Area can provide partial references for predicting the distribution of favorable reservoirs in the study area.
The sedimentary area of carbonate platforms is significantly controlled by third-order sea-level changes. With the periodic fall of sea level, sediments are exposed above the sea surface or located within the freshwater lens, undergoing selective and non-selective dissolution. This karstification is widely developed in the Tabei-Tazhong Area [34]. Based on cyclostratigraphic time series analysis, the residual stratigraphic age of the Yijianfang Formation in the Fuman Area is only 1.6 Ma, characterized by a long duration of meteoric freshwater leaching and large erosion thickness. Shi Pingzhou (2023) conducted rare earth element and major-trace element analyses on multiple wells in this area, and the results showed that the fracture-cave fillings of the Yijianfang Formation in the study area are derived from meteoric freshwater and are highly disturbed by terrigenous clastic materials [35]. This indicates that the exposure below the third-order sequence boundaries has a significant impact on karst development and a positive effect on the physical property modification of reservoirs. In summary, the establishment of a detailed sequence stratigraphic framework in the Fuman Area can provide a basis for characterizing favorable sedimentary facies belts and exploring non-fault-controlled hydrocarbon reservoirs.
7. Conclusions
The division results of field outcrop characteristics of the Penglaiba Formation in the Kalpin Cement Plant Section and the Yingshan Formation in the Yangjikan Section, Xinjiang, are basically consistent with the sea levels simulated by the sedimentary noise model. The Middle-Lower Ordovician carbonate rocks in the Tarim Basin preserve relatively good astronomical orbital cycle signals. A comparison between the cyclostratigraphic analysis of field outcrops and petrology, logging curves, seismic data, etc., verifies the feasibility and applicability of the cyclostratigraphic method for the “high-efficiency and low-cost” division of the third and fourth-order sequences of the Ordovician carbonate rocks in the Fuman Area.
Obvious exposure unconformity surfaces are developed in the Ordovician carbonate rocks in the Fuman Area of the Tarim Basin. Comprehensive analysis of logging curve characteristics, elemental geochemical response characteristics, carbon isotope characteristics, field outcrop characteristics, and cyclostratigraphic characteristics shows that: the Yijianfang Formation can be divided into one third-order sequence (O-SQ4) and two fourth-order sequences (FSQ11-10); the Yingshan Formation can be divided into two third-order sequences (O-SQ2, O-SQ3) and five fourth-order sequences (FSQ9-5); the Penglaiba Formation can be divided into one third-order sequence (O-SQ1) and four fourth-order sequences (FSQ4-1).
References
- YANG Haijun, DENG Xingliang, ZHANG Yintao, et al. Great discovery and its significance of exploration for Ordovician ultra-deep fault-controlled carbonate reservoirs of Well Manshen 1 in Tarim Basin. China Petroleum Exploration, 2020, 25(3): 13-23. [CrossRef]
- WANG Qinghua, YANG Haijun, ZHANG Yintao, et al. Great discovery and its significance in the Ordovician of Well Fudong 1 in Fuman Oilfield, Tarim Basin. China Petroleum Exploration, 2023, 28(1): 47-58. [CrossRef]
- ABELS H A, AZIZ H A, KRIJGSMAN W, et al. Long-period eccentricity control on sedimentary sequences in the continental Madrid Basin (middle Miocene, Spain). Earth and Planetary Science Letters, 2010, 289(1-2): 220-231. [CrossRef]
- BOULILA S, GALBRUN B, MILLER K G, et al. On the origin of Cenozoic and Mesozoic “third-order” eustatic sequences. Earth-Science Reviews, 2011, 109(3-4): 94-112. [CrossRef]
- MEI Mingxiang. From vertical stacking pattern of cycles to discerning and division of sequences: The third advance in sequence stratigraphy. Journal of Palaeogeography, 2011, 13(1): 37-54.
- SHI Juye, JIN Zhijun, LIU Quanyou, et al. Quantitative classification of high-frequency sequences in fine-grained lacustrine sedimentary rocks based on Milankovitch theory. Oil & Gas Geology, 2019, 40(6): 1205-1214. [CrossRef]
- LI Mingsong, HINNOV L A, HUANG C, et al. Sedimentary noise and sea levels linked to land–ocean water exchange and obliquity forcing. Nature Communications, 2018, 9: 1004. [CrossRef]
- JIA Chengzao. Structural features and oil-gas accumulation rules in Tarim Basin. Xinjiang Petroleum Geology, 1999, 20(3): 177-183. [CrossRef]
- SONG Xingguo, CHEN Shi, XIE Zhou, et al. Strike-slip faults and hydrocarbon accumulation in the eastern part of Fuman Oilfield, Tarim Basin. Oil & Gas Geology, 2023, 44(2): 335-349. [CrossRef]
- YANG Haijun, CAI Zhenzhong, LI Yong, et al. Organic geochemical characteristics of source rocks and significance for oil-gas exploration of the Tumuxiuke Formation in Fuman Area, Tarim Basin. Bulletin of Geological Science and Technology, 2023.
- YANG Haijun, HAN Jianfa, CHEN Lixin, et al. Characteristics and patterns of complex hydrocarbon accumulation in the Lower Paleozoic carbonate rocks of the Tazhong Palaeouplift. Oil & Gas Geology, 2007, 28(6): 784-790.
- FENG Zengzhao, BAO Zhidong, WU Maobing, et al. Lithofacies palaeogeography of the Ordovician in Tarim Area. Journal of Palaeogeography, 2007, 9(5): 447-460. [CrossRef]
- WU Guanghui, LI Qiming, XIAO Zhongyao, et al. Evolution characteristics and oil-gas exploration of palaeouplifts in Tarim Basin. Geotectonica et Metallogenia, 2009, 33(1): 124-130.
- ZHENG Herong, TIAN Jingchun, HU Zongquan, et al. Lithofacies palaeogeographic evolution and sedimentary model of the Ordovician in the Tarim Basin. Oil & Gas Geology, 2022, 43(4): 733-745. [CrossRef]
- TIAN Jun, YANG Haijun, ZHU Yongfeng, et al. Geological conditions for hydrocarbon accumulation and key technologies for exploration and development in Fuman Oilfield, Tarim Basin. Acta Petrolei Sinica, 2021, 42(8): 971-985. [CrossRef]
- WU Guanghui, DENG Wei, HUANG Shaoying, et al. Tectonic-paleogeographic evolution of Tarim Basin. Chinese Journal of Geology, 2023, 58(2): 305-321. [CrossRef]
- YANG Xiaofa, LIN Changsong, YANG Haijun, et al. Application of natural gamma ray spectrometry in sequence stratigraphic analysis of Late Ordovician carbonate rocks in the central Tarim Basin. Oil Geophysical Prospecting, 2010, 45(3): 384-39.
- DAI Dajing, TANG Zhengsong, CHEN Xintang, et al. Geochemical characteristics of uranium and its logging response in oil and gas exploration. Natural Gas Industry, 1995, 15(5): 21-24, 99-100. [CrossRef]
- ZHAO Zongju. Indicators of global sea-level change and research methods of marine tectonic sequences: A case study of the Ordovician in Tarim Basin. Acta Petrolei Sinica, 2015, 36(3): 262-273.
- LI Hongjiao, ZHANG Tingshan, ZHANG Xi, et al. Effects of sea-level change modulated by astronomical orbital cycles on organic reef development: A case study of the Late Permian Changxing Period in northeastern Sichuan. Fault-Block Oil & Gas Field, 2023, 30(1): 52-59.
- LU Tenghui, ZHANG Xi, ZHANG Tingshan, et al. Influence of the Luzhou Palaeouplift on the development of the Upper Triassic Xujiahe Formation in the southeastern Sichuan Basin, China. Journal of Stratigraphy, 2023, 47(2): 176-190.
- ZHANG Xi, ZHANG Tingshan, ZHAO Xiaoming, et al. Effects of astronomical orbital cycles and volcanic activity on organic carbon accumulation during the Late Ordovician-Early Silurian in the Upper Yangtze Area, South China. Petroleum Exploration and Development, 2021, 48(4): 732-744. [CrossRef]
- FANG Qiang, WU Huaichun, WANG Xunlian, et al. An astronomically forced cooling event during the Middle Ordovician. Global and Planetary Change, 2019, 173: 96-108. [CrossRef]
- WANG Meng, LI Mingsong, KEMP D B, et al. Sedimentary noise modeling of lake-level change in the Late Triassic Newark Basin of North America. Global and Planetary Change, 2022, 208: 103706. [CrossRef]
- ZHANG Tan, LI Yifan, FAN Tailiang, et al. Orbitally-paced climate change in the early Cambrian and its implications for the history of the Solar System. Earth and Planetary Science Letters, 2022, 583: 117420. [CrossRef]
- LI Mingsong, HINNOV L, KUMP L. Acycle: Time-series analysis software for paleoclimate research and education. Computers & Geosciences, 2019, 127: 12-22. [CrossRef]
- THOMSON D J. Spectrum estimation and harmonic analysis. Proceedings of the IEEE, 1982, 70(9): 1055-1096. [CrossRef]
- LI Mingsong, KUMP L R, HINNOV L A, et al. Tracking variable sedimentation rates and astronomical forcing in Phanerozoic paleoclimate proxy series with evolutionary correlation coefficients and hypothesis testing. Earth and Planetary Science Letters, 2018, 501: 165-179. [CrossRef]
- ERIKSSON P G, CATUNEANU O, NELSON D R, et al. Controls on Precambrian sea level change and sedimentary cyclicity. Sedimentary Geology, 2005, 176(1-2): 43-65. [CrossRef]
- DU Yang. Diagenesis in the Ordovician carbonate sequence stratigraphic framework of the Tarim Basin [D]. Beijing: China University of Geosciences (Beijing), 2018. [CrossRef]
- HUANG Chunju. The current status of cyclostratigraphy and astrochronology in the Mesozoic. Earth Science Frontiers, 2014, 21(2): 48-66.
- WALTHAM D. Milankovitch Period Uncertainties and Their Impact On Cyclostratigraphy. Journal of Sedimentary Research, 2015, 85(8): 990-998. [CrossRef]
- FAN Tailiang, YU Bingsong, GAO Zhiqian. Characteristics of carbonate sequence stratigraphy and its control on oil and gas in Tarim Basin. Geoscience, 2007, 21(1): 57-65.
- YU Bingsong, CHEN Jianqiang, LIN Changsong. Sequence stratigraphic framework and its control on the development of Ordovician carbonate reservoirs in Tarim Basin. Oil & Gas Geology, 2005, 26(3): 305-309, 316.
- SHI Pingzhou, LI Ting, ZHU Yongfeng, et al. Geochemical characteristics and environmental implications of fracture-cave fillings: A case study of the Middle Ordovician Yijianfang Formation in Fuman Area, Tarim Basin. Science Technology and Engineering, 2023, 23(11): 4527-4535. [CrossRef]
Figure 1.
The structural map of the transitional zone between the Awati and Manjiaer depressions ( A ), the comprehensive histogram ( B ) and the large section map of the Carboniferous flattening structure ( C ).
Figure 1.
The structural map of the transitional zone between the Awati and Manjiaer depressions ( A ), the comprehensive histogram ( B ) and the large section map of the Carboniferous flattening structure ( C ).
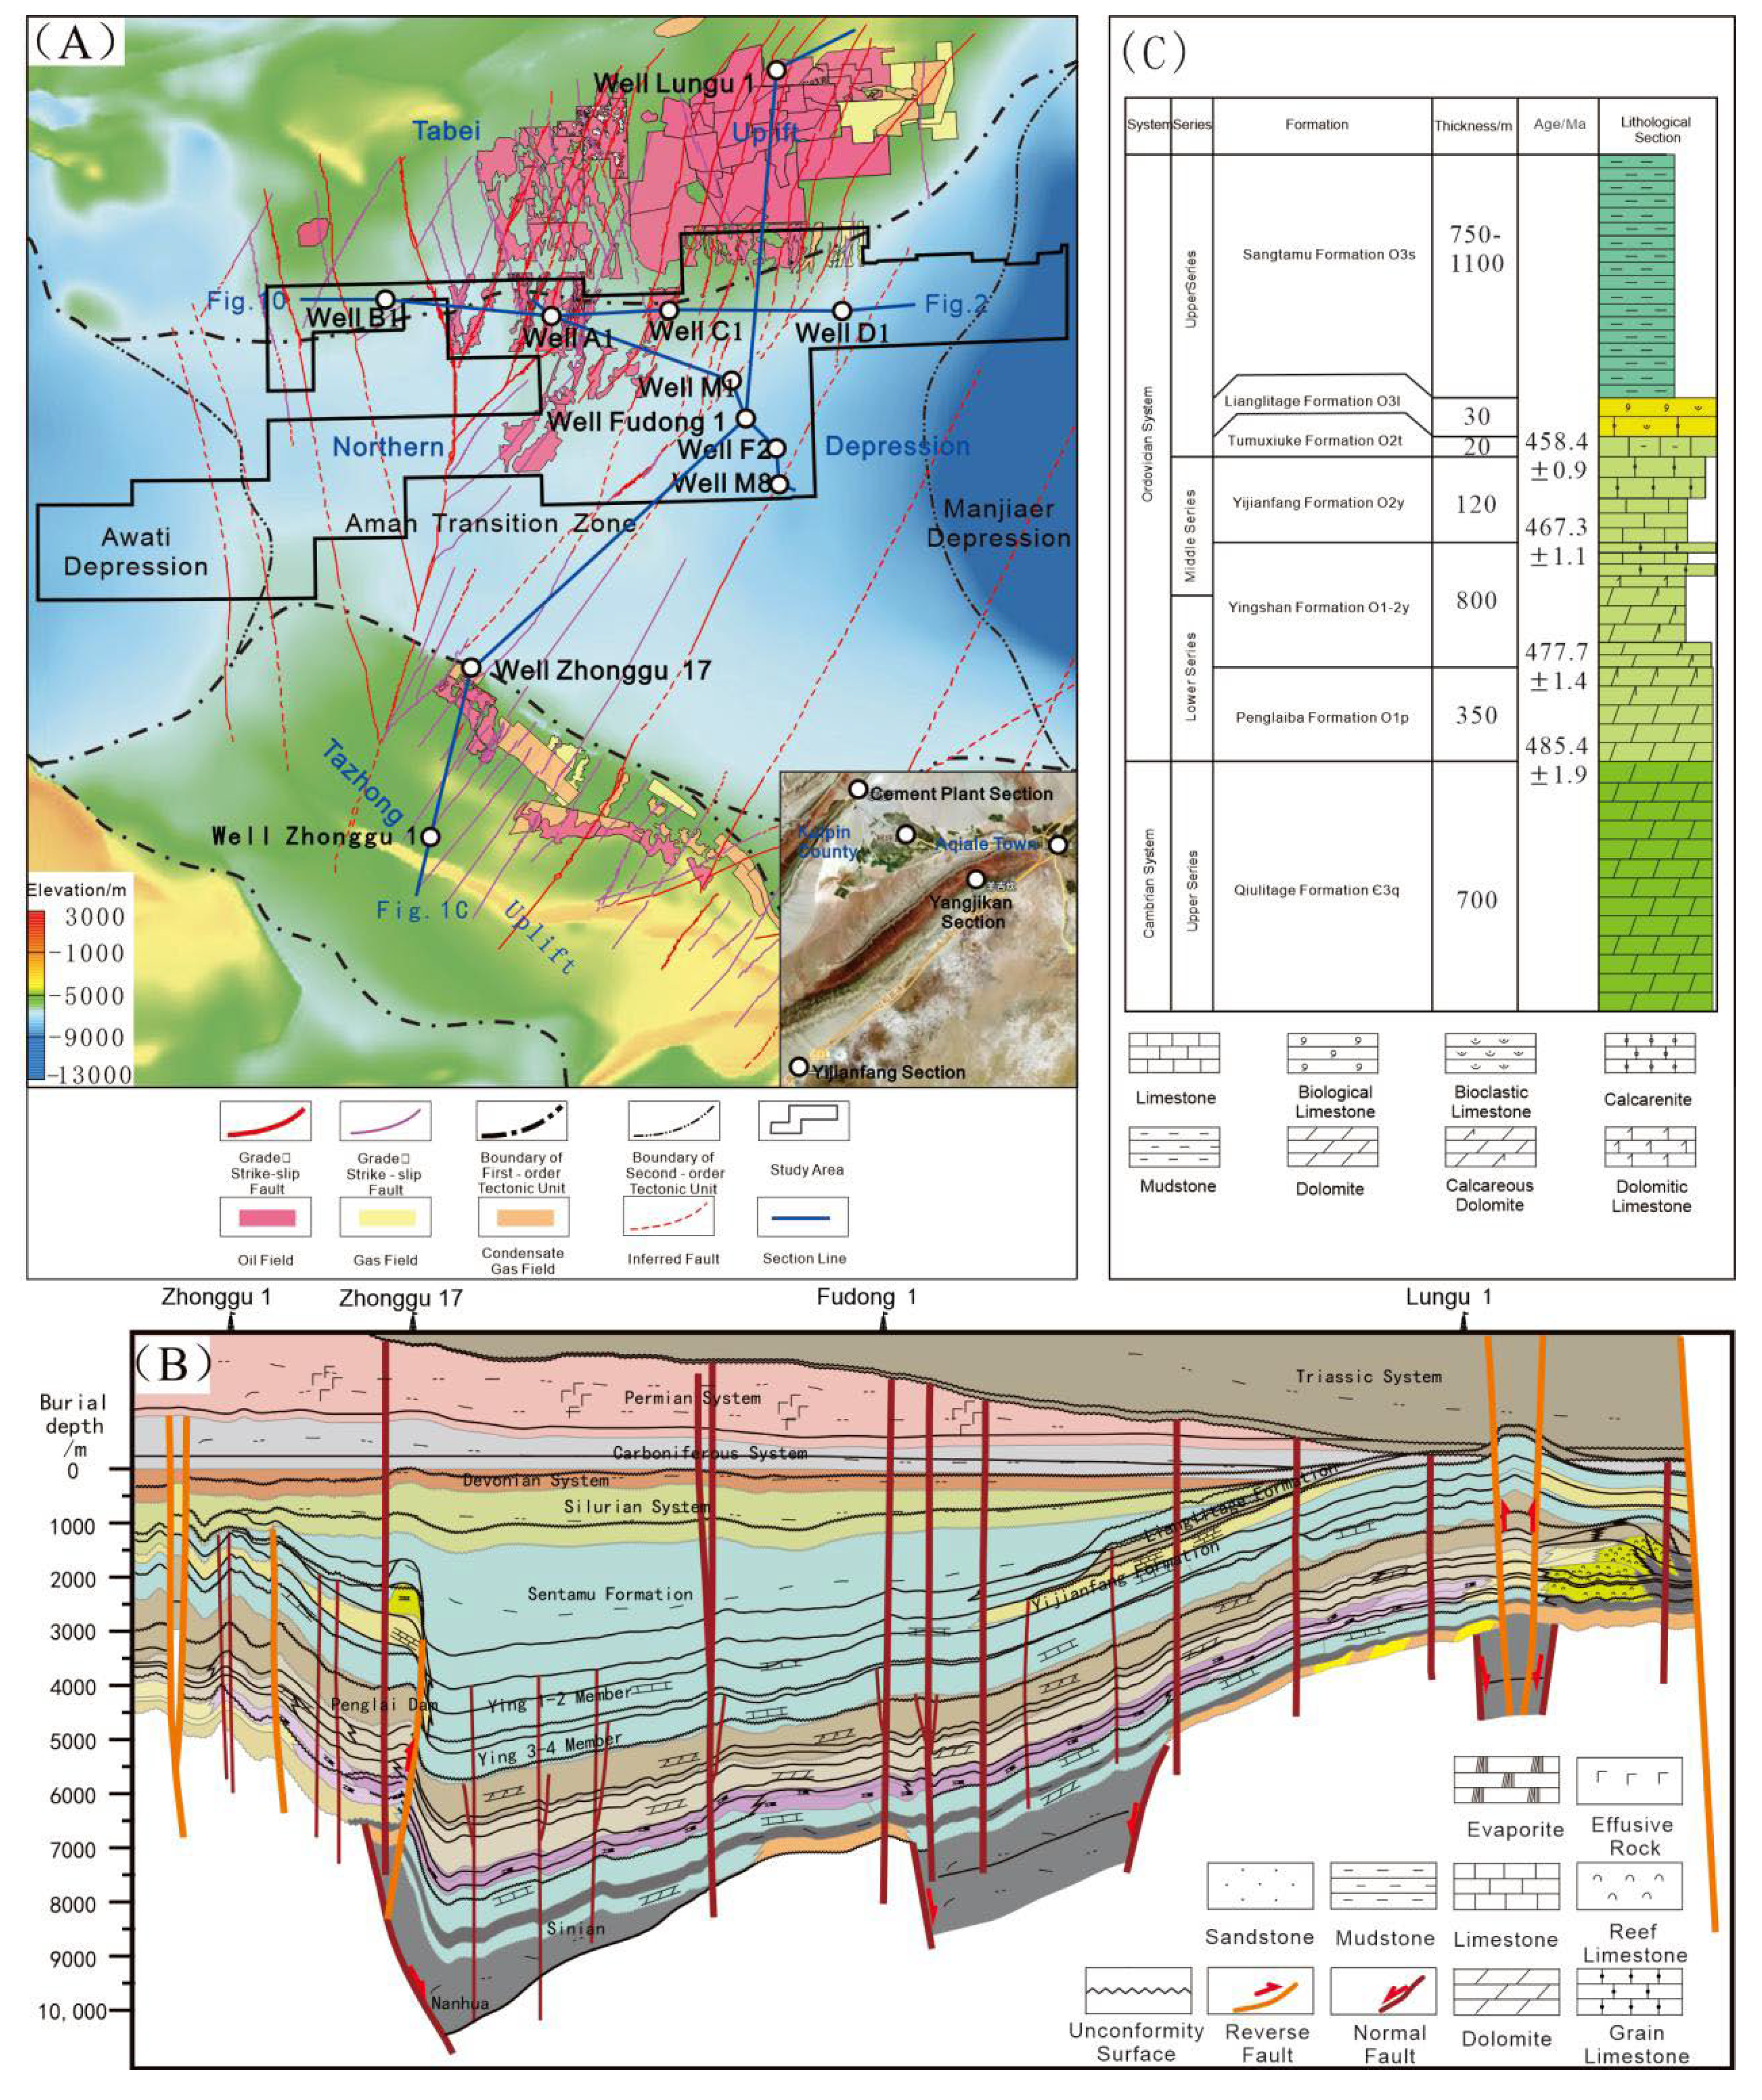
Figure 2.
The third-order sequence interface characteristics of well A1.
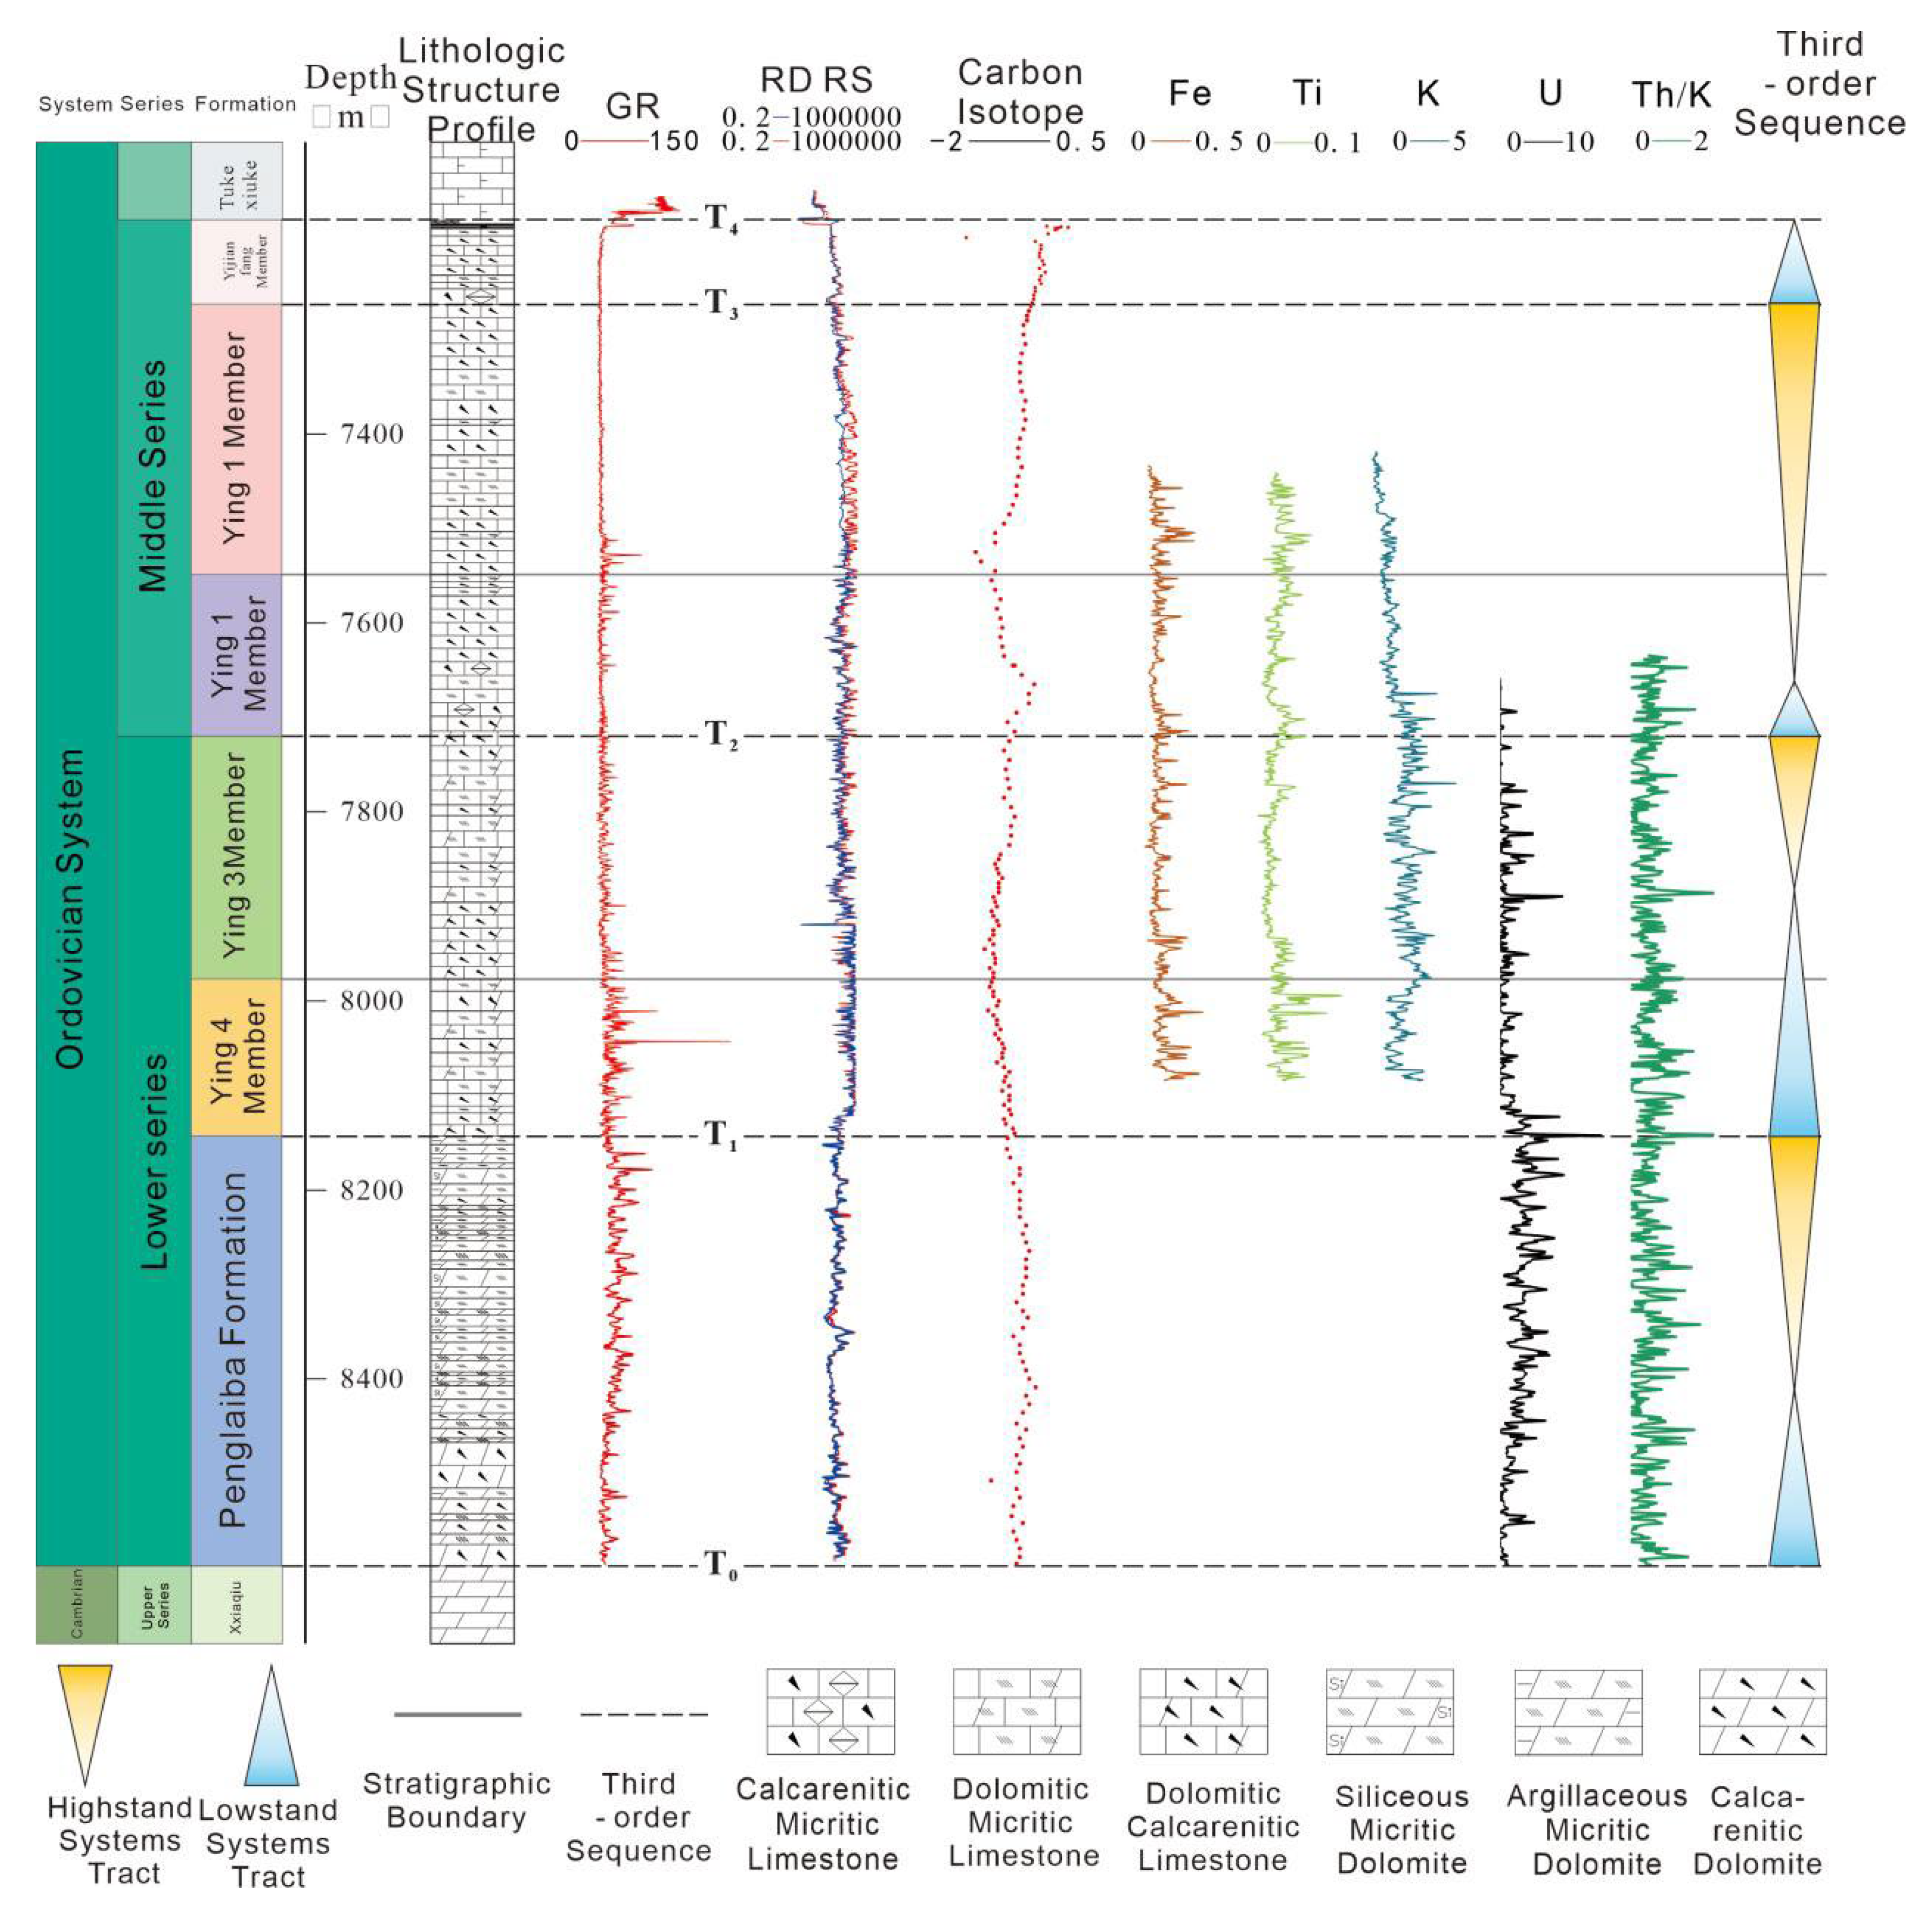
Figure 3.
Characteristics of field third-order sequence interface.
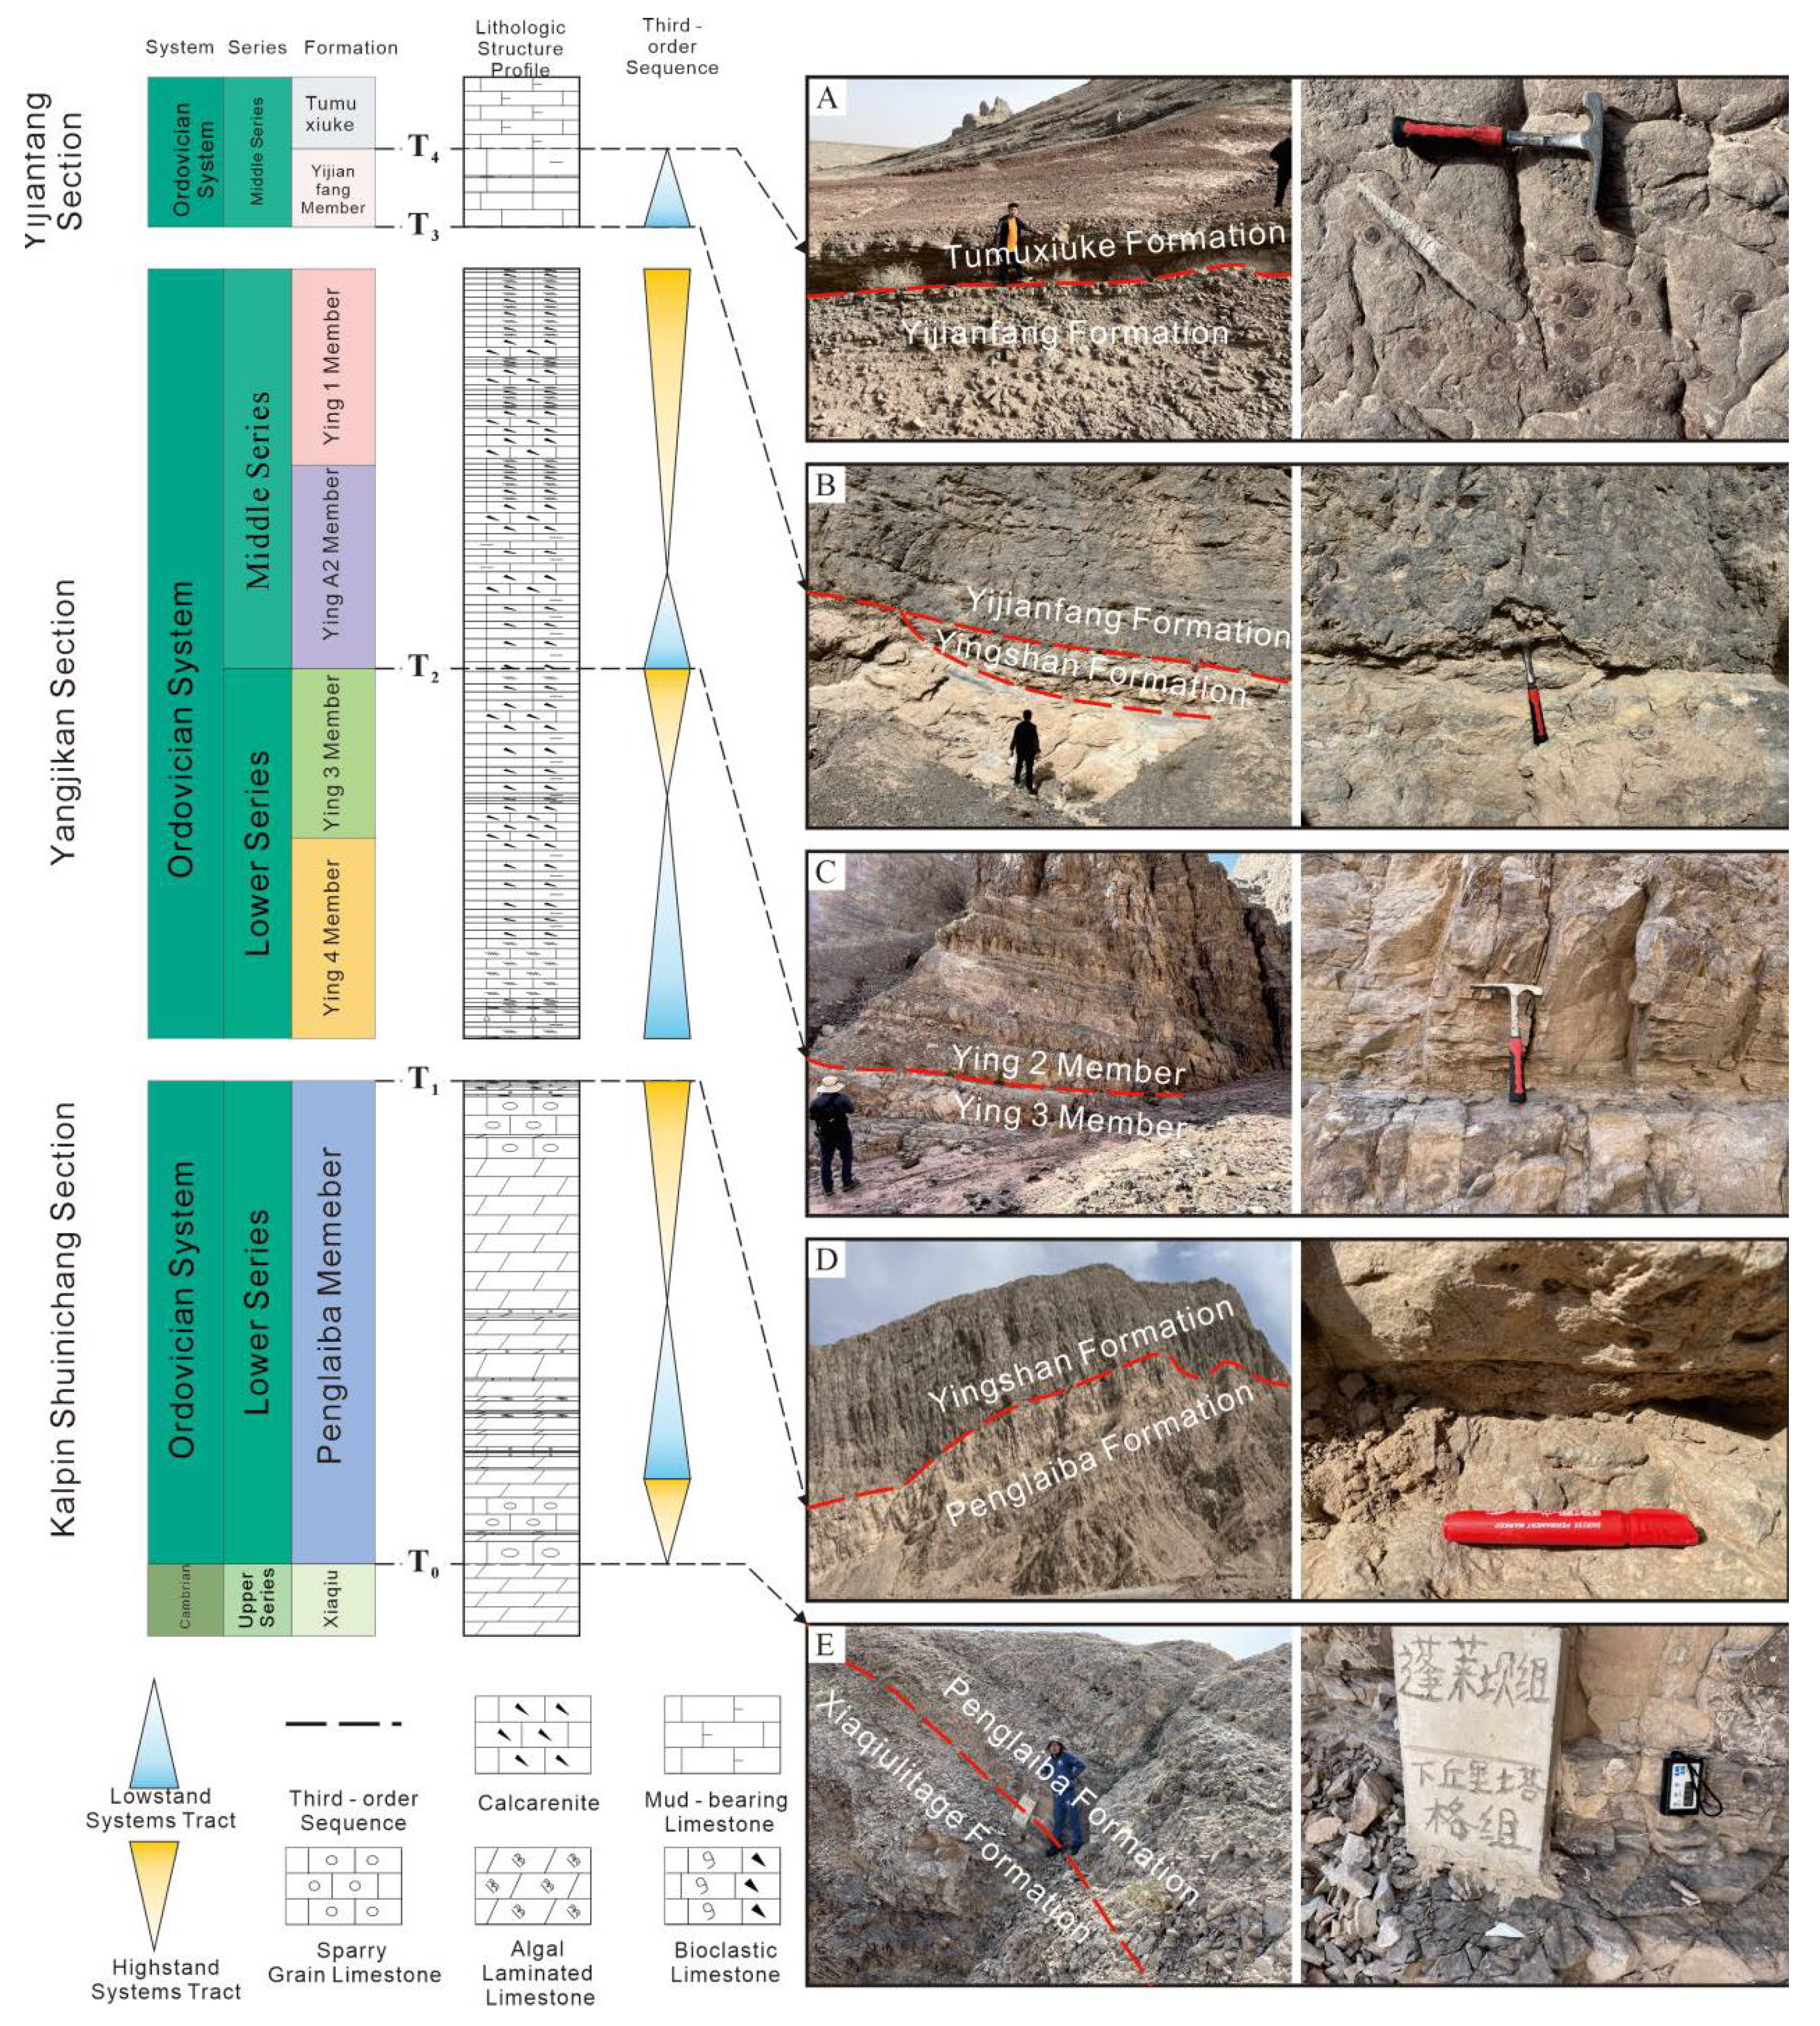
Figure 4.
Spectrum analysis and depth domain filtering.
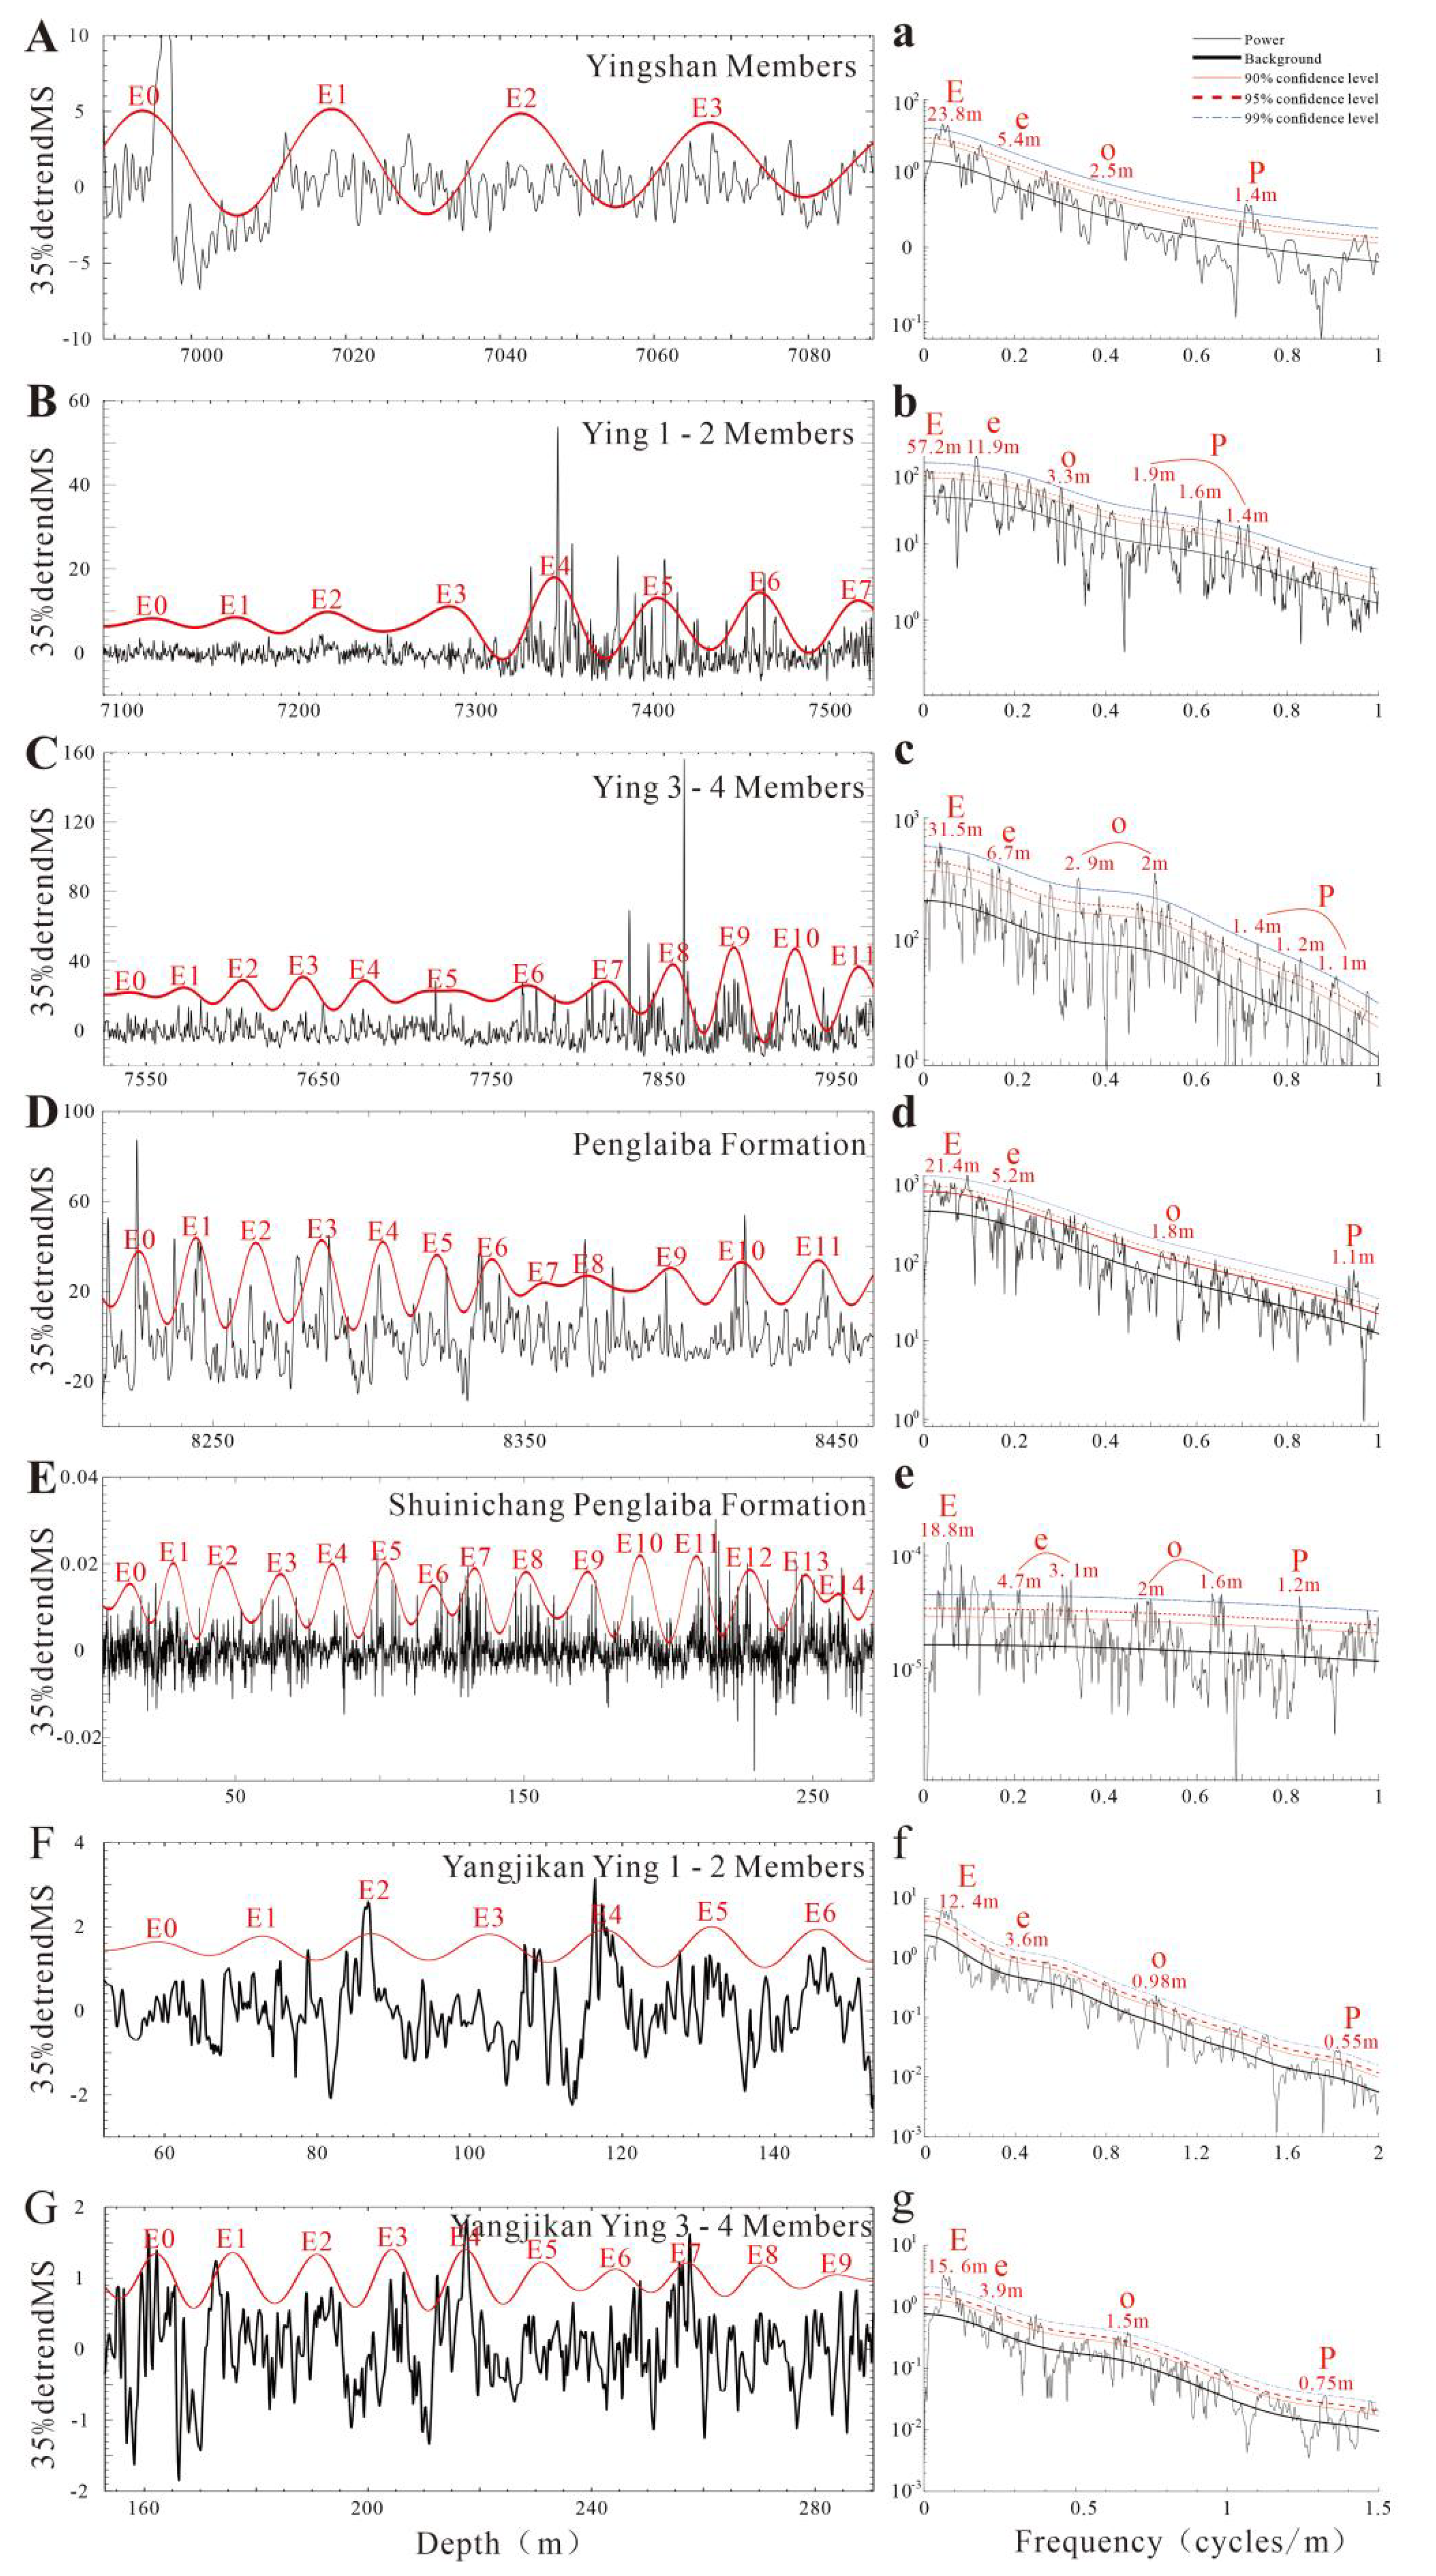
Figure 5.
Sedimentary noise model to reconstruct sea level.
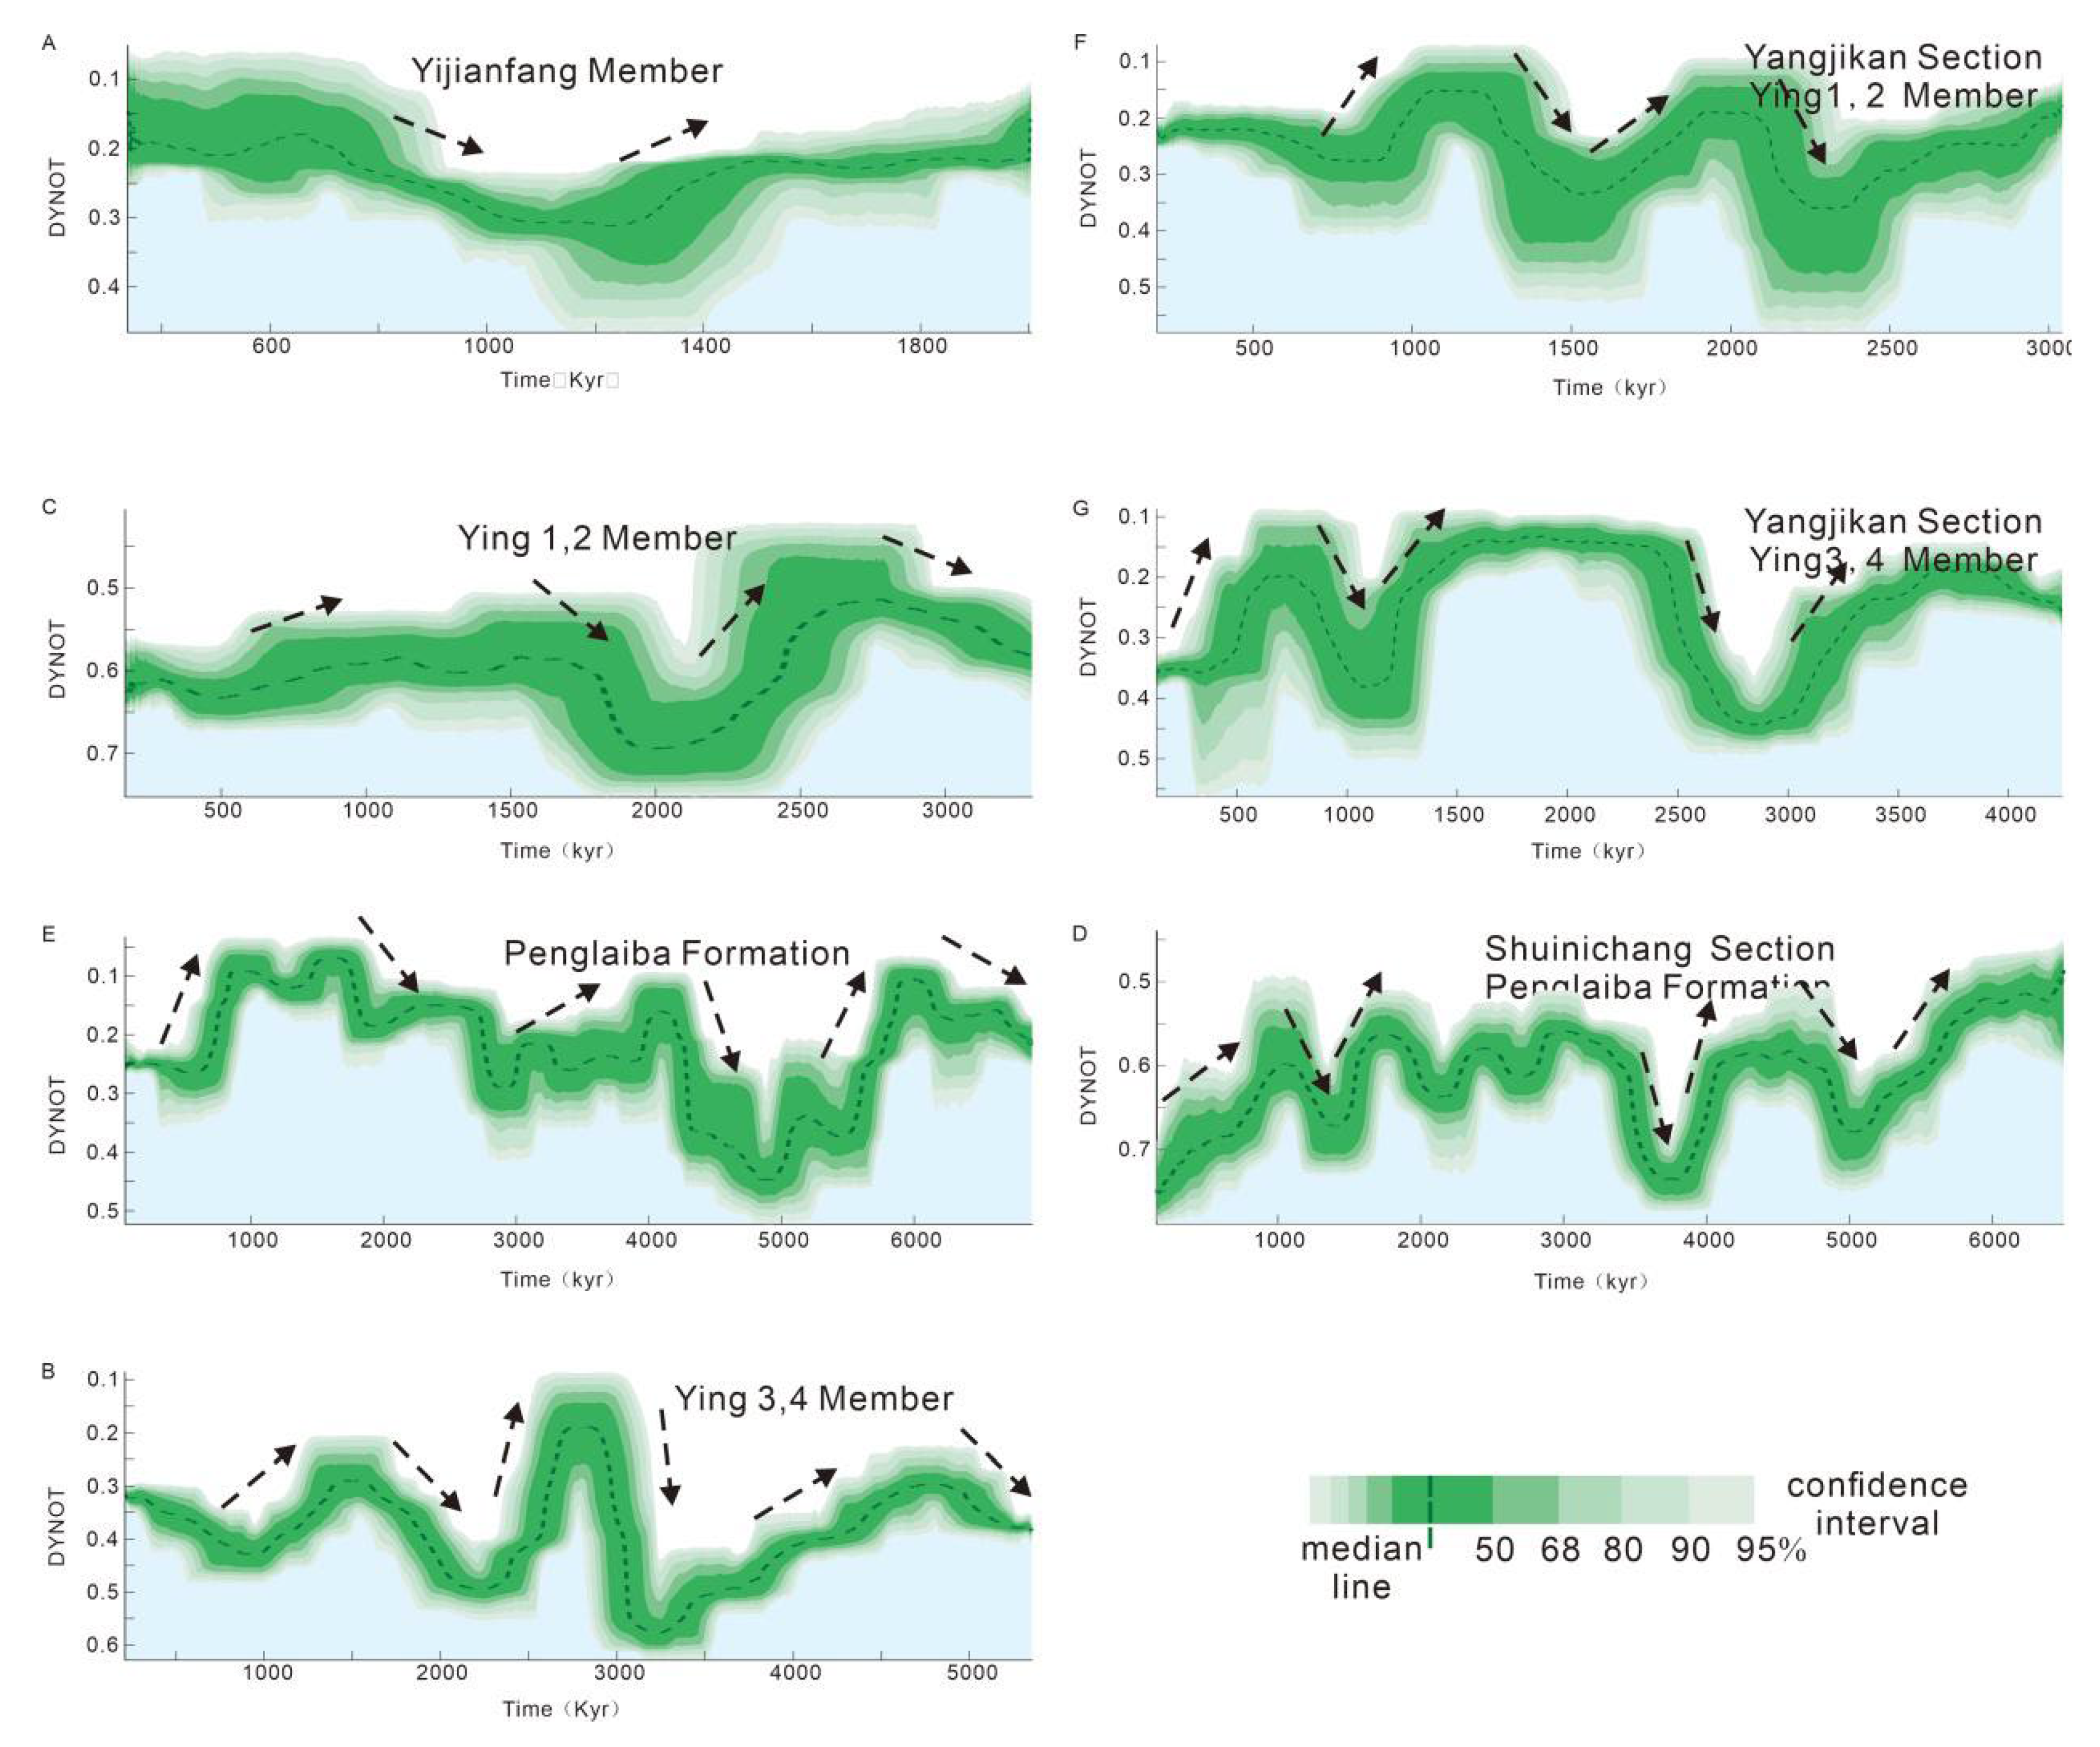
Figure 6.
Field characteristics of fourth-order sequence.
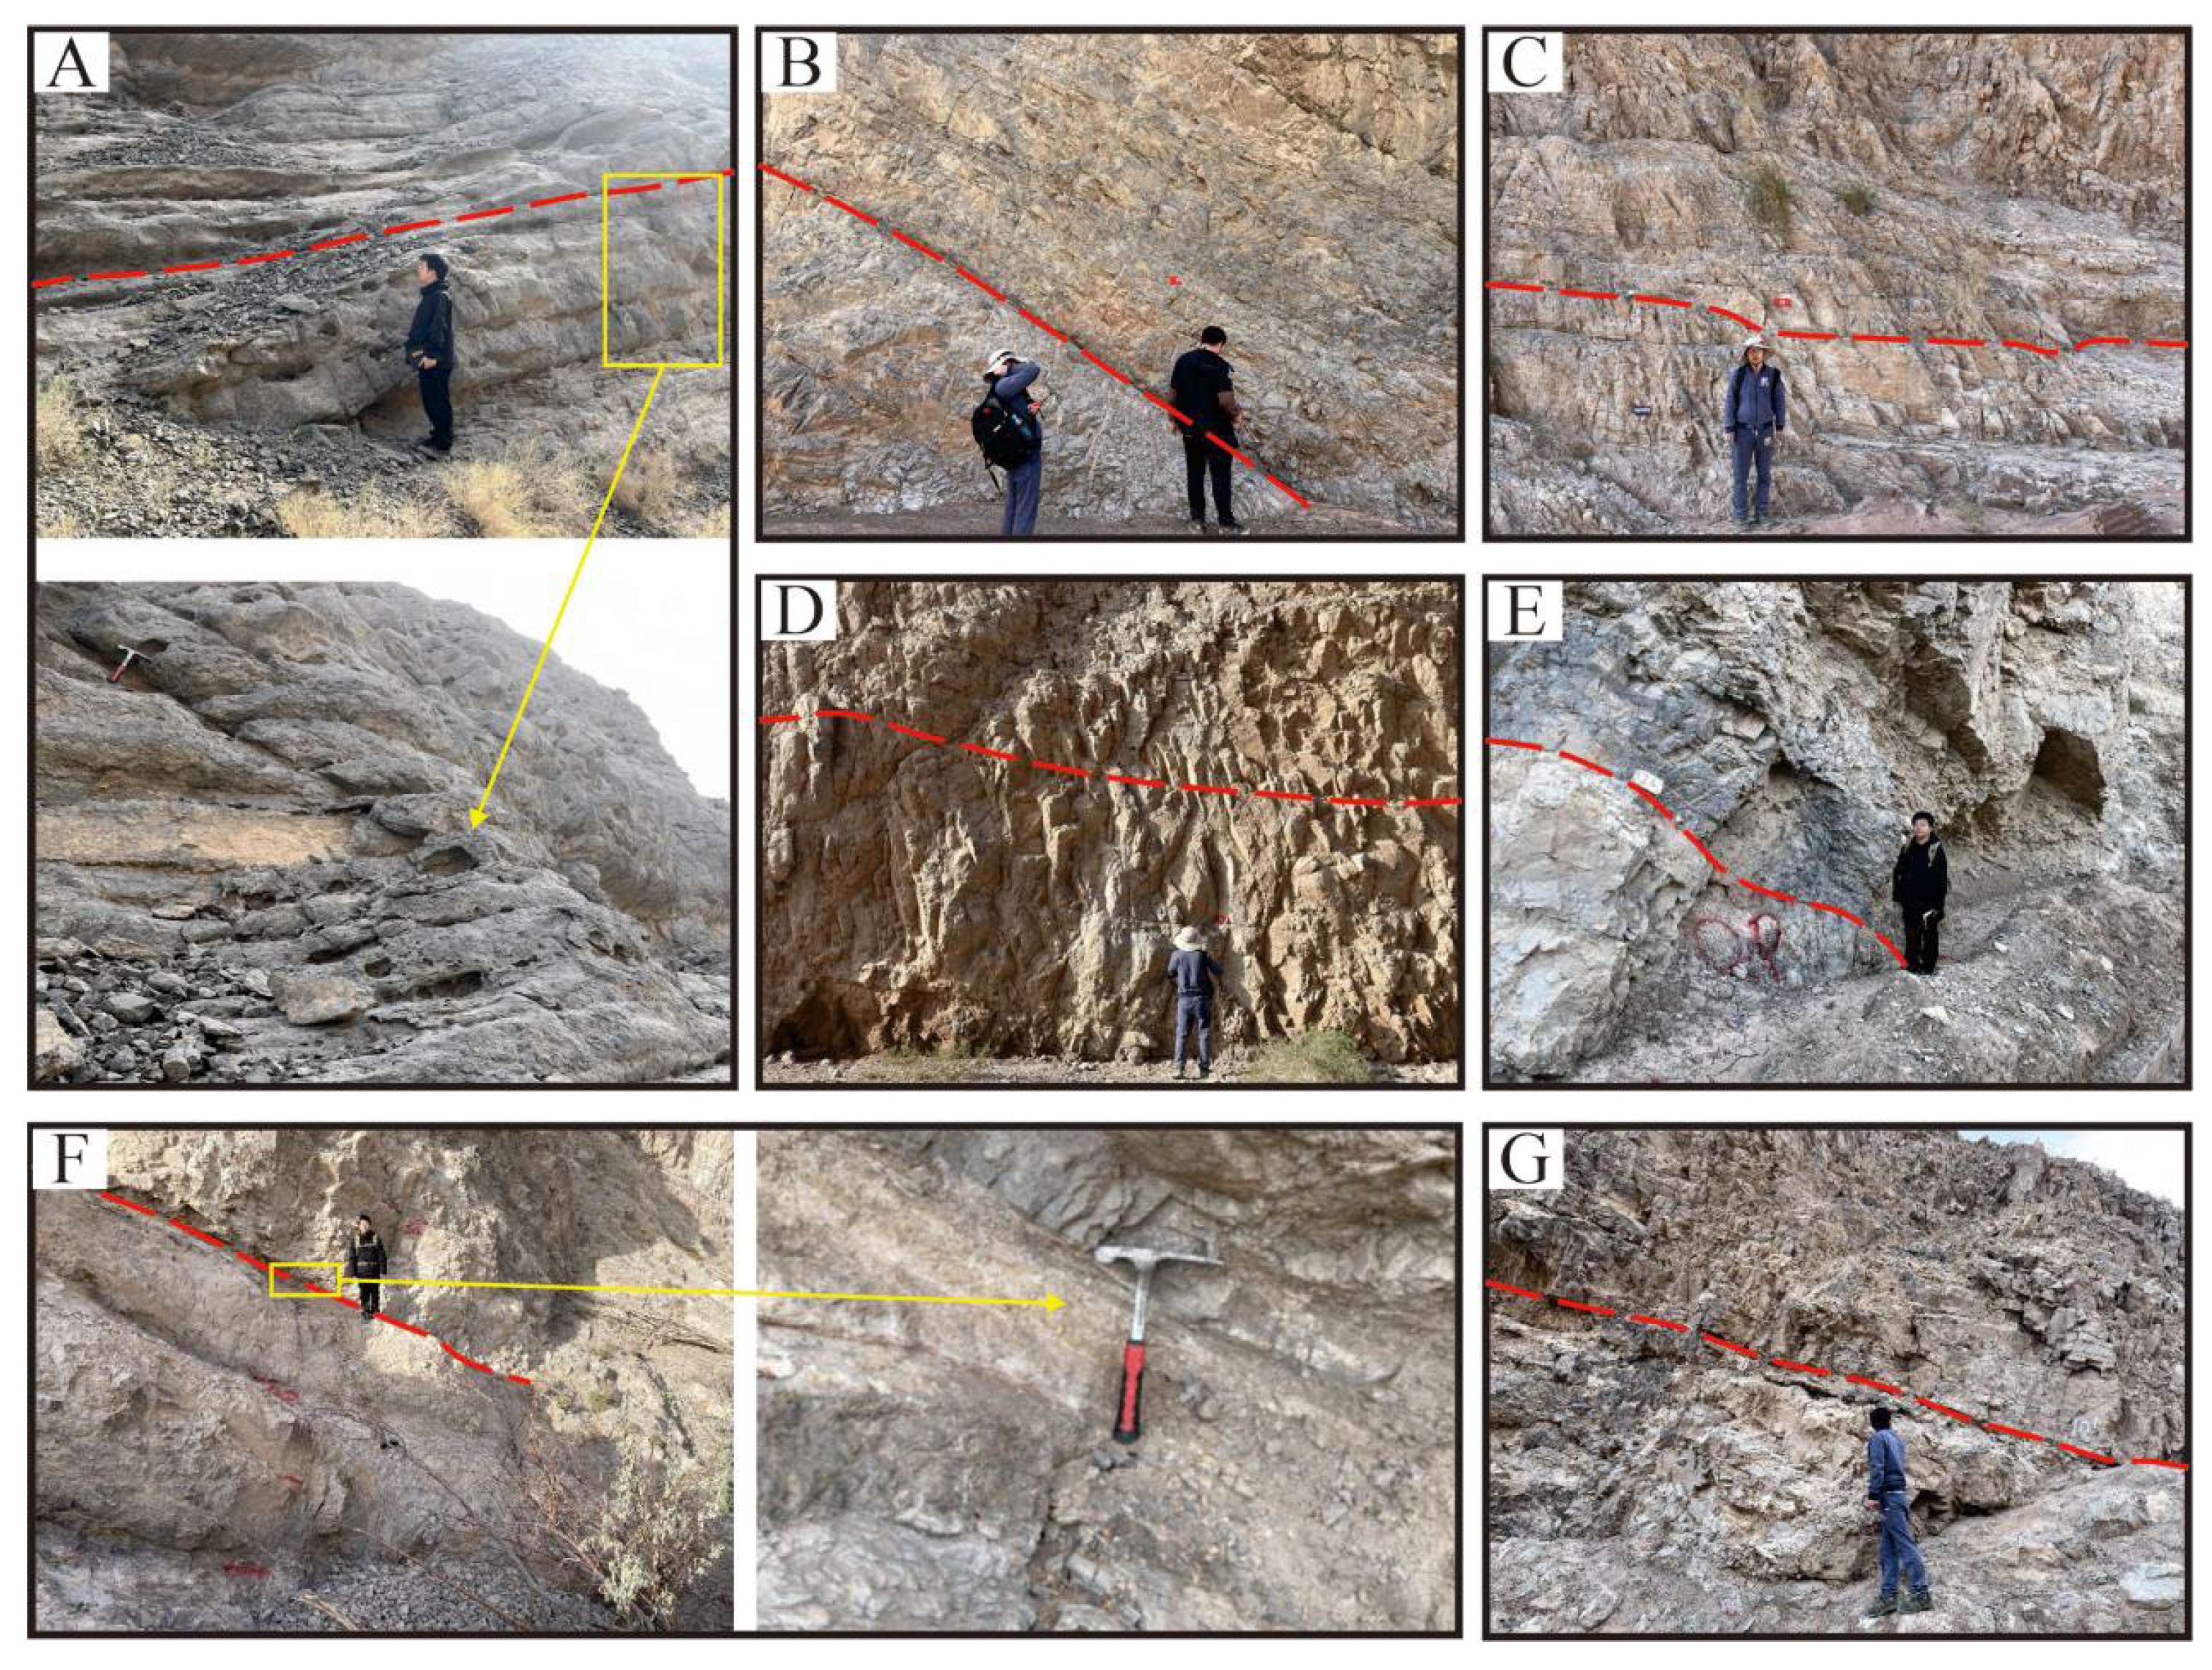
Figure 7.
Sequence interface characteristics and correlation diagram of Keping Cement Plant profile-Yangjikan profile-A1 well.
Figure 7.
Sequence interface characteristics and correlation diagram of Keping Cement Plant profile-Yangjikan profile-A1 well.
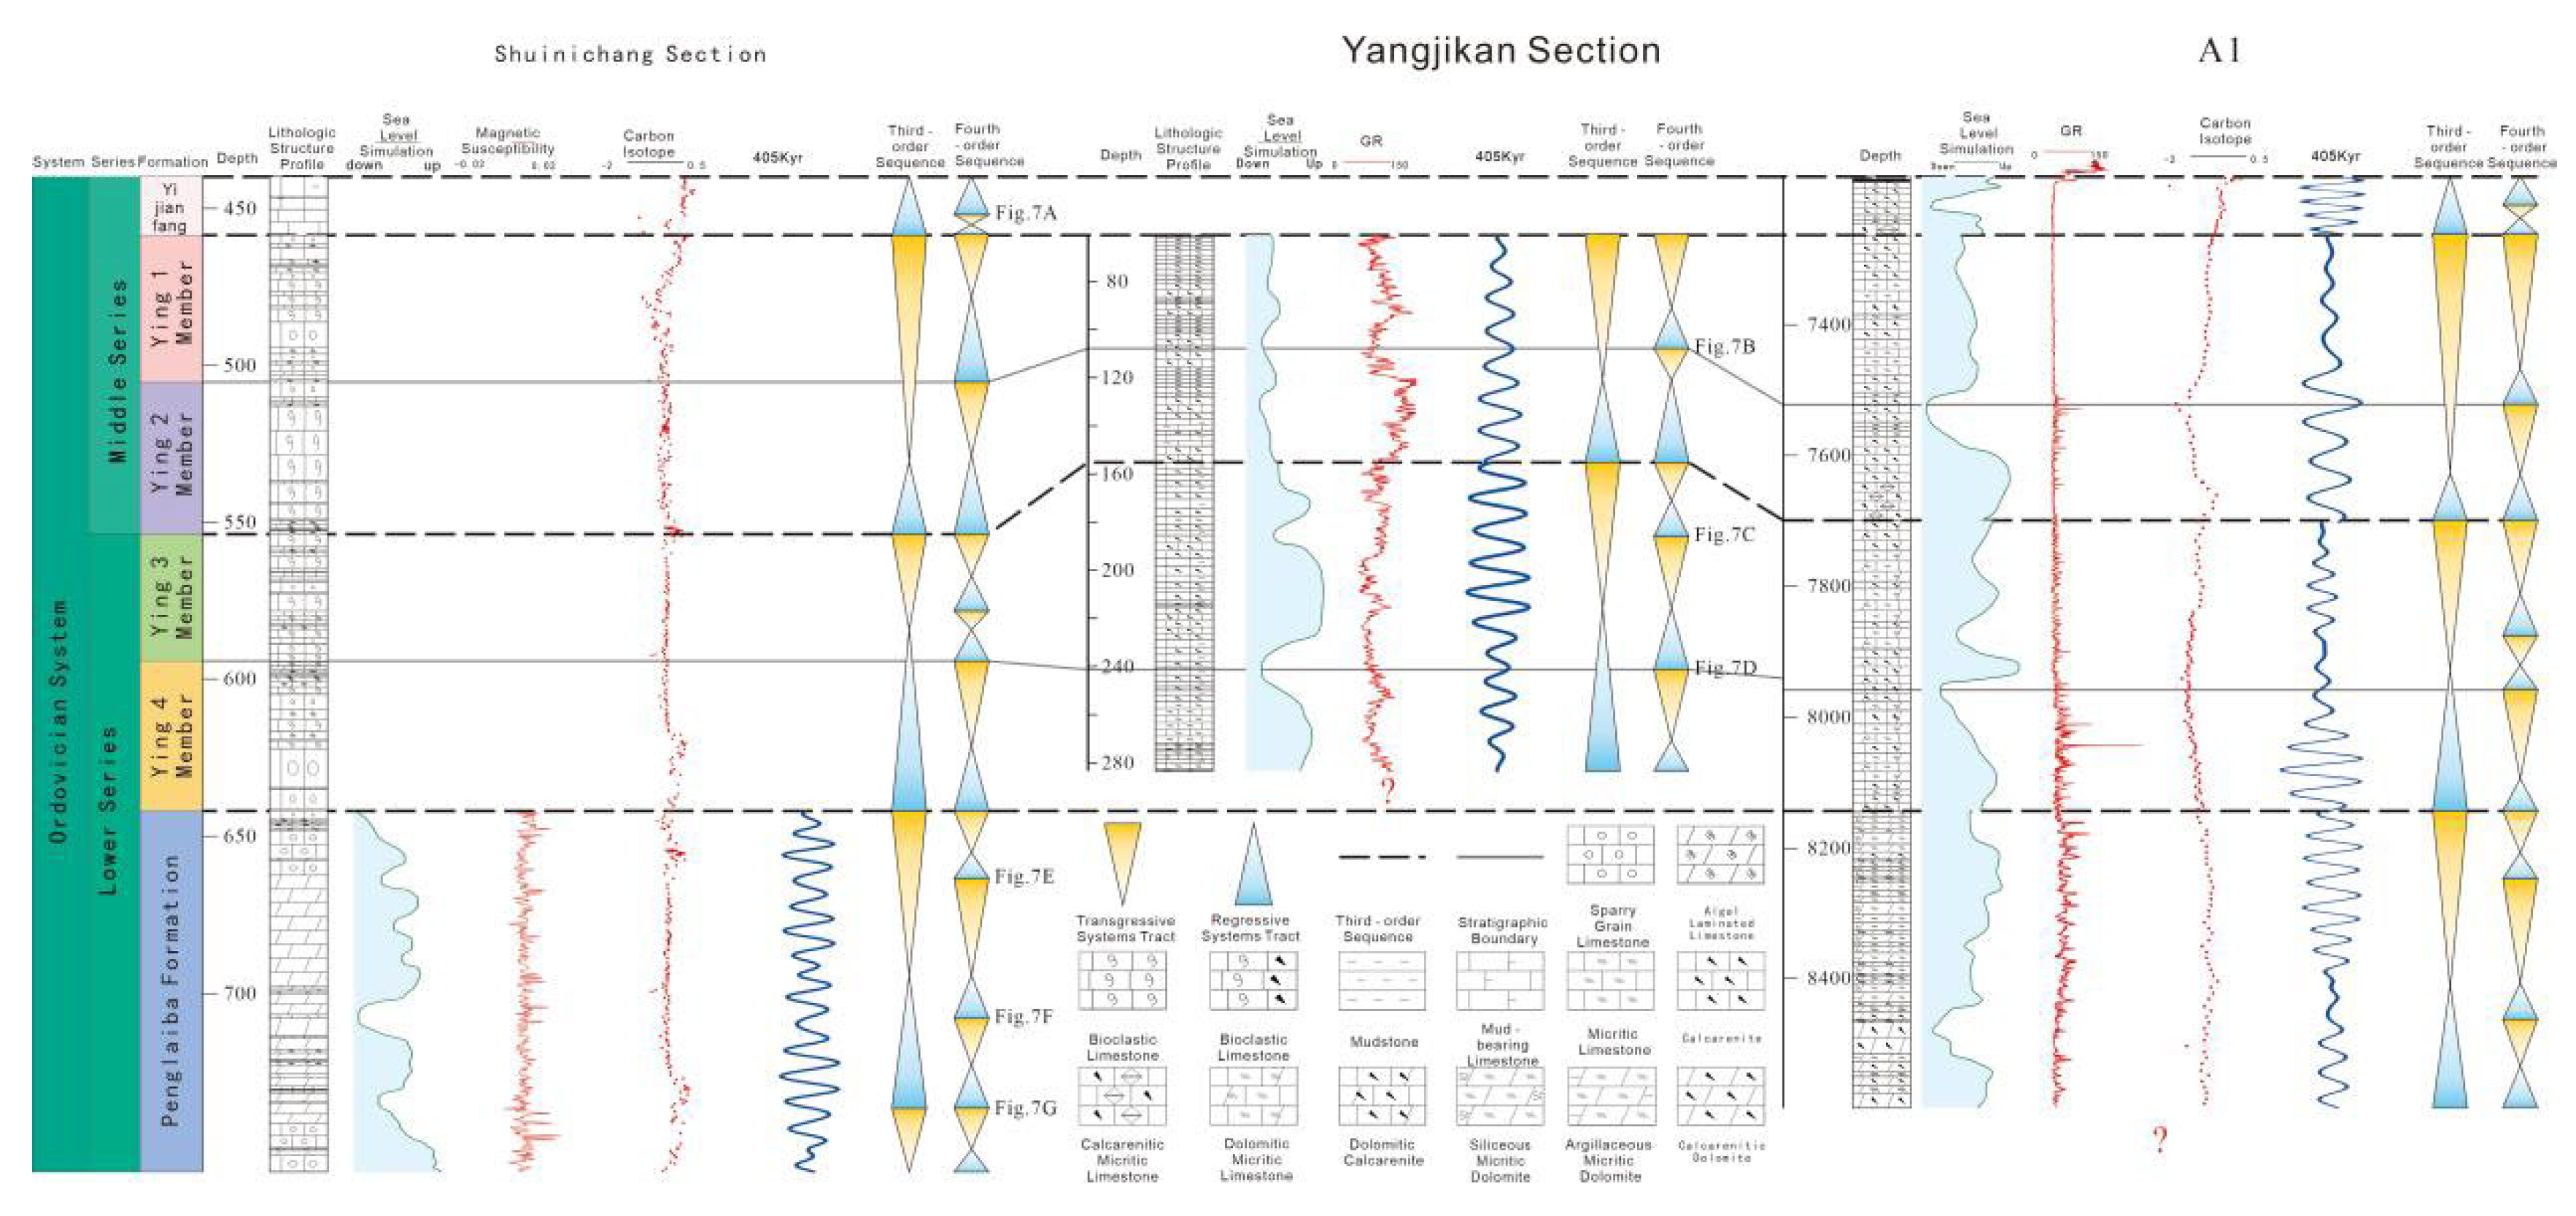
Figure 8.
Sequence division scheme of well A1 based on DYNOT model.
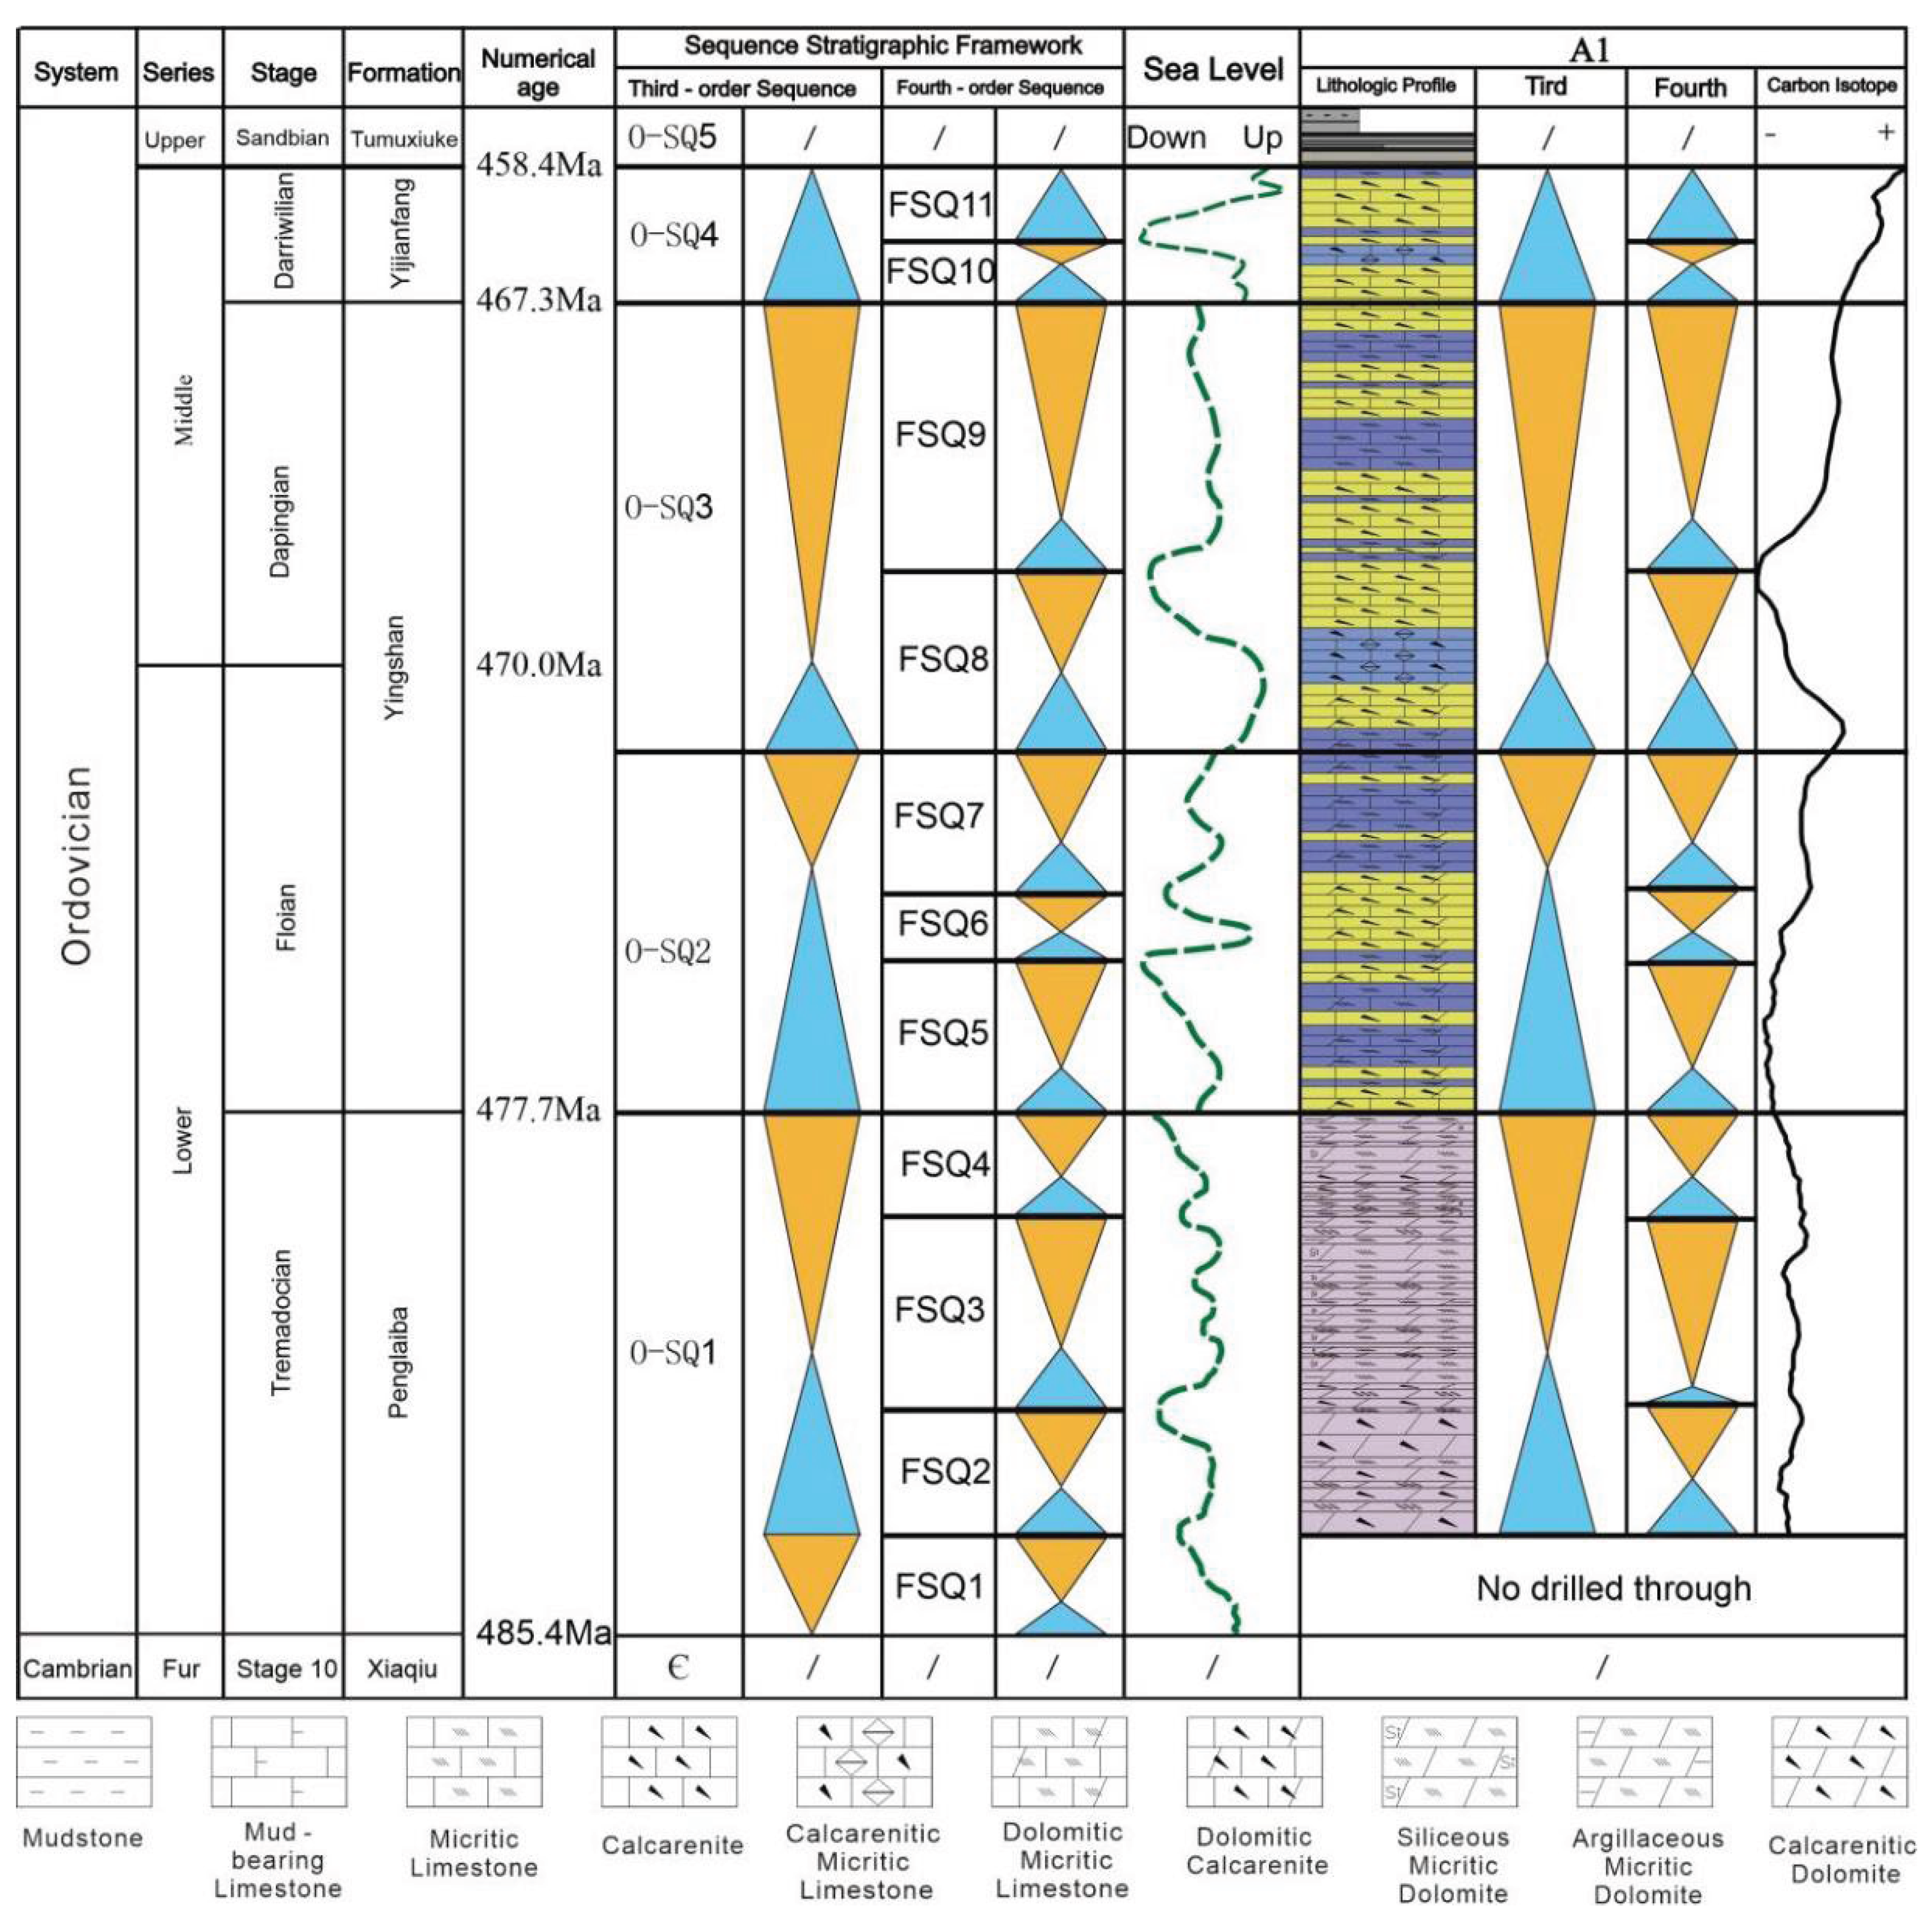
Figure 9.
M8 well-F2 well-M1 well-A1 well reservoir comparison.
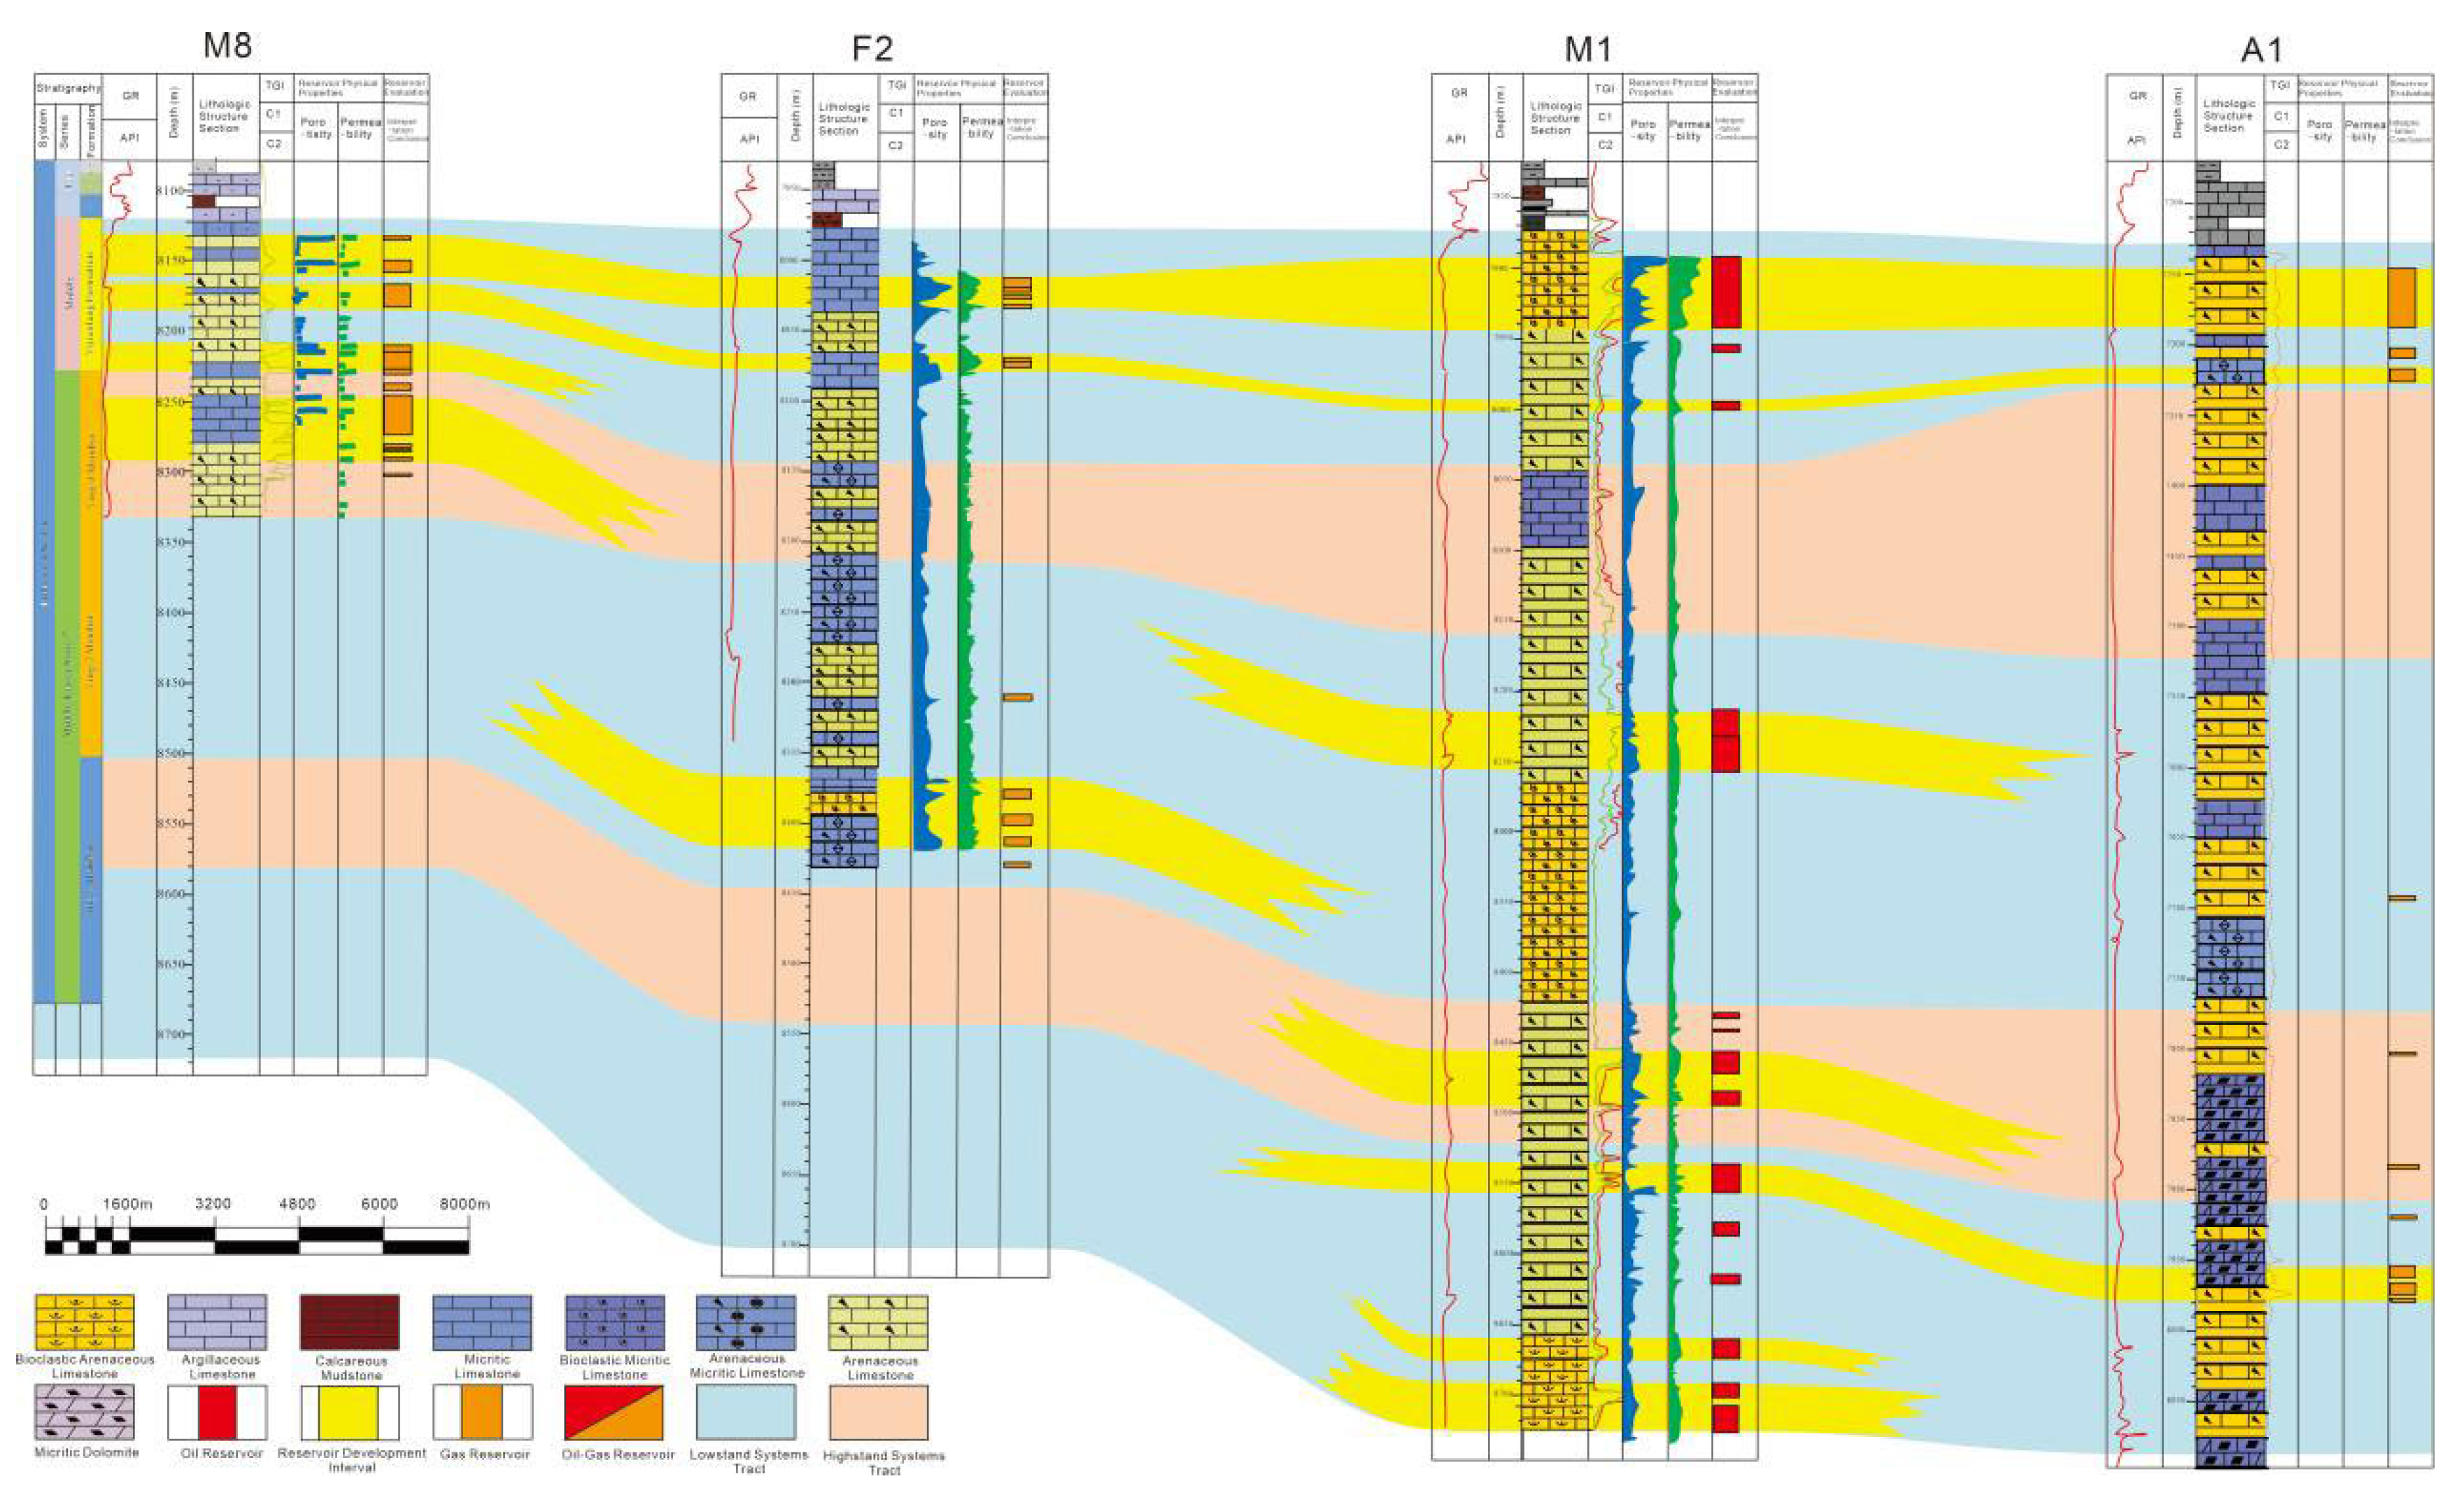

Table 1.
Theoretical astronomical orbital period of Middle-Lower Ordovician.
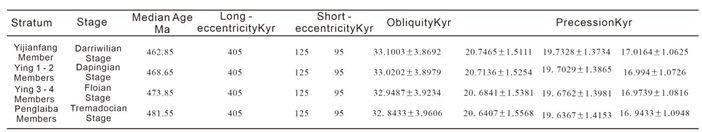 |
Table 2.
Reservoir classification standard.
 |
Disclaimer/Publisher’s Note: The statements, opinions and data contained in all publications are solely those of the individual author(s) and contributor(s) and not of MDPI and/or the editor(s). MDPI and/or the editor(s) disclaim responsibility for any injury to people or property resulting from any ideas, methods, instructions or products referred to in the content. |
© 2025 by the authors. Licensee MDPI, Basel, Switzerland. This article is an open access article distributed under the terms and conditions of the Creative Commons Attribution (CC BY) license (http://creativecommons.org/licenses/by/4.0/).
Copyright: This open access article is published under a Creative Commons CC BY 4.0 license, which permit the free download, distribution, and reuse, provided that the author and preprint are cited in any reuse.


