
Submitted:
02 December 2025
Posted:
03 December 2025
You are already at the latest version
Abstract
This study investigates the interactions between surface atmospheric variables such as temperature, relative humidity, dew point, solar radiation, wind speed, and pressure to understand how thermodynamic and dynamic processes effect local weather conditions. Four diagnostic analyses were performed, viz. (i) the inverse relationship between temperature and relative humidity, (ii) the positive coupling between wind speed and pressure variability, (iii) the association between temperature and dew point during warm and moist conditions, and (iv) the multivariate correlations between all variables. The results show that cooler temperatures correspond to higher relative humidity, while higher temperatures follow with higher dew point values, which indicates improved heat–moisture interaction during warm periods. Wind speed increases with decreasing pressure, reflecting dynamic instability during disturbed weather. The correlation structure reveals two coherent clusters, such as a thermodynamic cluster (temperature, dew point, humidity, solar radiation) and a dynamic cluster (pressure and wind). These findings provide a foundational understanding of weather behavior and offer valuable perceptions for climate modelling, forecasting, and risk assessment.
Keywords:
extreme weather
; thermodynamic–dynamic interactions
; surface atmospheric variability
1. Introduction
The increasing severity of extreme weather events has been widely documented in many recent climatological studies. Observational studies indicates that both the frequency and magnitude of these events are rising under ongoing climate change (Zwiers et al., 2013; Nayak, 2018; Tyagi et al., 2022; Clarke et al., 2022; Sahu et al., 2023; Sayat et al., 2024; Nayak and Sahu, 2025). The weather phenomena such as heatwaves, cold surges, heavy rainfall, tropical cyclones, thunderstorms, and snowfall continue to cause significant risks to the human life and properties (Chaudhary and Piracha, 2021; Rajkovich et al., 2024; Koteshwaramma et al., 2024; Maity et al., 2025). Thus, understanding the physical interactions that precede such extremes remains essential for improving forecasting skill and mitigating societal impacts.
Several research has shown that extreme events are rarely driven by a single factor; rather, they emerge from coupled land–atmosphere–ocean processes. Many studies have examined these couplings from multiple perspectives. For instance, Walsh et al. (2020), Meinander et al. (2021), and Nayak et al. (2023) describe how synoptic-scale circulation reorganizes moisture and temperature fields. Crisp et al. (2022) highlight feedbacks among soil moisture, radiation balance, and boundary-layer thermodynamics, while Bindhajam et al. (2020) demonstrate how land-surface temperature and vegetation modulate atmospheric moisture supply. At the oceanic interface, Sahu et al. (2022) illustrate how sea-surface temperature and currents influence large-scale circulation patterns such as ENSO and tropical cyclone formation. Land-use change such as deforestation, agricultural intensification, and urbanization also modify the local climate extremes (Nayak and Mandal, 2012; Sahu et al., 2023; Mishra et al., 2025).
These findings emphasize that extreme weather arises from the co-evolution of temperature, humidity, pressure gradients, wind speed, and radiative fluxes. Heatwaves, for example, are closely linked to land-surface warming and humidity dynamics (Maity et al., 2021; Nayak et al., 2022, 2023). Tropical cyclones depend strongly on pressure anomalies and sea-surface temperatures (Singh et al., 2023; Nayak and Takemi, 2023), while flooding is driven by intense precipitation and interactions with sea-level rise and storm surge (Nayak and Takemi, 2020; Singh et al., 2022; Nayak, 2024). Drought events, in contrast, are formed by soil moisture depletion and atmospheric circulation anomalies (Lhotka et al., 2020; Qing et al., 2023). Despite this progress, the thermodynamic and dynamic relationships that support the development of extremes remain underexplored, especially where land–atmosphere coupling dominates (Dabral et al., 2023; Sahu et al., 2025).
The present study aims to explore the interactions among temperature, humidity, vapor pressure, dewpoint, wind speed, solar radiation, and pressure fields to discuss (1) how thermodynamic variables (e.g., temperature, RH, dewpoint) and dynamic indicators (e.g., wind speed, local pressure, sea-level pressure) evolve simultaneously and (2) how the integrated assessment of the physical drivers influence weather variability.
2. Methodology
This study uses hourly surface meteorological observations from the Radar-Automated Meteorological Data Acquisition System (Radar-AMeDAS) to investigate the thermodynamic and dynamic relationships relevant to the development of extreme weather conditions. Three months of hourly data (January–March) were analyzed, covering a comprehensive set of surface variables including air temperature, precipitation, wind speed, solar radiation, local pressure, sea-level pressure, relative humidity, vapor pressure, dew-point temperature, cloud cover, and visibility (Japan Meteorological Agency; https://www.jma.go.jp/jma/index.html).
Temperature, humidity, and vapor-pressure fields were used to compute dew-point temperature. The thermodynamic relationship was analyzed to understand the near-surface coupling to highlighting the saturation behavior of the atmosphere and its sensitivity to temperature fluctuations. The local pressure and sea-level pressure were examined alongside wind speed to identify signatures of dynamic forcing and the pressure drop’s association with cyclonic activity or windy conditions (Nayak et al., 2018; Saini et al., 2020; Nayak and Takemi, 2020, 2021; Sahu et al., 2022). The relationship between radiation and thermodynamic variables was analyzed to assess how surface heating influences moisture content, drying potential, and diurnal variations in relative humidity and vapor pressure. A correlation matrix was also discussed to capture the dominant connections between all variables.
3. Results
3.1. Thermodynamic Variability
Figure 1 illustrates the temporal evolution of three thermodynamic variables such as air temperature, vapor pressure, and relative humidity over the entire observation period. Temperature fluctuates between approximately 1°C and 22°C, with repeated short-duration warming and cooling cycles indicating active day–night variability and synoptic-scale transitions. Vapor pressure ranges from roughly 2 to 12 hPa, which follow the broad pattern of temperature due to its exponential dependence on thermal state. Relative humidity shows a much larger dynamic range (18% to nearly 100%), with sharp oscillations that reflect rapid moisture adjustments through changes in temperature, mixing processes, and varying cloud conditions. Periods of high temperature and moderately high vapor pressure correspond to RH depressions below 40%, indicating conditions conducive to drying and enhanced evaporative demand. On the other hand, RH frequently peaks above 85–95% when temperature drops or when moist air masses influence the station behaviors consistent with previous findings for winter and early-spring boundary-layer conditions in Japan (Nayak and Dairaku, 2016; Nayak et al., 2018; 2025).
3.2. Dynamical Coupling
Figure 2 examines the relationship between surface pressure and wind speed. Pressure values extend from approximately 992 to 1022 hPa, while wind speeds vary from near 0 to about 7.5 m/s. A broad but evident pattern shows higher wind speeds occurring specially at lower pressure values, consistent with the expected response to stronger horizontal pressure gradients during cyclonic passages or frontal activity. Sea-level pressure anomaly ranges from ~9.5 to 10.6 (normalized units).
oints with more negative or lower anomalies are located toward the lower-pressure side and often correspond to wind speeds above 4–6 m/s, strengthening the link between anomalous pressure deficits and enhanced low-level flow. This dynamical structure agrees with the typical winter and early-spring synoptic environment of Japan, where transient low-pressure systems and marginal baroclinic activity frequently modulate near-surface winds (Nayak et al., 2018; Nayak & Takemi, 2020).
3.3. Radiative–Moisture Interaction
Figure 3 shows the surface solar radiation clearly influences relative humidity. Solar radiation values range from 0 to ~3.2 MJ/m2, with a substantial proportion of data occurring at or near zero, reflecting night-time and cloudy conditions. Relative humidity ranges 20–100%, and the air temperature ranges 1–22°C. At higher solar radiation (>1.5 MJ/m2), RH predominantly falls between 35–60%, indicating drying due to solar-driven warming and boundary-layer mixing.
At low or zero solar radiation, RH frequently clusters above 80–95%, representing nocturnal cooling, radiative saturation processes, and cloud-related moisture retention. Solar radiation and lower RH are consistent with enhanced evaporative demand under daytime heating. This pattern reproduces the established radiative–thermodynamic coupling in midlatitude surface environments, where shortwave heating drives boundary-layer deepening and humidity reduction (Nayak et al., 2021; Crisp et al., 2022).
3.4. Multivariate Atmospheric Relationships
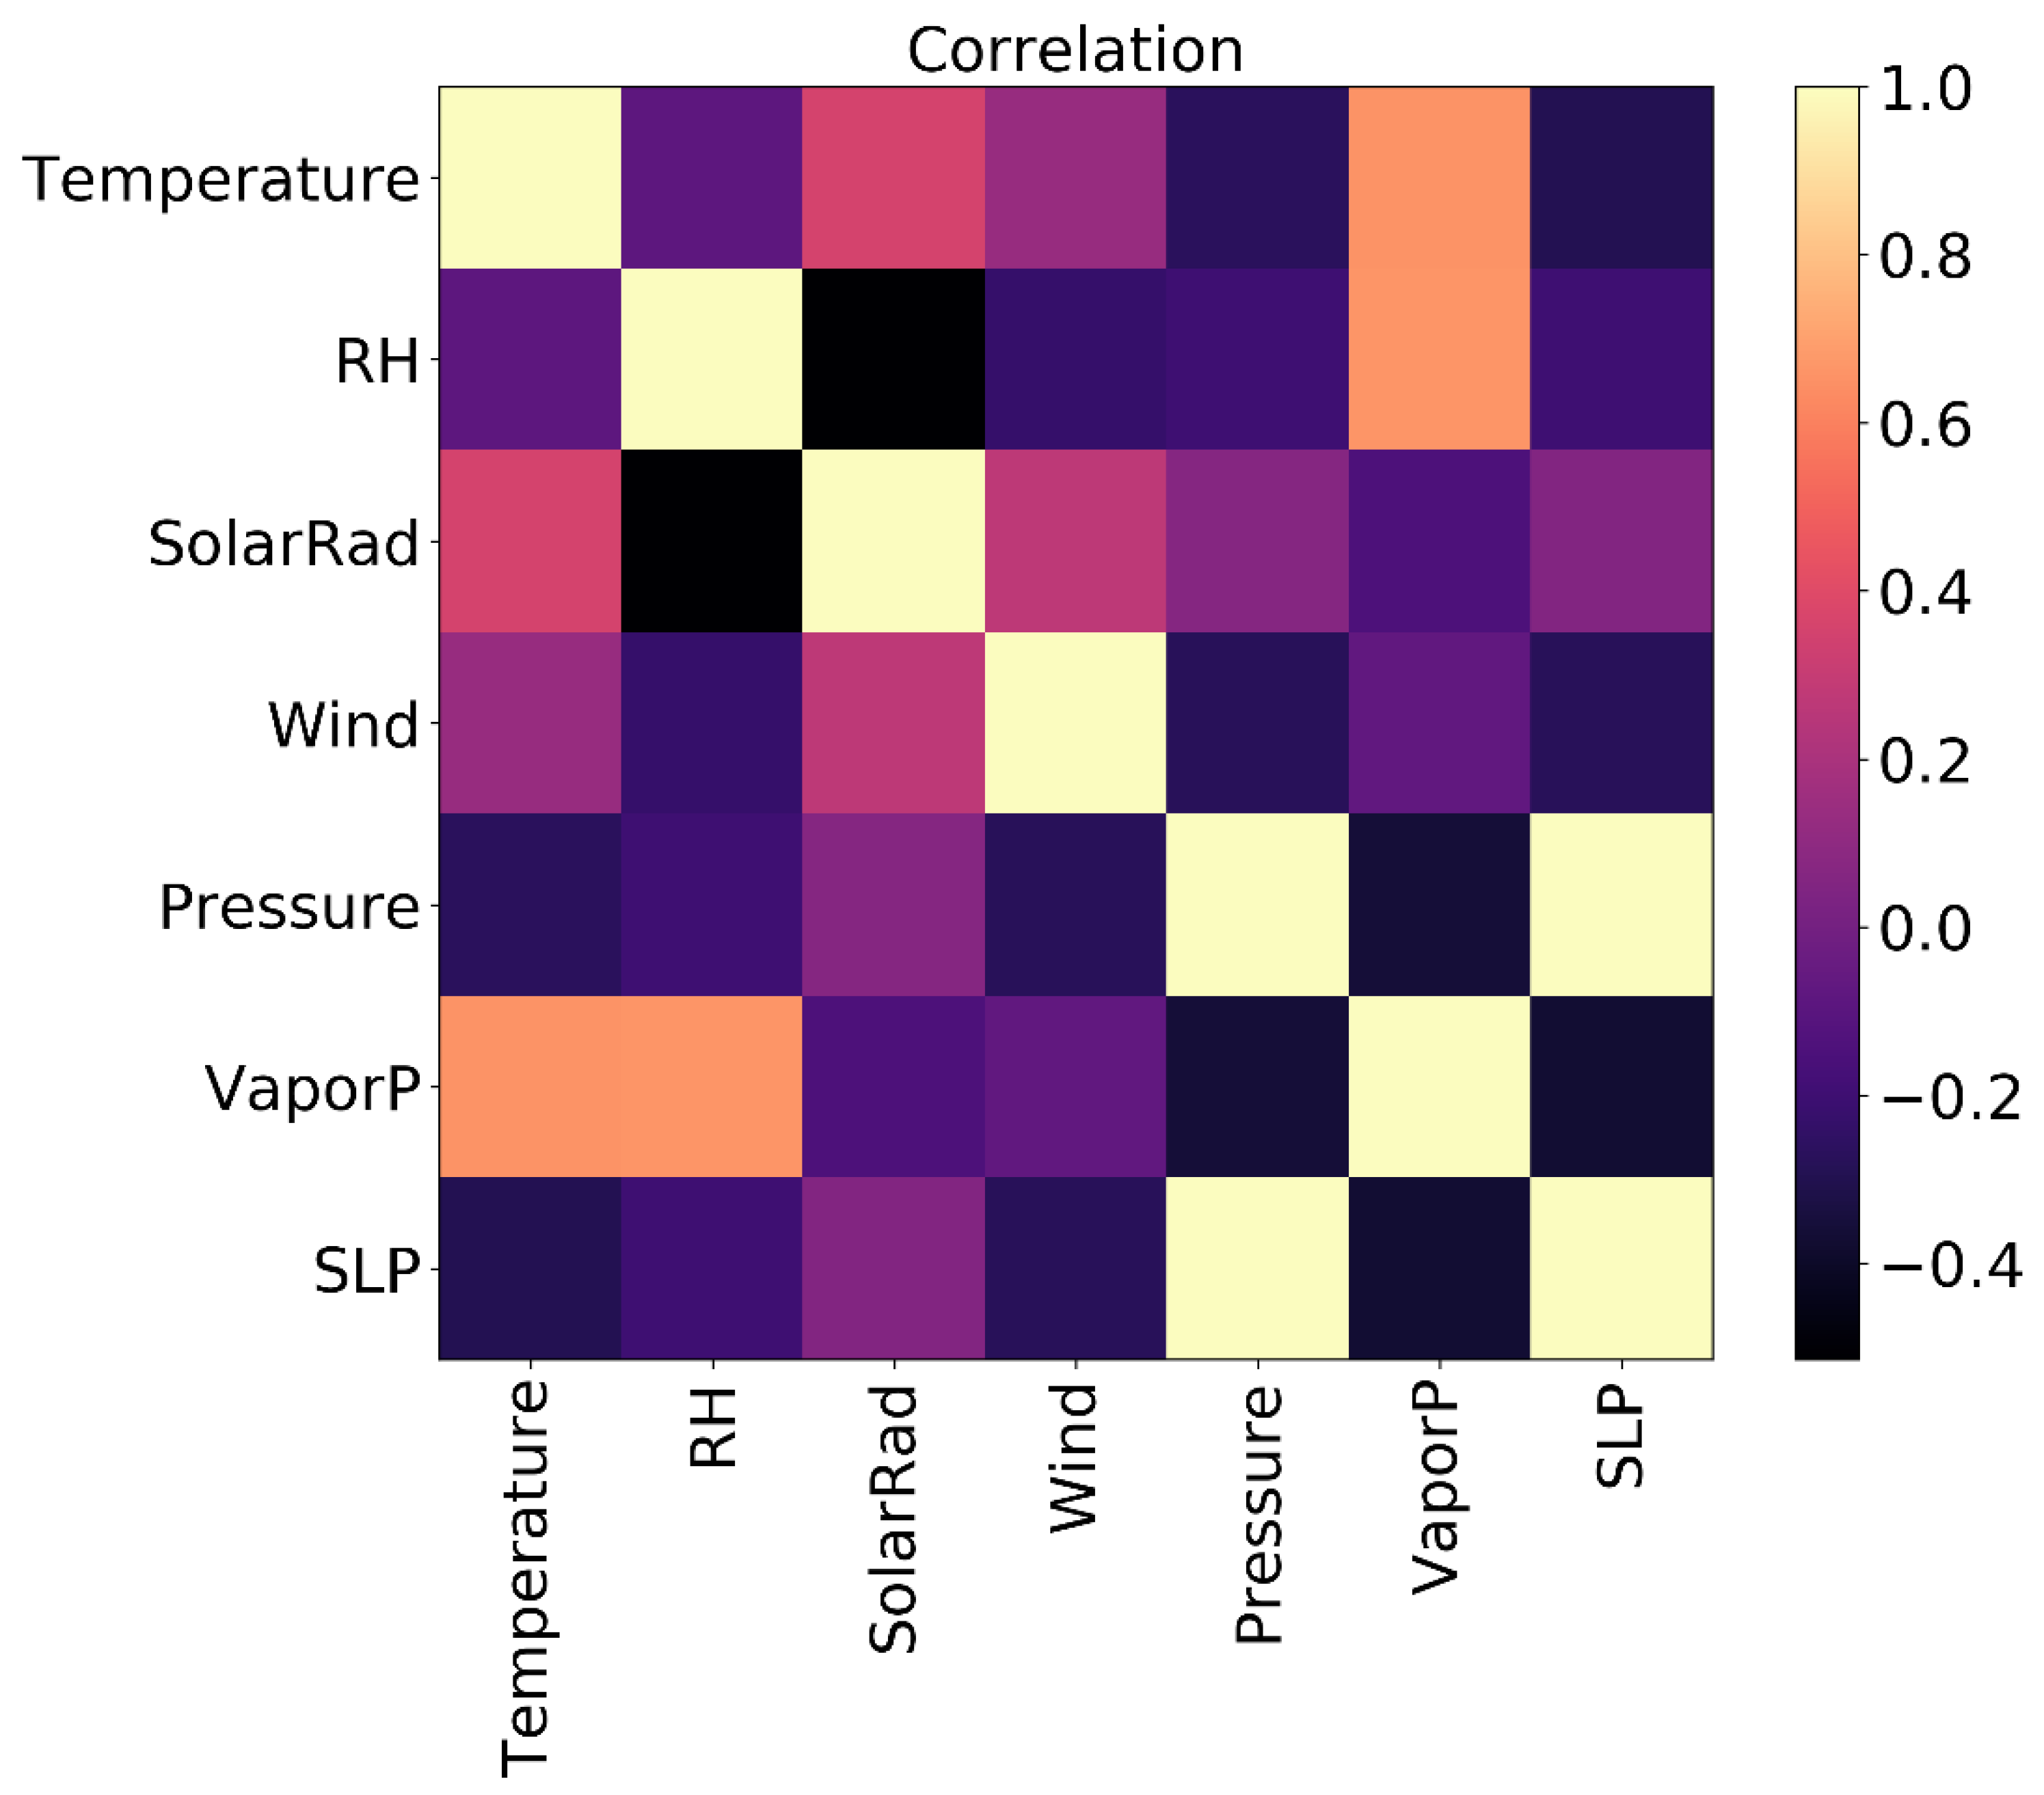
Figure 4 presents the correlation matrix constructed from all the seven variables such as temperature, relative humidity, solar radiation, wind speed, surface pressure, vapor pressure, and sea-level pressure. The strongest positive correlations is noticed between temperature and vapor pressure (~0.70–0.80), indicating the exponential dependence of vapor pressure on temperature through the Clausius–Clapeyron relation. Temperature also shows a moderate positive correlation with solar radiation (~0.30–0.40), representing the contribution of daytime radiative forcing to surface warming. Relative humidity exhibits a robust negative correlation with temperature (around –0.45 to –0.55), consistent with expected thermodynamic behavior that warmer conditions reduce RH unless accompanied by substantial moisture increases.
RH is also strongly negatively correlated with solar radiation (~–0.50), highlighting the radiant–mixing driven humidity suppression described earlier. Wind speed shows generally weak correlations with most thermodynamic variables but a slight positive relationship with solar radiation and a modest negative relationship with SLP. The weak-to-moderate negative correlation between wind and pressure (~–0.20 to –0.30) agrees with link between enhanced winds and pressure that deficits during synoptic disturbances. Pressure and SLP correlate strongly with each other, as expected from their shared physical basis and diurnal pressure cycle. Both pressure fields exhibit weak negative correlations with temperature and vapor pressure, consistent with occasional warm-sector passages during low-pressure events.
4. Discussion
The analysis reveals that relative humidity increases evidently when temperatures fall, representing a strong inverse sensitivity between these two variables (Figure 1). This behavior is consistent with cold-season processes, where lower temperatures reduce the air’s moisture-holding capacity, causing RH to rise and intensifying the likelihood of cold waves, fog, or snowfall. Such conditions can exacerbate freezing events or enhance dew formation, similar to the cold-region responses noted in previous climatological assessments (Nayak, 2023). The pressure–wind relationship shows that lower local pressure corresponds with higher wind speeds (Figure 2). This pattern is of particular importance during storm development, in which strong pressure gradients drive intense winds and can lead to storm surge development. The clustering of low-pressure, high-wind observations agrees with established storm dynamics reported in regional studies (Nayak and Takemi, 2020, 2021; Morimoto et al., 2021; Nayak and Kanda, 2023; Koteshwaramma et al., 2025). High temperature and high dew point combinations correspond to extreme heat conditions, which increase thermal stress and magnify heat-wave intensity (Figure 3). This is consistent with previous work demonstrating that moist heat extremes are becoming more prominent under climate warming (Nayak, 2021; Nayak, 2023). The correlation suggests that moisture-rich conditions are conducive to heavy rainfall events (Figure 4). This is also consistent with previous findings on flood-inducing systems (Nayak et al., 2013; Nayak and Mandal, 2019). The structural coherence of these clusters suggests that thermodynamic processes primarily drive humidity- and heat-related extremes, while dynamic processes shape storm-induced wind and pressure anomalies.
Overall, the results reproduce a system in which climate change is likely to intensify the underlying relationships. Rising temperatures, increased atmospheric moisture, and changing sea-level and land-surface conditions can intensify the severity of tropical cyclones, heat waves, and heavy rainfall events (Nayak et al., 2013; Nayak, 2021; Nayak, 2023). Moreover, anthropogenic activities such as land-use change, urbanization, and industrial development may further alter surface–atmosphere interactions and may amplify the expression of extreme weather phenomena (Nayak and Behera, 2008, 2009; Nayak et al., 2019, 2021).
5. Conclusion
This study provides an integrated assessment of thermodynamic and dynamic atmospheric variables, and highlights how their interactions evolve. The results indicate that lower temperatures are associated with higher relative humidity, whereas higher temperatures coincide with elevated dew point values, suggesting enhanced heat–moisture interactions during warmer periods. Wind speed rises as pressure drops, highlighting the dynamic instability present during unsettled weather conditions. Thus, the climate change may amplify these interactions, with rising temperatures, increased humidity, and modified surface conditions potentially strengthening the intensity of extreme weather events such as TCs, heat waves, and heavy rainfall episodes. This study can be extended with data collected over a longer temporal window to better capture interannual variations and long-term trends in extreme weather behavior, thereby improving our understanding of climate change impacts (Nayak and Takemi, 2022, 2024, 2025). Moreover, the relationships between surface variables have strong potential applications in climate modelling and forecasting frameworks (Nayak et al., 2017, 2018, 2019; Nayak 2021; Maity et al., 2017, 2022), which support the improved risk assessment and early-warning capabilities for high-impact weather events.
References
- Dabral, A., Shankhwar, R., Martins-Ferreira, M. A. C., Pandey, S., Kant, R., Meena, R. K., Chandra, G., Ginwal, H. S., Thakur, P. K., Bhandari, M. S., Sahu, N., & Nayak, S. (2023). Phenotypic, geological, and climatic spatio-temporal analyses of an exotic Grevillea robusta in the Northwestern Himalayas. Sustainability, 15(15), 12292. [CrossRef]
- Nayak, S. (2023). Exploring the future rainfall characteristics over India from large ensemble global warming experiments. Climate, 11(5), 94. [CrossRef]
- Zwiers, F. W., Alexander, L. V., Hegerl, G. C., Knutson, T. R., Kossin, J. P., Naveau, P.,... & Zhang, X. (2013). Climate extremes: challenges in estimating and understanding recent changes in the frequency and intensity of extreme climate and weather events. Climate science for serving society: research, modeling and prediction priorities, 339-389.
- Nayak, S., & Takemi, T. (2022). Assessing the impact of climate change on temperature and precipitation over India. In T. Sumi et al., (Eds.), Wadi Flash Floods, Natural Disaster Science and Mitigation Engineering: DPRI Reports (pp. 121-142). Springer. [CrossRef]
- Nayak, S., & Takemi, T. (2024). Climate change scenario over Japan: trends and impacts. In Khare (Ed.), The Role of Tropics in Climate Change (pp. 145-169), Elsevier Inc.
- Clarke, B., Otto, F., Stuart-Smith, R., & Harrington, L. (2022). Extreme weather impacts of climate change: an attribution perspective. Environmental Research: Climate, 1(1), 012001. [CrossRef]
- Nayak, S., Takemi, T., & Maity, S. (2022). Precipitation and temperature climatologies over India: A study with AGCM large ensemble climate simulations. Atmosphere, 13(5), 671. [CrossRef]
- Saha, S., Nayak, S., Bhattacharyya, I., Saha, S., Mandal, A. K., Chakraborty, S., Bhattacharyya, R., Chakraborty, R., Franco, O. L., Mandal, S. M., & Basak, A. (2014). Understanding the patterns of antibiotic susceptibility of bacteria causing urinary tract infection in West Bengal, India. Frontiers in Microbiology, 5, 463. [CrossRef]
- Sahu, N., Panda, A., Nayak, S., Saini, A., Mishra, M., Sayama, T., Sahu, L., Duan, W., Avtar, R., Behera, S. (2020). Impact of Indo-Pacific Climate Variability on High Streamflow Events in Mahanadi River Basin, India. Water, 12(7), 1952. [CrossRef]
- Sahu, N., Saini, A., Behera, S., Sayama, T., Nayak, S., Sahu, L., Duan, W., Avtar, R., Yamada, M., Singh, R.B., Takara, K. (2020). Impact of Indo-Pacific Climate Variability on Rice Productivity in Bihar, India. Sustainability, 12(17), 7023. [CrossRef]
- Saini, A., Sahu, N., Kumar, P., Nayak, S., Duan, W., Avtar, R., Behera, S. (2020). Advanced Rainfall Trend Analysis of 117 Years over West Coast Plain and Hill Agro-Climatic Region of India. Atmosphere, 11(11), 1225. [CrossRef]
- Saini, A., Sahu, N., & Nayak, S. (2023). Determination of Grid-Wise Monsoon Onset and Its Spatial Analysis for India (1901–2019). Atmosphere, 14(9), 1424. [CrossRef]
- Tyagi, N., Jayal, T., Singh, M., Mandwal, V., Saini, A., Nirbhav, Sahu, N., & Nayak, S. (2022). Evaluation of Observed and Future Climate Change Projection for Uttarakhand, India, Using CORDEX-SA. Atmosphere, 13(947). [CrossRef]
- Sahu, N., Nayan, R., Panda, A., Varun, A., Kesharwani, R., Das, P., Kumar, A., Mallick, S.K., Mishra, M.M., Saini, A., Aggarwal, S.P., Nayak, S. (2025). Impact of Changes in Rainfall and Temperature on Production of Darjeeling Tea in India. Atmosphere, 16(1), 1. [CrossRef]
- Morimoto, J., Aiba, M., Furukawa, F., Mishima, Y., Yoshimura, N., Nayak, S., Takemi, T., Haga, C., Matsui, T., & Nakamura, F. (2021). Risk assessment of forest disturbance by typhoons with heavy precipitation in northern Japan. Forest Ecology and Management, 479, 118521. [CrossRef]
- Nayak, S. (2018). Do extreme precipitation intensities linked to temperature over India follow the Clausius–Clapeyron relationship? Current Science, 115(3), 391-392. [CrossRef]
- Nayak, S., & Dairaku, K. (2016). Future changes in extreme precipitation intensities associated with temperature under SRES A1B scenario. Hydrological Research Letters, 10(4), 139–144. [CrossRef]
- Sayat, A., Lyazzat, M., Elmira, T., Gaukhar, B., & Gulsara, M. (2024). Assessment of the impacts of climate change on drought intensity and frequency using SPI and SPEI in the Southern Pre-Balkash region, Kazakhstan. Watershed Ecology and the Environment. [CrossRef]
- Nayak, S., & Mandal, M. (2019). Assessment of sea level and morphological changes along Indian coastal areas during 1975-2005. Earth Science India, 12(II), 117-125.
- Nayak, S., & Takemi, T. (2019). Dependence of extreme precipitable water events on temperature. Atmósfera, 32(2), 159-165. [CrossRef]
- Chaudhary, M. T., & Piracha, A. (2021). Natural disasters—origins, impacts, management. Encyclopedia, 1(4), 1101-1131. [CrossRef]
- Nayak, S., & Takemi, T. (2020). Clausius-Clapeyron scaling of extremely heavy precipitations: Case studies of the July 2017 and July 2018 heavy rainfall events over Japan. Journal of the Meteorological Society of Japan, 98(6), 1147–1162. [CrossRef]
- Nayak, S., & Takemi, T. (2021). Atmospheric driving mechanisms of extreme precipitation events in July of 2017 and 2018 in western Japan. Dynamics of Atmospheres and Oceans, 93, 101186. [CrossRef]
- Rajkovich, N. B., Brown, C., Azaroff, I., Backus, E., Clarke, S., Enriquez, J.,... & Stevens, A. (2024). New York State Climate Impacts Assessment Chapter 04: Buildings. [CrossRef]
- Nayak, S., Mandal, M., Adhikari, A., & Bhatla, R. (2013). Estimation of Indian coastal areas inundated into the sea due to sea-level rise during the 20th century. Current Science, 104(5), 583-585.
- Nayak, S., Dairaku, K., Takayabu, I., Suzuki-Parker, A., & Ishizaki, N. N. (2018). Extreme precipitation linked to temperature over Japan: current evaluation and projected changes with multi-model ensemble downscaling. Climate Dynamics, 51, 4385–4401. [CrossRef]
- Sahu, R.K., Choudhury, G., Vissa, N.K., Tyagi, B., & Nayak, S. (2022). The Impact of El-Niño and La-Niña on the Pre-Monsoon Convective Systems over Eastern India. Atmosphere, 13(8), 1261.
- Sahu, R.K., Nayak, S., Singh, K.S., Nayak, H.P., & Tyagi, B. (2023). Evaluating the impact of topography on the initiation of Nor’westers over eastern India. Geomatics, Natural Hazards and Risk, 14(1), 2184669. [CrossRef]
- Trošelj, J., Nayak, S., Hobohm, L., & Takemi, T. (2023). Real-time flash flood forecasting approach for development of early warning systems: integrated hydrological and meteorological application. Geomatics, Natural Hazards and Risk, 14(1), 2269295. [CrossRef]
- Nayak, S., & Mandal, M. (2019). Examining the impact of regional land use and land cover changes on temperature: the case of Eastern India. Spatial Information Research, 27, 601-611. [CrossRef]
- Nayak, S., & Mandal, M. (2019). Impact of land use and land cover changes on temperature trends over India. Land Use Policy, 89, 104238. [CrossRef]
- Nayak, S. (2021). Land use and land cover change and their impact on temperature over central India. Letters in Spatial and Resource Sciences, 14(3), 339–356. [CrossRef]
- Nayak, S., & Mandal, M. (2012). Impact of land-use and land-cover changes on temperature trends over Western India. Current Science, 102(8), 1166-1173.
- Nayak, S., Maity, S., Singh, K. S., Nayak, H. P., & Dutta, S. (2021). Influence of the changes in land-use and land cover on temperature over Northern and North-Eastern India. Land, 10(52), 1-14. [CrossRef]
- Nayak, S., Maity, S., Sahu, N., Saini, A., Singh, K. S., Nayak, H. P., & Dutta, S. (2022). Application of "Observation Minus Reanalysis" Method towards LULC Change Impact over Southern India. ISPRS International Journal of Geo-Information, 11(2), 94. [CrossRef]
- Nayak, H.P., Nayak, S., Maity, S., Patra, N., Singh, K.S., & Dutta, S. (2022). Sensitivity of Land Surface Processes and Its Variation during Contrasting Seasons over India. Atmosphere, 13, 1382. [CrossRef]
- Nayak, S., & Behera, M.D. (2008). Land use/land cover classification and mapping of Pilibhit District, Uttar Pradesh, India. Indian Geographical Journal, 83, 15-24.
- Meinander, O., Dagsson-Waldhauserova, P., Amosov, P., Aseyeva, E., Atkins, C., Baklanov, A.,... & Vukovic Vimic, A. (2021). Newly identified climatically and environmentally significant high latitude dust sources. Atmospheric Chemistry and Physics Discussions, 2021, 1-74.
- Nayak, S., & Behera, M. D. (2009). Improving Land Use and Vegetation Cover Classification Accuracy using Fuzzy Logic - A Study in Pilibhit District Uttar Pradesh, India. International Journal of Geoinformatics, 5(2), 1–10.
- Nayak, S., Mandal, M., & Maity, S. (2021). Assessing the impact of Land-use and Land-cover changes on the climate over India using a Regional Climate Model (RegCM4). Climate Research, 85, 1-20. [CrossRef]
- Maity, S., Satyanarayana, A.N.V., Mandal, M., & Nayak, S. (2017). Performance evaluation of land surface models and cumulus convection schemes in the simulation of Indian summer monsoon using a regional climate model. Atmospheric Research, 197, 21–41. [CrossRef]
- Maity, S., Mandal, M., Nayak, S., & Bhatla, R. (2017). Performance of cumulus parameterization schemes in the simulation of Indian Summer Monsoon using RegCM4. Atmósfera, 30(4), 287-309. [CrossRef]
- Nayak, S., & Takemi, T. (2025). Regional and vertical scaling of water vapor with temperature over Japan during extreme precipitation in a changing climate. Scientific Reports, 15(1), 34826. [CrossRef]
- Maity, S., Nayak, S., Singh, K.S., Nayak, H.P., & Dutta, S. (2021). Impact of soil moisture initialization in the simulation of Indian summer monsoon using RegCM4. Atmosphere, 12, 1148. [CrossRef]
- Maity, S., Nayak, S., Nayak, H. P., & Bhatla, R. (2022). Comprehensive assessment of RegCM4 towards interannual variability of Indian summer monsoon using multi-year simulations. Theoretical and Applied Climatology, 147, 129–140. [CrossRef]
- Nayak, S., Mandal, M., & Maity, S. (2017). Customization of regional climate model (RegCM4) over Indian region. Theoretical and Applied Climatology, 127, 153-168. [CrossRef]
- Nayak, S., Mandal, M., & Maity, S. (2018). RegCM4 simulation with AVHRR land use data towards temperature and precipitation climatology over Indian region. Atmospheric Research, 214, 163–173. [CrossRef]
- Nayak, S., Mandal, M., & Maity, S. (2019). Performance evaluation of RegCM4 in simulating temperature and precipitation climatology over India. Theoretical and Applied Climatology, 138(3), 1535–1552. [CrossRef]
- Nayak, S., & Takemi, T. (2019). Dynamical Downscaling of Typhoon Lionrock (2016) for Assessing the Resulting Hazards under Global Warming. Journal of the Meteorological Society of Japan, 97(1), 123–143. [CrossRef]
- Nayak, S., & Takemi, T. (2019). Quantitative estimations of hazards resulting from Typhoon Chanthu (2016) for assessing the impact in current and future climate. Hydrological Research Letters, 13(2), 20-27. [CrossRef]
- Nayak, S., & Takemi, T. (2020). Robust responses of typhoon hazards in northern Japan to global warming climate: cases of landfalling typhoons in 2016. Meteorological Applications, 27, e1954. [CrossRef]
- Nayak, S., & Takemi, T. (2020). Typhoon-induced precipitation characterization over northern Japan: a case study for typhoons in 2016. Progress in Earth and Planetary Science, 7(39). [CrossRef]
- Nayak, S., & Takemi, T. (2023). Statistical analysis of the characteristics of typhoons approaching Japan from 2006 to 2019. Geomatics, Natural Hazards and Risk, 14(1), 2208722. [CrossRef]
- Nayak, S., & Takemi, T. (2023). Structural characteristics of typhoons Jebi (2018), Faxai (2019), and Hagibis (2019). Meteorology and Atmospheric Physics, 135(34). [CrossRef]
- Singh, K. S., Nayak, S., Maity, S., Nayak, H. P., & Dutta, S. (2023). Prediction of extremely severe cyclonic storm “Fani” using moving nested domain. Atmosphere, 14(4), 637. [CrossRef]
- Nayak, S., & Kanda, I. (2023). Examining the effectiveness of Doppler lidar-based observation nudging in WRF simulation for wind field: A case study over Osaka, Japan. Atmosphere, 14(972). [CrossRef]
- Walsh, J. E., Ballinger, T. J., Euskirchen, E. S., Hanna, E., Mård, J., Overland, J. E.,... & Vihma, T. (2020). Extreme weather and climate events in northern areas: A review. Earth-Science Reviews, 209, 103324. [CrossRef]
- Nayak, S. (2024). Temporal Characteristics of Rainfall Events at Very High Timescale. Preprints. [CrossRef]
- Koteshwaramma, T., Singh, K. S., & Nayak, S. (2024). Performance of High-Resolution WRF Modeling System in Simulation of Severe Tropical Cyclones over the Bay of Bengal Using IMDAA Regional Reanalysis Dataset. Preprints. [CrossRef]
- Nayak, S., Trošelj, J., Pattnayak, K. C., & Bharambe, K. P. (2025). Exploring the Underlying Patterns and Relationships Between Temperature and Heavy Rainfall Events over Western Japan. In Computing, Communication and Intelligence (pp. 300-304). CRC Press.
- Mishra, M., Mishra, A., Mangaraj, P., Srivastava, A. K., Beig, G., Sahoo, P.,... & Sahu, S. K. (2025). Quantification and spatial assessment of industrial Cd and Pb emission across India. All Earth, 37(1), 1-13. [CrossRef]
- Singh, K. S., Nayak, S., Maity, S., Nayak, H. P., & Dutta, S. (2022). Prediction of Bay of Bengal Extremely Severe Cyclonic Storm "Fani” Using Moving Nested Domain. Preprints. [CrossRef]
- Nayak, S., & Maity, S. (2021). Evaluating the Performance of Cumulus Convection Parameterization Schemes in Regional Climate Modeling System. Preprints. [CrossRef]
- Nayak, S. (2021). Assessing the Changes of the Landmass Surrounded by the Indian Coast. Preprints. [CrossRef]
- Crisp, D., Dolman, H., Tanhua, T., McKinley, G. A., Hauck, J., Bastos, A.,... & Aich, V. (2022). How well do we understand the land-ocean-atmosphere carbon cycle?. Reviews of Geophysics, 60(2), e2021RG000736.
- Bindajam, A. A., Mallick, J., AlQadhi, S., Singh, C. K., & Hang, H. T. (2020). Impacts of vegetation and topography on land surface temperature variability over the semi-arid mountain cities of Saudi Arabia. Atmosphere, 11(7), 762. [CrossRef]
- Lhotka, O., Trnka, M., Kyselý, J., Markonis, Y., Balek, J., & Možný, M. (2020). Atmospheric circulation as a factor contributing to increasing drought severity in central Europe. Journal of Geophysical Research: Atmospheres, 125(18), e2019JD032269. [CrossRef]
- Nayak, S., & Sahu, N. (2025). Editorial for the Special Issue on Climate Change and Climate Variability, and Their Impact on Extreme Events. Atmosphere, 16(2), 182. [CrossRef]
- Qing, Y., Wang, S., Yang, Z. L., & Gentine, P. (2023). Soil moisture− atmosphere feedbacks have triggered the shifts from drought to pluvial conditions since 1980. Communications Earth & Environment, 4(1), 254. [CrossRef]
- Nayak, S. (2024). Understanding the Interaction Between Land, Atmosphere and Ocean Towards Intensifying the Extreme Weather Events.
- Koteshwaramma, T., Singh, K. S., & Nayak, S. (2025). The Performance of a High-Resolution WRF Modelling System in the Simulation of Severe Tropical Cyclones over the Bay of Bengal Using the IMDAA Regional Reanalysis Dataset. Climate, 13(1), 17. [CrossRef]
- Maity, S., Patil, K., & Nayak, S. (2025). Evaluation of CMIP6 models for future rainfall projections over India: Insights on bias correction and scenario-based variability.
Figure 1.
Time series of air temperature and vapor pressure (left axis) and relative humidity (right axis).
Figure 1.
Time series of air temperature and vapor pressure (left axis) and relative humidity (right axis).
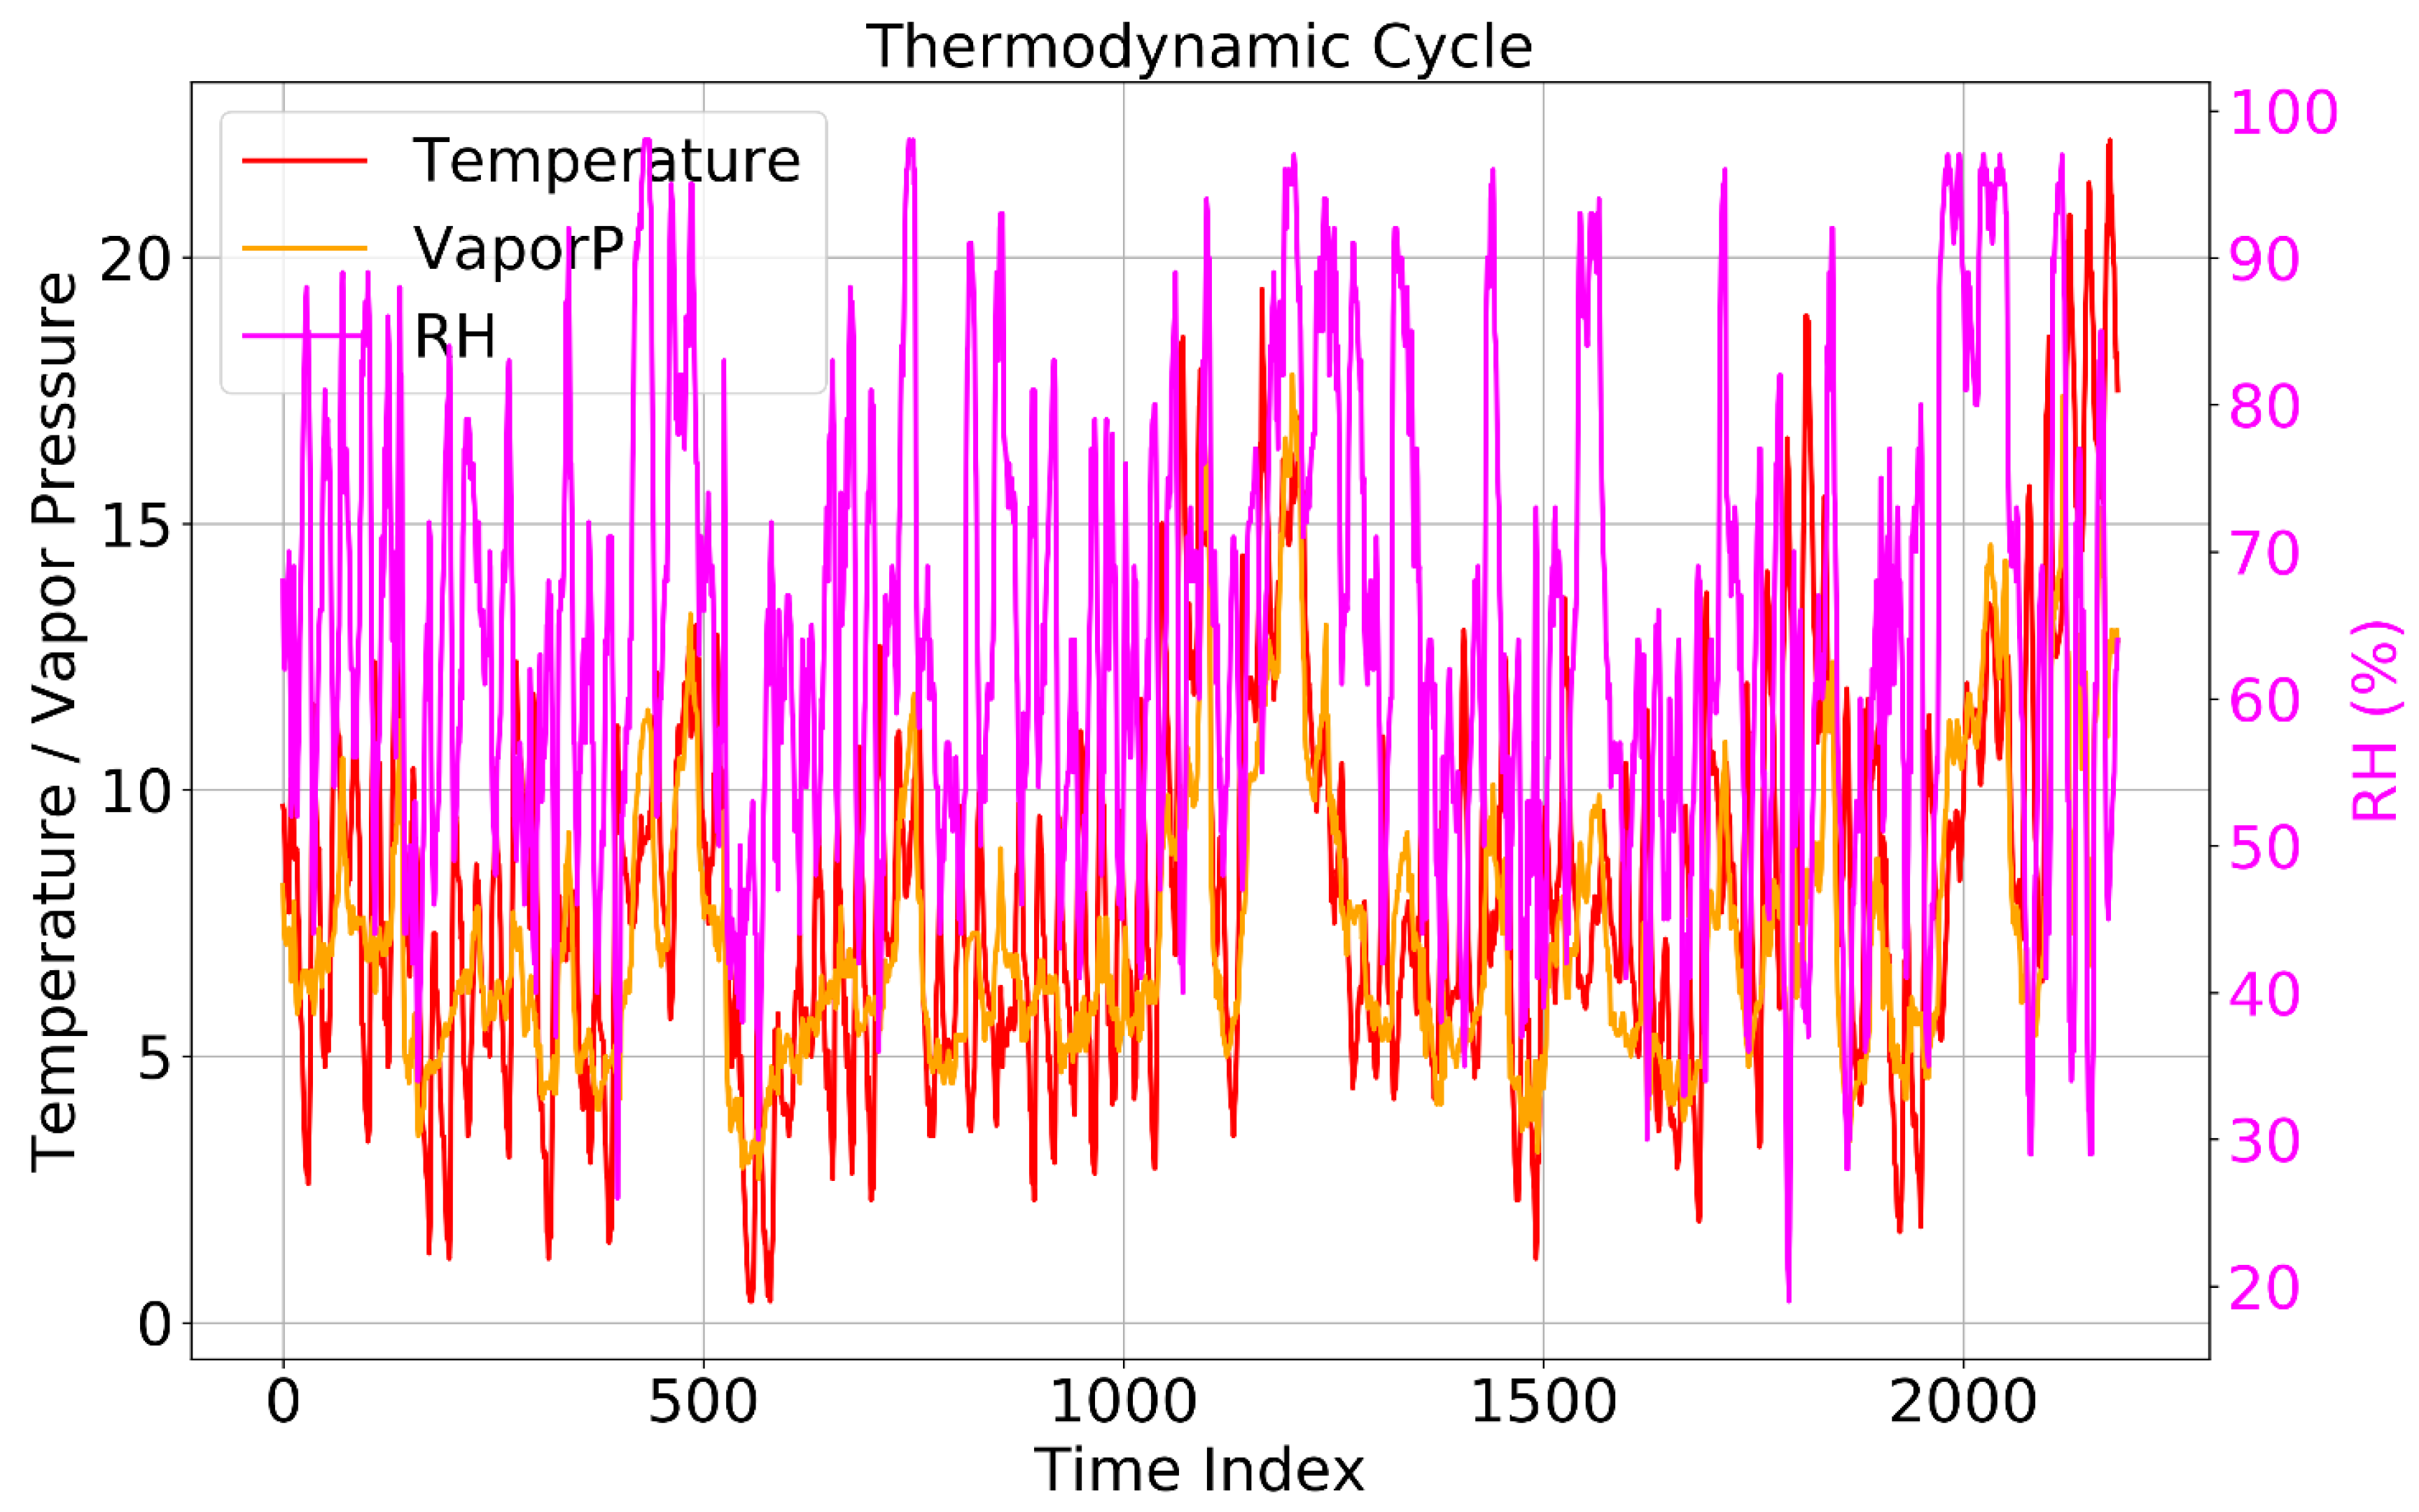
Figure 2.
Wind speed versus surface pressure with sea-level pressure anomaly shading.
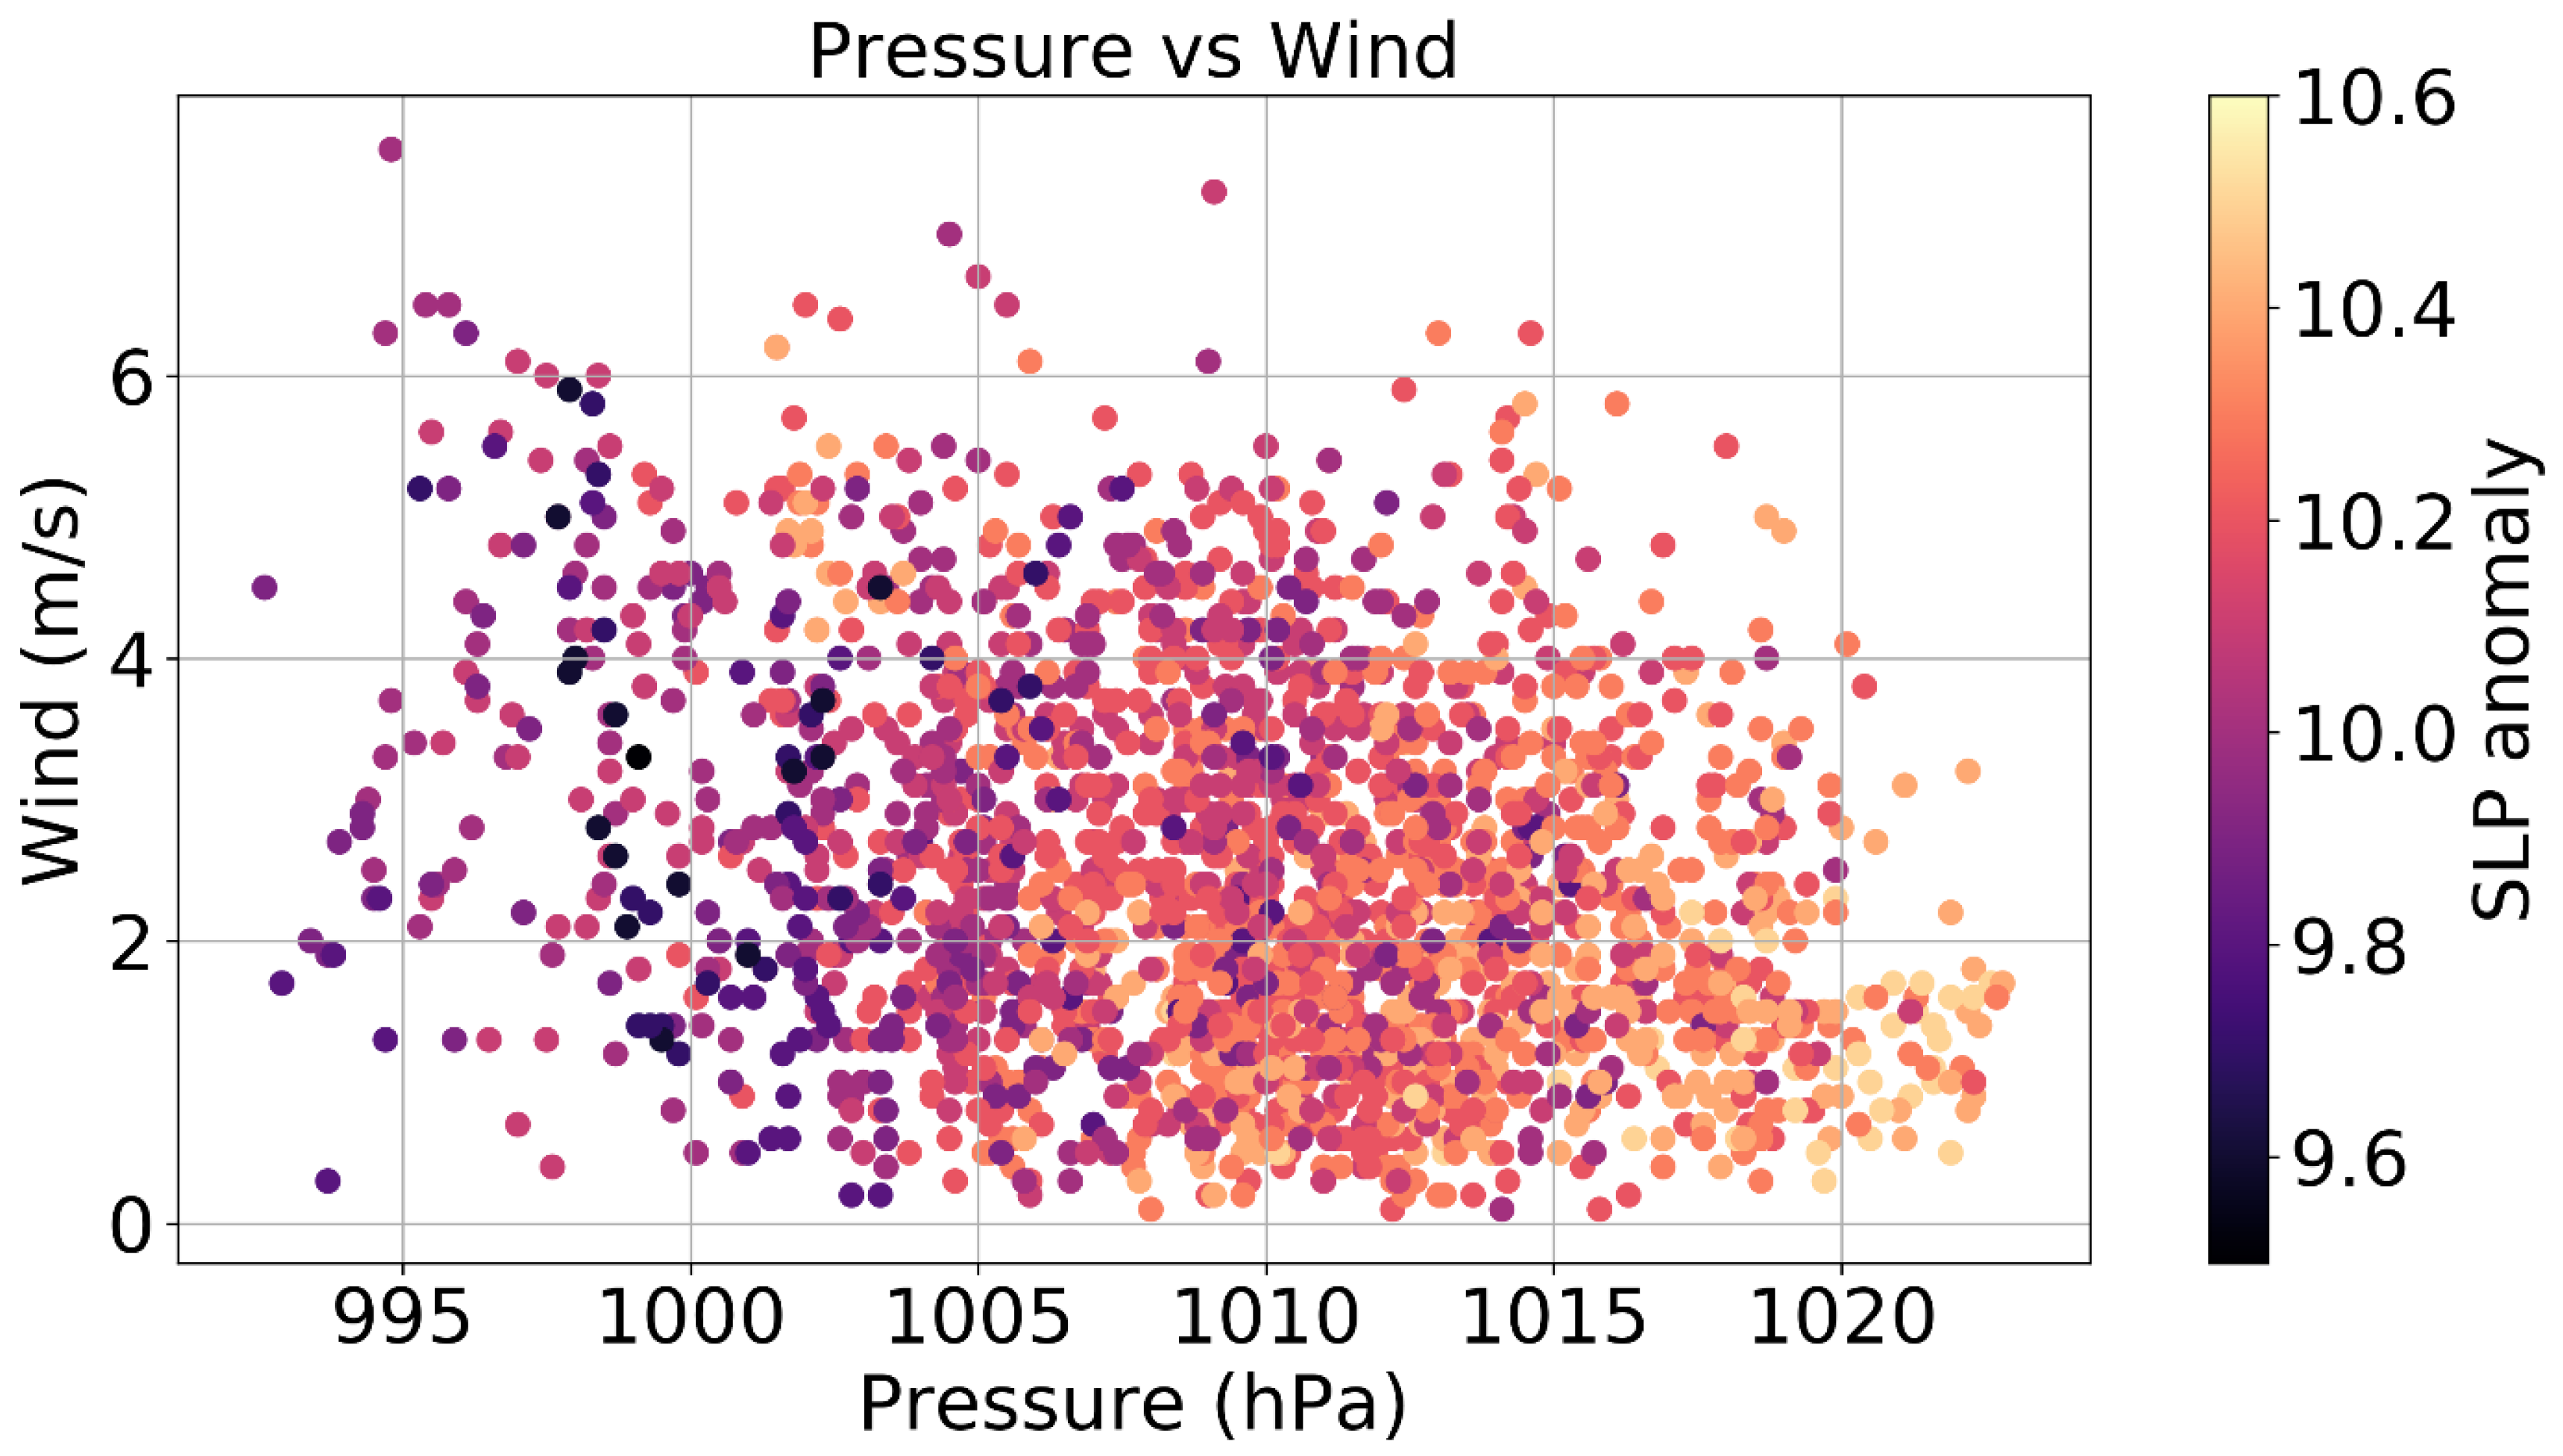
Figure 3.
Relative humidity versus solar radiation, shaded by air temperature.
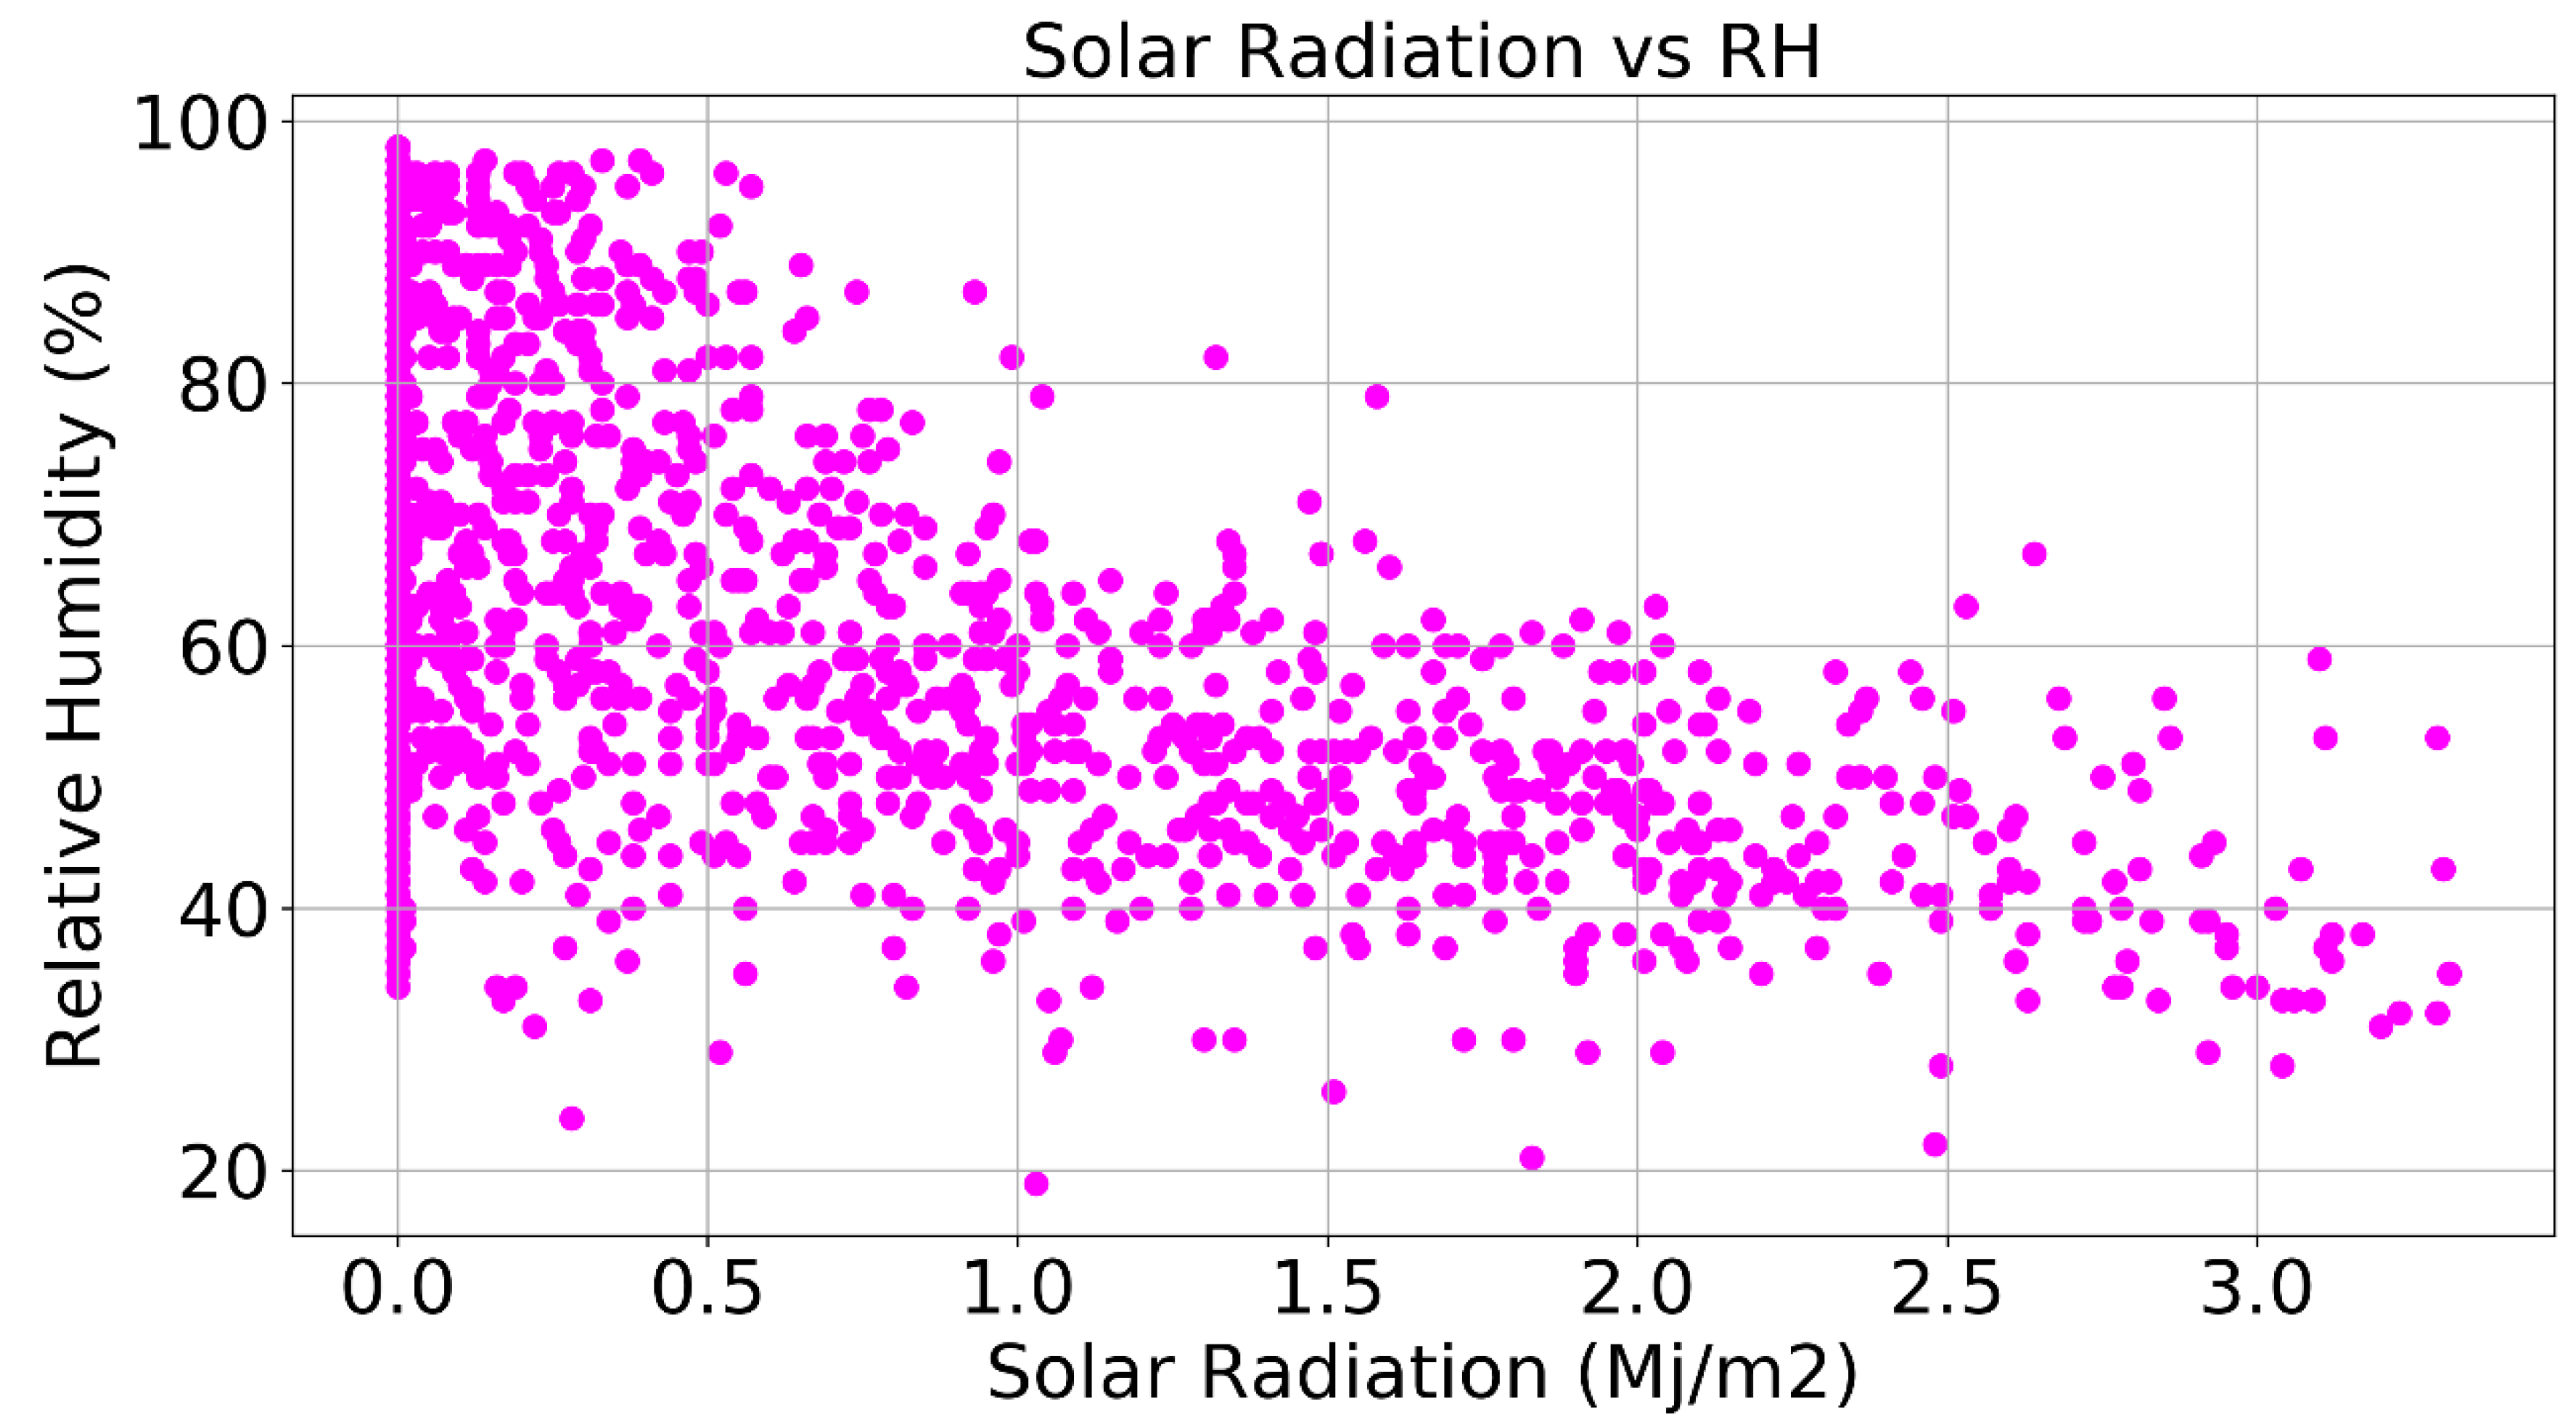
Figure 4.
Correlation for seven atmospheric variables.
Disclaimer/Publisher’s Note: The statements, opinions and data contained in all publications are solely those of the individual author(s) and contributor(s) and not of MDPI and/or the editor(s). MDPI and/or the editor(s) disclaim responsibility for any injury to people or property resulting from any ideas, methods, instructions or products referred to in the content. |
© 2025 by the authors. Licensee MDPI, Basel, Switzerland. This article is an open access article distributed under the terms and conditions of the Creative Commons Attribution (CC BY) license (http://creativecommons.org/licenses/by/4.0/).
Copyright: This open access article is published under a Creative Commons CC BY 4.0 license, which permit the free download, distribution, and reuse, provided that the author and preprint are cited in any reuse.


