
Submitted:
26 December 2024
Posted:
27 December 2024
You are already at the latest version
Abstract
In this study we explore the interaction between land, atmosphere and ocean and understand how they affect the intensity of extreme weather events such as cold waves, storms, floods and heat waves from the important parameters such as temperature, precipitation, wind speed, local pressure, sea level pressure, relative humidity, and dew point temperature. Our results show that when temperature drops (below 0°C), there is an increase in relative humidity and precipitation, which disturbs the cold weather conditions. A positive correlation was found between wind speed and local pressure, indicating stormy conditions. Our overall study has an implication towards the threat of climate change and extreme weather events to develop the strategies to deal with these changes.
Keywords:
extreme events
; land-atmosphere-ocean relationship
; climate change
1. Introduction
It is well documented that the intensity and frequency of extreme weather events are increasing due to global climate change (Zwiers et al., 2013; Nayak, 2018, Tyagi et al., 2022; Clarke et al., 2022; Sahu et al., 2023; Sayat et al., 2024). These events include extreme heat waves, tropical cyclones, snowfall, floods, thunderstorms, tornados, and other types of natural disasters, which have a severe impact on human life, the environment, and economic activities (Chaudhary and Piracha 2021; Rajkovich et al., 2024; Koteshwaramma et al., 2024). In order to understand the impact of these phenomena, many studies so far are conducted to understand their formations and possible causes at local or large scale (Walsh et al., 2020; Meinandar et al., 2021; Nayak et al., 2023). In a study, Script et al., (2022) documented the physical processes and feedback mechanisms between the land, atmosphere, and oceans. Bindhajam et al., (2020) analyzed soil moisture, land surface temperature, and vegetation cover influencing atmospheric conditions. Sahu et al., (2022) documented on how the ocean temperature and currents affect atmospheric circulation patterns (e.g., El Niño, tropical cyclones). Similarly, a number of studies discussed how land use changes (e.g., deforestation) and ocean surface temperatures contribute to weather extremes (Nayak and Mandal, 2012, Sahu et al., 2023).
These studies infers that the interaction between the land, ocean, and atmospheric systems leads to intensified extreme weather events such as heatwaves (influenced by land surface temperatures (Maity et al., 2021, Nayak et al., 2022, 2023)), tropical cyclones (influenced by ocean temperatures and atmospheric pressure (Singh et al., 2023; Nayak and Takemi, 2023), flooding (affected by precipitation, sea level rise, and storm surge (Nayak and Takemi, 2020; Singh et al., 2022), droughts (affected by land moisture and atmospheric circulation (Lhotka et al., 2020; Qing et al., 2023)). However, the interaction between land, atmosphere and ocean towards intensifying such extremes are not well documents, as these three elements are closely related to each other and the interactions between them ultimately result in the intensity and pattern of weather (Dabral et al., 2023; Sahu et al., 2025).
In this study, we explore the interaction between land, atmosphere and ocean and understand how they affect the intensity of extreme weather events such as cold waves, storms, floods and heat waves from the important parameters such as temperature, precipitation, wind speed, local pressure, sea level pressure, relative humidity, and dew point temperature (Nayak et al., 2021).
2. Methodology
In this study, we analyze various climatic parameters from Radar-Automated Meteorological Data Acquisition System (Radar-AMeDAS) data to understand the interrelationship of land, atmosphere and ocean, which intensify the extreme weather events. The analysis is based on three months of climate data from January to March. All the available climatic variables are considered in this study which includes temperature, precipitation, wind speed, solar radiation, local pressure, sea level pressure, relative humidity, vapor pressure, dew point temperature, cloud cover and visibility (https://www.jma.go.jp/jma/index.html) We analyze various relationships between the variables to understand their interaction and impact on extremes. As the present data deal with winter time, so we focus on cold waves that is, how any relationship can combine to produce cold waves, and how other relationship to make it stormy.
3. Results
In this section, we explore the interrelationship between the major weather variables with a focus with multiple variables on different scales simultaneously to understand the complex interactions that drive extreme weather events like cyclones, heatwaves, and floods.
3.1. Temperature over Time with Extreme Cold Temperature Threshold
Figure 1 shows the temperature over time with a focus on identifying periods of extreme cold. It shows that few extreme cold events (the dotted line marks 0°C cold threshold) exists and after a few hours of time the relative humidity increases. This causes frost formation and develops cold-related phenomena, indicating times when the temperature drops to extreme cold levels could lead to frost or cold waves.
3.2. Wind Speed Versus Local Pressure
Figure 2 depicts the wind speed and local pressure over time. It shows the potential relationships between the wind and pressure that are linked to cyclonic or storm activities. We find that wind speed tends to increase when local pressure drops, indicating a good correlation between the pressure variations with wind intensification. Many several studies (Nayak et al., 2018, Saini et al., 2020; 2023) have identified this characteristic during storm days.
3.3. Precipitation Versus Relative Humidity
The relationship between precipitation and relative humidity are shown in Figure 3. We find that the amount of precipitation is higher when the humidity is higher. This condition favors to cause heavy precipitation and potential flooding (Sahu et al., 2020; Trošelj et al., 2023; Nayak, 2024). The precipitation patterns together with relative humidity clearly indicates the important for assessing the likelihood of floods, particularly in areas with high humidity and precipitation events (Nayak et al., 2025).
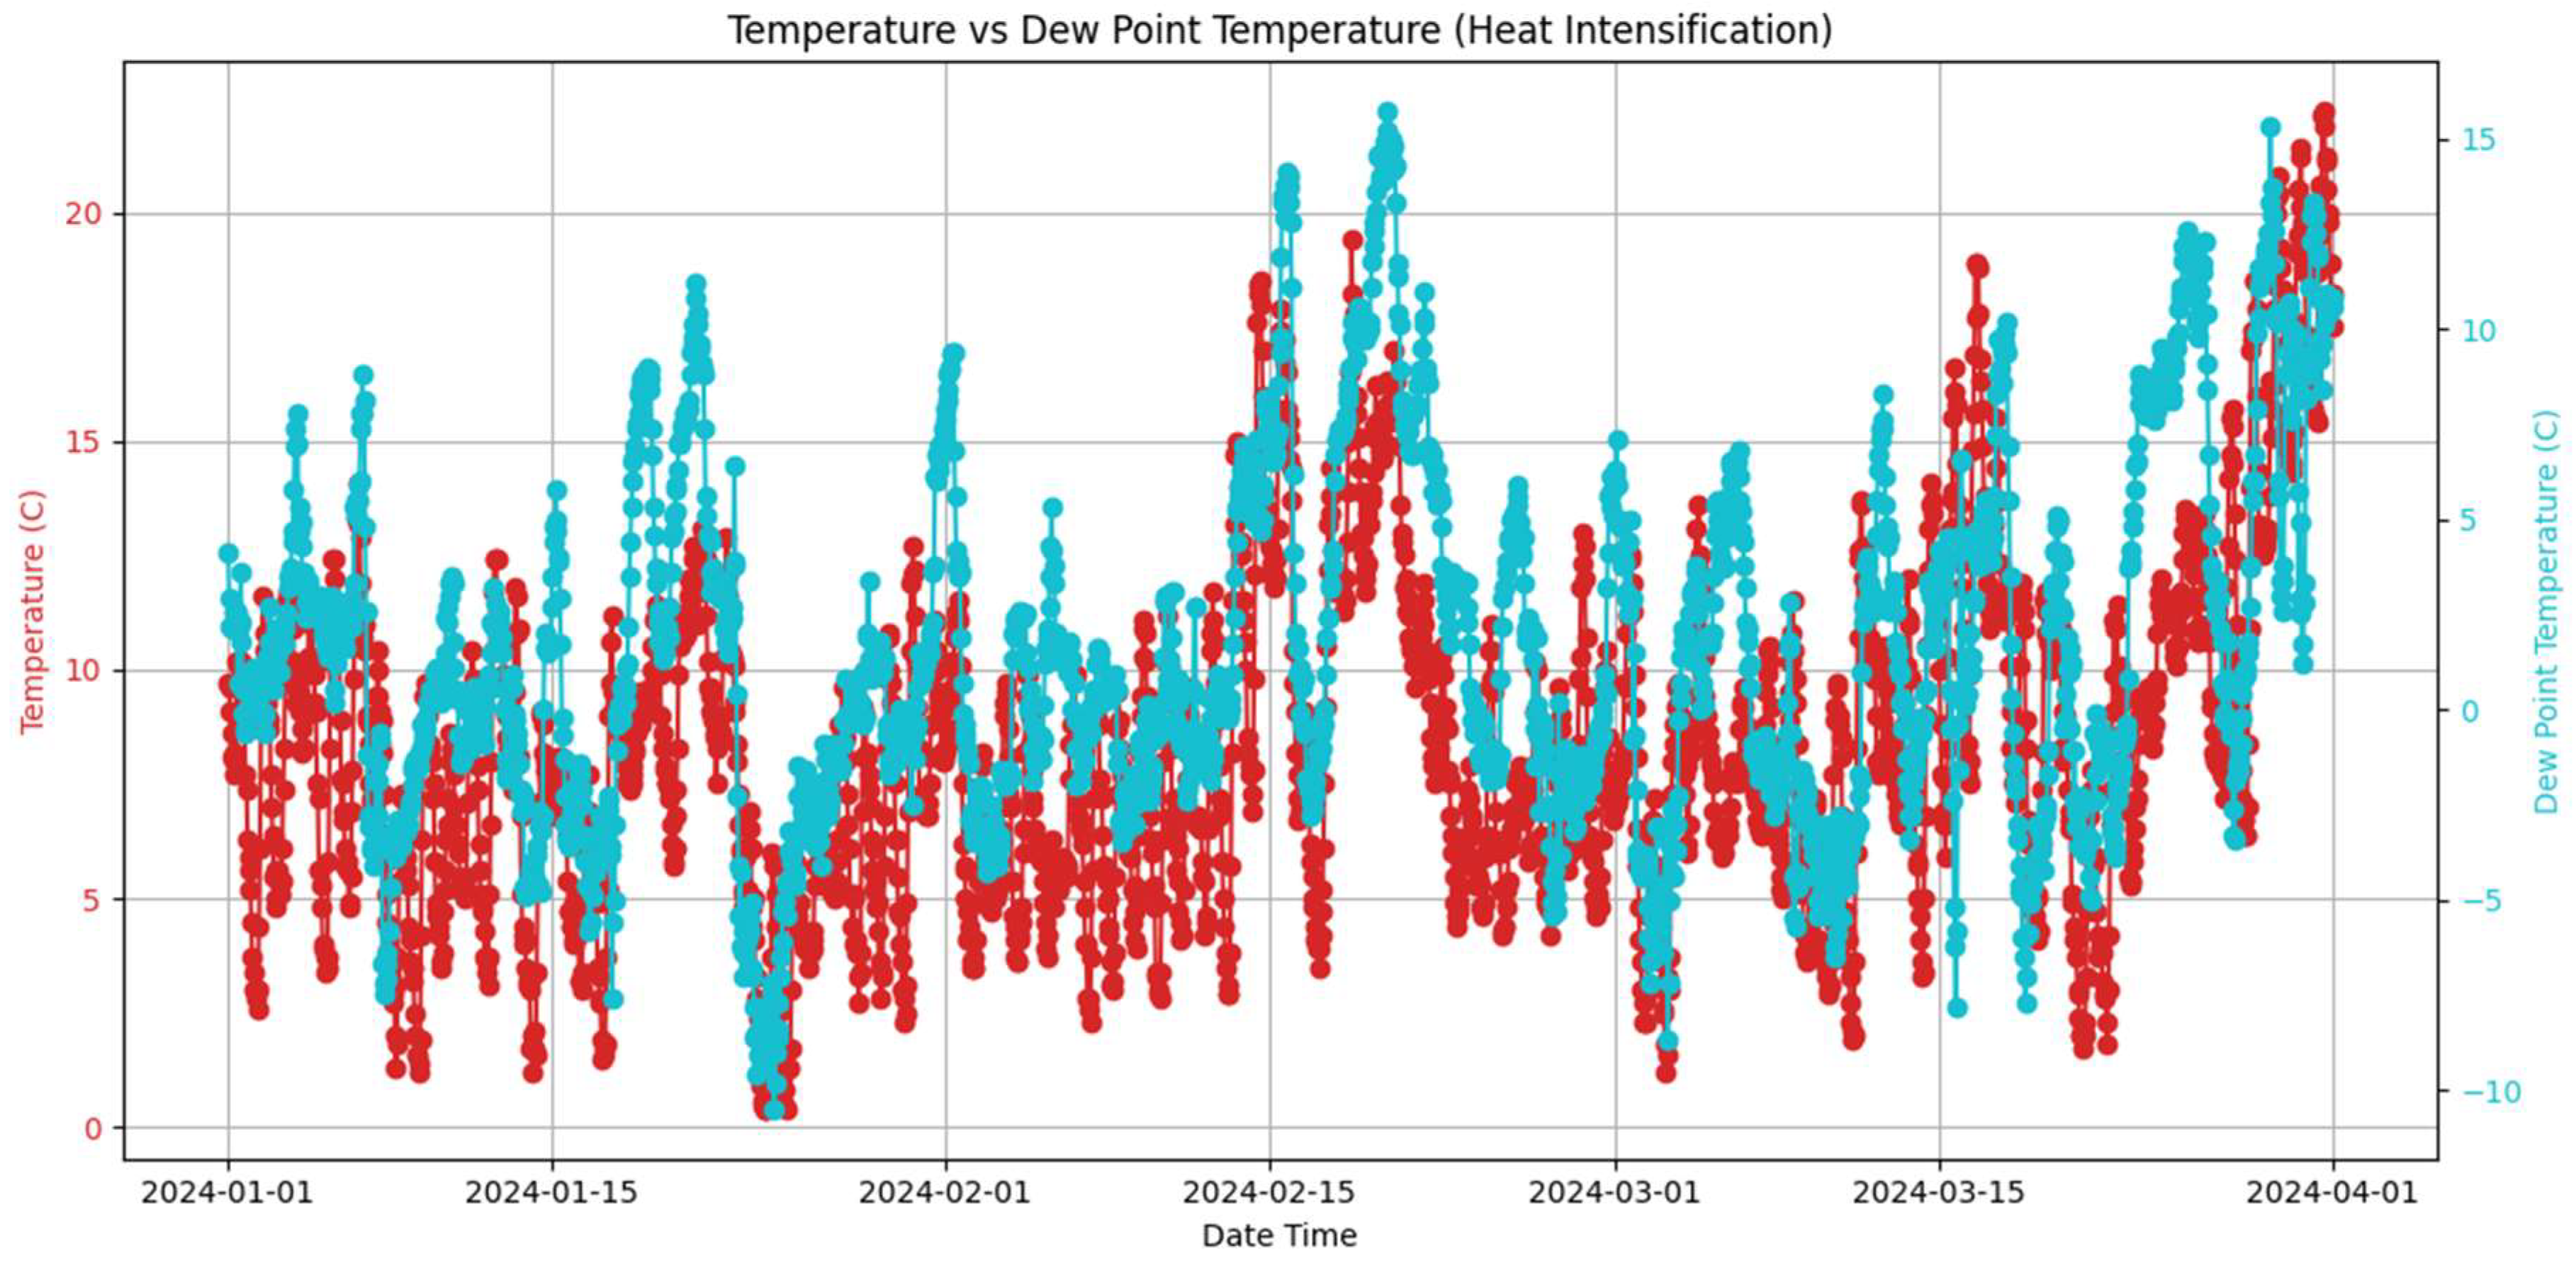
3.4. Temperature Versus Dew Point Temperature
To understand the heat intensification, we analysis the relationship between temperature and dew point temperature over time. It is shown in Figure 4. We find that the temperature at which air becomes saturated with moisture, causes humid conditions, especially when it shows a high value. Numerous studies show this effect through Clausius-Clapeyron analysis (Nayak and Dairaku, 2016; Nayak et al., 2018, 2020). In our results, high temperatures and dew point temperatures together contribute to the feeling of extreme events, indicating a discomfort and health risk situations (Saha et al., 2014).
4. Discussion
The study analyses the interrelationships between land, atmosphere and ocean to understand how interactions between these elements affect the intensity of extreme weather events. The study analysed important parameters such as temperature, precipitation, wind speed, pressure, relative humidity and dew point, and its results have helped us understand the deeper relationship between different weather phenomena. We found that when the temperature falls excessively (below 0°C), the relative humidity increases (Figure 1). This is especially important for events such as cold waves and snowfall. Due to the high humidity, cold conditions can become more intense, leading to increased cases of snowfall or heavy dew. A positive correlation was found between wind speed and local pressure, indicating that areas with high wind speed and low pressure could cause storm surge (Figure 2). During tropical cyclones, this favorable relationship in wind speed and pressure indicates the development of stormy conditions (Nayak and Takemi, 2020, 2021; Morimoto et al., 2021; Nayak and Kanda, 2023). The relationship between temperature and dew point temperature showed that when both the temperature and dew point are high, extreme heat conditions arise (Figure 3). A positive correlation was observed between precipitation and relative humidity (Figure 4), which could increase the risk of heavy precipitation and flooding.
The study suggests that the relationship between these weather variables may change due to climate change (Nayak 2023). Rising temperatures, greater humidity, and sea level changes due to climate change can increase the intensity of events such as tropical cyclones, heat waves, and floods (Nayak et al., 2013; Nayak and Mandal, 2019; Nayak, 2021). The interactions between anthropogenic and natural components, such as human activities, industrialization, and land-use change (Nayak and Behera, 2008, 2009; Nayak et al., 2019, 2021) can impact the intensity of these weather events.
5. Conclusions
This study highlights the interaction between land, atmosphere and ocean and understand how they affect the intensity of extreme weather events. We find that when temperature drops (below 0°C), there is an increase in relative humidity and precipitation, which disturbs the cold weather conditions. The relationship between temperature and dew point temperature showed that when both the temperature and dew point are high, extreme heat conditions arise. A positive correlation was found between wind speed and local pressure, indicating stormy conditions. It provides the basis for dealing with the growing impacts of climate change and the consequences of these events. This study can be expanded with data over a longer period of time to understand the changes between weather events and better understand the impacts of climate change (Nayak and Takemi, 2022, 2024). The results of the study can be used in climate modelling (Nayak et al., 2017, 2018, 2019; Nayak 2021; Maity et al., 2017, 2022) so that we can forecast and risk analysis of extreme weather events. This study may include the impact of human activities such as industrialization, agriculture, and urbanization.
References
- Dabral, A.; Shankhwar, R.; Martins-Ferreira, M.A.C.; Pandey, S.; Kant, R.; Meena, R.K.; Chandra, G.; Ginwal, H.S.; Thakur, P.K.; Bhandari, M.S.; Sahu, N.; Nayak, S. Phenotypic, geological, and climatic spatio-temporal analyses of an exotic Grevillea robusta in the Northwestern Himalayas. Sustainability 2023, 15, 12292. [Google Scholar] [CrossRef]
- Nayak, S. Exploring the future rainfall characteristics over India from large ensemble global warming experiments. Climate 2023, 11, 94. [Google Scholar] [CrossRef]
- Zwiers, F.W.; Alexander, L.V.; Hegerl, G.C.; Knutson, T.R.; Kossin, J.P.; Naveau, P.; Zhang, X. Climate extremes: challenges in estimating and understanding recent changes in the frequency and intensity of extreme climate and weather events. Clim. Sci. Serv. Soc. Res. Model. Predict. Priorities 2013, 339–389. [Google Scholar]
- Nayak, S.; Takemi, T. Assessing the impact of climate change on temperature and precipitation over India. In Wadi Flash Floods, Natural Disaster Science and Mitigation Engineering: DPRI Reports; Sumi, T., Ed.; Springer: Berlin/Heidelberg, Germany, 2022; pp. 121–142. [Google Scholar] [CrossRef]
- Nayak, S.; Takemi, T. Climate change scenario over Japan: trends and impacts. In The Role of Tropics in Climate Change; Khare, Ed.; Elsevier Inc.: Amsterdam, The Netherlands, 2024; pp. 145–169. [Google Scholar]
- Clarke, B.; Otto, F.; Stuart-Smith, R.; Harrington, L. Extreme weather impacts of climate change: an attribution perspective. Environ. Res. Clim. 2022, 1, 012001. [Google Scholar] [CrossRef]
- Nayak, S.; Takemi, T.; Maity, S. Precipitation and temperature climatologies over India: A study with AGCM large ensemble climate simulations. Atmosphere 2022, 13, 671. [Google Scholar] [CrossRef]
- Saha, S.; Nayak, S.; Bhattacharyya, I.; Saha, S.; Mandal, A.K.; Chakraborty, S.; Bhattacharyya, R.; Chakraborty, R.; Franco, O.L.; Mandal, S.M.; Basak, A. Understanding the patterns of antibiotic susceptibility of bacteria causing urinary tract infection in West Bengal, India. Front. Microbiol. 2014, 5, 463. [Google Scholar] [CrossRef]
- Sahu, N.; Panda, A.; Nayak, S.; Saini, A.; Mishra, M.; Sayama, T.; Sahu, L.; Duan, W.; Avtar, R.; Behera, S. Impact of Indo-Pacific Climate Variability on High Streamflow Events in Mahanadi River Basin, India. Water 2020, 12, 1952. [Google Scholar] [CrossRef]
- Sahu, N.; Saini, A.; Behera, S.; Sayama, T.; Nayak, S.; Sahu, L.; Duan, W.; Avtar, R.; Yamada, M.; Singh, R.B.; Takara, K. Impact of Indo-Pacific Climate Variability on Rice Productivity in Bihar, India. Sustainability 2020, 12, 7023. [Google Scholar] [CrossRef]
- Saini, A.; Sahu, N.; Kumar, P.; Nayak, S.; Duan, W.; Avtar, R.; Behera, S. Advanced Rainfall Trend Analysis of 117 Years over West Coast Plain and Hill Agro-Climatic Region of India. Atmosphere 2020, 11, 1225. [Google Scholar] [CrossRef]
- Saini, A.; Sahu, N.; Nayak, S. Determination of Grid-Wise Monsoon Onset and Its Spatial Analysis for India (1901–2019). Atmosphere 2023, 14, 1424. [Google Scholar] [CrossRef]
- Tyagi, N.; Jayal, T.; Singh, M.; Mandwal, V.; Saini, A.; Nirbhav, Sahu, N. ; Nayak, S. Evaluation of Observed and Future Climate Change Projection for Uttarakhand, India, Using CORDEX-SA. Atmosphere 2022, 13, 0947. [Google Scholar] [CrossRef]
- Sahu, N.; Nayan, R.; Panda, A.; Varun, A.; Kesharwani, R.; Das, P.; Kumar, A.; Mallick, S.K.; Mishra, M.M.; Saini, A.; Aggarwal, S.P.; Nayak, S. Impact of Changes in Rainfall and Temperature on Production of Darjeeling Tea in India. Atmosphere 2025, 16, 1. [Google Scholar] [CrossRef]
- Morimoto, J.; Aiba, M.; Furukawa, F.; Mishima, Y.; Yoshimura, N.; Nayak, S.; Takemi, T.; Haga, C.; Matsui, T.; Nakamura, F. Risk assessment of forest disturbance by typhoons with heavy precipitation in northern Japan. For. Ecol. Manag. 2021, 479, 118521. [Google Scholar] [CrossRef]
- Nayak, S. Do extreme precipitation intensities linked to temperature over India follow the Clausius–Clapeyron relationship? Curr. Sci. 2018, 115, 391–392. [Google Scholar] [CrossRef]
- Nayak, S.; Dairaku, K. Future changes in extreme precipitation intensities associated with temperature under SRES A1B scenario. Hydrol. Res. Lett. 2016, 10, 139–144. [Google Scholar] [CrossRef]
- Sayat, A.; Lyazzat, M.; Elmira, T.; Gaukhar, B.; Gulsara, M. Assessment of the impacts of climate change on drought intensity and frequency using SPI and SPEI in the Southern Pre-Balkash region, Kazakhstan. Watershed Ecol. Environ. 2024. [Google Scholar] [CrossRef]
- Nayak, S.; Mandal, M. Assessment of sea level and morphological changes along Indian coastal areas during 1975–2005. Earth Sci. India 2019, 12, 117–125. [Google Scholar]
- Nayak, S.; Takemi, T. Dependence of extreme precipitable water events on temperature. Atmósfera 2019, 32, 159–165. [Google Scholar] [CrossRef]
- Chaudhary, M.T.; Piracha, A. Natural disasters—origins, impacts, management. Encyclopedia 2021, 1, 1101–1131. [Google Scholar] [CrossRef]
- Nayak, S.; Takemi, T. Clausius-Clapeyron scaling of extremely heavy precipitations: Case studies of the July 2017 and July 2018 heavy rainfall events over Japan. J. Meteorol. Soc. Jpn. 2020, 98, 1147–1162. [Google Scholar] [CrossRef]
- Nayak, S.; Takemi, T. Atmospheric driving mechanisms of extreme precipitation events in July of 2017 and 2018 in western Japan. Dyn. Atmos. Ocean. 2021, 93, 101186. [Google Scholar] [CrossRef]
- Rajkovich, N.B.; Brown, C.; Azaroff, I.; Backus, E.; Clarke, S.; Enriquez, J.; Stevens, A. New York State Climate Impacts Assessment Chapter 04: Buildings.
- Nayak, S.; Mandal, M.; Adhikari, A. Estimation of Indian coastal areas inundated into the sea due to sea-level rise during the 20th century. Curr. Sci. 2024, 104, 583–585. [Google Scholar]
- Nayak, S.; Dairaku, K.; Takayabu, I.; Suzuki-Parker, A.; Ishizaki, N.N. Extreme precipitation linked to temperature over Japan: current evaluation and projected changes with multi-model ensemble downscaling. Clim. Dyn. 2018, 51, 4385–4401. [Google Scholar] [CrossRef]
- Sahu, R.K.; Choudhury, G.; Vissa, N.K.; Tyagi, B.; Nayak, S. The Impact of El-Niño and La-Niña on the Pre-Monsoon Convective Systems over Eastern India. Atmosphere 2022, 13, 1261. [Google Scholar] [CrossRef]
- Sahu, R.K.; Nayak, S.; Singh, K.S.; Nayak, H.P.; Tyagi, B. Evaluating the impact of topography on the initiation of Nor’westers over eastern India. Geomat. Nat. Hazards Risk 2023, 14, 2184669. [Google Scholar] [CrossRef]
- Trošelj, J.; Nayak, S.; Hobohm, L.; Takemi, T. Real-time flash flood forecasting approach for development of early warning systems: integrated hydrological and meteorological application. Geomat. Nat. Hazards Risk 2023, 14, 2269295. [Google Scholar] [CrossRef]
- Nayak, S.; Mandal, M. Examining the impact of regional land use and land cover changes on temperature: the case of Eastern India. Spat. Inf. Res. 2019, 27, 601–611. [Google Scholar] [CrossRef]
- Nayak, S.; Mandal, M. Impact of land use and land cover changes on temperature trends over India. Land Use Policy 2019, 89, 104238. [Google Scholar] [CrossRef]
- Nayak, S. Land use and land cover change and their impact on temperature over central India. Lett. Spat. Resour. Sci. 2021, 14, 339–356. [Google Scholar] [CrossRef]
- Nayak, S.; Mandal, M. Impact of land-use and land-cover changes on temperature trends over Western India. Curr. Sci. 2012, 102, 1166–1173. [Google Scholar]
- Nayak, S.; Maity, S.; Singh, K.S.; Nayak, H.P.; Dutta, S. Influence of the changes in land-use and land cover on temperature over Northern and North-Eastern India. Land 2021, 10, 1–14. [Google Scholar] [CrossRef]
- Nayak, S.; Maity, S.; Sahu, N.; Saini, A.; Singh, K.S.; Nayak, H.P.; Dutta, S. Application of “Observation Minus Reanalysis” Method towards LULC Change Impact over Southern India. ISPRS Int. J. Geo-Inf. 2022, 11, 94. [Google Scholar] [CrossRef]
- Nayak, H.P.; Nayak, S.; Maity, S.; Patra, N.; Singh, K.S.; Dutta, S. Sensitivity of Land Surface Processes and Its Variation during Contrasting Seasons over India. Atmosphere 2022, 13, 1382. [Google Scholar] [CrossRef]
- Nayak, S.; Behera, M.D. Land use/land cover classification and mapping of Pilibhit District, Uttar Pradesh, India. Indian Geogr. J. 2008, 83, 15–24. [Google Scholar]
- Meinander, O.; Dagsson-Waldhauserova, P.; Amosov, P.; Aseyeva, E.; Atkins, C.; Baklanov, A.; Vukovic Vimic, A. Newly identified climatically and environmentally significant high latitude dust sources. Atmos. Chem. Phys. Discuss. 2021, 2021, 1–74. [Google Scholar] [CrossRef]
- Nayak, S.; Behera, M.D. Improving Land Use and Vegetation Cover Classification Accuracy using Fuzzy Logic - A Study in Pilibhit District Uttar Pradesh, India. Int. J. Geoinformatics 2009, 5, 1–10. [Google Scholar]
- Nayak, S.; Mandal, M.; Maity, S. Assessing the impact of Land-use and Land-cover changes on the climate over India using a Regional Climate Model (RegCM4). Clim. Res. 2021, 85, 1–20. [Google Scholar] [CrossRef]
- Maity, S.; Satyanarayana, A.N.V.; Mandal, M.; Nayak, S. Performance evaluation of land surface models and cumulus convection schemes in the simulation of Indian summer monsoon using a regional climate model. Atmos. Res. 2017, 197, 21–41. [Google Scholar] [CrossRef]
- Maity, S.; Mandal, M.; Nayak, S.; Bhatla, R. Performance of cumulus parameterization schemes in the simulation of Indian Summer Monsoon using RegCM4. Atmósfera 2017, 30, 287–309. [Google Scholar] [CrossRef]
- Maity, S.; Nayak, S.; Singh, K.S.; Nayak, H.P.; Dutta, S. Impact of soil moisture initialization in the simulation of Indian summer monsoon using RegCM4. Atmosphere 2021, 12, 1148. [Google Scholar] [CrossRef]
- Maity, S.; Nayak, S.; Nayak, H.P.; Bhatla, R. Comprehensive assessment of RegCM4 towards interannual variability of Indian summer monsoon using multi-year simulations. Theor. Appl. Climatol. 2022, 147, 129–140. [Google Scholar] [CrossRef]
- Nayak, S.; Mandal, M.; Maity, S. Customization of regional climate model (RegCM4) over Indian region. Theor. Appl. Climatol. 2017, 127, 153–168. [Google Scholar] [CrossRef]
- Nayak, S.; Mandal, M.; Maity, S. RegCM4 simulation with AVHRR land use data towards temperature and precipitation climatology over Indian region. Atmos. Res. 2018, 214, 163–173. [Google Scholar] [CrossRef]
- Nayak, S.; Mandal, M.; Maity, S. Performance evaluation of RegCM4 in simulating temperature and precipitation climatology over India. Theor. Appl. Climatol. 2019, 138, 1535–1552. [Google Scholar] [CrossRef]
- Nayak, S.; Takemi, T. Dynamical Downscaling of Typhoon Lionrock (2016) for Assessing the Resulting Hazards under Global Warming. J. Meteorol. Soc. Jpn. 2019, 97, 123–143. [Google Scholar] [CrossRef]
- Nayak, S.; Takemi, T. Quantitative estimations of hazards resulting from Typhoon Chanthu (2016) for assessing the impact in current and future climate. Hydrol. Res. Lett. 2019, 13, 20–27. [Google Scholar] [CrossRef]
- Nayak, S.; Takemi, T. Robust responses of typhoon hazards in northern Japan to global warming climate: cases of landfalling typhoons in 2016. Meteorol. Appl. 2020, 27, e1954. [Google Scholar] [CrossRef]
- Nayak, S.; Takemi, T. Typhoon-induced precipitation characterization over northern Japan: a case study for typhoons in 2016. Prog. Earth Planet. Sci. 2020, 7. [Google Scholar] [CrossRef]
- Nayak, S.; Takemi, T. Statistical analysis of the characteristics of typhoons approaching Japan from 2006 to 2019. Geomat. Nat. Hazards Risk 2023, 14, 2208722. [Google Scholar] [CrossRef]
- Nayak, S.; Takemi, T. Structural characteristics of typhoons Jebi (2018), Faxai (2019), and Hagibis (2019). Meteorol. Atmos. Phys. 2023, 135. [Google Scholar] [CrossRef]
- Singh, K.S.; Nayak, S.; Maity, S.; Nayak, H.P.; Dutta, S. Prediction of extremely severe cyclonic storm “Fani” using moving nested domain. Atmosphere 2023, 14, 637. [Google Scholar] [CrossRef]
- Nayak, S.; Kanda, I. Examining the effectiveness of Doppler lidar-based observation nudging in WRF simulation for wind field: A case study over Osaka, Japan. Atmosphere 2023, 14, 972. [Google Scholar] [CrossRef]
- Walsh, J.E.; Ballinger, T.J.; Euskirchen, E.S.; Hanna, E.; Mård, J.; Overland, J.E.; Vihma, T. Extreme weather and climate events in northern areas: A review. Earth-Sci. Rev. 2020, 209, 103324. [Google Scholar] [CrossRef]
- Nayak, S. Temporal Characteristics of Rainfall Events at Very High Timescale. Preprints 2024. [Google Scholar] [CrossRef]
- Koteshwaramma, T.; Singh, K.S.; Nayak, S. Performance of High-Resolution WRF Modeling System in Simulation of Severe Tropical Cyclones over the Bay of Bengal Using IMDAA Regional Reanalysis Dataset. Preprints 2024. [Google Scholar] [CrossRef]
- Nayak, S.; Trošelj, J.; Pattnayak, K.C.; Bharambe, K.P. Exploring the Underlying Patterns and Relationships Between Temperature and Heavy Rainfall Events over Western Japan. In Computing, Communication and Intelligence; CRC Press: Boca Raton, FL, USA, 2025; pp. 300–304. [Google Scholar]
- Singh, K.S.; Nayak, S.; Maity, S.; Nayak, H.P.; Dutta, S. Prediction of Bay of Bengal Extremely Severe Cyclonic Storm “Fani” Using Moving Nested Domain. Preprints 2022. [Google Scholar] [CrossRef]
- Nayak, S.; Maity, S. Evaluating the Performance of Cumulus Convection Parameterization Schemes in Regional Climate Modeling System. Preprints 2021. [Google Scholar] [CrossRef]
- Nayak, S. Assessing the Changes of the Landmass Surrounded by the Indian Coast. Preprints 2021. [Google Scholar] [CrossRef]
- Crisp, D.; Dolman, H.; Tanhua, T.; McKinley, G.A.; Hauck, J.; Bastos, A.; Aich, V. How well do we understand the land-ocean-atmosphere carbon cycle? Rev. Geophys. 2022, 60, e2021RG000736. [Google Scholar] [CrossRef]
- Bindajam, A.A.; Mallick, J.; AlQadhi, S.; Singh, C.K.; Hang, H.T. Impacts of vegetation and topography on land surface temperature variability over the semi-arid mountain cities of Saudi Arabia. Atmosphere 2020, 11, 762. [Google Scholar] [CrossRef]
- Lhotka, O.; Trnka, M.; Kyselý, J.; Markonis, Y.; Balek, J.; Možný, M. Atmospheric circulation as a factor contributing to increasing drought severity in central Europe. J. Geophys. Res. Atmos. 2020, 125, e2019JD032269. [Google Scholar] [CrossRef]
- Qing, Y.; Wang, S.; Yang, Z.L.; Gentine, P. Soil moisture—Atmosphere feedbacks have triggered the shifts from drought to pluvial conditions since 1980. Commun. Earth Environ. 2023, 4, 254. [Google Scholar] [CrossRef]
Figure 1.
Temperature over time with a focus on identifying periods of extreme cold.
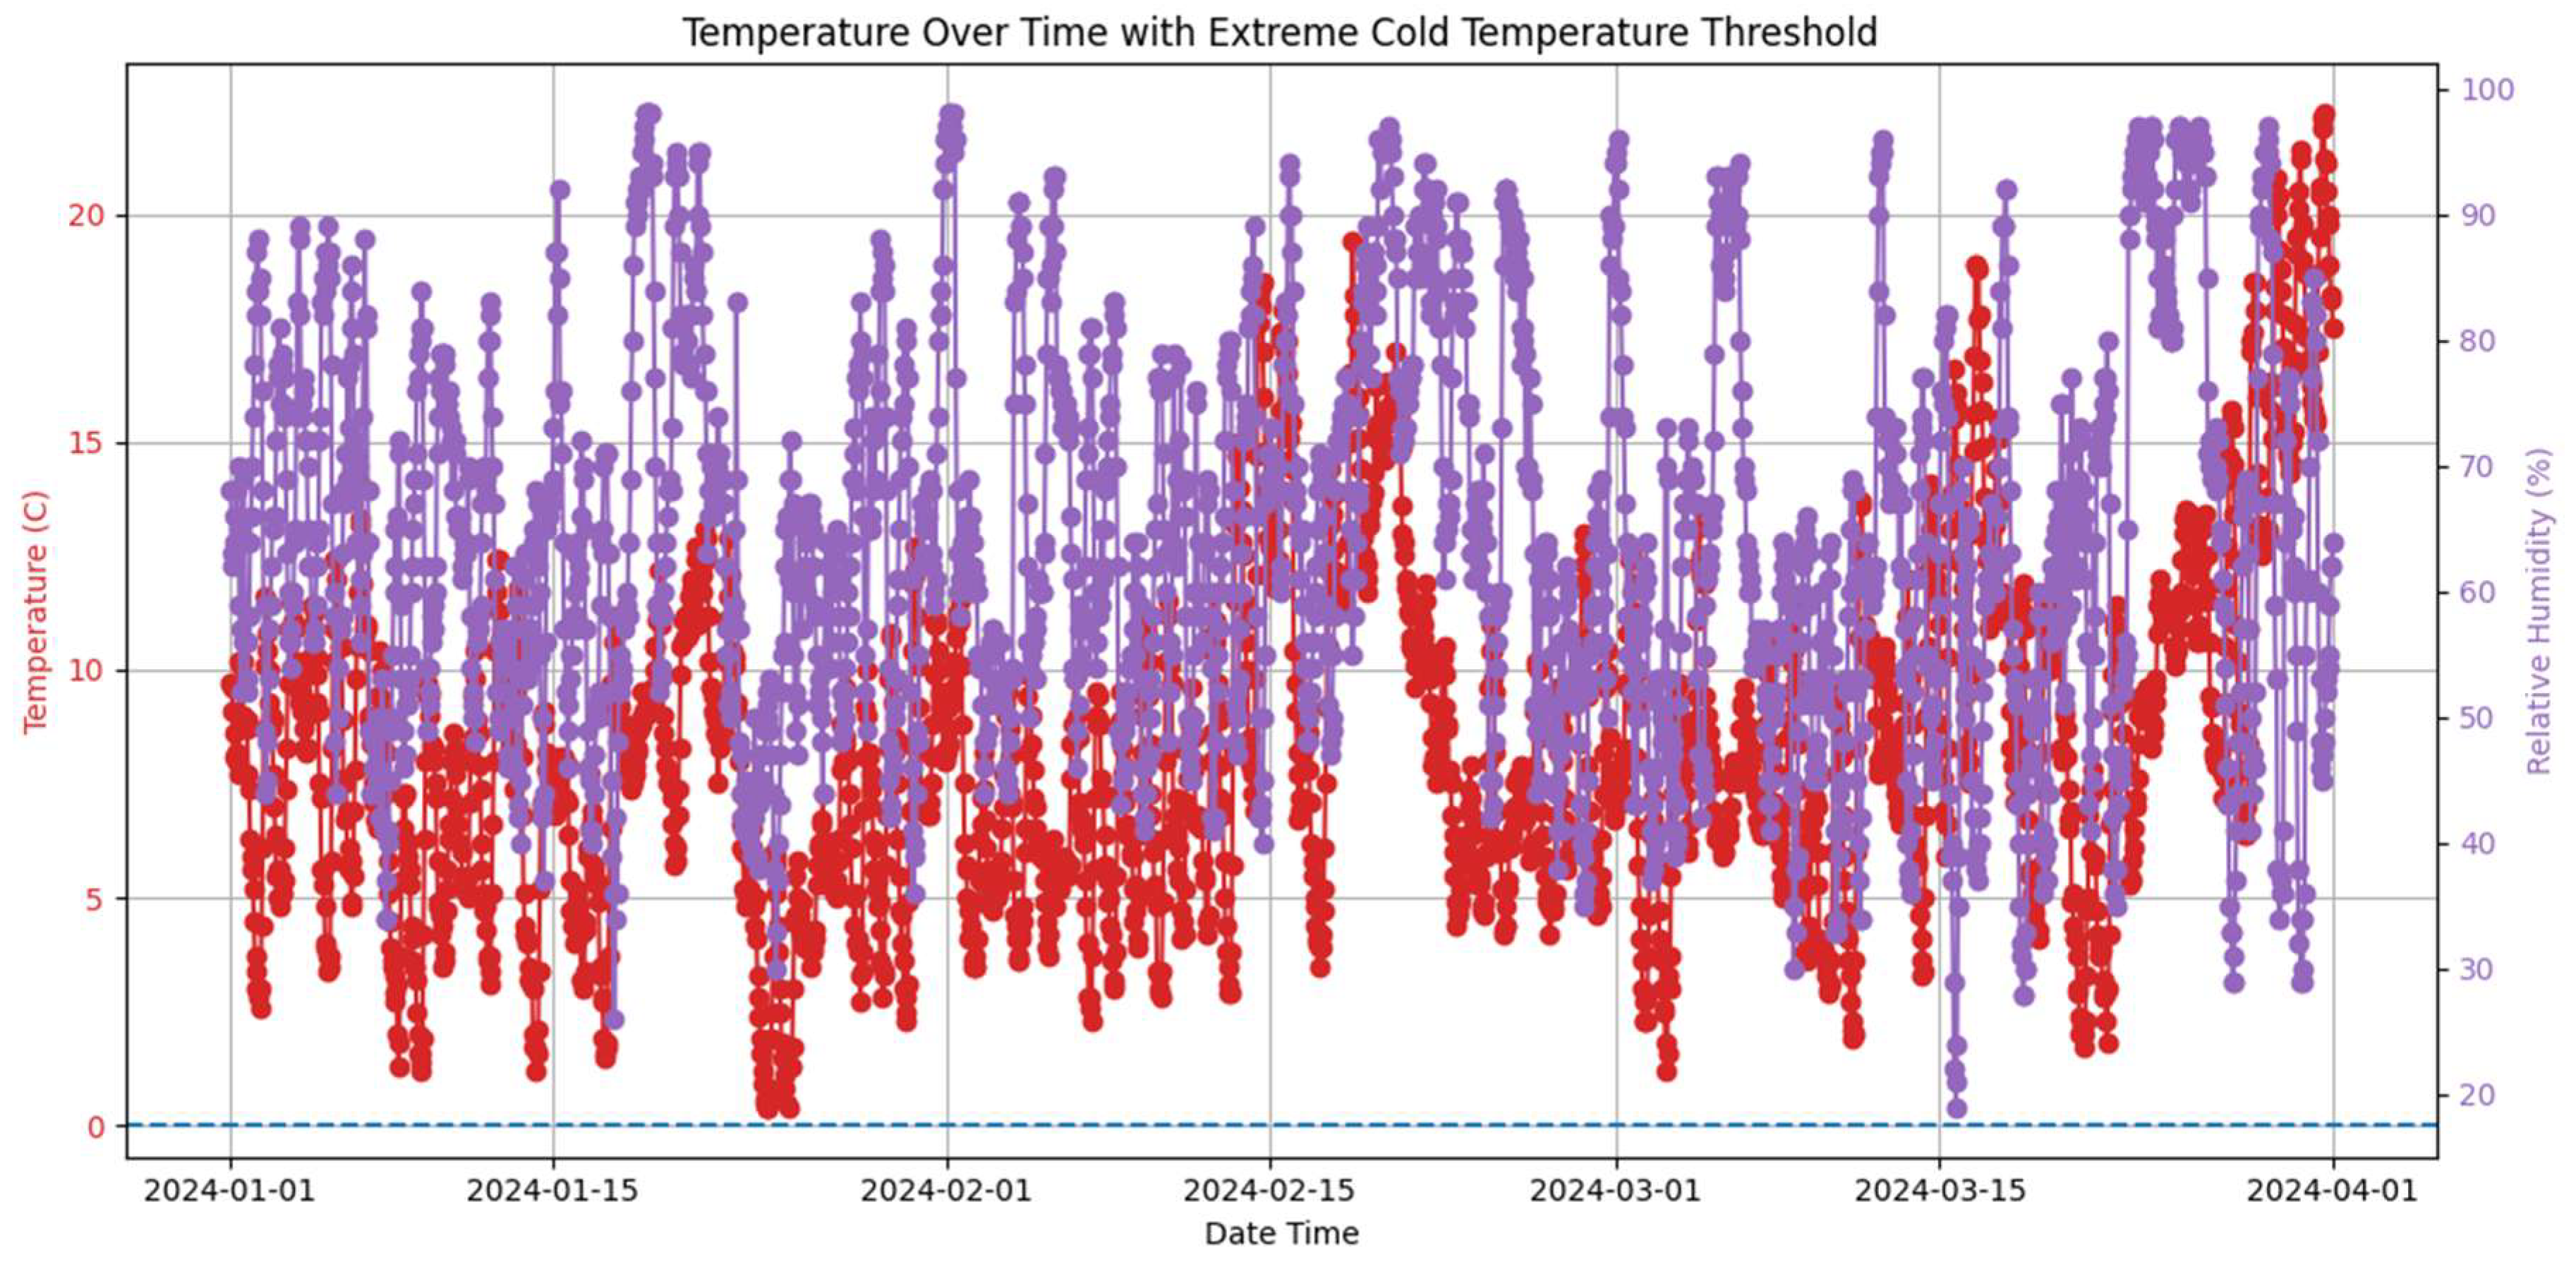
Figure 2.
Wind speed and local pressure over time.
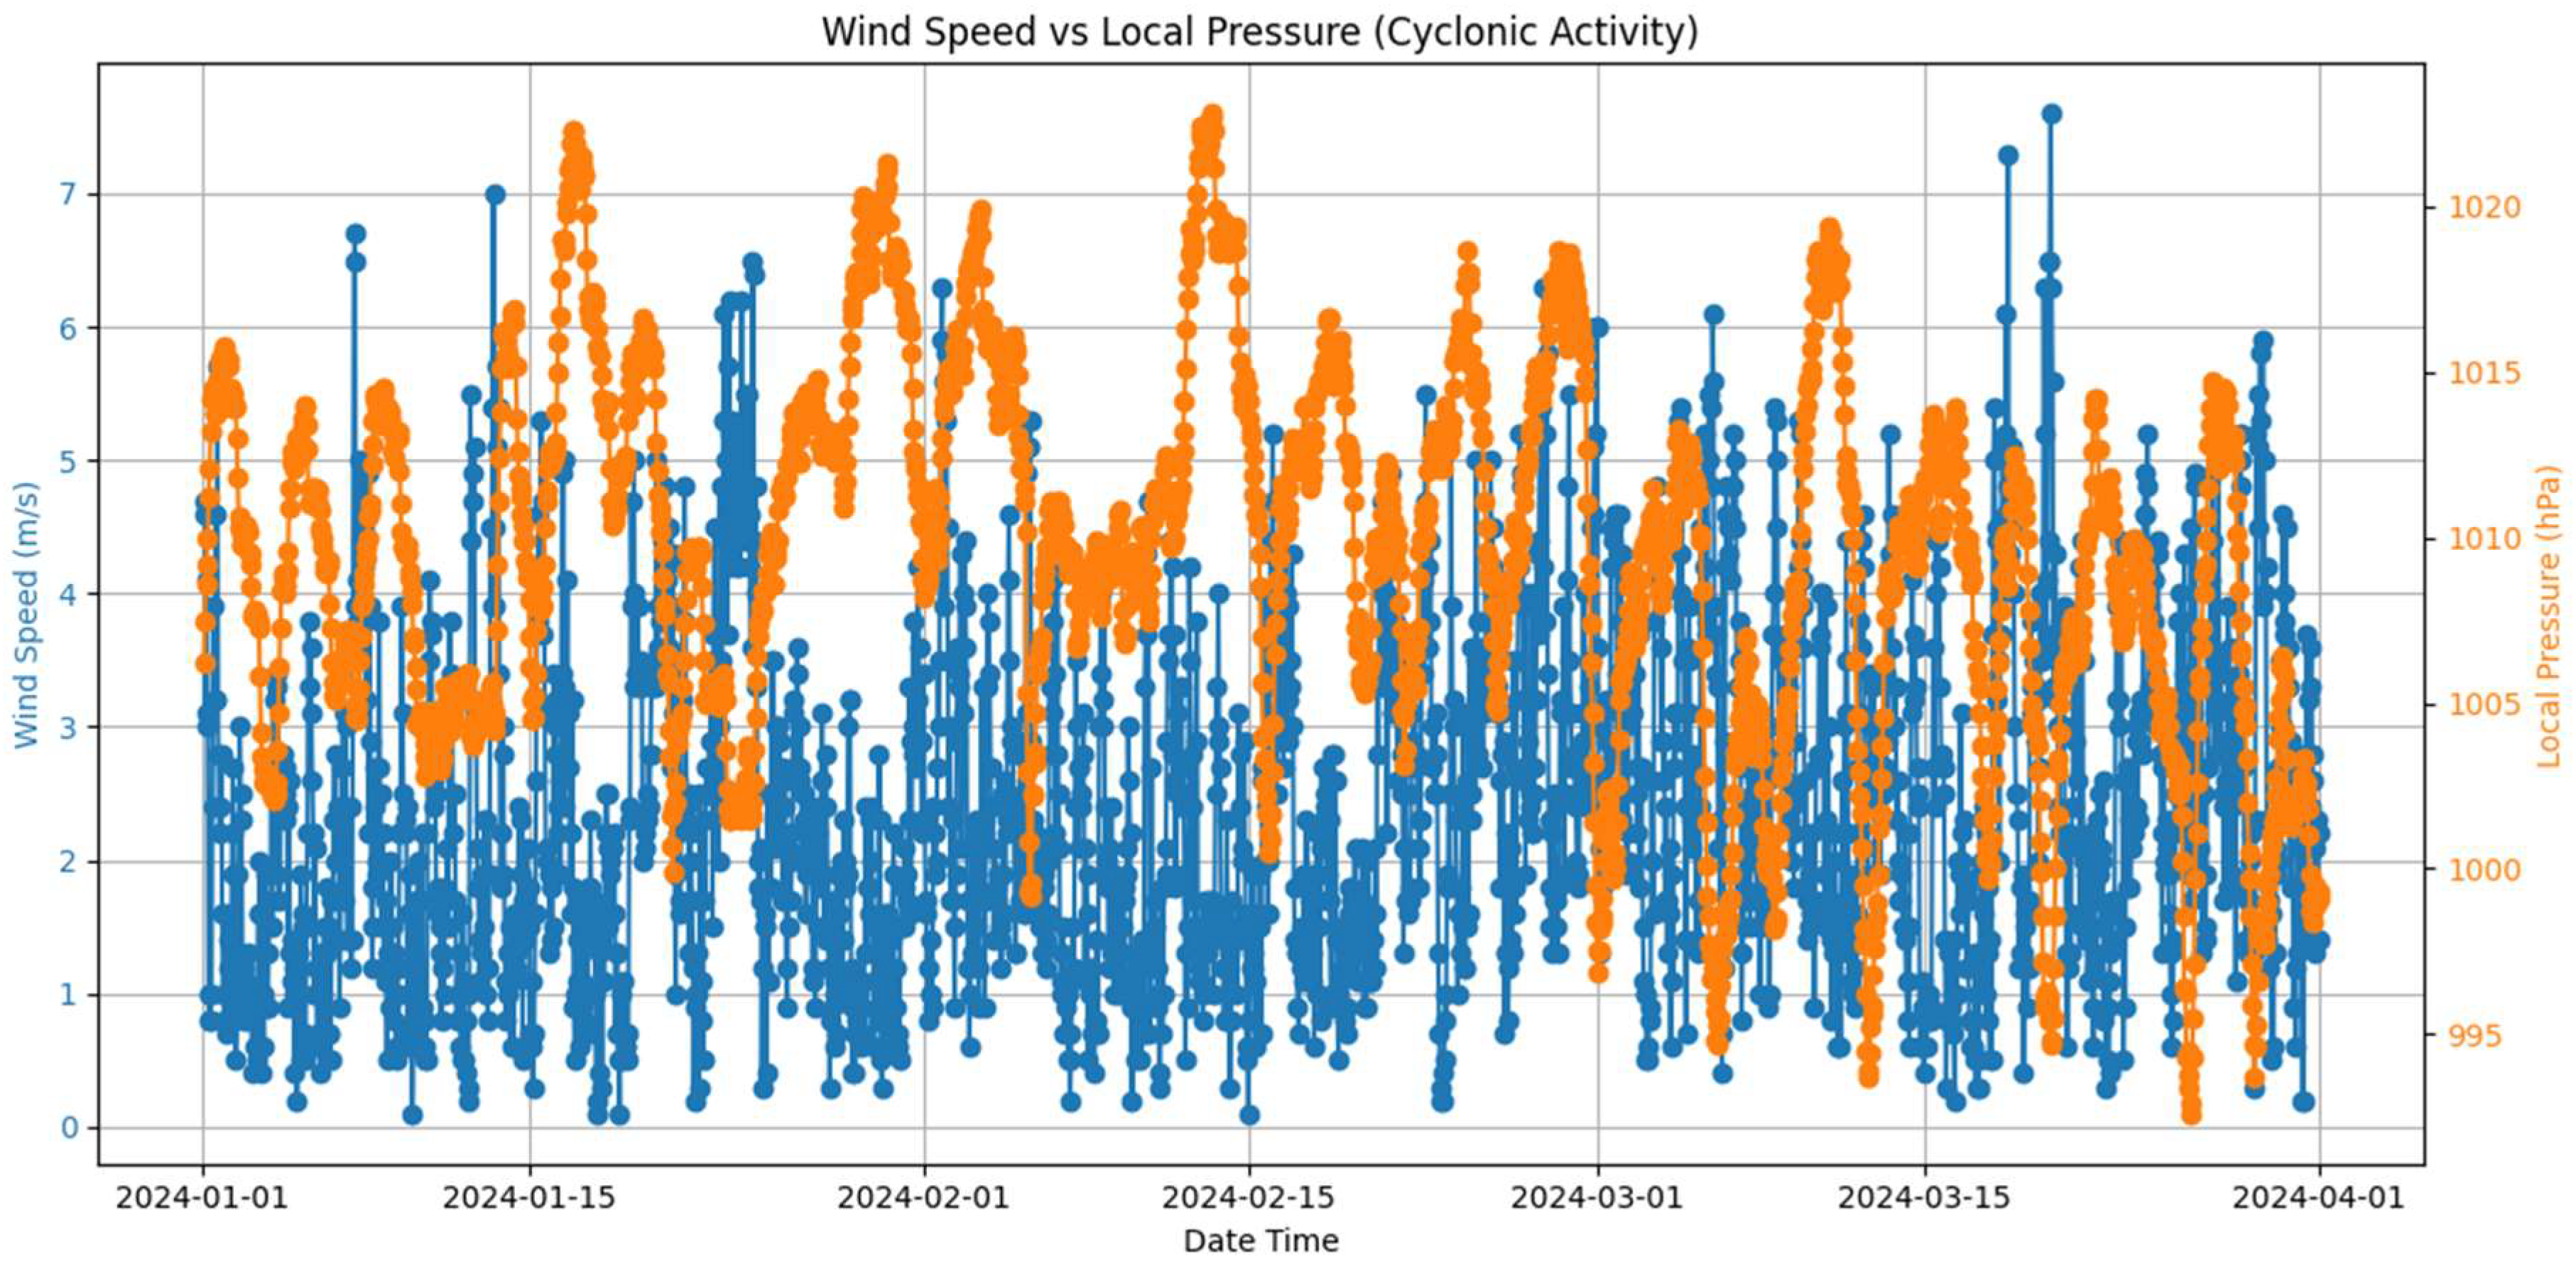
Figure 3.
Relationship between precipitation and relative humidity.
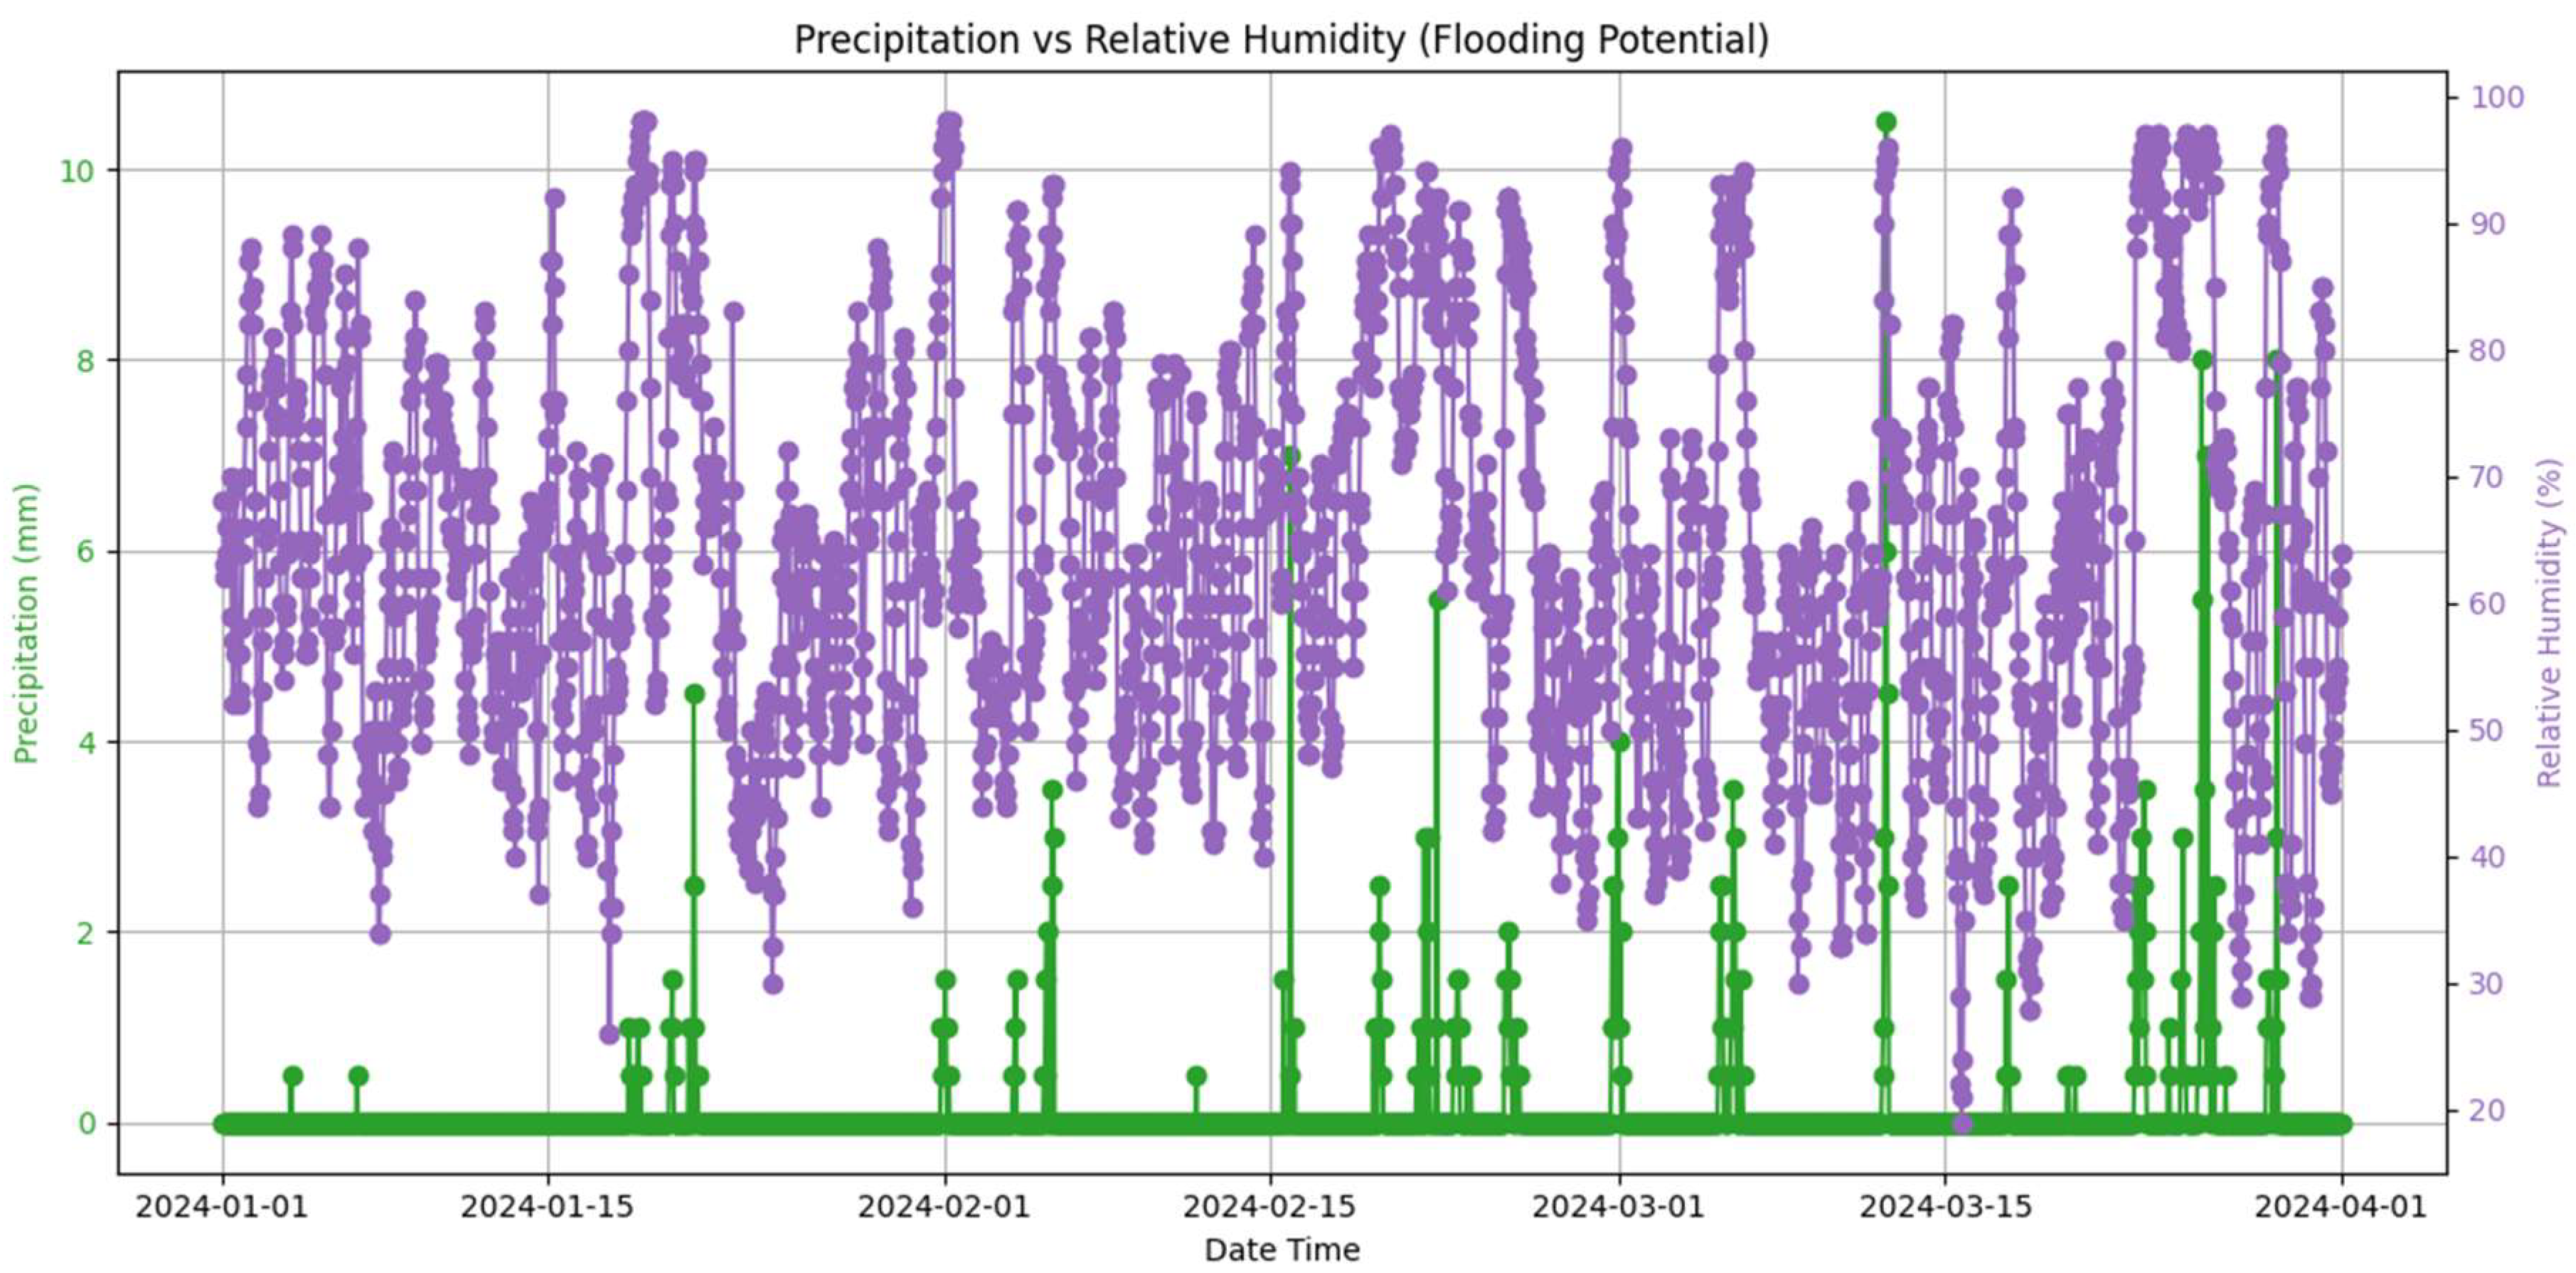
Figure 4.
Relationship between temperature and dew point temperature.
Disclaimer/Publisher’s Note: The statements, opinions and data contained in all publications are solely those of the individual author(s) and contributor(s) and not of MDPI and/or the editor(s). MDPI and/or the editor(s) disclaim responsibility for any injury to people or property resulting from any ideas, methods, instructions or products referred to in the content. |
© 2024 by the authors. Licensee MDPI, Basel, Switzerland. This article is an open access article distributed under the terms and conditions of the Creative Commons Attribution (CC BY) license (http://creativecommons.org/licenses/by/4.0/).
Copyright: This open access article is published under a Creative Commons CC BY 4.0 license, which permit the free download, distribution, and reuse, provided that the author and preprint are cited in any reuse.


