1. Introduction
Chondrodendron tomentosum Ruiz & Pav. (Menispermaceae), locally known in northeastern Perú as "
uva de montaña" (
mountain grape), is an Amazonian woody liana that produces dark purple fleshy drupes arranged in infructescences of 3–6 units [
1,
2]. The fruits, traditionally consumed in Andean-Amazonian communities, have a sweet-tart flavor and ripen between July and September in montane forests at 1500–2000 m a.s.l. [
3]. Despite its traditional use, the phytochemical composition of
C. tomentosum fruits remains uncharacterized in scientific literature, classifying it as an understudied and underexploited wild species.
Wild Amazonian and Andean berries constitute rich sources of phenolic compounds, anthocyanins, organic acids, and vitamins, with recognized antioxidant, anti-inflammatory, and anticancer properties [
4,
5,
6,
7]. These secondary metabolites confer nutraceutical value and position wild species as candidates for functional food development [
8]. Additionally, their resistance to adverse climatic conditions and natural immunity to pathogens represent significant agronomic advantages for sustainable production systems [
9].
C. tomentosum remains absent from indexed scientific literature: as of November 2025, no studies on fruit composition, bioactive compounds, or extraction methodologies have been reported in databases such as Scopus or Web of Science. This absence in scientific literature simultaneously represents a conservation risk and an unexplored opportunity for functional food development from underutilized tropical biodiversity.
Ultrasound-assisted extraction (UAE) is gaining in importance as a green technology for extracting bioactive compounds from plant matrices by enhancing extraction time, yield, and selectivity over traditional techniques [
10,
11]. The acoustic cavitation of the ultrasonic probe system, breaking down cell walls, increases mass transfer and reduces thermal degradation of labile metabolites [
12,
13]. Various berries have shown promising efficiency in collecting anthocyanins and total phenols:
Prunus spinose [
14]
, Aronia melanocarpa [
15],
Myrciaria cauliflora [
16]
, Myrtus communis [
17]
, Morus nigra [
18].
The goal of this analysis was to analyze the biometric and physicochemical properties of C. tomentosum at 3 maturity stages (green, turning, and ripe) as well as to assess them along with the proximate characterization of ripe fruits. Ultrasound-assisted extraction (UAE) of phenolic compounds, anthocyanins, and antioxidant capacity from ripe fruits was optimized through Box-Behnken design, evaluating the effect of methanol concentration (25–75%), ultrasonic amplitude (30–70%), and extraction time (1–15 min). Once optimized, the optimal UAE conditions were validated and applied on green and turning stages to evaluate the variation of bioactive compounds during ripening. This study constitutes the first comprehensive scientific report addressing the biometric, physicochemical, proximate, and phytochemical characterization of this species, together with the optimization of green extraction technologies for bioactive compound recovery.
2. Materials and Methods
2.1. Plant Material
Wild fruits of
C. tomentosum Ruiz & Pav. were collected at green (0), turning (1), and ripe (2) stages (
Figure 1) in a montane forest in the village of Villa Rica, San José de Lourdes district, San Ignacio province, Cajamarca, Perú (−5.059457°, −78.892105°; 1626 m a.s.l.) during July–August 2025. Only healthy fruits without mechanical damage, bruise, or signs of insect or pathogen attack were selected. Taxonomic identification was verified, and the reference specimen (Botanical Determination Certificate No. 05-2024) was deposited in the Isidoro Sánchez Vega Herbarium (ISV), Universidad Nacional de Jaén, Perú. Samples were transported under refrigeration (4 ± 1 °C) to the Nutrition and Toxicology Laboratory of the Instituto de Investigación Tecnológico Agroindustrial (IITA), Universidad Nacional del Santa, Chimbote, Perú, for immediate conditioning and processing.
2.2. Chemical Reagents
Folin-Ciocalteu reagent, 2,2-diphenyl-1-picrylhydrazyl (DPPH), (±)-6-hydroxy-2,5,7,8-tetramethylchromane-2-carboxylic acid (Trolox), HPLC-grade methanol, potassium chloride, sodium acetate trihydrate, hydrochloric acid (37%), and glacial acetic acid were supplied by Sigma-Aldrich (St. Louis, MO, USA). Anhydrous sodium carbonate was purchased from J.T. Baker (Phillipsburg, NJ, USA), and gallic acid from Merck KGaA (Darmstadt, Germany). Sodium hydroxide and phenolphthalein indicator were of analytical grade.
2.3. Classification of Maturity Stages and Sample Preparation
Fruits were washed with abundant running water, disinfected with sodium hypochlorite solution (80 mg/L) for 2 min, and rinsed with distilled water. Classification by maturity stage was established through a visual colorimetric scale adapted from the maturity index (MI) of olives
Olea europaea L. [
19], defining three categories according to epicarp pigmentation: green (index 0) - uniform green epidermis without pigmentation; turning (index 1) - epidermis with 25–75% purple-reddish pigmentation; ripe (index 2) - uniform dark purple epidermis with >95% pigmented surface (
Figure 1).
2.4. Morphological Characterization
Visual observations were performed to describe the
C. tomentosum plant, as well as the shape, color, and texture of the fruit and seed at three ripening stages [
20,
21].
2.5. Biometric Characterization
Fifty fruits per maturity stage were evaluated (n = 50). The recorded variables were: fresh weight (g), polar diameter (cm), and equatorial diameter (cm). Fresh weight was determined on a precision balance (Precisa, LX-4200C, Switzerland). Diameters were measured with a stainless steel vernier caliper (Pretul, escolar, Mexico) [
22]. Polar diameter corresponded to the longitudinal peduncle-style axis; equatorial diameter was measured perpendicularly at the widest zone of the fruit.
2.6. Physicochemical Characteristics
Fruits from each maturity stage were homogenized in a mortar to obtain purée. Vitamin C content was determined by titration using the AOAC 967.21 (2019) [
23] method. pH (AOAC 981.12), total soluble solids (AOAC 932.12), and titratable acidity (AOAC 942.15) were developed following standard AOAC methods (2023) [
24]. pH was measured with a benchtop pH meter (Hanna, HI2211, Romania) previously calibrated with pH 4.0 and 7.0 buffer solutions. A manual refractometer (Wmeters, REF108, China) was used to estimate total soluble solids (TSS), and values were expressed in °Brix at 20 °C. Titratable acidity (TA) was determined by titrating the sample with an acid-base solution with 0.1 N NaOH to pH 8.8, and results were expressed as percentage of citric acid. The maturity index (MI) was calculated as the TSS/TA ratio [
25].
2.7. Proximate Composition
Proximate characterization was performed only on ripe fruits (n = 3). Moisture was quantified by gravimetry after drying samples in an oven (POL-EKO/SLW 240, Poland) following the AOAC 945.15 (2023) [
24] method. Ash was determined by incineration in a muffle furnace (Protherm Furnaces, PLF 110/6, France) at 550 °C using AOAC 223.03 (2023) [
24]. Crude protein was estimated using a Kjeldahl apparatus (Labconco, 6030001, USA) following AOAC 954.01 (2019) [
26] with 6.25 as the nitrogen conversion factor. Crude fiber was determined by acid-base hydrolysis following NTP 205.003 (2011) [
27], and crude fat by Soxhlet extraction (Marconi, MA-491, Brazil) with petroleum ether as solvent using AOAC 930.09 (2019) [
28]. Carbohydrate content was estimated by difference according to the AOAC 986.25 (2023) [
24] method using Equation 1.
2.8. Ultrasound-Assisted Extraction (UAE)
The UAE protocol was adapted from Christou et al. [
29] and Razola et al. [
30]. Seeds were manually removed, and the pericarp (pulp and peel) was homogenized in a mortar. 1.00 g of sample was weighed into a 50 mL beaker, adding methanolic solution at a 1:30 (w/v) ratio. Extraction was performed using a USCG 1800 ultrasonic homogenizer (Infitek, China) equipped with a titanium sonotrode (Ø 18 mm, frequency 24 kHz, nominal power 2500 W). The probe was immersed to approximately 50% of the volume without contact with the vessel walls, operating in continuous mode. Methanol (%, v/v), amplitude (%), and time (min) conditions varied according to the Box-Behnken design. Subsequently, extracts were centrifuged (Sigma 4-16KS, Osterode, Germany) at 4200 rpm, 4 °C for 20 min. Supernatants were filtered (Whatman No. 42 paper), protected from light in aluminum foil-wrapped Falcon tubes, and stored at −20 °C until respective analyses.
2.9. Quantification of Total Phenols
Total phenols were determined by the Folin-Ciocalteu spectrophotometric method [
31] with modifications. A calibration curve was prepared with gallic acid (0–300 μg/mL in 50% methanol). In amber microtubes, 80 µL of extract was mixed with 160 µL of Folin-Ciocalteu reagent (10% v/v), incubating for 5 min in darkness. 640 µL of Na₂CO₃ (7.5% w/v) was added, and the mixture was incubated for 60 min in darkness at room temperature. Absorbance was measured at 765 nm in a microplate reader (Model Synergy H1, USA). Results were expressed as mg gallic acid equivalents (GAE)/100 g fresh weight basis.
2.10. Quantification of Monomeric Anthocyanins
Total anthocyanins were quantified by the pH differential method [
32]. Buffer solutions were prepared: potassium chloride (pH 1.0, 0.025 M) adjusted with concentrated HCl and sodium acetate (pH 4.5, 0.4 M) adjusted with glacial acetic acid. 500 µL of extract was mixed with 500 µL of each buffer independently, homogenizing in a vortex (Model MS 3 digital, Germany). Absorbances were measured at 510 nm and 700 nm in the microplate reader. Monomeric anthocyanin concentration was calculated using Equation 2 and Equation 3:
Where A is the sample absorbance, MW = 449.2 g/mol (cyanidin-3-glucoside), DF = dilution factor, ε = 26900 L·mol⁻¹·cm⁻¹, and l = path length in cm. Results were expressed as mg cyanidin-3-glucoside equivalents (C3G)/L.
2.11. Antioxidant Capacity by DPPH
Antioxidant activity was evaluated by the DPPH method [
33]. A Trolox stock solution (1 mM) was prepared by dissolving 0.0125 g in 50 mL of methanol. A calibration curve was constructed with Trolox (5–500 µM). A methanolic DPPH solution (1 mM) was prepared, adjusting absorbance to 0.800 ± 0.020 at 515 nm with methanol. In a 96-well microplate, 10 µL of diluted extract (1:5) was mixed with 190 µL of DPPH solution (final volume 200 µL). The mixture was incubated for 30 min in darkness at room temperature, and absorbance was measured at 515 nm in a microplate reader (Model Synergy H1, USA). Results were expressed as µmol Trolox equivalents (TE)/100 g fresh weight basis.
2.12. Experimental Design and Statistical Analysis
RSM using a three-factor Box-Behnken design (15 experimental runs) was applied to optimize UAE. Independent variables were: methanol concentration (A: 25, 50, 75%, v/v), ultrasonic amplitude (B: 30, 50, 70%), and extraction time (C: 1, 8, 15 min). Response variables were: anthocyanins (mg C3G/L), total phenols (mg GAE/100 g), and antioxidant capacity (µmol TE/100 g). Data were fitted by least squares to a quadratic polynomial model in coded variables (Equation 4):
Where y is the predicted response, A, B y C are coded independent variables, β₀ is the intercept, βA, βB y βC are linear coefficients, βAA, βBB y βCC are quadratic coefficients, and βAB, βAC y βBC are interaction coefficients. Optimal conditions were determined using Derringer-Suich's desirability function, simultaneously maximizing the three responses. Analyses were performed using Statgraphics Centurion software (version XVI.I, USA).
Biometric and physicochemical data were analyzed by one-way ANOVA and Tukey's multiple comparison test (α = 0.05) using Minitab software (version 14, USA).
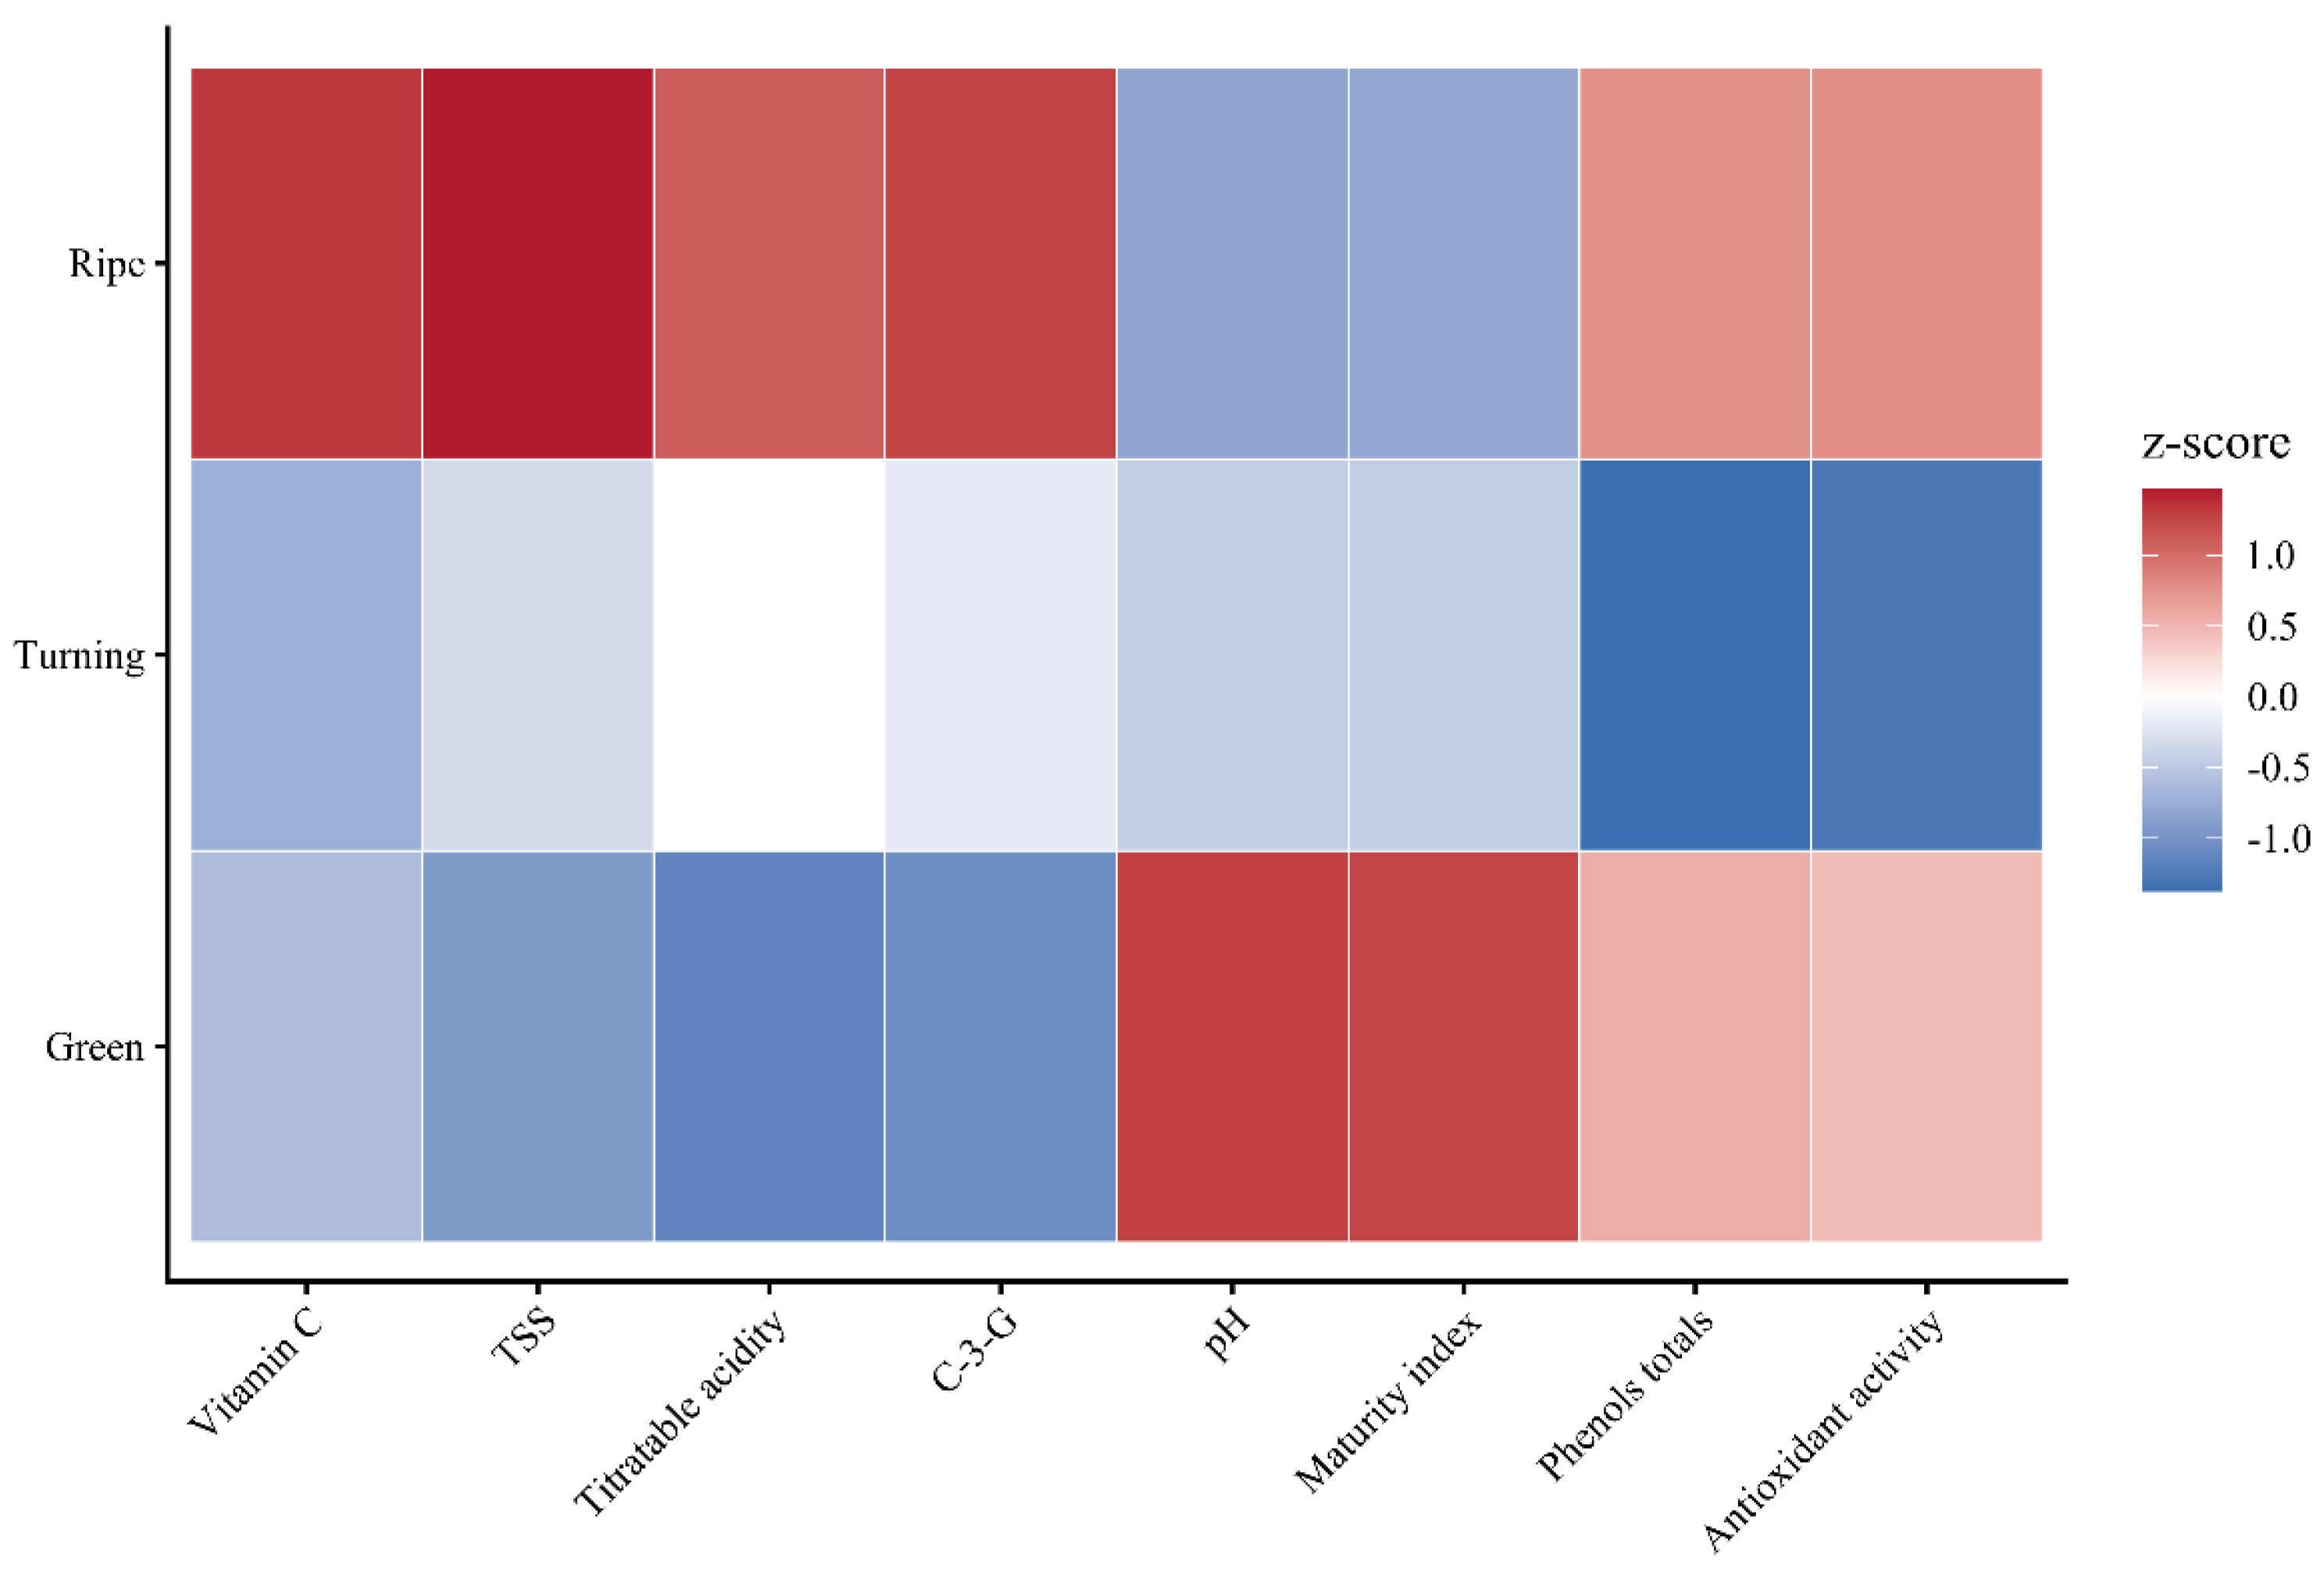
Multivariate exploration was performed through principal component analysis (PCA) on a standardized data matrix (mean-centered, scaled to unit variance) comprising vitamin C, TSS, pH, TA, MI, anthocyanins, total phenols, and antioxidant capacity. A z-score heatmap was generated with annotation by maturity stage. Analyses were executed in R software (version 4.x, USA) with factoextra and ggplot2 packages.
3. Results and Discussion
3.1. Morphological, Biometric, and Physicochemical Characterization During Ripening
3.1.1. Plant and Fruit Morphology
C. tomentosum is a climbing woody liana characterized by large cordate leaves and small whitish-green flowers arranged in axillary inflorescences [
1,
2] (
Figure 2A). The fruits are fleshy ovoid drupes of dark purple color, grouped in clusters of 3-6 units, with scarce mesocarp and sweet-tart flavor [
3] (
Figure 2B). Each drupe contains a single lunate seed with hard testa, characteristic of Menispermaceae (
Figure 2C).
The ontogenic transition from green to ripe involved pronounced changes in epicarp pigmentation and mesocarp firmness (
Table 1). The epicarp evolved from intense green and rough (green) to smooth yellowish-red (turning) and glossy blackish-violet (maduro), reflecting chlorophyll degradation and anthocyanin synthesis via the phenylpropanoid pathway [
34,
35]. The mesocarp transitioned from pale green and firm (green) to semi-soft red (turning) and juicy garnet (ripe), indicating pectin hydrolysis and accumulation of soluble sugars and organic acids [
35,
36]. The seed maintained constant lunate morphology and hardness, with testa evolving from whitish yellowish to light yellow.
Visual classification by colorimetric index (green = 0, turning = 1, ripe = 2) is used in drupes such as
Olea europaea and
Prunus spinosa, where epicarp pigmentation correlates with anthocyanin content, firmness, and physicochemical parameters [
14,
36]. In,
C. tomentosum, the chromatic transition green → yellowish-red → blackish-violet represents a phenotypic marker of physiological ripening (
Table 2).
3.1.2. Biometric Parameters
Fruit dimensions increased progressively during ripening (
Table 2). Polar diameter increased from 2.34 ± 0.15 cm (green) to 2.49 ± 0.17 cm (ripe) (+6.4%), while equatorial diameter increased from 1.71 ± 0.15 cm to 1.97 ± 0.14 cm (+15.2%), accompanied by fresh weight gain from 3.89 ± 0.86 g to 5.74 ± 1.07 g (+47.7%; p < 0.0001). This growth pattern reflects cell expansion and accumulation of soluble solids characteristic of climacteric ripening in drupes [
35,
36].
Vitamin C content doubled from green to ripe phase (10.22 ± 0.01 vs. 5.12 ± 0.01 mg/100 g FW.; +99.6%), in line with activation of ascorbate biosynthesis during late ripening observed in
Vaccinium spp. and other Andean berries [
5,
35,
37]. TSS increased from 7.00 to 8.83 °Brix (+26.1%), which corresponded to the starch-to-sugar conversion and the building up of soluble carbohydrates [
36]. At the same time, pH decreased from 6.28 to 4.27 (−32.0%) and titratable acidity increased from 0.25 to 0.94% (+276%), reflecting organic acid accumulation induced by berry ripening [
36,
38]. The maturity index (TSS/acidity ratio) decreased from 27.82 to 9.42, illustrating that acidity growth was greater than sugar production, which was contrary to common temperate berries and was in line with ripening fruit of tropical species such as
Rubus and
Vaccinium [
35,
39]. The acidic pH and higher TSS at maturity phase are positive for the stability of anthocyanins whose characteristic flavylium cation predominates below pH 5.0, improving extractability properties and chromatic intensity [
36,
38]. This biochemical framework indicates that ripe fruits maximize pigment content and technological acceptability for extraction of biologically active compounds.
3.2. Proximate Composition of Ripe Fruits
Ripe fruits presented moisture of 90.45 ± 0.47%, ash of 2.04 ± 0.14%, crude protein of 1.70 ± 0.02 g/100 g, crude fiber of 2.49 ± 0.01 g/100 g, crude fat of 0.05 ± 0.01 g/100 g, and carbohydrates by difference of 3.01 ± 0.49 g/100 g (dry basis). The high water content classifies
C. tomentosum as an aqueous matrix comparable to grumixama (
Eugenia brasiliensis, 86.2–89.9%) [
40] and superior to cauchao (
Amomyrtus luma, 75.3%) [
37], favoring hydroalcoholic extraction of water-soluble metabolites [
41].
The ash fraction exceeded 3.6–6.0 times the values of cauchao (0.57%) [
37] and grumixama (0.34–0.49%) [
40], suggesting high mineral content associated with montane volcanic soil [
42]. Protein content was comparable to cauchao (1.73 g/100 g) [
37] but higher than grumixama (0.65–0.83 g/100 g) [
40]. The extremely low lipid content (2.3% of cauchao's value) confirms the characteristic profile of pigmented drupes where phenolic metabolites predominate over structural lipids [
40,
41]. This high-moisture, low-lipid matrix minimizes apolar interferences and maximizes solvent diffusion toward epidermal vacuoles rich in anthocyanins [
37,
41].
3.3. Ultrasound-Assisted Extraction Optimization
3.3.1. Box-Behnken Experimental Design
The Box-Behnken design evaluated 15 combinations of methanol (25–75%, v/v), ultrasonic amplitude (30–70%), and time (1–15 min) on anthocyanins, total phenols, and antioxidant capacity (
Table 3). Response ranges were 42.64–120.82 mg C3G/L, 372.05–677.67 mg GAE/100 g, and 1869.09–5799.38 µmol TE/100 g, respectively, demonstrating variability of 2.8, 1.8, and 3.1-fold between extreme conditions. This second-order factorial design allows modeling linear, quadratic, and interaction effects with a reduced number of experiments compared to full factorial designs [
15,
16,
43].
The quadratic models were statistically significant (p-model ≤ 0.0037) with R² of 97.62% (anthocyanins), 98.28% (phenols), and 96.57% (antioxidants), confirming robust predictive fit comparable to studies in
Aronia melanocarpa (R² = 0.99) [
15],
Myrciaria cauliflora (R² = 0.98) [
16], and
Prunus domestica (R² = 0.97) [
43]. The absence of residual autocorrelation (Durbin-Watson: 1.16–2.64; p > 0.05) validated independence of experimental errors [
44,
45]. The predictive equations in coded variables were:
Linear effects of methanol (A), amplitude (B), and time (C) were significant for all three responses (p ≤ 0.015), indicating monotonic increase toward upper levels like UAE optimizations in berries [
16,
43,
44]. Quadratic terms lacked significance (p ≥ 0.17), suggesting absence of interior optimum and confirming that maximum conditions are located at the boundaries of the experimental space [
15,
45]. Two interactions were relevant: A×C increased anthocyanins (p = 0.048) and B×C increased antioxidant capacity (p = 0.0319), demonstrating synergy between solvent-time and amplitude-time respectively, consistent with ultrasonic cavitation mechanisms where prolonged times potentiate methanol and mechanical energy effects on cell disruption [
16,
44].
3.3.2. ANOVA Fit and Regression Coefficients
The quadratic models were significant (p ≤ 0.0037) with R² of 97.62% (anthocyanins), 98.28% (phenols), and 96.57% (antioxidants), without residual autocorrelation (Durbin-Watson: 1.16–2.64; p > 0.05). Regression coefficients (see
Table 4) demonstrated the linear effect of methanol (A), amplitude (B), and time (C) on all (p ≤ 0.015) of the 3 responses, showing the monotonic increase. In summary, the non-significant terms showed no significance in quadratic variables (p ≥ 0.17), indicative of optimal at experimental space limits consistent with Fernández et al. [
16] and Vázquez et al. [
15]. The A×C interaction enhanced anthocyanins (p = 0.048) and B×C was found to provide the enhanced antioxidant capacity (p = 0.032), confirming solvent-time and amplitude-time synergy associated with ultrasonic cavitation mechanisms [
43,
44].
3.3.3. Response Surfaces and Mechanistic Interpretation
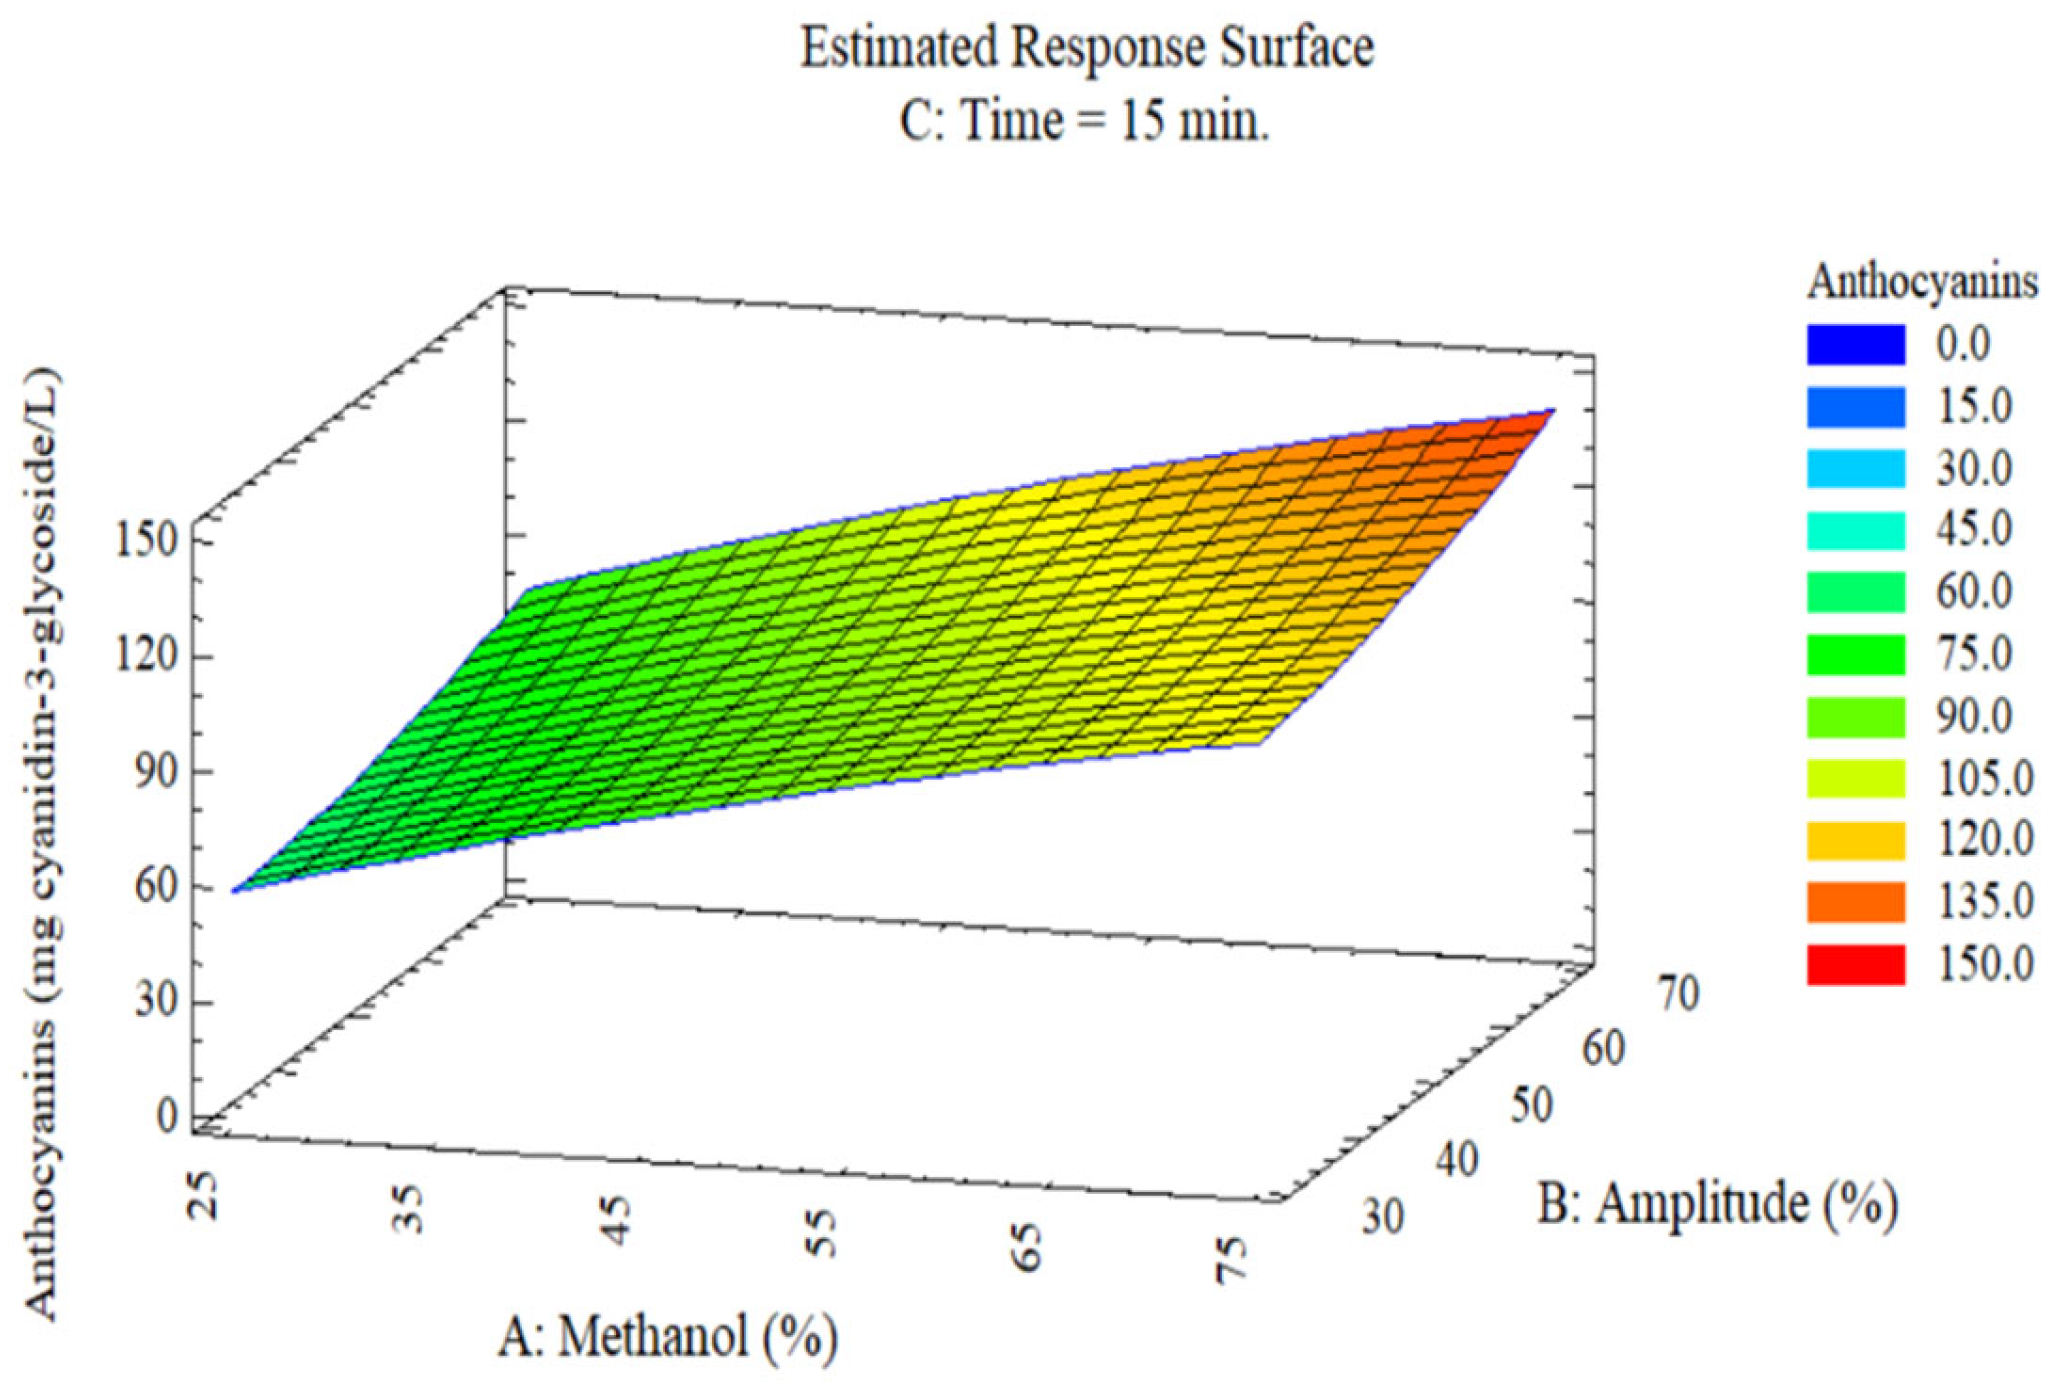
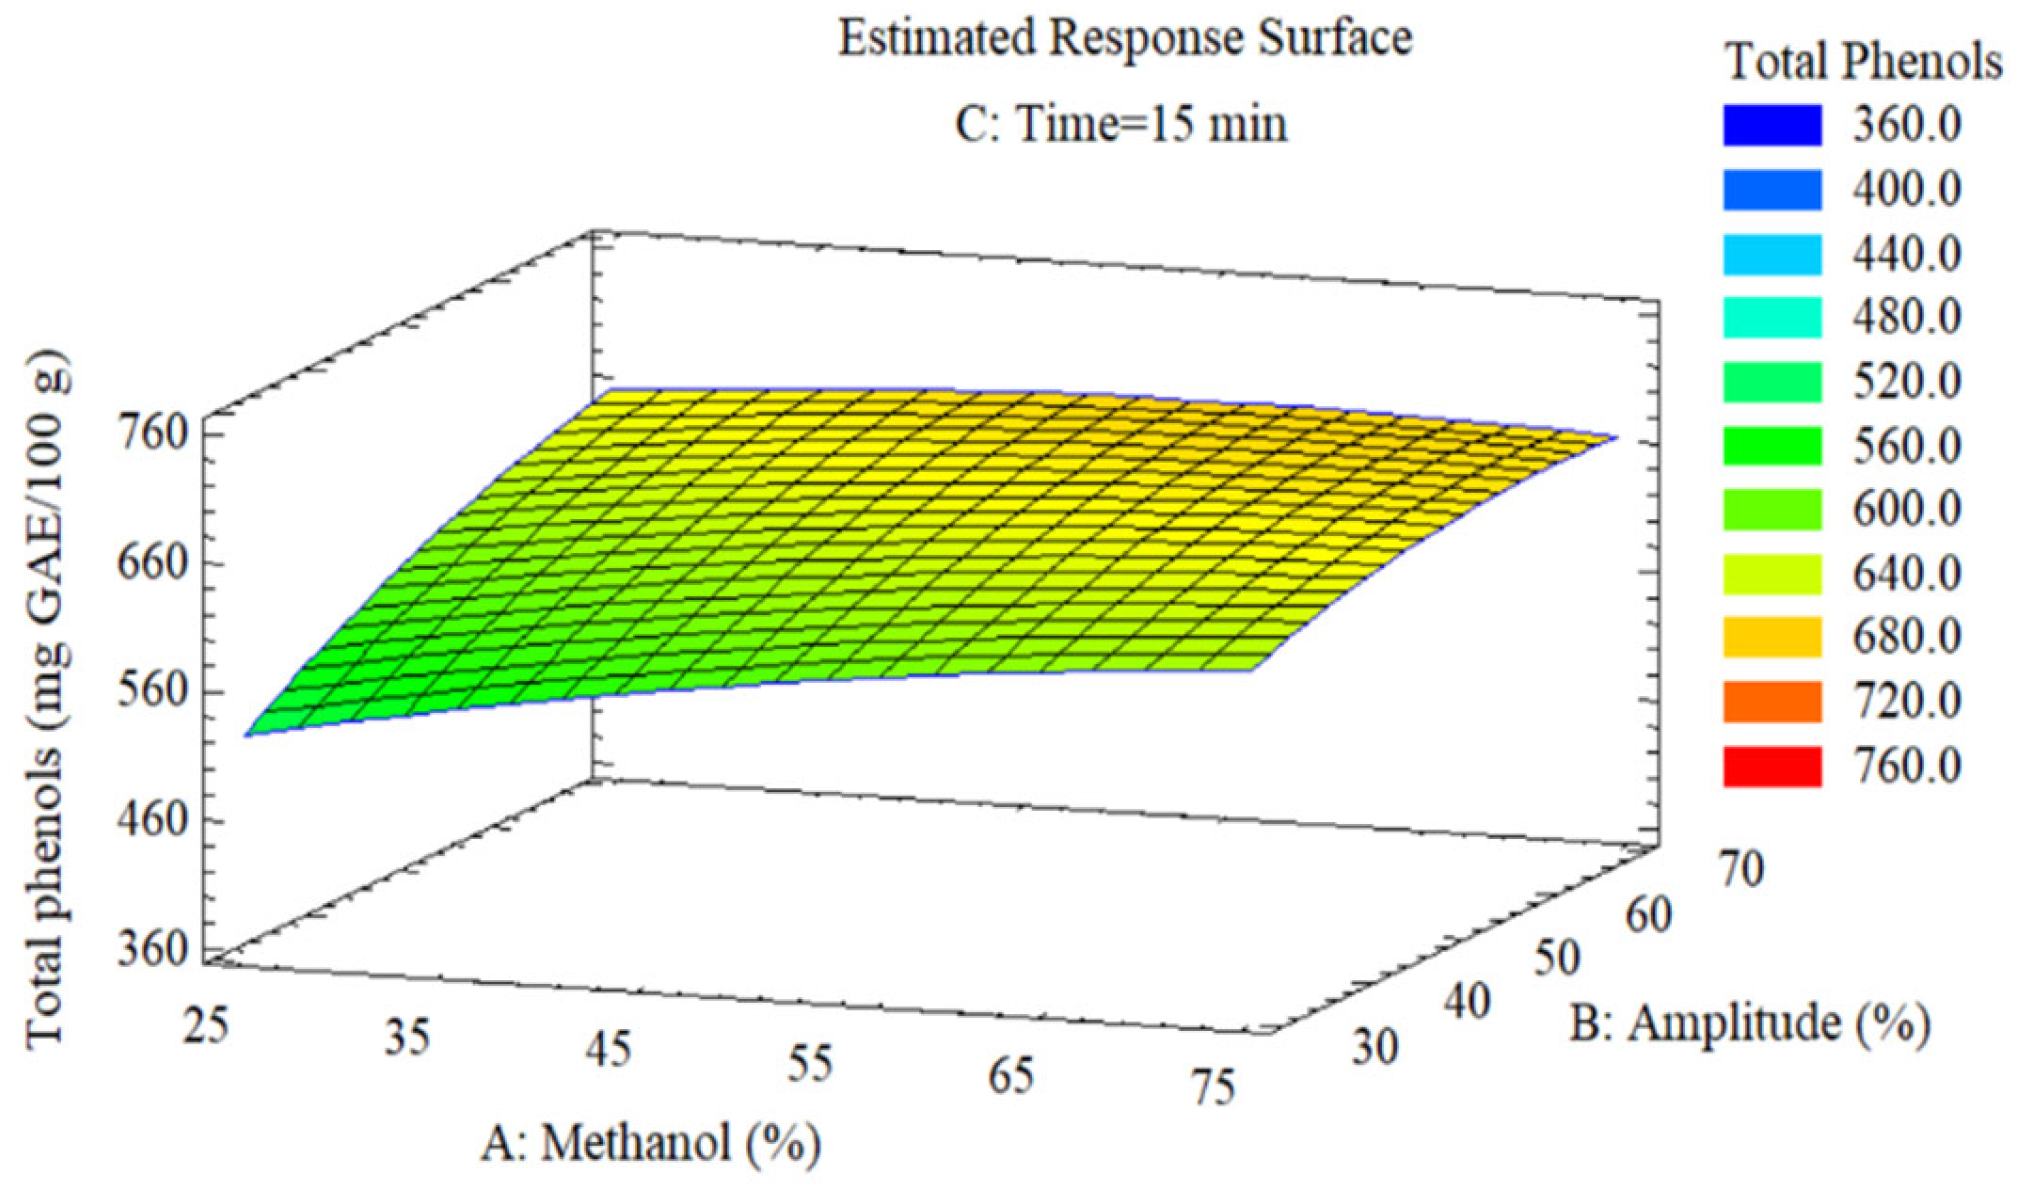
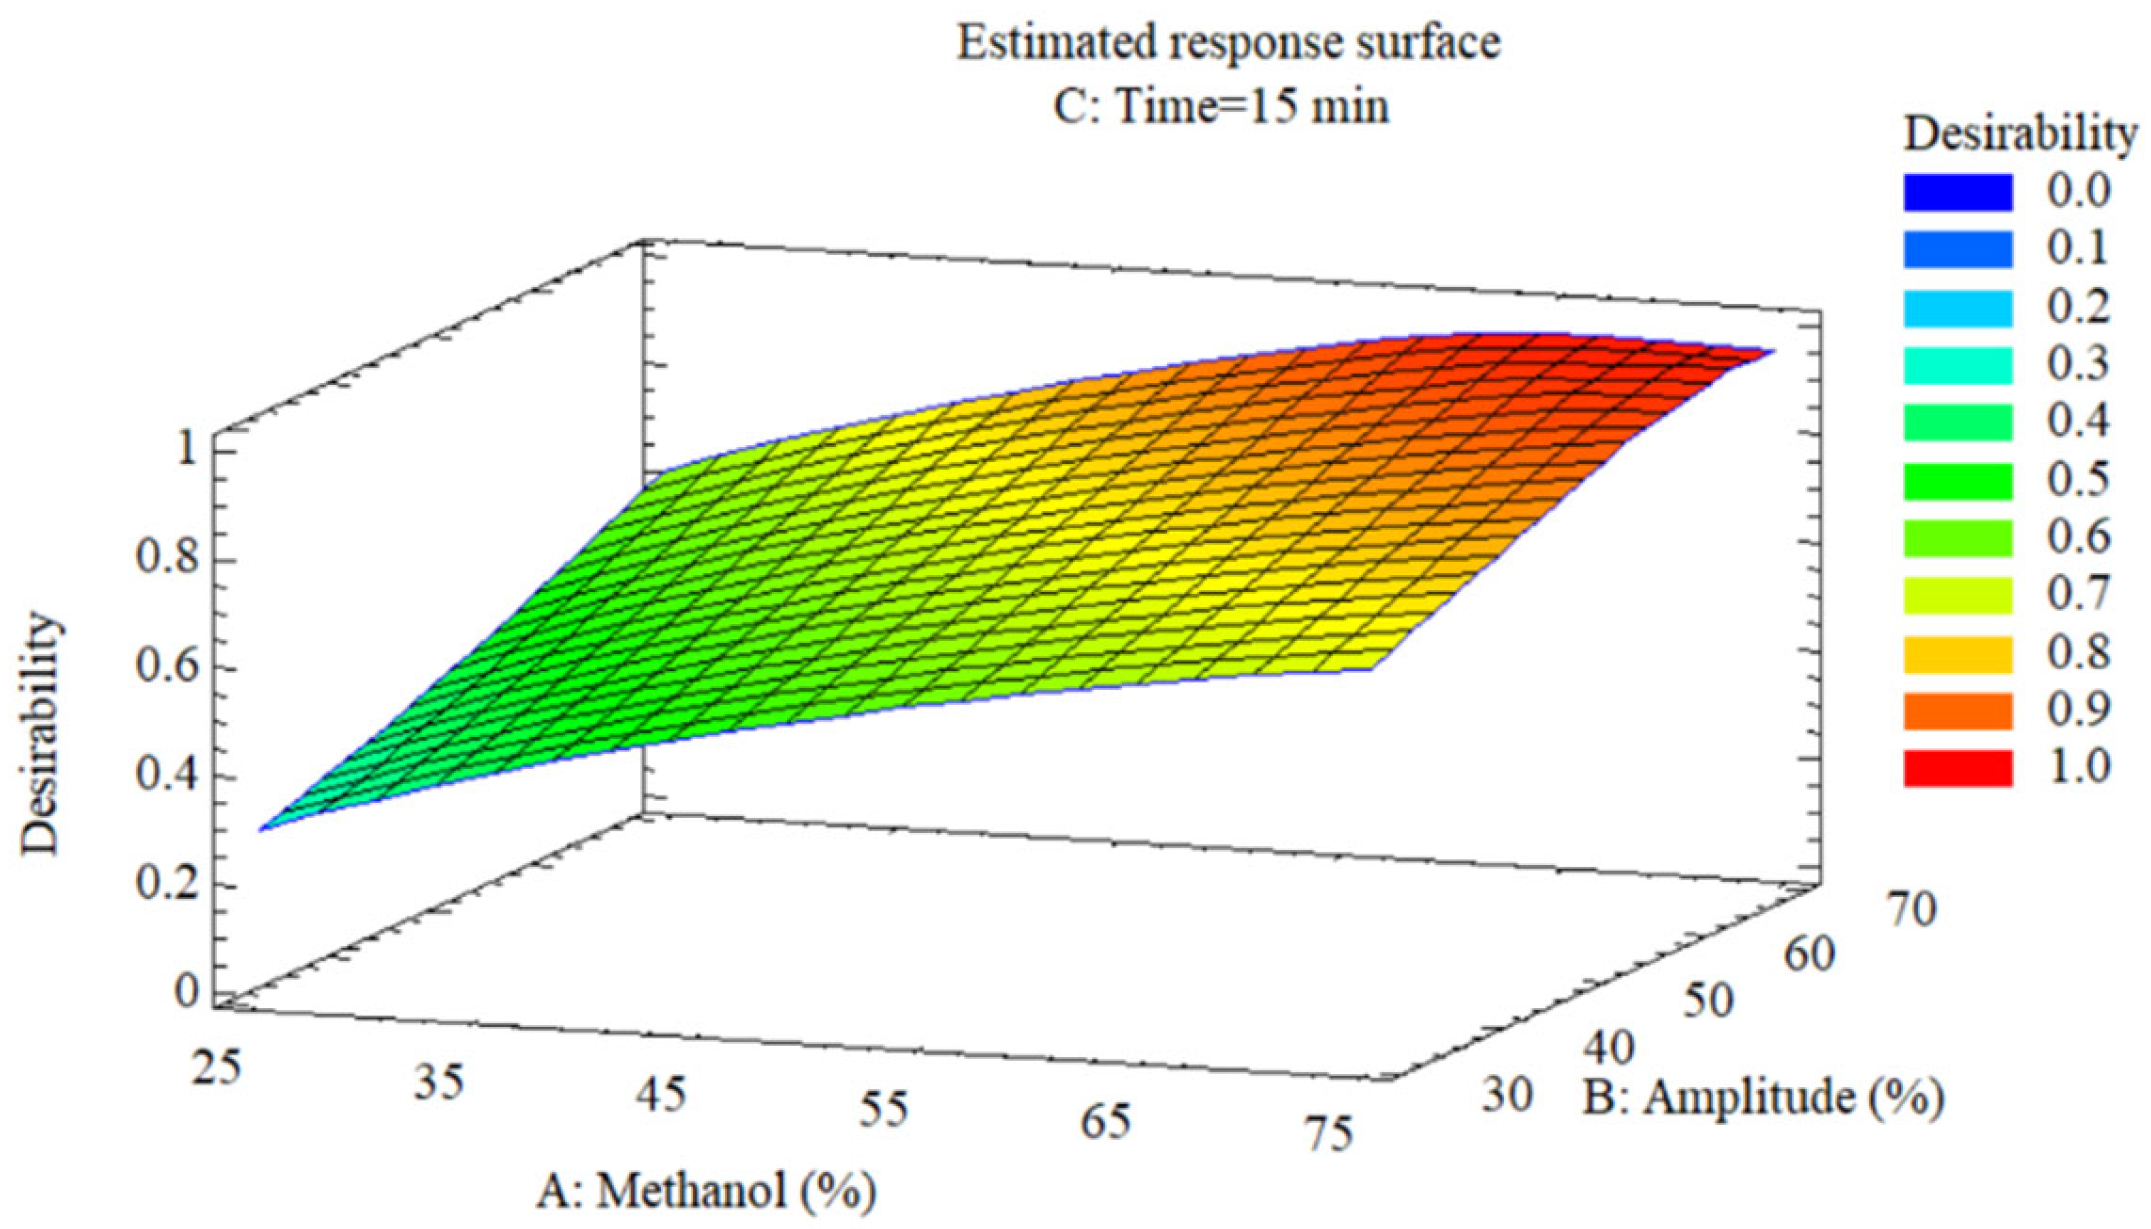
The 3D response surfaces (
Figure 3,
Figure 4,
Figure 5 and
Figure 6) illustrate the combined effects of methanol and amplitude at fixed time of 15 min on the three responses. The anthocyanin surface (
Figure 3) shows progressive increase from 60 mg C3G/L (25% methanol, 30% amplitude) to 151 mg C3G/L (75% methanol, 70% amplitude), with color gradient transitioning from blue (low values) to red (high values). The elongated diagonal contours toward the upper right corner indicate synergistic effect between solvent concentration and ultrasonic energy. This pattern confirms that elevated methanol concentrations improve solubilization of glycosylated anthocyanins by reducing medium polarity, while higher amplitudes intensify acoustic cavitation that disrupts epidermal vacuoles rich in pigments [
16,
43].
The antioxidant capacity surface (
Figure 4) exhibits analogous behavior, increasing from 3200 µmol TE/100 g (minimum conditions) to 6200 µmol TE/100 g (maximum conditions), representing a 2.0-fold increase. The surface shows parallel contours without pronounced interior curvature, consistent with the absence of significant quadratic terms (
Table 4; p ≥ 0.17) and confirming additive effects of methanol and amplitude. The linear increase reflects that reducing capacity measured by DPPH increases proportionally with the extraction of total phenolic compounds and anthocyanins, main contributors to antioxidant activity [
15,
44].
Total phenols (
Figure 5) present a surface with increase from 500 mg GAE/100 g to 670 mg GAE/100 g, showing greater influence of methanol (coefficient β = 32.87; p = 0.006) than amplitude (β = 32.30; p = 0.007). The more widely spaced contours in the direction of the methanol axis evidence its dominant effect on phenolic recovery. The optimal region is located at the upper boundary of the experimental space (≥ 65% methanol, ≥ 60% amplitude), confirming absence of interior maximum. Mechanistically, methanol facilitates rupture of ester bonds between phenolics and cell wall polysaccharides, while ultrasound accelerates mass transfer by localized microagitation in bubble collapse zones of cavitation [
43,
45].
3.3.4. Multi-Response Optimization and Validation
The desirability surface (
Figure 6) identifies the optimal region at 57% methanol, 70% amplitude, and 15 min (desirability = 0.9996), represented by the red zone in the upper right corner where the three optimal responses converge. Desirability transitions from 0.4 (blue, minimum conditions) to 1.0 (red, optimal conditions), demonstrating simultaneous maximization without trade-offs between objectives. Experimental validation (
Table 5) confirms 120.71 ± 1.89 mg C3G/L, 672.46 ± 5.84 mg GAE/100 g, and 5857.31 ± 60.20 µmol TE/100 g, with deviations of 1.69%, 0.47%, and 2.07% from predicted values, within acceptable limits (< 5%) for RSM models [
44].
3.4. Application of Optimal Conditions Across Maturity Stages
Under optimized UAE conditions (57% methanol, 70% amplitude, 15 min), maturity stage determined significant differences in all three responses (ANOVA, p < 0.0001;
Table 6). Monomeric anthocyanins were undetectable in green fruits, reached 46.01 ± 0.70 mg C3G/L in turning fruits, and 120.71 ± 1.89 mg C3G/L in ripe fruits (+162% vs. turning; p < 0.0001). This progressive increase reflects activation of the phenylpropanoid biosynthetic pathway during ripening, responsible for anthocyanin synthesis through sequential action of chalcone synthase, flavanone 3-hydroxylase, and UDP-glucose:flavonoid 3-O-glucosyltransferase [
34,
35,
38]. Additionally, cell wall softening mediated by pectinases and cellulases in ripe stages facilitates mechanical disruption by ultrasonic cavitation, increasing release of vacuolar anthocyanins [
14,
16].
Total phenols exhibited a nonlinear pattern during ripening. The turning stage registered the minimum value (458.86 ± 5.66 mg GAE/100 g), while ripe reached the maximum (672.46 ± 5.84 mg GAE/100 g; +46.7% vs. turning; p < 0.0001), slightly exceeding green (647.83 ± 3.55 mg GAE/100 g; +3.8% vs. green). The transient depression in turning coincides with the rapid cell expansion phase, where dilution by water accumulation and metabolic reconfiguration toward anthocyanin biosynthesis temporarily reduce the total phenolic pool [
5,
34,
35]. In contrast, the ripe stage combines net accumulation of structural phenols (hydroxycinnamic acids) with newly synthesized anthocyanins, resulting in maximum phenolic content [
38,
41].
Antioxidant capacity followed a trend analogous to total phenols: turning < green < ripe (3581.11 ± 39.80 < 5492.63 ± 54.30 < 5857.55 ± 60.20 µmol TE/100 g). The +63.6% increase between turning and ripe (p < 0.0001) correlates with synchronized accumulation of anthocyanins (+162%) and total phenols (+46.7%), evidencing additive contribution of both metabolite families to reducing activity measured by DPPH [
15,
34]. The acidic pH of the ripe stage (4.27 ± 0.02;
Table 1) additionally favors stability of the flavylium cation (predominant form of anthocyanins at pH < 5), maximizing its antioxidant activity through electronic resonance of the oxonium ring [
36,
38].
3.5. Principal Component Analysis
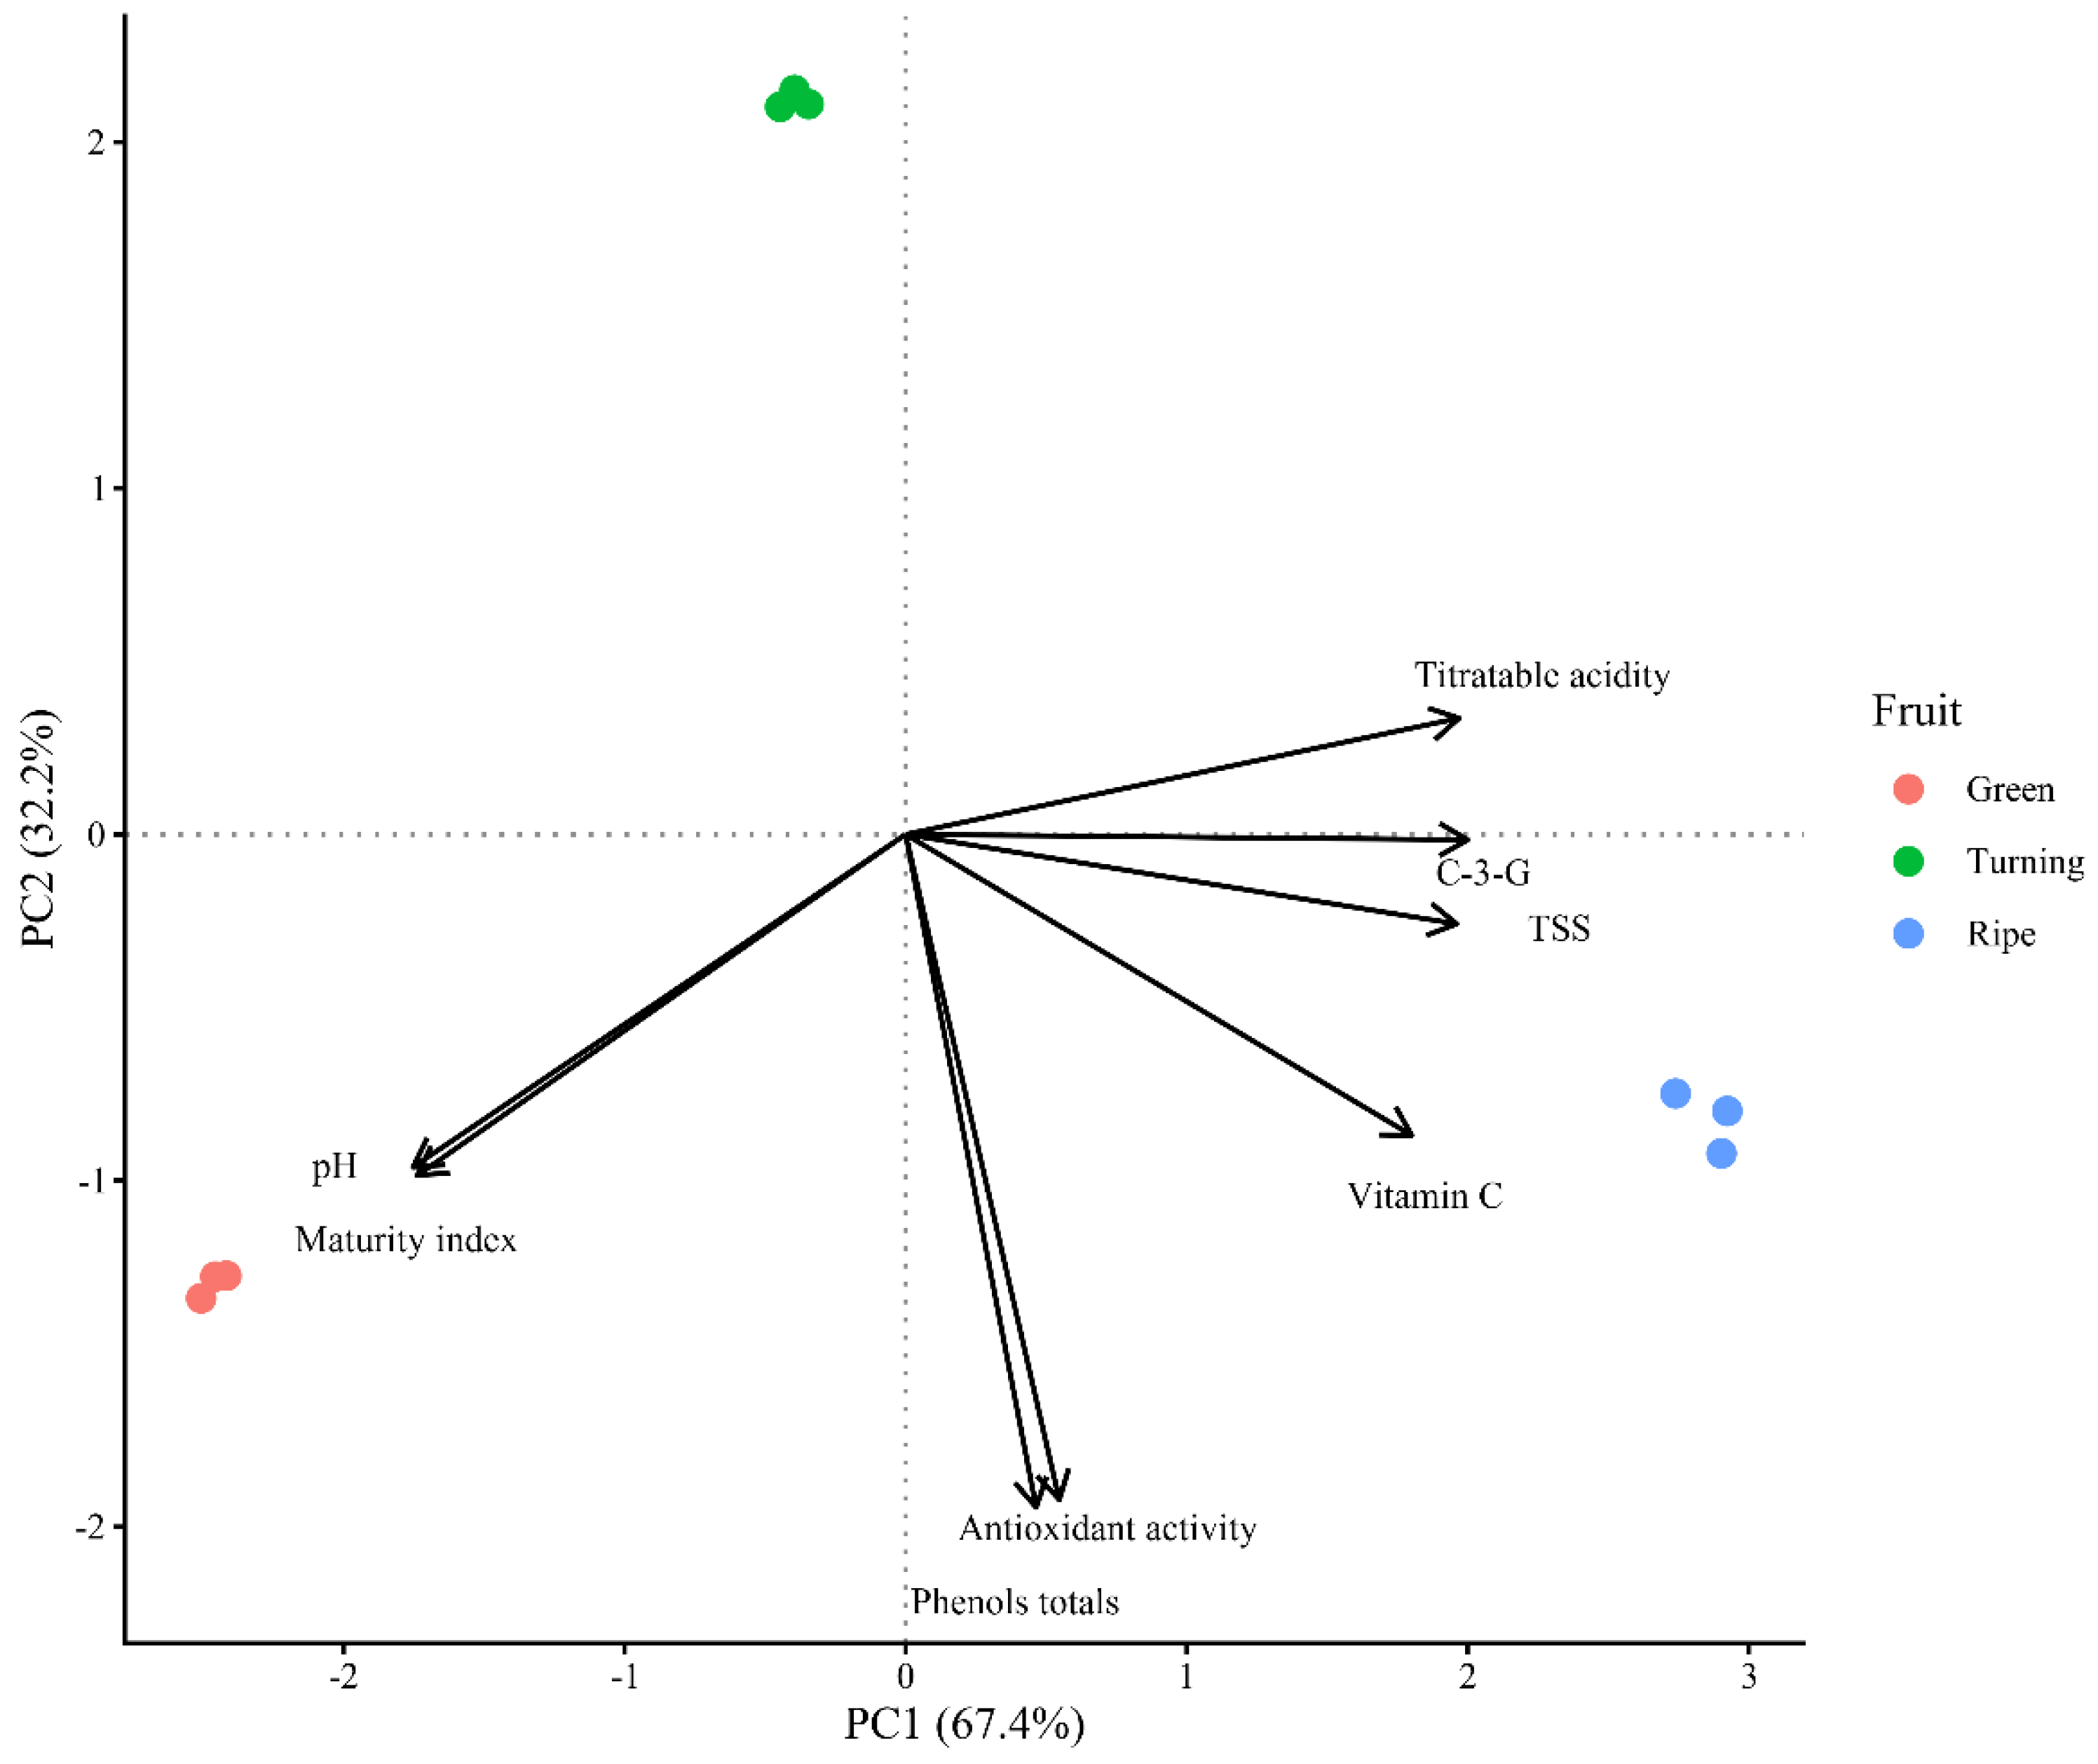
PCA on eight physicochemical and bioactive variables explained 90.6% of total variability (PC1 = 67.4%, PC2 = 23.2%;
Figure 7). PC1 ordered samples according to ontogenic gradient: green fruits in negative PC1, ripe in positive PC1, turning in intermediate positions. This separation reflects metabolic transition during ripening [
5,
35].
TSS, vitamin C, anthocyanins, total phenols, antioxidant capacity, and acidity presented positive loadings on PC1, associated with ripe fruits. pH and maturity index showed negative loadings, associated with green fruits. This configuration agrees with
Table 1 data: TSS increased +26.1% (7.00 → 8.83 °Brix), vitamin C +99.6%, acidity +276% (0.25 → 0.94%), while pH decreased 32.0% (6.28 → 4.27) and maturity index −66.1% (27.82 → 9.42). This pattern, where acidity exceeds sugar accumulation, is characteristic of Andean and tropical berries of
Vaccinium and
Rubus, differing from temperate fruits [
34,
39,
41].
PC2 differentiated the turning stage, which projected separately from green and ripe. This separation captures the transient metabolic minimum in turning: total phenols (458.86 mg GAE/100 g; −29.2% vs. green) and antioxidant capacity (3581.11 µmol TE/100 g; −34.8% vs. green;
Table 5). This valley coincides with rapid cell expansion, where water dilution and biosynthetic reorientation toward anthocyanins temporarily reduce the extractable phenolic pool [
5,
35].
Vaccinium corymbosum and
Rubus ulmifolius exhibit analogous minima at intermediate stages [
34,
38].
The standardized z-score heatmap confirmed differentiation by maturity (
Figure 8). Ripe fruits presented positive z-scores in anthocyanins, total phenols, antioxidant capacity, vitamin C, TSS, and
acidity, negative in pH and maturity index. This pattern indicates co-accumulation of primary (sugars, ascorbate) and secondary (phenols, anthocyanins) metabolites, characteristic of pigmented berries where ripening integrates shikimate, phenylpropanoid, and ascorbate-glutathione pathways [
38,
41]. Turning showed minimum z-scores exclusively in phenols and antioxidant capacity, confirming its metabolic transition.
Vacuolar acidification in ripe fruits (pH 4.27;
Table 1) optimizes bioactive compounds under UAE. Acidic pH stabilizes the flavylium cation (predominant form at pH < 5), preventing conversion to colorless forms and maximizing chromophoric content and antioxidant activity [
36,
38]. Furthermore, the acidic environment protonates phenolic hydroxyl groups in hydroalcoholic mixtures allowing greater solubility in them and also in optimizing UAE efficiency [
14,
16]. This association between ripening physiology and extraction method enables ripe fruit to maximise all three responses at the same time (
Table 5): 120.71 mg C3G/L (+162% vs. turning), 672.46 mg GAE/100 g (+46.7% vs. turning), 5857.55 µmol TE/100 g (+63.6% vs. turning).
The findings demonstrate that C. tomentosum ripening has a progressive bioactive compound accumulation model, which was promoted via vacuolar acidification with a transient metabolic valley in turning. This pattern, along with favorable UAE conditions (57% methanol, 70% amplitude, 15 min) turns ripe fruit into raw materials for natural colorants, nutraceuticals and functional foods from Amazonian berries.
4. Conclusions
Box-Behnken optimization established UAE conditions (57% methanol, 70% amplitude, 15 min) that maximized anthocyanin yield (120.71 mg C3G/L), total phenols (672.46 mg GAE/100 g), and antioxidant capacity (5857.55 µmol TE/100 g) from ripe C. tomentosum fruits with high predictive accuracy (R² > 0.95, 2.1% deviation). Ripening from green to ripe stage triggered a 162% increase in anthocyanins and 46.7% increase in total phenols, driven by vacuolar acidification (pH 4.27) that stabilizes anthocyanin structure and enhances UAE extractability. The transitory metabolic valley at turning stage (−29.2% phenols, −34.8% antioxidant capacity) reflects biosynthetic reorganization during cell expansion, establishing an ontogenic pattern where acidification predominates over sugar accumulation. Proximate composition (90.45% moisture, 2.04% ash, 2.49% fiber, 1.70% protein) positions C. tomentosum as a hydrophilic matrix comparable to Andean berries, favoring hydroalcoholic extraction of water-soluble bioactives. These findings establish ripe C. tomentosum fruits as a promising raw material for natural colorants and functional food ingredients derived from underexploited Amazonian biodiversity.
Author Contributions
D.H-H.: conceptualization, investigation, formal analysis, writing—original draft preparation, writing—review and editing. H.M.-V.: formal analysis, writing—original draft preparation, writing—review, and editing. S.C-Q.: formal analysis, writing—original draft preparation, writing—review, and editing. L.M-C.: writing—review, and editing, validation and visualization. R.R-B.: writing—review and editing, and supervision. All authors have read and agreed to the published version of the manuscript.
Funding
This research was funded by PROINTEC-2023 (Proyectos de Investigación, Innovación y Desarrollo Tecnológico) under agreement No. 05-2023-UNJ/PCO with the Universidad Nacional de Jaén.
Data Availability Statement
Data are contained within the article.
Acknowledgments
This research was conducted with institutional support from the Universidad Nacional del Santa (UNS). The authors would also like to thank PROINTEC-2023 for its funding and Elver Peralta, a farmer, for facilitating our access to the fruits of Chondrodendron tomentosum (mountain grapes).
Conflicts of Interest
The authors declare no potential financial or other interests that could be perceived to influence the outcomes of this research. No conflict, informed consent, human or animal rights applicable.
Abbreviations
| ANOVA |
Analysis of variance |
| AOAC |
Association of Official Analytical Chemists |
| BBD |
Box-Behnken design |
| C3G |
Cyanidin-3-glucoside |
| DPPH |
2,2-diphenyl-l-picrylhydrazyl |
| FRAP |
Ferric reducing antioxidant power |
| GAE |
Gallic acid equivalents |
| MI |
Maturity index |
| RSM |
Response surface methodology |
| TA |
Titratable acidity |
| TAC |
Total anthocyanin content |
| TE |
Trolox equivalents |
| TPC |
Total phenolic content |
| TSS |
Total soluble solids |
| UAE |
Ultrasound-assisted extraction |
References
- Cañigueral, S. Plantas Medicinales y Drogas Vegetales. OFFARM 2003, 22, 161–162. [Google Scholar]
- Chondrodendron Tomentosum. Available online: https://ntbg.org/database/plants/detail/chondrodendron-tomentosum (accessed on 13 October 2025).
- Instituto de Salud Pública Curare, Pareira. 2021, 9–11.
- Atongbiik, M.; Olaide, R.; Hensel, O.; Sturm, B.; Kudadam, J. Nutritional Characteristics of Four Underutilized Edible Wild Fruits of Dietary Interest in Ghana. Foods 2019, 8, 1–12. [Google Scholar] [CrossRef] [PubMed]
- Ayuso, M.; Cruz, F.; Ramos, M.; Nicolás, N.; Ramos, M.; Rodríguez, M.; Calvo, P. Characterization and Classification of Berry (Aronia, Haskap, and Goji) Fruits with High Bioactive Value Grown in Spain. Foods 2024, 13, 1–15. [Google Scholar] [CrossRef] [PubMed]
- Feng, C.; Su, S.; Wang, L.; Wu, J.; Tang, Z.; Xu, Y.; Shu, Q.; Wang, L. Antioxidant Capacities and Anthocyanin Characteristics of the Black–Red Wild Berries Obtained in Northeast China. Food Chem. 2016, 204, 150–158. [Google Scholar] [CrossRef] [PubMed]
- Vega, A.; Rodríguez, Á.; Stucken, K. Antioxidant, Functional Properties and Health-promoting Potential of Native South American Berries: A Review. J. Sci. Food Agric. 2021, 101, 364–378. [Google Scholar] [CrossRef]
- Bozdogan, N.; Yıldız, E.; Tunç, Y.; Khadivi, A.; Yaman, M.; Sümbül, A.; Ugurtan, K.; Ates, U.; Oztürk, B. Morphological, Biochemical, and Molecular Characterizations of Rosehip (Rosa Canina, L.) Genotypes Naturally Grown in the Eastern Central Anatolia Region of Türkiye. Sci. Hortic. (Amsterdam). 2025, 350, 114375. [Google Scholar] [CrossRef]
- Ercıslı, S.; Ibrahim, H. Wild Edible Fruits: A Rich Source of Biodiversity. ANADOLU Ege Tarımsal Araştırma Enstitüsü Derg. 2017, 27, 116–122. [Google Scholar]
- Bhadange, Y.; Carpenter, J.; Kumar, V. A Comprehensive Review on Advanced Extraction Techniques for Retrieving Bioactive Components from Natural Sources. ACS Omega 2024, 9, 31274–31297. [Google Scholar] [CrossRef]
- Carpentieri, S.; Soltanipour, F.; Ferrari, G.; Pataro, G.; Donsì, F. Emerging Green Techniques for the Extraction of Antioxidants from Agri-Food by-Products as Promising Ingredients for the Food Industry. Antioxidants 2021, 10, 1417. [Google Scholar] [CrossRef]
- Athanasiadis, V.; Chatzimitakos, T.; Mantiniotou, M.; Kalompatsios, D.; Kotsou, K.; Makrygiannis, I.; Bozinou, E.; Lalas, S. Optimization of Four Different Rosemary Extraction Techniques Using Plackett–Burman Design and Comparison of Their Antioxidant Compounds. Int. J. Mol. Sci. 2024, 25, 7708. [Google Scholar] [CrossRef]
- Hong, C.; Ching, M.; Pin, S.; Ling, N. A Review on Extraction Techniques and Its Future Applications in Industry. Eur. J. Lipid Sci. Technol. 2021, 123, 1–10. [Google Scholar] [CrossRef]
- González, A.; Vázquez, M.; Espada, E.; Ferreiro, M.; Carrera, C.; Palma, M.; Álvarez, J.; Barbero, G.; Ayuso, J. Optimization of Analytical Ultrasound-Assisted Methods for the Extraction of Total Phenolic Compounds and Anthocyanins from Sloes (Prunus Spinosa, L.). Agronomy 2020, 10, 1–22. [Google Scholar] [CrossRef]
- Vázquez, M.; González, A.; Espada, E.; Ferreiro, M.; Toledo, J.; Carrera, C.; Palma, M.; Barbero, G. Ultrasound-Assisted Extraction of Two Types of Antioxidant Compounds (TPC and TA) from Black Chokeberry (Aronia Melanocarpa, L.): Optimization of the Individual and Simultaneous Extraction Methods. Agronomy 2019, 9, 456. [Google Scholar] [CrossRef]
- Fernández, G.; Pinedo, C.; Espada, E.; Ferreiro, M.; Carrera, C.; Palma, M.; García, C. Optimization of Ultrasound-Assisted Extraction of Bioactive Compounds from Jabuticaba (Myrciaria Cauliflora) Fruit through a Box-Behnken Experimental Design. Food Sci. Technol. 2019, 39, 1018–1029. [Google Scholar] [CrossRef]
- González, A.; Vázquez, M.; Espada, E.; Ferreiro, M.; Amores, A.; Palma, M.; Barbero, G.; Jiménez, A. Alternative Ultrasound-Assisted Method for the Extraction of the Bioactive Compounds Present in Myrtle (Myrtus Communis, L.). Molecules 2019, 24, 882. [Google Scholar] [CrossRef]
- Espada, E.; Ferreiro, M.; Carrera, C.; Palma, M.; Barroso, C.; Barbero, G. Optimization of the Ultrasound-Assisted Extraction of Anthocyanins and Total Phenolic Compounds in Mulberry (Morus Nigra) Pulp. Food Chem. 2017, 219, 23–32. [Google Scholar] [CrossRef]
- Justicia, M.; Madueño, A.; Ruiz, A.; Molina, J.; López, M.; Madueño, J.; Granados, J. Low-Frequency Characterisation of Mesocarp Electrical Conductivity in Different Varieties of Olives (Olea Europaea, L.). Comput. Electron. Agric. 2017, 142, 338–347. [Google Scholar] [CrossRef]
- Safy, S.; Khalifa, A.; Almashad, A.; Mohamed, A.; Hammad, E.; Sami, R.; Aljahani, A.; Pareek, S.; Helal, M.; Alharthi, S.; et al. Utilization of Jamun Fruit (Syzygium Cumini, L.) for Value Added Food Products. J. Food Qual. 4606. [Google Scholar] [CrossRef]
- McCullum, R.; Saifullah, M.; Bowyer, M.; Vuong, Q. Characteristics, Bioactives and Antioxidant Activity of Illawarra Plum (Podocarpus Elatus) Fruit. eFood 2025, 6, e70088. [Google Scholar] [CrossRef]
- Rymbai, H.; Kumar, J.M.V.; Kumar, S.; Hazarika, S.; Ercisli, S.; Kumar, V.; Sulusoglu, M. Maturity Stages Modulate Fruit Quality, Bioactive Constituents, and Antioxidant Activity of Prunus Jenkinsii. Genet. Resour. Crop Evol. 2023, 71, 1541–1555. [Google Scholar] [CrossRef]
- AOAC INTERNATIONAL Official Method 967.21: Vitamin, C. In; Official Methods of Analysis of AOAC INTERNATIONAL, 2019; pp. 21–22.
- Latimer, G.W. Official Methods of Analysis of AOAC INTERNATIONAL.; 22nd ed.; Oxford University Press, 2023. [CrossRef]
- Santos, J.; Damiani, C.; Crivelari, M.; Nunes, E.; Vilas, E. Volatile Profiling of Pitanga Fruit (Eugenia Uniflora, L.) at Different Ripening Stages Using Solid-Phase Microextraction and Mass Spectrometry Coupled with Gas Chromatography. Sci. Hortic. (Amsterdam). 2019, 250, 366–370. [Google Scholar] [CrossRef]
- AOAC INTERNATIONAL Official Method 954.01: Crude Protein. In; Official Methods of Analysis of AOAC INTERNATIONAL, 2019; p. 24.
- NTP Peruvian Technical Standard 205.003: Cereals and Legumes. Determination of Crude Fiber. In; National Quality Institute, 2011; pp. 1–5.
- AOAC INTERNATIONAL Official Method 930.09: Fat. In; Official Methods of Analysis of AOAC INTERNATIONAL, 2019; p. 24.
- Christou, A.; Stavrou, I.; Kapnissi, C. Continuous and Pulsed Ultrasound-Assisted Extraction of Carob’s Antioxidants: Processing Parameters Optimization and Identification of Polyphenolic Composition. Ultrason. Sonochem. 2021, 76, 105630. [Google Scholar] [CrossRef] [PubMed]
- Razola, M.; Aznar, M.; Guerra, E.; García, B.; Gómez, A.; Verardo, V. Establishment of a Sonotrode Ultrasound-Assisted Extraction of Phenolic Compounds from Apple Pomace. Foods 2022, 11, 3809. [Google Scholar] [CrossRef] [PubMed]
- Alvarez, E.; de la Rosa, L.; Amarowicz, R.; Shahidi, F. Antioxidant Activity of Fresh and Processed Jalapeño and Serrano Peppers. J. Agric. Food Chem. 2011, 59, 163–173. [Google Scholar] [CrossRef] [PubMed]
- Lee, J.; Durst, R.; Wrolstad, R. Determination of Total Monomeric Anthocyanin Pigment Content of Fruit Juices, Beverages, Natural Colorants, and Wines by the PH Differential Method: Collaborative Study. J. AOAC Int. 2005, 88, 1269–1278. [Google Scholar] [CrossRef]
- Pyrzynska, K.; Pekal, A. Application of Free Radical Diphenylpicrylhydrazyl (DPPH) to Estimate the Antioxidant Capacity of Food Samples. Anal. Methods 2013, 5, 4288–4295. [Google Scholar] [CrossRef]
- Castro, R.; Vásquez, C.; Gil, M.; Parra, C.; Ramos, P.; Morales, L. Evolution of the Volatile Organic Compounds, Phenols and Antioxidant Capacity during Fruit Ripening and Development of Rubus Ulmifolius Schott Fruits. Horticulturae 2022, 9, 1–13. [Google Scholar] [CrossRef]
- Murcia, A.; Ruiz, H.; Balaguera, H. Estudio Del Crecimiento y Desarrollo Del Fruto de Agraz (Vaccinium Meridionale Swartz) Bajo Condiciones de Clima Frío. Biotecnol. en el Sect. Agropecu. y Agroindustrial 2021, 19, 135–146. [Google Scholar] [CrossRef]
- Ivancic, T.; Jakopic, J.; Veberic, R.; Vesel, V.; Hudina, M. Effect of Ripening on the Phenolic and Sugar Contents in the Meso- and Epicarp of Olive Fruits (Olea Europaea, L.) Cultivar ‘Leccino. ’ Agriculture 2022, 12, 1–17. [Google Scholar] [CrossRef]
- Gomez, L.; Poblete, J.; García, V.; Vidal, R. Cauchao Berry (Amomyrtus Luma) as a Promising Source of Bioactive Compounds: Optimized Extraction, Phytochemical Characterization, and Assessment of Antioxidant and Antidiabetic Potential. Int. J. Mol. Sci. 2025, 26, 8391. [Google Scholar] [CrossRef]
- Bernal, J.; Molina, J.; Angoa, M.; Cárdenas, J.; García, I.; Ceja, J.; Mena, H. Phenolic Compound Content and the Antioxidant and Antimicrobial Activity of Wild Blueberries (Vaccinium Stenophyllum Steud.) Fruits Extracts during Ripening. Horticulturae 2022, 8, 1–17. [Google Scholar] [CrossRef]
- Agostino, M.; Sicari, V.; Giuffrè, A.; Soria, A. Blackberries (Rubus Ulmifolius Schott) from Calabria (Italy): A Comprehensive Characterisation. Eur. Food Res. Technol. 2022, 248, 905–916. [Google Scholar] [CrossRef]
- Nehring, P.; Tischer, S.; Schulz, M.; Betta, F.; Gonzaga, L.; Vitali, L.; da Silva, M.; Amadeu, G.; Oliveira, A.; Fett, R. Grumixama (Eugenia Brasiliensis Lamarck) Functional Phytochemicals: Effect of Environmental Conditions and Ripening Process. Food Res. Int. 2022, 157, 111460. [Google Scholar] [CrossRef]
- Flor, O.; Guanochanga, F.; Samaniego, I.; Arias, V.; Ortiz, B.; Rosales, C.; Palacios, H. Physicochemical Characterization and Antioxidant Capacity of Açaí (Euterpe Oleracea) in Ecuadorian Region. Foods 2024, 13, 1–20. [Google Scholar] [CrossRef]
- Sasikumar, R.; Kambhampati, V.; Kumar, J.; Paras, S.; Govindasam, K.; Jaiswal, A. Nutritional, Phytochemical, and Toxicological Profiles of Blood Fruit (Haematocarpus Validus). J. Agric. Food Res. 2025, 19, 101731. [Google Scholar] [CrossRef]
- Drăghici, A.; Pârvulescu, O.; Stan, R.; Brezoiu, A. Optimization of Ultrasound-Assisted Extraction of Phenolic Compounds from Romanian Blackthorn (Prunus Spinosa, L.) Fruits. Antioxidants 2025, 14, 1–19. [Google Scholar] [CrossRef] [PubMed]
- Kashyap, P.; Singh, C.; Jindal, N. Polyphenol Bio-Accessibility and Antioxidant Activity of in Vitro Digested Ultrasound-Assisted Meghalayan Cherry (Prunus Nepalensis) Pomace Extract. Biomass Convers. Biorefinery 2022, 13, 14071–14085. [Google Scholar] [CrossRef]
- Sousa, L.; Alves, E.; Narciso, F.; Sousa, E.; Silva, I. Optimization of Pressurized Liquid Extraction and Ultrasound Methods for Recovery of Anthocyanins Present in Jambolan Fruit (Syzygium Cumini, L.). Food Bioprod. Process. 2021, 127, 77–89. [Google Scholar] [CrossRef]
Figure 1.
Mountain grape fruits at different ripening stages.
Figure 1.
Mountain grape fruits at different ripening stages.
Figure 2.
Mountain grape morphology. (A) Liana habit showing foliage and flowers. (B) Fruit cluster at physiological and commercial maturity. (C) Lunate seed.
Figure 2.
Mountain grape morphology. (A) Liana habit showing foliage and flowers. (B) Fruit cluster at physiological and commercial maturity. (C) Lunate seed.
Figure 3.
Response surface of the effect of methanol (A) and ultrasonic amplitude (B) on (C) anthocyanin content in C. tomentosum fruits (time = 15 min).
Figure 3.
Response surface of the effect of methanol (A) and ultrasonic amplitude (B) on (C) anthocyanin content in C. tomentosum fruits (time = 15 min).
Figure 4.
Response surface of the effect of methanol (A) and ultrasonic amplitude (B) on (C) antioxidant capacity (µmol Trolox/100 g) at 15 min.
Figure 4.
Response surface of the effect of methanol (A) and ultrasonic amplitude (B) on (C) antioxidant capacity (µmol Trolox/100 g) at 15 min.
Figure 5.
Response surface of the effect of (A) methanol and (B) ultrasonic amplitude on (C) total phenol content (mg GAE/100 g) at 15 min.
Figure 5.
Response surface of the effect of (A) methanol and (B) ultrasonic amplitude on (C) total phenol content (mg GAE/100 g) at 15 min.
Figure 6.
Multi-response optimization through desirability function: optimal operating region for simultaneous maximization of anthocyanins, total phenols, and antioxidant capacity.
Figure 6.
Multi-response optimization through desirability function: optimal operating region for simultaneous maximization of anthocyanins, total phenols, and antioxidant capacity.
Figure 7.
Principal component analysis biplot of physicochemical and bioactive variables in mountain grape fruits according to maturity stage. PC1 explains 67.4% and PC2 explains 23.2% of total variability.
Figure 7.
Principal component analysis biplot of physicochemical and bioactive variables in mountain grape fruits according to maturity stage. PC1 explains 67.4% and PC2 explains 23.2% of total variability.
Figure 8.
Heatmap of z-scores of physicochemical and bioactive variables at three maturity stages of mountain grape. Red: values above mean (z > 0); blue: values below mean (z < 0).
Figure 8.
Heatmap of z-scores of physicochemical and bioactive variables at three maturity stages of mountain grape. Red: values above mean (z > 0); blue: values below mean (z < 0).
Table 1.
Morphological characteristics of mountain grape fruits at three maturity stages.
Table 1.
Morphological characteristics of mountain grape fruits at three maturity stages.
| Characteristic |
Green (index 0) |
Turning (index 1) |
Ripe (index 2) |
| Images |
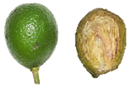 |
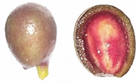 |
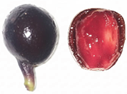 |
| Shape |
Ovoid |
Ovoid |
Ovoid |
| Epicarp |
Thin, intense green, rough |
Thin, yellowish-red, smooth |
Thin, blackish-violet, smooth, glossy |
| Mesocarp |
Pale green, firm, darkens upon cutting |
Red, semi-fleshy, slightly soft |
Garnet, scarce, juicy, soft |
| Endocarp |
Lunate seed, whitish-yellowish testa, hard |
Lunate seed, light yellow testa, hard |
Lunate seed covered with pulp, light yellow testa, hard |
Table 2.
Biometric and physicochemical parameters of mountain grape fruits at different maturity stages.
Table 2.
Biometric and physicochemical parameters of mountain grape fruits at different maturity stages.
| Parameter |
Green |
Turning |
Ripe |
p-value |
| Biometric characteristics |
| Polar diameter (cm) |
2.34 ± 0.15 b
|
2.45 ± 0.22 a
|
2.49 ± 0.17 a
|
<0.0001 |
| Equatorial diameter (cm) |
1.71 ± 0.15 b
|
1.90 ± 0.18 a
|
1.97 ± 0.14 a
|
<0.0001 |
| Weight (g) |
3.89 ± 0.86 b
|
5.24 ± 1.31 a
|
5.74 ± 1.07 a
|
<0.0001 |
| Physicochemical characteristics |
| Vitamin C (mg/100 g fresh sample) |
5.12 ± 0.01 b
|
4.78 ± 0.01 c
|
10.22 ± 0.01 a
|
<0.0001 |
| TSS (°Brix) |
7.00 ± 0.00 c
|
7.50 ± 0.00 b
|
8.83 ± 0.29 a
|
<0.0001 |
| pH |
6.28 ± 0.04 a
|
4.60 ± 0.02 b
|
4.27 ± 0.02 c
|
<0.0001 |
| Titratable acidity (%) |
0.25 ± 0.01 c
|
0.62 ± 0.02 b
|
0.94 ± 0.02 a
|
<0.0001 |
| Maturity index |
27.82 ± 0.83 c
|
12.13 ± 0.38 b
|
9.42 ± 0.49 a
|
<0.0001 |
Table 3.
Box-Behnken design and experimental responses for UAE of mountain grape in ripe stage.
Table 3.
Box-Behnken design and experimental responses for UAE of mountain grape in ripe stage.
| Methanol (%) |
Amplitude (%) |
Time (min) |
Response variables |
| Anthocyanins a
|
Total phenols b
|
Antioxidant capacity c
|
| 25 (-1) |
30 (-1) |
8 (0) |
50.50 ± 1.28 |
431.45 ± 3.74 |
3106.72 ± 91.39 |
| 25 (-1) |
50 (0) |
1 (-1) |
42.64 ± 0.64 |
372.05 ± 0.79 |
1869.09 ± 111.22 |
| 25 (-1) |
50 (0) |
15 (+1) |
64.87 ± 2.61 |
608.97 ± 3.70 |
3784.06 ± 118.17 |
| 25 (-1) |
70 (+1) |
8 (0) |
54.02 ± 1.58 |
525.86 ± 3.94 |
3491.38 ± 104.96 |
| 50 (0) |
30 (-1) |
1 (-1) |
54.45 ± 0.79 |
386.91 ± 3.34 |
2688.60 ± 115.43 |
| 50 (0) |
30 (-1) |
15 (+1) |
85.34 ± 2.64 |
576.94 ± 3.80 |
3758.98 ± 137.04 |
| 50 (0) |
50 (0) |
8 (0) |
77.38 ± 0.72 |
572.04 ± 3.51 |
3859.33 ± 148.29 |
| 50 (0) |
50 (0) |
8 (0) |
71.93 ± 1.68 |
516.29 ± 2.40 |
3725.53 ± 142.78 |
| 50 (0) |
50 (0) |
8 (0) |
77.96 ± 1.58 |
535.42 ± 3.97 |
3625.18 ± 74.98 |
| 50 (0) |
70 (+1) |
1 (-1) |
69.63 ± 1.45 |
441.83 ± 1.00 |
2872.57 ± 127.04 |
| 50 (0) |
70 (+1) |
15 (+1) |
118.58 ± 2.57 |
677.67 ± 4.12 |
5799.38 ± 155.35 |
| 75 (+1) |
30 (-1) |
8 (0) |
93.41 ± 2.15 |
538.73 ± 3.24 |
3449.57 ± 138.29 |
| 75 (+1) |
50 (0) |
1 (-1) |
66.53 ± 1.21 |
448.27 ± 1.46 |
3098.35 ± 132.38 |
| 75 (+1) |
50 (0) |
15 (+1) |
120.82 ± 1.79 |
667.21 ± 3.13 |
5581.96 ± 131.48 |
| 75 (+1) |
70 (+1) |
8 (0) |
104.36 ± 2.81 |
547.09 ± 3.32 |
4469.78 ± 156.46 |
Table 4.
Estimated regression coefficients (β), standard errors (SD), and p-values for quadratic models fitted for bioactive compound extraction and antioxidant capacity.
Table 4.
Estimated regression coefficients (β), standard errors (SD), and p-values for quadratic models fitted for bioactive compound extraction and antioxidant capacity.
| Term |
Anthocyanins (mg cyanidin-3-glucoside/L) |
Total phenols (mg GAE/100 g) |
Antioxidant capacity (uMol Trolox/100 g) |
| β |
SD |
p-value |
β |
SD |
p-value |
β |
SD |
p-value |
| Intercept |
75.755 |
– |
– |
541.251 |
– |
– |
3736.68 |
(–) |
– |
| A (Methanol) |
21.635 |
-2.179 |
0.0002 |
32.871 |
-7.196 |
0.006 |
543.55 |
-111.294 |
0.0045 |
| B (Amplitude) |
7.862 |
-2.179 |
0.0154 |
32.302 |
-7.196 |
0.0065 |
453.656 |
-111.294 |
0.0096 |
| C (Time) |
19.544 |
-2.179 |
0.0003 |
110.217 |
-7.196 |
<0.0001 |
1049.47 |
-111.294 |
0.0002 |
| A² |
−8.466 |
-6.415 |
0.2442 |
−27.183 |
-21.184 |
0.2557 |
−303.831 |
-327.641 |
0.3963 |
| B² |
8.1 |
-6.415 |
0.2624 |
−33.761 |
-21.184 |
0.1719 |
89.198 |
-327.641 |
0.7963 |
| C² |
4.387 |
-6.415 |
0.5245 |
−7.067 |
-21.184 |
0.7522 |
−2.787 |
-327.641 |
0.9935 |
| AB |
1.857 |
-3.082 |
0.5731 |
−21.512 |
-10.176 |
0.0882 |
158.884 |
-157.394 |
0.3591 |
| AC |
8.016 |
-3.082 |
0.0482 |
−4.495 |
-10.176 |
0.6771 |
142.16 |
-157.394 |
0.4078 |
| BC |
4.515 |
-3.082 |
0.2028 |
11.454 |
-10.176 |
0.3115 |
464.109 |
-157.394 |
0.0319 |
Table 5.
Experimental validation of the optimal point (57% MeOH, 70% amplitude, 15 min).
Table 5.
Experimental validation of the optimal point (57% MeOH, 70% amplitude, 15 min).
| Response |
Perdition |
Experimental |
Error (%) |
| Anthocyanins (mg C3G/L) |
122.79 |
120.71 ± 1.89 |
1.69 |
| Total Phenols (mg GAE/100 g) |
675.65 |
672.46 ± 5.84 |
0.47 |
| Antioxidants (µmol TE/100 g) |
5981 |
5857.31 ± 60.20 |
2.07 |
Table 6.
Bioactive compounds extracted under optimal UAE conditions (57% MeOH, 70% amplitude, 15 min) at three maturity stages of mountain grape.
Table 6.
Bioactive compounds extracted under optimal UAE conditions (57% MeOH, 70% amplitude, 15 min) at three maturity stages of mountain grape.
| Maturity stage |
Anthocyanins (mg C3G/L)* |
Total phenols (mg GAE/100 g)** |
Antioxidant capacity (µmol TE/100 g)*** |
| Green (0) |
0.00 ± 0.00 c |
647.83 ± 3.55 b |
5492.63 ± 54.30 b |
| Turning (3) |
46.01 ± 0.70 b |
458.86 ± 5.66 c |
3581.11 ± 39.80 c |
| Ripe (7) |
120.71 ± 1.89 a |
672.46 ± 5.84 a |
5857.55 ± 60.20 a |
|
Disclaimer/Publisher’s Note: The statements, opinions and data contained in all publications are solely those of the individual author(s) and contributor(s) and not of MDPI and/or the editor(s). MDPI and/or the editor(s) disclaim responsibility for any injury to people or property resulting from any ideas, methods, instructions or products referred to in the content. |
© 2025 by the authors. Licensee MDPI, Basel, Switzerland. This article is an open access article distributed under the terms and conditions of the Creative Commons Attribution (CC BY) license (http://creativecommons.org/licenses/by/4.0/).