Submitted:
02 December 2025
Posted:
02 December 2025
You are already at the latest version
Abstract
Climate change driven by the accumulation of greenhouse gases (GHG) in the atmosphere is projected toincrease average global surface temperatures, influencing agricultural production and nutrient cycling. Phosphorus (P), a key nutrient for plant growth, can both contribute to and reduce the effects of climate change. Climate change and P management are interrelated, as climate change will influence optimal P management while P fertilizer can both help in ameliorating and adapting to climate change effects on agriculture and the environment and contribute to direct and indirect GHG emissions. Greenhouse gases are emitted during phosphate rock extraction, as well as during the production transport and application of P fertilizer. Emissions during production could be reduced by improving energy efficiency, using alternative, non-fossil energy sources, or possibly using emerging technologies for synthesis of the ammonia used in production. To reduce the amount of indirect greenhouse gas emissions linked to P manufacture, it is important to optimize the efficiency of P fertilizer as the less P that is mined, processed, transported and applied to the field per unit of agricultural production, the less risk there is of both GHG emissions and off-site transport. While production and transport of P fertilizer can contribute to climate change, efficient P management can reduce negative effects of climate change and may contribute to reductions in GHG emissions and to climate change adaptation. Optimal P management is needed to support carbon sequestration in soil, to allow plants to benefit from increasing CO2 concentrations, to reduce risk of indirect GHG emissions, to reduce P movement to water bodies and to enhance resiliency of crops to climate stress. Proper nutrient management, including P management, plays a key role in Climate Smart Agriculture, Low-Carbon Agriculture and Sustainable Intensification, that are different approaches to encouraging optimal crop productivity while minimizing the contribution of agriculture to climate change. Managing P fertilizer in a changing environment requires use of the 4R principles to select the rate, source, timing and placement combination best suited to the site-specific agronomic and environmental conditions.
Keywords:
climate change
; greenhouse gases (GHG)
; global surface temperature
; agricultural production
; nutrient cycling
; phosphorus (P)
; P management
; P fertilizer
; phosphate rock extraction
1. Introduction
In the face of climate change and increasing global population, agricultural systems are under increasing pressure to reduce greenhouse gas (GHG) emissions while adapting to increasing weather variability. Phosphorus (P), a key nutrient for plant growth, is critical for crop productivity, soil carbon sequestration, and soil health. This review will evaluate the important role that P may play in climate change mitigation and adaption of agricultural systems.
2. How Is Climate Changing?
Climate change is characterized by an overall increase in the average global surface temperature (IPCC 2023). Global surface temperature measured between 2011 and 2020 has increased by 1.1C above that measured from 1850-1900, with the increase being higher over land than over the ocean. The rate of increase has been more rapid since 1970 than at any time in the last 2000 years. Modeling studies predict that global surface temperatures will continue to rise in the foreseeable future, with the magnitude of the increase depending on the model parameters.
Much of this increase in global surface temperature is likely due to human activity related to the emission of GHGs such as carbon dioxide (CO2), methane (CH4) and nitrous oxide (N2O) (IPCC 2023). Atmospheric CO2 concentrations are higher than they have been over the last 2 million years and concentration of CH4 and N2O are higher than anytime over the last 800,000 years. Methane and N2O are released in lower amounts than CO2 but have a global warming potential approximately 25 and 300 times greater than that of CO2, respectively ( Global-Warming-Potential-Values,2025). Based on the relation between increasing GHGs and increasing temperatures, models predict that global temperatures will continue to increase in the near term (2025-2040) since cumulative GHG emissions are almost certain to increase in the short term.
The increase in average global surface temperature has widespread effects on global climate and on natural and managed ecosystems. Local weather in any region is characterized by year-to-year variability; however, climate change increases the frequency and intensity of extreme weather events such as heatwaves, heavy precipitation, droughts, and tropical storms (IPCC 2023).
About half of the world’s population experience severe water scarcity for at least part of the year, driven in part by climate change (IPCC 2023). Increasing global temperatures will produce an intensification in the global water cycle, with greater variability leading to more very wet and very dry years (Donat et al. 2016; IPCC 2023). Climate change will also affect precipitation distribution, with precipitation likely decreasing in mid-latitude and subtropical dry regions and increasing in mid-latitude wet regions (O'Brien et al. 2021; IPCC 2023). Extreme precipitation events are likely to become more frequent and more intense, with droughts and floods both becoming more extreme. Tropical storms and extratropical storms are likely to intensify, with more frequent rain-generated local flooding. In contrast, reduced precipitation in some regions will lead to more droughts that can affect both drinking water supply and crop production, while dry conditions will also increase the risk of and forest fires.
Effects of climate change will not be equally distributed around the world and will vary from region to region (IPCC 2023) (Figure 1). For example, in the Northern Great Plains of the United States, temperatures are rising faster than in the rest of the country (O'Brien et al. 2021). Increases in temperature are more the result of higher minimum temperature during the night and winter than higher maximum temperatures (O'Brien et al. 2021). In the western part of the United States frost-free days have increased. While prediction of future effects vary based on the assumptions made, many models predict that the increased heatwave duration will be greatest in South America, South Asia and parts of Africa while drought frequency is predicted to increase more in North and South America than in Asia (Arnell et al. 2019; IPCC 2023). Sub-Saharan Africa may be particularly sensitive to increased heat and disruption of precipitation patterns (Sinore and Wang 2025).
Climate change may have a disproportionate effect on developing countries because their economies often depend more on agriculture than do those of developed countries (Fischer et al. 2005; IPCC 2023). In addition, developing countries may not have the resources needed for adaptation measures and their regions may be more sensitive to increasing climate and extreme weather events.
3. Climate Change and Agriculture
Agriculture will both be affected by and contribute to climate change. Agriculture is a major source of GHG production. About 22% of GHG emissions come from agriculture, forestry and other land use (IPCC 2023). Emissions are associated with processes such as energy use in the manufacture and transport of the inputs and equipment used in crop production, field operations, and with in-field production of GHGs such as CO2, CH4, and N2O from biological activity (Sokal and Kachel 2025). Agricultural land can also serve as a carbon sink if CO2 is incorporated into soil organic matter more rapidly than it is released.
Climate change will have a large effect on crop production, globally. Crop yields are directly affected by length of growing season, growing degree days and by temperature extremes such as frost or excess heat at critical periods. Amount and distribution of available moisture will affect crop production, with both drought and excess moisture negatively affecting yield.
Increasing CO2 may also directly and positively affect crop growth and crop yield. Effects of CO2 on plant growth has been assessed using different techniques to enrich the CO2 concentration in the atmosphere around the plant including open chambers and Free-Air Carbon Dioxide Enrichment (FACE) (Sun and Chen 2024; Ainsworth and Long 2005). Plants utilize C02 in photosynthisis, so increases in C02 can directly increase photosynthesis rate and plant growth. If plants can access higher amounts of C02 from the atmosphere, their stomata do not need to remain open as long to allow C02 uptake to optimize photosynthesis, so elevated C02 under controlled conditions has been shown to reduce stomatal conductance and transpiration, improve water use efficiency (WUE) and lead to higher rates of photosynthesis and greater light-use efficiency (Ainsworth and Long 2005; Sun et al. 2023). The benefits in improved WUE from rising C02 could help to offset negative effects of lower precipitation resulting from climate change. FACE trials also showed that elevated CO2 concentrations improved the phosphorus use efficiency (PUE) of rice (Zhang et al. 2025). The increase in PUE was related both to increased photosynthetic rate, which created a greater sink for P, and to a lesser extent, to increased soil P mineralization.
The impact of CO2 enrichment on plant growth will be affected by environmental conditions. For example, photosynthesis increased more with increasing C02 when temperatures were above 25C rather than below 25C (Ainsworth and Long 2005). Nutrient and water availability will influence the plant’s ability to respond to enhanced CO2 with increasing drought or nutrient stress decreasing possible benefits of increased C02 on crop growth (Wang et al. 2020; Gray et al. 2016).
Benefits of enhanced C02 also differ with plant species. Trees were the most responsive plants, but other fertilized C3 plants were also responsive. Increases in photosynthesis with higher C02 were greater in C3 plants than C4 plants (Ainsworth and Long 2005). Wheat and rice tended to show increased yield with increasing C02 in FACE trials, but sorghum did not. Stomatal conductance and hence potential for reduced transpiration and water loss occurred in both C3 and C4 plants (Ainsworth and Long 2005). Observed benefits from CO2 enrichment may also vary with experimental technique, with benefits being less in FACE studies than with other methods of CO2 enrichment (Ainsworth and Long 2005).
While increased CO2 enrichment may have beneficial effects on crop growth, the benefits are projected to be negated in many regions by the impacts of changing temperature and rainfall patterns. Climate change has already affected food and water security (IPCC 2023). Overall agriculture production of major crops has increased over time due to improvements in genetics, technology, and management, but climate change has slowed the rate of increase (Lobell and Field 2007). Increasing temperatures have had a negative effect on the yield of wheat, maize and barley, with yields being about 2-3% lower on average in 2002 than they would have been without changing climate.
Models and observations of patterns over the last several decades indicate that, overall, climate change will continue to have a net negative effect on global agricultural production, potentially increasing food insecurity and instability of food supply (IPCC 2023). However, the effect of climate change on agricultural production will vary regionally. Effects will depend on how climate changes in the particular location and what site-specific factors limit crop growth (Zhang et al. 2022). For example, if production in limited by low temperature and climate change leads to increased temperatures in that region, crop growth may benefit. Alternatively, if the region is moisture-limited and climate change decreases precipitation, especially at critical growth periods, crop growth will be decreased. Impacts will depend how the environment changes in relation to the growth optimum for that production system.
Negative impacts on agricultural productivity are projected to occur mainly in the mid- and low latitudes while positive impacts may occur in high latitudes (Figure 2) (IPCC 2023; Fischer et al. 2005). In the corn belt of the United States, temperature is expected to increase while moisture is expected to decrease (Urban et al. 2012). Modeling indicates that maize yield is likely to decrease overall in this region, while yield variability is likely to increase. In Mexico, particularly in arid to semi-arid regions, higher temperatures and reduced precipitation are expected to reduce yield of rain-fed maize, while irrigated maize may be less affected (López Hernández et al. 2025; Ureta et al. 2020). Crop production in Eastern Africa is also predicted to decrease, potentially making the region dependant on food aid (Bedasa et al. 2025). In Sub-Saharan Africa effects may differ regionally, but changes in precipitation patterns are likely to contribute to more drought and floods, while rising temperatures will increase heat stress, with an overall negative effect on agricultural production (Sinore and Wang 2025). Maize production in China may increase with climate change due to an increase in land area suitable for production (Xu et al. 2017). Yield per hectare is likely to increase in the northern regions of the country and decrease in the south. The higher temperatures and increased moisture predicted under climate change would be beneficial in the cooler, dryer northern areas and detrimental in the hotter, more humid southern regions of China. Overall, models indicate that cereal production in general may increase in Canada, northern Europe and Russia, but decrease in the drier Northern Great Plains of the United States, in eastern Brazil, Western Australia and many parts of Africa (Fischer et al. 2001).
As well as varying regionally, effects of climate change can also be site-specific on a landscape scale. Crop yields can be reduced by both excess and insufficient moisture (Li et al. 2019). Many fields have zones along the landscape that vary in yield in response to changes in weather. Specific areas that are prone to flooding may produce higher crop yields in dry years, while areas prone to drought may produce significantly lower yields (Martinez-Feria and Basso 2020). More frequent extremes of excess or insufficient rainfall can have a major impact on the site-specific yield variability.
Climate change can directly and indirectly influence soil degradation which can have increasing cumulative effects on crop production (Bedasa et al. 2025). Climate change and soil degradation can reinforce one another. If crop production declines because of climate change, inputs of organic matter into the soil will also decline leading to a negative effect on soil quality and productivity over time. Higher soil temperatures can also increase carbon decomposition, further reducing soil organic matter. Increased wind and water erosion associated with more frequent extreme droughts or rainfall events will also increase soil degradation. Decreasing organic matter and reduced vegetative cover will also increase susceptibility of the soil to erosion. Therefore, decreasing soil quality leads to decreasing crop yield, which reduces vegative cover and carbon inputs, further decreasing soil quality.
Climate change may also impact crop yield indirectly through effect on the weeds, diseases and insects that affect crop growth (Gregory et al. 2009). Effects of temperature changes will depend on if temperatures are moving towards or away from the optimum temperature range for the pest. Changing climate can alter the geographical distrbution of some pests, with warmer temperatures increasing the reproductive rate and winter survival of different species in cooler regions, allowing more rapid population growth and the expansion of pests into new areas (Skendžić et al. 2021). Warmer, moister conditions and greater populations of insect vectors can encourage the development of specific diseases. In contrast, in hotter regions increasing temperatures may decrease incidence of pests and diseases (Kaushik et al. 2023). Moisture and humidity can be a major driving force for plant pathogens, with greater precipitation increasing the development and spread of many plant diseases (Lahlali et al. 2024). Extreme weather events such as storms, hail, heat waves and cold snaps can increase plant stress or lead to wounding, that can increase plant susceptibility to pests and diseases.
Climate change may also impact crop quality. Water availability and temperature affect seed size, starch and protein deposition and therefore grain quality. Increasing CO2 may decrease protein in wheat while protein content may increase under higher temperature and moisture stress, but functional properties of both the protein and starch may also change (Nuttall et al. 2017).
Long-term effects of climate change will depend on the ability of the producers to adapt to changes, by changing crop type, optimizing inputs, or responding to pest infestations (Hultgren et al. 2025; Sinore and Wang 2025). Adaptation for agriculture includes a wide range of factors including crop diversification, cultivar improvements, on-farm water management and storage, soil moisture conservation, irrigation management, sustainable land management practice, sustainable intensification and use of agroecological principles and practices that take into consideration site-specific factors (IPCC 2023; Hultgren et al. 2025; Sinore and Wang 2025). Currently in the major high-yielding production zones in the world, crop systems are optimized for high average yields but not necessarily for resilience to adverse weather and climate change. While climate change will impact agricultural production, producer adaptations may ameliorate some of the effects (Hultgren et al. 2025). Practices such as changing crop or cultivar selection, fine-tuning irrigation amount and scheduling, and alteration in fertilizer management practices can help to compensate to some extent for climate change impacts. However, adaptation can be difficult for small-scale farmers because of financial and policy constraints. If climate change reduces financial returns for farmers, it may make adaptation even more difficult. Even with adaptation, global crop yield of the major staple crops is likely to decine with climate change.
4. Climate Change and Phosphorus
Phosphorus is an essential element for crop growth and an adequate supply of P is needed to support agricultural production and global food security. Climate change and P management are interrelated as climate change will influence optimal P management while P fertilizer can both help in ameliorating and adapting to climate change effects on agriculture and the environment and contribute to direct and indirect GHG emissions.
4.1. How Does P Fertilization Contribute to Climate Change?
Plants absorb phosphate as orthophosphate ions from the soil solution, and phosphate fertilizer are applied to augment the soil supply of available phosphate to optimize crop growth. Greenhouse gases are emitted during the extraction, production, transport and application of P fertilizer (Zhang et al. 2017; Wu et al. 2021).
Phosphate rock is the original source for production of most agricultural phosphate fertilizers and contains a range of apatite minerals (Chien and Menon 1995; Grant and Flaten 2019). Phosphate rock is relatively insoluble but may be used directly as a fertilizer source. It is particularly common in organic farming because it is considered a permissible organic fertilizer source, while other more soluble phosphate fertilizers are prohibited. The solubility and effectiveness of rock phosphate as a fertilizer varies, depending on its composition and particle size and on the characteristics of the soils and crops where it is used.
The common commercial phosphorus fertilizers are produced from rock phosphate treated with acid to increase its solubility and so make it more plant available. Impurities are removed through beneficiation and the ore is ground and reacted with acid to form phosphoric acid that is used directly, or more commonly as a step in the production of other less corrosive products (Grant and Flaten 2019). Commercial phosphate fertilizers include single superphosphate, triple superphosphate, monoammonium phosphate, diammonium phosphate, ammonium polyphosphate and a wide range of other specific formulations.
Most GHG emissions associated with phosphate fertilizers occur due to consumption of fossil fuels during the various stages of phosphate fertilizer production (Wood and Cowie 2004). Much of the net emission is related to phosphoric acid production, when C02 contained in the phosphate rock is released. Production of phosphoric acid uses sulphuric acid in the initial step but since much of the sulphur used is recovered from natural gas and fuel oil production, there is no additional GHG generated due to sulphur mining. Production of the sulphuric acid from sulphur is exothermic and may generate a net energy export that can be classified as an emissions credit if production plants can take advantage of the energy surplus (Abumounshar et al. 2021). Calculated emission factors for phosphate fertilizers vary widely, but emission factors for production are usually around 1–1.5 kg CO2-eq./kg of P2O5 (Walling and Vaneeckhaute 2020). Emissions for ammonium phosphates tend to be higher than for super phosphates because of the need for ammonia in the production process (Walling and Vaneeckhaute 2020). In studies in China, emissions from calcium superphosphate were lower than from triple superphosphate or calcium magnesium phosphate (Wang et al. 2017). Emissions during production could be reduced by improving energy efficiency, using alternative, non-fossil energy sources, or possibly using emerging technologies for synthesis of the ammonia used in production.
Transport of raw materials, intermediary products and finished product comprises a considerable amount of the total emissions. Therefore the transport distance and mode of transport have an impact on net emissions (Wood and Cowie 2004).
To reduce the amount of indirect greenhouse gas emissions linked to P production, it is important to optimize the efficiency of P fertilizer use (Gong et al. 2022). The less P that is mined, processed, transported and applied to the field per unit of agricultural production, the less risk there is of both GHG emissions and off-site transport of P. While many regions of the world are operating at a negative P balance, excess P application can lead to P-surplus on cropland particularly in areas of intensive agricultural production in Asia and North America (MacDonald et al. 2011). Assessment of global PUE, including fertilizer and manure inputs, offtake in crops, losses to the environment and accumulation of P in the soil shows that global PUE decreased from 1961 to the 1980s, then began to increase to 2019 (Zou et al. 2022). The PUE tends to be highest in high GDP countries that can afford effective P management practices and in low GDP countries where applications of P are below those required to optimize crop production. Higher fertilizer prices encourage producers to use P more efficiently.
Recovery of P from manure and wastewater streams and it reuse as fertilizer would have dual benefits of reducing energy consumption and GHG production during fertilizer production and transport and reducing the risk of P movement to water (Cordell et al. 2011). However, the life cycle costs of P recovery in terms of GHG production also need to be assessed.
4.2. How Will Climate Change Affect Phosphorus Cycling?
Phosphorus limitations to crop growth occur in both tropical and temperate soils (Menge et al. 2023) (Figure 3) (Lucas et al. 2023). Changes in P inputs, losses and internal cycling can have a major impact on P availability, both in natural and managed ecosystems.
Unlike nitrogen, gaseous forms of P are not relevant in P cycling (Smil 2000). The P that is available for plant growth originally comes from P-containing minerals and when soluble P is in the soil solution, it will interact with soil minerals to become less plant-available over time (Menge et al. 2023; Syers et al. 2008). Climate change will impact the global transport of P and the chemical and biological reactions of P in the soil, thus influencing P cycling, availability and losses. If climate change affects the balance between P supply and P demand, it will influence P available for crop production.
The two main natural inputs of P into ecosystems are atmospheric deposition and rock weathering, although flooding can also deposit P in a local area (Menge et al. 2023). Dust from Northern Africa produces about half of all dust worldwide. Large amounts of dust from Africa move to the Southeastern USA, Caribbean and South America (Prospero and Lamb 2003). Deposition of P from dust will contribute a large proportion of the P input into weathered soils, such as those in the Amazon basin and the Congo basin. Dust transport increased in the 1970s due to drought in the Soudano-Sahel (Prospero and Lamb 2003). Dust production is inversely related to prior year rainfall, and poor crop growth and overgrazing increase the problem. However, most dust comes from largely uninhabited areas of North Africa and is not directly related to agricultural practices. Dry conditions in the area of origin increases dust movement in part because of reduced vegetative cover. Once dust is in the air, increased precipitation increases the rate of deposition. Biomass burning from fires can also contribution to P deposition. Changes in precipitation or in the atmospheric circulation patterns will influence both the amount of dust generated and the amount and distribution of deposition.
In younger, less-weathered soils, release of P from rock weathering is a primary source of natural P. Climate change will affect soil temperature and precipitation on a site-specific basis. This will affect the chemical weathering of rocks with the net effect determined by the time scale involved (Goll et al. 2014). Chemical weathering is expected to increase from climate change, especially in mid-latitute to high-altitude regions. Weathering increases with increasing temperature and moisture, so there is less primary P remaining in soils that developed in warmer and wetter regions where the P has been depleted over time (Menge et al. 2023). Observational studies along gradients capture the long-term effects of moisture and show that increasing moisture leads to greater weathering and lower primary and labile P, but higher secondary, occluded, microbial and soil organic P (Menge et al. 2023). High precipitation also lowers pH which lowers primary P reserves. In the long-term, soils that were warmer historically also had lower primary mineral P because of greater weathering and lower plant-available P because of the P depletion from long-term weathering.
In contrast to the long-term process of weathering of primary materials during soil formation, P availability over the scale of decades and shorter is mainly controlled by within-system P cycling (Menge et al. 2023). Within natural systems, release and uptake of P from plants, microorganisms and soil organic matter as well as sorption and desorption of P from mineral forms determine P availability. In cold and temperate environments when water is not limiting, short-term warming can increase biological activity. This warming enhances mineralization and nutrient cycling,leading to greater nutrient release and availability for plant uptake (Sardans and Peñuelas 2012; Schoumans et al. 2015). Soil warming can therefore increase the concentration of plant-available P in temperate soils (Seidel et al. 2021). However, the net effect of short-term soil warming can vary depending on the complex site-specific interactions in effects on mineralization, sorption/desorption and biological activity (Menge et al. 2023). Similarly, changes in moisture can also influence biological activity and chemical process in the soil. Experimental studies that impose changes on a system often show that wetter treatments have higher primary and labile P and lower microbial P (Wood et al. 2016; Zhang et al. 2020; Menge et al. 2023). Increasing moisture increases available P in the short-term, therefore drought will decrease and optimal moisture increase P under moisture limited condition.
4.3. How Will Climate Change Affect P Losses to the Environment?
Phosphorus in natural systems is removed from the soil through leaching, run-off, and by wind and water erosion, while in agricultural systems, P offtake in the harvested crop is a major export pathway. Net losses of P through leaching and run-off are usually small relative to internal cycling, but these small P losses can have a large effect on water systems.
The greatest environmental concern associated with P losses is eutrophication resulting from P movement to water, particularly in freshwater systems. In freshwater bodies, P is normally the most commonly limiting nutrient, so even a small amount of additional phosphorus moving into the water body and increasing the P concentration in the water will increase plant growth and potentially lead to eutrophication (Jeppesen et al. 2007; Chambers et al. 2001; Schindler et al. 2008; Wilander and Persson 2001). Eutrophication has significant social costs, including ecological, economic, recreational and health effects (Gourevitch et al. 2021). Eutrophication will not only affect water quality, it will also influence GHG emissions from fresh water (Li et al. 2021). As organic mater in the water and sediments increase, emissions of CO2 and CH4 will also increase. Therefore the increase in organic matter production associated with eutrophication can lead to increased GHG production.
In freshwater systems, the growth of algae will largely depend on the concentration of P in the water, which is a function of climatic conditions such as rainfall and temperature, the amount, timing and bioavailability of the nutrient load, the rate of input of nutrient-rich water compared to the volume and output of the lake (flushing rate) and the depth of the lake (Chambers et al. 2001; Chambers et al. 2008). If a lake is rapidly flushed, its concentration will reflect the concentration in the in-flowing waters, while a slowly flushing lake will have a P concentration that is more controlled by sedimentation. Even if a lake has a low overall P concentration, there may still be problems in specific areas near the shoreline where channels, streams and rivers discharge nutrients and dilution is limited. Phosphorus effects in a lake can persist for many years after external loading has been reduced (Gourevitch et al. 2021).
The amount of P that will move from the field and its impact on a water body can be described by the P transfer continuum, which is related to the source of P, its mobilization for movement, its delivery or transportation to the water and the biological impact that it will have on the waterbody (Figure 4) (Haygarth et al. 2005). Phosphorus movement will therefore be a function of the P concentration near the soil surface, its ability to move mobilized in particles or solution, and the degree of transport (Sharpley 1995; McDowell et al. 2001b). The potential for P movement from agricultural land to water will be high in areas where soil test P is high, the ability of the soil to retain P is low, susceptibility to runoff is high, soil erosion is high, and water from the field can easily move offsite to sensitive waters through natural or artificial drainage (Van Bochove et al. 2006).
Much of the potential for P movement to water is related to excess manure application in conjunction with intensive livestock operations, since it is often not feasible to transport manure the distances required to apply only agronomically P desirable rates (Lucas et al. 2023). High rates of P in a mobile form can remain at the soil surface and be subject to run-off, while the labile organic forms may be subject to leaching.
Leaching of P is not normally a major transport path but may occur on soils with very low P sorption capacity, on soils where there is a large amount of macropore flow, or if soil test P is very high from application of organic wastes to sandy soils or acid organic soils. Labile organic forms of P are more prone to leaching than are inorganic P forms (Campbell and Racz 1975). If conditions conducive to leaching occur in tile-drained land, the risk of subsurface drainage losses of P into surface water may be high (King et al. 2015).
Phosphorus moving into water systems will be affected by climate change (Ockenden et al. 2017; Wang et al. 2021; El-Khoury et al. 2015; Forber et al. 2018; Apostel et al. 2025; Costa et al. 2022; Mumbi et al. 2025; Jennings et al. 2009) through its effects on precipitation, P cycling and crop growth. The net effect of climate change on P movement to water systems will depend on local lithological and climatic conditions and the time scale involved.
It is predicted that climate change will contribute to increasing frequency and magnitude of intense precipitation events (Liu et al. 2020). Increases in the frequency, amount and intensity of precipitation can increase the risk of surface run-off which can carry P from the field and to water bodies (Ockenden et al. 2017; Lucas et al. 2023; Donat et al. 2016; Liu et al. 2020). The amount of precipitation that comes from extreme events will almost double with each degree of warming (Lucas et al. 2023). Extreme precipitation events will increase the movement of dissolved and particulate P off-field, particularly if P concentration at the soil surface is high because of P fertilization or manure applications structure (Ockenden et al. 2017; Lucas et al. 2023; Skidmore et al. 2023). Off-field movement may be increased if drought has reduced the vegetative cover protecting the soil surface or produced crusting or poor soil structure (Ockenden et al. 2017; Lucas et al. 2023; Skidmore et al. 2023).
Increases in P movement to water bodies will vary regionally, with the greatest losses occurring in wet regions where P inputs are high (Liu et al. 2020). However, the largest proportional increase from moderate to high precipitation years is likely to occur in dry regions. Dilution of the P in run-off due to high water volumes can decrease the impact of the increase in losses. Similarly, decreases in labile P in the soil can decrease P movement to waterways. For example, a modeling study in the Lake Erie region in Canada predicted that climate change would lead to increases in corn and soybean yield and an increase in P movement in surface run-off but a decrease in P loss through subsurface tile drainage (Wang et al. 2021). The projected decreases in labile P due to greater crop uptake outweighed the increase in runoff volume and led to a reduction in P losses.
The direct effect of increasing temperature on P losses appears minor, but some effects may occur through changes in evapotranspiration (Lucas et al. 2023). In addition, freeze-thaw cycles in regions such as the Canadian prairies, where much of the P loss is associated with movement of dissolved P released from vegetation during snowmelt, may also influence P movement (Lucas et al. 2023; Jensen et al. 2011). Effect of increased P on eutrophication may also be affected by climate change, since warmer summer temperatures can lead to higher water temperatures and greater thermal stratification within lake that may increase algal growth (Gourevitch et al. 2021). Sustainable phosphorus management practices aim to ensure this vital nutrient supports terrestrial ecosystems while also preserving the health and balance of freshwater resources.
5. Sustainable Phosphorus Management to Address Climate Change Concerns
Phosphorus management in agricultural systems can have direct and indirect effects on climate change and climate change effects. Ensuring optimum P management can reduce negative effects and may contribute to reductions in GHG emissions and to climate change adaptation.
5.1. Sustainable P Management to Encourage Carbon Sequestration
Agriculture in the future must address two goals – food security and climate change mitigation. While agriculture is a contributing factor for GHG and climate change, it can also be part of the solution. Crop production relies on the harvesting of CO2 from the atmosphere and its conversion to carbohydrates via photosynthesis. Carbon sequestion occurs by the assimilation of carbon into organic matter. Increasing the assimilation of CO2 from the atmosphere and its storage in soils can sequester CO2 as soil organic matter, both mitigating GHG and improving soil quality (Lal et al. 2015). The soil is a large carbon sink and can sequester a significant amount of carbon (Sun and Chen 2024). In particular, restoration of degraded soils by adoption of soil conservation practices and increased input of organic matter may decrease the emissions of GHG, enhance carbon sequestration, and improve soil productivity and resilience to stresses that result from climate change (Bayu 2020).
The amount of carbon sequestered in the soil is proportional to the amount of biomass produced and returned to the soil (Ni et al. 2025). Production of biomass relies on the availability of adequate nutrients to support plant growth. Phosphorus is a limiting nutrient for crop production in many agricultural soils globally (Zou et al. 2022). In many environments, P is the primary limiting nutrient, so for increased CO2 to increase plant growth, there must be an adequate supply of P available to support plant growth.
Many studies have demonstrated an increase in carbon storage with improved P fertilization. Long-term P fertilization of grazed pastures, for a total input of 380 kg P ha-1 over a 20-year period, led to an increase in soil carbon to a depth of at least 60 cm (Coonan et al. 2019). In a 20-year study with maize grown in summer and wheat grown in winter, P fertilization increased plant biomass production and increased soil organic carbon measured after wheat growth (Ortas and Bykova 2020; Ortas and Lal 2012). Numerous other studies also showed that biomass production and soil carbon storage both increase in the long-term when balanced fertilization including P is applied to crops on P-deficient soils (Ni et al. 2025; Brar et al. 2013; Grant et al. 2020). In a meta-analysis of effects of P fertilization on carbon cycling, P fertilization consistently increased carbon cycling, including above- and below-ground biomass, microbial biomass carbon and soil organic carbon (Sun and Chen 2024). However, effects were dependent on background soil P, with positive effects occurring where soil P levels were low. If P concentration in the soil is above a threshhold level, efficiency of P fertilizers in increasing crop production and carbon sequestration decreases. Similarly, another meta-analysis of trials across China showed that addition of mineral fertilizers increased carbon sequestration in a range of crops, with both NPK and P providing benefits in terms of carbon storage (Zhao et al. 2017). Two other meta-analysis of global studies showed that fertilization in general increased soil organic carbon over time, with balanced fertility including P having the greatest benefit (Liu et al. 2023; Tao and Liu 2025). Therefore, optimizing crop production through balanced nutrient inputs, including P, is important for carbon sequestrion.
5.2. Managing Phosphorus Supply to Take Advantage of CO2 Increases
As mentioned previously, increases in atmospheric CO2 can increase crop growth, however optimum crop growth requires an adequate supply of available nutrients, including P. Phosphorus availability limits biological CO2 fixation in many ecosystems. A decline in the observed CO2 fertilization effect has been observed since 1982 and may be due to limitations in supply of N and P (Wang et al. 2020). Phosphorus deficiency will reduce the biological response to CO2, so if P is limited the plants are less able to benefit from increasing CO2 (Terrer et al. 2019; Jiang et al. 2020). Therefore, balanced fertilizer management with adequate inputs of P is important to take advantage of any possible plant growth benefits from increasing atmospheric CO2 levels.
Atmospheric CO2 concentrations may also directly affect P dynamics. Increasing CO2 leads to stomatal closure which can decrease transpiration and decrease uptake of nutrients. Increasing CO2 tends to decrease P concentration in plant tissues due to a dilution effect from higher biomass production (Sardans and Peñuelas 2012; Jiang et al. 2020). This will decrease P removal per unit yield and should be considered when planning fertilizer management systems. Interactions with mycorrhizal associations may also influence the CO2 and P response (Jiang et al. 2020; Terrer et al. 2019).
5.3. Phosphorus Management to Reduce Indirect Greenhouse Gas Emissions
Optimization of nutrient balance can increase efficiency of use of other nutrients, especially N, that can contribute to GHG production. Global food production can increase either by increasing the amount of land cultivated or by intensification of cropping to improve crop yield from land that is already under production (Burney et al. 2010). Both land use change and increased inputs into agricultural production can increase GHG production. The GHG emission related to agriculture includes direct emission of N2O and CH4 from production of rice. Rice studies showed that CH4 emission was higher from plots where only N was applied as compared to plots with balanced fertilization (Datta et al. 2013). Application of P fertilizer and combined NPK applications also reduced methane emission from the soil relative to grain yield. Nitrogen application alone led to high methane production. On alpine grasslands in China, application of NP fertilizers increased CO2 and N2O emissions but reduced CH4 emissions (Wang et al. 2018).
Emissions also occur from energy use in the production of fertilizers and other inputs and from production and operation of farm machinery. Tillage can also increase CO2 emissions when soil organic matter mineralizes. Intensification of production in a sustainable manner, using precision farming, incorporation of crop residues, reduced tillage and effective nutrient and water management can reduce GHG production per unit of production and would produce less GHG than expansion of farm area to maintain food production (Burney et al. 2010).
Phosphorus can also influence indirect GHG emissions through its effects on eutrophication (Li et al. 2021). As outlined prviously, P is frequently the limiting factor for growth in freshwater systems, so increasing P movement into waterbodies will increase organic matter production and eutrophication. As organic matter in the water and sediments increase, emissions of CO2 and methane will also increase. Therefore the increase in organic matter production associated with eutrophication can lead to increased GHG production. Reducing P movement to water systems is an important step in reducing indirect effects of P on indirect GHG emissions.
5.4. Phosphorus Management to Reduce P Movement to Waterbodies
Increased risk of P movement to waterbodies may be a consequence of climate change, as discussed previously. Phosphorus movement to water increases with increasing concentration of P at the soil surface and increasing movement of P through erosion, run-off or leaching. Therefore, management practices should aim to reduce the concentration of P at the soil surface and to reduce the movement of particulate or solution P (Mumbi et al. 2025; Skidmore et al. 2023; Apostel et al. 2025; Liu et al. 2025). Conservation practices to reduce P loss include those that reduce P susceptible to movement such as reducing surface P concentration, as well as practices such as no-till or cover crops that control the movement of dissolved or particulate P and practices such as buffer strips that trap P before it enters the waterway (Skidmore et al. 2023; Liu et al. 2025; Kleinman et al. 2022). However, there may be trade-offs among these practices. For example, no-till may reduce particulate P movement but may increase the movement of soluble P that leaches from plant tissue left on the soil surface. Buffer strips may trap particulate P, but may release soluble P into water from the plant material especially during freeze-thaw cycles (Kleinman et al. 2022). The overall effectiveness of control practice must be assessed on a long-term, site-specific basis. Climate change may alter the relative performance of the conservation practices in a particular region (Kleinman et al. 2022).
Proper site-specific P management will play an important role in reducing the risk of P movement to water bodies under changing climate conditions. Fertilizer applications can be a major source of P input into farming systems and a large potential source for P movement into water systems (Yates et al. 2012; Mumbi et al. 2025). However, the amount of P lost from the system will not necessarily relate directly to the amount applied because much of the P applied will be retained in the field through adsorption or precipitation or be utilized for crop uptake. Proper 4R fertilizer management practices that increase the proportion of applied P taken up by the crop or retained within the field will be important in ensuring that losses from the field to water bodies are minimized (Skidmore et al. 2023).
Fertilizer application rates that are closely matched to crop demand should be used to minimize the risk of P runoff and the risk of excess accumulation of P over time (Wiens 2017). Rates of P application matched to crop uptake will help to reduce accumulation of plant-available P in the surface soils (Wright et al. 2006; Sawka 2009; MacDonald et al. 2011). Increasing P concentration at the soil surface will increase the risk of P loss (McDowell et al. 2001a; Sharpley et al. 1994; Little et al. 2007). Therefore, practices that significantly increase the soil test phosphorus values at the soil surface are likely to increase the potential of P runoff. Managing P concentrations with fertilizer applications closely related to agronomic optimum concentrations based on soil tests can help to avoid excessive concentrations of available P and reduce the risk of P loss. In addition, increasing the rate of P fertilization above agronomic optimum concentrations can lead to luxury consumption of P by the crop, increasing the concentration of P in the crop tissue. Higher P concentration in the vegetative material in contact with runoff water can increase the amount of P leached and the amount of P movement. Again, matching P applications with crop demand can reduce the risk. Therefore, once optimum agronomic concentrations of soil test P are achieved, P fertilizer rate should be proportional to crop removal. Where soil P concentrations have been increased to high levels, for example due to long-term application of livestock manure, the impact of legacy P may prolong the movement of P from the field to waterbodies, delaying the observed benefit of control measures (Liu et al. 2025). In certain cases, application of P rates below crop removal can deplete legacy P over time.
Potential for P loss increases if P fertilizers are applied at the surface. In-soil banding of P below the surface will reduce the potential for P loss by placing the P in a position where it is protected from runoff (Carver et al. 2022). Phosphorus is relatively immobile in the soil and so remains near the site of fertilizer placement unless disrupted by tillage (Grant and Lafond 1994; Selles et al. 1999; Weiseth 2015). Banding will leave the P fertilizer in a zone that is not directly in contact with runoff water, reducing the potential for P movement. In studies that evaluated 30 minutes of runoff using runoff boxes, injecting the fertilizer even 1 cm below the soil surface reduced P losses from monoammonium phosphate fertilizer (MAP) by 98% as compared to broadcasting the fertilizer and leaving it at the soil surface (Smith et al. 2016). Placing the P in a concentrated band near the seed-row can also increase fertilizer use efficiency and reduce the rate of P required for optimum crop yield. Band placement of P reduces contact with the soil and should result in less P retention than broadcast application, thus increasing fertilizer use efficiency (Tisdale et al. 1993).
If P fertilizer cannot be in-soil banded, incorporation of broadcast fertilizer will minimize the potential for P movement by reducing the concentration of P at the soil surface. In field studies in Indiana, disking in diammonium phosphate fertilizer (DAP) reduced soluble P losses as compared to unincorporated DAP, but sediment loads were higher from disked DAP (Smith et al. 2017). Similarly in Kansas, incorporation of liquid P fertilizer through field cultivation prior to planting reduced P runoff (Janssen et al. 2000). Incorporation of P fertilizer will increase the contact between the fertilizer and the soil, increasing retention through precipitation and adsorption reactions and reducing the proportion of soluble P present that is subject to direct dissolution and movement in runoff water (Hansen et al. 2002). Soils with a high capacity for P retention will be less at risk for P loss than soils with a low retention capacity. Due to the challenges of losing soluble fertilizer P when broadcast P is not incorporated or losing soil P by erosion when broadcast P is incorporated, P fertilizer should not be broadcast in areas that are prone to runoff.
Timing of P application can also have a large effect on losses. Large P losses can occur where large rainfall events or runoff in general follow quickly after surface P application (Mumbi et al. 2025). However, P enrichment of runoff from soluble P fertilizers rapidly declines with time after fertilizer application (Shigaki et al. 2006). Risk of loss can be decreased by avoiding P applications immediately prior to expected rainfall events or during very wet periods, particularly if the P is broadcast. Application of P during prolonged droughty periods can lead to short-term increases in surface soil P that can be mobilized upon rewetting. Furthermore, in areas where cold winters and frozen soil restrict the soil’s capacity to retain fertilizer P, fertilizer P should not be applied in late fall, or on frozen soil. For example, studies at Swift Current, Canada broadcasting P in the fall on summer fallow without incorporation, a situation that would encourage P runoff, led to losses of about 9.8% of the fertilizer applied (Nicholaichuk and Read 1978). In studies in Ontario, fall broadcast and shallow incorporation of P fertilizer increased the water-extractable P concentration at the surface, increasing the risk of P release to runoff events immediately after P application (Lozier et al. 2017).
When considering the range of best management practices for P fertilization, it is important to identify the major pathways for P movement at a given site, before recommending or adopting specific management practices to address the problem (Salvano et al. 2009; Sims et al. 1998). Optimum 4R nutrient stewardship practices to reduce P runoff should concentrate on matching P application rates to crop demand, ensuring that P concentrations in the surface soil are managed to avoid excess accumulation, placing P fertilizers below the soil surface and timing applications to avoid P fertilizer remaining at the soil surface during the snowmelt period or immediately prior to rainfall events. It is also important to consider that most of the P loss will generally occur from a small area of the watershed and practices that reduce potential for P movement in those sites are likely to have the greatest benefit on water quality (Sharpley et al. 2011). Within a field, P tends to accumulate in lower-slope and depressional areas where water movement is concentrated (Wilson et al. 2016; Letkeman et al. 1996; Roberts et al. 1985). Reducing or eliminating P application on those sites could reduce the potential for P movement off-field, without impairing crop yield potential.
While the majority of P losses from agricultural fields are by runoff, P can also be lost by leaching and subsurface flow (McDowell et al. 2001b; King et al. 2015). Risk of P leaching can occur with water movement through sandy, light-textured soils, soils with a low P retention capacity, waterlogged soils where reducing conditions mobilize P, organic soils or soils with high manure loading, and soils where there are preferential flow paths, such as root channels, earthworm channels, or cracks in the soil structure. With tile-drained systems on soils that are prone to P leaching, the risk of subsurface drainage losses of P may be high (King et al. 2015). Again, management practices that reduce P concentration in the soil will reduce the risk of P leaching.
5.5. Phosphorus Management to Enhance Resilience of Crops to Climate Stress
Balanced fertilization is an important step to increase resiliency of crops to climate stress. For example, in Nigeria, low soil fertility is a major issue, with N being most limiting and P second most limiting. A modeling study assessed the impact of N and P management on maize crops in interaction with climate change in Nigeria (Tofa et al. 2023). Maize yield was predicted to decrease with increasing temperature and decreasing moisture under climate change, but the negative effect on yield was ameliorated to some exent with proper P applications. In some situations, yield declined with increasing N applications alone, but not when N was applied with adequate P.
Some of the benefits of nutrient management in ameliorating crop stress due to climate change are from a general improvement in crop vigour. A healthy, vigorous crop will be able to resist drought and temperature stress and combat pests such as weeds, insects and diseases. However, there are also specific mechanisms by which P management can increase the ability of a crop to resist stresses induced by climate change.
Increasing temperatures under climate change will affect plant growth, with the impact on productivity depending on how temperature deviates from the physiological optimum (Mishra et al. 2023). Plants have an optimum temperature range for growth and temperatures above or below that range will reduce productivity (Aziz et al. 2023). Where crop growth is limited due to low temperatures or a short growing season, increasing temperature under climate change may improve crop productivity. However, if seasonal temperatures, particularly during sensitive growth stages, are increased above the optimum, crop yields may be reduced. Heat stress can reduce the photosynthetic activity of plants, impair nutrient uptake and water relations, and lead to production of harmful reactive oxygen species (Aziz et al. 2023; Mishra et al. 2023). Reproductive processes such as pollen germation and fertilization are particularly sensitive to temperature. With increasing global temperatures there is an increased risk of high temperatures during critical growth periods such as flowering and seed filling (Aziz et al. 2023). Heat stress may impair root growth and possibly membrane nutrient transporter function, restricting the ability of a plant to access P (Mishra et al. 2023). An adequate P supply would be important to maintain crop growth. In soybean, seed weight and yield were reduced by heat stress after flowering when P was deficient but sufficient post-flowering P ameliorated the harmful effects of heat stress on photosynthesis and allowed the soybean to maintain yield (Laira et al. 2023).
Climate change is predicted to increase variability in precipitation, potentially increasing frequency of both drought and excess moisture (IPCC 2023). Phosphorus deficiency can delay plant development and maturity, making the crop more susceptible to late season moisture stress (Meier et al. 2021; Gutiérrez-Boem and Thomas 1998). Phosphorus fertilization can decrease the negative effects of drought, allowing the plant to better maintain yield under low moisture conditions. Cotton plants that were supplied with P were less sensitive to water stress than plants that were deficient in P (Radin 1984). Similarly, application of P fertilizer increased the ability of wheat to cope with mild water stress (Gutiérrez-Boem and Thomas 1998). Application of P also reduced the effects of drought stress in clusterbean (Burman et al. 2004) and white clover (Singh et al. 2000b).
Application of P can improve crop yield under drought stress through several different mechanisms (Suriyagoda et al. 2014). Optimum P availability will increase both shoot and root biomass, increasing the ability of the plant to both photosynthesize and to explore the soil for water and nutrients (Khan et al. 2023; Bechtaoui et al. 2021; Epie and Maral 2018). Application of P fertilizer to tobocco plants increased growth and root activity under conditions and also increased rooting under dry conditions decreasing the negative effects of drought (Begum et al. 2020). Similar effects were seen in wheat (Meier et al. 2021). Phosphorus application increased soybean root length and root surface area under drought conditions which could increase the ability to adapt to water stress by increasing water uptake during reproduction (He et al. 2019). Phosphorus fertilization increased root biomass of seedlings of the tree P. shennan under drought-stressed conditions, increasing their ability to extract water from the soil (Tariq et al. 2017).
Root distribution through the soil profile is also important for water use efficiency (Lynch 2013). Under low P environments, plants tend to have a greater proportion of roots in surface soils where P is concentrated and may proliferate roots in areas of high P concentration (Strong and Soper 1974b, 1974a; Lynch and Brown 2001). However, shallow rooting to better access P may come at the expense of deep rooting that can increase the ability to extract water from the soil (Lynch 2022; Lynch 2013; Lynch and Brown 2001). Phosphorous fertilizer can increase root growth to depth, allowing the plant to extract water from a greater volume of soil and from deeper soils that tend to dry out more slowly than surface soils (Hansel et al. 2017; Jin et al. 2015). Therefore, part of the benefit of P fertilization is in producing a more vigorous, well-rooted plant with a greater ability to access and utilize the water present in the soil. For example, high-P white clover plants were able to extract more water from a drying soil than were low-P plants (Singh et al. 2000b) with the same pattern seen for a range of other plants evaluated in a meta-analysis (Suriyagoda et al. 2014). While part of this increased extraction may relate to root volume and distribution, other P responses may also be important in mitigating negative effects of drought.
Phosphorus fertilization may create specific physiological benefits that allow a plant to resist drought conditions. Stomata are the pores on plant leaves that allow the entry of the CO2 required for photosynthesis. However, water vapor also moves through the stomata, leading to transpirational loss of water. Drought-tolerant plants are able to control stomatal opening to reduce tranpirational water loss (Singh et al. 2000a). For example, under water stress, chickpea plants reduce the number and conductance of stomata to reduce transpiration and conserve soil moisture (Chtouki et al. 2022). The guard cells surrounding the stomata swell to open and shrink to close the stomata, with the swelling and shrinking occurring in response to changes is osmotic pressure in the cell (Daszkowska-Golec and Szarejko 2013). The stomata open and close in response to environmental and physiological signals to control stomatal aperature and gas exchange (Daszkowska-Golec and Szarejko 2013). High levels of CO2 encourage stomatal closure. Abiotic stress triggers a network of responses, including the production of abscisic acid (ABA) that closes the stomata. Under drought stress, concentration of ABA in the cell increase, inducing ion efflux and reduction of sugar uptake by the guard cells, causing them to shrink and close the stomata.
A balance is required under dry conditions between maintaining sufficient gas exchange to allow photosynthesis and reducing transpiration loss of water. Maintaining water conductance can allow photosynthesis to continue under stress, while decreasing stomatal conductance may be important in conserving moisture, particularly when CO2 is high. Water use efficiency, in terms of biomass production per unit of water used, will depend on the balance between allowing gas exhange to support photosynthesis and controlling transpiration to conserve moisture.
Phosphorus can play a role in affecting stomatal closure, influencing tranpirational flow and gas exchange. There are some contradictory results in the literature in terms of the effects of P management on stomatal function under water stress with some studies finding increases in stomatal conductance and transpiration rate with P application (Radin 1984) while others show decreases (Singh et al. 2000a).
The effect of P on drought tolerance will depend on the overall impact on gas exchange, moisture loss, net photosynthesis and dry matter production, which combine to determine water use efficiency. If P is limiting, stomatal density, size and aperture can decrease, reducing uptake rate of CO2 and decreasing photosynthesis (Khan et al. 2023). Adequate P and enhanced CO2 interact to reduce drought stress by decreasing stomatal conductance.
In studies with white clover, rates of transpiration decreased and leaf dry mass per unit leaf area increased with increasing P (Singh et al. 2000a). High P plants therefore had a lower leaf dry mass per unit leaf area and a lower tranpiration rate per unit leaf area. Total water uptake and water use efficiency both increased with P fertilization because there was a greater reduction in transpirational loss of water with P application in proportion to the decrease in dry matter assimilation. Under dry conditions, abscisic acid increased with P fertilization and the improved drought tolerance with increasing P was related to lower transpirational losses per unit leaf area. Phosphorus also affected stomatal production and function in field pea, with increasing P increasing water use efficiency and stress tolerance (Jin et al. 2015). Greater stomatal closure reduced transpiration and led to greater conservation of soil water.
Drought tolerance may also be related to osmotic potential and leaf turgor. Osmotic adjustment refers to the accumulation of solutes to decrease cell water potential and help in retention of water (Graciano et al. 2005; Suriyagoda et al. 2014). Osmotic adjustment throught the accumulation of compatible solutes such as soluble sugars and proline helps to maintain cell turgor, gas exchange and growth under drought stress. This process also protects cell membranes from rupturing, and preserves the activity of enzymes and proteins in the cell (Tariq et al. 2019). Osmotic adjustment can therefore confer tolerance to drought and reduce the negative effect of water deficits on plant growth (Graciano et al. 2005). Osmotic adjustment can maintain stomatal conductance under drought conditions, allowing photosynthetic rate to be maintained under stress (González et al. 1999).
In white clover, P-fertilized plants had higher osmotic adjustment than unfertilized plants, and were able to extract more water from the soil as it dried. Osmotic adjustment can allow the plant to maintain leaf turgor and keep stomata open as the soil dries, to maintain gas exchange, photosynthesis and growth. Therefore, osmotic adjustment can maintain plant growth under water stress.
Phosphate fertilization can contribute to osmotic adjustment and improve solute concentration in drought-stressed plants, helping to protect cells from drought damage (Tariq et al. 2017; Begum et al. 2020). High P plants have higher leaf water potential than P-deficient plants under drought conditions (Suriyagoda et al. 2014; Burman et al. 2004). In a FACE system with elevated CO2, water use efficiency was greatest when field pea plants were provided with adequate P, with P increasing the concentration of soluble sugars in drought-stressed plants (Jin et al. 2015). Phosphorus fertilization increased leaf turgor slightly in cotton plants, with P-deficient plants being more responsive to abscisic acid produced during drought stress than P-fertilized plants. The higher response to abscisic acid led to the stomatal closure occuring at higher turgor threshholds for low P plants (Suriyagoda et al. 2014; Radin 1984). In eucalyptis, plants fertilized with P adjusted osmotically to drought stress on a black soil but not on a red sand (Graciano et al. 2005). Increasing P application improved water status in field pea during drought by increasing accumulation of soluble sugars (Jin et al. 2015). Concentration of osmolytes such as prolines, sugars and free amino acids were increased when P fertilizer was applied to drought-stressed tobacco plants, improving the leaf relative water content (Begum et al. 2020).
Proline is an osmoprotectant and plants can accumulate proline under water stress (Suriyagoda et al. 2014; Begum et al. 2020). In some but not all plants, proline accumulation may be increased with P fertilization (Suriyagoda et al. 2014). In white clover, proline accumulated to a greater extent in response to drought in high-P as compared to low-P plants (Singh et al. 2000b). In studies with two sorghum and two bean cultivars, plants had higher proline accumulation when water-stressed. Sorghum had higher proline concentrations when fertilized with P while bean had higher concentrations when unfertilized, indicating that accumulation of proline might be an adaptive response for sorghum but not for bean (Al-Karaki et al. 1996).
Phosphorus fertilization may improve plant growth by allowing leaf expansion to continue in spite of water stress, increasing leaf area under drought (Suriyagoda et al. 2014; Singh et al. 2006a). Phosphorus fertilization contributed to increasing leaf turgor and cell wall elasticity allowing cellular expansion to continue under drought stress (Singh et al. 2000b). Phosphorus deficiency inhibited leaf expansion of cotton plants by reducing root hydraulic conductance, so benefits of P fertilization under dry conditions may relate to the ability to maintain root hydraulic conditivity and water transport (Radin and Eidenbock 1984). Well-fertilized plants with adequate P had larger cell sizes, lower stomatal conductance and better water use efficiency, all of which would improve leaf water content and influence leaf expansion rate (Singh et al. 2006a, b).
Phosphorus may also help to ameliorate drought stress through effects on photosynthetic pigments. In tobacco, drought reduced the production of chlorophyll and carotenoids, leading to a decrease in photosynthsis, while application of P mitigated the decrease in pigments and photosynthetic ability (Begum et al. 2020). In drought-stressed eucalyptus seedlings, P fertilizer improved leaf water relative content, net photosynthesis rates, the amount of chlorophyll pigments and nitrogenous compounds and reduced lipid peroxidation (Tariq et al. 2019). Under all moisture levels, P fertilizer increased chlorophyll content and photosynthesis. Phosphorus fertilization also increased chlorophyll content, photosynthetic efficiency, and biomass production in chickpea (Chtouki et al. 2022).
Drought can increase damaging reactive oxygen species and hydrogen peroxide, while P fertilization can help mitigate this effect (Begum et al. 2020). Phosphorus fertilization improved tobacco growth under drought conditions in a rich black soil. Phosphorus fertilization led to reduced production of reactive oxygen species and hydrogen peroxide under drought, leading to lower oxidative damage, while concentration of osmolytes such as prolines, sugars and free amino acids were increased. Increased in these osmolytes improved the leaf relative water content and decreased oxidative damage (Begum et al. 2020).
Plant growth can also be affected by excess water. Soil flooding and waterlogging may occur with extreme rainfall under climate change. Globally, flooding currently affects over 17 million km2 of land and 10-12% of agricultural land is impacted by waterlogging or drainage contraints, causing production losses (Kaur et al. 2020). Changes in land use can contribute to the risk of flooding. Excess water may occur generally, or in specific low-lying areas of a field. Excess moisture can directly reduce plant growth or have indirect effects such as increasing N losses by denitrification and increasing N and P loss through leaching and runoff (Kaur et al. 2020; Arguello et al. 2016; Collaku and Harrison 2002).
Waterlogging reduces plant growth by reducing the ability of the plant to access oxygen in the rooting zone, reducing respiration (Kaur et al. 2020). The lack of oxygen reduces the ability of the plant to generate ATP for energy transfer, impairing cellular metabolism. Lack of oxygen in the soil reduces root formation and can increase root decay, so roots tend to grow near the surface without exploring a large soil volume (Ren et al. 2016; Kaur et al. 2020). Flooding can also reduce nodulation and N fixation in legumes, since N fixation requires an oxygen supply. Waterlogging also reduces photosynthesis, possibly because of stomatal closure (Kaur et al. 2020; Ren et al. 2016). Reactive oxygen species increase under waterlogging and can cause oxidative damage to the plants. The amount of damage is affected by the timing, severity and duration of the flooding and by the temperature during the flood (Olgun et al. 2008; Kaur et al. 2020). Damage increases if flooding is combined with warm temperature.
There are few studies directly assessing the impact of P fertilizer management under flooded conditions, as most of the effort has been directed at N management (Kaur et al. 2020). A meta-analysis showed that leaf N:P ratio decreased with flooding because N accumulation decreased more than P accumulation, indicating that N availability may be more limiting than P availability under flooded conditions (Cao et al. 2022).
6. Climate Smart and Low-Carbon Agricultural Practice to Combat Climate Change
Management strategies need to be implemented to mitigate the negative effects of climate change and capitalize on beneficial effects. Climate Smart Agriculture (CSA) refers to an integrated system of practices, technologies and policies designed to improve the resilience of the production system to climate change (Sinore and Wang 2025). Climate-smart agriculture uses sustainable management practices that reduce land degradation and enhance crop resistance to stress (Rinke Dias de Souza et al. 2025). Practices considered as CSA include sustainable livestock management, crop rotation, mixed cropping, agroforestry, mulching and integration of cover crops and buffer zones into crop production systems (Sinore and Wang 2025).
Low Carbon Agriculture (LCA) is a closely related concept to CSA, that refers to practices that attempt to reduce the energy inputs into and GHG emissions from agriculture (Norse 2012). As with CSA, recommended practices include crop rotation, mixed cropping, and intercropping, as well as reduced tillage, composting, and the use of organic fertilizers. The aim is to reduce bare soil, increase biodiversity, increase water use efficiency, choose the right crops for the environment and reduce excessive fertilization, pesticide use and over-cultivation. A major thrust of LCA is to reduce nutrient inputs through improvements in nutrient use efficiency such as precision farming with variable rate fertilization. Agroforestry systems, crop rotation, intercropping, cover crops, and other techniques can improve the sequestration of carbon in agriculture (Thamarai et al. 2024).
Recommended practices for CSA and LCA can provide environmental benefits by increasing habitat quality and biodiversity, increasing carbon storage, reducing erosion risk and reducing movement of nutrients to waterways. However, some of the practices such as cover crops may also lead to short-term yield loss and increases in production cost, which make them unattractive to producers. Effectiveness of practices such as cover crops and barrier zones on P movement to water will also vary with environment. Cover crops and barrier zone have not proven as effective in areas where P loss is driven by losses of soluble P from snowmelt as compared to where losses are driven by particulate erosion losses because leaching of P from vegetation may contribute to soluble P losses (Salvano et al. 2009; Flaten 2018; Jensen et al. 2011; Liu et al. 2013; Tiessen et al. 2010; Sheppard et al. 2006).
Many of the practices suggested in both CSA and LCA may be practical and improve economic returns for farmers. Crop diversification to utilize crop species and cultivars more suited to the changing climate is an important adaptation strategy for CSA and LCA (Sinore and Wang 2025). Improved drought resistance or timing of crop maturation to avoid stress during critical periods can improve crop resiliency. Avoiding stress would involve selecting crop species or cultivars with a growth pattern suited to the changing environment. Changing climate may also require changes in management practices, such as altering seeding date to avoid critical stress periods (Rahimi-Moghaddam et al. 2018). Changes in climate may alter the range and intensity of crop pests, including insects, weeds and diseases, leading to a need for modifications of control practices.
Water management practices such as increased water storage, improved drainage and better irrigation management will also be important. Improved irrigation strategies such as drip irrigation can improve crop production in times of moisture stress (Sinore and Wang 2025). Water conservation practices such as reduced tillage and mulching can also help to improve crop water use efficiency. Adding organic matter to the soil can improve soil structure, help cycle nutrients and conserve moisture.
Sustainable intensification is another viewpoint in this discussion (Cassman and Grassini 2020). Sustainable intensification attempts to increase crop yield per unit input without negatively affecting the environment. In many developed countries, production is intensified, the yield gap betweeen actual yield and potential yield is small, and there is less potential increase in yield with further increases in intensification. In contrast, in many of the low-income countries, such as Sub-Saharan Africa, production systems are low-yielding and poorly intensified. While some farmers in Sub-Saharan Africa use strategies to mitigate climate change including planting more resilient crops, enhancing soil and water management and using climate-smart agricultural practices, adoption of such practices needs to expand to maintain productivity in the face of a changing climate (Sinore and Wang 2025). Part of the issue is many low-income countries is soil degradation due to low nutrient input and inadequate return of crop residue to maintain soil organic matter. Substantial increases in yield could be attained through use of improved crop cultivars and balanced inputs of nutrients. An important question to ask in this environment is how much of the yield gap due to resource availability and how much is due to access to technology (Tittonell and Giller 2013).
While excess nutrient accumulation may be a concern in some developed countries, in many areas of the world, including much of the African continent, inputs of nutrients are lower than required to optimize crop production. If nutrient deficiencies limit crop yield, increased nutrient imputs and improved fertilizer management can improve crop yield and help to offset the negative effects of climate change on crop production. Climate Smart Agriculture, Low Carbon Agriculture and Sustainable Intensification all include the concept of optimizing nutrient management to reduce nutrient losses to the environment and GHG production while maintaining or improving crop yield and economic returns. These goals are closely related to those of the 4R nutrient stewardship framework.
7. 4R Phosphorus Management Under a Changing Climate
With a changing climate, proper nutrient management becomes more critical than ever. Effective nutrient management is essential to reduce the negative impacts of nutrient application on GHG emissions, and to optimize crop production by taking advantage of beneficial effects of climate change and ameliorating negative effects in an increasingly variable environment. The 4R nutrient stewardship framework means applying the right nutrient source or product at the right rate, right time and right place to optimize agronomic crop yield and quality, economics of production, environmental sustainability and social good on a site-specific basis (Figure 5). Within the 4R framework, fertilizer beneficial management practices (BMPs) should be developed for each location considering all three of these areas of sustainable development.
The right source (or product) at the right rate, right time and right place encompass the nutrient management options available to achieve the economic, social and environmental goals. The 4R framework is adaptable and allows a producer to make nutrient management decisions based on site-specific conditions such as soil characteristics, climate, cropping history, as well as the local sustainability imperatives (Flis 2018; Bruulsema 2017; Bruulsema et al. 2009; Bruulsema et al. 2008; IPNI 2012; Johnston and Bruulsema 2014). As climate changes, 4R management can be used to adjust fertilization practices to adapt to new environmental conditions.
Right Rate – Choosing the right rate means matching the fertilizer applied to the crop demand. The rate required will be affected by crop type, yield potential, residual soil nutrient levels, crop sequence, and other management factors. Accurate assessment of nutrient supply is a first step to selection of the right rate. Optimum rate will reflect the balance between crop demand and soil supply. Rate is also affected by source, timing and placement methods and by short- and long-term sustainability goals.
Right Source – Using the right source means using a form that is suitable for the crop being grown, the management practices used and the environmental conditions occurring in the field. The source selected should provide plant-available nutrients to meet crop demand. Sources of P fertilizer include fluid fertilizers such as ammonium polyphosphate, dry granular products such as monoammonium or diammonium phosphate, triple superphosphate, rock phosphate, or compound fertilizers. Composts, manure and reclaimed materials such as struvite are also sources of P. Various additives, coatings and amendments may also be used to improve the effectiveness of applied fertilizer sources. Source selection will be affected by balance and interaction with other nutrients and the presence of other nutrients or contaminants in the fertilizer material. Selection of source must also consider factors such as soil characteristics, timing of application, method of placement, availability of P over time, compatibility issues, and cost per unit of “actual” nutrient.
Right Place – Applying fertilizer in the right place means that the nutrient must be in a position where the crop can access it when needed and where it will not be lost from the system. Phosphorus is not very mobile in the soil and should be placed in a position where the crop roots can access it early in the growing season. Seed-placement or side-banding P ensure that the crop roots reach the fertilizer early in the season to correct P deficiencies. Root geometry is an important factor in selecting proper placement. Surface applications of P, especially if not incorporated, are at risk for transport off-site to surface waters, so should not be used in environmentally sensitive areas.
Right Time - Applying fertilizer at the right time means making nutrients available to the crop when they are needed. Nutrient use efficiency can be increased significantly when availability is synchronized with crop demand. Early-season P supply is critical for optimum crop growth, so it is important that P be accessible by the crop early in the season. Placement and source will interact with timing, to ensure that a readily available form of P can be safely placed near the seedling for the plant to use early in the season. Timing of application may also influence risk of off-site movement of P, through snow-melt or rainfall events.
Adopting the 4R approach can help to answer the question of what are the best management practices that can be used to reduce and/or ameliorate effects of climate change. Phosphorus rate, source, placement and timing are important tools to address climate change issues and the optimum 4R practices can be affected by climate change.
Managing P fertilizer rate in a changing climate must consider the interaction among climatic conditions, P demand by the crop and P supply from the soil. As discussed previously, climate change will influence plant growth, with effects varying from location to location. Changes in crop yield potential will affect P uptake and crop requirements for P. Phosphorus supply in a soil will also be affected by climate change. Legacy P provides an important source of P for the crop, but P supply is affected by the exchange of P between the soil solution and a variety of inorganic and organic pools that differ in their availability (Suriyagoda et al. 2014; Grant and Flaten 2019; Schoumans et al. 2015). Phosphorus availability may decrease under dry conditions through effects on mineralization, diffusion, mass flow and root growth (Mackay and Barber 1985; Barber et al. 1963; Grant and Flaten 2019). In most soils, phosphorus is concentrated in the upper layers that are first to dry under drought conditions. Therefore, P availability is likely to decrease if dry conditions become more prevalent under climate change. As discussed previously, in cold and temperate climates increasing temperatures may increase biological activity, increasing mineralization and nutrient cycling and therefore increasing plant-available P (Sardans and Peñuelas 2012; Schoumans et al. 2015; Seidel et al. 2021). The interactive effects of soil temperature and soil moisture will vary on a site-specific basis because of the interactions of mineralization, sorption/desorption and biological activity (Menge et al. 2023). Therefore, changes in P fertilizer rate requirements with climate change will depend on the relative change between P demand by the crop and P supply from the soil and must be assessed on a site-specific basis.
Climate change will affect optimal source of P fertilizer less than it will affect the optimal rate of application. Source of P fertilizer must be selected to complement the rate, timing and placement selected. A plant-available source of P fertilizer should be applied at a rate, timing and placement that optimizes fertilizer use efficiency. While many novel enhanced efficiency fertilizers have been assessed, their practical performance and benefits under varying climatic conditions has not been clearly demonstrated (Maaz et al. 2025).
Optimum P placement is an important consideration in a changing climate. Under the drying conditions that are likely to increase under climate change, P placed near the surface may be “stranded” in dry soil and inaccessable for plant uptake (Borges and Mallarino 2000). Placement of P in a position where it is in moist soil and available for crop uptake will be critical to ensure its availability (Hansel et al. 2017). In a meta-analysis, in-soil band application of P was generally found to be the best method of placement for wheat, maize and oilseed rape (canola), while banded P increased P uptake in soybean but there was a slight advantage of broadcast P in increasing soybean yield (Freiling et al. 2022). Studies with soybean in Brazil showed that strip tillage with deep banded P increased soybean root growth at depth and resilience to induced drought (Hansel et al. 2017). In studies with wheat in Australia, most of the P taken up by the crop came from topsoil, but P fertilizer banded below the seed increased plant P uptake and increased the amount of subsoil P that was used by the plant (McBeath et al. 2012). Deep banding of P may be able to maintain P in a moist soil zone for a longer period of time if soils dry because of prolonged drought. Proliferation of roots at depth in response to deep P placement may also increase the ability of the plant to access moisture, increasing drought tolerance. If climate change increases surface drying and higher temperatures increases evaporative demand, deep placement of P may help both to improve P uptake and drought resiliency (Verburg et al. 2024). However, banding P fertilizer with or near the seed can also be beneficial in dry seasons if the soil stays moist from small rainfall events while in wet seasons it can encourage greater early root development thoughout the profile to aid in the extraction of moisture and nutrients from depth (McBeath et al. 2012). As with fertilizer rate, optimum fertilizer placement must be assessed on a site-specific basis to respond to climatic conditions.
Timing of phosphorus fertilizer must ensure that P is available to the crop when needed. An adequate supply of P is required from the early stages of plant growth (Grant et al. 2001). Changing climate may change the timing of P supply by affecting P cycling, the release of plant-available P from the soil P, and P movement from the soil to the plant root. Changing climate may also change the rate of plant development and timing of P demand. Ensuring that P is available to the crop both early in the season and as the plant grows and develops will be important to optimize productivity. Placement of P close to the seed-row during seeding should ensure early-season access to P. If adequate P is available to the crop early in the growing season, the plant may accumulate more P than required at the time (Grant et al. 2001). This “luxury consumption” can be remobilized by the crop to support growth later in the season. Under drought, plants may not be able to access adequate P because of reduced availability from the soil, so remobilization of P accessed early in the season may be increasingly important (Sardans and Peñuelas 2012). If soil levels of P are adequate, plants may be able to access sufficient P from the soil through the growing season as the crop roots explore the soil. If the ability of the crop to access soil P is limiting through the season because of soil drying or nutrient stratification, deep placement of P in soil that remains moist may allow the crop to access P later in the growing season. In-season foliar application of P may also be an option if crops are deficient, but there are limitations in the amount that can be safely applied and in its effectiveness (Görlach and Mühling 2021; Henningsen et al. 2022; Noack et al. 2010). High-frequent drip irrigation with soluble P forms such as polyphosphate fertilizer may be an effective method of managing P under drought conditions (Chtouki et al. 2022).
It is important to recognize that 4R nutrient management does not apply only to management of inorganic fertilizers. Inputs from crop residues, cover crops, organic sources such as manures and composts, and legacy P also play an important role in nutrient management. Integrated nutrient management, where mineral fertilizers are combined with available organic resources may improve nutrient use efficiency on small holdings where access to mineral fertilizers is limited (Bayu 2020; Wu and Ma 2015; Lal et al. 2015). Application of organic materials with inorganic fertilizers can improve the ability of the soil to retain nutrients and moisture. Using all available nutrient resources as efficiency as possible is a critical step to increasing the resiliency of agricultural in the face of climate change.
Nutrient management has to be part of an overall production system, including improved crop genetics, crop diversification and rotation, balanced nutrient management, optimum planting dates, tillage system, water management, and control of pests such as weeds, diseases and insects (Bedasa et al. 2025; Tittonell and Giller 2013). Efficent nutrient management cannot occur without optimization of all available resources.
8. Actionable Recommendations for GPI to Develop an In-Depth Program for Integrating P Management into Climate and Agricultural Policies
Climate change prediction is based on models and changes in the assumptions used will lead to large differences in results. More and better data are needed to contribute to improved models (Folberth et al. 2016; Hoffmann et al. 2016; Hu et al. 2024). Sensitivity of the models to changes in input factors must be considered.
Most GHG emissions associated with phosphate fertilizers occur due to consumption of fossil fuels during the various stages of phosphate fertilizer production, transport and application. Reducing energy inputs during sulphuric acid production and efficiently utilizing the net energy generated when sulphuric acid is produced from sulphur can offset some of the GHG production generated at other stages. Emissions generated during the manufacture of ammonium phosphates may be reduced through enhanced energy efficiency, adoption of alternative non-fossil energy sources, and potentially, through the implementation of advanced technologies for ammonia synthesis in the production process.
Logistical efficiency to reduce the energy consumption during the transport of raw materials, intermediary products and finished product could have an impact on net emissions.
To reduce the amount of indirect greenhouse gas emissions linked to P use, it is important to optimize the efficiency of P fertilizer use. The less P that is mined, processed, transported and applied to the field per unit of agricultural production, the less risk there is for both GHG emissions and off-site transport of P. With a changing climate, proper nutrient management becomes more critical than ever. Effective 4R nutrient management is essential to reduce the negative impacts of nutrient application on GHG emissions, and to optimize crop production by taking advantage of beneficial effects of climate change and ameliorating negative effects in an increasingly variable environment.
Negative effects of climate change are predicted to occur mainly in the med- and low latitudes while positive effects may occur in the high latitudes. Therefore, negative effects may be concentrated in regions where producers currently have limited resources to adapt to climate change. An emphasis needs to be placed on developing effective adaptations that can be implemented in a cost-effective manner by producers in the regions that will be most seriously affected.
Assessment of factors limiting adoption of improved nutrient management practices may be needed to determine if lack of adoption is due to resource availability, lack of technological information, policy contraints or sociological factors.
Effective 4R P management practices should be evaluated in combination with other agronomic factors including crop genetics, crop diversification and rotation, balanced nutrient management, optimum planting dates, tillage system, water management, sustainable land management and control of pests such as weeds, diseases and insects. Nutrient management must be part of the overall production system.
References
- Abumounshar, NM; Ibrahim, S; Raj, A. A detailed reaction mechanism for elemental sulphur combustion in the furnace of sulphuric acid plants. The Canadian Journal of Chemical Engineering 2021, 99(11), 2441–2451. [Google Scholar] [CrossRef]
- Ainsworth, EA; Long, SP. What have we learned from 15 years of free-air CO2 enrichment (FACE)? A meta-analytic review of the responses of photosynthesis, canopy properties and plant production to rising CO2. New Phytol 2005, 165(2), 351–372. [Google Scholar] [CrossRef]
- Al-Karaki, GN; Al-Karaki, RB; Al-Karaki, CY. Phosphorus nutrition and water stress effects on proline accumulation in sorghum and bean. J Plant Physiol 1996, 148(6), 745–751. [Google Scholar] [CrossRef]
- Apostel, A; Kalcic, M; Logsdon-Muenich, R; King, K; Martin, J; Scavia, D. A retrospective analysis of climate and land management drivers of nutrient export from the western Lake Erie watershed: 1980-2019. Aquatic Ecosystem Health & Management 2025, 28(1), 95–111, 117. [Google Scholar]
- Arguello, MN; Mason, RE; Roberts, TL; Subramanian, N; Acuña, A; Addison, CK; Lozada, DN; Miller, RG; Gbur, E. Performance of soft red winter wheat subjected to field soil waterlogging: Grain yield and yield components. Field Crop Res 2016, 194, 57–64. [Google Scholar] [CrossRef]
- Arnell, NW; Lowe, JA; Challinor, AJ; Osborn, TJ. Global and regional impacts of climate change at different levels of global temperature increase. Climatic Change 2019, 155(3), 377–391. [Google Scholar] [CrossRef]
- Aziz, A; Wazir, I; Azhar, M. Heat Stress Tolerance in Crop Plants: Physiological and Biochemical Approaches. In Climate Change Impacts on Agriculture: Concepts, Issues and Policies for Developing Countries, 1 edn; Jatoi, WN, Mubeen, M, Hashmi, MZ, Ali, S, Fahad, S, Mahmood, K, Eds.; Springer: Cham., 2023; pp. pp 315–328. [Google Scholar] [CrossRef]
- Barber, SA; Walker, JM; Vasey, EH. Mechanisms for the movement of plant nutrients from the soil and fertilizer to the plant root. J Agric Food Chem 1963, 11(3), 204–207. [Google Scholar] [CrossRef]
- Bayu, T. Review on contribution of integrated soil fertility management for climate change mitigation and agricultural sustainability. Cogent Environmental Science 2020, 6(1), 1823631. [Google Scholar] [CrossRef]
- Bechtaoui, N; Rabiu, MK; Raklami, A; Oufdou, K; Hafidi, M; Jemo, M. Phosphate-dependent regulation of growth and stresses management in plants. Frontiers in Plant Science 2021, 12–2021. [Google Scholar] [CrossRef]
- Bedasa, Y; Gemechu, A; Bedemo, A; Gebissa, B; Xiuguang, B. Impacts of climate and non-climate factors on cereal crop yield in East Africa: A generalized method of moments (GMM) panel data analysis. Journal of Agriculture and Food Research 2025, 21, 101829. [Google Scholar] [CrossRef]
- Begum, N; Ahanger, MA; Zhang, L. AMF inoculation and phosphorus supplementation alleviates drought induced growth and photosynthetic decline in Nicotiana tabacum by up-regulating antioxidant metabolism and osmolyte accumulation. Environ Exp Bot 2020, 176, 104088. [Google Scholar] [CrossRef]
- Borges, R; Mallarino, AP. Grain yield, early growth, and nutrient uptake of no-till soybean as affected by phosphorus and potassium placement. Agron J 2000, 92(2), 380–388. [Google Scholar]
- Brar, BS; Singh, K; Dheri, GS; Balwinder, K. Carbon sequestration and soil carbon pools in a rice–wheat cropping system: Effect of long-term use of inorganic fertilizers and organic manure. Soil Till Res 2013, 128, 30–36. [Google Scholar] [CrossRef]
- Bruulsema, T. 4R phosphorus management practices for major commodity crops of North America. In REf#17023 edn; International Plant Nutrition Institute: Norcross, GA, 2017. [Google Scholar]
- Bruulsema, T; Lemunyon, J; Herz, B. Know your fertilizer rights. Crops and Soils 2009, 42(2), 13–18. [Google Scholar]
- Bruulsema, T; Witt, C; García, F; Li, S; Rao, TN; Chen, F; Ivanova, S. A global framework for fertilizer BMPs. Better Crops Plant Food 2008, 92, 13–15. [Google Scholar]
- Burman, U; Garg, BK; Kathju, S. Interactive effects of thiourea and phosphorus on clusterbean under water stress. Biol Plantarum 2004, 48(1), 61–65. [Google Scholar] [CrossRef]
- Burney, JA; Davis, SJ; Lobell, DB. Greenhouse gas mitigation by agricultural intensification. Proceedings of the National Academy of Sciences 2010, 107(26), 12052–12057. [Google Scholar] [CrossRef]
- Cao, Y; Tong, R; Tan, Q; Mo, S; Ma, C; Chen, G. Flooding influences on the C, N and P stoichiometry in terrestrial ecosystems: A meta-analysis. CATENA 2022, 215, 106287. [Google Scholar] [CrossRef]
- Carver, RE; Nelson, NO; Roozeboom, KL; Kluitenberg, GJ; Tomlinson, PJ; Kang, Q; Abel, DS. Cover crop and phosphorus fertilizer management impacts on surface water quality from a no-till corn-soybean rotation. J Environ Manage 2022, 301, 113818. [Google Scholar] [CrossRef]
- Cassman, KG; Grassini, P. A global perspective on sustainable intensification research. Nature Sustainability 2020, 3(4), 262–268. [Google Scholar] [CrossRef]
- Nutrients and their impact on the Canadian environment; Chambers, PA, Guy, M, Roberts, ES, Charlton, MN, Kent, R, Gagnon, C, Grove, G, Foster, N, Eds.; Agriculture and Agri-Food Canada, Environment Canada, Fisheries and Oceans Canada, Health Canada and Natural Resources Canada.: Ottawa, 2001. [Google Scholar]
- Chambers, PA; Vis, C; Brua, R; Guy, M; Culp, J; Benoy, G. Eutrophication of agricultural streams: defining nutrient concentrations to protect ecological condition. Water Sci Technol 2008, 58(11), 2203–2210. [Google Scholar] [CrossRef]
- Chien, SH; Menon, RG. Factors affecting the agronomic effectiveness of phosphate rock for direct application. Fert Res 1995, 41(3), 227–234. [Google Scholar] [CrossRef]
- Chtouki, M; Laaziz, F; Naciri, R; Garré, S; Nguyen, F; Oukarroum, A. Interactive effect of soil moisture content and phosphorus fertilizer form on chickpea growth, photosynthesis, and nutrient uptake. Scientific Reports 2022, 12(1), 6671. [Google Scholar] [CrossRef] [PubMed]
- Collaku, A; Harrison, SA. Losses in wheat due to waterlogging. Crop Sci 2002, 42(2), 444–450. [Google Scholar] [CrossRef]
- Coonan, EC; Richardson, AE; Kirkby, CA; Kirkegaard, JA; Amidy, MR; Simpson, RJ; Strong, CL. Soil carbon sequestration to depth in response to long-term phosphorus fertilization of grazed pasture. Geoderma 2019, 338, 226–235. [Google Scholar] [CrossRef]
- Cordell, D; Rosemarin, A; Schröder, JJ; Smit, AL. Towards global phosphorus security: A systems framework for phosphorus recovery and reuse options. Chemosphere 2011, 84(6), 747–758. [Google Scholar] [CrossRef]
- Costa, D; Sutter, C; Shepherd, A; Jarvie, H; Wilson, H; Elliott, J; Liu, J; Macrae, M. Impact of climate change on catchment nutrient dynamics: insights from around the world. Environ Rev 2022, 31. [Google Scholar] [CrossRef]
- Daszkowska-Golec, A; Szarejko, I. Open or close the gate - stomata action under the control of phytohormones in drought stress conditions. Front Plant Sci 2013, 4, 138. [Google Scholar] [CrossRef]
- Datta, A; Santra, SC; Adhya, TK. Effect of inorganic fertilizers (N, P, K) on methane emission from tropical rice field of India. Atmos Environ 2013, 66, 123–130. [Google Scholar] [CrossRef]
- Donat, MG; Lowry, AL; Alexander, LV; O’Gorman, PA; Maher, N. More extreme precipitation in the world’s dry and wet regions. Nature Climate Change 2016, 6(5), 508–513. [Google Scholar] [CrossRef]
- El-Khoury, A; Seidou, O; Lapen, DR; Que, Z; Mohammadian, M; Sunohara, M; Bahram, D. Combined impacts of future climate and land use changes on discharge, nitrogen and phosphorus loads for a Canadian river basin. J Environ Manage 2015, 151, 76–86. [Google Scholar] [CrossRef] [PubMed]
- Epie, K; Maral, E. Shoot and root biomass, phosphorus and nitrogen uptake of spring wheat grown in low phosphorus and moisture content conditions in a pot experiment. J Plant Nutr 2018, 41, 1–8. [Google Scholar] [CrossRef]
- Fischer, G; Shah, M; Tubiello, FN; van Velhuizen, H. Socio-economic and climate change impacts on agriculture: an integrated assessment, 1990-2080. Philos Trans R Soc Lond B Biol Sci 2005, 360(1463), 2067–2083. [Google Scholar] [CrossRef]
- Fischer, G; Shah, M; Velthuizen, H; Nachtergaele, F. Global Agro-Ecological Assessment for Agriculture in the 21st Century. IIASA Research Rep Ort 02-02, International Institute for Applied Systems Analysis, Laxenburg, Austria; 2001. [Google Scholar]
- Flaten, D. Phosphorus: refining nutrient and water management for cold climates. Paper presented at the Minnesota Nutrient Management Conference, Mankato, MN, February 20; 2018. [Google Scholar]
- Flis, S. 4R history and recent phosphorus research. Crops and Soils 2018, 51(2), 36–47. [Google Scholar] [CrossRef]
- Folberth, C; Skalský, R; Moltchanova, E; Balkovič, J; Azevedo, LB; Obersteiner, M; Van Der Velde, M. Uncertainty in soil data can outweigh climate impact signals in global crop yield simulations. Nature Communications 2016, 7. [Google Scholar] [CrossRef]
- Forber, KJ; Withers, PJA; Ockenden, MC; Haygarth, PM. The phosphorus transfer continuum: a framework for exploring effects of climate change. Agricultural & Environmental Letters 2018, 3(1), 180036. [Google Scholar] [CrossRef]
- Freiling, M; von Tucher, S; Schmidhalter, U. Factors influencing phosphorus placement and effects on yield and yield parameters: A meta-analysis. Soil Till Res 2022, 216, 105257. [Google Scholar] [CrossRef]
- Goll, DS; Moosdorf, N; Hartmann, J; Brovkin, V. Climate-driven changes in chemical weathering and associated phosphorus release since 1850: Implications for the land carbon balance. Geophys Res Lett 2014, 41(10), 3553–3558. [Google Scholar] [CrossRef]
- Gong, H; Guo, Y; Wu, J; Wu, H; Nkebiwe, PM; Pu, Z; Feng, G; Jiao, X. Synergies in sustainable phosphorus use and greenhouse gas emissions mitigation in China: Perspectives from the entire supply chain from fertilizer production to agricultural use. Sci Total Environ 2022, 838, 155997. [Google Scholar] [CrossRef]
- González, A; Martı́n, I; Ayerbe, L. Barley yield in water-stress conditions: the influence of precocity, osmotic adjustment and stomatal conductance. Field Crop Res 1999, 62(1), 23–34. [Google Scholar] [CrossRef]
- Görlach, BM; Mühling, KH. Phosphate foliar application increases biomass and P concentration in P deficient maize. J Plant Nutr Soil Sc 2021, 184(3), 360–370. [Google Scholar] [CrossRef]
- Gourevitch, JD; Koliba, C; Rizzo, DM; Zia, A; Ricketts, TH. Quantifying the social benefits and costs of reducing phosphorus pollution under climate change. J Environ Manage 2021, 293, 112838. [Google Scholar] [CrossRef] [PubMed]
- Graciano, C; Guiamét, JJ; Goya, JF. Impact of nitrogen and phosphorus fertilization on drought responses in Eucalyptus grandis seedlings. Forest Ecology and Management 2005, 212(1), 40–49. [Google Scholar] [CrossRef]
- Grant, C; Flaten, D. 4R Management of Phosphorus Fertilizer in the Northern Great Plains: A Review of the Scientific Literature; Flaten, D, Grant, C, Eds.; 2019; Available online: https://canadianagronomist.ca/wp-content/uploads/2019/09/4R-P-fertilizer-mgmt-for-NGP-Detailed-version-July-3-2019_VF.pdf.
- Grant, CA; Flaten, DN; Tomasiewicz, DJ; Sheppard, SC. The importance of early season phosphorus nutrition. Can J Plant Sci 2001, 81(2), 211–224. [Google Scholar] [CrossRef]
- Grant, CA; Lafond, GP. The effects of tillage systems and crop rotations on soil chemical properties of a Black Chernozemic soil. Can J Soil Sci 1994, 74(3), 301–306. [Google Scholar] [CrossRef]
- Grant, RF; Dyck, M; Puurveen, D. Nitrogen and phosphorus control carbon sequestration in agricultural ecosystems: modelling carbon, nitrogen, and phosphorus balances at the Breton Plots with ecosys under historical and future climates. Can J Soil Sci 2020, 100(4), 408–429. [Google Scholar] [CrossRef]
- Gray, SB; Dermody, O; Klein, SP; Locke, AM; McGrath, JM; Paul, RE; Rosenthal, DM; Ruiz-Vera, UM; Siebers, MH; Strellner, R; Ainsworth, EA; Bernacchi, CJ; Long, SP; Ort, DR; Leakey, ADB. Intensifying drought eliminates the expected benefits of elevated carbon dioxide for soybean. Nature Plants 2016, 2(9), 16132. [Google Scholar] [CrossRef]
- Gregory, PJ; Johnson, SN; Newton, AC; Ingram, JSI. Integrating pests and pathogens into the climate change/food security debate. J Exp Bot 2009, 60(10), 2827–2838. [Google Scholar] [CrossRef]
- Gutiérrez-Boem, FH; Thomas, GW. Phosphorus nutrition affects wheat response to water deficit. Agron J 1998, 90(2), 166–171. [Google Scholar] [CrossRef]
- Hansel, FD; Amado, TJC; Ruiz Diaz, DA; Rosso, LHM; Nicoloso, FT; Schorr, M. Phosphorus fertilizer placement and tillage affect soybean root growth and drought tolerance. Agron J 2017, 109(6), 2936–2944. [Google Scholar] [CrossRef]
- Haygarth, PM; Condron, LM; Heathwaite, AL; Turner, BL; Harris, GP. The phosphorus transfer continuum: Linking source to impact with an interdisciplinary and multi-scaled approach. Sci Total Environ 2005, 344(1), 5–14. [Google Scholar] [CrossRef] [PubMed]
- He, J; Jin, Y; Turner, NC; Chen, Z; Liu, H-Y; Wang, X-L; Siddique, KHM; Li, F-M. Phosphorus application increases root growth, improves daily water use during the reproductive stage, and increases grain yield in soybean subjected to water shortage. Environ Exp Bot 2019, 166, 103816. [Google Scholar] [CrossRef]
- Henningsen, JN; Görlach, BM; Fernández, V; Dölger, JL; Buhk, A; Mühling, KH. Foliar P application cannot fully restore photosynthetic capacity, P nutrient status, and growth of P deficient maize (Zea mays L.). Plants (Basel) 2022, 11(21). [Google Scholar] [CrossRef] [PubMed]
- Hoffmann, H; Zhao, G; Asseng, S; Bindi, M; Biernath, C; Constantin, J; Coucheney, E; Dechow, R; Doro, L; Eckersten, H; Gaiser, T; Grosz, B; Heinlein, F; Kassie, BT; Kersebaum, K-C; Klein, C; Kuhnert, M; Lewan, E; Moriondo, M; Nendel, C; Priesack, E; Raynal, H; Roggero, PP; Rötter, RP; Siebert, S; Specka, X; Tao, F; Teixeira, E; Trombi, G; Wallach, D; Weihermüller, L; Yeluripati, J; Ewert, F. Impact of spatial soil and climate input data aggregation on regional yield simulations. PLOS ONE 2016, 11(4), e0151782. [Google Scholar] [CrossRef]
- Hu, T; Zhang, X; Khanal, S; Wilson, R; Leng, G; Toman, EM; Wang, X; Li, Y; Zhao, K. Climate change impacts on crop yields: A review of empirical findings, statistical crop models, and machine learning methods. Environmental Modelling & Software 2024, 179, 106119. [Google Scholar] [CrossRef]
- Hultgren, A; Carleton, T; Delgado, M; Gergel, DR; Greenstone, M; Houser, T; Hsiang, S; Jina, A; Kopp, RE; Malevich, SB; McCusker, KE; Mayer, T; Nath, I; Rising, J; Rode, A; Yuan, J. Impacts of climate change on global agriculture accounting for adaptation. Nature 2025, 642(8068), 644–652. [Google Scholar] [CrossRef]
- IPCC. Summary for Policymakers. In Climate Change 2023: Synthesis Report.Contribution of Working Groups I, II and III to the Sixth Assessment Report of the Intergovernmental Panel on Climate Change. Intergovernmental Panel on Climate Change Geneva, Switzerland; 2023. [Google Scholar] [CrossRef]
- IPNI. 4R Plant Nutrition Manual: A Manual for Improving the Management of Plant Nutrition; Bruulsema, T, Fixen, P, Sulewski, G, Eds.; International Plant Nutrition Institute: Peachtree CornersGA, 2012. [Google Scholar]
- Janssen, KA; Pierzynski, GM; Meyers, RG; Barnes, PL. Runoff losses of phosphorus from cropland as affected by tillage and phosphorus management. In Great Plains Soil Fertility Conference; Denver, CO, Schlegel, A, Ed.; Kansas State University, March 7-8, 2000 2000; pp. pp 203–208. [Google Scholar]
- Jennings, E; Allott, N; Pierson, DC; Schneiderman, EM; Lenihan, D; Samuelsson, P; Taylor, D. Impacts of climate change on phosphorus loading from a grassland catchment: Implications for future management. Water Res 2009, 43(17), 4316–4326. [Google Scholar] [CrossRef]
- Jensen, T; Tiessen, K; Salvano, E; Kalischuk, A; Flaten, DN. Spring snowmelt impact on phosphorus addition to surface runoff in the Northern Great Plains. Better Crops 2011, 95(1), 28–31. [Google Scholar]
- Jeppesen, E; Meerhoff, M; Jacobsen, BA; Hansen, RS; Søndergaard, M; Jensen, JP; Lauridsen, TL; Mazzeo, N; Branco, CWC. Restoration of shallow lakes by nutrient control and biomanipulation - The successful strategy varies with lake size and climate. Hydrobiologia 2007, 581(1), 269–285. [Google Scholar] [CrossRef]
- Jiang, M; Caldararu, S; Zhang, H; Fleischer, K; Crous, KY; Yang, J; De Kauwe, MG; Ellsworth, DS; Reich, PB; Tissue, DT; Zaehle, S; Medlyn, BE. Low phosphorus supply constrains plant responses to elevated CO2: A meta-analysis. Global Change Biol 2020, 26(10), 5856–5873. [Google Scholar] [CrossRef]
- Jin, J; Lauricella, D; Armstrong, R; Sale, P; Tang, C. Phosphorus application and elevated CO2 enhance drought tolerance in field pea grown in a phosphorus-deficient vertisol. Ann Bot 2015, 116(6), 975–985. [Google Scholar] [CrossRef] [PubMed]
- Johnston, A; Bruulsema, T. 4R nutrient stewardship for improved nutrient use efficiency. Procedia Engineering 2014, 83, 365–370. [Google Scholar] [CrossRef]
- Kaur, G; Singh, G; Motavalli, PP; Nelson, KA; Orlowski, JM; Golden, BR. Impacts and management strategies for crop production in waterlogged or flooded soils: A review. Agron J 2020, 112(3), 1475–1501. [Google Scholar] [CrossRef]
- Kaushik, B; Singh, K; Tiwari, DK; Singh, UK. Impact of climate change on crop yield due to crop pests and crop diseases: future projections. Microscopy and Microanalysis 2023, 29 Supplement_1, 56–58. [Google Scholar] [CrossRef]
- Khan, F; Siddique, AB; Shabala, S; Zhou, M; Zhao, C. Phosphorus plays key roles in regulating plants' physiological responses to abiotic stresses. Plants (Basel) 2023, 12(15). [Google Scholar] [CrossRef]
- King, KW; Williams, MR; Macrae, ML; Fausey, NR; Frankenberger, J; Smith, DR; Kleinman, PJ; Brown, LC. Phosphorus transport in agricultural subsurface drainage: A review. J Environ Qual 2015, 44(2), 467–485. [Google Scholar] [CrossRef]
- Kleinman, PJA; Osmond, DL; Christianson, LE; Flaten, DN; Ippolito, JA; Jarvie, HP; Kaye, JP; King, KW; Leytem, AB; McGrath, JM; Nelson, NO; Shober, AL; Smith, DR; Staver, KW; Sharpley, AN. Addressing conservation practice limitations and trade-offs for reducing phosphorus loss from agricultural fields. Agricultural & Environmental Letters 2022, 7(2), e20084. [Google Scholar] [CrossRef]
- Lahlali, R; Taoussi, M; Laasli, S-E; Gachara, G; Ezzouggari, R; Belabess, Z; Aberkani, K; Assouguem, A; Meddich, A; El Jarroudi, M; Barka, EA. Effects of climate change on plant pathogens and host-pathogen interactions. Crop and Environment 2024, 3(3), 159–170. [Google Scholar] [CrossRef]
- Laira, MD; Andrade, SAL; Silveira, NM; Machado, EC; Ribeiro, RV; Zambrosi, FCB. High post-flowering phosphorus status promotes the tolerance of soybean to terminal heat stress. Environ Exp Bot 2023, 215, 105501. [Google Scholar] [CrossRef]
- Lal, R; Negassa, W; Lorenz, K. Carbon sequestration in soil. Current Opinion in Environmental Sustainability 2015, 15, 79–86. [Google Scholar] [CrossRef]
- Letkeman, LP; Tiessen, H; Campbell, CA. Phosphorus transformations and redistribution during pedogenesis of western Canadian soils. Geoderma 1996, 71(3-4), 201–218. [Google Scholar] [CrossRef]
- Li, Y; Guan, K; Schnitkey, GD; DeLucia, E; Peng, B. Excessive rainfall leads to maize yield loss of a comparable magnitude to extreme drought in the United States. Global Change Biol 2019, 25(7), 2325–2337. [Google Scholar] [CrossRef] [PubMed]
- Li, Y; Shang, J; Zhang, C; Zhang, W; Niu, L; Wang, L; Zhang, H. The role of freshwater eutrophication in greenhouse gas emissions: A review. Sci Total Environ 2021, 768, 144582. [Google Scholar] [CrossRef] [PubMed]
- Little, JL; Nolan, SC; Casson, JP; Olson, BM. Relationships between soil and runoff phosphorus in small Alberta watersheds. J Environ Qual 2007, 36(5), 1289–1300. [Google Scholar] [CrossRef]
- Liu, K; Elliott, JA; Lobb, DA; Flaten, DN; Yarotski, J. Critical factors affecting field-scale losses of nitrogen and phosphorus in spring snowmelt runoff in the Canadian Prairies. J Environ Qual 2013, 42(2), 484–496. [Google Scholar] [CrossRef]
- Liu, W; Ciais, P; Liu, X; Yang, H; Hoekstra, AY; Tang, Q; Wang, X; Li, X; Cheng, L. Global phosphorus losses from croplands under future precipitation scenarios. Environ Sci Technol 2020, 54(22), 14761–14771. [Google Scholar] [CrossRef]
- Liu, Y; Li, C; Cai, G; Sauheitl, L; Xiao, M; Shibistova, O; Ge, T; Guggenberger, G. Meta-analysis on the effects of types and levels of N, P, and K fertilization on organic carbon in cropland soils. Geoderma 2023, 437, 116580. [Google Scholar] [CrossRef]
- Liu, Y; Yang, W; Bass, B; Rao, YR. Effectiveness of agricultural BMPs on phosphorus load reduction for the Canadian Lake Erie basin: A literature review. Environ Rev (ja) 2025. [Google Scholar] [CrossRef]
- Lobell, DB; Field, CB. Global scale climate–crop yield relationships and the impacts of recent warming. Environmental Research Letters 2007, 2(1), 014002. [Google Scholar] [CrossRef]
- López Hernández, NA; Martínez Sifuentes, AR; Halecki, W; Trucíos Caciano, R; Rodríguez Moreno, VM. An assessment of the impact of climate change on maize production in Northern Mexico. Atmosphere 2025, 16(4), 455. [Google Scholar] [CrossRef]
- Lozier, T; Macrae, M; Brunke, R; Van Eerd, L. Release of phosphorus from crop residue and cover crops over the non-growing season in a cool temperate region. Agr Water Manage 2017, 189, 39–51. [Google Scholar] [CrossRef]
- Lucas, E; Kennedy, B; Roswall, T; Burgis, C; Toor, GS. Climate change effects on phosphorus loss from agricultural land to water: a review. Current Pollution Reports 2023, 9(4), 623–645. [Google Scholar] [CrossRef]
- Lynch, JP. Steep, cheap and deep: an ideotype to optimize water and N acquisition by maize root systems. Ann Bot 2013, 112(2), 347–357. [Google Scholar] [CrossRef] [PubMed]
- Lynch, JP. Harnessing root architecture to address global challenges. The Plant Journal 2022, 109(2), 415–431. [Google Scholar] [CrossRef] [PubMed]
- Lynch, JP; Brown, KM. Topsoil foraging–an architectural adaptation of plants to low phosphorus availability. Plant Soil 2001, 237, 225–237. [Google Scholar] [CrossRef]
- Maaz, TM; Dobermann, A; Lyons, SE; Thomson, AM. Review of research and innovation on novel fertilizers for crop nutrition. npj Sustainable Agriculture 2025, 3(1), 25. [Google Scholar] [CrossRef]
- MacDonald, GK; Bennett, EM; Potter, PA; Ramankutty, N. Agronomic phosphorus imbalances across the world's croplands. Proceedings of the National Academy of Sciences 2011, 108(7), 3086–3091. [Google Scholar] [CrossRef]
- Mackay, AD; Barber, SA. Soil Moisture Effects on Root Growth and Phosphorus Uptake by Corn. Agron J 1985, 77(4), 519–523. [Google Scholar] [CrossRef]
- Martinez-Feria, RA; Basso, B. Unstable crop yields reveal opportunities for site-specific adaptations to climate variability. Scientific Reports 2020, 10(1), 2885. [Google Scholar] [CrossRef]
- McBeath, T; McLaughlin, M; Kirby, J; Armstrong, R. The effect of soil water status on fertiliser, topsoil and subsoil phosphorus utilisation by wheat. Plant Soil 2012, 358(1), 337–348. [Google Scholar] [CrossRef]
- McDowell, RW; Sharpley, AN; Beegle, DB; Weld, JL. Comparing phosphorus management strategies at a watershed scale. J Soil Water Conserv 2001a, 56(4), 306–315. [Google Scholar] [CrossRef]
- McDowell, RW; Sharpley, AN; Condron, LM; Haygarth, PM; Brookes, PC. Processes controlling soil phosphorus release to runoff and implications for agricultural management. Nutr Cycling Agroecosyst 2001b, 59(3), 269–284. [Google Scholar] [CrossRef]
- Meier, S; Moore, F; Morales, A; Jobet, C; López-Olivari, R; Aponte, H; Cartes, P; Campos, P; Khan, N. Interactive role between phosphorus utilization efficiency and water use efficiency. A tool to categorize wheats co-adapted to water and phosphorus limiting conditions. Agr Water Manage 2021, 248, 106765. [Google Scholar] [CrossRef]
- Menge, DNL; Kou-Giesbrecht, S; Taylor, BN; Akana, PR; Butler, A; Carreras Pereira, KA; Cooley, SS; Lau, VM; Lauterbach, EL. Terrestrial phosphorus cycling: responses to climatic change. Annual Review of Ecology, Evolution, and Systematics 2023, 54((Volume 54), 429–449. [Google Scholar] [CrossRef]
- Mishra, S; Spaccarotella, K; Gido, J; Samanta, I; Chowdhary, G. Effects of heat stress on plant-nutrient relations: an update on nutrient uptake, transport, and assimilation. Int J Mol Sci 2023, 24(21). [Google Scholar] [CrossRef]
- Mumbi, RCK; Williams, MR; King, KW; Penn, CJ; Camberato, JJ. Drought to inundation: Precipitation extremes exacerbate phosphorus loss in artificially drained watersheds. Agr Water Manage 2025, 316, 109606. [Google Scholar] [CrossRef]
- Ni, Z; Cao, M; Wang, Y; Zhong, W; Zhang, M; Duan, Y; Wu, L. Phosphorus fertilizer input level regulates soil organic carbon physical fraction sequestration by influencing the microbial community. Appl Soil Ecol 2025, 210, 106072. [Google Scholar] [CrossRef]
- Nicholaichuk, W; Read, D. Nutrient runoff from fertilized and unfertilized fields in western Canada. J Environ Qual 1978, 7(4), 542–544. [Google Scholar] [CrossRef]
- Noack, SR; McBeath, TM; McLaughlin, MJ. Potential for foliar phosphorus fertilisation of dryland cereal crops: a review. Crop Pasture Sci 2010, 61(8), 659–669. [Google Scholar] [CrossRef]
- Norse, D. Low carbon agriculture: Objectives and policy pathways. Environmental Development 2012, 1(1), 25–39. [Google Scholar] [CrossRef]
- Nuttall, JG; O'Leary, GJ; Panozzo, JF; Walker, CK; Barlow, KM; Fitzgerald, GJ. Models of grain quality in wheat—A review. Field Crop Res 2017, 202, 136–145. [Google Scholar] [CrossRef]
- O'Brien, P; Kral-O'Brien, K; Hatfield, JL. Agronomic approach to understanding climate change and food security. Agron J 2021, 113(6), 4616–4626. [Google Scholar] [CrossRef]
- Ockenden, MC; Hollaway, MJ; Beven, KJ; Collins, AL; Evans, R; Falloon, PD; Forber, KJ; Hiscock, KM; Kahana, R; Macleod, CJA; Tych, W; Villamizar, ML; Wearing, C; Withers, PJA; Zhou, JG; Barker, PA; Burke, S; Freer, JE; Johnes, PJ; Snell, MA; Surridge, BWJ; Haygarth, PM. Major agricultural changes required to mitigate phosphorus losses under climate change. Nature Communications 2017, 8(1), 161. [Google Scholar] [CrossRef] [PubMed]
- Olgun, M; Metin Kumlay, A; Cemal Adiguzel, M; Caglar, A. The effect of waterlogging in wheat (T. aestivum L.). Acta Agriculturae Scandinavica, Section B — Soil & Plant Science 2008, 58(3), 193–198. [Google Scholar] [CrossRef]
- Ortas, I; Bykova, A. Effects of long-term phosphorus fertilizer applications on soil carbon and CO2 flux. Commun Soil Sci Plant Anal 2020, 51(17), 2270–2279. [Google Scholar] [CrossRef]
- Ortas, I; Lal, R. Long-term phosphorus application impacts on aggregate-associated carbon and nitrogen sequestration in a Vertisol in the Mediterranean Turkey. Soil Sci 2012, 177(4), 241–250. [Google Scholar] [CrossRef]
- Prospero, JM; Lamb, PJ. African droughts and dust transport to the Caribbean: climate change implications. Science 2003, 302(5647), 1024–1027. [Google Scholar] [CrossRef]
- Radin, JW. Stomatal responses to water stress and to abscisic Acid in phosphorus-deficient cotton plants. Plant Physiol 1984, 76(2), 392–394. [Google Scholar] [CrossRef]
- Radin, JW; Eidenbock, MP. Hydraulic conductance as a factor limiting leaf expansion of phosphorus-deficient cotton plants. Plant Physiol 1984, 75(2), 372–377. [Google Scholar] [CrossRef]
- Rahimi-Moghaddam, S; Kambouzia, J; Deihimfard, R. Adaptation strategies to lessen negative impact of climate change on grain maize under hot climatic conditions: A model-based assessment. Agr Forest Meteorol 2018, 253-254, 1–14. [Google Scholar] [CrossRef]
- Ren, B; Zhang, J; Dong, S; Liu, P; Zhao, B. Root and shoot responses of summer maize to waterlogging at different stages. Agron J 2016, 108(3), 1060–1069. [Google Scholar] [CrossRef]
- Rinke Dias de Souza, N; Mohn Solberg, MK; Hu, X; Cherubini, F. Environmental benefits and changes in ecosystem services of climate-smart agriculture relative to conventional agriculture in Norway. J Environ Manage 2025, 377, 124633. [Google Scholar] [CrossRef] [PubMed]
- Roberts, T; Stewart, J; Bettany, J. The influence of topography on the distribution of organic and inorganic soil phosphorus across a narrow environmental gradient. Can J Soil Sci 1985, 65(4), 651–665. [Google Scholar] [CrossRef]
- Salvano, E; Flaten, DN; Rousseau, AN; Quilbe, R. Are current phosphorus risk indicators useful to predict the quality of surface waters in southern Manitoba, Canada? J Environ Qual 2009, 38(5), 2096–2105. [Google Scholar] [CrossRef] [PubMed]
- Sardans, J; Peñuelas, J. The role of plants in the effects of global change on nutrient availability and stoichiometry in the plant-soil system. Plant Physiol 2012, 160(4), 1741–1761. [Google Scholar] [CrossRef]
- Sawka, CAD. Relationship between chemical analyses of P in soil and P loss in simulated runoff; Manitoba: Winnipeg, MB, 2009. [Google Scholar]
- Schindler, DW; Hecky, RE; Findlay, DL; Stainton, MP; Parker, BR; Paterson, MJ; Beaty, KG; Lyng, M; Kasian, SEM. Eutrophication of lakes cannot be controlled by reducing nitrogen input: Results of a 37-year whole-ecosystem experiment. Proc Natl Acad Sci U S A 2008, 105(32), 11254–11258. [Google Scholar] [CrossRef]
- Schoumans, OF; Bouraoui, F; Kabbe, C; Oenema, O; van Dijk, KC. Phosphorus management in Europe in a changing world. Ambio 2015, 44, 180–192. [Google Scholar] [CrossRef]
- Seidel, SJ; Gaiser, T; Ahrends, HE; Hüging, H; Siebert, S; Bauke, SL; Gocke, MI; Koch, M; Schweitzer, K; Schaaf, G; Ewert, F. Crop response to P fertilizer omission under a changing climate - Experimental and modeling results over 115 years of a long-term fertilizer experiment. Field Crop Res 2021, 268, 108174. [Google Scholar] [CrossRef]
- Selles, F; McConkey, B; Campbell, C. Distribution and forms of P under cultivator-and zero-tillage for continuous-and fallow-wheat cropping systems in the semi-arid Canadian prairies. Soil Till Res 1999, 51(1-2), 47–59. [Google Scholar] [CrossRef]
- Sharpley, AN. Soil phosphorus dynamics: agronomic and environmental impacts. Ecol Eng 1995, 5(2-3), 261–279. [Google Scholar] [CrossRef]
- Sharpley, AN; Chapra, SC; Wedepohl, R; Sims, JT; Daniel, TC; Reddy, KR. Managing agricultural phosphorus for protection of surface waters: Issues and options. J Environ Qual 1994, 23(3), 437–451. [Google Scholar] [CrossRef]
- Sharpley, AN; Kleinman, PJ; Flaten, DN; Buda, AR. Critical source area management of agricultural phosphorus: experiences, challenges and opportunities. Water Sci Technol 2011, 64(4), 945. [Google Scholar] [CrossRef] [PubMed]
- Sheppard, S; Sheppard, M; Long, J; Sanipelli, B; Tait, J. Runoff phosphorus retention in vegetated field margins on flat landscapes. Can J Soil Sci 2006, 86(5), 871–884. [Google Scholar] [CrossRef]
- Shigaki, F; Sharpley, A; Prochnow, LI. Source-related transport of phosphorus in surface runoff. J Environ Qual 2006, 35(6), 2229–2235. [Google Scholar] [CrossRef] [PubMed]
- Sims, JT; Simard, RR; Joern, BC. Phosphorus loss in agricultural drainage: historical perspective and current research. J Environ Qual 1998, 27(2), 277–293. [Google Scholar] [CrossRef]
- Singh, DK; Sale, PWG; Pallaghy, CK; McKenzie, BM. Phosphorus concentrations in the leaves of defoliated white clover affect abscisic acid formation and transpiration in drying soil. New Phytol 2000a, 146(2), 249–259. [Google Scholar] [CrossRef]
- Singh, DK; Sale, PWG; Pallaghy, CK; Singh, V. Role of proline and leaf expansion rate in the recovery of stressed white clover leaves with increased phosphorus concentration. New Phytol 2000b, 146(2), 261–269. [Google Scholar] [CrossRef]
- Singh, V; Pallaghy, CK; Singh, D. Phosphorus nutrition and tolerance of cotton to water stress: I. Seed cotton yield and leaf morphology. Field Crop Res 2006a, 96(2), 191–198. [Google Scholar] [CrossRef]
- Singh, V; Pallaghy, CK; Singh, D. Phosphorus nutrition and tolerance of cotton to water stress: II. Water relations, free and bound water and leaf expansion rate. Field Crop Res 2006b, 96(2), 199–206. [Google Scholar] [CrossRef]
- Sinore, T; Wang, F. Climate change impact and adaptation options in Sub-Saharan Africa: a systematic review. In Environment, Development and Sustainability; 2025; pp. 1–29. [Google Scholar] [CrossRef]
- Skendžić, S; Zovko, M; Živković, IP; Lešić, V; Lemić, D. The impact of climate change on agricultural insect pests. Insects 2021, 12(5). [Google Scholar] [CrossRef]
- Skidmore, M; Andarge, T; Foltz, J. The impact of extreme precipitation on nutrient runoff. Journal of the Agricultural and Applied Economics Association 2023, 2(4), 769–785. [Google Scholar] [CrossRef]
- Smil, V. Phosphorus in the environment: Natural flows and human interferences. Annu Rev Energ Env 2000, 25, 53–88. [Google Scholar] [CrossRef]
- Smith, D; Huang, C; Haney, R. Phosphorus fertilization, soil stratification, and potential water quality impacts. J Soil Water Conserv 2017, 72(5), 417–424. [Google Scholar] [CrossRef]
- Smith, DR; Harmel, RD; Williams, M; Haney, R; King, KW. Managing acute phosphorus loss with fertilizer source and placement: Proof of concept. Agricultural & Environmental Letters 2016, 1(1). [Google Scholar] [CrossRef]
- Sokal, K; Kachel, M. Impact of agriculture on greenhouse gas emissions—a review. Energies 2025, 18(9), 2272. [Google Scholar] [CrossRef]
- Strong, WM; Soper, RJ. Phosphorus utilization by flax, wheat, rape, and buckwheat from a band or pellet-like application. I. Reaction zone proliferation. Agron J 1974a, 66, 597–601. [Google Scholar] [CrossRef]
- Strong, WM; Soper, RJ. Phosphorus utilization by flax, wheat, rape, and buckwheat from a band or pellet-like application. II. Influence of reaction zone phosphorus concentration and soil phosphorus supply. Agron J 1974b, 66, 601–605. [Google Scholar] [CrossRef]
- Sun, W; Fleisher, D; Timlin, D; Ray, C; Wang, Z; Sahila, B; Reddy, V. Does drought stress eliminate the benefit of elevated CO2 on soybean yield? Using an improved model to link crop and soil water relations. Agr Forest Meteorol 2023, 343, 109747. [Google Scholar] [CrossRef]
- Sun, Y; Chen, X. Phosphorus fertilization enhances terrestrial carbon cycling in phosphorus-deficient ecosystems. J Environ Manage 2024, 351, 119941. [Google Scholar] [CrossRef]
- Suriyagoda, L; Ryan, M; Renton, M; Lambers, H. Plant responses to limited moisture and phosphorus availability: a meta-analysis. 2014. [Google Scholar]
- Syers, J; Johnston, A; Curtin, D. Efficiency of soil and fertilizer phosphorus use. In FAO Fertilizer and Plant Nutrition Bulletin No. 18; FAO: Rome, 2008. [Google Scholar]
- Tao, J; Liu, X. Combined application of nitrogen and phosphorus fertilizers increases soil organic carbon storage in cropland soils. Eur J Agron 2025, 168, 127607. [Google Scholar] [CrossRef]
- Tariq, A; Pan, K; Olatunji, OA; Graciano, C; Li, Z; Li, N; Song, D; Sun, F; Wu, X; Dakhil, MA; Sun, X; Zhang, L. Impact of phosphorus application on drought resistant responses of Eucalyptus grandis seedlings. Physiol Plant 2019, 166(4), 894–908. [Google Scholar] [CrossRef] [PubMed]
- Tariq, A; Pan, K; Olatunji, OA; Graciano, C; Li, Z; Sun, F; Sun, X; Song, D; Chen, W; Zhang, A; Wu, X; Zhang, L; Mingrui, D; Xiong, Q; Liu, C. Phosphorous application improves drought tolerance of Phoebe zhennan. Frontiers in Plant Science 2017, 8–2017. [Google Scholar] [CrossRef] [PubMed]
- Terrer, C; Jackson, RB; Prentice, IC; Keenan, TF; Kaiser, C; Vicca, S; Fisher, JB; Reich, PB; Stocker, BD; Hungate, BA; Peñuelas, J; McCallum, I; Soudzilovskaia, NA; Cernusak, LA; Talhelm, AF; Van Sundert, K; Piao, S; Newton, PCD; Hovenden, MJ; Blumenthal, DM; Liu, YY; Müller, C; Winter, K; Field, CB; Viechtbauer, W; Van Lissa, CJ; Hoosbeek, MR; Watanabe, M; Koike, T; Leshyk, VO; Polley, HW; Franklin, O. Nitrogen and phosphorus constrain the CO2 fertilization of global plant biomass. Nature Climate Change 2019, 9(9), 684–689. [Google Scholar] [CrossRef]
- Thamarai, P; Deivayanai, VC; Saravanan, A; Vickram, AS; Yaashikaa, PR. Carbon mitigation in agriculture: Pioneering technologies for a sustainable food system. Trends Food Sci Technol 2024, 147, 104477. [Google Scholar] [CrossRef]
- Tiessen, K; Elliott, J; Yarotski, J; Lobb, D; Flaten, D; Glozier, N. Conventional and conservation tillage: Influence on seasonal runoff, sediment, and nutrient losses in the Canadian prairies. J Environ Qual 2010, 39(3), 964–980. [Google Scholar] [CrossRef]
- Tisdale, SL; Nelson, WL; Beaton, JD; Havlin, JL. Soil Fertility and Fertilizers, 5th ed.; MacMillan Publishing: Coppany, New York, 1993. [Google Scholar]
- Tittonell, P; Giller, KE. When yield gaps are poverty traps: The paradigm of ecological intensification in African smallholder agriculture. Field Crop Res 2013, 143, 76–90. [Google Scholar] [CrossRef]
- Tofa, AI; Kamara, A; Babaji, B; Adnan, A; Ademulegun, T; Bebeley, J. Evaluating the use of nitrogen and phosphorous fertilization as crop management options for maize adaptation to climate change in the Nigeria savannas. Environmental Research Communications 2023, 5(5), 055001. [Google Scholar] [CrossRef]
- Urban, D; Roberts, MJ; Schlenker, W; Lobell, DB. Projected temperature changes indicate significant increase in interannual variability of U.S. maize yields. Climatic Change 2012, 112(2), 525–533. [Google Scholar] [CrossRef]
- Ureta, C; González, EJ; Espinosa, A; Trueba, A; Piñeyro-Nelson, A; Álvarez-Buylla, ER. Maize yield in Mexico under climate change. Agric Syst 2020, 177, 102697. [Google Scholar] [CrossRef]
- Van Bochove, E; Thériault, G; Dechmi, F; Rousseau, A; Quilbé, R; Leclerc, M; Goussard, N. Indicator of risk of water contamination by phosphorus from Canadian agricultural land. Water Sci Technol 2006, 53(2), 303. [Google Scholar] [CrossRef] [PubMed]
- Verburg, K; Armstrong, RD; Biggs, JS; Wilhelm, NS; Haling, RE; Sandral, G; Uddin, S; Mason, SD; McBeath, TM. Identifying soil and climate drivers of soil water conditions favourable for deep phosphorus placement for wheat in Australia using spatial modelling. Field Crop Res 2024, 315, 109448. [Google Scholar] [CrossRef]
- Walling, E; Vaneeckhaute, C. Greenhouse gas emissions from inorganic and organic fertilizer production and use: A review of emission factors and their variability. J Environ Manage 2020, 276, 111211. [Google Scholar] [CrossRef] [PubMed]
- Wang, G; Liang, Y; Ren, F; Yang, X; Mi, Z; Gao, Y; George, TS; Zhang, Z. Greenhouse gas emissions from the Tibetan Alpine grassland: effects of nitrogen and phosphorus addition. Sustainability 2018, 10(12), 4454. [Google Scholar] [CrossRef]
- Wang, S; Zhang, Y; Ju, W; Chen, JM; Ciais, P; Cescatti, A; Sardans, J; Janssens, IA; Wu, M; Berry, JA; Campbell, E; Fernández-Martínez, M; Alkama, R; Sitch, S; Friedlingstein, P; Smith, WK; Yuan, W; He, W; Lombardozzi, D; Kautz, M; Zhu, D; Lienert, S; Kato, E; Poulter, B; Sanders, TGM; Krüger, I; Wang, R; Zeng, N; Tian, H; Vuichard, N; Jain, AK; Wiltshire, A; Haverd, V; Goll, DS; Peñuelas, J. Recent global decline of CO2 fertilization effects on vegetation photosynthesis. Science 2020, 370(6522), 1295–1300. [Google Scholar] [CrossRef]
- Wang, Z-B; Chen, J; Mao, S-C; Han, Y-C; Chen, F; Zhang, L-F; Li, Y-B; Li, C-D. Comparison of greenhouse gas emissions of chemical fertilizer types in China's crop production. J Cleaner Prod 2017, 141, 1267–1274. [Google Scholar] [CrossRef]
- Wang, Z; Zhang, TQ; Tan, CS; Xue, L; Bukovsky, M; Qi, ZM. Modeling impacts of climate change on crop yield and phosphorus loss in a subsurface drained field of Lake Erie region, Canada. Agric Syst 2021, 190, 103110. [Google Scholar] [CrossRef]
- Weiseth, B. Impact of fertilizer placement on phosphorus in crop, soil, and run-off water in a brown Chernozem in south-central Saskatchewan; University of Saskatchewan, 2015. [Google Scholar]
- Wiens, JT. Agronomic and environmental effects of phosphorus fertilizer application methods; University of Saskatchewan: Saskatoon, SK, 2017. [Google Scholar]
- Wilander, A; Persson, G. Recovery from eutrophication: Experiences of reduced phosphorus input to the four largest lakes of Sweden. Ambio 2001, 30(8), 475–485. [Google Scholar] [CrossRef]
- Wilson, HF; Satchithanantham, S; Moulin, AP; Glenn, AJ. Soil phosphorus spatial variability due to landform, tillage, and input management: A case study of small watersheds in southwestern Manitoba. Geoderma 2016, 280, 14–21. [Google Scholar] [CrossRef]
- Wood, S; Cowie, A. A review of greenhouse gas emission factors for fertiliser production. 2004. [Google Scholar]
- Wood, TE; Matthews, D; Vandecar, K; Lawrence, D. Short-term variability in labile soil phosphorus is positively related to soil moisture in a humid tropical forest in Puerto Rico. Biogeochemistry 2016, 127(1), 35–43. [Google Scholar] [CrossRef]
- Wright, CR; Amrani, M; Akbar, MA; Heaney, DJ; Vanderwel, DS. Determining phosphorus release rates to runoff from selected Alberta soils using laboratory rainfall simulation. J Environ Qual 2006, 35(3), 806–814. [Google Scholar] [CrossRef] [PubMed]
- Wu, H; MacDonald, GK; Galloway, JN; Zhang, L; Gao, L; Yang, L; Yang, J; Li, X; Li, H; Yang, T. The influence of crop and chemical fertilizer combinations on greenhouse gas emissions: A partial life-cycle assessment of fertilizer production and use in China. Resources, Conservation and Recycling 2021, 168, 105303. [Google Scholar] [CrossRef]
- Wu, W; Ma, B. Integrated nutrient management (INM) for sustaining crop productivity and reducing environmental impact: A review. Sci Total Environ 2015, 512-513, 415–427. [Google Scholar] [CrossRef]
- Xu, X; Wang, L; Sun, D; Liu, L; Banson, KE. The impact of climate change on yield potential of maize across China. International Journal of Plant Production 2017, 11(1), 47–63. [Google Scholar] [CrossRef]
- Yates, AG; Culp, JM; Chambers, PA. Estimating nutrient production from human activities in subcatchments of the Red River, Manitoba. Journal of Great Lakes Research 2012, 38, 106–114. [Google Scholar] [CrossRef]
- Zhang, F; Wang, Q; Hong, J; Chen, W; Qi, C; Ye, L. Life cycle assessment of diammonium- and monoammonium-phosphate fertilizer production in China. J Cleaner Prod 2017, 141, 1087–1094. [Google Scholar] [CrossRef]
- Zhang, H; Shi, L; Lu, H; Shao, Y; Liu, S; Fu, S. Drought promotes soil phosphorus transformation and reduces phosphorus bioavailability in a temperate forest. Sci Total Environ 2020, 732, 139295. [Google Scholar] [CrossRef]
- Zhang, H; Xiao, T; Shi, Z; Ren, R; Jiang, Y; Ding, Y; Wang, S. Enhanced rice phosphorus use efficiency under elevated atmospheric CO2 and its drivers. Agr Ecosyst Environ 2025, 393, 109827. [Google Scholar] [CrossRef]
- Zhang, Z; Wei, J; Li, J; Jia, Y; Wang, W; Li, J; Lei, Z; Gao, M. The impact of climate change on maize production: Empirical findings and implications for sustainable agricultural development. Frontiers in Environmental Science 2022, 10–2022. [Google Scholar] [CrossRef]
- Zhao, H; Sun, B; Lu, F; Wang, X; Zhuang, T; Zhang, G; Ouyang, Z. Roles of nitrogen, phosphorus, and potassium fertilizers in carbon sequestration in a Chinese agricultural ecosystem. Climatic Change 2017, 142(3), 587–596. [Google Scholar] [CrossRef]
- Zou, T; Zhang, X; Davidson, EA. Global trends of cropland phosphorus use and sustainability challenges. Nature 2022, 611(7934), 81–87. [Google Scholar] [CrossRef]
Figure 1.
Projected regional changes in hottest day temperature, soil moisture and annual maximum 1 day precipition at various climate change scenarios (IPCC 2023).
Figure 1.
Projected regional changes in hottest day temperature, soil moisture and annual maximum 1 day precipition at various climate change scenarios (IPCC 2023).
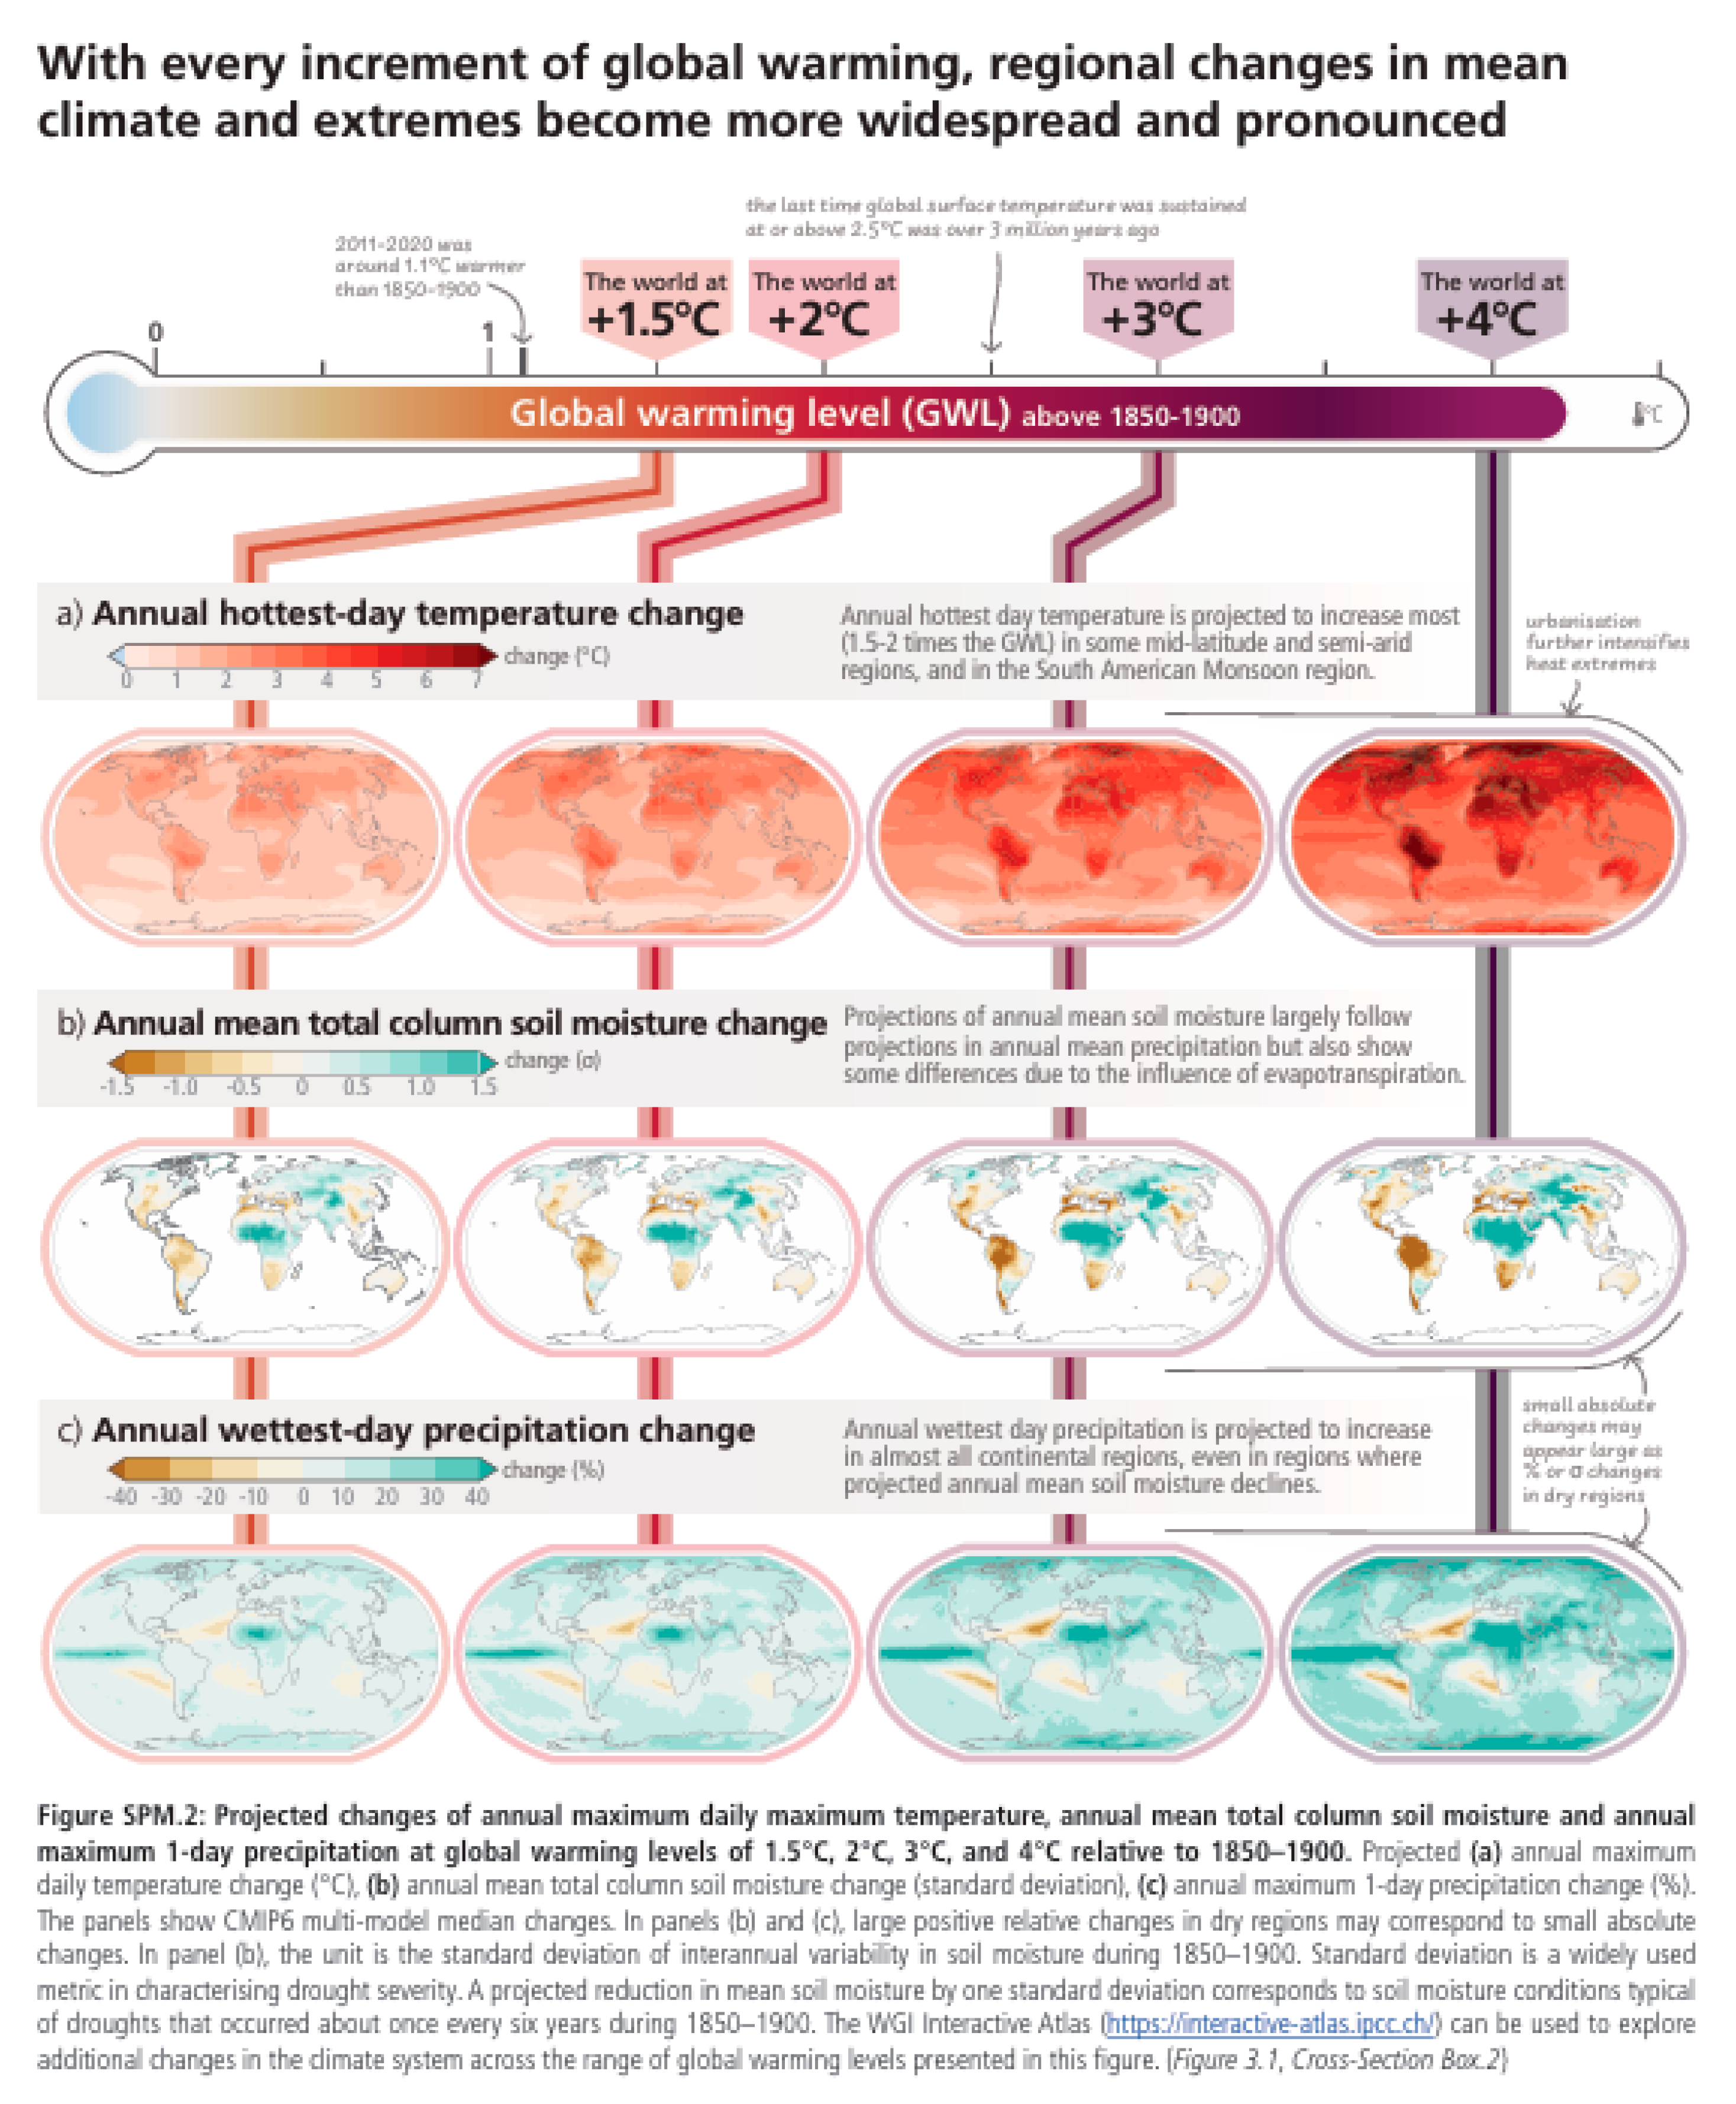
Figure 2.
adapted from IPCC (IPCC 2023). Changes in maize yield by 2080–2099 relative to 1986–2005 at projected GWLs of 1.6°C–2.4°C (2.0°C), 3.3°C–4.8°C (4.1°C) and 3.9°C–6.0°C (4.9°C). Median yield changes from an ensemble of 12 crop models, each driven by bias-adjusted outputs from 5 Earth system models, from the Agricultural Model Intercomparison and Improvement Project (AgMIP) and the Inter-Sectoral Impact Model Intercomparison Project (ISIMIP). Maps depict 2080–2099 compared to 1986–2005 for current growing regions (>10 ha), with the corresponding range of future global warming levels shown under SSP1 2.6, SSP3-7.0 and SSP5-8.5, respectively. Hatching indicates areas where <70% of the climate-crop model combiantions agree on the sign of impact. (IPCC 2023).
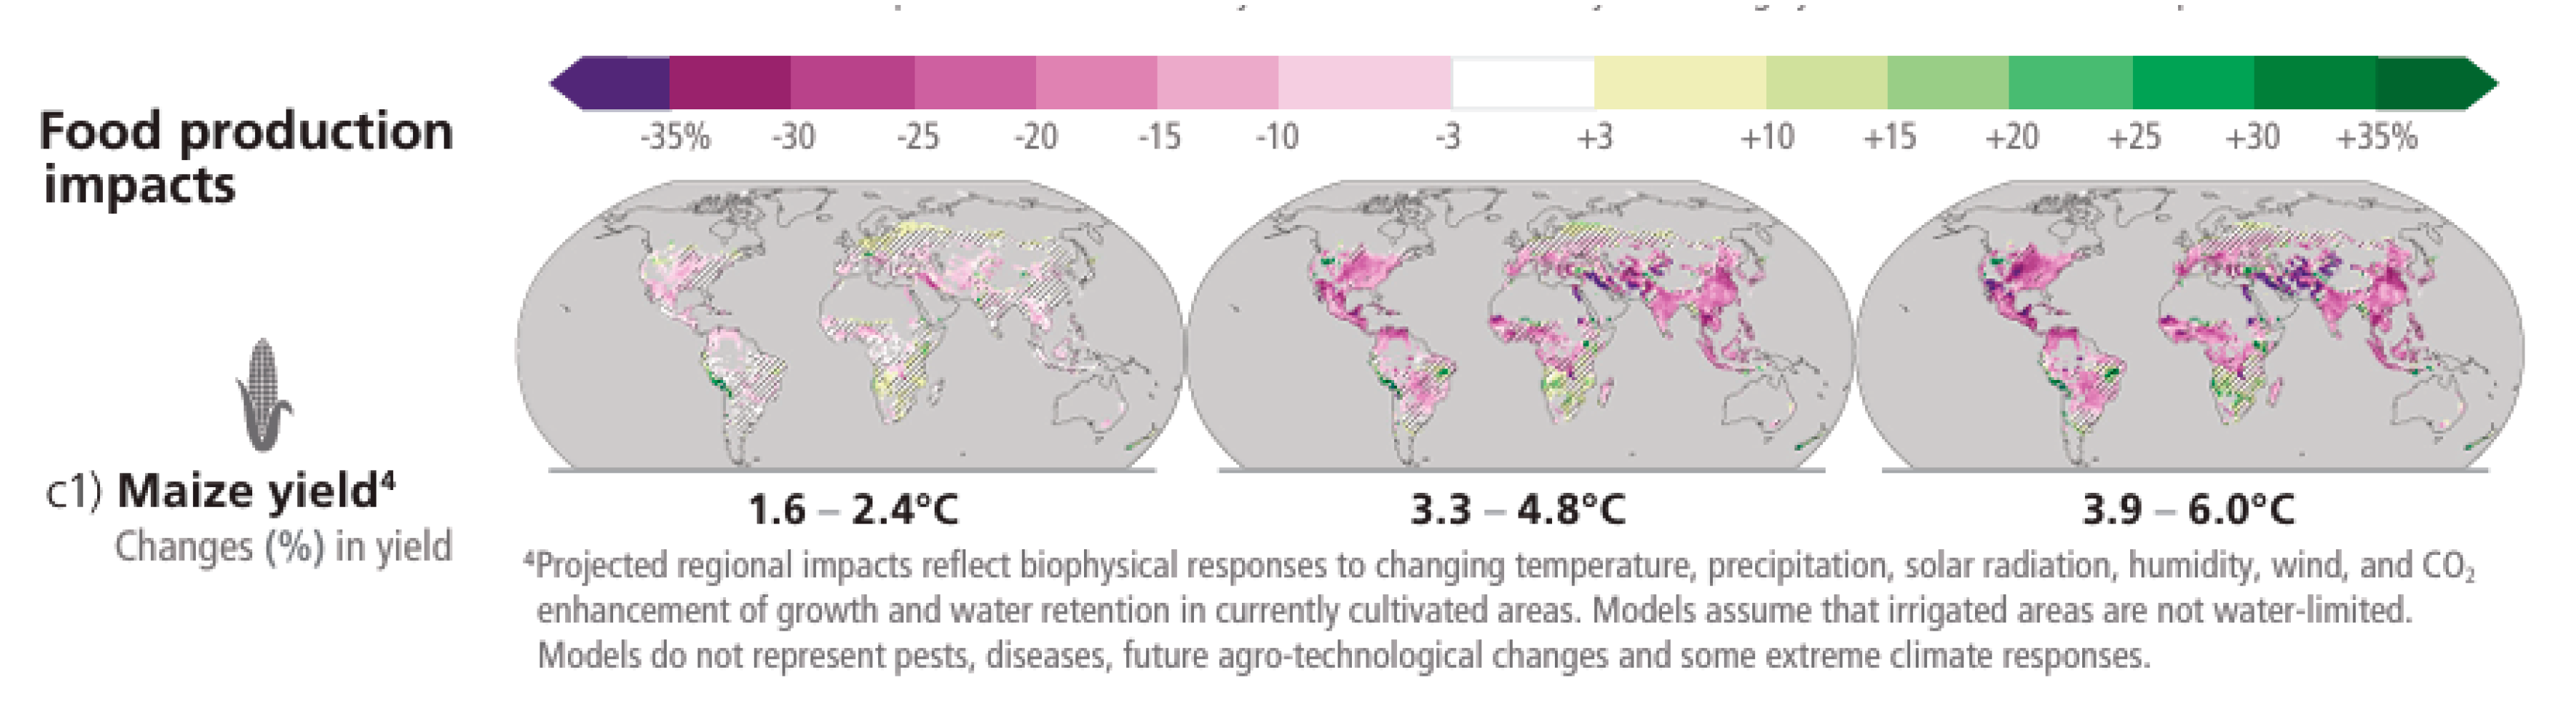
Figure 3.
Global map of agronomic P imbalances for the year 2000 expressed per unit of cropland area in each 0.5 grid cell. The P surpluses and deficits are each classified according to quartiles globally (0-25th, 25-50th, 50-75th and 75-100th percentiles) (MacDonald et al. 2011).
Figure 3.
Global map of agronomic P imbalances for the year 2000 expressed per unit of cropland area in each 0.5 grid cell. The P surpluses and deficits are each classified according to quartiles globally (0-25th, 25-50th, 50-75th and 75-100th percentiles) (MacDonald et al. 2011).
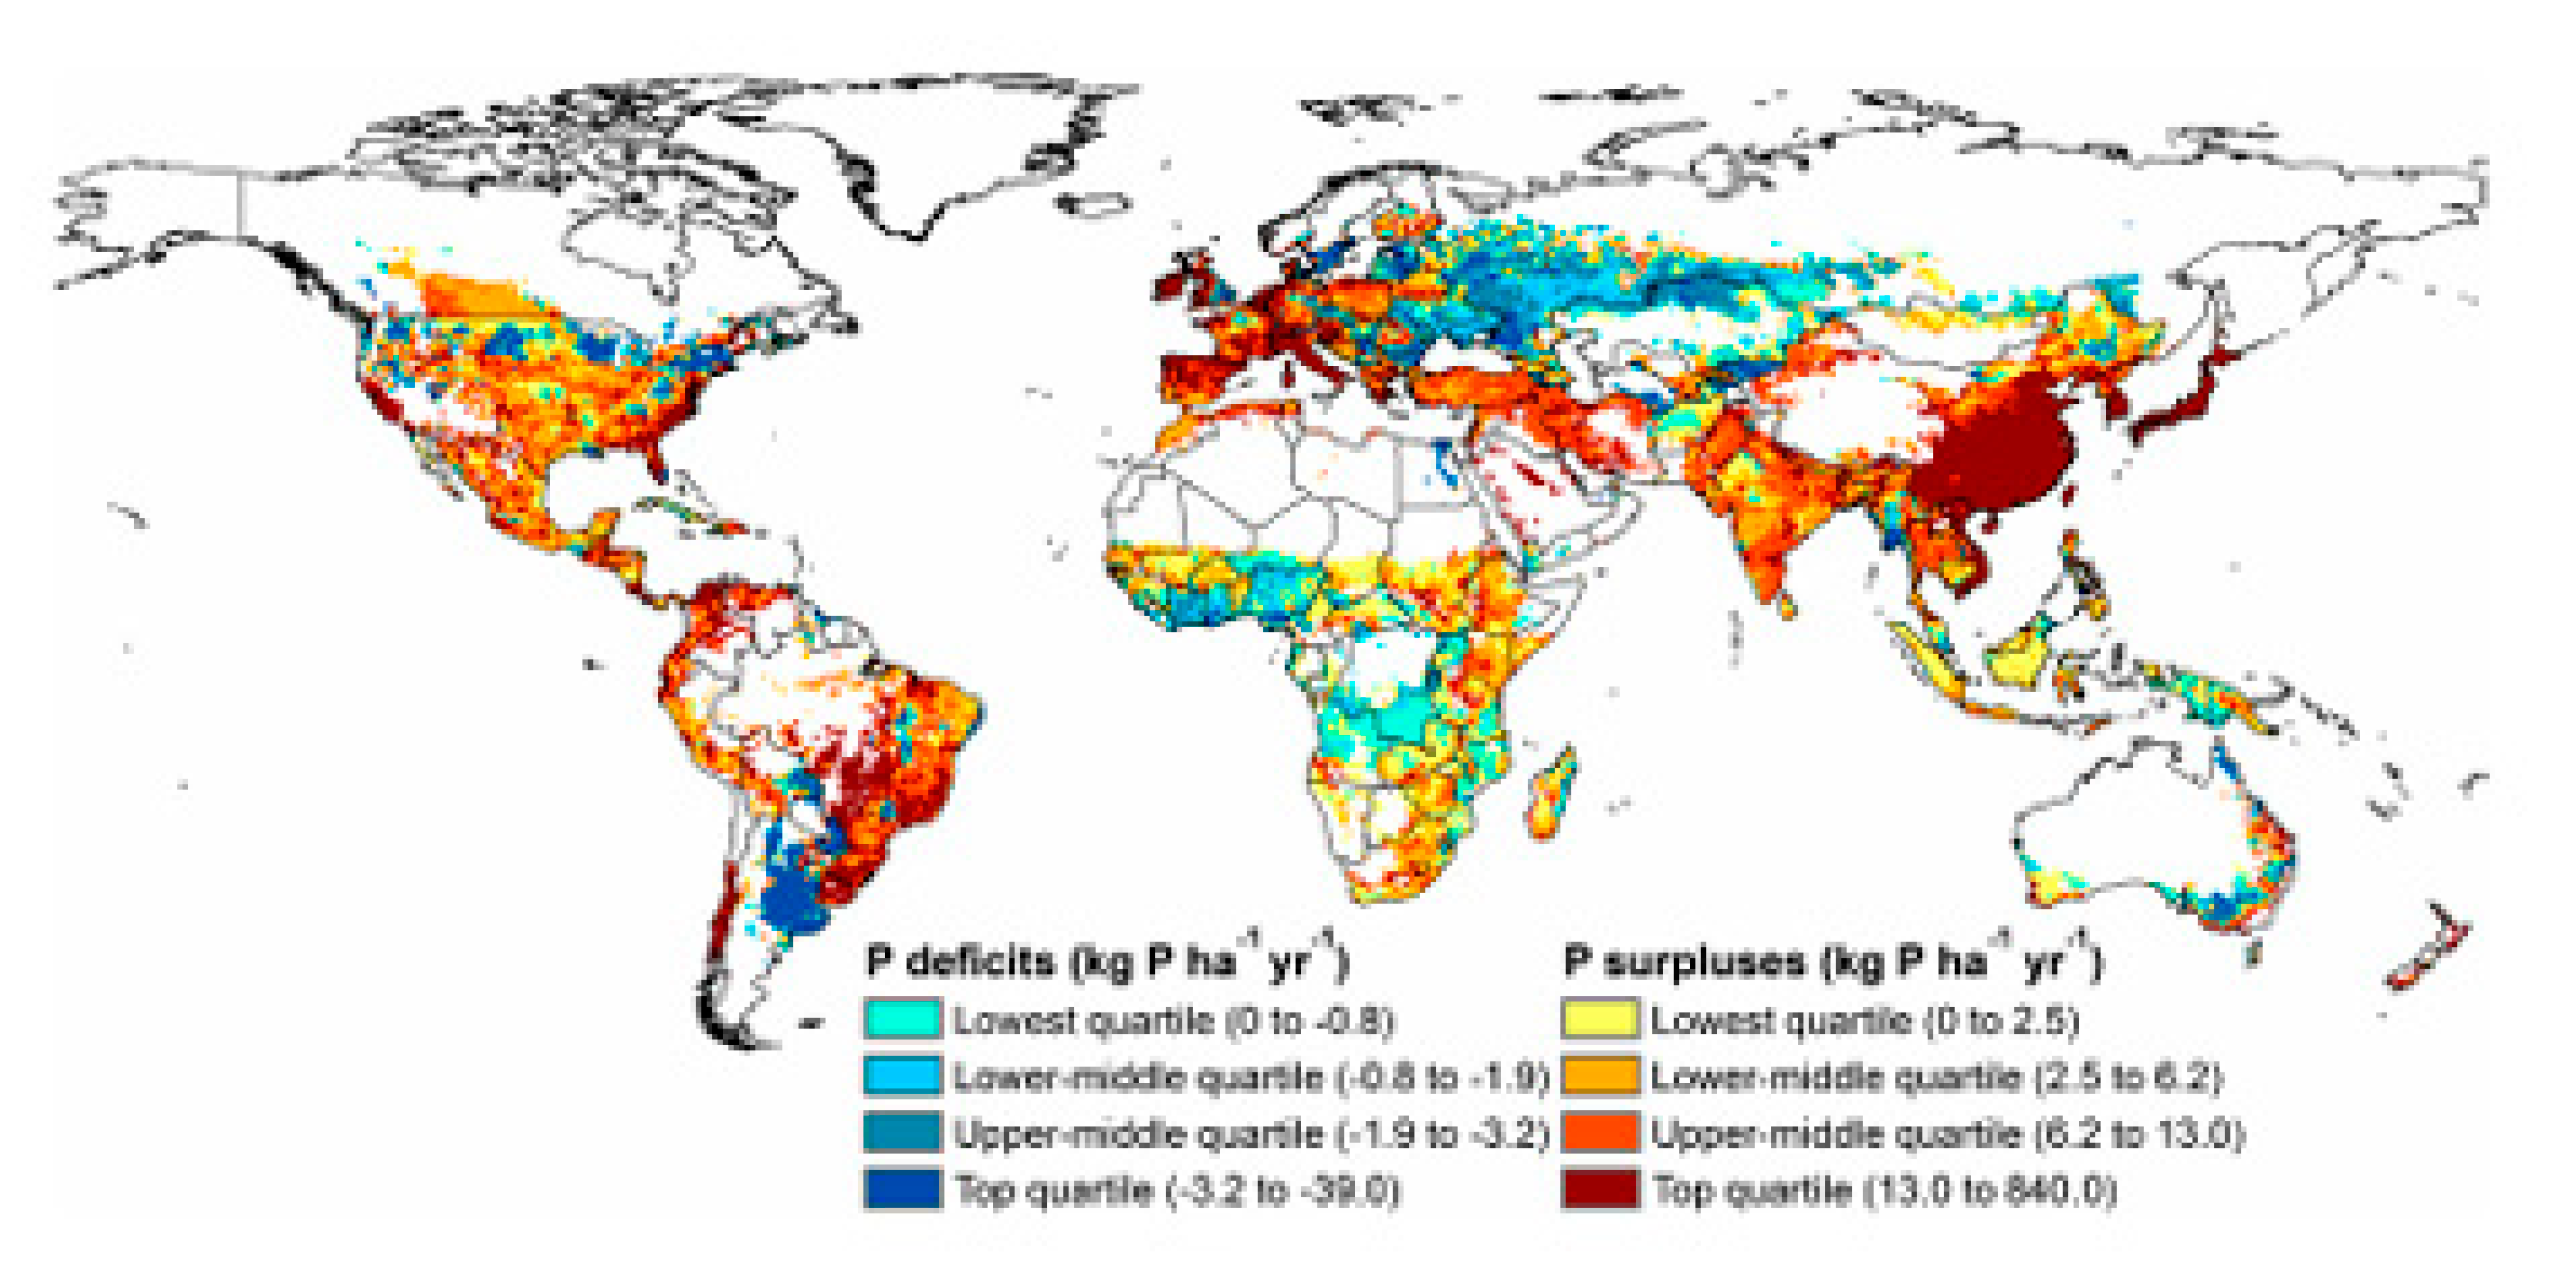
Figure 4.
Processes that transport phosphorus to water from agricultural land (Sharpley, A. N., Daniel, T., Sims, T., Lemunyon, J., Stevens, R., and Parry, R. 2003. Agricultural phosphorus and eutrophication. ARS-149, USDA-ARS. https://www.ars.usda.gov/oc/np/phoseutro2/phoseutrointro2ed/.
Figure 4.
Processes that transport phosphorus to water from agricultural land (Sharpley, A. N., Daniel, T., Sims, T., Lemunyon, J., Stevens, R., and Parry, R. 2003. Agricultural phosphorus and eutrophication. ARS-149, USDA-ARS. https://www.ars.usda.gov/oc/np/phoseutro2/phoseutrointro2ed/.
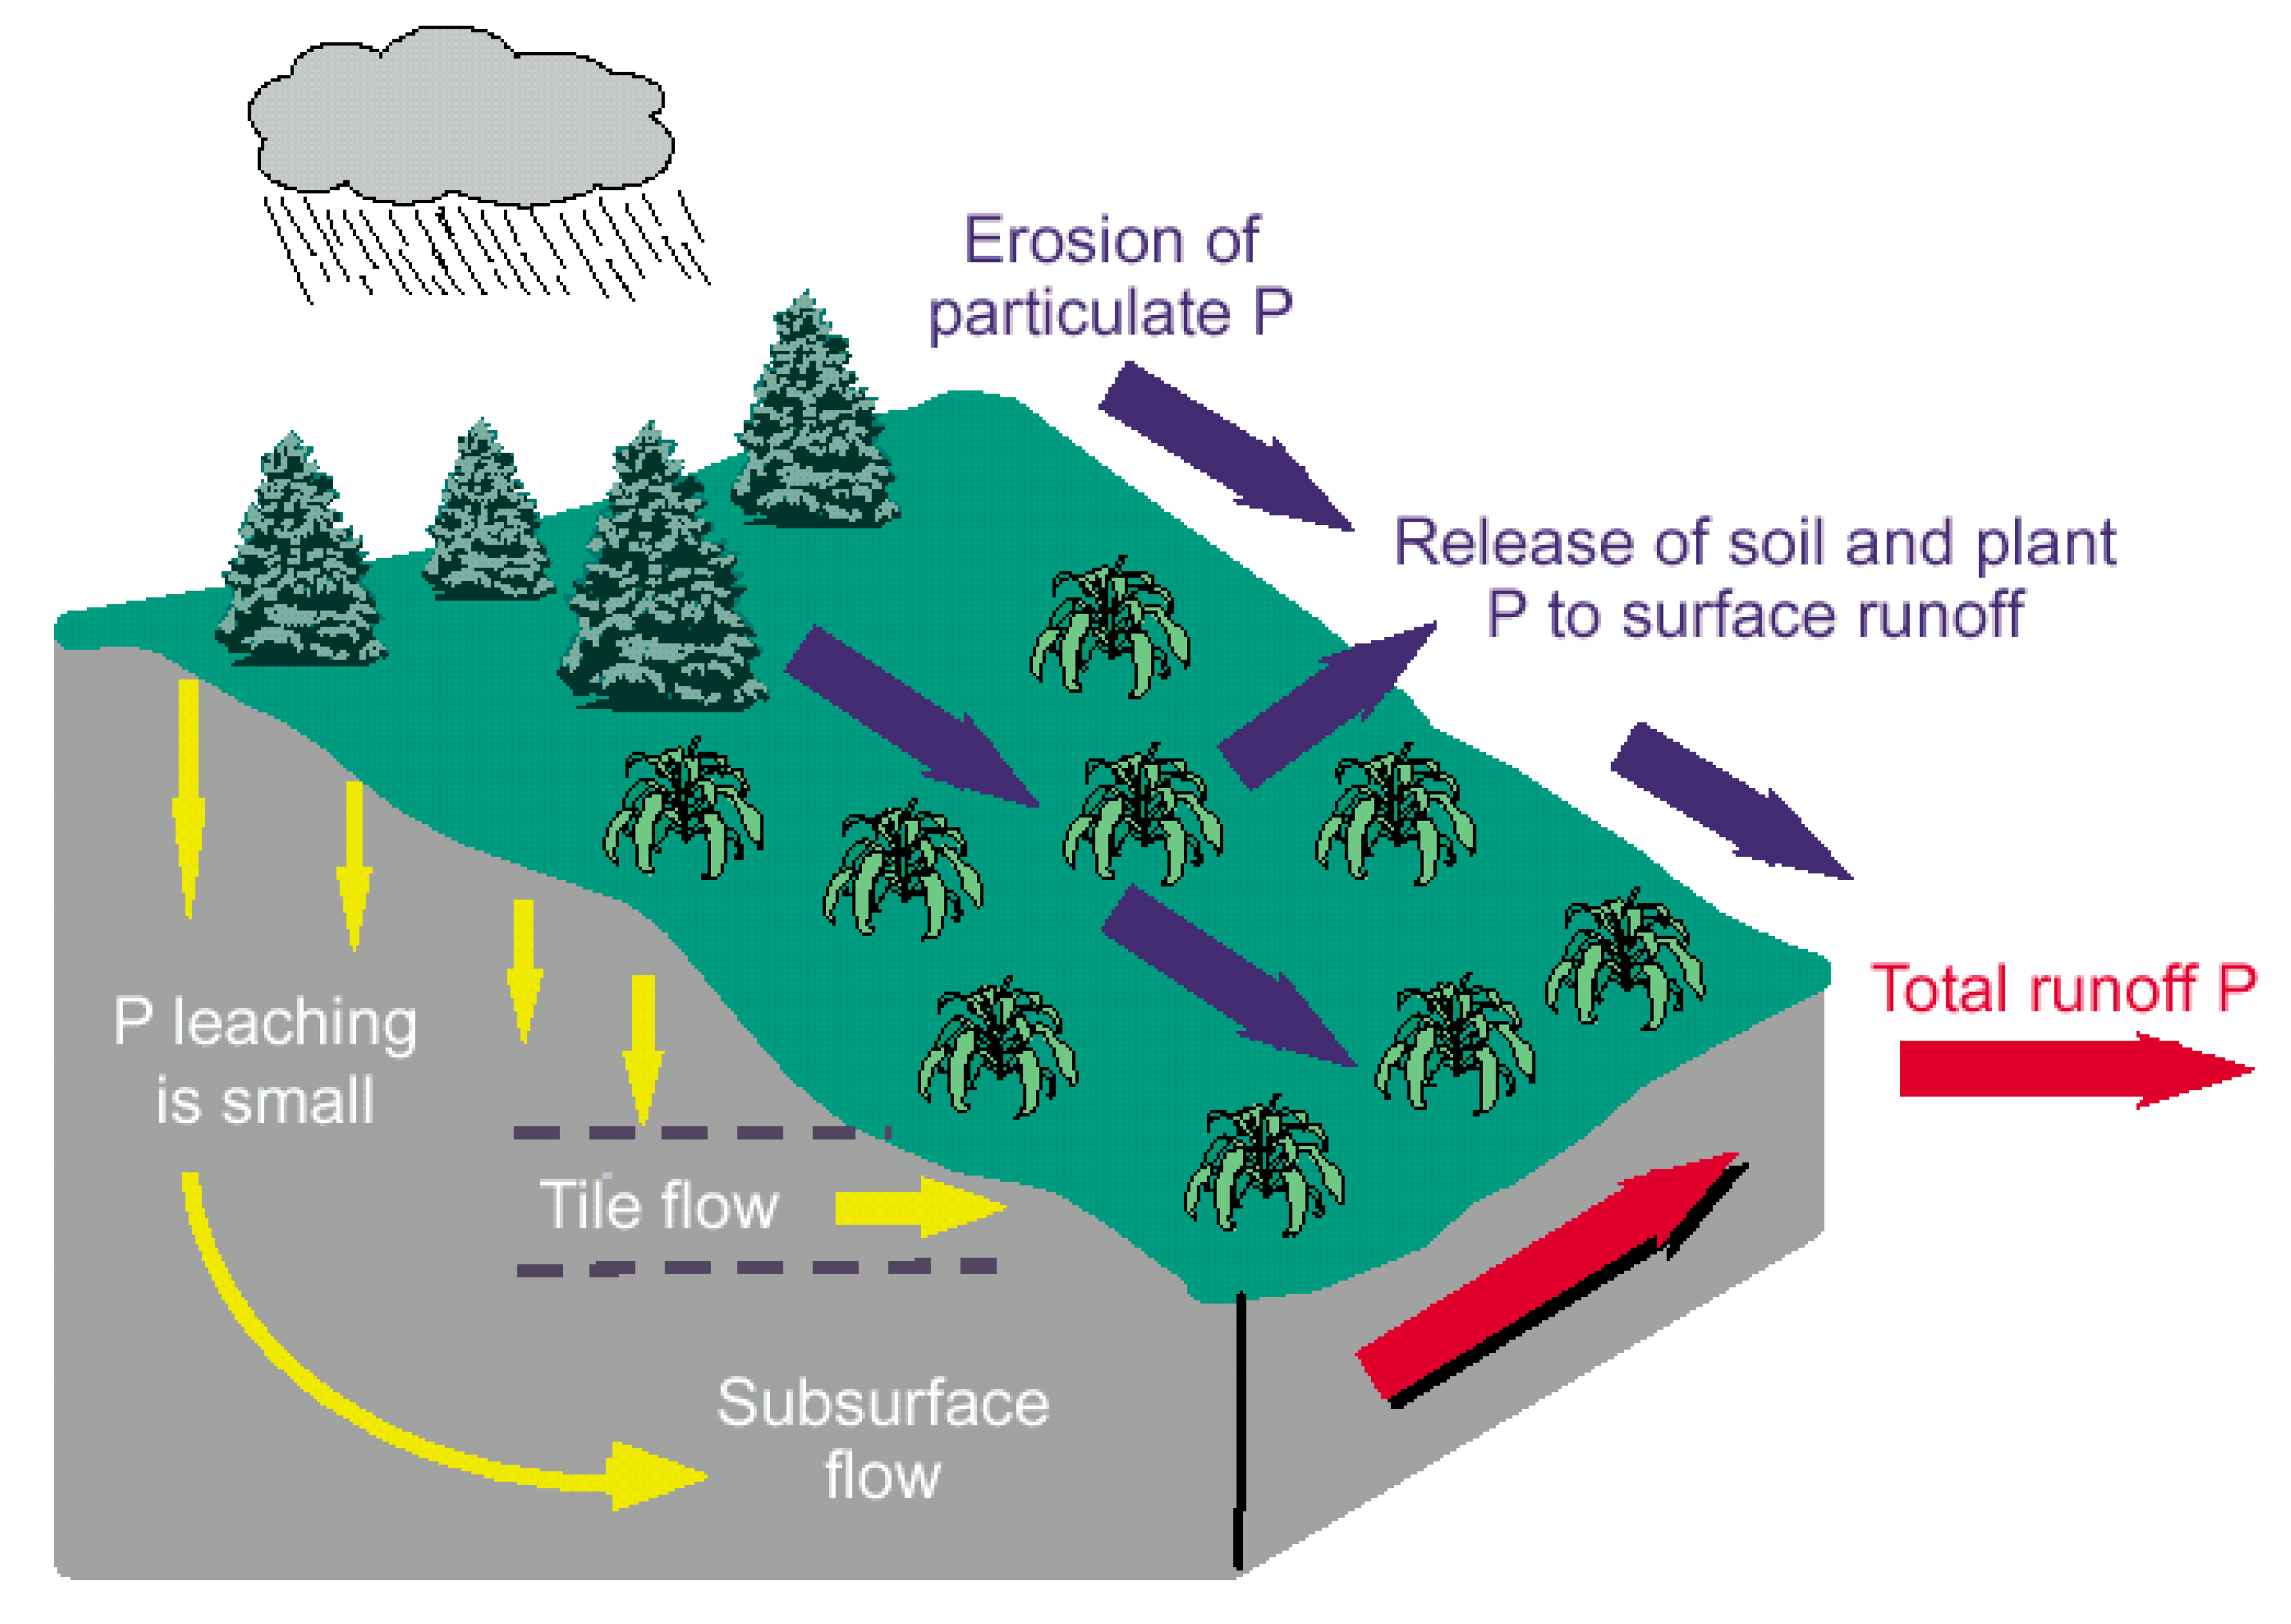
Figure 5.
The 4R nutrient stewardship concept defines the right source, rate, time, and place for plant nutrient application as those producing the economic, social, and environmental outcomes desired by all stakeholders to the soil-plant ecosystem (Roberts 2010) figure credit: http://www.ipni.net/ipniweb/portal/4r.nsf/article/communicationsguide.
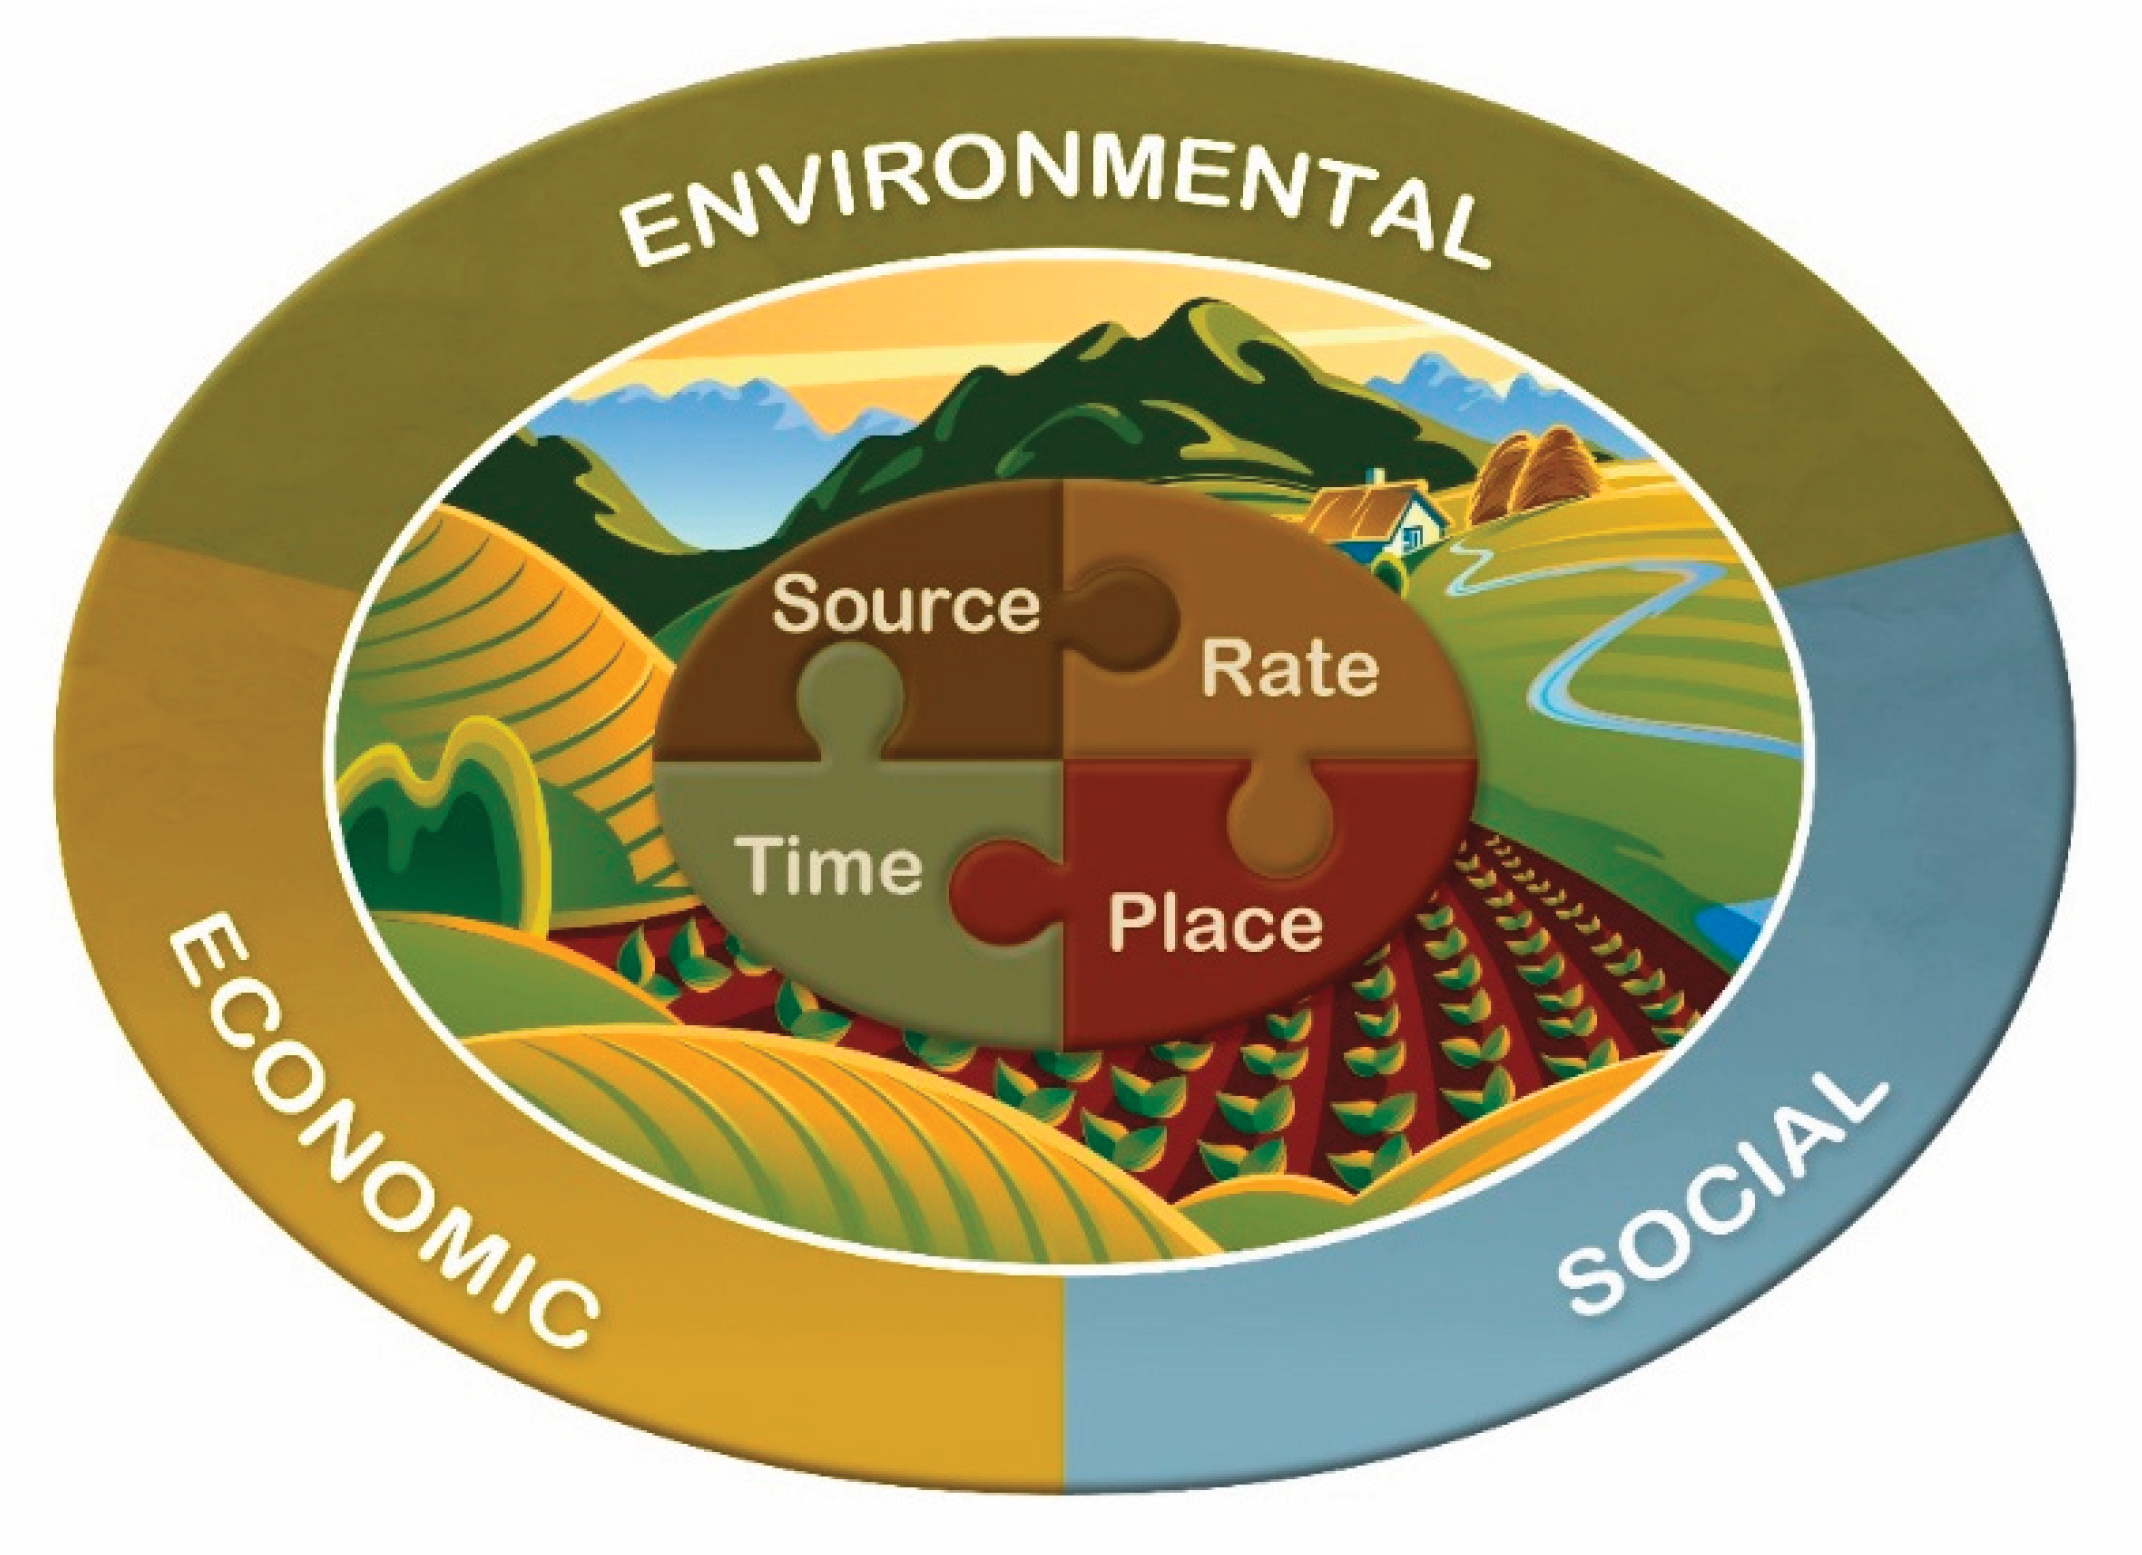
Disclaimer/Publisher’s Note: The statements, opinions and data contained in all publications are solely those of the individual author(s) and contributor(s) and not of MDPI and/or the editor(s). MDPI and/or the editor(s) disclaim responsibility for any injury to people or property resulting from any ideas, methods, instructions or products referred to in the content. |
© 2025 by the author. Licensee MDPI, Basel, Switzerland. This article is an open access article distributed under the terms and conditions of the Creative Commons Attribution (CC BY) license (https://creativecommons.org/licenses/by/4.0/).
Copyright: This open access article is published under a Creative Commons CC BY 4.0 license, which permit the free download, distribution, and reuse, provided that the author and preprint are cited in any reuse.


