Preprint
Article

This version is not peer-reviewed.

Monitoring Spatiotemporal Dynamics of Spartina alternifloraPhragmites australis Mixed Ecotone in Chongming Dongtan Wetland Integrated with Three-Dimensional Feature Space and Multi-Threshold Otsu Segmentation

Submitted:

02 December 2025

Posted:

02 December 2025

You are already at the latest version

Abstract

The Chongming Dongtan wetland, a representative coastal wetland in East Asia, is subject to a significant ecological threat from the invasive species Spartina alterniflora. The mixed ecotone formed between this invasive species and the native Phragmites australis serves as a highly sensitive and critical indicator of alterations in wetland ecosystem structure and function. Using spring and autumn Sentinel-2 imagery from 2016 to 2023, this study developed a method that integrates a three-dimensional feature space with multi-threshold Otsu segmentation to accurately extract the mixed S. alternifloraP. australis ecotone. The spatiotemporal dynamics of the mixed ecotone were analyzed at multiple temporal scales using a centroid migration model and the Seasonal Area Ratio (SAR) index. The results suggest that: (1) Near-infrared reflectance and NDVI were identified as the optimal spectral indices for spring and autumn, respectively, which led to a classification achieving an overall accuracy of 87.3±1.4% and a Kappa coefficient of 0.84±0.02. Notably, the mixed ecotone was mapped with producer’s and user’s accuracies of 85.2% and 83.6%. (2) The vegetation followed a distinct land-to-sea ecological sequence of “pure P. australis–mixed ecotone–pure S. alterniflora”, predominantly distributed as an east–west trending belt. This pattern was fragmented by tidal creeks and micro-topography in the northwest, contrasting with geometrically regular linear anomalies in the central area, indicative of human engineering. (3) The ecotone saw continuous seaward expansion throughout the 2016–2023 period. Spring exhibited a consistent annual area growth of 13.93% and a stable seaward centroid migration, whereas autumn exhibited significant intra-annual fluctuations in both area and centroid due to extreme climate events. (4) The SAR index uncovered a fundamental transition in the seasonal competition pattern in 2017, initiating a seven-year spring-dominant phase after a single year of autumn dominance. This spring-dominated era exhibited a distinctive sawtooth fluctuation pattern, indicative of competitive dynamics arising from the phenological advancement of P. australis combined with the niche penetration of S. alterniflora. This study elucidates the multi-scale competition and succession mechanisms between S. alterniflora and P. australis, thus providing a scientific underpinning for effective invasive species control and ecological restoration in coastal wetlands.

Keywords: 
;  ;  ;  ;  ;  ;  

1. Introduction

Spartina alterniflora, a species indigenous to the coastal zones of North America, has exhibited extensive proliferation following its introduction to China in 1979 [1]. More than two decades after its introduction, it was designated as one of China’s first official invasive alien species [2]. In the Chongming Dongtan wetland within the Yangtze Estuary, S. alterniflora undergoes intense niche competition with the native dominant species Phragmites australis for limited resources [3]. The mixed ecotone formed between these two species constitutes a critical ecologically sensitive zone that maintains the structural and functional stability of the wetland ecosystem [4]. Consequently, precisely monitoring the spatiotemporal dynamics of the ecotone is a crucial prerequisite for containing the further spread of S. alterniflora [5] and preserving coastal wetland biodiversity [6].
Current research on monitoring the spatiotemporal dynamics of ecotones [7] primarily relies on multi-source remote sensing data and long-term time-series analysis, which has converged into three typical paradigms. The first paradigm involves long-term monitoring by using medium-to-low-resolution imagery, such as analyses of land-use changes in agro-pastoral ecotones in various regions across China based on national land survey data (NLSD) or Wuhan University’s CLCD dataset [8,9]. The second paradigm focuses on static boundary extraction by using high-resolution imagery. For instance, Yao et al. [10] utilized GF-1 data to extract the S. alterniflora–P. australis mixed ecotone in the Chongming Dongtan wetland, while Döweler et al. [7] detected the spatial distribution of the alpine treeline ecotone in the Southern Alps of New Zealand by using radar data. The third paradigm employs multi-platform collaborative observation, as demonstrated by Dong et al. [11], who integrated satellite and unmanned aerial vehicle (UAV) remote sensing to monitor a mangrove–salt marsh ecotone in Guangxi’s Dandou Sea.
Although previous studies have established remote sensing methodologies for ecotones [12], significant challenges are still faced in the high-accuracy spatiotemporal monitoring of the intertidal S. alterniflora–P. australis ecotone. Spatially, periodic tidal inundation leads to spectral mixing of vegetation signatures, while micro-topographic variations across the tidal flat further exacerbate spectral heterogeneity by modulating the duration of tidal immersion [13]. Traditional two-dimensional remote sensing methods [14,15], lacking support from three-dimensional spatial features, thus exhibit limited accuracy in identifying small-scale mixed ecotones. Temporally, there is a lack of analytical models capable of resolving phenological dynamics across monthly, seasonal, and annual scales [16]. This gap impedes a deeper mechanistic understanding of the competitive reversal in spring and autumn [17], which arises from the earlier sprouting of P. australis and the later senescence of S. alterniflora. Elucidating this mechanism has become a critical scientific bottleneck in achieving precise control of this invasive species.
To address the aforementioned challenges [18,19], this study proposes a methodology that integrates a three-dimensional feature space (X: Longitude, Y: Latitude, Z: Spectrum) with multi-threshold Otsu segmentation. By incorporating pixel-level geographic coordinates to generate three-dimensional scatterplots, the proposed method quantifies the modulation effects of tidal inundation and micro-topography on spectral responses, thereby addressing the limitations of two-dimensional methods, which often misclassify pixels due to neglected spatial context [20]. Furthermore, it leverages visible and near-infrared bands alongside the NDVI to establish multi-temporal adaptive thresholds, overcoming the issue of spectral homogenization inherent in single-date classifications [21]. In contrast to the seasonal spectral index method proposed by Yao et al. [10], this research further integrates three-dimensional geographic features with both inter-annual and intra-annual time-series tracking, establishing a dynamic monitoring model centered on the “Spatial–Phenological–Expansion” nexus.
Guided by this framework, this study adopts the Chongming Dongtan wetland as the study area and uses a time-series of Sentinel-2 imagery (2016–2023) to address the following objectives: (1) to achieve high-accuracy extraction of the S. alterniflora–P. australis mixed ecotone; and (2) to combine centroid migration and the Seasonal Area Ratio (SAR) index to characterize the ecotone’s expansion trajectory and competitive dynamics across multiple temporal scales. This research aims to provide critical methodological support and a decision-making basis for the dynamic monitoring of invasive species, analysis of competitive mechanisms, and ecological management in coastal wetlands.

2. Study Area, Data Sources, and Methodology
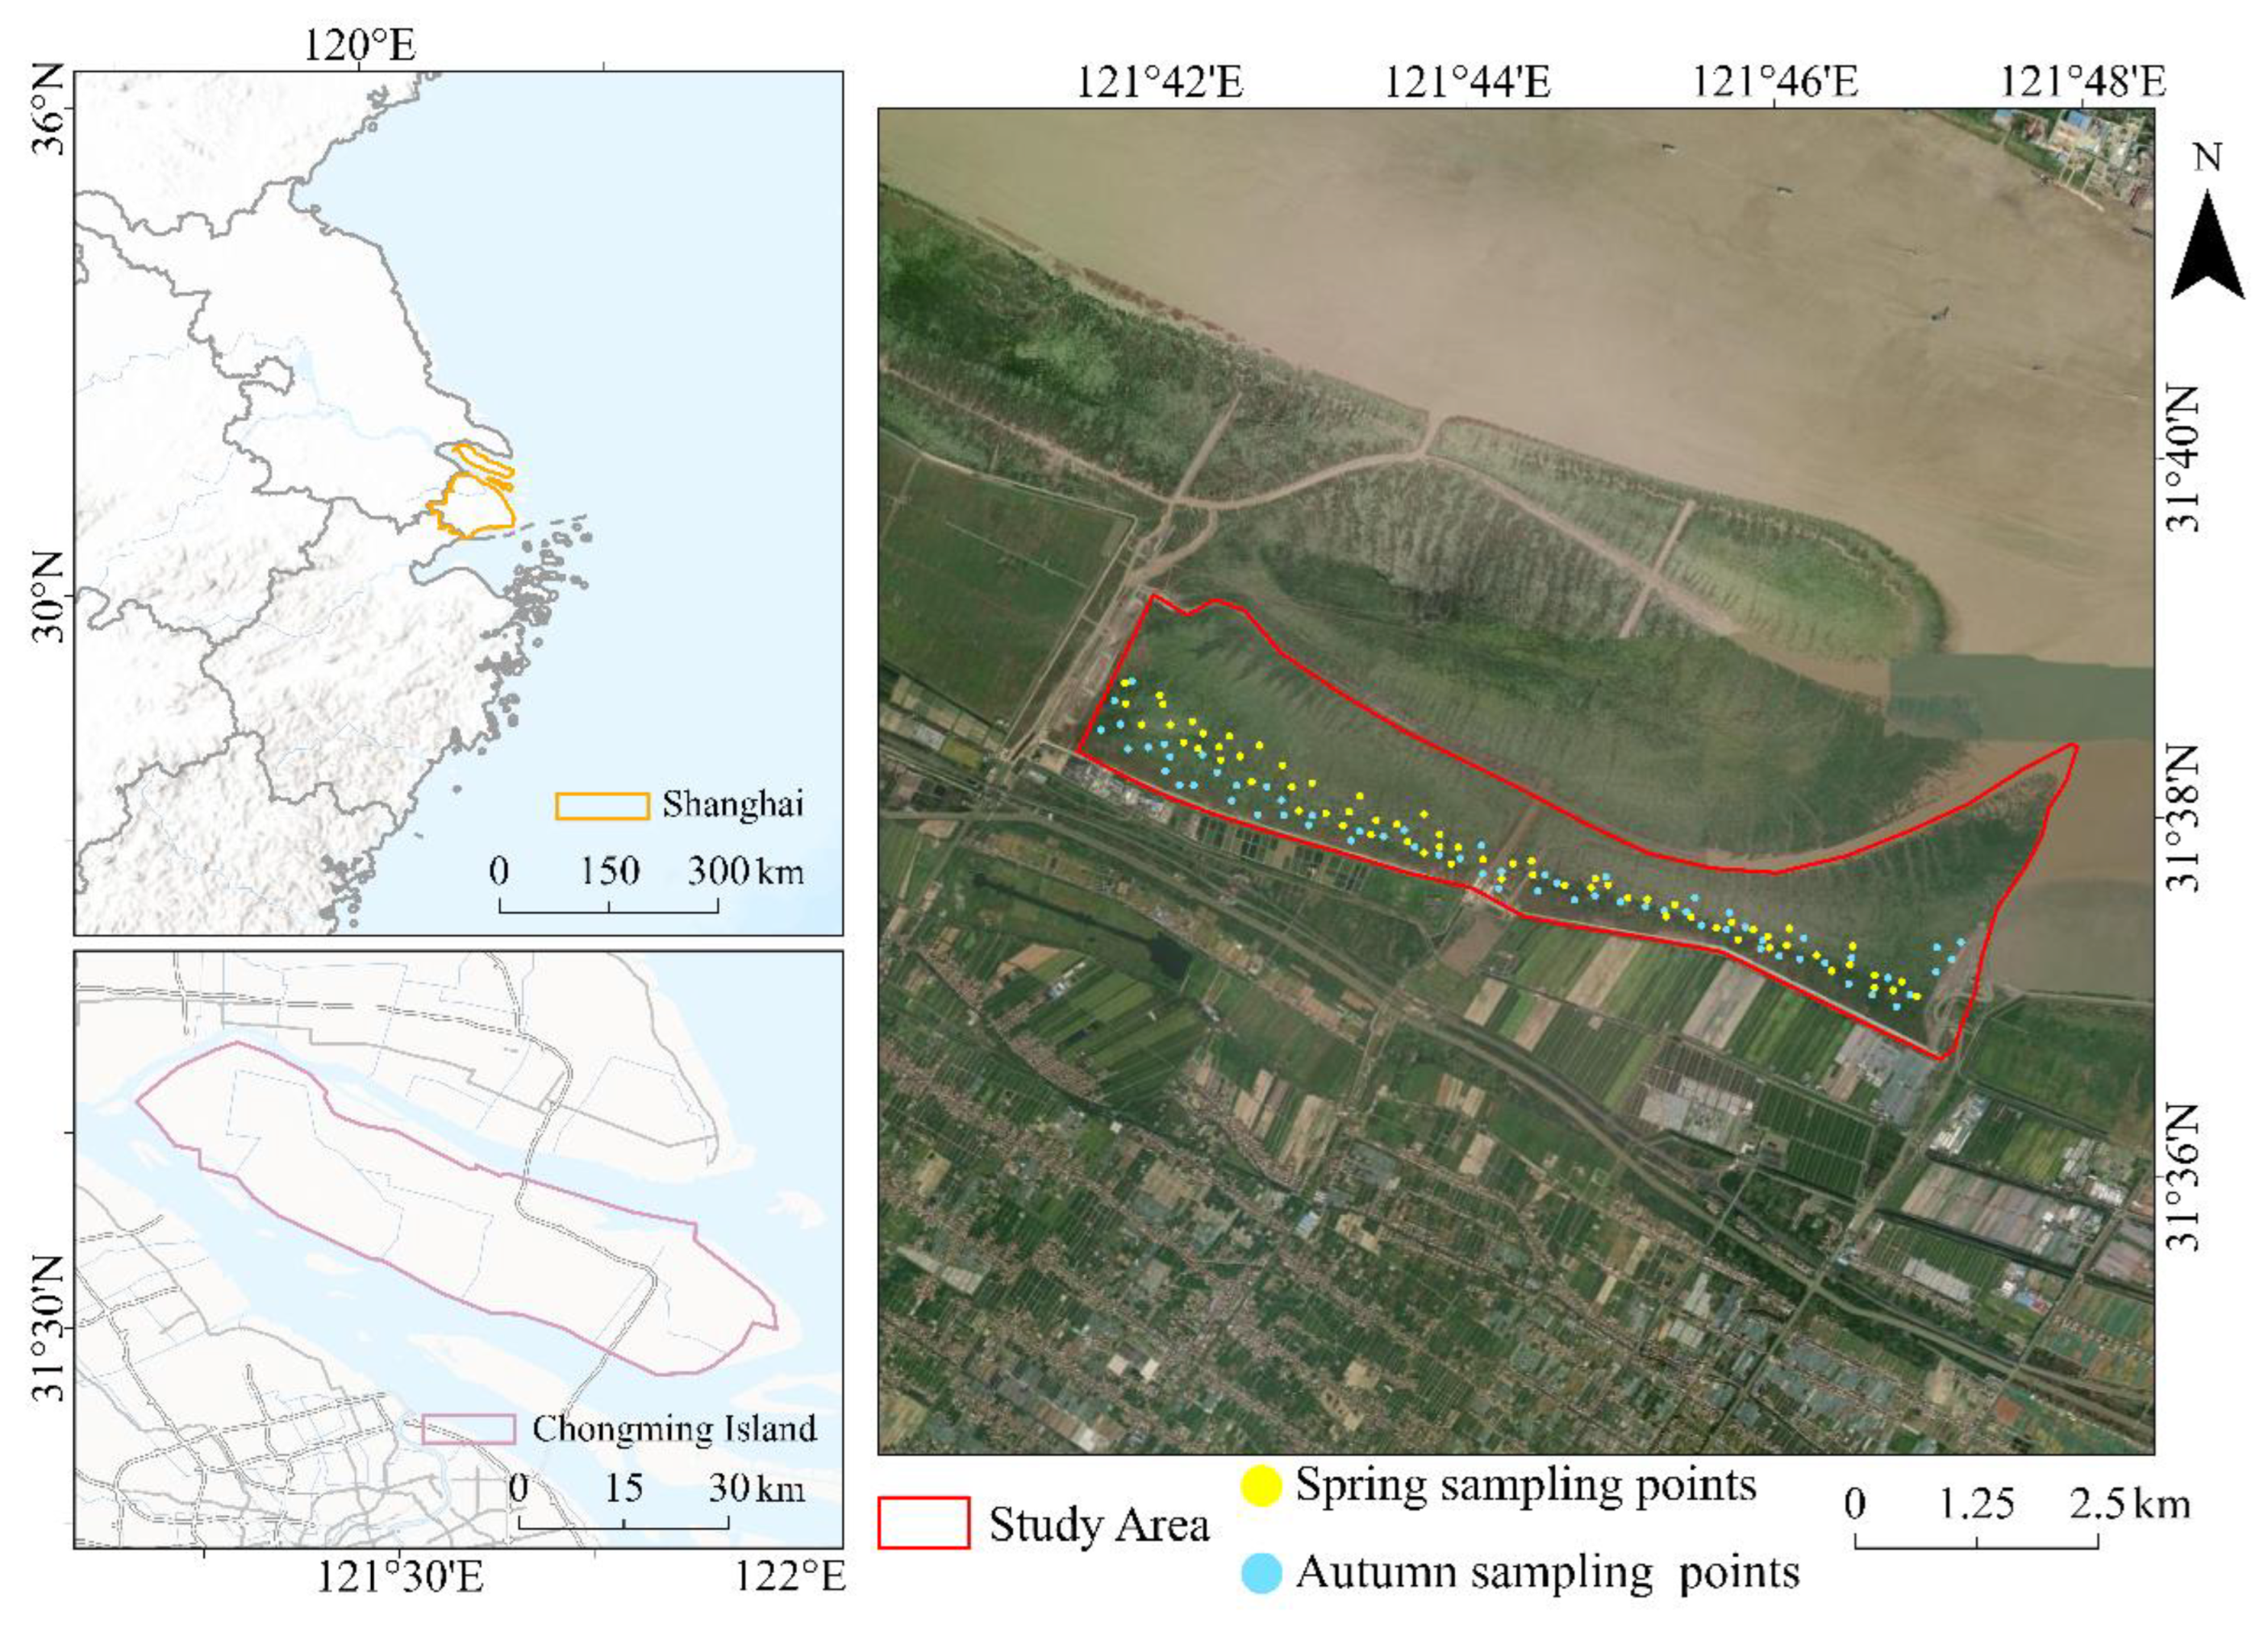
2.1. Study Area

Chongming Island, situated in the core area of the Yangtze River Estuary (121°09′–121°54′ E, 31°27′–31°51′ N), is the largest alluvial sandbar in China [22]. This study focuses on the Chongming Dongtan wetland (Figure 1). The geomorphology of this area is primarily formed by the long-term deposition of suspended sediments from therunoff [23], characterized by wide and gentle tidal flats with a semi-diurnal tidal regime [24], making it a typical prograding tidal wetland. The region experiences a northern subtropical monsoon climate [25] with a mean annual temperature of approximately 15°C and an average annual precipitation of about 1000 mm. The concurrent occurrence of abundant rainfall and elevated temperatures generates an optimal hydrothermal regime that promotes the development of wetland vegetation [26].
Prior to the Spartina alterniflora invasion, the native salt marsh vegetation community in this wetland was co-dominated by Phragmites australis and Bolboschoenoplectus mariqueter. Since the introduction of S. alterniflora in the 1990s, its continuous expansion has led to a significant decline in the coverage of B. mariqueter (by 60%–80%) [27], gradually forming a new vegetation pattern centered on a competitive P. australis–S. alterniflora ecotone. As such, the Chongming Dongtan wetland represents an ideal region for investigating the competitive mechanisms between invasive and native species and is exceptionally well-suited for studying the dynamic succession of ecotones under the coupled “Spatial–Phenological–Expansion” framework.

2.2. Data Source and Preprocessing

The Sentinel-2A/2B satellites, equipped with the Multispectral Instrument (MSI), acquire data across 13 spectral bands spanning the visible to shortwave infrared regions. Among these, the blue, green, red, and near-infrared bands offer a 10-meter spatial resolution and a 5-day revisit cycle [28], enabling high-frequency, dynamic monitoring of wetland vegetation. Leveraging the distinct phenological differences between Phragmites australis (early sprouting) and Spatina alterniflora (late senescence) [29,30], this study selected Sentinel-2 Level-2A imagery, specifically targeting the key phenological windows of spring green-up (April) and autumn senescence (November) for each year from 2016 to 2023. A total of 16 scenes with cloud cover of less than 10% were retrieved from the Copernicus Open Access Hub (https://scihub.copernicus.eu/). Their key specifications are provided in Table 1. All Sentinel-2 images were uniformly reprojected to the WGS84 UTM Zone 51N coordinate system and clipped to the study area extent, establishing a standardized spatial framework for subsequent analysis.
Furthermore, complementary field surveys were conducted in April and November 2023 using GPS Real-Time Kinematic (RTK) positioning and UAV aerial photography. These surveys gathered a total of 127 validation sample points along the mixed ecotone boundaries (Figure 1), which were used to support the accuracy assessment of the classification results.

2.3. Methodology

2.3.1. Delineation of the Mixed Ecotone

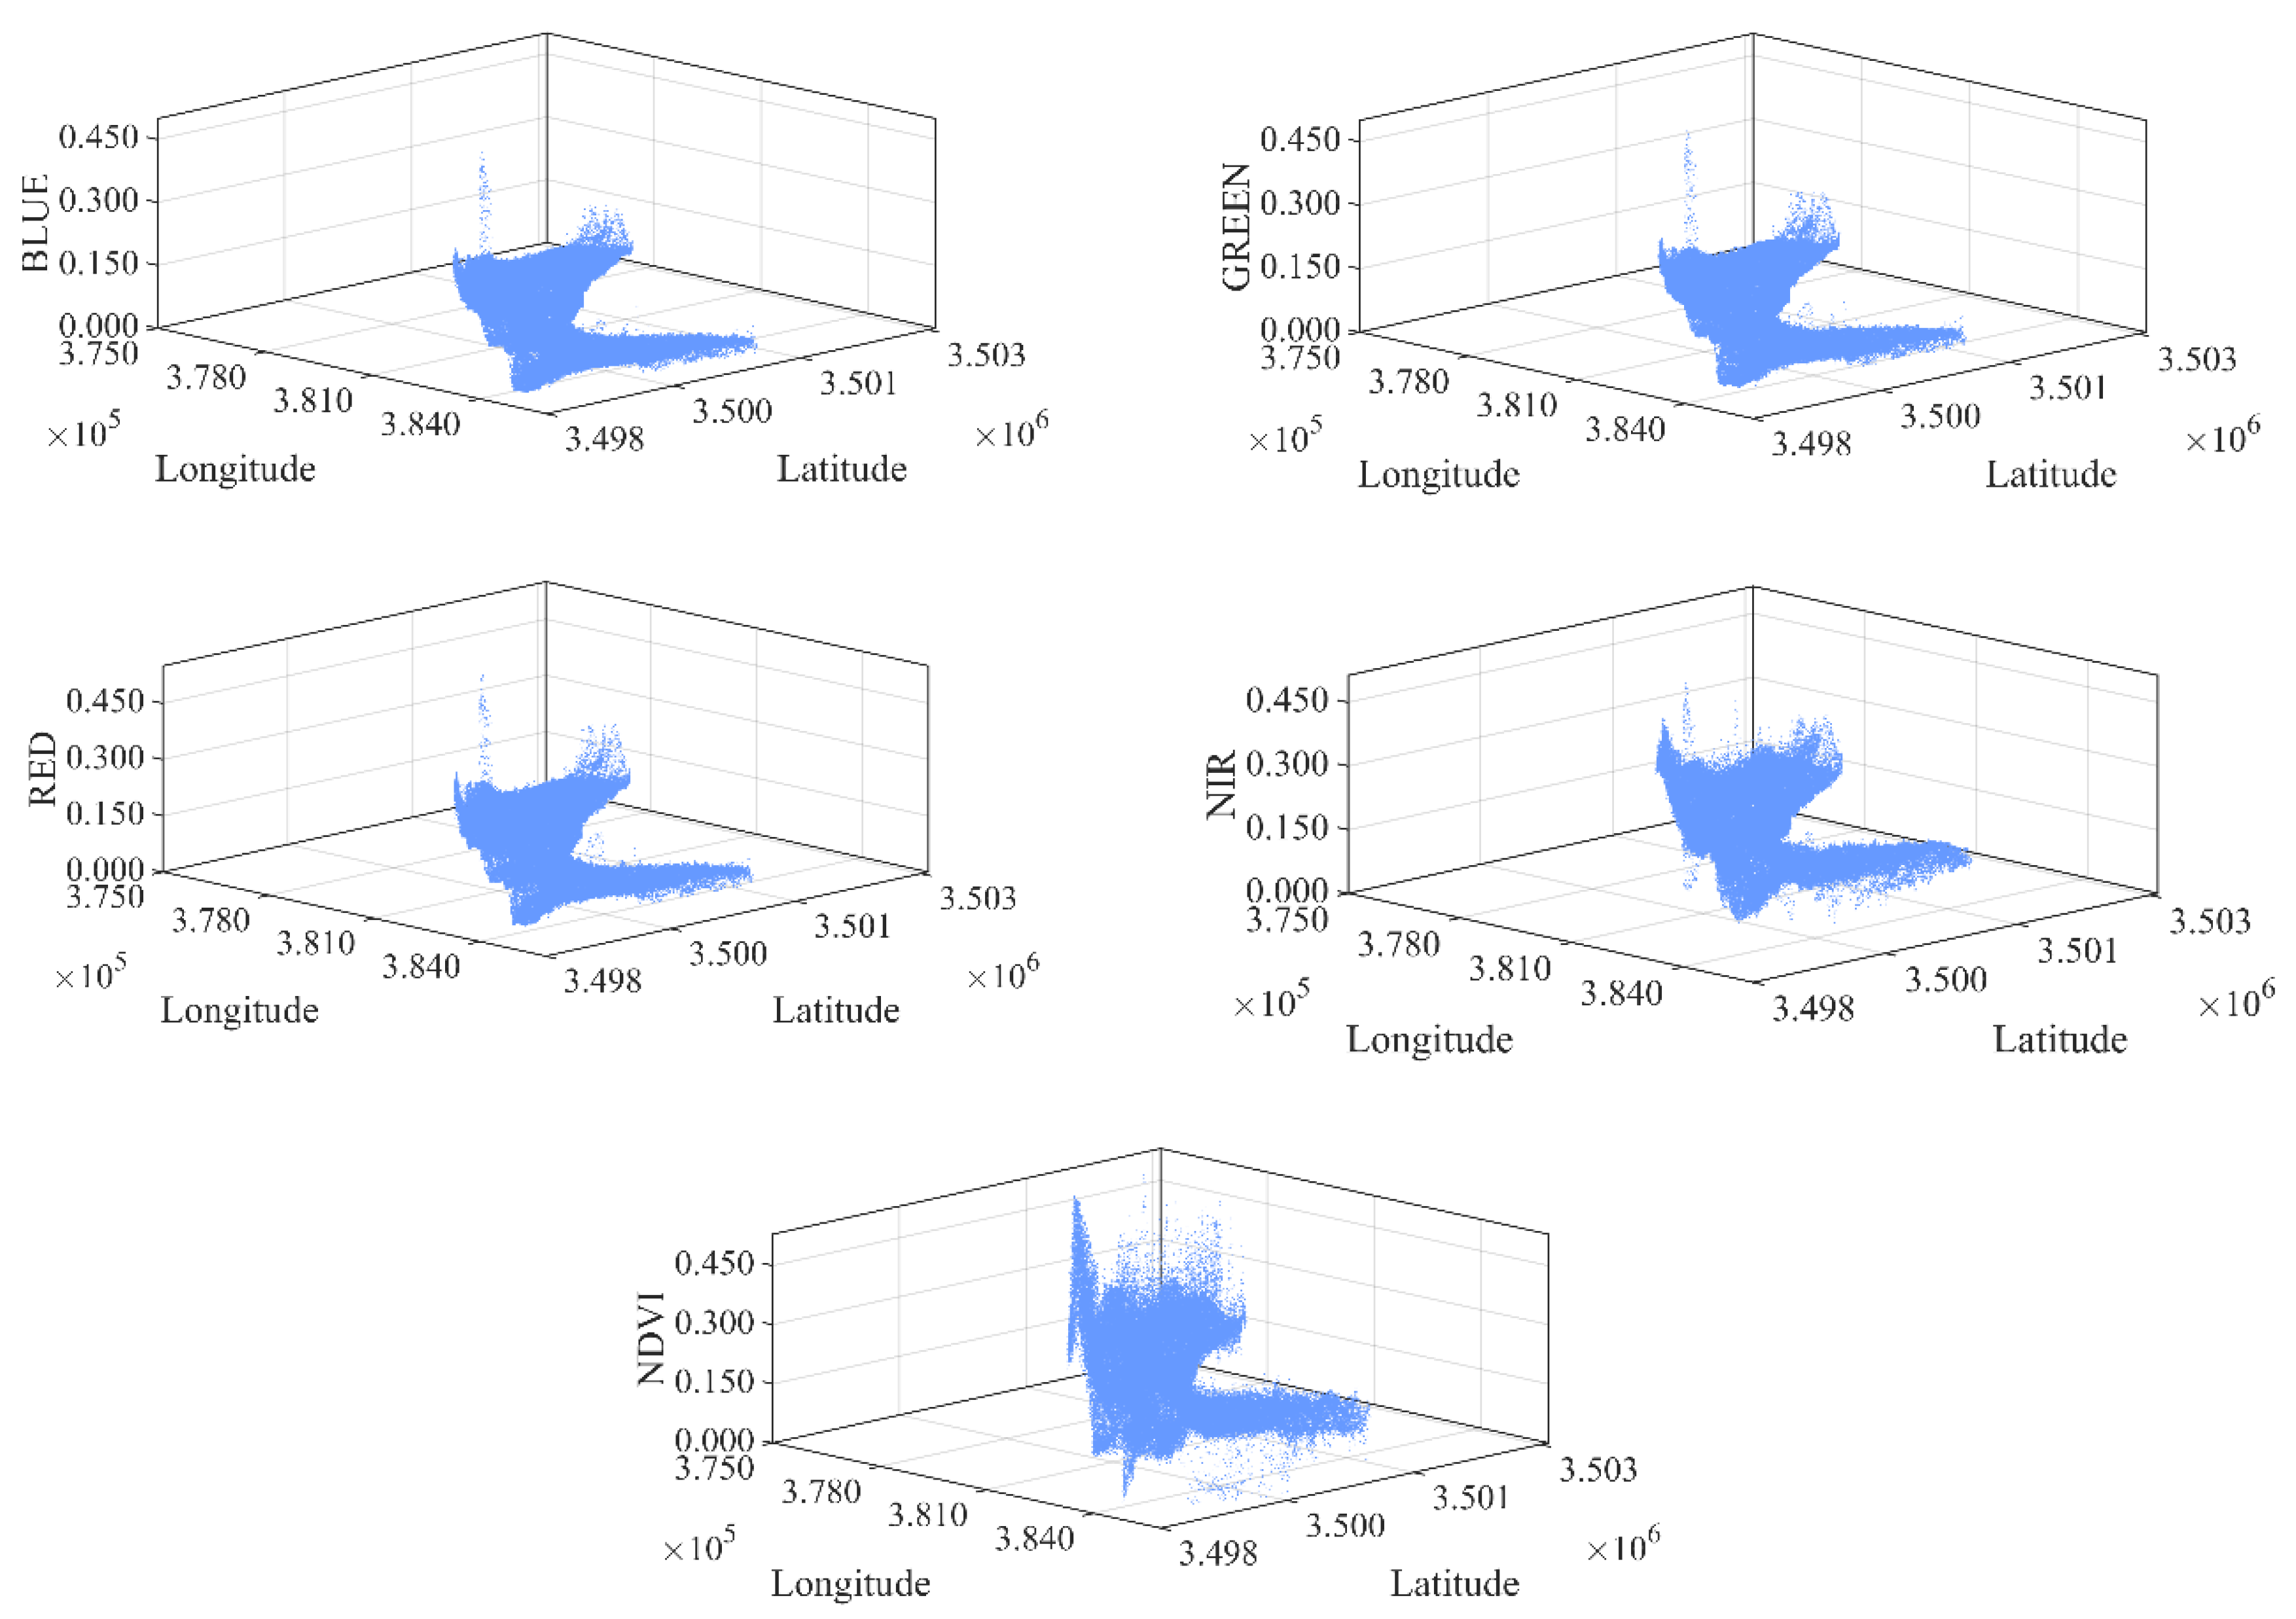
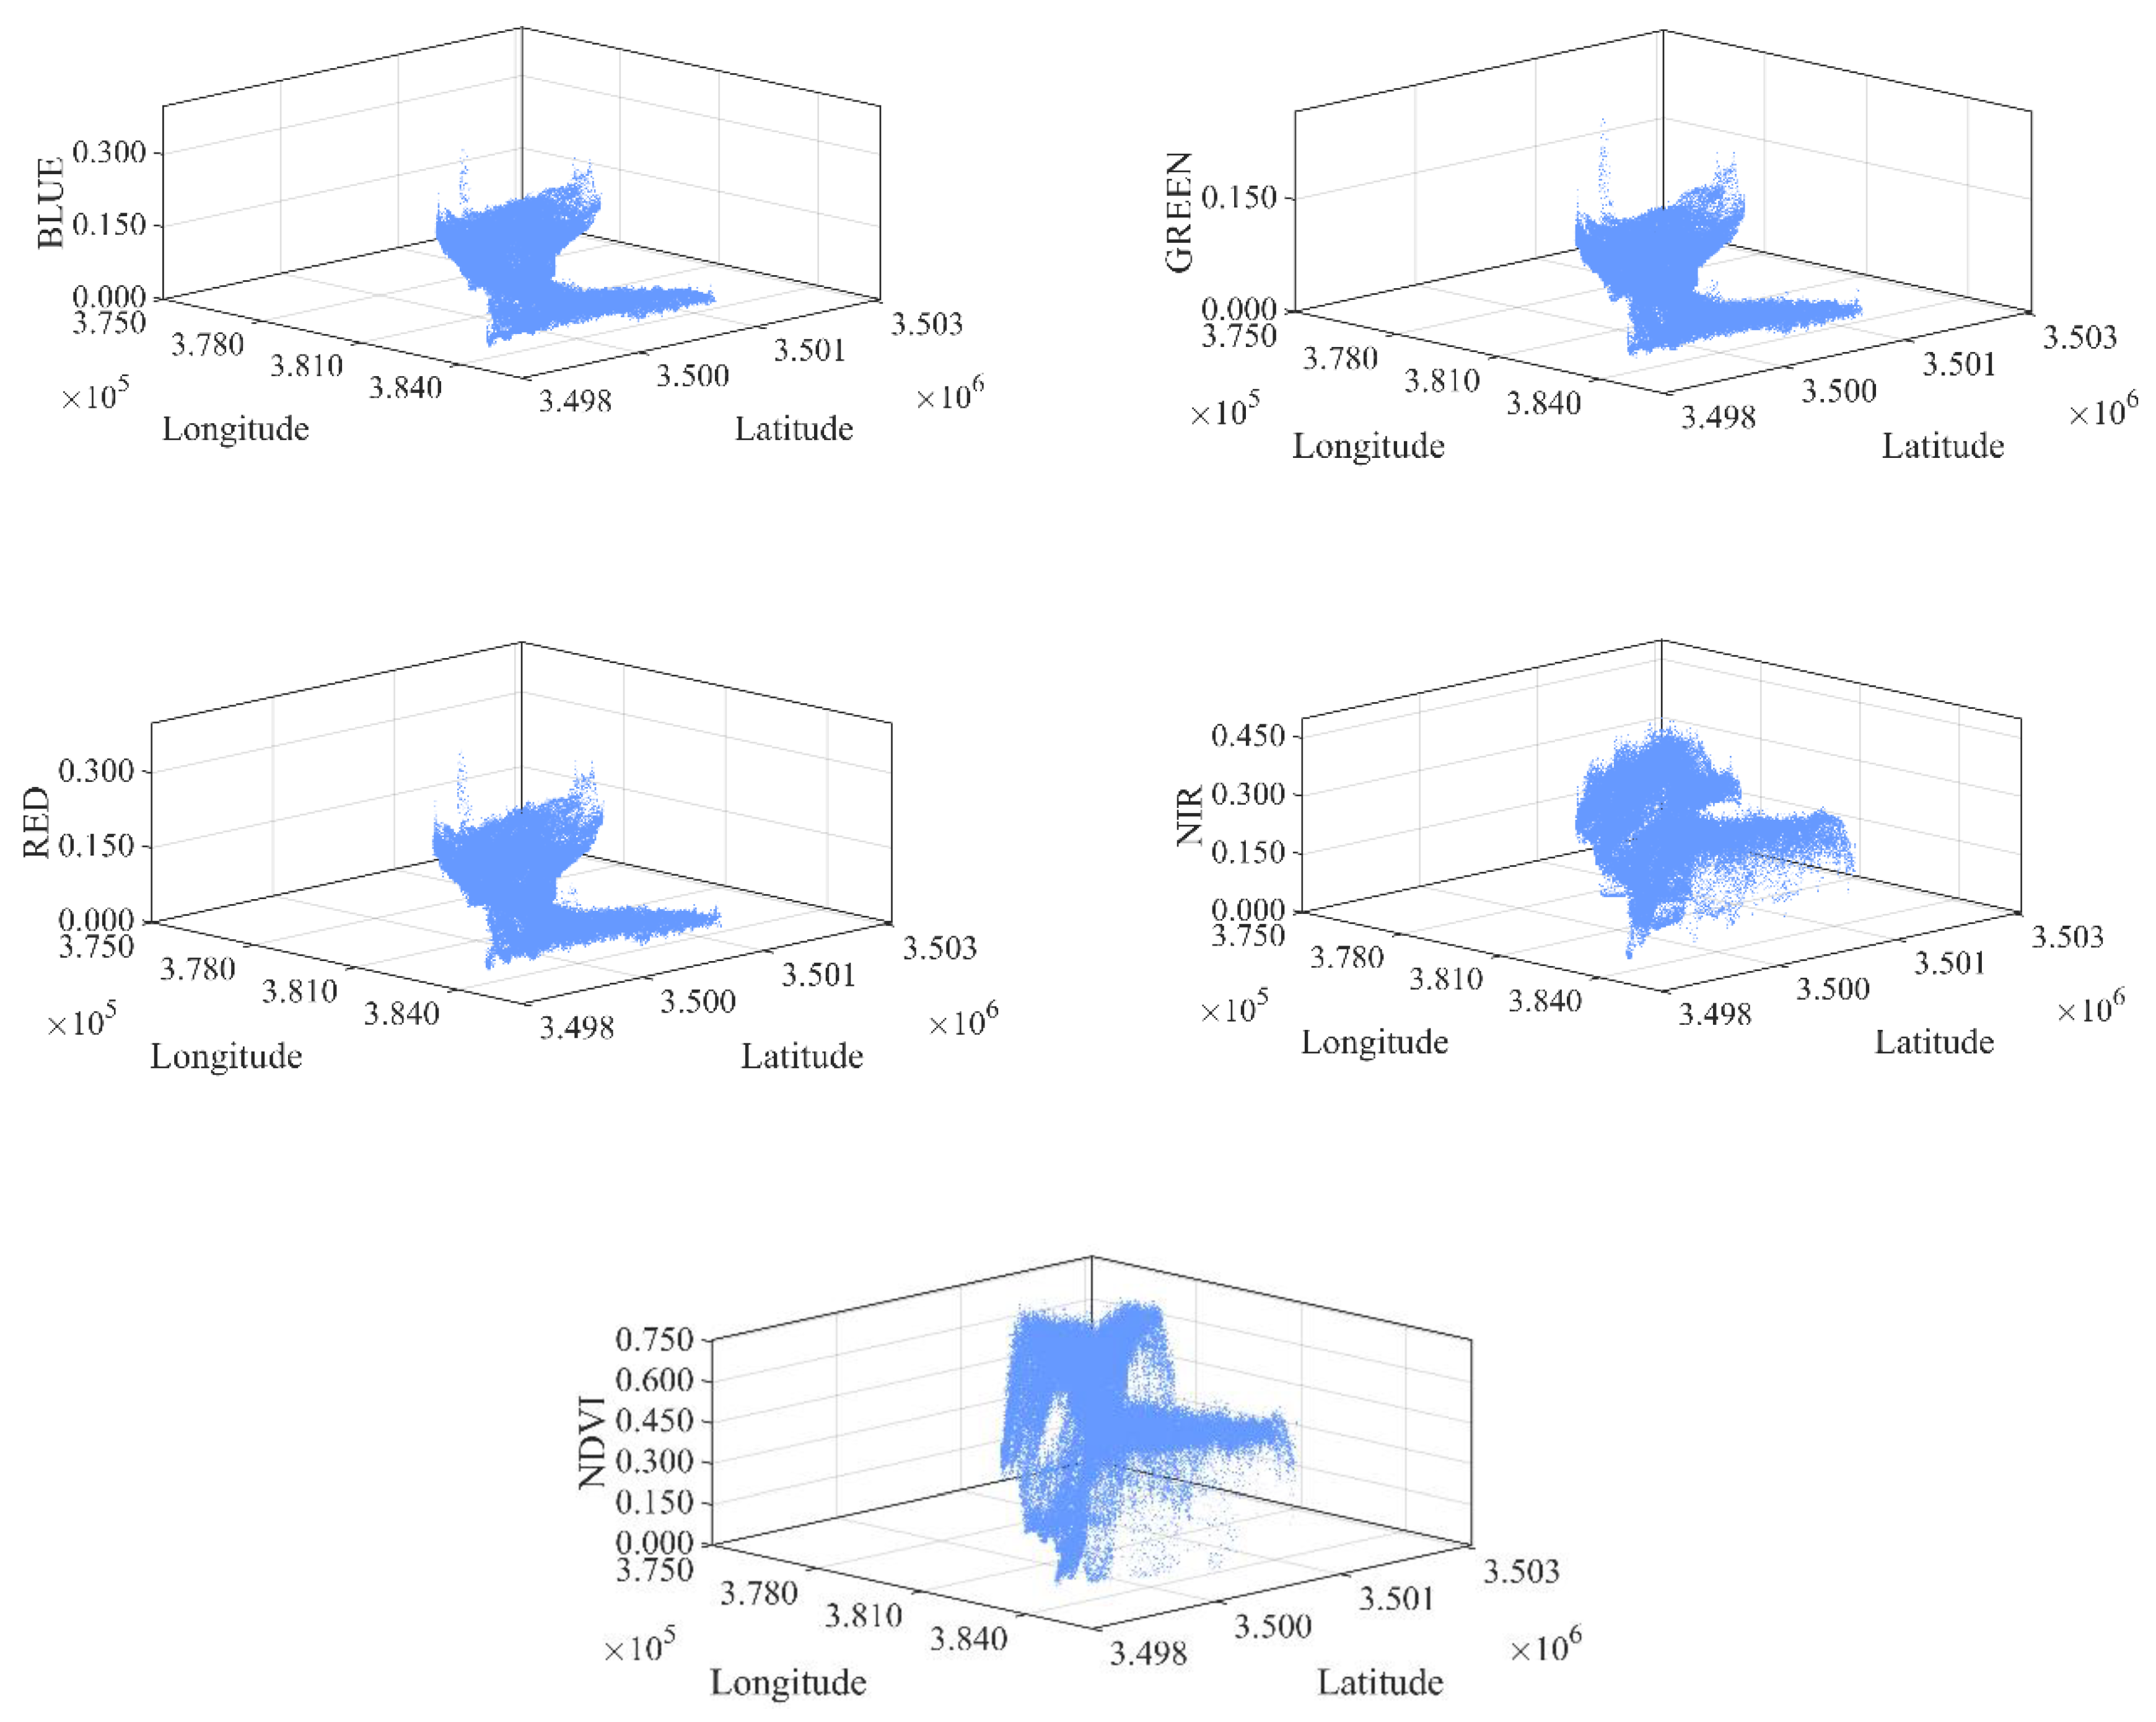
  • Spectral Feature Extraction and 3D Feature Space Construction.
Spectral reflectance from the blue (B2), green (B3), red (B4), and near-infrared (B8) bands was retrieved pixel-by-pixel from the preprocessed Sentinel-2 images for both spring (April) and autumn (November) 2023. The Normalized Difference Vegetation Index (NDVI) was subsequently calculated using the following formula [31]:
NDVI = (ρ₈ - ρ₄) / (ρ₈ + ρ₄)
where ρ₈ and ρ₄ represent the reflectance of the B8 and B4 bands, respectively. To capitalize on both spatial and spectral information in vegetation distribution, a three-dimensional feature space scatter plot was constructed (Figure 2 and Figure 3) where pixel’s geographic coordinates (X, Y) define the planar axes and a spectral index (reflectance or NDVI) forms the vertical Z-axis [32]. By fusing geographic and spectral dimensions [33], this approach discriminates tidal and micro-topographic influences on spectral signatures, providing an integrated spatial-spectral basis for threshold segmentation.
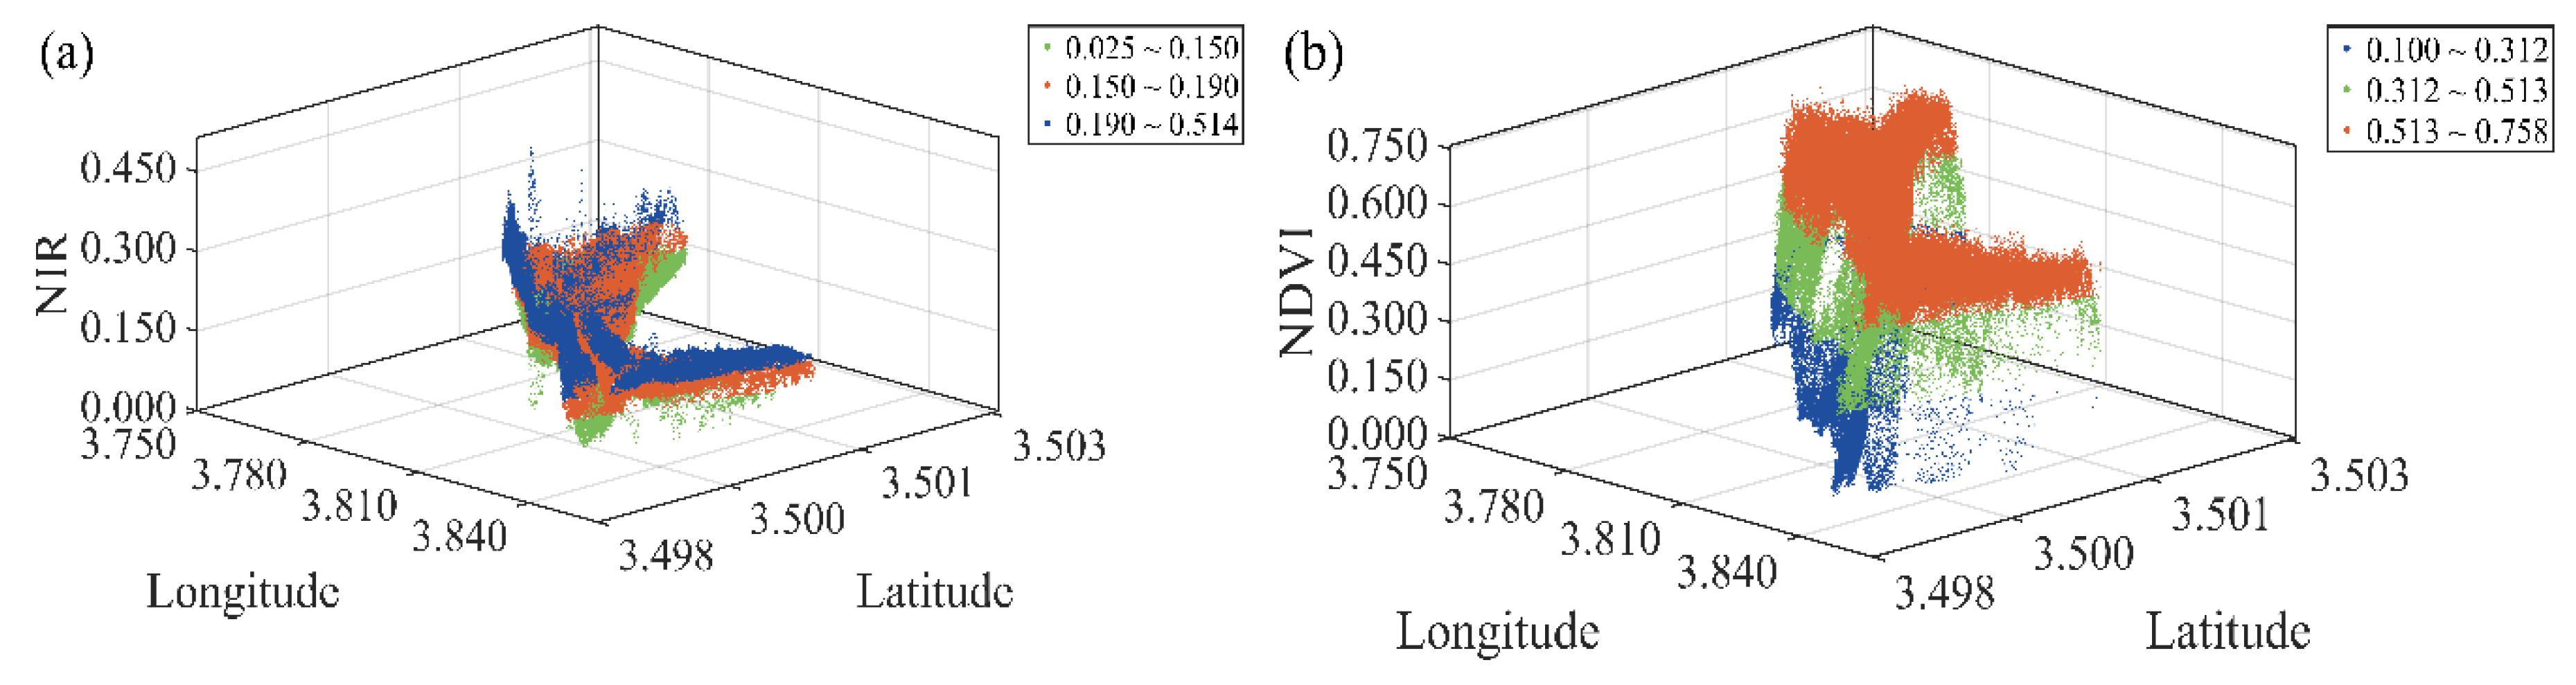
  • Optimal Spectral Index Selection and Multi-threshold Otsu Segmentation.
To identify the optimal spectral index for distinguishing pure P. australis, pure S. alterniflora, and their mixed ecotone, the 2023 spring and autumn images were selected as representative periods for analysis. The 3D scatter plots, constructed based on pixel-level geo-spectral features, were input into the Otsu algorithm for multi-threshold segmentation [34]. The Otsu algorithm automatically determines the optimal threshold(s) by maximizing the inter-class variance based on the grayscale distribution of image pixels, making it suitable for multi-category segmentation tasks [35,36]. In this study, the number of classes was set to three (pure P. australis, mixed ecotone, pure S. alterniflora), and accordingly, two thresholds were extracted to achieve this three-class separation. To objectively evaluate the class separability achieved by each spectral index, the Jeffries-Matusita (JM) distance [37] was employed as a statistical measure. It is calculated as follows:
JM = 2(1 - e⁻ᴮ)
where B is the Bhattacharyya distance. The JM distance ranges from 0 to 2, where increasing values correspond to enhanced class separability [38], and values exceeding 1.80 generally indicate good separability. Through systematic comparison of Otsu segmentation outcomes and JM distances, optimal spectral indices and their corresponding segmentation thresholds were identified for spring and autumn. These validated thresholds were subsequently applied to perform vegetation classification across the entire temporal dataset.
  • Time-Series Classification and Accuracy Validation.
Using the selected optimal spectral indices and their corresponding Otsu thresholds identified in the analysis, automated classification was conducted on all 16 spring and autumn scenes spanning 2016–2023. This process produced seasonal and annual vegetation distribution maps featuring three distinct classes: pure P. australis, the mixed ecotone, and pure S. alterniflora. For accuracy validation, 127 ground verification points collected along the mixed ecotone boundaries in April and November 2023 via GPS RTK and UAV aerial photography (Figure 1) were utilized. These sample points were interpreted against high-resolution UAV orthophotos to generate a validation dataset encompassing all three vegetation types [39]. A confusion matrix was generated to systematically evaluate the reliability and consistency of the classification results by calculating the overall accuracy, Kappa coefficient, producer’s accuracy, and user’s accuracy [40].

2.3.2. Spatiotemporal Dynamics Monitoring of the Mixed Ecotone

Accordingly, quantitative models were developed to examine the spatiotemporal dynamics of the mixed ecotone across inter-annual and intra-annual scales. At the inter-annual scale, the ecotone area was quantified from the annual classification results to determine its yearly change rate [41], with linear regression employed to evaluate the statistical significance of the observed trend [42]. Meanwhile, the centroid migration model was applied to delineate the evolutionary trajectory of its spatial configuration [43]. To capture intra-annual variations, the Seasonal Area Ratio (SAR) index quantified seasonal dynamics of the vegetation community.
  • Centroid Migration Model.
The centroid migration model revealed the spatial trajectory and stability [44] of the mixed ecotone. The centroid (spatial first-order moment) of the ecotone patches was calculated annually, with its migration trajectory tracked over the study period. The centroid coordinates [45] are computed as follows:
Xt = (Σᵢ (Aᵢ * xᵢ)) / Σᵢ Aᵢ, Yt = (Σᵢ (Aᵢ * yᵢ)) / Σᵢ Aᵢ
where (Xt, Yt) represents the centroid coordinates in year t, Ai is the area of the i-th patch, and (xi, yi) denotes the geometric center coordinates of that patch. The centroid migration trajectory can be used to identify the dominant direction of spatial expansion for the entire ecotone.
  • Seasonal Area Ratio (SAR) Index.
To quantify the seasonal competitive dynamics of the vegetation community [46], the study presents the Seasonal Area Ratio (SAR) index, defined by the ratio of ecotone area in autumn to that in spring within the same calendar year.
SARt = (Areaautumn, t) / (Areaspring, t)
where Areaautumn, t and Areaspring, t denote the ecotone area in autumn and spring of year t, respectively. Inter-annual SAR variations capture phenologically mediated competitive shifts between P. australis and S. alterniflora, thus establishing a novel framework for quantifying succession mechanisms.

3. Results and Analysis

3.1. Selection of Optimal Spectral Indices

To determine the optimal spectral indices for mixed ecotone delineation, 2023 was selected as a representative year for detailed analysis. Three-dimensional scatter plots were constructed for key spectral indices—comprising the blue, green, red, and near-infrared reflectance along with NDVI—during both spring (April) and autumn (November) seasons (Figure 2 and Figure 3). The multi-threshold Otsu segmentation algorithm was applied to determine the optimal thresholds for distinguishing the three classes: pure P. australis, the mixed ecotone, and pure S. alterniflora. Table 2 summarizes the classification thresholds derived for each spectral index by season. In addition, the Jeffries-Matusita (JM) distance, as summarized in Table 2, was employed to evaluate the classification performance of each spectral index, quantifying separability among the three vegetation classes. Analysis showed that the near-infrared band reflectance yielded the strongest separability in spring (JM value = 1.98), supported by its 3D scatter plot (Figure 4a) which demonstrated superior clustering and distinction among vegetation types. In contrast, autumn observations identified NDVI (JM = 1.92) as the most effective index, with its scatter plot (Figure 4b) revealing a well-defined gradient pattern.
These findings demonstrate that near-infrared reflectance effectively captures the phenological differences between P. australis (higher reflectance) and S. alterniflora (lower reflectance) in spring, while the NDVI exhibits the strongest discriminatory power during autumn—a period characterized by the distinct phenological contrast between senescent P. australis and still-verdant S. alterniflora. Thus, near-infrared reflectance and NDVI were established as the optimal spectral indices for spring and autumn, respectively. The corresponding thresholds were subsequently employed to classify the complete time-series dataset.

3.2. Accuracy Validation of Classification Results

Using the established optimal spectral indices for spring and autumn, an automated processing workflow was applied to the 16 Sentinel-2 scenes spanning 2016–2023. Each scene was processed with its corresponding seasonal index and classified via multi-threshold Otsu segmentation, yielding distribution maps of the three vegetation types for each season and year (Figure 5).
To evaluate the reliability of the classification results, a confusion matrix and derived accuracy metrics were systematically calculated using 127 ground validation points from April and November 2023 (Figure 1), together with a verification sample set based on high-resolution UAV-based visual interpretation. The results (Table 3) show that the average overall classification accuracy across all images was 87.3±1.4%, with an average Kappa coefficient of 0.84±0.02, indicating high consistency and reliability of the time-series classification results. For the primary target—the mixed ecotone—the average producer’s and user’s accuracies reached 85.2% and 83.6%, respectively, confirming the method’s effectiveness in delineating this narrow transition zone and avoiding confusion with pure vegetation communities. Classification accuracies for both pure P. australis and pure S. alterniflora exceeded 90%, further validating the overall robustness of the classification approach.
To sum up, this study develops a “seasonally adaptive spectral indices and dynamic threshold segmentation” framework that establishes a robust data foundation for analyzing the spatiotemporal dynamics of the mixed ecotone. By identifying optimal spectral features and validating them across multiple temporal phases, the proposed method enables high-accuracy monitoring of mixed ecotone dynamics and provides reliable technical support for coastal wetland management.

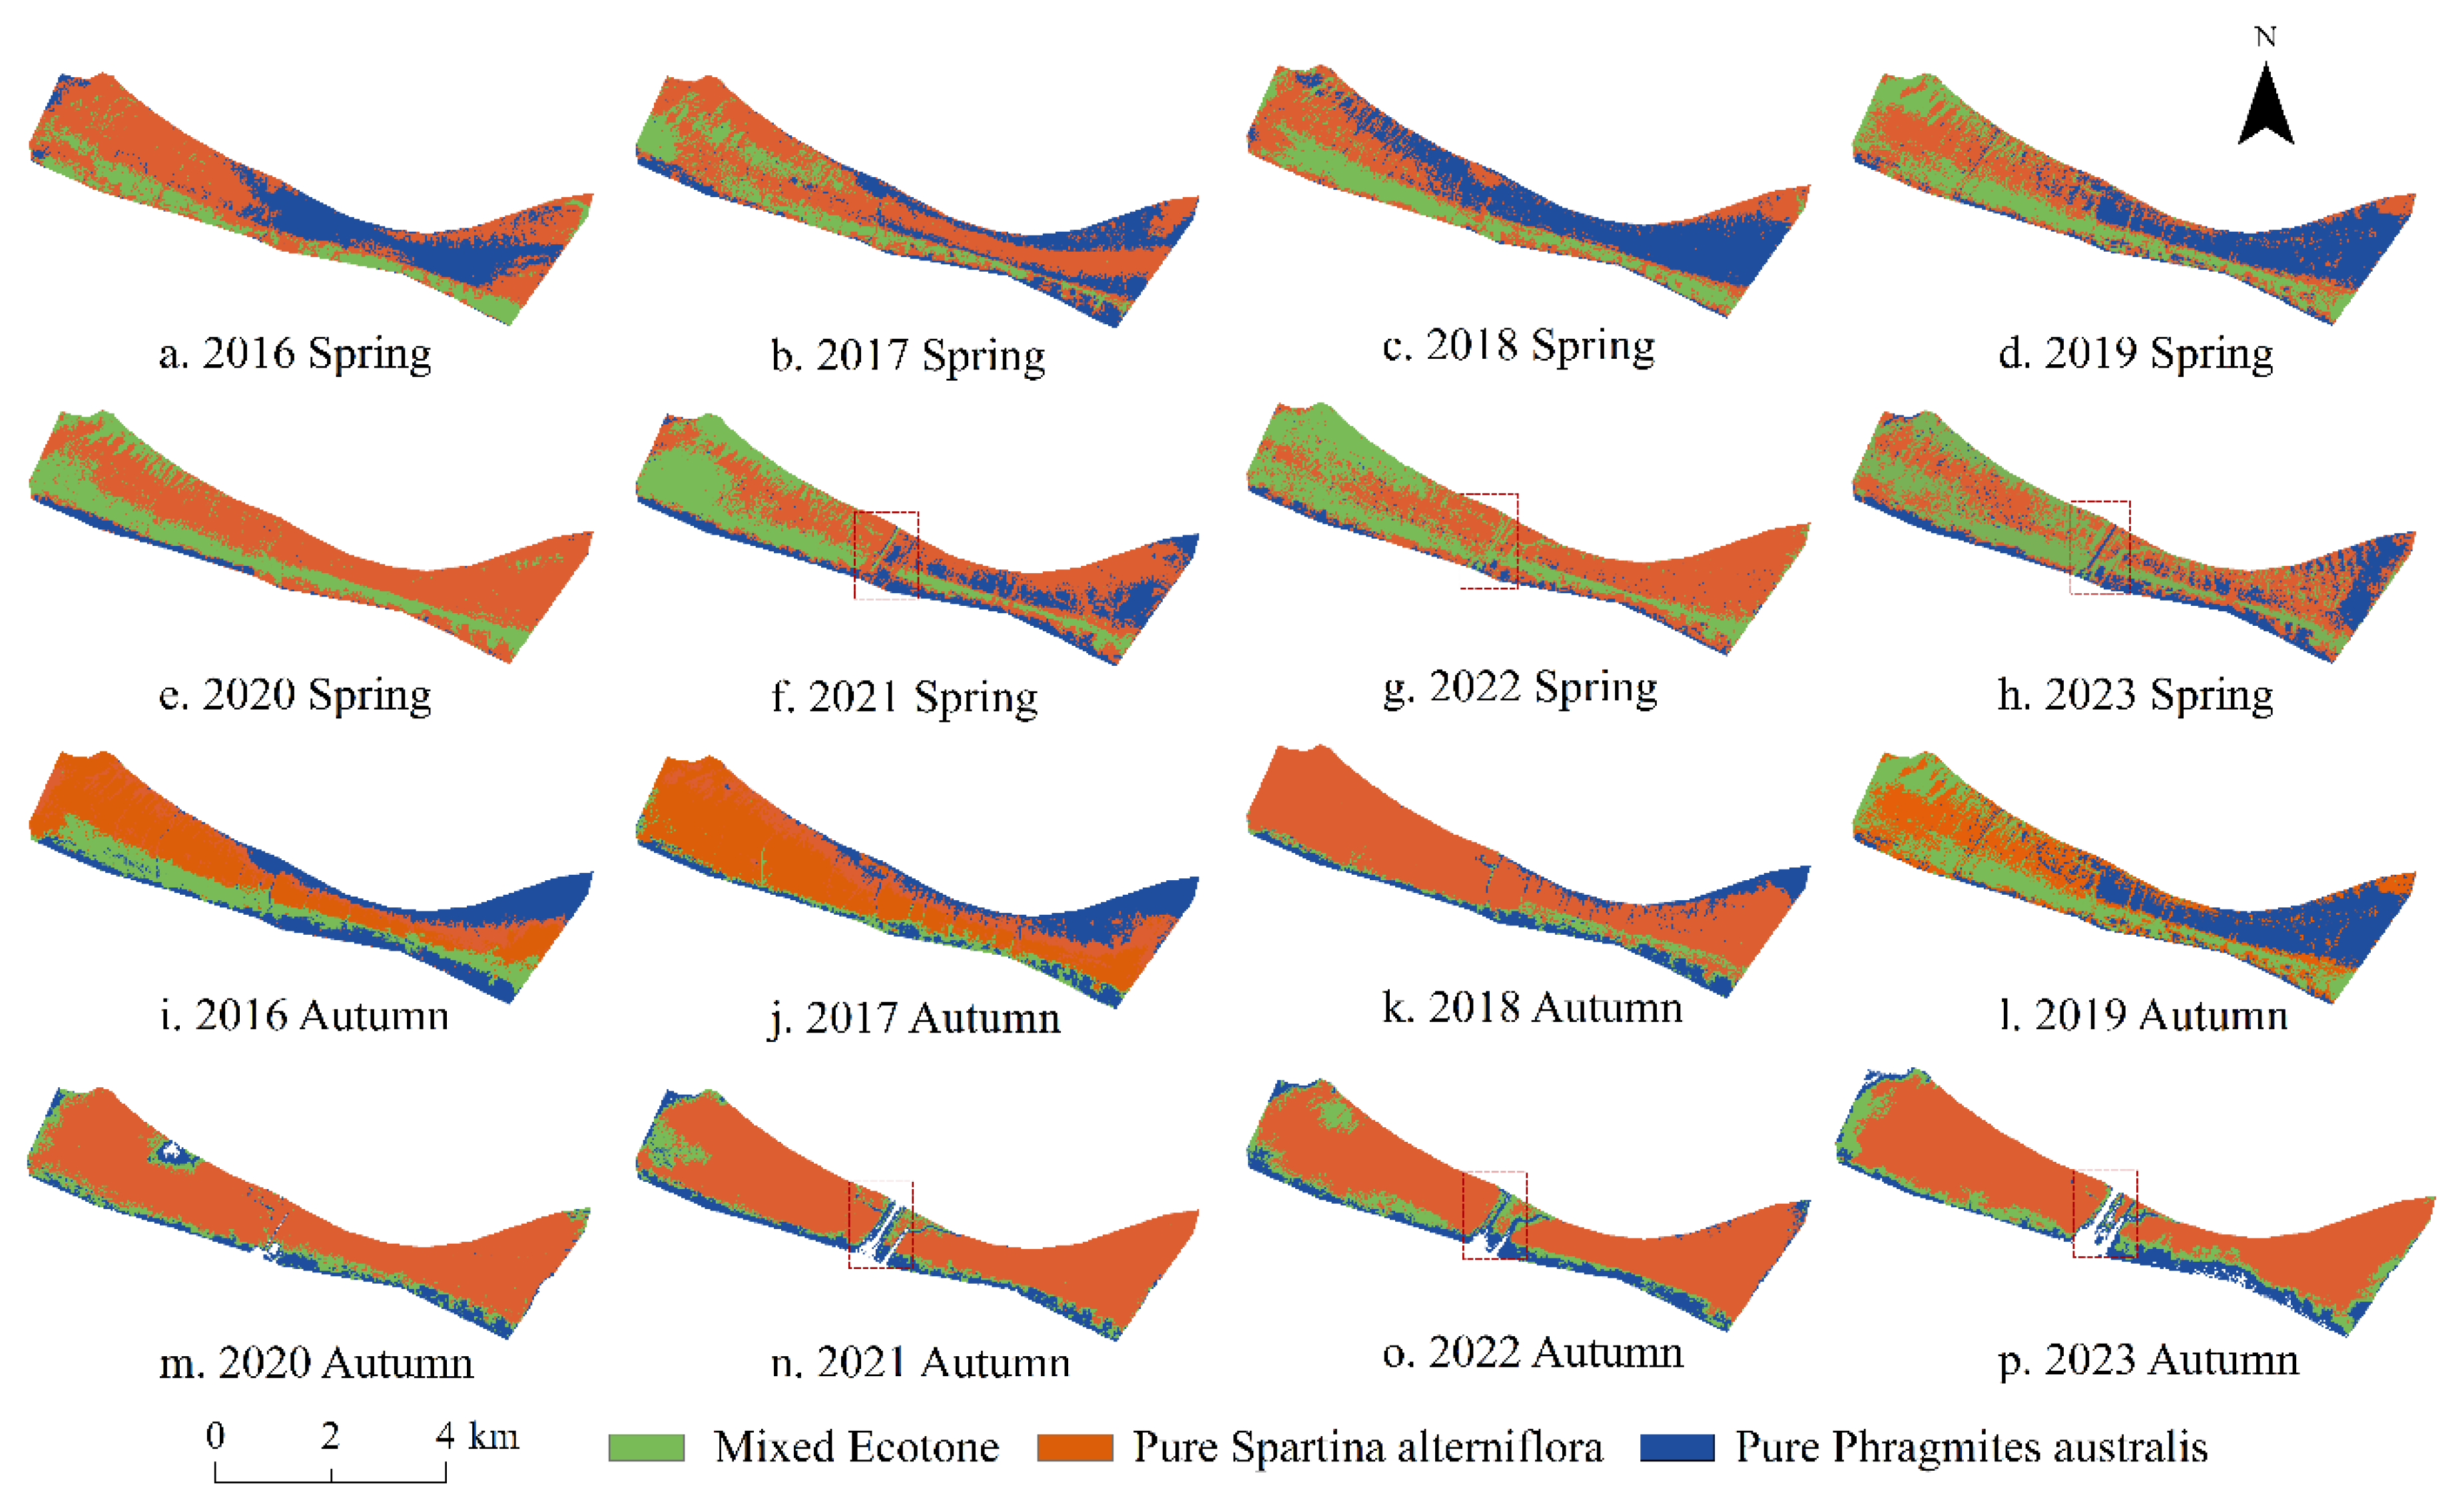
3.3. Spatial Distribution Pattern of the Mixed Ecotone

The high-resolution 2023 classification results (Figure 5) elucidate distinct vegetation zonation patterns in the Chongming Dongtan wetland. Overall, the vegetation exhibits a distinct land-to-sea ecological sequence transitioning from pure P. australis through mixed ecotone to pure S. alterniflora. The mixed ecotone, serving as a transitional zone of competition between the two vegetation types, forms a continuous, east–west trending strip, constituting a critical ecological frontline between the terrestrial and marine environments.
At the local scale, the vegetation distribution pattern exhibits significant spatial heterogeneity. In the northwestern sector, where tidal creek dissection and micro-topographic variation prevail, the mixed ecotone develops a patchy mosaic pattern. This observed spatial pattern stems primarily from hydrodynamic differentiation induced by variations in tidal flat elevation. Notably, elevated patches with infrequent inundation and moderate salinity support P. australis persistence, whereas low-lying areas characterized by frequent waterlogging and high salinity promote S. alterniflora establishment. The resultant salinity gradient, affected by such microhabitat heterogeneity, partially mitigates the competitive expansion of S. alterniflora, thereby allowing P. australis to persist in localized patches and giving rise to a complex, interwoven distribution of the two vegetation types. In contrast to the naturally driven patterns, a geometrically regular linear anomaly emerged in the central study area during 2021–2023 (red dashed box, Figure 5). The area features sharply delineated linear boundaries that contrast markedly with the sinuous, continuous formations of the surrounding natural vegetation. Comparison with high-resolution imagery confirmed that its geometric characteristics align closely with anthropogenic infrastructure such as embankments or ditches, which indicates human activities as the primary driver of this anomalous vegetation pattern.

3.4. Spatiotemporal Dynamics of the Mixed Ecotone

3.4.1. Inter-Annual Variations (2016–2023)

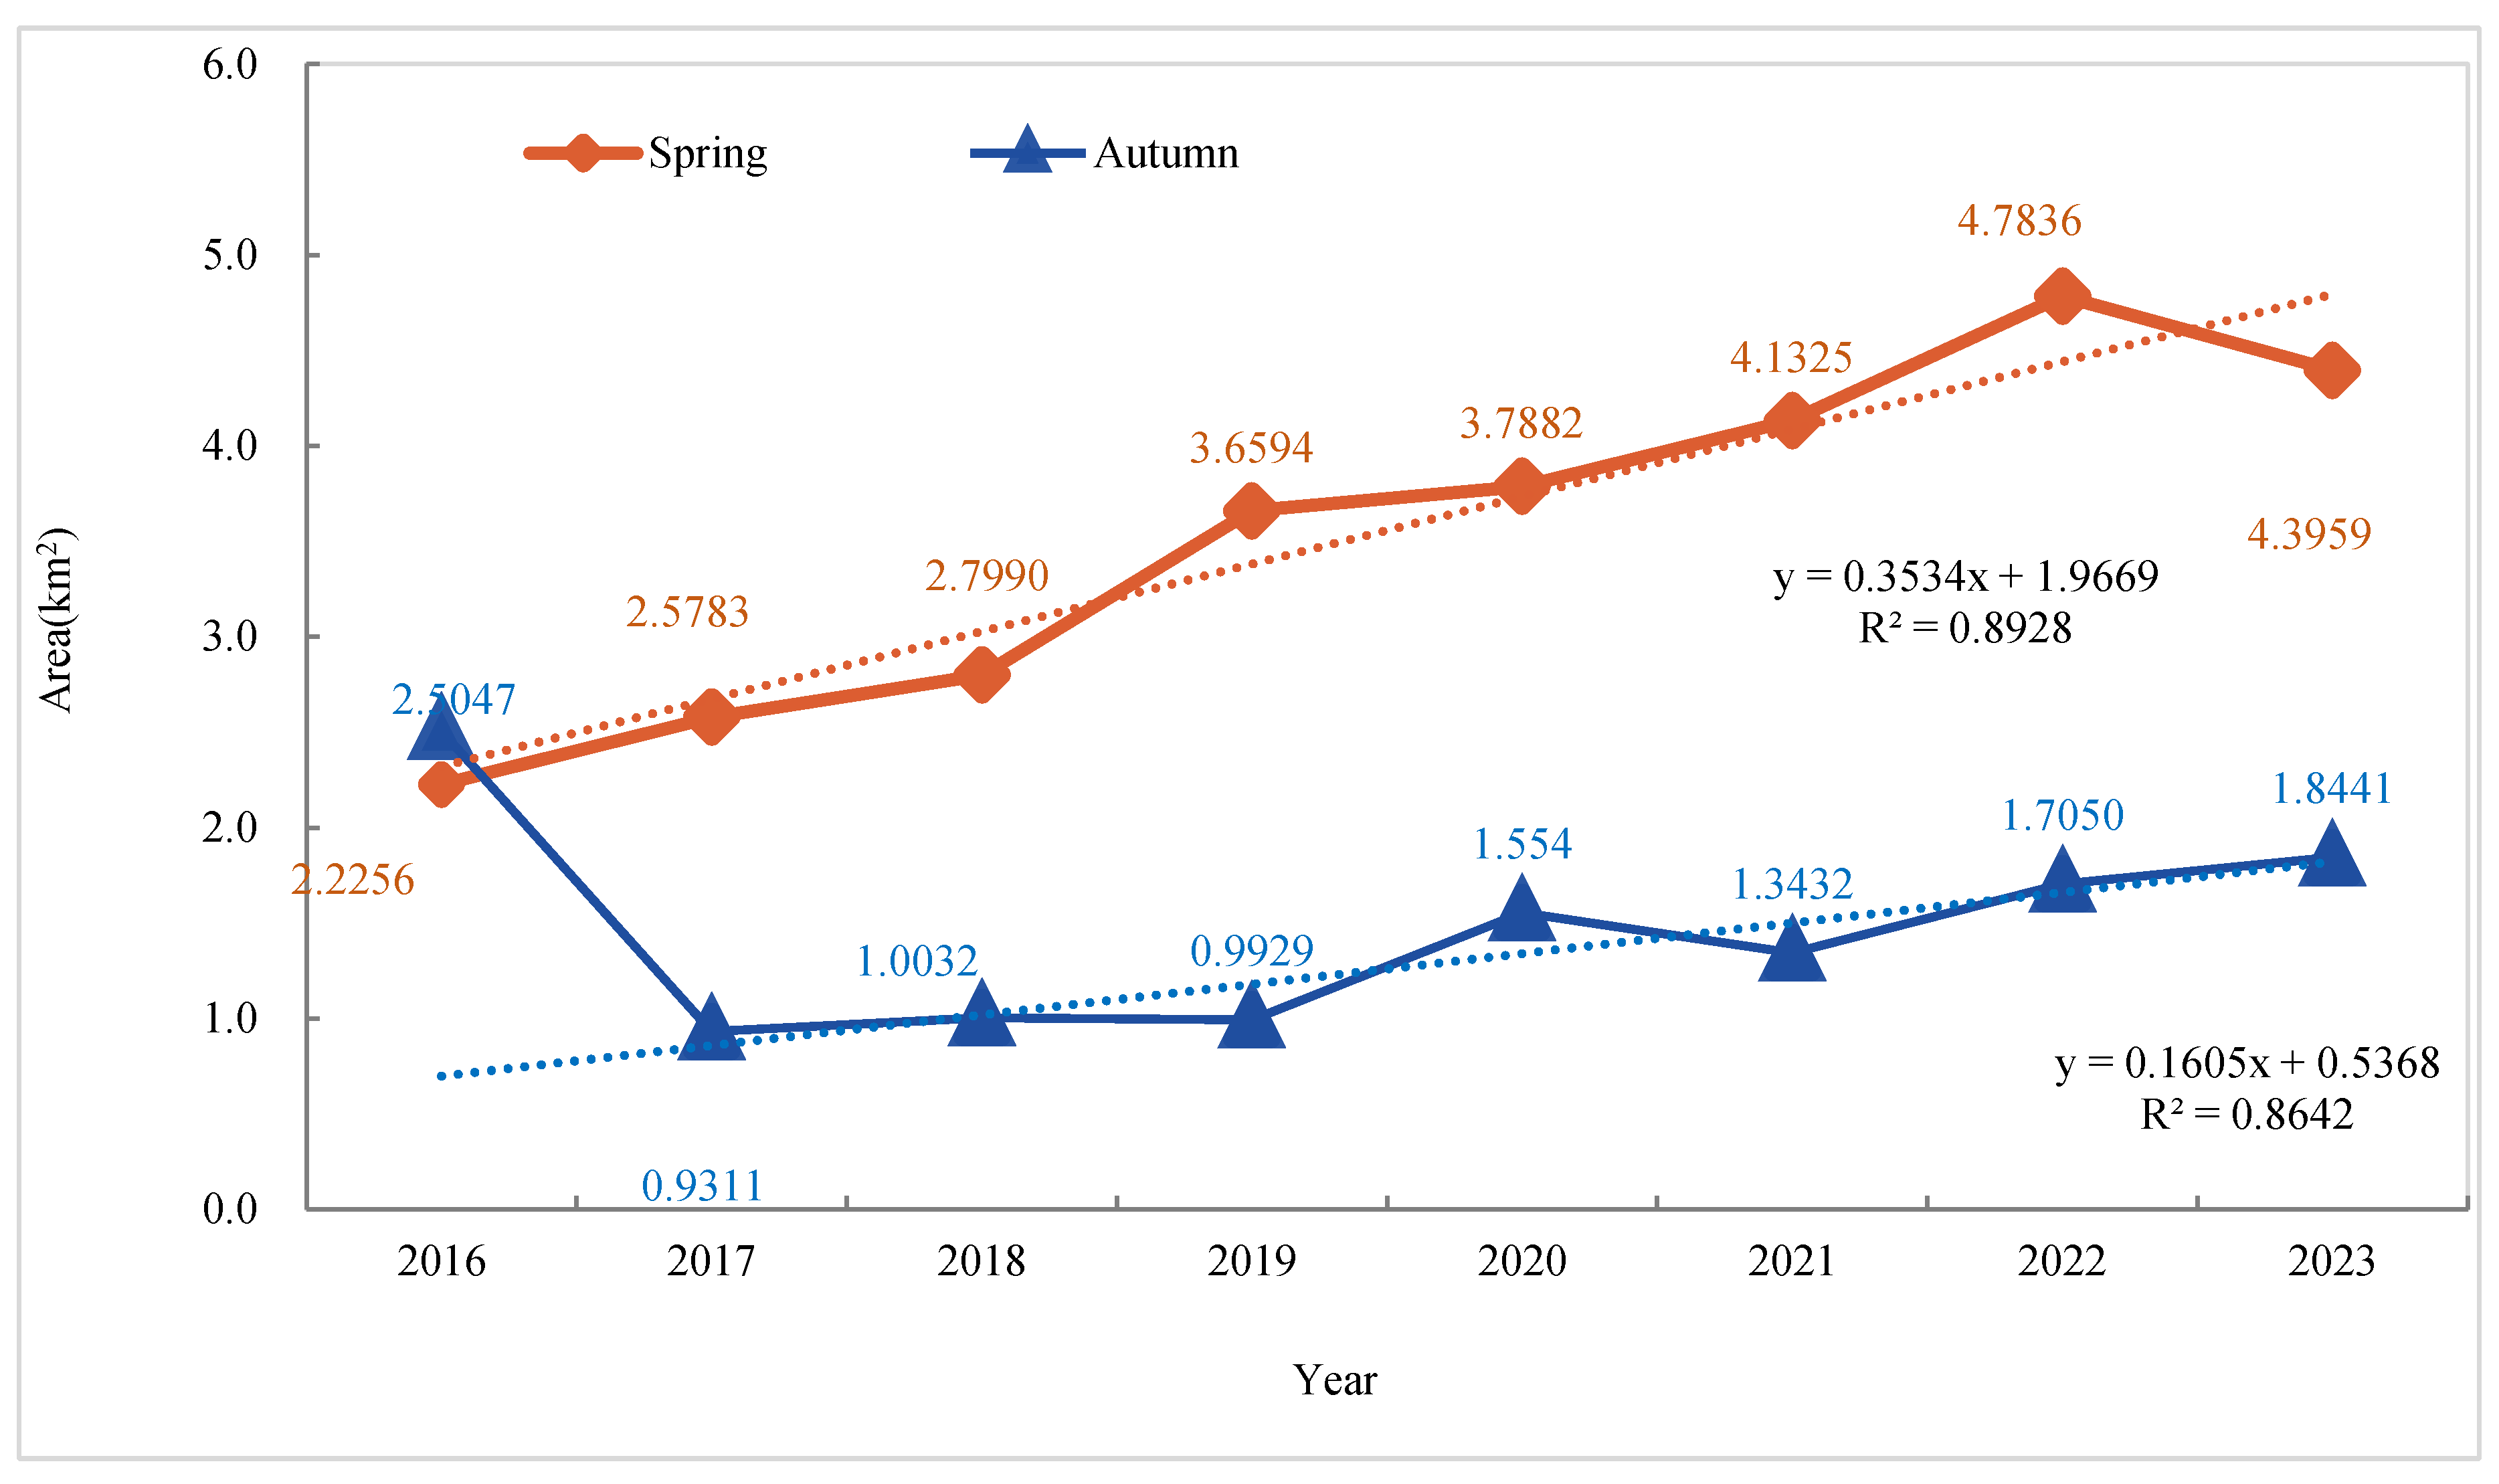
  • Analysis of Area Change Trends.
During 2016–2023, the mixed ecotone in Chongming Dongtan wetland showed a general trend of progressive expansion, with marked seasonal differences between spring and autumn as detailed in Table 4 and shown in Figure 6.
Linear regression analysis confirmed a highly significant expansion trend (R2 = 0.89, p < 0.05) in spring mixed ecotone area, with an average annual growth rate of 13.93%. The expansion process was divided into two distinct phases: A pronounced expansion phase (2016–2019) with an average annual growth rate of 21.47%, followed by a moderate phase (2020–2023) with the rate dropping to 5.35%. The area reached its peak in 2022, followed by a modest decline in 2023; nevertheless, it maintained levels well above those recorded at the start of the monitoring period. In contrast, autumn area exhibited high variability, well described by polynomial regression (R2 = 0.86). A sharp decline of 62.83% occurred in 2017 relative to the 2016 baseline, likely linked to vegetation damage from extreme climate events including intense typhoons or anomalous high tides. Following this decline, gradual recovery proceeded at a mean annual rate of 16.34% (2017–2023), though the area failed to return to pre-decline (2016) levels by the end of the study period. Inter-annual variability in autumn was markedly more pronounced than that observed in spring, suggesting heightened sensitivity of the vegetation to external perturbations during this season.
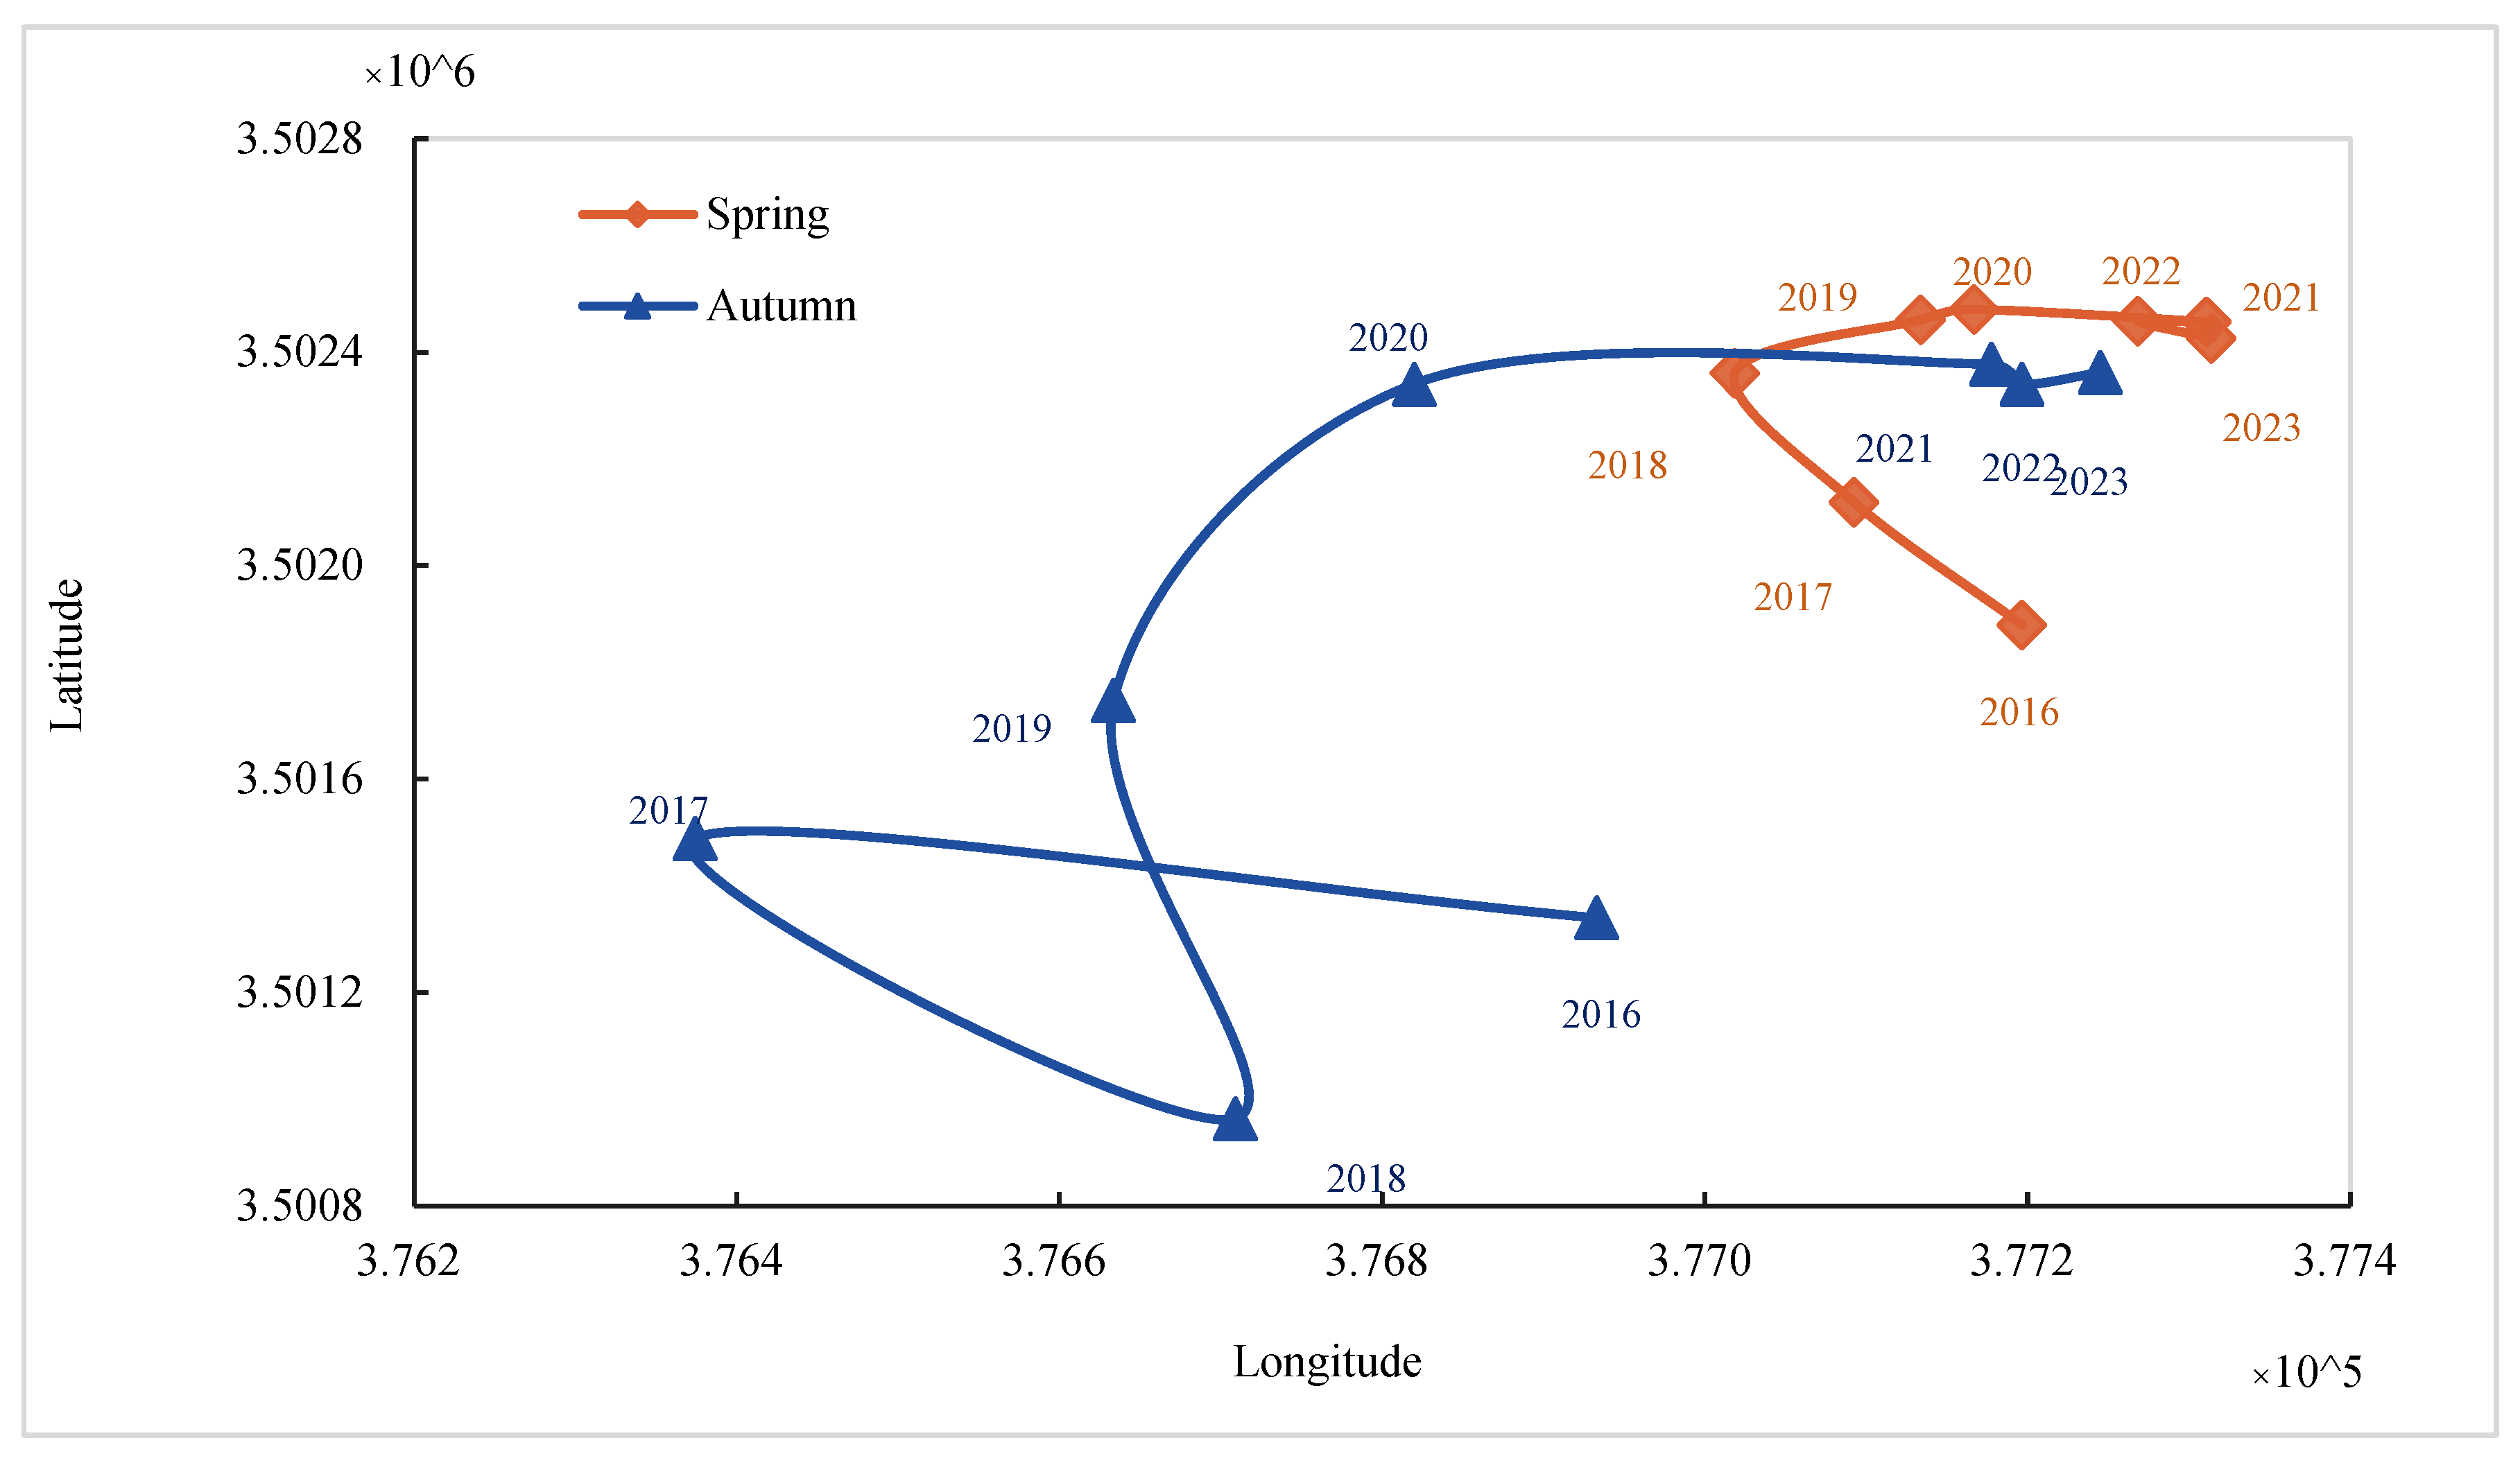
  • Centroid Migration Trajectory and Spatial Expansion Pattern.
Centroid migration analysis reveals the spatial evolution of the mixed ecotone, as documented in Figure 7. A general seaward migration of mixed ecotone was observed in spring (mean azimuth: 112°), revealing a progressive seaward expansion mechanism. The centroid migrated at a relatively high rate between 2016 and 2019, averaging 219.20 m per year. This was followed by a pronounced deceleration between 2020 and 2023, with the average annual displacement plummeting to 70.70 m and accompanied by periodic oscillations—patterns suggesting potential regulation by hydrological resistance or interspecific competition. The autumn migration trajectory revealed greater complexity, characterized by a net displacement of 1068.80 m and a mean orientation of N17.0°E. The trajectory progressed through three distinct phases: Initial southwestward retreat (2016–2018) likely reflecting post-disturbance recovery heterogeneity, followed by a pronounced northeastward shift in 2019, and culminating in sustained northeastward expansion (2020–2023) showing directional alignment with spring migration patterns.
Integrated spatiotemporal analysis verifies a predominant long-term seaward expansion of the mixed ecotone, despite substantial variability in both area fluctuations and centroid trajectories. This dynamic divergence reflects how the competition between S. alterniflora and P. australis is integrally regulated by multiple environmental drivers: Sediment accretion and climatic warming likely create persistent forcing for seaward progression, whereas episodic disturbances—including typhoons, salt stress, and hydrological fluctuations—induce short-term variability and localized retreat. The study clarifies the intricate response pathways of coastal wetland vegetation to climate change and natural disturbances, thereby establishing a spatiotemporal framework for adaptive ecosystem management.

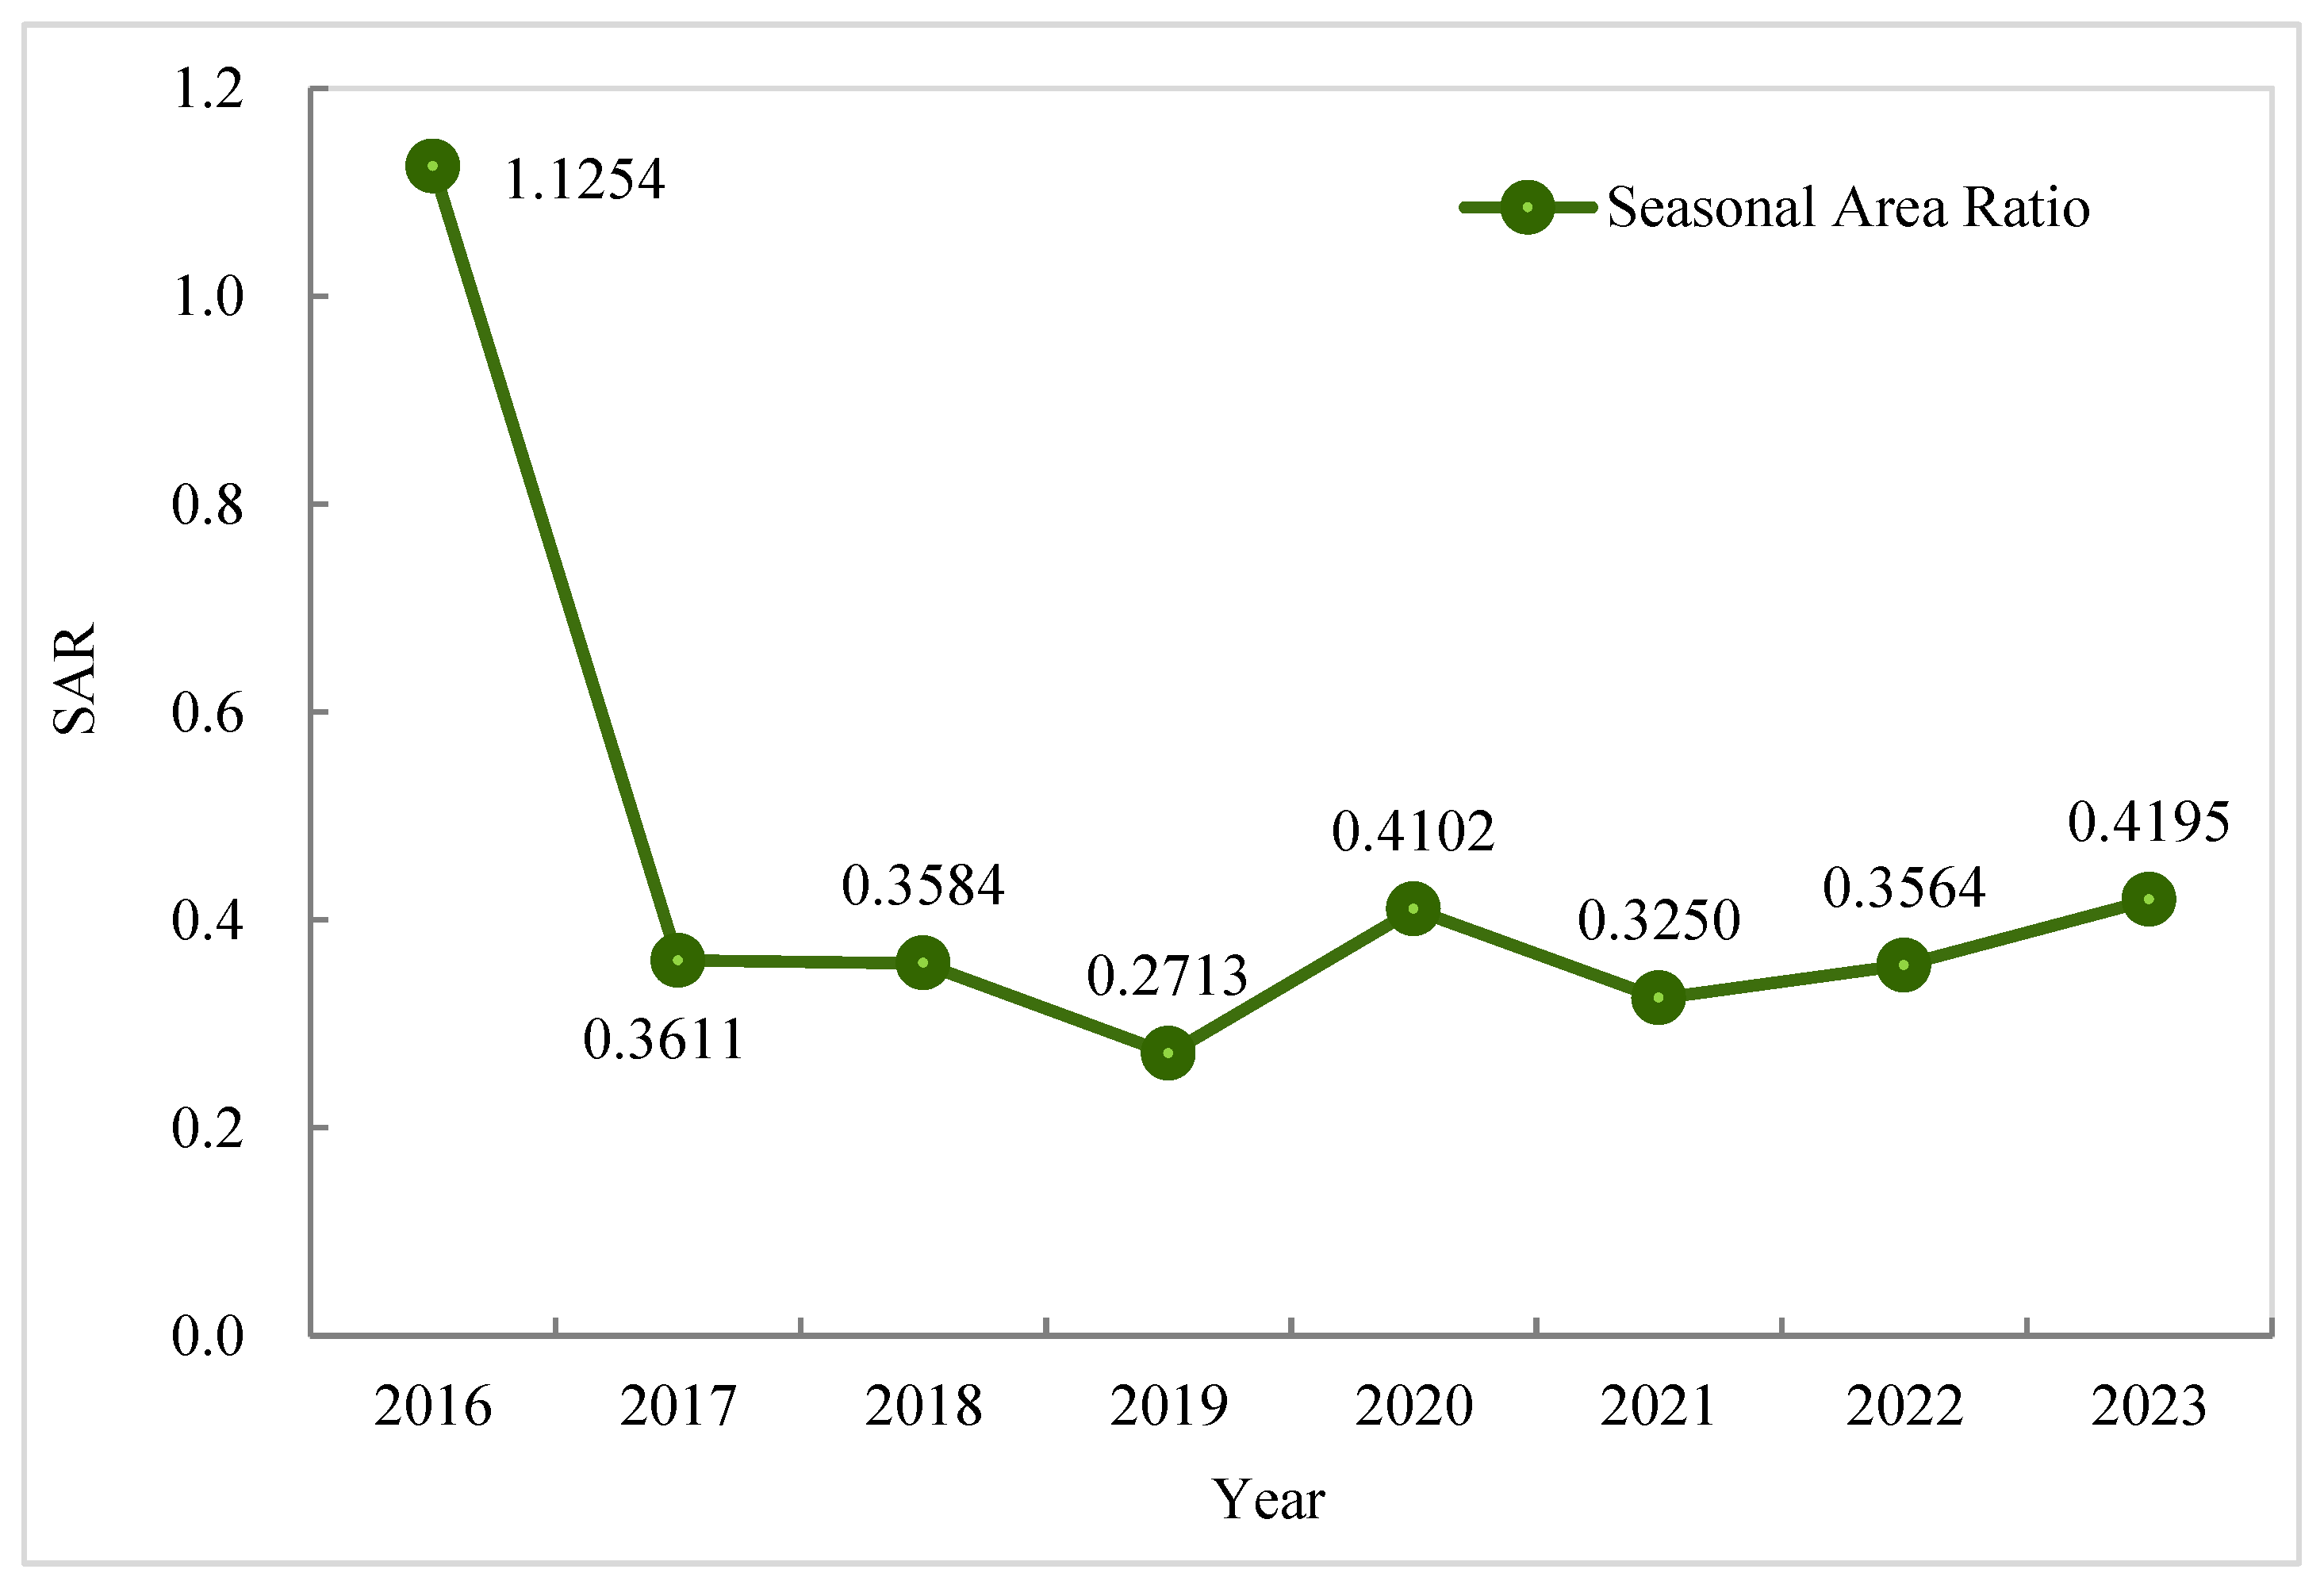
3.4.2. Intra-Annual Dynamics (Seasonal Variations)

Analysis of the Seasonal Area Ratio (SAR) index (2016–2023; Figure 8) reveals a multi-tiered competitive structure within the seasonal dynamics of the S. alterniflora–P. australis mixed ecotone in Chongming Dongtan. Notably, a tipping point in seasonal competition patterns emerged in 2017, corresponding to the abrupt autumn ecotone contraction during 2016–2017—probably triggered by extreme climate events as analyzed in Section 3.4.1. At the inter-annual scale, spring prevailed in seven of the eight monitoring years, forming a distinct “1-year autumn/7-year spring dominance” pattern across the study period. The year 2016 stood as the only period of autumn dominance (SAR = 1.1254), suggesting that S. alterniflora maintained a late-season competitive advantage due to its extended growth period. In contrast, SAR values remained consistently below 1 (range: 0.27–0.42) throughout 2017–2023, establishing a stable spring-dominated regime after the extreme disturbance. During this phase, the earlier phenology of P. australis became the key competitive advantage.
During the seven-year spring-dominated phase, the SAR index further displayed characteristic sawtooth fluctuations with alternating low, medium, and high annual patterns, indicating sustained dynamics in competitive intensity. More specifically, the trough phases with low SAR values (2019: 0.2713; 2021: 0.3250) represent periods of absolute P. australis dominance in spring, resulting from either its strong resource preemption capacity during early phenological stages or favorable hydro-meteorological conditions for germination in those years. Medium SAR values (2017–2018, 2022: ≈ 0.36) indicate an equilibrium phase marked by a temporary competitive standoff between the two species. Elevated SAR values during recovery phases (2020: 0.4102; 2023: 0.4195) indicate that S. alterniflora temporarily regained competitiveness in certain years, enabled by niche penetration and phenotypic plasticity, which led to a periodic rebound in its autumn area.
This aforementioned composite pattern—an overarching regime shift coupled with persistent internal fluctuations—illuminates the competitive dynamics between P. australis and S. alterniflora through the lens of phenological asynchrony and niche differentiation. P. australis secures an initial advantage by establishing early growth precedence through its phenological lead in spring, while S. alterniflora maintains competitive resilience through physiological adaptation and clonal expansion, resulting in a seesaw dynamic at the annual scale. SAR index not only captured a critical transition in the vegetation competition pattern but also established a quantitative framework, via its nuanced inter-annual variations, for comprehending long-term dynamics between invasive and native plants in coastal wetlands under changing conditions. This highlights the fundamental role of phenological strategies in shaping interspecific competition.

4. Discussion

4.1. Methodological Innovations and Comparative Analysis

This study introduces an integrated “3D feature space and multi-threshold Otsu segmentation” method that effectively addresses the challenge of fine-scale wetland vegetation classification, thus providing accurate delineation of complex ecotones. Unlike conventional two-dimensional remote sensing approaches, the proposed method constructs three-dimensional scatter plots that incorporate pixel geographic coordinates (X, Y) and spectral features (Z), thereby mitigating the spectral mixing problem induced by periodic tidal inundation and micro-topographic variations in intertidal zones [13,14,15]. This innovation yielded an overall classification accuracy of 87.3% for the ecotone, with producer’s and user’s accuracies reaching 85.2% and 83.6% respectively. Moreover, building upon the seasonal spectral index method of Yao et al. [10], the proposed approach advances fine-scale classification in dynamic intertidal zones by incorporating pixel-level spatial constraints and an adaptive threshold mechanism, thereby significantly improving its robustness to tidal flat heterogeneity. In conclusion, this methodological framework offers new perspectives for delineating narrow ecological transition zones in complex environments and can be directly applied to vegetation classification and dynamic monitoring in other estuarine wetlands with distinct gradient characteristics and patchy distributions.

4.2. Ecological Implications and Mechanistic Insights

The mixed ecotone exhibited a distinct “seaward expansion” trend and a composite pattern of “overall regime shift with internal fluctuations.” These dynamics thereby elucidate key mechanisms governing the ecological invasion process of S. alterniflora. With an annual spring expansion rate of 13.93% and a seaward azimuth of 112°, the ecotone’s persistent migration is primarily attributable to the unique physiological and ecological adaptive strategies of the invasive species S. alterniflora [47,48]. These strategies—including well-developed aerenchyma, high photosynthetic efficiency, and strong clonal reproductive potential—jointly enable S. alterniflora to maintain a competitive advantage in waterlogged and high-salinity environments. These SAR-based patterns uncovered in this study—a single year of autumn dominance preceding a seven-year spring-dominant phase, and low–medium–high sawtooth fluctuations within it—are consistent with reports by Yin et al. [49], Lisner et al. [50], and Feng et al. [51] on phenological asynchrony driving plant community dynamics. This reflects a typical “seasonal push–pull” competition mechanism: S. alterniflora sustains stronger autumn competitiveness owing to its extended growth period, whereas P. australis secures early spring resource access through phenological advancement (sprouting 15–20 days earlier), thereby establishing a critical growth lead. This form of niche separation [52,53], rooted in phenological differentiation, constitutes a critical mechanism for long-term species coexistence amid ongoing competition.
Beyond identifying key natural drivers, this study reveals substantial anthropogenic influences on vegetation patterning. The geometrically regular linear anomalies in the central study area align with engineering infrastructures like embankments and ditches, supporting previous findings by Wei et al. [54] on human-induced habitat fragmentation in coastal wetlands. This finding underscores that human engineering activities, alongside natural factors, are a core driver of wetland vegetation patterns—necessitating its integration into future ecological assessments and management strategies.

4.3. Management Implications and Recommendations

Based on the findings of this study, the following management recommendations are proposed:
  • Develop differentiated seasonal management strategies based on phenological asynchrony. This involves implementing precise control measures during S. alterniflora’s physiologically vulnerable periods (e.g., green-up and flowering/fruiting stages) [55], and conducting ecological restoration projects during the spring dominance phase of P. australis. Implementing these strategies significantly offers a synergistic benefit, enhancing management efficacy with minimal ecological disruption.
  • Adopt spatially-differentiated management strategies. This requires accounting for micro-topographic and salinity gradients [56] to implement tailored strategies for the patchy northwestern ecotone, whereas the central region—affected by human activities—must undertake ecological engineering assessments and adaptive restoration planning to mitigate counter infrastructure impacts on vegetation patterns.
  • Establish a dynamic monitoring and early-warning system. By integrating multi-source remote sensing data with ground observation networks [57], develop a model that captures spatial, phenological, and competitive dynamics to track the expansion of S. alterniflora and issue early risk alerts, thereby providing essential decision-support for coastal wetland conservation.

4.4. Management Implications and Recommendations

The study is primarily constrained by the limited temporal coverage of ground validation data and an over-reliance on remote sensing inversion in interpreting vegetation competition mechanisms [58]. Accordingly, future studies should be directed toward the following key areas:
  • Enhancement of multi-temporal validation and in-situ monitoring through integrated long-term plots and UAV-based hyperspectral observations for improved classification reliability and ecological process analysis.
  • Employ spatially explicit models to decipher the interactive effects of anthropogenic and natural drivers to quantify the impact of human disturbances—particularly engineering infrastructure—on ecotone dynamics.

5. Conclusion

Using spring and autumn Sentinel-2 satellite imagery from 2016 to 2023, this study developed an integrated framework that combines a three-dimensional feature space with multi-threshold Otsu segmentation, achieving high-accuracy extraction and multi-scale dynamic monitoring of the mixed S. alterniflora–P. australis ecotone in Chongming Dongtan. The main findings are as follows:
  • A seasonally adaptive spectral index framework, incorporating a three-dimensional feature space, was developed to extract the mixed ecotone. Identification of the optimal spectral features—near-infrared reflectance (spring) and NDVI (autumn)—followed by adoption of the multi-threshold Otsu algorithm, enabled high-precision vegetation community classification. The validation results yielded high accuracy, with an overall accuracy of 87.3±1.4% and a Kappa coefficient of 0.84±0.02. The mixed ecotone was accurately delineated, achieving producer’s and user’s accuracies of 85.2% and 83.6%, respectively, which greatly enhances the identification capability and temporal stability for narrow transition zones.
  • This study documented a distinct land-to-sea ecological sequence—pure P. australis–mixed ecotone–pure S. alterniflora—in the Chongming Dongtan wetland, with the vegetation arranged in an overall east–west belt. The northwestern sector exhibited a patchy distribution influenced by tidal creeks and micro-topography, related to salinity gradients and hydrological differentiation induced by elevation heterogeneity. Meanwhile, regular linear anomalies identified in the central area were attributable to engineering infrastructure, underscoring the spatial heterogeneity shaped by coupled natural-anthropogenic drivers.
  • The mixed ecotone showed consistent seaward expansion from 2016 to 2023. During spring, it exhibited an average annual growth rate of 13.93%, with the centroid migrating steadily seaward at an azimuth of 112°. The migration rate showed a notable deceleration in later years, interspersed with periodic reversals, suggesting control by hydrological resistance or interspecific competition. Influenced by extreme climate events, the ecotone area exhibited marked fluctuations in autumn—most notably a 62.83% decline from 2016 to 2017. Paralleling this instability, the centroid migration path was similarly complex, unfolding in a three-phase sequence of “retreat–leap–expansion.” The spatiotemporal dynamics were shaped by the long-term drivers of sediment deposition and climate warming, with short-term modifiers including typhoons, salt stress, and hydrological disturbances.
  • Analysis of the SAR index revealed a tipping point in 2017, when the seasonal competition pattern of the ecotone transitioned from a single year of autumn dominance to a subsequent seven-year phase of spring dominance. During the spring-dominated phase, the SAR values demonstrated a characteristic sawtooth-like fluctuation (0.27–0.42) with cyclical low-medium-high shifts, thereby indicating a dynamic equilibrium wherein P. australis establishes dominance through phenological advancement, whereas S. alterniflora ensures competitive resilience via niche penetration. The SAR index serves as a powerful tool for capturing spatiotemporal competition dynamics and deciphering the mechanisms driving wetland vegetation succession.
The integrated “spatial–spectral–temporal” monitoring framework developed in this study can establish a technical foundation for managing invasive species and supporting ecological restoration in coastal wetlands. This study contributes directly to advancing UN Sustainable Development Goal (SDG) 15.1 on wetland conservation and informs China’s national strategy for “integrated protection of mountains, waters, forests, farmlands, lakes, grasslands, and deserts.”

Author Contributions

Conceptualization, W.H.; methodology, X.X. and X.C.; software, Z.Z.; validation, X.X., X.C. and B.X.; formal analysis, X.X.; investigation, X.C.; resources, Q.L.; data curation, T.D.; writing—original draft preparation, X.X. and X.C.; writing—review and editing, W.H. and Q.L.; visualization, X.X., X.C. and B.X.; supervision, T.D.; project administration, Q.L.; funding acquisition, W.H. All authors have read and agreed to the published version of the manuscript.

Funding

This research was funded by the National Natural Science Foundation of China, grant number 42401320; and the Natural Science Research Project of Anhui Universities, grant number KJ2021A0122.

Data Availability Statement

The data supporting the findings of this study are available from the following sources. The primary remote sensing data comprise Sentinel-2A/2B imagery, which was obtained from the Copernicus Open Access Hub (https://scihub.copernicus.eu/). For ground validation, 127 field points were collected along the mixed ecotone boundaries in April and November 2023 using GPS RTK and UAV aerial photography (Figure 1). These points were interpreted against high-resolution UAV orthophotos to establish a comprehensive validation dataset that encompasses all three vegetation types. All datasets generated and analyzed in this study will be made publicly available via a persistent repository upon publication.

Acknowledgments

We confirm that all individuals acknowledged herein have provided their consent. We are also grateful to the anonymous reviewers for their constructive comments and suggestions, which significantly enhanced the quality of this paper.

Conflicts of Interest

The authors declare no conflicts of interest.

Abbreviations

The following abbreviations are used in this manuscript:
SAR Seasonal Area Ratio
JM Jeffries-Matusita
3D Three-Dimensional
S. alterniflora Spartina alterniflora
P. australis Phragmites australis
B. mariqueter Bolboschoenoplectus mariqueter
NIR Near-Infrared Reflectance
NDVI Normalized Difference Vegetation Index
GIS Geographic Information System
NLSD National Land Survey Data
CLCD China Land Cover Dataset
GF-1 Gaofen-1satellite
UAV Unmanned Aerial Vehicle
MSI Multispectral Instrument
GPS Global Positioning System
RTK Real-Time Kinematic
UN United Nations
SDG Sustainable Development Goal

References

  1. Zhu, W.Q.; Ren, G.B.; Wang, J.P.; Wang, J.B.; Hu, Y.B; Lin, Z.Y.; Li, W.; Zhao, Y.J.; Li, S.B.; Wang, N. Monitoring the Invasive Plant Spartina alterniflora in Jiangsu Coastal Wetland Using MRCNN and Long-Time Series Landsat Data. Remote Sens. 2022, 14, 2630. [Google Scholar] [CrossRef]
  2. Zhang, G.L.; Bai, J.H.; Tebbe, C.C.; Huang, L.B.; Jia, J.; Wang, W.; Wang, X.; Yu, L.; Zhao, Q.Q. Spartina alterniflora invasions reduce soil fungal diversity and simplify co-occurrence networks in a salt marsh ecosystem. Sci. Total Environ. 2021, 758, 143667. [Google Scholar] [CrossRef]
  3. Huang, Y.Y.; Huang, Y.Y.; Du, X.L.; Li, Y.M.; Tian, J.T.; Chen, Q.; Huang, Y.H.; Lv, W.W.; Yang, Y.; Liu, Z.Q.; Zhao, Y.L. Assessment of macrobenthic community function and ecological quality after reclamation in the Changjiang (Yangtze) River Estuary wetland. Acta Oceanol. Sin. 2022, 41, 96–107. [Google Scholar] [CrossRef]
  4. Syed, S.; Xu, M.; Wang, Z.F.; Yu, C.F.; Lian, B. Invasive Spartina alterniflora in controlled cultivation: Environmental implications of converging future technologies. Ecol. Indic. 2021, 130, 108027. [Google Scholar] [CrossRef]
  5. Chen, W.J.; Shi, C. Fine-scale mapping of Spartina alterniflora-invaded mangrove forests with multi-temporal WorldView-Sentinel-2 data fusion. Remote Sens. Environ. 2023, 295, 113690. [Google Scholar] [CrossRef]
  6. Chang, D.; Wang, Z.Y.; Ning, X.G.; Li, Z.J.; Zhang, L.; Liu, X.T. Vegetation changes in Yellow River Delta wetlands from 2018 to 2020 using PIE-Engine and short time series Sentinel-2 images. Front. Mar. Sci. 2022, 9, 977050. [Google Scholar] [CrossRef]
  7. Döweler, F.; Fransson, J.E.S.; Bader, M.K.F. Linking High-Resolution UAV-Based Remote Sensing Data to Long-Term Vegetation Sampling—A Novel Workflow to Study Slow Ecotone Dynamics. Remote Sens. 2024, 16, 840. [Google Scholar] [CrossRef]
  8. Zhou, H.; Tang, M.D.; Huang, J.; Mei, X.X.; Zhao, H.J. Driving mechanisms and multi-scenario simulation of land use change based on National Land Survey Data: a case in Jianghan Plain, China. Front. Environ. Sci. 2024, 12, 1422987. [Google Scholar] [CrossRef]
  9. Shi, Z.Y.; Pu, W.P.; Dong, J.H. Spatiotemporal Changes of Land Use and Their Impacts on Ecosystem Service Value inthe Agro-pastoral Ecotone of Northern China. Environ. Sci. 2025, 46, 2373–2384. [Google Scholar]
  10. Yao, H.Y.; Liu, P.D.; Shi, R.H.; Zhang, C. Extracting the transitional zone of Spartina alterniflora and Phragmites australis in the wetland using high-resolution remotely sensed images. J. Geo-inf. Sci. 2017, 19, 1375–1381. [Google Scholar]
  11. Dong, D.; Huang, H.M.; Gao, Q.; Zhang, S.P.; Li, K.; Wei, Z.; Sun, Y.C. Combing satellite and UAV remote sensing to monitor a mangrove-saltmarsh ecotone: a case study from Dandou Sea in Guangxi. J. Appl. Oceanogr. 2025, 44, 167–176. [Google Scholar]
  12. Li, C.W.; Fang, S.B.; Geng, X.L.; Yuan, Y.; Zheng, X.W.; Zhang, D.; Li, R.X.; Sun, W.; Wang, X.R. Coastal ecosystem service in response to past and future land use and land cover change dynamics in the Yangtze river estuary. J. Clean. Prod. 2023, 385, 135601. [Google Scholar] [CrossRef]
  13. Mohammed Rabiul Alam, S.; Shawkat Hossain, M. Using a water index approach to mapping periodically inundated saltmarsh land-cover vegetation and eco-zonation using multi-temporal Landsat 8 imagery. J. Coast. Conserv. 2024, 28, 19. [Google Scholar] [CrossRef]
  14. Wittstruck, L.; Jarmer, T.; Waske, B. Multi-Stage Feature Fusion of Multispectral and SAR Satellite Images for Seasonal Crop-Type Mapping at Regional Scale Using an Adapted 3D U-Net Model. Remote Sens. 2024, 16, 3115. [Google Scholar] [CrossRef]
  15. Zhou, N.; Zhou, M.T.; Sui, H.G. DepthCD: Depth prompting in 2D remote sensing imagery change detection. ISPRS J. Photogramm. Remote Sens. 2025, 227, 145–169. [Google Scholar] [CrossRef]
  16. Liu, P.D.; Shi, R.H.; Meng, F.; Liu, J.T.; Yao, G.B.; Fu, P.J. Combining Multi-Indices by Neural Network Model for Estimating Canopy Chlorophyll Content: a Case Study of Interspecies Competition between Spartina alterniflora and Phragmites australis. Pol. J. Environ. Stud. 2022, 31, 199–217. [Google Scholar] [CrossRef]
  17. Najjar Khodabakhsh, Z.; Moradi, H.; Rahimzadeh-Bajgiran, P.; Pourmanafi, S.; Ahmadi, M. A 30-year phenological study of mangrove forests at the species level as a function of climatic drivers using multispectral remote sensing satellites. Ecol. Indic. 2025, 178, 114038. [Google Scholar] [CrossRef]
  18. Klehr, D.; Stoffels, J.; Hill, A.; Pham, V.D.; van der Linden, S.; Frantz, D. Mapping tree species fractions in temperate mixed forests using Sentinel-2 time series and synthetically mixed training data. Remote Sens. Environ. 2025, 323, 114740. [Google Scholar] [CrossRef]
  19. Lomeo, D.; Simis, S.G.H.; Selmes, N.; Jungblut, A.D.; Tebbs, E.J. Colour-informed ecoregion analysis highlights a satellite capability gap for spatially and temporally consistent freshwater cyanobacteria monitoring. ISPRS J. Photogramm. Remote Sens. 2025, 228, 323–339. [Google Scholar] [CrossRef]
  20. Kumbier, K.; Hughes, M.G.; Rogers, K.; Woodroffe, C.D. Inundation characteristics of mangrove and saltmarsh in micro-tidal estuaries. Estuar. Coast. Shelf Sci. 2021, 261, 107553. [Google Scholar] [CrossRef]
  21. Deijns, A.A.J.; Michéa, D.; Déprez, A.; Malet, J.P.; Kervyn, F.; Thiery, W.; Dewitte, O. A semi-supervised multi-temporal landslide and flash flood event detection methodology for unexplored regions using massive satellite image time series. ISPRS J. Photogramm. Remote Sens. 2024, 215, 400–418. [Google Scholar] [CrossRef]
  22. Lin, Y.X.; Hu, H.W.; Yang, P.; Ye, G.P. Spartina alterniflora invasion has a greater impact than non-native species, Phragmites australis and Kandelia obovata, on the bacterial community assemblages in an estuarine wetland. Sci. Total Environ. 2022, 822, 153517. [Google Scholar] [CrossRef] [PubMed]
  23. Wu, W.T.; Yang, Z.Q.; Chen, C.P.; Tian, B. Tracking the environmental impacts of ecological engineering on coastal wetlands with numerical modeling and remote sensing. J. Environ. Manage. 2022, 302, 113957. [Google Scholar] [CrossRef] [PubMed]
  24. Liu, S.; Hu, Z.; Grandjean, T.J.; Bing Wang, Z.; van Zelst, V.T.M.; Qi, L.; Xu, T.P.; Young Seo, J.; Bouma, T.J. Dynamics and drivers of tidal flat morphology in China. Nat. Commun. 2025, 16, 2153. [Google Scholar] [CrossRef]
  25. Cao, Y.; Dong, B.; Xu, H.F.; Xu, Z.L.; Wei, Z.Z.; Lu, Z.P.; Liu, X. Landscape ecological risk assessment of chongming dongtan wetland in shanghai from 1990 to 2020. Environ. Res. Commun. 2023, 5, 105016. [Google Scholar] [CrossRef]
  26. Chen, X.H.; Yang, Q.Q.; Chen, Z.Z.; Lei, J.R.; Wu, T.T.; Li, Y.L.; Pan, X.Y. The interaction between temperature and rainfall determines the probability of tropical forest fire occurrence in Hainan Island. Front. Vet. Sci. 2025, 8, 1495699. [Google Scholar] [CrossRef]
  27. Zhang, Q.; Li, B. Field practice of Scirpus mariqueter restoration in the bird habitats of Chongming Dongtan Wetland, China. Chin. J. Appl. Ecol. 2023, 34, 2663–2671. [Google Scholar]
  28. Suwanprasit, C. ; Shahnawaz. Mapping burned areas in Thailand using Sentinel-2 imagery and OBIA techniques. Sci. Rep. 2024, 14, 9609. [Google Scholar]
  29. Zhang, J.Y.; Ning, Y.L.; Li, J.X.; Shi, Z.L.; Zhang, Q.Z.; Li, L.Q.; Kang, B.Y.; Du, Z.B.; Luo, J.C.; He, M.X.; Li, H.Y. Invasion stage and competition intensity co-drive reproductive strategies of native and invasive saltmarsh plants: Evidence from field data. Sci. Total Environ. 2024, 954, 176383. [Google Scholar] [CrossRef]
  30. Sun, C.; Li, J.L.; Liu, Y.X.; Liu, Y.C.; Liu, R.Q. Plant species classification in salt marshes using phenological parameters derived from Sentinel-2 pixel-differential time-series. Remote Sens. Environ. 2021, 256, 112320. [Google Scholar] [CrossRef]
  31. Zhao, Q.; Qu, Y.H. The Retrieval of Ground NDVI (Normalized Difference Vegetation Index) Data Consistent with Remote-Sensing Observations. Remote Sens. 2024, 16, 1212. [Google Scholar] [CrossRef]
  32. Zhang, Q.J.; Guo, Z.H.; Liu, L.; Mei, J.C.; Wang, L. Lithological classification using SDGSAT-1 TIS data and three-dimensional spectral feature space model. Int. J. Digit. Earth 2025, 18, 2467983. [Google Scholar] [CrossRef]
  33. Li, J.; Wu, Z.C.; Hu, Z.W.; Jian, C.L.; Luo, S.J.; Mou, L.C.; Zhu, X.X.; Molinier, M. A Lightweight Deep Learning-Based Cloud Detection Method for Sentinel-2A Imagery Fusing Multiscale Spectral and Spatial Features. IEEE Trans. Geosci. Remote Sens. 2021, 60, 1–19. [Google Scholar] [CrossRef]
  34. Turker, M.; Rahimzadeganasl, A. Agricultural Field Detection from Satellite Imagery Using the Combined Otsu’s Thresholding Algorithm and Marker-Controlled Watershed-Based Transform. J. Indian Soc. Remote Sens. 2021, 49, 1035–1050. [Google Scholar] [CrossRef]
  35. Kahaer, Y.; Shi, Q.D.; Shi, H.B.; Peng, L.; Abudureyimu, A.; Wan, Y.B.; Li, H.; Zhang, W.Q.; Yang, N.J. What Is the Effect of Quantitative Inversion of Photosynthetic Pigment Content in Populus euphratica Oliv. Individual Tree Canopy Based on Multispectral UAV Images? Forests 2022, 13, 542. [Google Scholar]
  36. Yang, X.Z.; Hong, L. A New Classification Rule-Set for Mapping Surface Water in Complex Topographical Regions Using Sentinel-2 Imagery. Water 2024, 16, 943. [Google Scholar] [CrossRef]
  37. Zhao, J.Q.; Wang, Z.X.; Zhang, Q.J.; Niu, Y.F.; Lu, Z.; Zhao, Z. A novel feature selection criterion for wetland mapping using GF-3 and Sentinel-2 Data. Ecol. Indic. 2025, 171, 113146. [Google Scholar] [CrossRef]
  38. Zhang, X.M.; Lin, X.F.; Fu, D.J.; Wang, Y.; Sun, S.B.; Wang, F.; Wang, C.P.; Xiao, Z.Y.; Shi, Y.Q. Comparison of the Applicability of J-M Distance Feature Selection Methods for Coastal Wetland Classification. Water 2023, 15, 2212. [Google Scholar] [CrossRef]
  39. Seo, D.M.; Woo, H.J.; Hong, W.H.; Seo, H.; Na, W.J. Optimization of Number of GCPs and Placement Strategy for UAV-Based Orthophoto Production. Appl. Sci. 2024, 14, 3163. [Google Scholar] [CrossRef]
  40. Xu, Q.; Jin, M.T.; Guo, P. A High-Precision Crop Classification Method Based on Time-Series UAV Images. Agriculture 2023, 13, 97. [Google Scholar] [CrossRef]
  41. Motiee, H.; Ahrari, S.; Motiee, S.; McBean, E. Assessment of Climate Change with Remote Sensing Data on Snow and Ice Cover in the Rocky Mountains Glaciers. J. Environ. Inf. 2025, 46, 544. [Google Scholar] [CrossRef]
  42. Hei Wong, C.; Li, Z.Y.; Hung Lam Yim, S.; Chang, T.Y.; Ling Man, C.; Ho Cheng, C.; Chi-Yui Kwok, T.; Fai Ho, K. The comparison between multiple linear regression and random forest model in predicting environmental noise and its frequency components level in Hong Kong using a land-use regression approach. Environ Res. 2025, 286, 122919. [Google Scholar] [CrossRef] [PubMed]
  43. Han, Z.M.; Huang, Q.; Huang, S.Z.; Leng, G.Y.; Bai, Q.J.; Liang, H.; Wang, L.; Zhao, J.; Fang, W. Spatial-temporal dynamics of agricultural drought in the Loess Plateau under a changing environment: Characteristics and potential influencing factors. Agric. Water Manag. 2021, 244, 106540. [Google Scholar] [CrossRef]
  44. Qiu, T.Z.; Cong, N.; Rong, L.; Qi, G.; Du, L.; Ren, P.; Xiao, J.T. Spatiotemporal dynamics and driving mechanisms of alpine peatland wetlands in the eastern Qinghai–Tibet Plateau based on a Vision Transformer model. Ecol. Indic. 2025, 178, 114136. [Google Scholar] [CrossRef]
  45. Yan, S.Y.; Yang, G.H.; Li, Q.Y.; Zhang, B.; Wang, Y.; Zhang, Y.; Wang, C.H. Distance–Intensity Image Strategy for Pulsed LiDAR Based on the Double-Scale Intensity-Weighted Centroid Algorithm. Remote Sens. 2021, 13, 432. [Google Scholar] [CrossRef]
  46. Haight, J.D.; Hall, S.J.; Lewis, J.S. Landscape modification and species traits shape seasonal wildlife community dynamics within an arid metropolitan region. Landsc. Urban Plan. 2025, 259, 105346. [Google Scholar] [CrossRef]
  47. Wang, J.B.; Lin, Z.Y.; Ma, Y.Q.; Ren, G.B.; Xu, Z.J.; Song, X.K.; Ma, Y.; Wang, A.D.; Zhao, Y.J. Distribution and invasion of Spartina alterniflora within the Jiaozhou Bay monitored by remote sensing image. Acta Oceanol. Sin. 2022, 41, 31–40. [Google Scholar] [CrossRef]
  48. Yu, H.L.; Zhao, X.Y.; Huang, W.D.; Zhan, J.; He, Y.Z. Drought Stress Influences the Growth and Physiological Characteristics of Solanum rostratum Dunal Seedlings From Different Geographical Populations in China. Front. Plant Sci. 2021, 12, 733268. [Google Scholar] [CrossRef]
  49. Yin, S.; Liang, G.P.; Wang, C.K.; Zhou, Z.H. Asynchronous seasonal patterns of soil microorganisms and plants across biomes: A global synthesis. Soil Biol. Biochem. 2022, 175, 108859. [Google Scholar] [CrossRef]
  50. Lisner, A.; Segrestin, J.; Konečná, M.; Blažek, P.; Janíková, E.; Applová, M.; Švancárová, T.; Lepš, J. Why are plant communities stable? Disentangling the role of dominance, asynchrony and averaging effect following realistic species loss scenario. J. Ecol. 2024, 112, 1832–1841. [Google Scholar]
  51. Feng, J.; Grandjean, T.J.; Wu, X.R.; van de Koppel, J.; van der Wal, D. Long-term phenological shifts in coastal saltmarsh vegetation reveal complex responses to climate change. Ecol. Indic. 2025, 179, 114219. [Google Scholar] [CrossRef]
  52. Ai, J.Q.; Chen, L.J.; He, H.Q.; Han, X.X. Revealing the long-term impacts of plant invasion and reclamation on native saltmarsh vegetation in the Yangtze River estuary using multi-source time series remote sensing data. Ecol. Eng. 2024, 208, 107362. [Google Scholar] [CrossRef]
  53. Bobrowski, M.; Bechtel, B.; Böhner, J.; Oldeland, J.; Weidinger, J.; Schickhoff, U. Application of Thermal and Phenological Land Surface Parameters for Improving Ecological Niche Models of Betula utilis in the Himalayan Region. Remote Sens. 2018, 10, 814. [Google Scholar] [CrossRef]
  54. Wei, F.; Han, M.; Han, G.X.; Wang, M.; Tian, L.X.; Zhu, J.Q.; Kong, X.L. Reclamation-oriented spatiotemporal evolution of coastal wetland along Bohai Rim, China. Acta Oceanol. Sin. 2022, 41, 192–204. [Google Scholar] [CrossRef]
  55. Zhang, C.; Zhang, Q.; Zhang, H.; Zheng, Y.L.; Yuan, L.; Zhong, Q.C. Climate warming increases the invasiveness of the exotic Spartina alterniflora in a coastal salt marsh: Implications for invasion management. J. Environ. Manage. 2025, 380, 124765. [Google Scholar] [CrossRef]
  56. Wang, D.W.; Bai, J.H.; Wang, W.; Ma, X.; Guan, Y.N.; Gu, C.H.; Zhang, S.Y.; Lu, F. Micro-Topography Manipulations Facilitate Suaeda Salsa Marsh Restoration along the Lateral Gradient of a Tidal Creek. Wetlands 2020, 40, 1657–1666. [Google Scholar] [CrossRef]
  57. Ma, X.S.; Wang, Z.L.; Liu, Y. Ecological risk assessment of a coastal area using multi-source remote sensing images and in-situ sample data. Ecol. Indic. 2024, 158, 111470. [Google Scholar] [CrossRef]
  58. Han, Y.L.; Dong, Y.Y.; Zhu, Y.N. , Huang, W. J. Remote Sensing Inversion of Vegetation Parameters With IPROSAIL-Net. IEEE Trans. Geosci. Remote Sens. 2023, 62, 1–16. [Google Scholar]
Figure 1. Location of the study area.
Preprints 187845 g001
Figure 2. 3D feature space representations of spectral indices for spring (April 2023).
Preprints 187845 g002
Figure 3. 3D feature space representations of spectral indices for autumn (November 2023).
Preprints 187845 g003
Figure 4. Three-dimensional scatter plots based on the optimal spectral indices for 2023: (a) Spring, using near-infrared reflectance; (b) Autumn, using NDVI.
Preprints 187845 g004
Figure 5. Time-series vegetation classification maps derived from optimal spectral indices and Otsu segmentation (2016–2023): (a–h) Spring, (i–p) Autumn.
Preprints 187845 g005
Figure 6. Spatiotemporal dynamics of the mixed ecotone in Chongming Dongtan: expansion trends and seasonal patterns (2016–2023).
Preprints 187845 g006
Figure 7. Spatiotemporal dynamics of mixed ecotone centroid migration (2016–2023).
Preprints 187845 g007
Figure 8. Interannual variability of the Seasonal Area Ratio (SAR) in the mixed ecotone (2016–2023).
Preprints 187845 g008
Table 1. Data specifications.
Year Spring Image Date Cloud Cover Autumn Image Date Cloud Cover
2016 20160325 7.8% 20161207 0.2%
2017 20170429 6.9% 20171115 3.1%
2018 20180401 7.3% 20181212 6.0%
2019 20190406 0.6% 20191115 0.0%
2020 20200413 4.9% 20201129 1.4%
2021 20210418 4.6% 20211114 0.0%
2022 20220420 2.8% 20221116 8.4%
2023 20230428 6.5% 20231124 8.7%
Table 2. Otsu segmentation thresholds and inter-class separability (JM distance) of spectral indices for spring and autumn 2023.
Season Spectral Index Threshold T1 Threshold T2 JM distance
P. australis–ecotone P. australis–ecotone P. australis–ecotone
Spring ρBLUE 0.040600 0.094005 1.50 1.50 1.50
ρGREEN 0.066416 0.123075 1.60 1.60 1.60
ρRED 0.075696 0.129511 1.70 1.70 1.70
ρNIR 0.149945 0.190183 1.99 1.99 1.99
NDVI 0.174555 0.282613 1.86 1.86 1.86
Autumn ρBLUE 0.066783 0.104831 1.40 1.40 1.40
ρGREEN 0.043947 0.074789 1.50 1.50 1.50
ρRED 0.072376 0.119112 1.60 1.60 1.60
ρNIR 0.181992 0.258286 1.80 1.80 1.80
NDVI 0.311753 0.513176 1.93 1.93 1.93
Table 3. Accuracy assessment of vegetation classification results (2016–2023).
Year Season Overall
Accuracy (%)
Kappa
Coefficient (%)
Mixed ecotone
Producer’s accuracy (%) User’s accuracy (%)
2016 Spring 85.5 0.82 83.8 82.0
Autumn 86.0 0.83 84.5 82.8
2017 Spring 86.8 0.83 85.0 83.5
Autumn 85.2 0.81 82.5 80.9
2018 Spring 87.2 0.84 85.5 84.0
Autumn 87.8 0.85 86.0 84.5
2019 Spring 88.0 0.85 86.3 85.0
Autumn 87.0 0.84 85.0 83.2
2020 Spring 88.5 0.86 87.0 85.8
Autumn 87.3 0.84 85.2 83.5
2021 Spring 88.9 0.86 87.5 86.2
Autumn 88.2 0.85 86.3 84.8
2022 Spring 89.2 0.87 88.0 86.5
Autumn 88.5 0.86 86.8 85.0
2023 Spring 89.5 0.86 86.2 85.0
Autumn 88.7 0.87 85.8 84.5
Average ± StdDev (%) 87.3±1.4 0.84±0.02 85.2±1.5 83.6±1.7
Table 4. Summary of mixed ecotone area (km2) and annual change rate (%) from 2016 to 2023.
Year Spring Area Annual Spring Change Rate Autumn Area Annual Autumn Change Rate
2016 2.2256 2.5047
2017 2.5783 15.85 0.9311 -62.83
2018 2.7990 8.56 1.0032 7.74
2019 3.6594 30.74 0.9929 -1.03
2020 3.7882 3.52 1.5540 56.51
2021 4.1325 9.09 1.3432 -13.56
2022 4.7836 15.76 1.7050 26.94
2023 4.3959 -8.10 1.8441 8.16
Disclaimer/Publisher’s Note: The statements, opinions and data contained in all publications are solely those of the individual author(s) and contributor(s) and not of MDPI and/or the editor(s). MDPI and/or the editor(s) disclaim responsibility for any injury to people or property resulting from any ideas, methods, instructions or products referred to in the content.
Copyright: This open access article is published under a Creative Commons CC BY 4.0 license, which permit the free download, distribution, and reuse, provided that the author and preprint are cited in any reuse.
Prerpints.org logo

Preprints.org is a free preprint server supported by MDPI in Basel, Switzerland.

Subscribe

Disclaimer

Terms of Use

Privacy Policy

Privacy Settings

© 2026 MDPI (Basel, Switzerland) unless otherwise stated