
Submitted:
01 December 2025
Posted:
02 December 2025
You are already at the latest version
Abstract
Abstract Green leaf volatiles (GLVs) are significant volatile signals that have been shown to protect plants against biotic and abiotic stresses including insect herbivory and pathogen infec-tions, but also drought, cold, and heat stress. Since all these stresses are affected by climate change, GLVs provide an important target for research into their broad activities and their potential applications in agricultural settings. Therefore, to gain further insights into the protective properties of GLVs and their regulation under changing environmental con-ditions, we investigated whether climate-related changes alter the capacity to produce and the responsiveness to GLVs. Specifically, we studied the effects of limited nutrient supply, drought, and higher temperature. Neither significantly affected the capacity of plants to produce Z-3-hexenal as the first metabolite of the pathway, but elevated temperature increased E-2-hexenal production. We further identified changes in the effectiveness of plants to respond to GLV under changing abiotic conditions by monitoring glucose levels and typical GLV-responsive genes covering metabolism, direct defense, indirect defense, and water stress. The results provide first evidence that plant responses to GLVs under defined environmentally challenging conditions are highly context-dependent and can vary substantially. The implications of these first findings as well as potential conse-quences will be discussed.
Keywords:
green leaf volatiles
; abiotic stress
; climate change
; gene expression
; plant protection
1. Introduction
Green leaf volatiles (GLV) are rapidly produced by most plants in large quantities upon mechanical damage caused by biotic and abiotic stresses, including insect herbivory, necrotrophic pathogens, as well as cold, drought, and extreme temperatures [1,2]. When GLV are perceived by undamaged parts of the same plant or by neighboring plants, they induce protective responses against these threats through signaling pathways that remain only partially understood. Aside from their immediate defensive effect, GLV further appear to prime plants against future threats, enabling a stronger and/or faster response when these stresses ensue [3,4].
Over the last 20 years research has provided extensive evidence to support these protective roles of GLVs in many plant species. In particular, their role in plant-insect interactions has been thoroughly investigated, and it has been demonstrated that GLV provide significant protection against insect herbivory [1,3,4,5,6].
The biosynthesis of GLV is essentially well established [1]. A lipoxygenase (LOX10 in maize [6]) inserts molecular oxygen in position 13 of linolenic acid resulting in 13-hydroperoxy linolenic acid. A hydroperoxide lyase (HPL) then cleaves off a 6-carbon unit as Z-3-hexenal (Z3al). Both enzymes are located within the chloroplast and these reactions happen within seconds after mechanical leaf damage. The aldehyde is then reduced to (Z)-3-hexenol (Z3ol) and often esterified to an acetate by enzymes in the neighboring undamaged leaf cells, which requires a supply with NADPH and acetyl-CoA [7]. This transformation of the Z-3, but also their corresponding E-2 aldehydes into the reduced forms is considered essential because of their potential toxicity to eukaryotic and prokaryotic cells [7,8].
More recently, GLV were also found to protect plants against abiotic stresses, mainly those related to water stress, including drought, salt, heat, and cold stress [2]. While the specific signaling pathways triggered by GLVs for abiotic stress responses are not well understood, the results show that protection occurs on multiple levels and may include increased growth of stem and root systems, higher photosynthetic activities, increased antioxidative activities, the production of proteins that help to maintain the structural integrity of the cells, reduced electrolyte leakage, as well as the storage of abscisic acid, which can rapidly become activated and induce protective responses [9,10,11,12,13,14,15].
In the past, GLV have been described as the plant’s “multifunctional weapon” [4] due to their broad spectrum of biological responses against herbivory and necrotrophic pathogens. Today, considering the wide range and complexity of responses they activate, it becomes evident, that GLVs might be an even broader multifunctional protector of plants against both, biotic and abiotic stresses.
A study performed in our lab showed that even under cold stress conditions GLVs are active and can prime cold-protective responses. Also, we found that GLVs are even released from plants at temperatures below 0ºC in significant quantities [15]. These initial findings prompted us to further investigate plant responses to GLV under altered stressful conditions. We selected drought, heat, and limited nitrogen supply as abiotic stressors to study the responses of maize seedlings to GLV by assessing potential changes in their capacity to produce GLVs, and by analyzing their responses to GLVs under those conditions. We selected 4 genes, representing metabolism, water stress, direct defense, and indirect defense. The results reveal that changing environmental conditions have significant effects on the responsiveness on maize plants to GLVs.
2. Results
2.1. Abiotic Factors Have Limited Effects on The capacity to Produce GLV
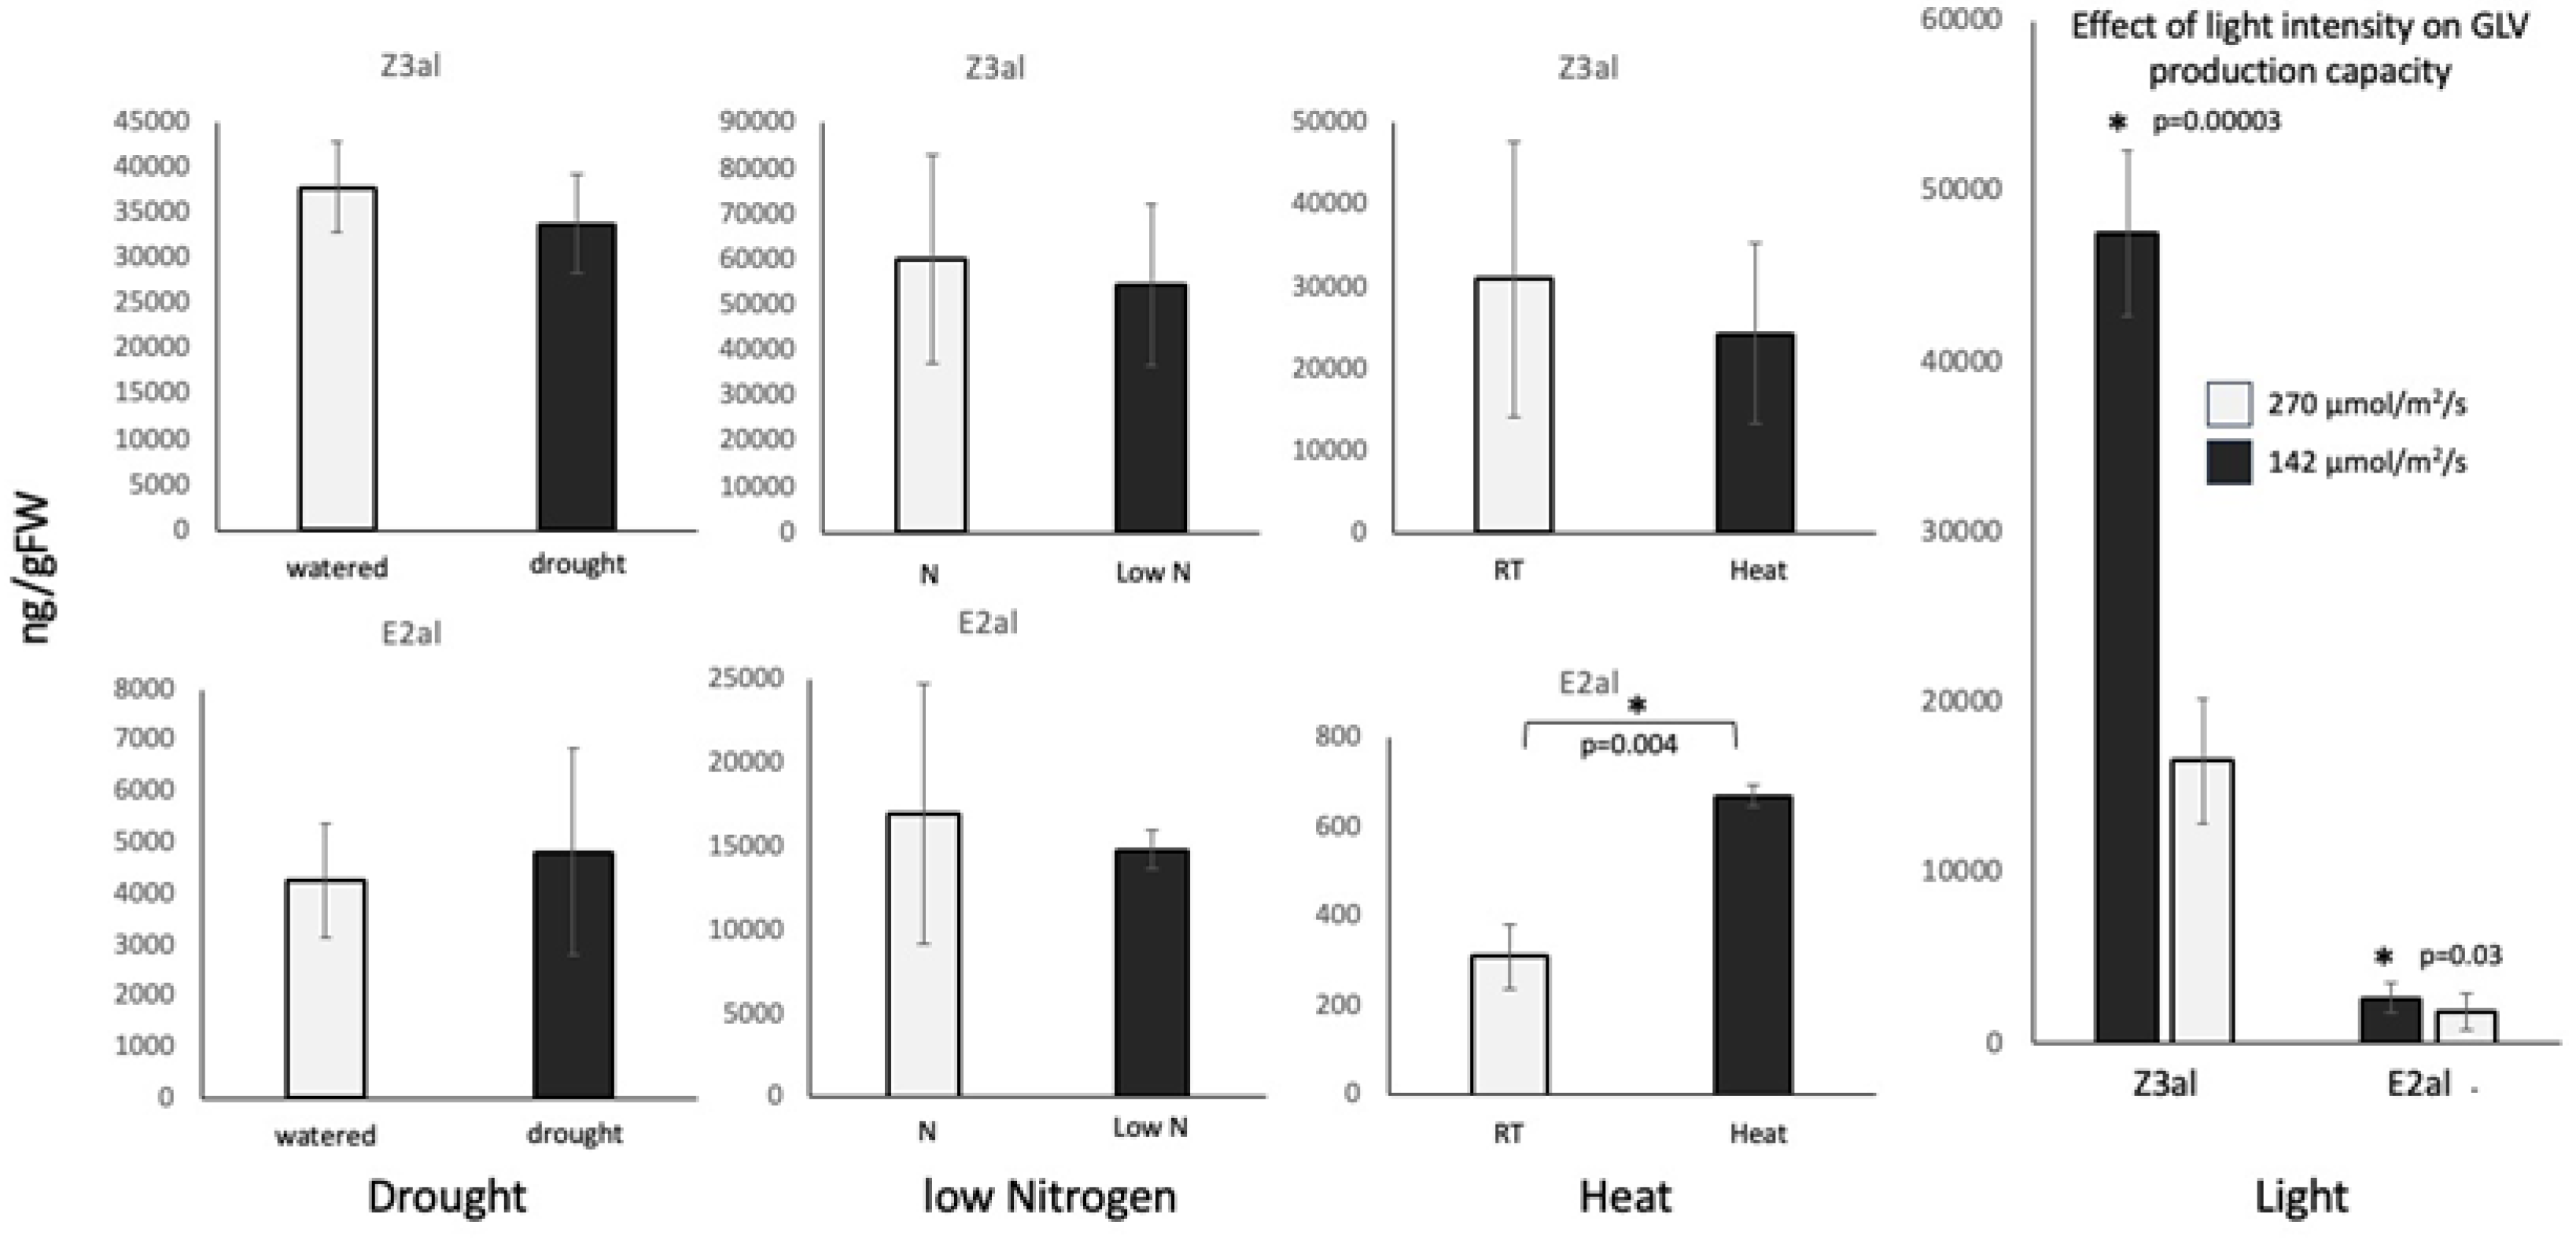
We first analyzed the capacity to produce GLVs, in particular Z-3-hexenal (Z3al) and E-2-hexenal (E2al), from leaf segments of stressed and control maize plants. For this, plants were treated similar to those analyzed for gene expression. We followed established procedures as described in [16]. We used drought stress, heat stress, nutrient deficiency, and high light exposure as abiotic stressors. Surprisingly, we found no significant changes in the capacity to produce GLV aldehydes in drought- and nutrient-stressed maize plants. After 7 days of drought, plants produced 44,787 ± 5,802 ng/gFW Z3al, while control plants made 44,787 ± 6,622 ng/gFW. E2al production was also similar between these treatments (5,802 ± 2,809 ng/gFW for drought, 6,622 ± 1,710 ng/gFW for control). Likewise, plants under reduced nutrient conditions produced 54,569 ± 14,778 ng/gFW Z3al and 14,778 ± 1,163 ng/gFW E2al, while plants supplied with nitrogen made 60,335 ± 16,949 ng/gFW Z3al and 16,949 ± 1,163 ng/gFW E2al. A 5ºC increase in temperature did not change Z3al production (24,271 ± 16840 ng/gFW Z3al at 30ºC, 31,032 ± 23,896 ng/gFW at 25ºC), but had a significant effect on E2al production. While control (RT, 25ºC) plants produced only 310 ± 73 ng/gFW, plants under heat stress produced significantly more (668 ± 24 ng/gFW) E2al, corresponding to a more than 100% increase.
However, we found the most dramatic effect on the capacity to produce GLV aldehydes, when we exposed plants to a higher light intensity. By changing the photosynthetically active light intensity from 140 µmol/m2/s to 270 µmol/m2/s, for 24h, we observed an increase of Z3al from 16,627 ± 4,863 ng/gFW to 47,537 ± 17,918 ng/gFW. E2al levels were also increased from 1,901 ± 862 ng/gFW at 140 µmol/m2/s to 2,672 ng/gFW at 270 µmol/m2/s. Since the temperature for both light intensities was kept constant, the shift in GLV aldehyde production of more than 280% can only be attributed to the changes in light intensity.
Figure 1.
Effects of environmental stressors on aldehyde GLV production in maize (Zea mays). * denotes significant differences (ttest, p ≤ 0.05). N ≥ 3, error bars represent standard deviation. Z3al, Z-3-hexenal; E2al, E-2-hexenal. N, treated with Nitrogen-containing fertilizer, Low N, no Nitrogen fertilizer added.
2.2. Effects of Abiotic Stresses on Z-3-Hexenol-Induced Gene Expression and Glucose Levels
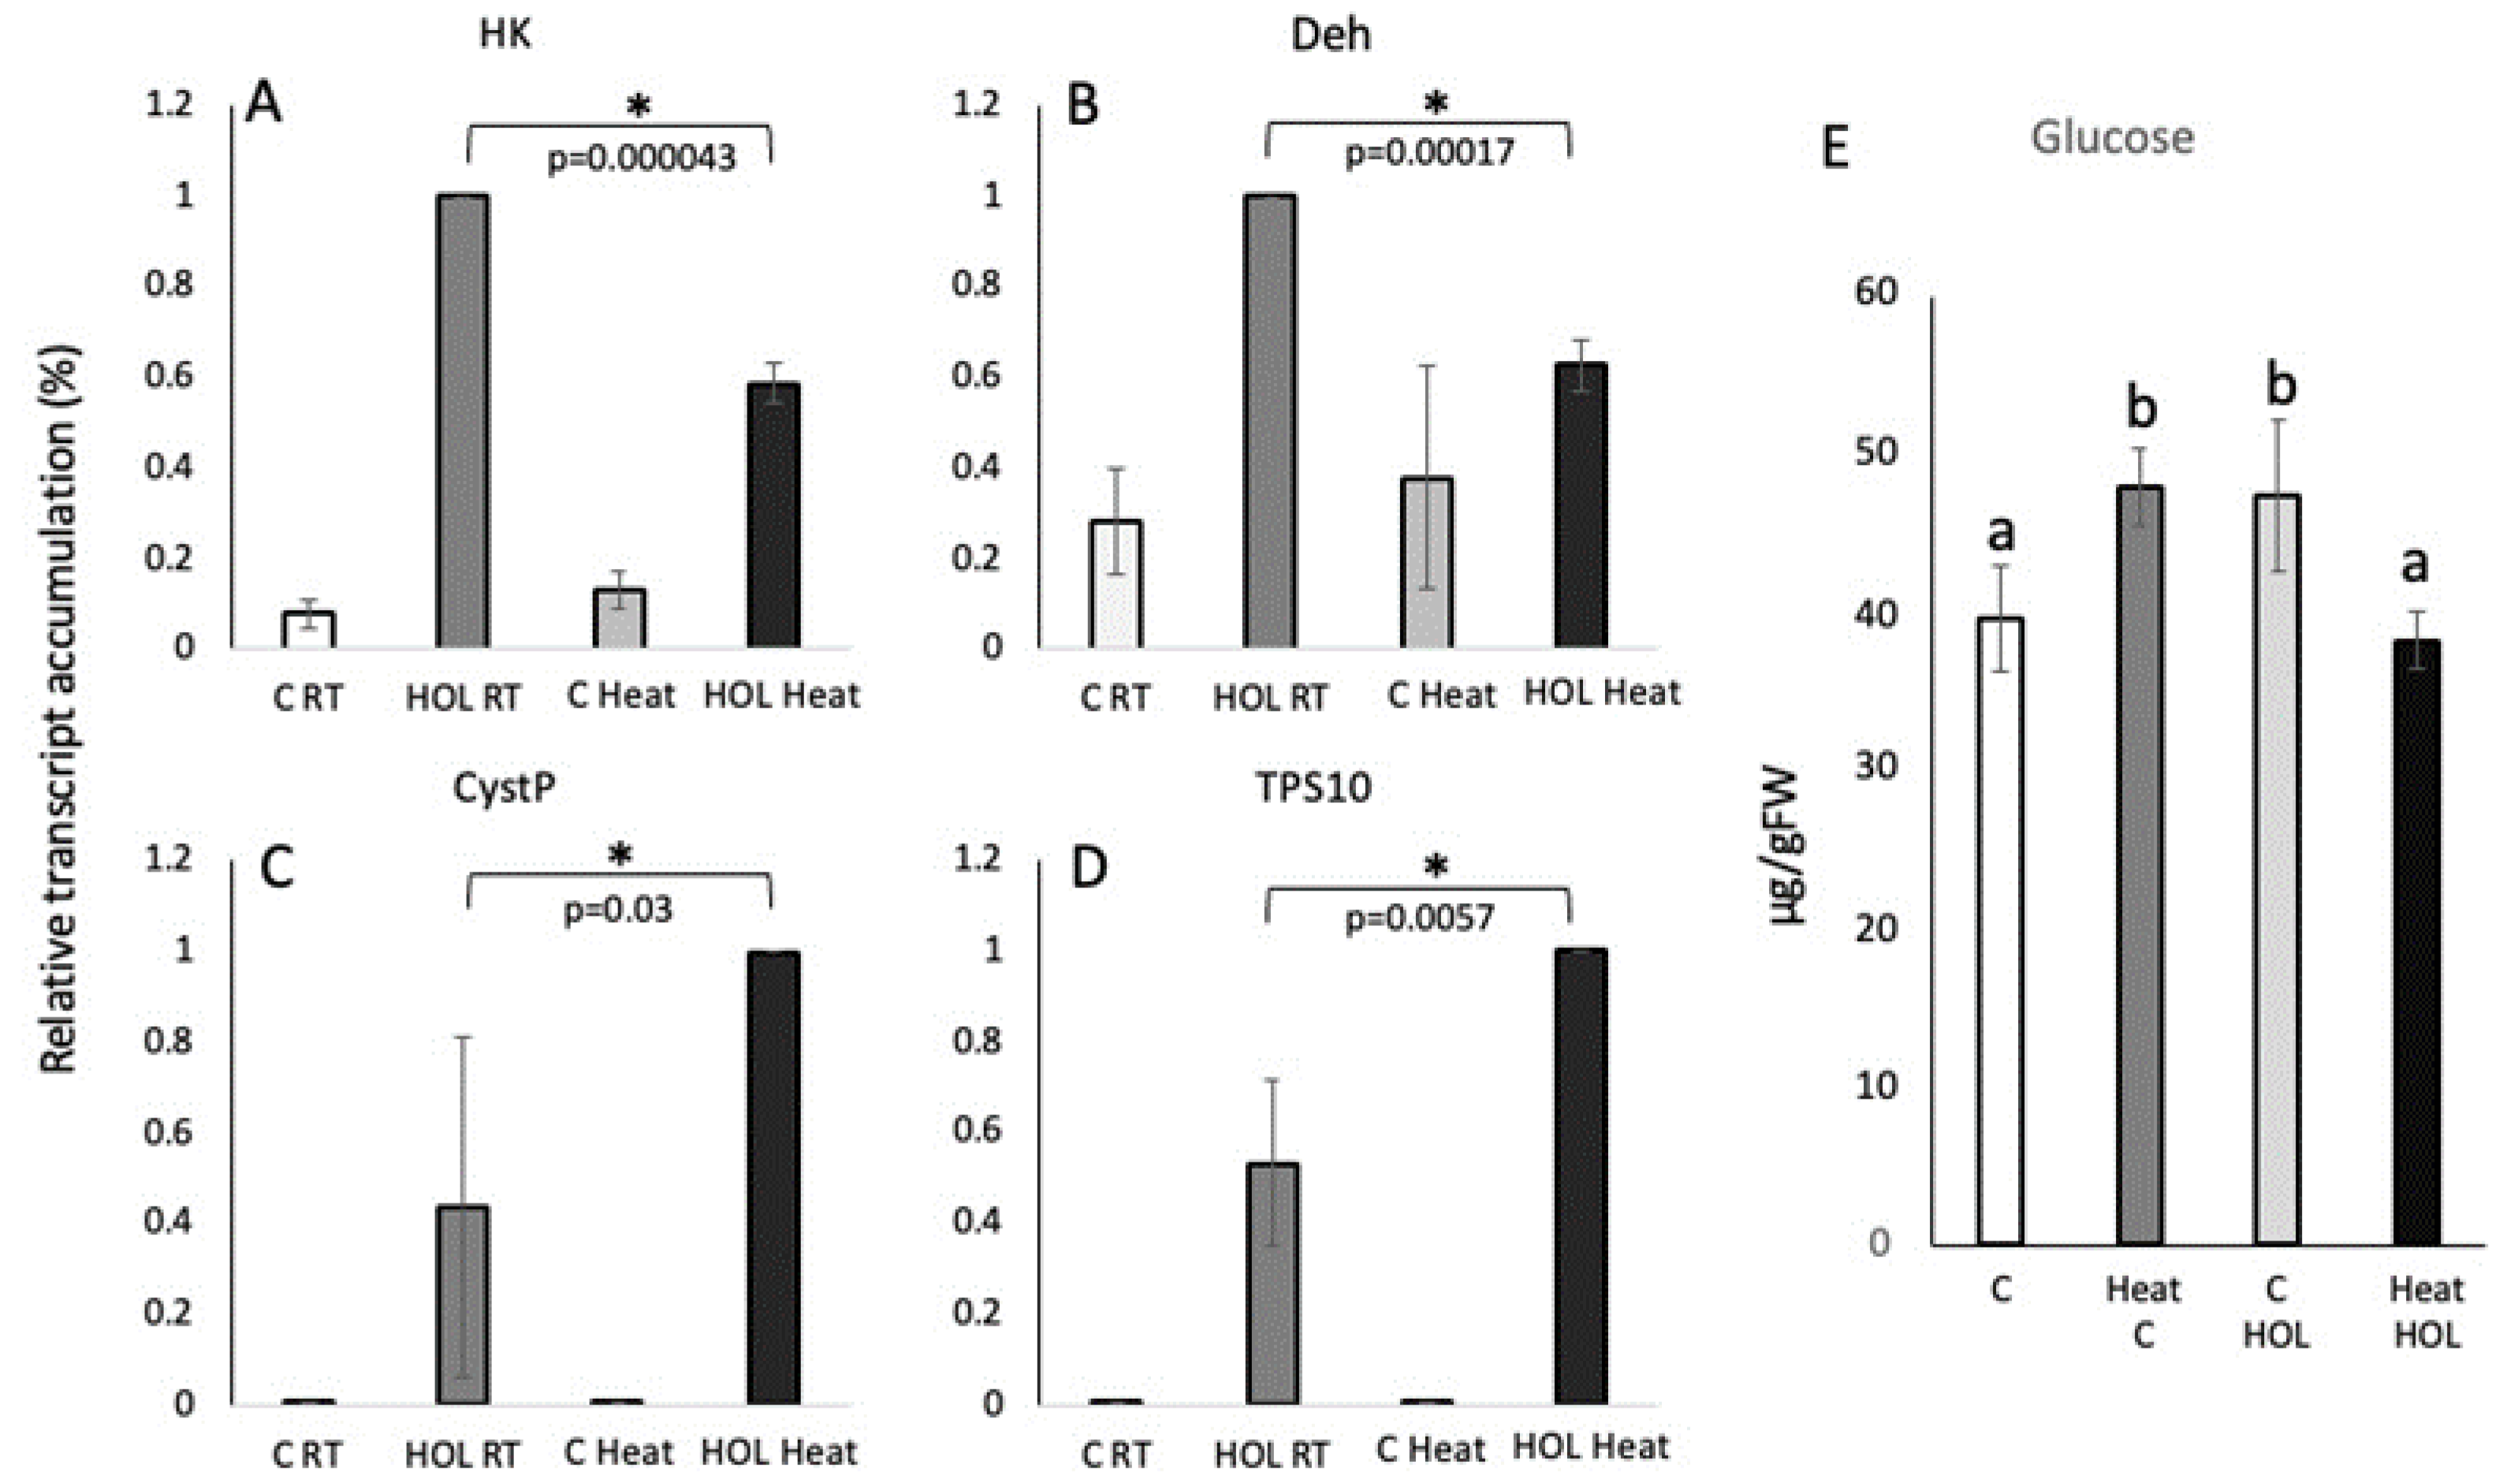
While abiotic stresses don’t seem to affect the capacities of maize plants to produce GLV, we further investigated how these stresses modulate the responses of plants to Z3ol by measuring transcript accumulation and glucose level. We selected 4 genes for our studies covering primary metabolism (hexokinase, HK), water stress (dehydrin, Deh), direct defense (cystein protease inhibitor, CystP), and indirect defense (terpene synthase 10, TPS 10). For better comparison, we set the highest Z3ol-induced level at 100% for each biological replicate.
2.2.1. Drought Stress
For HK we found the highest levels of transcripts accumulation in well-watered unstressed control plants treated with Z3ol (100%, 6.6-fold increase compared to corresponding control) (Figure 2A). However, HK transcript levels in drought stressed plants treated with Z3ol only reached 64 ± 21% of control-Z3ol levels. Untreated control levels of HK transcripts were not significantly different from each other (18 ± 8% for control plants, and 15 ± 3% for drought control plants).
Transcript accumulation for Deh showed a very different trend. While unstressed control-Z3ol-treated seedlings (C HOL) reached 93 ± 12% (7.8 fold increase compared to control), drought controls (drought C) already showed a much higher accumulation (260 ± 48%) (Figure 2B). Surprisingly, in drought-Z3ol-treated plants those levels were reduced within 1h to the level of control Z3ol-treated plants (94 ± 8%). Resting levels in the control plants were at 13 ± 3%.
CystP followed the same trend as shown above for HK. Watered control-Z3ol plants reached 100% (36-fold increase), while drought-Z3ol plants only reached 89 ± 8% (Figure 2C). Levels of CystP transcripts in watered controls were at 4.3 ± 3.5%, while those in drought controls were at 2.6 ± 0.4%.
For TPS10 no significant differences between control-Z3ol and drought-Z3ol plants were found (81 ± 32% (545-fold increase) and 78 ± 19%, respectively (Figure 2D). Likewise, control levels for watered and drought-stressed control plants were similar (0.4 ± 0.3% and 0.5 ± 0.02%, respectively.
Glucose levels were also measured 1h after Z3ol treatment. For unstressed control plants (C) we determined a glucose level of 38 ± 2.9 µg/gFW (Figure 2F). After Z3ol treatment (C HOL) glucose levels increased significantly to 50 ± 5.0 µg/gFW. In drought stressed plants (C drought) we found 51 ± 1.2 µg/gFW, but did not measure a significant increase upon treatment with Z3ol (49 ± 4.1 µg/gFW).
2.2.2. Low Nitrogen
HK transcript accumulation in well-fertilized and low nitrogen plants after Z3ol treatment was not found to be significantly different (98 ± 3.1% (8.2-fold increase) and 78 ± 30%, respectively) (Figure 3A). However, transcript levels in control seedlings and low N control seedlings were slightly different (12 ± 0.2% and 18 ± 3.7%, respectively, p=0.025).
For Deh, control plants as well as low nitrogen controls also showed minor differences in transcript levels (38 ± 3.2% and 25 ± 11%, p=0.028) (Figure 3B). But while Z3ol treatment did increase Deh levels in general, no differences were found between Z3ol treated control and Z3ol treated low nitrogen plants (99 ± 0.7% (2.6-fold increase) in control Z3ol and 84 ± 15% in low nitrogen Z3ol plants).
But while HK and Deh showed no significant difference between control and low nitrogen plants after Z3ol treatment, direct and indirect defense genes behaved very differently. CystP was at 100% (470-fold increase) in control Z3ol treated plants but reached only 16 ± 12% in low nitrogen Z3ol-treated plants (Figure 3C). Control and low nitrogen plants showed small, but insignificant differences (0.22 ± 0.07% in controls versus 0.1 ± 0.04% in low nitrogen controls).
Similar results were found for TPS10 (Figure 3D). Control-Z3ol plants were also at 100% (2,100-fold increase), while low nitrogen plants accumulated 31 ± 11% after Z3ol treatment. Controls for both controls without Z3ol treatment were very low at 0.1 ± 0.1% and 0.1± 0.1%, respectively.
We also analyzed glucose concentration in low-nitrogen-stressed and control plants. In control plants without Z3ol treatment we found 38 ± 2.2 µg/gFW and with Z3ol treatment an increase to 46 ± 2.1 µg/gFW (Figure 3E). However, in low nitrogen control plants glucose levels were already significantly increased (70 ± 15.1 µg/gFW) compared to control plants. Z3ol treatement of low nitrogen plants did not increase glucose levels as described above for drought stress (68 ±6.9 µg/gFW). These increases of glucose levels correspond to an 82% and 48% increase, respectively, when compared to the corresponding levels in fertilized control plants.
2.2.3. Heat
To cultivate and treat maize seedlings under heat stress, we increased the growth room temperature (RT) from 25º C to 30º C (heat), while keeping all other parameters constant. Under those conditions we found contrasting patterns for HK and Deh transcript accumulation on one side and CystP and TPS10 on the other.
For HK and Deh, Z3ol-treated RT control plant accumulated 100% transcript for both, HK (7-fold increase) and Deh ( 4.15-fold increase), while heat and Z3ol treated plants only reached 59 ± 4.4% (HK) and 63 ± 5.7%, (Deh) (Figure 4A and B). Resting levels were at 8 ± 3.2% and 13 ± 4.2% for HK and 28 ± 11.5% and 38 ± 24.6% for Deh in RT control and heat control plant, respectively.
Direct and indirect defense genes (CystP and TPS10) on the other hand showed a significant increase in Z3ol-treated heat stressed plants when compared to Z3ol-treated RT controls. For both genes, we found 100% (802-fold increase for CystP, 2648-fold increase for TPS10) of transcripts in heat-Z3ol treated maize seedlings, while at the same time control Z3ol treated plants only accumulated 44 ± 38% for CystP and 53 ± 18% for TPS10 (Figure 4C and D). Control samples for RT and heat-treated plants only accumulated 0.3 ± 0.3% and 0.4 ± 0.25% CystP, respectively, and 0.04 ± 0.16% for TPS10 in RT control and 0.04 ± 0.11% in heat control.
Likewise, glucose concentrations varied significantly between RT and heat-treatments (Figure 4E). In RT controls, glucose was at 40 ± 3.3 µg/gFW, while Z3ol treatment increased this level to 47 ± 4.8 µg/gFW. In contrast, heat control plants already had 48 ±2.4 µg/gFW, which then surprisingly decreased during Z3ol treatment to 38 ± 1.8 µg/gFW.
3. Discussion
The protective roles of GLVs in plant defense are well established. GLVs provide rapid, direct protection by inducing defense-related genes and act as priming signals that enable faster and often stronger responses to subsequent stress. Priming by GLVs have been documented for biotic stresses, including insect herbivory and pathogen infection [1], as well as for abiotic stresses such as cold, salinity, and drought [2]. The broad spectrum of protective functions led to their characterization as the plants multifunctional weapon [4].
This study investigated whether changing environmental conditions modulate plant responsive to GLVs. Previous work has largely relied on plants grown and treated under standardized laboratory conditions or in field assays, in which environmental variation is uncontrolled and often unrecognized. Consequently, it remains unclear how plants perceive and respond to GLV under challenging environmental conditions. To advance understanding of this unexplored area, we assessed plant responses to GLVs under defined, environmentally challenging growth conditions and conducted all experiments within these altered settings. The results presented here demonstrate that plant responses to GLVs regarding gene expression and glucose levels are highly context-dependent and can vary substantially under changing environmental conditions. We selected abiotic factors that are closely related to those encountered by plants during climate changes including drought, heat, and low nutrient supply. Interestingly, the capacity of maize seedlings to produce GLVs was not significantly affected by most of those stressors. Only increases in light intensity did upregulate the capacity to produce GLV significantly. As we consider it as an unlikely natural occurrence - other than a sudden change in cloud cover- we decided to not pursue this aspect further unless we have more information on actual light intensity changes in a natural environment and their potential physiology consequences for plants. Because GLVs have been shown to possess photoprotective properties, the observed increase may just reflect that activity [17]. However, we observed significant changes in the expression patterns of selected genes for all other tested stress conditions.
Drought is one of the most important factors that may harm plants in their natural environment and is often unpredictable [18,19]. Plants have therefore developed an array of protective measures, most of which are regulated by abscisic acid (ABA) [20]. However, in recent years GLVs were also found to activate responses that can help plants to better survive under drought conditions [21]. For GLV treatment under drought conditions, we found that responses were considerably affected. HK and CystP transcripts showed significant reduction, while TPS10 expression was not affected. Most surprisingly, however, was the finding that Deh transcripts, which are upregulated by drought and by GLVs, were actually reduced by Z3ol to the exact same level as in Z3ol treated controls. This was unexpected, because in previous experiments with GLV and cold stress, we found an additional increase in those gene transcript, even when the treatment with GLVs was done in the cold [15]. Glucose levels, which are upregulated by GLV within 1h, were already significantly higher in drought stressed plants and did not respond to the GLV treatment. This overall increase might be in part attributed to the reduced water levels in the drought stressed plants since quantities of glucose are based on the fresh weight of plant material. Stomata may also have been closed, reducing the uptake of GLVs and consequently their activity. However, TPS10 did clearly respond to the GLV treatment in drought-stressed plants, and the reduction in Deh transcript levels also strongly suggests an effective uptake of GLV in order to cause the observed effects.
Low nitrogen availability constitutes another important environmental factor. For example, increased rain fall can wash out nutrients from the soil, thereby depleting essential nutrients such as nitrogen and phosphate from plants [22,23]. Drought on the other side can limit nutrient uptake because water is required as a solvent for nutrient mobilization. Reduced nutrient supply has multiple consequences for the physiology of plants, with nitrogen deficiency being especially critical due to its central role in protein synthesis. For maize, Schmelz et al. [24] described the effects of low nitrogen availability on volatile production and jasmonic acid accumulation after insect herbivory. Jasmonic acid is the major plant hormone regulating plant defense responses to insect herbivory [25]. Surprisingly, nitrogen starved plants produced significantly higher levels of jasmonic acid and volatiles than well-supplied control plants. This is even more surprising since in our study we found a significant reduction of TPS10 as a gene that is putatively involved in volatile production, but also in CystP, which is a direct defense gene. On the other hand, HK and Deh were similar in their transcript levels, suggesting a more targeted reduced response elicited by GLV towards defense. Another indication of increased volatile production in low nitrogen plants might be our finding that glucose levels are massively increased under low nutrient conditions. An increase in glucose may provide necessary metabolic resources that can positively affect certain types of metabolite-based defense responses.
Although average global temperatures are projected to increase only modestly, climate change is more expected to increase the frequency of temperature extremes. Such extreme events can impose substantial stress on plants, leading to a wide range of negative consequences. For our temperature stress study, we increased the ambient temperature in one of our growth chambers to 30ºC, while control plants were maintained at 25ºC. We recognize that temperatures exceeding 40ºC are common in some regions, particular in the southern United States. However, our objective was to demonstrate that even a modest change in ambient temperature can alter the plant’s response to the GLV treatment. And as shown above, even this relatively small increase already had significant consequences on the maize seedlings. Notably, the overall capacity to produced GLV was not affected by this temperature increase, however, the heat-stressed plants showed significantly higher levels of E2al when compared to control plants. Fittingly, E2al as well as other α, β-unsaturated carbonyls, have previously been described as a powerful inducer of abiotic stress-related genes including heat stress-related transcription factors (HFSA2 and MBF1c) [13]. Interestingly, both transcription factors are not induced by other GLVs, strongly implying a certain specificity of E2al in particular, but also other α, β-unsaturated carbonyls with regard to heat protection.
In addition to the altered GLV production, heat stress also had a significant effect on Z3ol-induced gene expression, which again differed from those found after drought and low nutrient treatment. HK and Deh transcript accumulation was significantly reduced at 30ºC, while CystP and TPS10 transcripts were significantly upregulated. This response may also reflect changes in stomatal status, as under heat stress, stomata are likely to open more widely to provide more cooling via increased water evaporation. However, this does not explain why HK and Deh are dramatically reduced. A reason for lower HK expression might lie in the fact that glucose levels in heat-stressed plants were higher, as we found for drought stress and low nutrients plants. Yet, overall, it looks more like the metabolism is following a certain trend by reducing the transcript levels for HK, which is considered to be the first committed step in glycolysis, and as such is a pivotal regulator of metabolism [26,27]. However, if glucose levels are already high, no additional HK production might be necessary in order to increase metabolite production, not only for energy, but also for making substrates available for other important metabolic pathways. And since glucose levels changed in the presence of Z3ol, in contrast to drought and low nutrients, other yet to be identified metabolic activities may have indeed become activated by the GLV treatment.
While we have shown that changes in the abiotic environment significantly influence plant responses to GLV, the ecological consequences of the modulated response remain unclear. GLV still appear to provide protection, but little is known about how insect herbivores or pathogens perform under these modified conditions. Furthermore, natural ecosystems rarely expose plants to single stressors. Instead, simultaneous or sequential stresses are common, and such interactions may profoundly influence the production, perception, and downstream effects of GLV. Another important question concerns metabolism, particularly glucose-related, and how it might affect the general plant responses to both biotic and abiotic stresses. Although we detected clear changes in metabolite levels, the implications of these changes remain unclear. Whether such metabolic adjustments enhance, constrain, or otherwise modulate volatile-mediated signaling and defense remains an open question.
This study may therefore serve as a foundation for expanding research to include multiple stresses, diverse metabolic states, in defined ecological scenarios, thereby advancing our understanding how GLVs function and how plants cope with an increasingly variable climate.
4. Materials and Methods
4.1. Chemicals
Z-3-hexenol (Z3ol) and E-2-hexenal were generously provided by Bedoukian Research Inc. (Danbury, CT, USA). Z-3-hexenal (Z3al) was purchased from Sigma-Adrich (St Louis, MO, USA). All solvents used were analytical grade.
4.2. Plant Material
Maize (Zea mays, var. Kandy King, J.W. Jung Seed Co., Randolf, WI, USA) seeds germinated in Sungro Horticulture Professional Growing Mix (Sun Gro Horticulture Canada Ltd., Seba Beach, AB, Canada) in pots with 5 seeds each in a growth chamber under a 12 h photoperiod at 26 °C with 60% relative humidity for 4-5 days. The light intensity was set to ca. 142 μmol m2 s−1 for all the experiments except light stress. After germination (development of the first leaf) the plants were transferred to the respective abiotic treatment setting for a minimum of seven days and tested for GLV capacity and stress-related gene expression in response to Z3ol. We tested seedlings either at the late V2 or early V3 stage, with the 4th leaf emerging.
Treatment with Z-3-hexenol (Z3ol) was done in a plexiglass chamber (43 cm x 54 cm x 52 cm; Volume ≈120 l) by adding 1ul of pure compound to a filter paper. Plants were treated for 1h for all experiments.
4.3. Plant Treatments, Glucose Assay, Plant Volatile Collection, and Gene Transcript Accumulation
4.3.1. Plant Treatment
Nutrient Deprivation: Maize seedlings were grown in pots with Vermiculite instead of soil. Control plants were treated with a nitrogen (N)-containing fertilizer (TPS nitrogen N-prime, Bellevue, WA 98009) according to the supplier’s recommendation, while stressed plants were grown without any addition of fertilizer. Upon first symptoms of N-depletion such as red stem and reduced growth as described in [24], we treated plants with Z3ol.
Heat: Pots with germinated maize seedlings (1st leaf, day 5) were transferred into plexiglass chambers (120 l volume). One chamber was heated with a heat pad placed underneath to 30ºC, while the other chamber was left at RT (25ºC, control). Plants were grown for 7 days under those conditions and were watered regularly. Temperatures were checked daily to ensure constant conditions. After 7 days under these conditions, plants were treated within the chambers with Z3ol as described above.
Drought: Maize seedlings were grown as described above. After gemination and the development of the first leaf (day 5), control plants were watered regularly, while drought-stressed plants were not watered anymore. Plants were kept under those conditions for 9 more days, until first signs of drought stress were visible (e.g. curled leaves) and the water/soil ratio reached 0.5 ± 0.15, while the water/soil ration for the well-watered maize seedlings was at 2.6 ± 0.2 (n=6). Plants were then treated with Z3ol in a plexiglass chamber as described above.
Intense Light: 10-day old maize seedlings were either kept under regular conditions as described under 4.2 with a light intensity at 142 μmol m2 s−1 (control) or were exposed to high light at 270 μmol m2 s−1 . Leaf samples of high light treated plants were collected after 24 h together with regular light-treated controls and analyzed for GLV capacity.
4.3.2. Glucose Assay
To analyze glucose, we used between 20 and 60 mg of maize leaf tissue immediately shock-frozen in a 2-ml screw-cap vial in liquid N2. We then added 400 µl of 100 mM potassium phosphate (KPi) buffer, pH 6, and about 600 mg of beads (Beads added only once the buffer is frozen). The tissue was then homogenized in a Precellys homogenizer at 5600 for 25 s. After homogenization we added 1 ml of dichloromethane and mixed the sample again in the Precellys homogenizer as described above. Samples were then briefly centrifuged at high speed (10,000 x g) for 30 s for phase separation. The supernatant, which represents the aqueous phase, contains the glucose among other polar compounds. We used 200 µl of this supernatant for our analysis. Fehling’s solution was mixed freshly by combining 1 ml of Solution A with 1 ml of Solution B as suggested by the supplier. However, the Fehling solution was then diluted 1:10 with H20 and mixed thoroughly. We then added 500 µl of the Fehling solution to the 200 µl of the glucose-containing aqueous phase and incubated for 10 min at 60ºC. A blank was prepared with KPi buffer and the Fehling solution. After the samples cooled down to RT, they were centrifuged at 10,000xg for 5 min and then analyzed in a spectrophotometer (Varian Cary 50 Bio) at 480 nm. A red precipitate may occur if glucose concentrations are high. If the glucose concentration is outside the linear range the original extract should be diluted. We also analyzed other wavelengths (420 nm, 640 nm) but found that 480 nm provided the most reliable and reproducible results. By creating a standard curve with known amounts of glucose absolute quantification of glucose in the samples was determined.
4.3.3. Volatile Collection
For volatile collections, maize seedlings were taken from the different treatment groups described above at the same day seedlings were also treated with Z3ol. GLV (mainly Z3al and E2al) were collected from damaged leaf tissue for 1 h and trapped on HayeSep Q80/100-containing filters (Supelco, Bellefonte, Pa) at a flow rate of 200 mL·min−1 as described previously [28]. Filters were then removed and eluted with 150 ul of dichloromethane. After adding the internal standard (Nonyl acetate, 1000 ng per sample), volatile samples were analyzed on a Varian model 3900 GC coupled to Varian Saturn 2200 MS equipped with split–splitless capillary injector systems in electron impact mode (EI). The data collection, storage, and subsequent analysis were performed on a computer using the Varian MS Workstation software (Version 6.6). Helium at a constant flow velocity of 1 mL/min was used as a carrier gas. The analyses of the volatile collections were performed on a fused silica capillary column (Equity™ 30 m × 0.25 mm inner diameter with a 0.25-µm-thick film of bonded methyl silicone). The GC was programmed as follows: initial temperature 40 °C for 2 min, then temperature programmed at 15 °C/min to 250 °C. All injections of were made in the splitless mode. The compounds were identified by comparison to authentic standards (retention time and fragmentation).
4.3.4. Transcript Accumulation (qPCR)
To test for the effects of Z3ol on transcript accumulation of selected genes, we treated plants 1h under the respective conditions outlined above. The 2nd leaf was then cut off and snap frozen in liquid nitrogen for RNA extraction. Similar segments from undamaged plants were used as controls. The leaves from three plants were pooled for one biological replicate, and three biological replicates were performed for each time point. We extracted the total RNA from ≤ 100 mg of ground leaf material using the PowerPlant® RNA Isolation Kit containing DNAse (MO BIO Laboratories, Inc., Carlsbad, CA, USA), with the following modifications: The frozen samples were homogenized in 2 mL screw cap tubes containing 0.5 g of Zirmil microbeads and 200 µL of extraction buffer (PR1) for 20 s at 6000 shakes min−1 in a Precellys tissue homogenizer (MO BIO Laboratories, Inc., Carlsbad, CA). After this initial homogenization step, we added 800 µL of PR1 and homogenized the samples for an additional 10 s at 6000 shakes min−1. The extract was then processed according to the manufacturer’s instructions.
We used the High-Capacity cDNA Reverse Transcript Kit (Applied Biosystems, Foster City, CA, USA) to synthesize the cDNA. We performed real-time PCR using the 7300 Real-Time PCR System (Applied Biosystems). The PCR reactions were performed in a 20 µL volume containing 10 µL of SYBR Green PCR Master Mix (GLPBIO, Montclair, CA, USA), 0.2 µM of forward and reverse primer, respectively, and the cDNA equivalent to 25 ng of total RNA. The primer specificity was confirmed by melting curve analysis, and the relative transcript levels were calculated using the 2−ΔΔCT method [29], with Membrane protein PB1A10.07c (MEP) as a reference gene [30]. We selected the following genes for our analysis: Hexokinase 1 (HK) for metabolism [27,28,31], terpene synthase 10 (TPS 10) as a marker for indirect defenses [32,33], cysteine protease inhibitor (CystP) as a marker for direct defenses [34], and dehydrin (Deh) as a marker for drought stress [14,15]
4.4. Primer Sequences
HK: F 5′-CGTACGTCGAAGAGGCCAGT, R 5′-GGAGGCAGGGCGAGTAGAAG
TPS10: F 5′-TGTGTCCACGGTCCAATGTT, R 5′-GTCCGCTGTCCTTGCAAAA
CystP: F 5′-GGACATGAGCTGGCGATTTT, R 5′-CAAGGAGCACAACAGGCAGA
MEP: F 5′-TGTACTCGGCAATGCTCTTG, R 5′-TTTGATGCTCCAGGCTTACC
Deh:F 5’-TGCTCGAGTACGAGATGTGG, R 5’-CTGATCATGTCCCAGACAGC
4.5. Statistical Analysis
Expression data was normalized by setting the transcript accumulation for the highest Z3ol-treated maize plants at 100% in each biological replicate for better comparison. At least 3 biological replicates were performed per experiment. Averages and standard deviation (SD) were calculated for all samples (Microsoft Excel, Version 16.88). For pairwise comparisons, Student’s t-test was used (Microsoft Excel, Version 16.88), while for multiple comparisons, one-way ANOVA and Tukey’s test were applied (JMP statistical software, Version 17.2).
5. Conclusions
The main goal of this study was to provide first evidence that altered environmental conditions can have a significant impact on maize seedling as our model plant. We found that drought, nutrient stress, and higher temperatures all modified the responses of maize seedlings to GLV when reared under those conditions. This study therefore may serve as a starting point to further investigate how plants may be affected by GLV and other protective signaling molecules in a highly variable and constantly changing environment.
Author Contributions
Conceptualization, J.E., M.E.; methodology, J.E., M.E.; writing—original draft preparation, J.E., M.E.. All authors have read and agreed to the published version of the manuscript.
Funding
This research received no external funding.
Data Availability Statement
Original data will be provided upon request by the corresponding author.
Acknowledgments
The authors also wish to Thank the Department of Biology, Health, and the Environment and the College of Science at UTSA for their support.
Conflicts of Interest
The authors declare no conflicts of interest.
Abbreviations
The following abbreviations are used in this manuscript:
| GLV | Green leaf volatiles |
| HK | Hexokinase 1 |
| CystP | Cystein protease inhibitor |
| TPS10 | Terpene Synthase 10 |
| MEP | Membrane protein PB1A10.07c |
| Deh | Dehydrin 2 |
References
- Matsui, K.; Engelberth, J. Green leaf volatiles – the forefront of plant responses against biotic attack. Plant Cell Physiol 2022, 63, 1378–1390. [Google Scholar] [CrossRef]
- Engelberth, J. Green Leaf Volatiles: A New Player in the Protection against Abiotic Stresses? Int J Mol Sci 2024, 25, 9471. [Google Scholar] [CrossRef]
- Engelberth, J.; Alborn, H.T.; Schmelz, E.A.; Tumlinson, J.H. Airborne signals prime plants against insect herbivore attack. PNAS 2004, 101, 1781–1785. [Google Scholar] [CrossRef]
- Scala, A.; Allman, S.; Mirabella, R.; Schuurink, R.C. Green leaf volatiles: A plant’s multifunctional weapon against herbivores and pathogens. Int J Mol Sci 2013, 14, 17781–17911. [Google Scholar] [CrossRef] [PubMed]
- Ameye, M.; Allman, S.; Verwaeren, J.; Smagghe, G.; Haesaert, G.; Schuurink, R.C.; Audenaert, K. Green leaf voatile production by plants: a meta-analysis. New Phytol 2017, 220, 666–683. [Google Scholar] [CrossRef]
- Christensen, S.A.; Nemchenko, A.; Borrego, E.; Murray, I.; Sobhy, I.S.; Bosak, L.; DeBlasio, S.; Erb, M.; Robert, C.A.M.; Vaughn, K.A.; Herrfurth, C.; Tumlinson, J.; Feussner, I.; Jackson, D.; Turlings, T.C.J.; Engelberth, J.; Nansen, C.; Meeley, R.; Kolomiets, M.V. The maize lipoxygenase, ZmLOX10, mediates green leaf volatile, jasmonate and herbivore-induced plant volatile production for defense against insect attack. Plant J 2013, 74, 59–73. [Google Scholar] [CrossRef]
- Matsui, K.; Sugimoto, K.; Mano, J.; Ozawa, R.; Takabayashi, J. Differential Metabolisms of Green Leaf Volatiles in Injured and Intact Parts of a Wounded Leaf Meet Distinct Ecophysiological Requirements. PLoS ONE 2012, 7(4), e36433. [Google Scholar] [CrossRef]
- Nakamura, S.; Hatanaka, A. Green-Leaf-Derived C6-Aroma Compounds with Potent Antibacterial Action That Act on Both Gram-Negative and Gram-Positive Bacteria. J Agric Food Chem 2002, 50, 7639–7644. [Google Scholar] [CrossRef] [PubMed]
- Guo, R.Z.; Yan, H.Y.; Li, X.X.; Zou, X.X.; Zhang, X.J.; Yu, X.N.; Ci, D.W.; Wang, Y.F.; Si, T. Green leaf volatile (Z)-3-hexeny-1-yl acetate reduces salt stress in peanut by affecting photosynthesis and cellular redox homeostasis. Physiologia Plantarum 2020, 170(1), 75–92. [Google Scholar] [CrossRef]
- Li, X.; Ji, Y.; Sheng, Y.; Sheng, L.; Guo, W.; Wang, H.; Zhang, Y. Priming with the green leaf volatile (Z)-3-hexeny-1-yl acetate enhances drought resistance in wheat seedlings. Plant Growth Reg 2022, 98(3), 477–490. [Google Scholar] [CrossRef]
- Jin, J.; Zhao, M.; Jing, T.; Wang, J.; Lu, M.; Pan, Y.; Du, W.; Zhao, C.; Bao, Z.; Zhao, W.; Tang, X.; Schwab, W.; Song, C. (Z)-3-hexenol integrates drought and cold stress signaling by activating abscisic acid glucosylation in tea plants. Plant Physiol 2023, 193, 1491–1507. [Google Scholar] [CrossRef] [PubMed]
- Tian, S.; Guo, R.; Zou, X.; Zhang, X.; Yu, X.; Zhan, Y.; Ci, D.; Wang, M.; Wang, Y.; Si, T. Priming with the green leaf volatile (Z)-3-hexeny-1-yl acetate enhances salinity stress tolerance in peanut (Arachis hypogaea L.) seedlings. Frontiers Plant Sci 2019, 10, 457409. [Google Scholar] [CrossRef] [PubMed]
- Yamauchi, Y.; Kunishima, M.; Mizutani, M.; Sugimoto, Y. Reactive short-chain leaf volatiles act as powerful inducers of abiotic stress-related gene expression. Scientific Reports 2015, 5(1), 1–8. [Google Scholar] [CrossRef]
- Cofer, T.M.; Engelberth, M.; Engelberth, J. Green leaf volatiles protect maize (Zea mays) seedlings against damage from cold stress. Plant Cell Environ 2018, 41(7), 1673–1682. [Google Scholar] [CrossRef]
- Engelberth, M.; Selman, S.M.; Engelberth, J. In-Cold Exposure to Z-3-Hexenal Provides Protection Against Ongoing Cold Stress in Zea mays. Plants 2019, 11(8(6)), 165. [Google Scholar] [CrossRef]
- Engelberth, J.; Engelberth, M. Leaf Developmental Stages Strongly Modulate Indole Emissions in Response to Simulated Insect Herbivory. Preprints 2025. [Google Scholar] [CrossRef]
- Savchenko, T.; Yanykin, D.; Khorobrykh, A.; Terentyev, V.; Klimov, V.; Dehesh, K. The hydroperoxide lyase branch of the oxylipin pathway protects against photoinhibition of photosynthesis. Planta 2017, 245, 1179–1192. [Google Scholar] [CrossRef]
- Gupta, A.; Rico-Medina, A.; Caño-Delgado, A.I. The physiology of plant responses to drought. Science 2020, 368(6488), 266–269. [Google Scholar] [CrossRef]
- Waadt, R.; Seller, C.A.; Hsu, P.K.; Takahashi, Y.; Munemasa, S.; Schroeder, J.I. Plant hormone regulation of abiotic stress responses. Nat Rev Mol Cell Biol 2022, 23(10), 680–694. [Google Scholar] [CrossRef]
- Chen, K.; Li, G.-J.; Bressan, R.A.; Song, C.-P.; Zhu, J.-K.; Zhao, Y. Abscisic acid dynamics, signaling, and functions in plants. J Int Plant Biol 2020, 62, 25–54. [Google Scholar] [CrossRef] [PubMed]
- Wang, S.; Gu, H.; Chen, S.; Li, Y.; Shen, J.; Wang, Y.; Ding, Z. Proteomics and phosphoproteomics reveal the different drought-responsive mechanisms of priming with (Z)-3-hexenyl acetate in two tea cultivars. J Proteomics 2023, 289, 105010. [Google Scholar] [CrossRef]
- Wang, M.; Shen, Q.; Xu, G.; Guo, S. New insight into the strategy for nitrogen metabolism in plant cells. Int Rev Cell Mol Biol 2014, 310, 1–37. [Google Scholar]
- Cho, H.; Bouain, N.; Zheng, L.; Rouached, H. Plant resilience to phosphate limitation: current knowledge and future challenges. Crit Rev Biotechnol 2021, 41(1), 63–71. [Google Scholar] [CrossRef]
- Schmelz, E.A.; Alborn, H.T.; Engelberth, J.; Tumlinson, J.H. Nitrogen deficiency increases volicitin-induced volatile emission, jasmonic acid accumulation, and ethylene sensitivity in maize. Plant Physiol 2003, 133(1), 295–306. [Google Scholar] [CrossRef]
- Ruan, J.; Zhou, Y.; Zhou, M.; Yan, J.; Khurshid, M.; Weng, W.; Cheng, J.; Zhang, K. Jasmonic Acid Signaling Pathway in Plants. Int J Mol Sci 2019, 20(10), 2479. [Google Scholar] [CrossRef] [PubMed]
- Xiao, W.; Sheen, J.; Jang, J.C. The role of hexokinase in plant sugar signal transduction and growth and development. Plant Mol Biol 2000, 44(4), 451–61. [Google Scholar] [CrossRef]
- Vanderwall, M.; Gendron, J.M. HEXOKINASE1 and glucose-6-phosphate fuel plant growth and development. Development 2023, 150(20), dev202346. [Google Scholar] [CrossRef] [PubMed]
- Engelberth, J.; Engelberth, M. Variability in the capacity to produce damage-induced aldehyde green leaf volatiles among different plant species provides novel insights into biosynthetic diversity. Plants 2020, 9, 213. [Google Scholar] [CrossRef] [PubMed]
- Livak, K.J.; Schmittgen, T.D. Analysis of relative gene expression data using real-time quantitative PCR and the 2(-Delta Delta C(T)) Method. Methods 2001, 25(4), 402–408. [Google Scholar] [CrossRef]
- Manoli, A; Sturaro, A; Trevisan, S; Quaggiotti, S; Nonis, A. Evaluation of candidate reference genes for qPCR in maize. J Plant Physiol 2012, 169(8), 807–815. [Google Scholar] [CrossRef]
- Engelberth, J.; Contreras, C.F.; Dalvi, C.; Li, T.; Engelberth, M. Early transcriptome analyses of Z-3-Hexenol-treated Zea mays revealed distinct transcriptional networks and anti-herbivore defense potential of green leaf volatiles. PLoS ONE 2013, 8, e77465. [Google Scholar] [CrossRef]
- Köllner, T.G.; Gershenzon, J.; Degenhardt, J. Molecular and biochemical evolution of maize terpene synthase 10, an enzyme of indirect defense. Phytochem 2009, 70(9), 1139–1145. [Google Scholar] [CrossRef] [PubMed]
- Seidl-Adams, I.; Richter, A.; Boomer, K.B.; Yoshinaga, N.; Degenhardt, J.; Tumlinson, J.H. Emission of herbivore elicitor-induced sesquiterpenes is regulated by stomatal aperture in maize (Zea mays) seedlings. Plant Cell Environ 2015, 38(1), 23–34. [Google Scholar] [CrossRef] [PubMed]
- Tanaka, Y.; Fujita, K.; Date, M.; Watanabe, B.; Matsui, K. Structure-activity relationship of volatile compounds that induce defense-related genes in maize seedlings. Plant Sig Behav 2023, 18(1), 2234115. [Google Scholar] [CrossRef] [PubMed]
Figure 2.
Transcript accumulation in leaves of maize seedlings in response to drought treatment and Z-3-hexenol (HOL). Transcript accumulation was determined by the Ct method and then normalized by setting the highest Z-3-hexenol-induced increase at 100% (here shown as 1). A, Transcript accumulation of hexokinase (HK). B, Transcript accumulation of dehydrin (Deh). C, Transcript accumulation of cysteine protease inhibitor (CystP). D, Transcript accumulation of terpene synthase 10 (TPS10). F, Glucose levels (gram/gram fresh weight) in control/watered plants. C, control plants (watered/unstressed); C HOL, control plants (watered/unstressed) treated with Z3ol; Drought C, control plants (drought stressed); Drought HOL, plants (drought stressed) treated with Z3ol. Error bars represent standard deviation. * indicates significant differences (A-D) (t test, p ≤ 0.05, N ≥ 3). Different letters above each bar indicate statistical differences determined by ANOVA analysis followed by Tukey tests where appropriate (p ≤ 0.05).
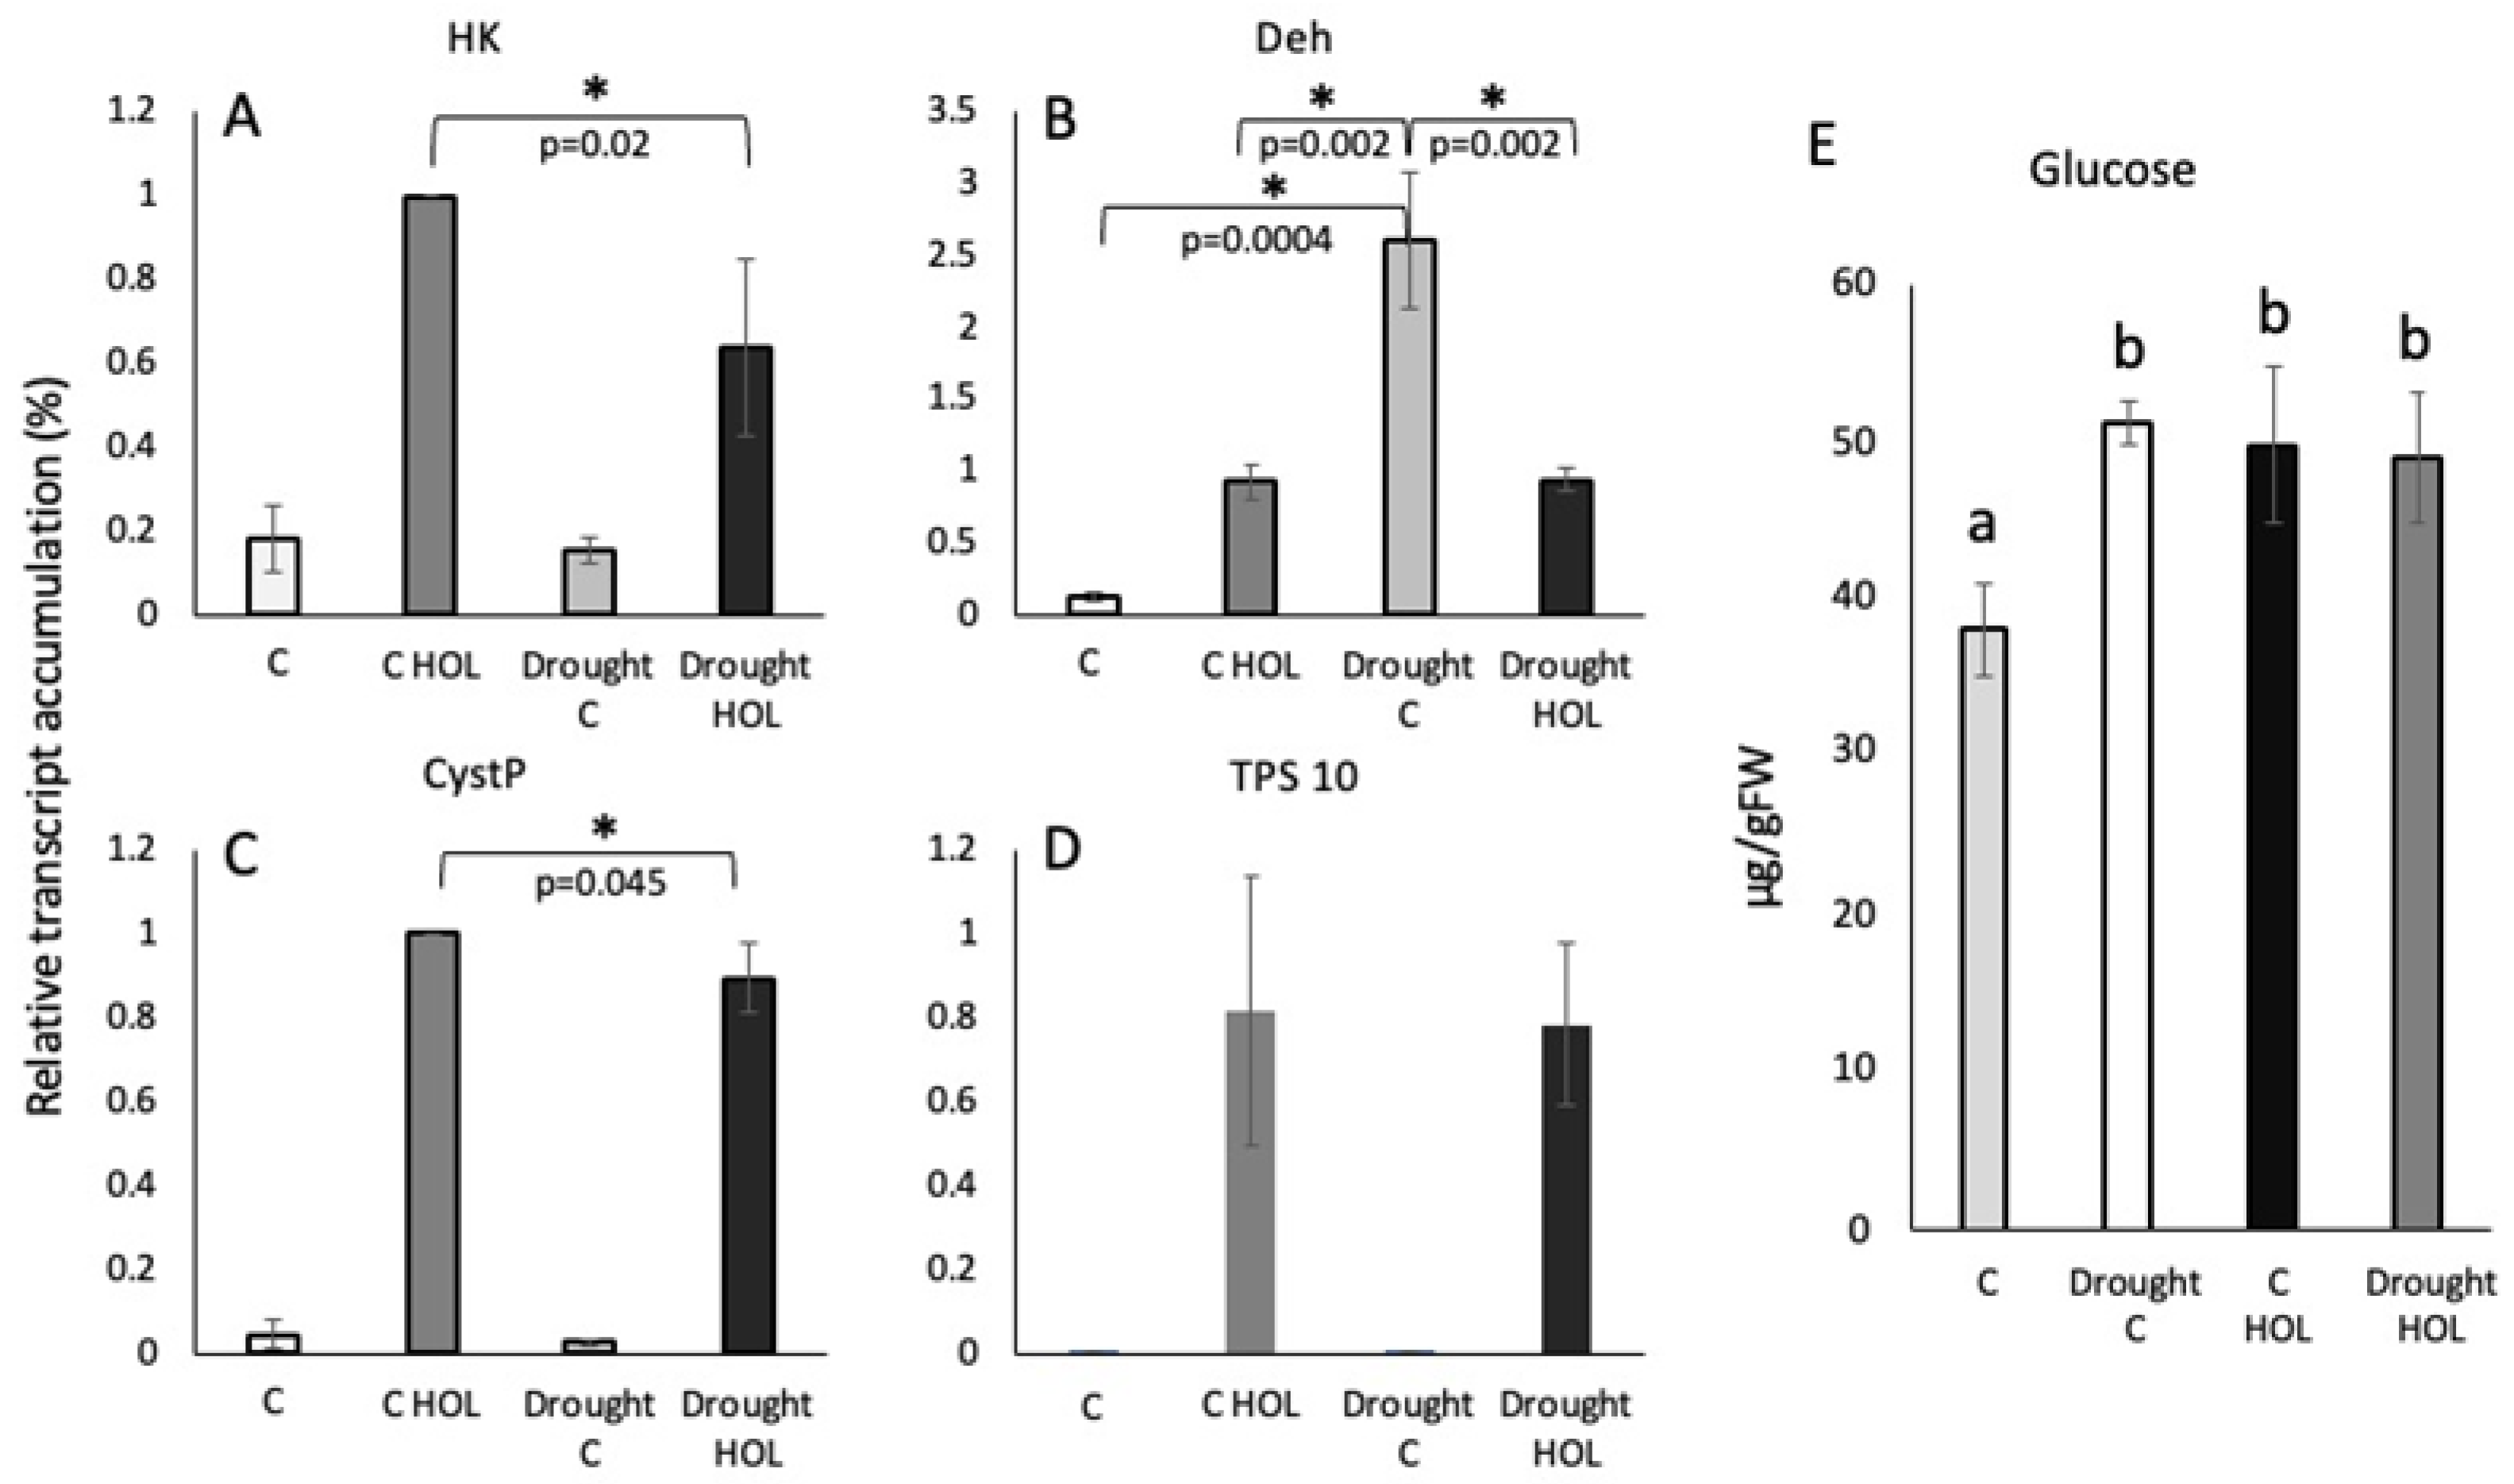
Figure 3.
Transcript accumulation in leaves of maize seedlings in response to low nitrogen condition and Z-3-hexenol (HOL) treatment. Transcript accumulation was determined by the ΔΔCt method and then normalized by setting the highest Z-3-hexenol-induced at 100% (here shown as 1). A, Transcript accumulation of hexokinase (HK). B, Transcript accumulation of dehydrin (Deh). C, Transcript accumulation of cysteine protease inhibitor (CystP). D, Transcript accumulation of terpene synthase 10 (TPS10). F, Glucose levels (μgram/gram fresh weight) in maize seedlings (2nd leaf) in response to low nitrogen and HOL treatment. N C, control plants; Low N C, control low nitrogen plants; N HOL, Z-3-hexenol (HOL) treated control plants, Low N HOL, Z-3-hexenol (HOL) treated low nitrogen plants. Error bars represent standard deviation. * indicates significant differences (A-D) (t test, p ≤ 0.05, N ≥ 3). Different letters above each bar indicate statistical differences determined by ANOVA analysis followed by Tukey tests where appropriate (p ≤ 0.05).
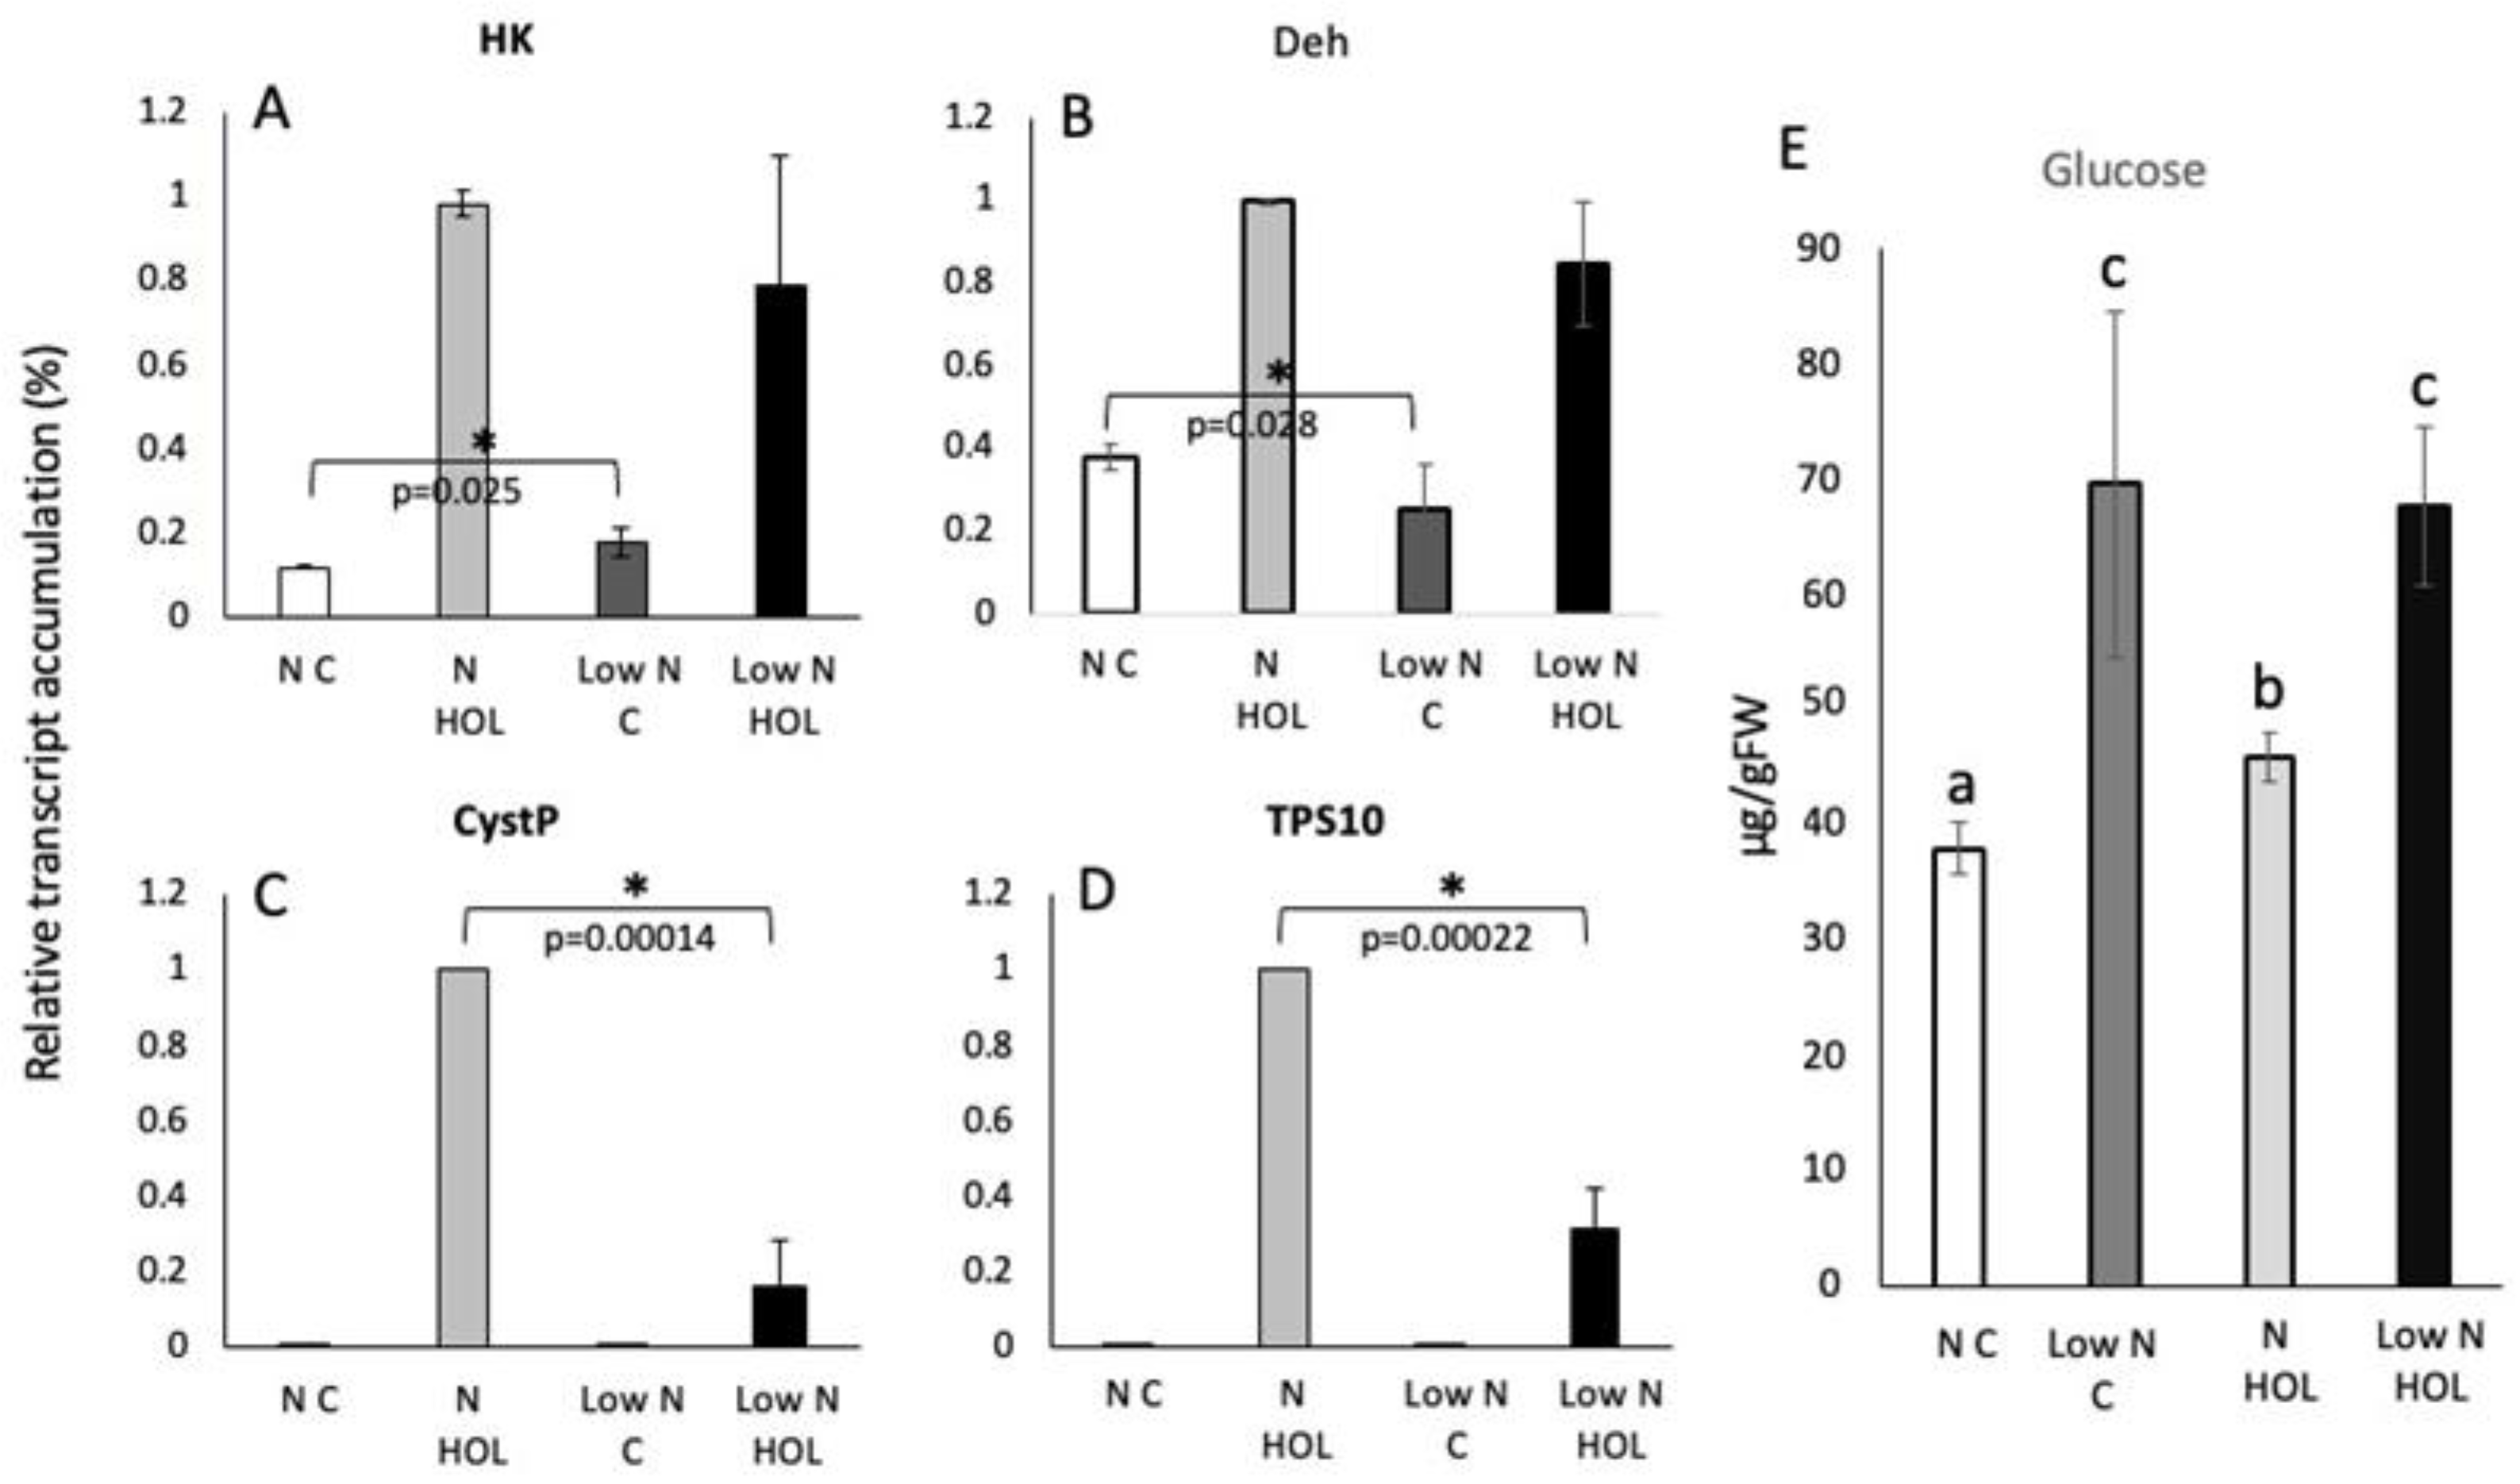
Figure 4.
Transcript accumulation in leaves of maize seedlings in response to heat treatment and Z-3-hexenol (HOL). Transcript accumulation was determined by the ΔΔCt method and then normalized by setting the highest Z-3-hexenol-induced at 100% (here shown as 1). A, Transcript accumulation of hexokinase (HK). B, Transcript accumulation of dehydrin (Deh). C, Transcript accumulation of cysteine protease inhibitor (CystP). D, Transcript accumulation of terpene synthase 10 (TPS10). E, Glucose levels (μgram/gram fresh weight) in maize seedlings (2nd leaf) in response to heat and Z-3-hexenol (HOL) treatment. C RT, control under room temperature; C Heat, control under heat; HOL RT, HOL treatment under room temperature; HOL Heat, HOL treatment under heat; RT, 25ºC; heat, 30ºC. Error bars represent standard deviation. * indicates significant differences (A-D) (t test, p ≤ 0.05, N ≥ 3). Different letters above each bar indicate statistical differences determined by ANOVA analysis followed by Tukey tests where appropriate (p ≤ 0.05).
Disclaimer/Publisher’s Note: The statements, opinions and data contained in all publications are solely those of the individual author(s) and contributor(s) and not of MDPI and/or the editor(s). MDPI and/or the editor(s) disclaim responsibility for any injury to people or property resulting from any ideas, methods, instructions or products referred to in the content. |
© 2025 by the authors. Licensee MDPI, Basel, Switzerland. This article is an open access article distributed under the terms and conditions of the Creative Commons Attribution (CC BY) license (http://creativecommons.org/licenses/by/4.0/).
Copyright: This open access article is published under a Creative Commons CC BY 4.0 license, which permit the free download, distribution, and reuse, provided that the author and preprint are cited in any reuse.


