
Submitted:
28 November 2025
Posted:
02 December 2025
You are already at the latest version
Abstract
The assessment of lake environments is crucial in tropical regions to ensure clean water access, while local lake sediments may serve as indicators of the local geology and environmental hazards. In this study, a multivariate approach was used to explore the sediment geochemistry of ten small lakes in Dak Lak province in Vietnam, which are characterized by contrasting elemental abundances. Specifically, multivariate analyses (CA and PCA) were applied to three datasets (bulk content, EFAl, and EFFe) of 57 elements and further combined with geochemical indicators and normalized rare earth element distribution patterns. The results enabled the identification of different groups of lakes with distinct geochemical fingerprints related to the major geochemical formations. The applied method can be effectively utilized to discriminate the provenance of surface sediment in water reservoirs, maintaining good coherence even with limited geochemical data. This study provides a foundation for sustainable land use and optimized irrigation in the Dak Lak region, which is under climate change stresses, such as longer and harder droughts.
Keywords:
Dak Lak province
; trace elements
; rare earth elements
; lake bottom sediments
; fingerprinting
; provenance
1. Introduction
Currently, climate change, industry expansion, and agricultural cultivation are globally affecting water quality in inland aquatic ecosystems. In this regard, the assessment of tropical lake environments has become a major goal for researchers, since these water reservoirs are crucial for climate change management, clean water, good health, and social–economic activity of the population [1,2,3,4,5,6]. Geochemical studies of lake sediment contribute to the understanding of the geological background, while trace (TEs) and rare earth (REEs) elements are effectively utilized as geochemical tracers of natural elemental input and possible anthropogenic impact [7,8,9]. However, recent research has shown that environmental assessment and source appointment of sediments in inland water reservoirs is often complicated by a complex geological and geochemical composition. Therefore, they should be implemented with a particular focus on the diverse methods of multi-element data normalization and multivariate statistics analyses [2,8,10,11,12]. In recent years, there has been ever-growing interest in the environmental geochemistry of TEs and REEs in Vietnam due to the rapidly growing tourism, industry, and urban and agricultural activities [2,13,14,15,16,17,18]. Dak Lak province, in the Central Highlands of Vietnam, has the biggest share (36%) of Vietnamese Robusta coffee production. Because of climate change, more severe and longer droughts are occurring in this area, altering the balance of water resources [2,15,19]. Additionally, aggressive land use has caused significant soil erosion, resulting in landscape changes in the catchment [20]. In this context, water reservoirs such as natural and human-made lakes, are vital for clean water access and sustainable agricultural production in the province.
This study progresses from a recent survey of ten previously unstudied small water reservoirs in Dak Lak province, which primarily focused on establishing a baseline geochemical assessment of lake bottom sediments. The results revealed severe spatial variability in the chemical composition of lake sediments within the relatively small area of Dak Lak province [21,22]. Since the studied lakes were separated from industrial anthropogenic sources of pollution until the sampling period, the detected trace and rare earth element anomalies were related to the local lithology rather than to anthropogenic influence [10,23,24]. However, agricultural non-point source pollution and land-use effects should still be considered.
This work aims to develop and implicate a comprehensive approach for processing and interpreting contrast elemental abundances in sediments using ten small lakes in Dak Lak province as a case study. For this, a combined fingerprinting method was applied: (1) complex EF calculations (EFAls, EFAlf, EFFes, and EFFef) were used for advanced risk element assessment; (2) Zr/Hf and Nb/Ta ratios were utilized as geochemical indicators of host rock origin; (3) cluster analysis (CA) was employed for sediment provenance discrimination; (4) principal component analysis (PCA) was employed for elemental fingerprint identification; (5) normalized rare earth element (REEs) distributions and fractionation patterns were implemented to determine the sediment sources.
This study provides a baseline for sustainable land use and clean water access in the Dak Lak region under climate change stresses and suggests a new approach for comprehensive environmental assessment of sediments of the inland water reservoirs, even with limited and contrasting geochemical data.
2. Materials and Methods
2.1. Study Area
Dak Lak, Vietnam’s vastest region for coffee-growing, spans an area of 13,030 km2 and is home to 1.919 million inhabitants. The rainfall data ranges between 1300 to 2000 mm year-1 and highlights an altitude dependency towards the mountains in the east and southeast. The province regularly goes through a dry season lasting from December until the end of April, often resulting in drought throughout the area [25].
The density of urbanization is highest within the central basaltic plateau, which is also the area of highest agricultural productivity. Most common land usages include rice, urban zones, and rubber forest, while the crop with the most significant role in the economy of the province is coffee. A strong correlation can be traced between land use and geology. The coffee plantations almost exactly map out the basaltic plateau, where the soil types are mostly Rhodic Ferralsols.
Fractured Neogene to Quaternary basaltic rocks, primarily of tholeitic and sub-alkaline olivine composition, form a morphologically slightly undulating plateau in the central part of the area. In the southern part of the region, intrusive Jurassic to Paleogene rocks outlines the major topographic highs of the province. The Precambrian to Paleogene magmatic and metamorphic rocks crop out in the northeastern, southern, and western parts of the area. The Jurassic sedimentary rocks crop out along a northwestern–southeastern axis across the province. Quaternary sediments crop out along the major streams and rivers.
2.2. Sampling
Bottom surface sediment samples were collected from 10 previously unexplored water reservoirs in Dak Lak province of Central Vietnam in August 2010 (Figure 1). Surface sediment samples (0-5 cm) were collected using a plastic piston corer and placed in pre-cleaned polyethylene containers using stainless steel spatulas. One portion of each sample was kept frozen until grain size analysis. The other portion was dried to a constant weight at 600C for chemical element analysis. All sampling, sampling transportation, and preparation procedures were performed using standard clean techniques according to the manual of Loring and Rantala [27].
2.3. Laboratory Analyses
The sediment was classified by particle size distribution using wet-sieving with precision sieves. The obtained fractions were: gravel (≥2 mm), sand (62.5 μm – 2 mm), silt (4 – 62.5 μm), and clay (<4 μm). The total organic carbon (TOC) content in the sediment samples was determined using a TOC 5000-V-CPH analyzer (Shimudzu Co., Japan), provided by the Ocean Chemistry Laboratory of the Shirshov Institute of Oceanology (Russian Academy of Science, RAS) [28,29].
Elemental analyses of the sediment samples were conducted at the Analytical and Certification Center of the Institute of Microelectronic Technology and High-Purity Materials (RAS). Inductively coupled plasma–atomic emission spectrometry (ICP-AES) (ICAP-61, Thermo Jarrell Ash, USA) and inductively coupled plasma–mass spectrometry (ICP-MS) (X-7, Thermo Elemental, USA) were utilized for elemental analyses of solutions obtained by total dissolution of sediment samples in HNO3 + HClO4 (3:1 by volume, Merck) using an autoclave system (Аnkon-АТ-2, Russia) [30]. ICP-AES was used to measure the major (Na, Mg, P, S, K, Ca, Al, Ti, and Fe) and trace elements (Li, V, Cr, Mn, Co, Ni, Cu, Zn, and Sr). ICP-MS was only utilized for the analysis of trace elements (Li, Be, B, Sc, Cr, Ni, Cu, Zn, Ga, As, Se, Rb, Sr, Y, Zr, Nb, Mo, Sn, Sb, Cs, Ba, Hf, W, Hg, Tl, Pb, Bi, Th, and U) and rare earth elements (La, Ce, Pr, Nd, Sm, Eu, Gd, Tb, Dy, Ho, Er, Tm, Yb, and Lu) [31]. The measurement error was less than 10–15 rel. % for ICP-AES and less than 10–30 rel.% for ICP-MS, regarding the element content. The precision and validity of the analytical determinations were assessed using certified reference materials (CRMs): Andesite, AGV-2 (United States Geological Survey), and Essexite Gabbro SRM-2A (Russian Geochemical Standard). In each case, the difference between the certified and measured element contents was within the limits of the confidence intervals.
2.4. Calculation of the Enrichment Factor
The enrichment factors (EFAl and EFFe) were calculated as follows:
where (M)/(MREF)s is the ratio of the metal concentration to the reference metal (Al or Fe in this study) in the sample, and (M)/(MREF)b is the corresponding in the reference materials, which included average World Shale [33,34] and average World Riverbed Sediments (WRSed) [35].
Standardized graphs of REE distribution were developed with respect to North American Shale Composite (NASC) [36].
2.5. Statistical Analysis
Descriptive statistics and Pearson correlation analysis were conducted using Microsoft Excel 2019 software. Multivariate statistics (Cluster (CA) and principal component (PCA) analyses) were carried out using the MATLAB R2018a computing environment (The Math Works, Inc., USA). Clustering was performed using an agglomerative hierarchical approach for correlation-based pairwise distances (where distance is defined as 1 minus the sample correlation coefficient of points) and average linkage function. PCA was performed using the single-value decomposition algorithm. All analyses were performed on datasets normalized using Z-scores (where chemical elements were treated as variables).
3. Results
3.1. Lake Bottom Sediment Characteristics
The age of artificial lakes at the time of sampling was 7 to 37 years. Organic carbon content in lake sediment samples varied in a wide range from 0.71% of dry weight in the Ea Knop to 8.41% of dry weight in the natural lake Lak, which indicates differences in organic matter influx, sedimentation duration, and rate. The dominant granulometric fractions were sand and silt, which varied from 0.12 to 83.26 and from 11.84 to 97.31% of dry weight, respectively. The finest silty sediments were discovered in the Lak, Buon Tria, Buon Triet, Ea Kao, Ea Nhai, and Buong Dong lakes, while the coarsest sandy sediments were found in Eadar and Ea Knop (Table 1).
3.2. Abundance and Risk Assessment
The mean bulk concentrations of major elements, TEs, and REEs in the surface sediments of Dak Lak lakes are presented in Table 2 (also see Supplementary Materials for bulk element content distribution in Table S1). The mean contents of most elements correspond to the reference material values in the World Shale [33,34] and World Riverbed Sediments (WRSed) [35].
According to Pearson correlation analysis (see correlation matrix in Table S2 of Supplementary Materials), total organic carbon (TOC) was not a controlling geochemical factor of distribution of most elements, which is consistent with the findings of Awankwaa et al. [5] in sediments from a crater lake in Bosomtwe. However, TOC showed positive correlations with bulk Li, S, Sn, Cs, W, and Bi, suggesting their affinity to sedimentary organic matter. The granulometric fractions showed positive (in the case of silt) and negative (in the case of sand) correlations with bulk contents of some major (Al and Fe), trace (Be, Zn, Ga, Se, and Y), and rare earth (Eu, Dy, Ho, Er, Tm, Yb, and Lu) elements.
The enrichment factor (EF) is widely utilized in environmental sedimentary studies as an effective indicator of anomalous elemental contents [6,8,11,20,32,37]. However, in EF calculation, the implication of a single reference element in combination with a single reference material may complicate risk assessment and element source determination [10]. To reduce uncertainty in interpreting contrasting elemental abundances, in this study, the four EF series were calculated using Al and Fe as reference elements, and World Shale and World Riverbed Sediments as reference materials, as follows: EFAls, EFAlf, EFFes, and EFFef (Table 2).
The results generally confirm that the lake bottom sediments were not contaminated in relation to most TEs and REEs, with a few exceptions. Average selenium EF values exceeded 2 in all calculations, indicating minor enrichment: EFAlf (2.98) > EFAls (2.77) > EFFef (2.37) > EFFes (2.24), while moderate Se enrichment corresponded to Eadar (EFAls of 5.03 and EFAlf of 5.41) and Ea Knop (EFFes of 5 and EFFef of 5.27) sediments. Furthermore, minor enrichment was detected for Ti (average EFAls of 2.14), Ta (average EFAls of 2.44), and Nb (average EFAls of 3.17, EFFes of 2.20). The heightened selenium content is likely related to its abundance in the magmatic source rocks of Dak Lak province (Figure 1). This is consistent with the study of [38], in which Se abundance in the topsoil of Hainan Island in China was inherited from the underlying basalt and granite, while Se content in both basalt and granite increased with chemical weathering intensity. Accordingly, minor to moderate enrichment in lithophile Ta, Nb, and Ti in sandy sediments in Eadar and Ea Knop is likely associated with underlying magmatic and metamorphic rocks [39] (Figure 1).
Generally, based on the results of complex EF analysis, we support the employment of several methods of normalization in risk element assessment. Specifically, in tropical lake sediments derived from Rhodic Ferralsols, the application of Fe as a reference element and average fluvial sediment (WRSed) as a reference material appears to be the most appropriate approach.
3.3. Geochemical Indicators
In multiple studies, element ratios such as Zr/Hf and Nb/Ta are widely utilized as geochemical fingerprints of rock origin and evolution [40,41]. Since sediments inherit their geochemical composition from parent source rocks, Zr/Hf and Nb/Ta ratios may add to sediment provenance discrimination.
Zr/Hf and Nb/Ta ratios are generally constant in basalts and equal to their chondritic values (Zr/Hf=36.6±2.9, Nb/Ta=16.8±3.1). In granitic rocks, Zr/Hf and Nb/Ta ratios are used as the geochemical indicators of fractional crystallization, since their values generally decrease from earlier to later intrusive phases [41,42,43]. In the Dak Lak lakes sediments, Zr-Hf and Nb-Ta were strongly positively linked pairwise (r=0.99), while their Zr/Hf and Nb/Ta ratios were strongly positively correlated (r=0.90). Both Zr/Hf and Nb/Ta varied widely (from 28.2 to 47.4 and from 11.9 to 22.2, respectively) within the relatively small study area of the province, reflecting a pronounced geochemical heterogeneity of sedimentary material. The relatively low Zr/Hf (28.2) and Nb/Ta (11.9) values in sediments of Lak lake indicate a moderate degree of fractional crystallization in the source intrusive rocks, corresponding to high-silica granites [42]. The near-chondritic Zr/Hf and Nb/Ta values of 32.6 and 14.2 in Dak Minh, 35.3 and 15 in Ea Knop, 37.4 and 14 in Buon Tria, 38.6 and 13.7 in Buon Triet, and 39.4 and 15.9 in Ea Sup Thuong, respectively, correspond to the continental material values [44]. The highest Zr/Hf and Nb/Ta ratios were detected in Ea Nhai (47.0 and 22.2), Ea Kao (42.7 and 19.1), Buon Dong (42.7 and 18.4), and Eadar (47.4 and 18.8). According to [44], extremely high “super-chondritic” Zr/Hf and Nb/Ta values suggest a very low degree of fractionation in the primary magmatic source rocks associated with the central basaltic plateau of Dak Lak province (Figure 1).
Overall, the distribution of Zr/Hf and Nb/Ta highlights the geochemical differentiation of Dak Lak lake sediments, conditioned by the provenance of source rocks.
3.4. Multivariate Analyses
In recent sedimentary research, various multivariate techniques, such as cluster analysis (CA) and principal component analysis (PCA), have been widely used to identify elemental fingerprints and discriminate sediment provenance [3,4,8,20,32]. In this study, cluster analysis and principal component analysis were applied to three datasets: bulk element content, EFAls, and EFFes.
CA enabled the classification of lakes into hierarchical clusters. Figure 2 shows cluster dendrograms for bulk element content (a), EFAls (b), and EFFes (c).
Summarizing the three dendrograms, we can identify two main groups that remain stable through all three datasets: Ea Kao, Ea Knai, and Buong Duong (1); and Lak, Buon Tria, Dak Minh, and Ea Sup Thuong (2). Lake Eadar was associated with the first group for both EF datasets, while for the bulk content, it was closer to the second group. Lake Ea Knop exhibited distinctive behavior for both EF datasets, forming a separate single-element cluster in the first three agglomerative stages, and was associated with the second group of lakes in the fourth stage. For the bulk dataset, the same pattern was observed for Ea Knop paired with Buon Triet.
The isolated clusters indicate similar geochemical compositions of the sediments within the separated lake groups inherited from similar geological sources. The first group included three lakes (Ea Kao, Ea Knai, and Buong Duong) located on the central plateau, which is composed of Neogene–Quarternary basalts of tholeitic and sub-alkaline olivine composition (Figure 1). The second group included two lakes of the southwestern area (Lak, and Buon Tria) and two lakes of the northwestern area (Dak Minh, and Ea Sup Thuong) of the province. These areas are mostly associated with a patchwork of Quarternary and Jurassic sediments that are cut and metamorphosed by Jurassic and Cretaceous intrusive rocks. Ea Knop sediment is likely associated with the Precambrian to Paleogene magmatic and metamorphic crystalline underlying rocks, while Eadar lake is located on the border of this formation and the plateau.
According to the CA results of the three datasets, the first group of lakes was most clearly isolated from the other lakes due to a different geochemical composition of the sediments. Furthermore, the CA results are supported by the Pearson correlation analysis results shown in Figure 3 (for EFFes). Among the studied lakes, Ea Kao, Ea Knai, and Buong Duong were strongly positively correlated to each other and positively correlated to Eadar.
PCA was implemented to isolate multi-element associations based on similarities of variable behavior. Figure 4 shows the PCA plots for the bulk element content (a), EFAls (b), and EFFes (c).
In all three plots, the first three PCs accounted for 82-83% of the total variation (see Supplementary Materials for correlation coefficients and respective p values (Tables S2 and S3), principal component loadings, and scores (Tables S4 and S5)). In each plot, the x and y coordinates correspond to the first two principal component loadings by variables (elements). Site scores were normalized to fit the plot. Scores and loadings for the third principal component are displayed in color.
In plot (a) for bulk element content, the first component (explaining 45% of variance) showed high positive loadings of Al, P, Fe, Ti, V, Cr, Mn, Co, Cu, Ni, Mo, Zn, Ga, Se, Y, Sc, Zr, Nb, Hf, Ta, and REEs (Sm-Lu), and high positive scores for Ea Nhai and Buon Dong (sites 9 and 10). The second component (explaining 24% of variance) showed high positive loadings of Li, Be, K, Rb, Sn, Sb, Cs, As, W, Pb, Tl, Pb, U, Th, and Bi, and high positive scores for Lak, Buon Tria, and Buon Triet (sites 5, 6, and 7). The third component (explaining 14% of variance) showed high positive loadings of Ca, high negative loadings of Sr and light REEs (La-Sm), and high negative scores for Ea Knop and Buon Triet (sites 2 and 7).
In plot (b) for element enrichment in relation to Al (EFAls), the first component (explaining 39% of variance) showed high positive loadings of Ca, Ti, V, Cr, Mn, Co, Mo, Se, Y, Sc, Ag, Cd, Ba, Zr, Nb, Hf, Ta, Hg, and REEs (Eu, Tb, Dy, Ho, Er, Tm), and a high positive score for Eadar (site 1). The second component (explaining 29% of variance) showed high positive loadings of Be, K, Rb, Sr, Tl, Pb, Th, U and high negative loadings of Fe, Ni, and Cu. Ea Knop and Buon Triet (sites 2 and 7) had the highest positive scores, while Ea Kao, Ea Nhai, and Buon Dong (sites 8, 9, and 10) had the highest negative scores along PC2. The third component (explaining 14% of variance) showed high positive loadings of Li, Mg, As, Sn, Sb, Yb, and Lu.
In plot (c) for element enrichment in relation to Fe (EFFes), the first component (explaining 52% of variance) showed high positive loadings of Be, Al, K, Rb, Zn, Ga, Sr, Se, Y, Sc, Mo, Ag, Cd, Ba, Tl, Pb, Th, U, and most REEs (except Eu, Yb, and Lu), high positive scores for Ea Knop and Buon Triet (sites 2 and 7), and high negative scores for Ea Kao, Ea Nhai, and Buon Dong (sites 8, 9 and 10). The second component (explaining 19% of variance) showed high positive loadings of P, Ti, V, Cr, Mn, Co, Ni, Nb, and Ta, high negative loadings of Li, S, and Cs, a high positive score for Eadar (site 1), and high negative scores for Lak, Buon Tria, and Buon Triet (sites 5, 6 and 7). The third component (explaining 11% of variance) showed high positive loadings of Zr, Hf, and Mg.
Summarizing the three PCA plots, we can identify two main element groups that remain stable through all three plots and can be interpreted as multi-element fingerprints of the dominant source rocks in lake sediments. The Ti-V-Cr-Fe-Mn-Co-Zr-Hf-Nb-Ta fingerprint is associated with detrital heavy minerals, such as zircon and titanite, derived from effusive basalts of the central basaltic plateau. A similar pattern has also been observed in basaltic effusives in other regions [37,41,43,45]. The Be-K-Rb-Tl-Pb-Th-U fingerprint is affiliated with felsic igneous source rocks, such as intrusive granites derived from a patchwork of magmatic and metamorphic rocks of the southwestern and northwestern parts of the province [40,46]. Additionally, the Al-Zn-Ga-Se-Y-Sc fingerprint is associated with the fine-grained silt- and clay-sized aluminosilicate host fraction, which is present in all lake sediments in different quantities. In fact, bulk Al-Zn-Ga-Se-Y-Sc exhibited a significant positive correlation with the silt fraction content, while Al and Ga showed very strong correlation to each other (r=0.99) and to the silt fraction (r=0.90) (Table S2). This is consistent with the study of [47], showing that Ga is concentrated with Al in clay minerals during the weathering process in stream and floodplain sediment and soils.
3.5. REE Patterns
Rare earth elements (REEs) are a group of metallic elements that are resistant to chemical mobilization and strongly partitioned into the particulate phase. Geochemical patterns of REEs are widely implemented to discriminate the provenance and depositional history of surface sediments in aquatic environments [8,11,37,48,49,50,51].
In Dak Lak sediments, the ΣREEs (summed from La to Lu) varied from 75 μg g−1 in Dak Minh to 272 μg g−1 in Buon Dong, which corresponds to the WRSed values (Table 2, Table S1). The light rare earth elements (LREEs, La - Nd) comprised 79 to 91% of the total REEs sum, medium rare earth elements (MREEs, Sm – Dy) comprised 6 to 10%, and heavy rare earth elements (HREEs, Ho-Lu) comprised 3 to 11% (Figure 5). LREE enrichment was evident in all sediment samples, which, according to Wang et al. [48], indicates terrestrial material input.
The coherent REE behavior during geochemical processes has been widely observed in lake sediments, suggesting their co-existence during weathering, erosion, and deposition [8,11,37,49,50]. Interestingly, in the Dak Lak lakes, Pearson correlation analysis results highlighted a high fractionation degree among the LREEs, MREEs, and HREEs (see Figure 6 for EFFes). LREEs and MREEs were strongly positively correlated with each other (with exception of Eu) and weakly or insignificantly correlated with HREEs. The distinct HREE distribution may be due to its affinity to the fine-grained fraction of the sediments. Earlier in this study, bulk HREEs were shown to be positively correlated with the silt fraction (Table S2). A similar trend was observed by [48,52] in surface sediments from Dongting Lake in China, while in the study of Prabakaran et al. [53], the HREE distribution in sediments in the tropical Baram River was related to mineralogical fractionation of the solid fluvial load. Furthermore, considerable fractionation occurred within the HREE group. Yb, and especially Lu, showed no significant correlation with other HREEs, suggesting the partitioning of HREEs during source rock evolution and weathering.
Additionally, the distinct HREE behavior, along with the positive correlation of HREEs with Fe, suggest a principal role of Fe-oxides as a HREE-carrier phase in tropical sediments. This effect was described by [54] in bottom sediments derived from tropical ferrolsols in the Western Atlantic.
Summarizing the NASC-normalized REE patterns presented in Figure 7, the studied lakes were divided into four groups. Lak, Buon Tria, and Buon Triet exhibited a generally even REE distribution around the NASC values, with a declining trend towards HREEs (a). Both Ea Knop and Eadar exhibited pronounced HREE depletion, while Ea Knop revealed the highest Eu depletion. Ea Sup Thuong, and especially Dakh Minh (c), were characterized by relative LREE depletion and a relatively even HREE distribution. The most cohesive group comprised Ea Kao, Ea Nhai, and Buon Dong (d), which were characterized by a vivid Eu elevation. Generally, Eu anomalies indicate differentiation between Eu and other REEs in the processes of sediment transportation and deposition [52]. As feldspars are the primary host for Eu, positive Eu anomaly suggests an abundance of feldspar minerals in the sediments of Ea Kao, Ea Nhai, and Buon Dong [7,54]. In contrast, negative Eu anomaly indicates depletion in feldspar minerals during the evolution and weathering of the source rocks in Ea Knop sediments [9,55].
4. Provenance Discrimination
Summarizing the results of multivariate analysis of the bulk content, EFAl, and EFFe of 57 elements, geochemical indicators, and REE distribution patterns, two main facies of lake sediments were identified and linked to three isolated multi-element fingerprints.
Buon Dong, Ea Nhai, and Ea Kao comprise the most isolated group of lakes. In these lakes, surface bottom sediments are characterized by «super-chondritic» Zr/Hf and Nb/Ta, a cohesive REE distribution pattern with a positive Eu anomaly, and a Ti-V-Cr-Fe-Mn-Co-Ni- Zr-Hf-Nb-Ta elemental fingerprint. These sediments are rich in detrital feldspar and originate from effusive tholeiitic basalts of the central basaltic plateau of Dak Lak province.
In Lak, Buon Tria, and Buon Triet, surface bottom sediments are affiliated with near-chondritic Zr/Hf and Nb/Ta values, near-NASC REE distribution pattern, and a K-Rb-Sr-Tl-Pb-Th-U elemental fingerprint. These sediments are derived from host intrusive granites incorporated in a patchwork of Quarternary and Jurassic sediments that are cut and metamorphosed by Jurassic and Cretaceous intrusive rocks.
The Al-Zn-Ga-Se-Y-Sc element fingerprint is related to the fine-grained silt- and clay-sized material inherited from the host sedimentary rocks that are largely composed of clay minerals, siltstones, shales, marls, and clayey limestones [26]. In Ea Knop, the detected negative Eu anomaly also indicates sedimentary rock origin.
Overall, the high degree of fractionation between the LREEs and HREEs suggests partitioning of the REEs during source rock evolution and weathering, while HREE fractionation is more pronounced than that of LREEs.
5. Conclusions
Multivariate analyses (CA and PCA) of three datasets (bulk content, EFAl, and EFFe) combined with geochemical indicators (Zr/Hf and Nb/Ta) and REE distribution patterns effectively determined the provenance of bottom sediments of 10 small lakes in Dak Lak province in Vietnam. Notably, a group of three lakes (Buon Dong, Ea Nhai, and Ea Kao) was clearly separated from the other lakes due to super-chondritic Zr/Hf and Nb/Ta values, a distinctive REE pattern with positive Eu anomaly, and a Ti-V-Cr-Fe-Mn-Co-Ni- Zr-Hf-Nb-Ta elemental fingerprint in the surface bottom sediments derived from tholeiitic basalts of the central basaltic plateau of Dak Lak province. The implemented comprehensive approach proved effective in linking elemental fingerprints to geochemical provenance when applied to limited geochemical data and contrasting element abundancies.
This study provides a baseline for sustainable land use, optimized irrigation, and clean water availability in Dak Lak province, which is experiencing climate change stresses. Generally, detected TE and REE anomalies in the studied sediments most likely relate to the local lithology and do not infer anthropogenic influence. However, in view of clean water use, agricultural non-point source pollution must be considered in future studies.
Supplementary Materials
The following supporting information can be downloaded at the website of this paper posted on Preprints.org, Table S1: Bulk element content and EF distribution in sediments of Dak Lak lakes; Tables S2–S5: Correlation matrixes, p-values, loadings and scores for bulk element content and EF.
Author Contributions
Conceptualization, S.K. and N.L.; software, A.S.; validation, A.S.; formal analysis, S.K. and N.L.; data curation, S.K. and N.L.; writing—original draft preparation, S.K.; writing—review and editing, S.K. and N.L.; visualization, A.S.; supervision, S.K. All authors have read and agreed to the published version of the manuscript.
Funding
This research was performed within the framework of the state assignment of Shirshov Institute of Oceanology, Russian Academy of Sciences (IO RAS) (theme no. FMWE-2024-0019).
Data Availability Statement
Not applicable.
Acknowledgments
Not applicable.
Conflicts of Interest
The authors declare no conflicts of interest.
Abbreviations
The following abbreviations are used in this manuscript:
| TE | Trace Elements |
| REE | Rare Earth Elements |
| CA | Cluster Analysis |
| PCA | Principal Component Analysis |
| EF | Enrichment Factor |
| TOC | Total Organic Carbon |
| NASC | North American Shale Composite |
References
- Le, H.T.; Ngo, H.T.T. Cd, Pb, and Cu in water and sediments and their bioaccumulation in freshwater fish of some lakes in Hanoi, Vietnam. Toxicol. Environ. Chem. 2013, 95, 1328–1337. [Google Scholar] [CrossRef]
- Le, N. Da; Hoang, T.T.H.; Phung, V.P.; Nguyen, T.L.T.D.T.A.H.; Rochelle-Newall, E.; Duong, T.T.; Pham, T.M.H.; Phung, T.X.B.; Nguyen, T.L.T.D.T.A.H.; Le, P.T.; et al. Evaluation of heavy metal contamination in the coastal aquaculture zone of the Red River Delta (Vietnam). Chemosphere 2022, 303, 134952. [Google Scholar] [CrossRef]
- Saleh, A.H.; Gad, M.; Khalifa, M.M.; Elsayed, S.; Moghanm, F.S.; Ghoneim, A.M.; Danish, S.; Datta, R.; Moustapha, M.E.; Abou El-Safa, M.M. Environmental Pollution Indices and Multivariate Modeling Approaches for Assessing the Potentially Harmful Elements in Bottom Sediments of Qaroun Lake, Egypt. J. Mar. Sci. Eng. 2021, 9, 1443. [Google Scholar] [CrossRef]
- Talukder, R.; Rabbi, M.H.; Baharim, N.B.; Carnicelli, S. Source identification and ecological risk assessment of heavy metal pollution in sediments of Setiu wetland, Malaysia. Environ. Forensics 2022, 23, 241–254. [Google Scholar] [CrossRef]
- Amankwaa, G.; Yin, X.; Zhang, L.; Huang, W.; Cao, Y.; Ni, X.; Gyimah, E. Spatial distribution and eco-environmental risk assessment of heavy metals in surface sediments from a crater lake (Bosomtwe/Bosumtwi). Environ. Sci. Pollut. Res. 2021, 28, 19367–19380. [Google Scholar] [CrossRef]
- Varol, M.; Ustaoğlu, F.; Tokatlı, C. Ecological risks and controlling factors of trace elements in sediments of dam lakes in the Black Sea Region (Turkey). Environ. Res. 2022, 205, 112478. [Google Scholar] [CrossRef] [PubMed]
- Fang, X.; Peng, B.; Guo, X.; Wu, S.; Xie, S.; Wu, J.; Yang, X.; Chen, H.; Dai, Y. Distribution, source and contamination of rare earth elements in sediments from lower reaches of the Xiangjiang River, China. Environ. Pollut. 2023, 336, 122384. [Google Scholar] [CrossRef] [PubMed]
- Sojka, M.; Choiński, A.; Ptak, M.; Siepak, M. Causes of variations of trace and rare earth elements concentration in lakes bottom sediments in the Bory Tucholskie National Park, Poland. Sci. Rep. 2021, 11, 244. [Google Scholar] [CrossRef]
- Slukovskii, Z.I.; Dauvalter, V.A.; Shelekhova, T.S. Anomalies of rare earth elements and heavy metals/metalloids in modern sediments of small lakes in the north of Karelia (Arctic): geology and technogenesis influence. Environ. Earth Sci. 2025, 84, 68. [Google Scholar] [CrossRef]
- Matys Grygar, T.; Popelka, J.; Grygar, T.M.; Popelka, J. Revisiting geochemical methods of distinguishing natural concentrations and pollution by risk elements in fluvial sediments. J. Geochemical Explor. 2016, 170, 39–57. [Google Scholar] [CrossRef]
- Fabijańczyk, P.; Zawadzki, J.; Łukasik, A. Assessment of the concentration of rare earth elements (REEs) in industrially impacted topsoil: a case study from the Jizera Mountains and Upper Silesian Industrial Area (USIR), Poland. Environ. Monit. Assess. 2025, 197, 1121. [Google Scholar] [CrossRef]
- Selvam, A.P.; Priya, S.L.; Banerjee, K.; Hariharan, G.; Purvaja, R.; Ramesh, R. Heavy metal assessment using geochemical and statistical tools in the surface sediments of Vembanad Lake, Southwest Coast of India. Environ. Monit. Assess. 2012, 184, 5899–5915. [Google Scholar] [CrossRef]
- Giuliani, S.; Bellucci, L.G.; Nhon, D.H. The Coast of Vietnam: Present Status and Future Challenges for Sustainable Development. In World Seas: an Environmental Evaluation; Elsevier, 2019; pp. 415–435. ISBN 9780081008539. [Google Scholar]
- Costa-Böddeker, S.; Hoelzmann, P.; Thuyên, L.X.; Huy, H.D.; Nguyen, H.A.; Richter, O.; Schwalb, A. Ecological risk assessment of a coastal zone in Southern Vietnam: Spatial distribution and content of heavy metals in water and surface sediments of the Thi Vai Estuary and Can Gio Mangrove Forest. Mar. Pollut. Bull. 2017, 114, 1141–1151. [Google Scholar] [CrossRef]
- Nguyen Nhu, T.; Bui Van, N.; Le, D.-A.; Tran Thi, T.H.; Nguyen, T.-D.; Dang Xuan, T.; Tran, H.-N.; Sang, P.N.; Saiyad Musthafa, M.; Duong, V.-H. Characteristics of heavy metals in surface sediments of the Van Don-Tra Co coast, northeast Vietnam. Reg. Stud. Mar. Sci. 2024, 73, 103459. [Google Scholar] [CrossRef]
- Nguyen, T.M.L.; Dang, H.N.; Nguyen, D.V.; Nguyen, V.Q.; Duong, T.N.; Hoang, T.C.; Nguyen, N.A.; Bui, V.V.; Nguyen, D.T.; Le, V.N.; et al. Assessment of heavy metal pollution risk in sediments of coastal ecosystems in Vietnam. Vietnam J. Mar. Sci. Technol. 2025, 25, 355–368. [Google Scholar] [CrossRef]
- Nhon, D.H.; Thanh, N.D.; Manh, H.N.; Nguyen Thi Mai, L.; Do Thi Thu, H.; Hoang Thi, C.; Van Nam, L.; Vu Manh, H.; Bui Van, V.; Bui Thi Thanh, L.; et al. Distribution and ecological risk of heavy metal(loid)s in surface sediments of the Hai Phong coastal area, North Vietnam. Chem. Ecol. 2022, 38, 27–47. [Google Scholar] [CrossRef]
- Thanh-Nho, N.; Marchand, C.; Strady, E.; Vinh, T.-V.; Nhu-Trang, T.-T. Metals geochemistry and ecological risk assessment in a tropical mangrove (Can Gio, Vietnam). Chemosphere 2019, 219, 365–382. [Google Scholar] [CrossRef]
- Trinh, L.H.; Bien, T.X.; Dao, K.H. Reservoir surface water area variations change research using Sentinel 2 MSI data. A case study in Dak Lak province, Central Highlands (Vietnam). Adv. Geod. Geoinf. 2024, 56–56. [Google Scholar] [CrossRef]
- Liu, H.; Liu, E.; Yu, Z.; Lin, Q.; Zhang, E.; Shen, J. Spatio-temporal accumulation patterns of trace metals in sediments of a large plateau lake (Erhai) in Southwest China and their relationship with human activities over the past century. J. Geochemical Explor. 2022, 234, 106943. [Google Scholar] [CrossRef]
- Koukina, S.; Lobus, N.; Bolotov, S. Spatial Variations of Trace and Rare Earth Elements in Tropical Lake Sediments. In Recent Research on Environmental Earth Sciences, Geomorphology, Soil Science and Paleoenvironments, Advances in Science, Technology & Innovation; Çiner, A., Ed.; Springer Nature Switzerland AG, 2024; pp. 129–131. [Google Scholar]
- Koukina, S.; Lobus, N.; Bolotov, S. Multi-element Signatures in Lake Bottom Sediments of Central Vietnam. In Recent Advances in Environmental Science from the Euro-Mediterranean and Surrounding Regions; Ksibi, M., Ed.; Springer Nature Switzerland AG, 2024; pp. 811–814. [Google Scholar]
- Reimann, C.; Garrett, R.G. Geochemical background—concept and reality. Sci. Total Environ. 2005, 350, 12–27. [Google Scholar] [CrossRef] [PubMed]
- Koukina, S.E.; Lobus, N. V. Relationship between enrichment, toxicity, and chemical bioavailability of heavy metals in sediments of the Cai River estuary. Environ. Monit. Assess. 2020, 192, 305. [Google Scholar] [CrossRef]
- Van Viet, L.; Thuy, T.T.T. Improving the quality of coffee yield forecasting in Dak Lak Province, Vietnam, through the utilization of remote sensing data. Environ. Res. Commun. 2023, 5, 095011. [Google Scholar] [CrossRef]
- Milnes, E.; Negro, P.; Perrochet, F. Hydrogeological study of the Basaltic Plateau in Dak Lak province, Vietnam. Prepared by the Centre for Hydrogeology and Geothermics (CHYN); 2015.
- Loring, D.H.; Rantala, R.T.T. Manual for the geochemical analyses of marine sediments and suspended particulate matter. Earth-Science Rev. 1992, 32, 235–283. [Google Scholar] [CrossRef]
- Lobus, N. V.; Peresypkin, V.I.; Shulga, N.A.; Drozdova, A.N.; Gusev, E.S. Dissolved, particulate, and sedimentary organic matter in the Cai River basin (Nha Trang Bay of the South China Sea). Oceanology 2015, 55, 339–346. [Google Scholar] [CrossRef]
- Koukina, S.E.; Lobus, N.V.; Peresypkin, V.I.; Dara, O.M.; Smurov, A.V. Abundance, distribution and bioavailability of major and trace elements in surface sediments from the Cai River estuary and Nha Trang Bay (South China Sea, Vietnam). Estuar. Coast. Shelf Sci. 2017, 198, 450–460. [Google Scholar] [CrossRef]
- Karpov, Y.A.; Orlova, V.A. Modern methods of autoclave sample preparation in chemical analysis of substances and materials. Inorg. Mater. 2008, 44, 1501–1508. [Google Scholar] [CrossRef]
- Karandashev, V.K.; Turanov, A.N.; Orlova, T.A.; Lezhnev, A.E.; Nosenko, S. V.; Zolotareva, N.I.; Moskvitina, I.R. Use of the inductively coupled plasma mass spectrometry for element analysis of environmental objects. Inorg. Mater. 2008, 44, 1491–1500. [Google Scholar] [CrossRef]
- Koukina, S.E.; Lobus, N. V.; Shatravin, A. V. Dataset on the abundance, enrichment and partitioning of chemical elements between the filtered, particulate and sedimentary phases in the Cai River estuary (South China Sea). Data Br. 2021, 107412. [Google Scholar] [CrossRef] [PubMed]
- Turekian, K.K.; Wedepohl, K.H. Distribution of the elements in some major units of the earth’s crust. Bull. Geol. Soc. Am. 1961, 72, 175–192. [Google Scholar] [CrossRef]
- Taylor, S.R.; McLennan, S.M. The Continental Crust: its Composition and Evolution.; Blackwell Scientific Publications: Oxford, 1985; ISBN 0632011483. [Google Scholar]
- Savenko, V.S. Chemical composition of World River’s suspended matter; GEOS, 2006.
- Gromet, L.P.; Haskin, L.A.; Korotev, R.L.; Dymek, R.F. The “North American shale composite”: Its compilation, major and trace element characteristics. Geochim. Cosmochim. Acta 1984, 48, 2469–2482. [Google Scholar] [CrossRef]
- Coțac, V.N.; Iancu, O.G.; Necula, N.; Sandu, M.C.; Loghin, A.A.; Chișcan, O.; Stoian, G. Rare earth elements distribution in the river sediments of Ditrău Alkaline massif, Eastern Carpathians. PLoS One 2024, 19, e0314874. [Google Scholar] [CrossRef]
- Gong, J.; Yang, J.; Wu, H.; Fu, Y.; Gao, J.; Tang, S.; Ma, S. Distribution of soil selenium and its relationship with parent rocks in Chengmai County, Hainan Island, China. Appl. Geochemistry 2022, 136, 105147. [Google Scholar] [CrossRef]
- Briqueu, L.; Bougault, H.; Joron, J.L. Quantification of Nb, Ta, Ti and V anomalies in magmas associated with subduction zones: Petrogenetic implications. Earth Planet. Sci. Lett. 1984, 68, 297–308. [Google Scholar] [CrossRef]
- Zaraisky, G.P.; Aksyuk, A.M.; Devyatova, V.N.; Udoratina, O. V.; Chevychelov, V.Y. The Zr/Hf ratio as a fractionation indicator of rare-metal granites. Petrology 2009, 17, 25–45. [Google Scholar] [CrossRef]
- Lowery Claiborne, L.; Miller, C.F.; Walker, B.A.; Wooden, J.L.; Mazdab, F.K.; Bea, F. Tracking magmatic processes through Zr/Hf ratios in rocks and Hf and Ti zoning in zircons: An example from the Spirit Mountain batholith, Nevada. Mineral. Mag. 2006, 70, 517–543. [Google Scholar] [CrossRef]
- Green, T.H. Significance of Nb/Ta as an indicator of geochemical processes in the crust-mantle system. Chem. Geol. 1995, 120, 347–359. [Google Scholar] [CrossRef]
- Pfänder, J.A.; Münker, C.; Stracke, A.; Mezger, K. Nb/Ta and Zr/Hf in ocean island basalts — Implications for crust–mantle differentiation and the fate of Niobium. Earth Planet. Sci. Lett. 2007, 254, 158–172. [Google Scholar] [CrossRef]
- David, K.; Schiano, P.; Allègre, C. Assessment of the Zr/Hf fractionation in oceanic basalts and continental materials during petrogenetic processes. Earth Planet. Sci. Lett. 2000, 178, 285–301. [Google Scholar] [CrossRef]
- Xie, Q.; Zhang, Z.; Foley, S.F.; Chen, C.; Cheng, Z.; Wang, Y.; Kong, W.; Lv, Y.; Santosh, M.; Jin, Q.; et al. Transition from tholeiitic to alkali basalts via interaction between decarbonated eclogite-derived melts and peridotite. Chem. Geol. 2023, 621, 121354. [Google Scholar] [CrossRef]
- He, X.; Deng, X.; Pirajno, F.; Zhang, J.; Li, C.; Chen, S.; Sun, H. The genesis of the granitic rocks associated with the Mo-mineralization at the Hongling deposit, eastern Tianshan, NW China: Constraints from geology, geochronology, geochemistry, and Sr-Nd-Hf isotopes. Ore Geol. Rev. 2022, 146, 104947. [Google Scholar] [CrossRef]
- Yuan, W.; Chen, J.; Teng, H.; Chetelat, B.; Cai, H.; Liu, J.; Wang, Z.; Bouchez, J.; Moynier, F.; Gaillardet, J.; et al. A Review on the Elemental and Isotopic Geochemistry of Gallium. Global Biogeochem. Cycles 2021, 35. [Google Scholar] [CrossRef]
- Wang, L.; Han, X.; Liang, T.; Guo, Q.; Li, J.; Dai, L.; Ding, S. Discrimination of rare earth element geochemistry and co-occurrence in sediment from Poyang Lake, the largest freshwater lake in China. Chemosphere 2019, 217, 851–857. [Google Scholar] [CrossRef]
- Budakoglu, M.; Abdelnasser, A.; Karaman, M.; Kumral, M. The rare earth element geochemistry on surface sediments, shallow cores and lithological units of Lake Acıgöl basin, Denizli, Turkey. J. Asian Earth Sci. 2015, 111, 632–662. [Google Scholar] [CrossRef]
- Och, L.M.; Müller, B.; Wichser, A.; Ulrich, A.; Vologina, E.G.; Sturm, M. Rare earth elements in the sediments of Lake Baikal. Chem. Geol. 2014, 376, 61–75. [Google Scholar] [CrossRef]
- Zhang, Y.; Zhang, Z.; Stephenson, W.; Chen, Y. Geochemical Behavior of Rare Earth Elements in Tidal Flat Sediments from Qidong Cape, Yangtze River Estuary: Implications for the Study of Sedimentary Environmental Change. Land 2024, 13, 1425. [Google Scholar] [CrossRef]
- Wang, L.; Han, X.; Ding, S.; Liang, T.; Zhang, Y.; Xiao, J.; Dong, L.; Zhang, H. Combining multiple methods for provenance discrimination based on rare earth element geochemistry in lake sediment. Sci. Total Environ. 2019, 672, 264–274. [Google Scholar] [CrossRef] [PubMed]
- Prabakaran, K.; Nagarajan, R.; Eswaramoorthi, S.; Anandkumar, A.; Franco, F.M. Environmental significance and geochemical speciation of trace elements in Lower Baram River sediments. Chemosphere 2019. [Google Scholar] [CrossRef]
- Sousa, T.A.; Venancio, I.M.; Marques, E.D.; Figueiredo, T.S.; Nascimento, R.A.; Smoak, J.M.; Albuquerque, A.L.S.; Valeriano, C.M.; Silva-Filho, E.V. REE Anomalies Changes in Bottom Sediments Applied in the Western Equatorial Atlantic Since the Last Interglacial. Front. Mar. Sci. 2022, 9. [Google Scholar] [CrossRef]
- Mardiyah, A.; Syahputra, M.R.; Tang, Q.; Okabyashi, S.; Tsuboi, M. The Spatial Distribution of Trace Elements and Rare-Earth Elements in the Stream Sediments Around the Ikuno Mine Area in Hyogo Prefecture, Southwest Japan. Sustainability 2025, 17, 2777. [Google Scholar] [CrossRef]
Figure 1.
Geological map of Dak Lak province [26] and sampling point location.
Figure 1.
Geological map of Dak Lak province [26] and sampling point location.
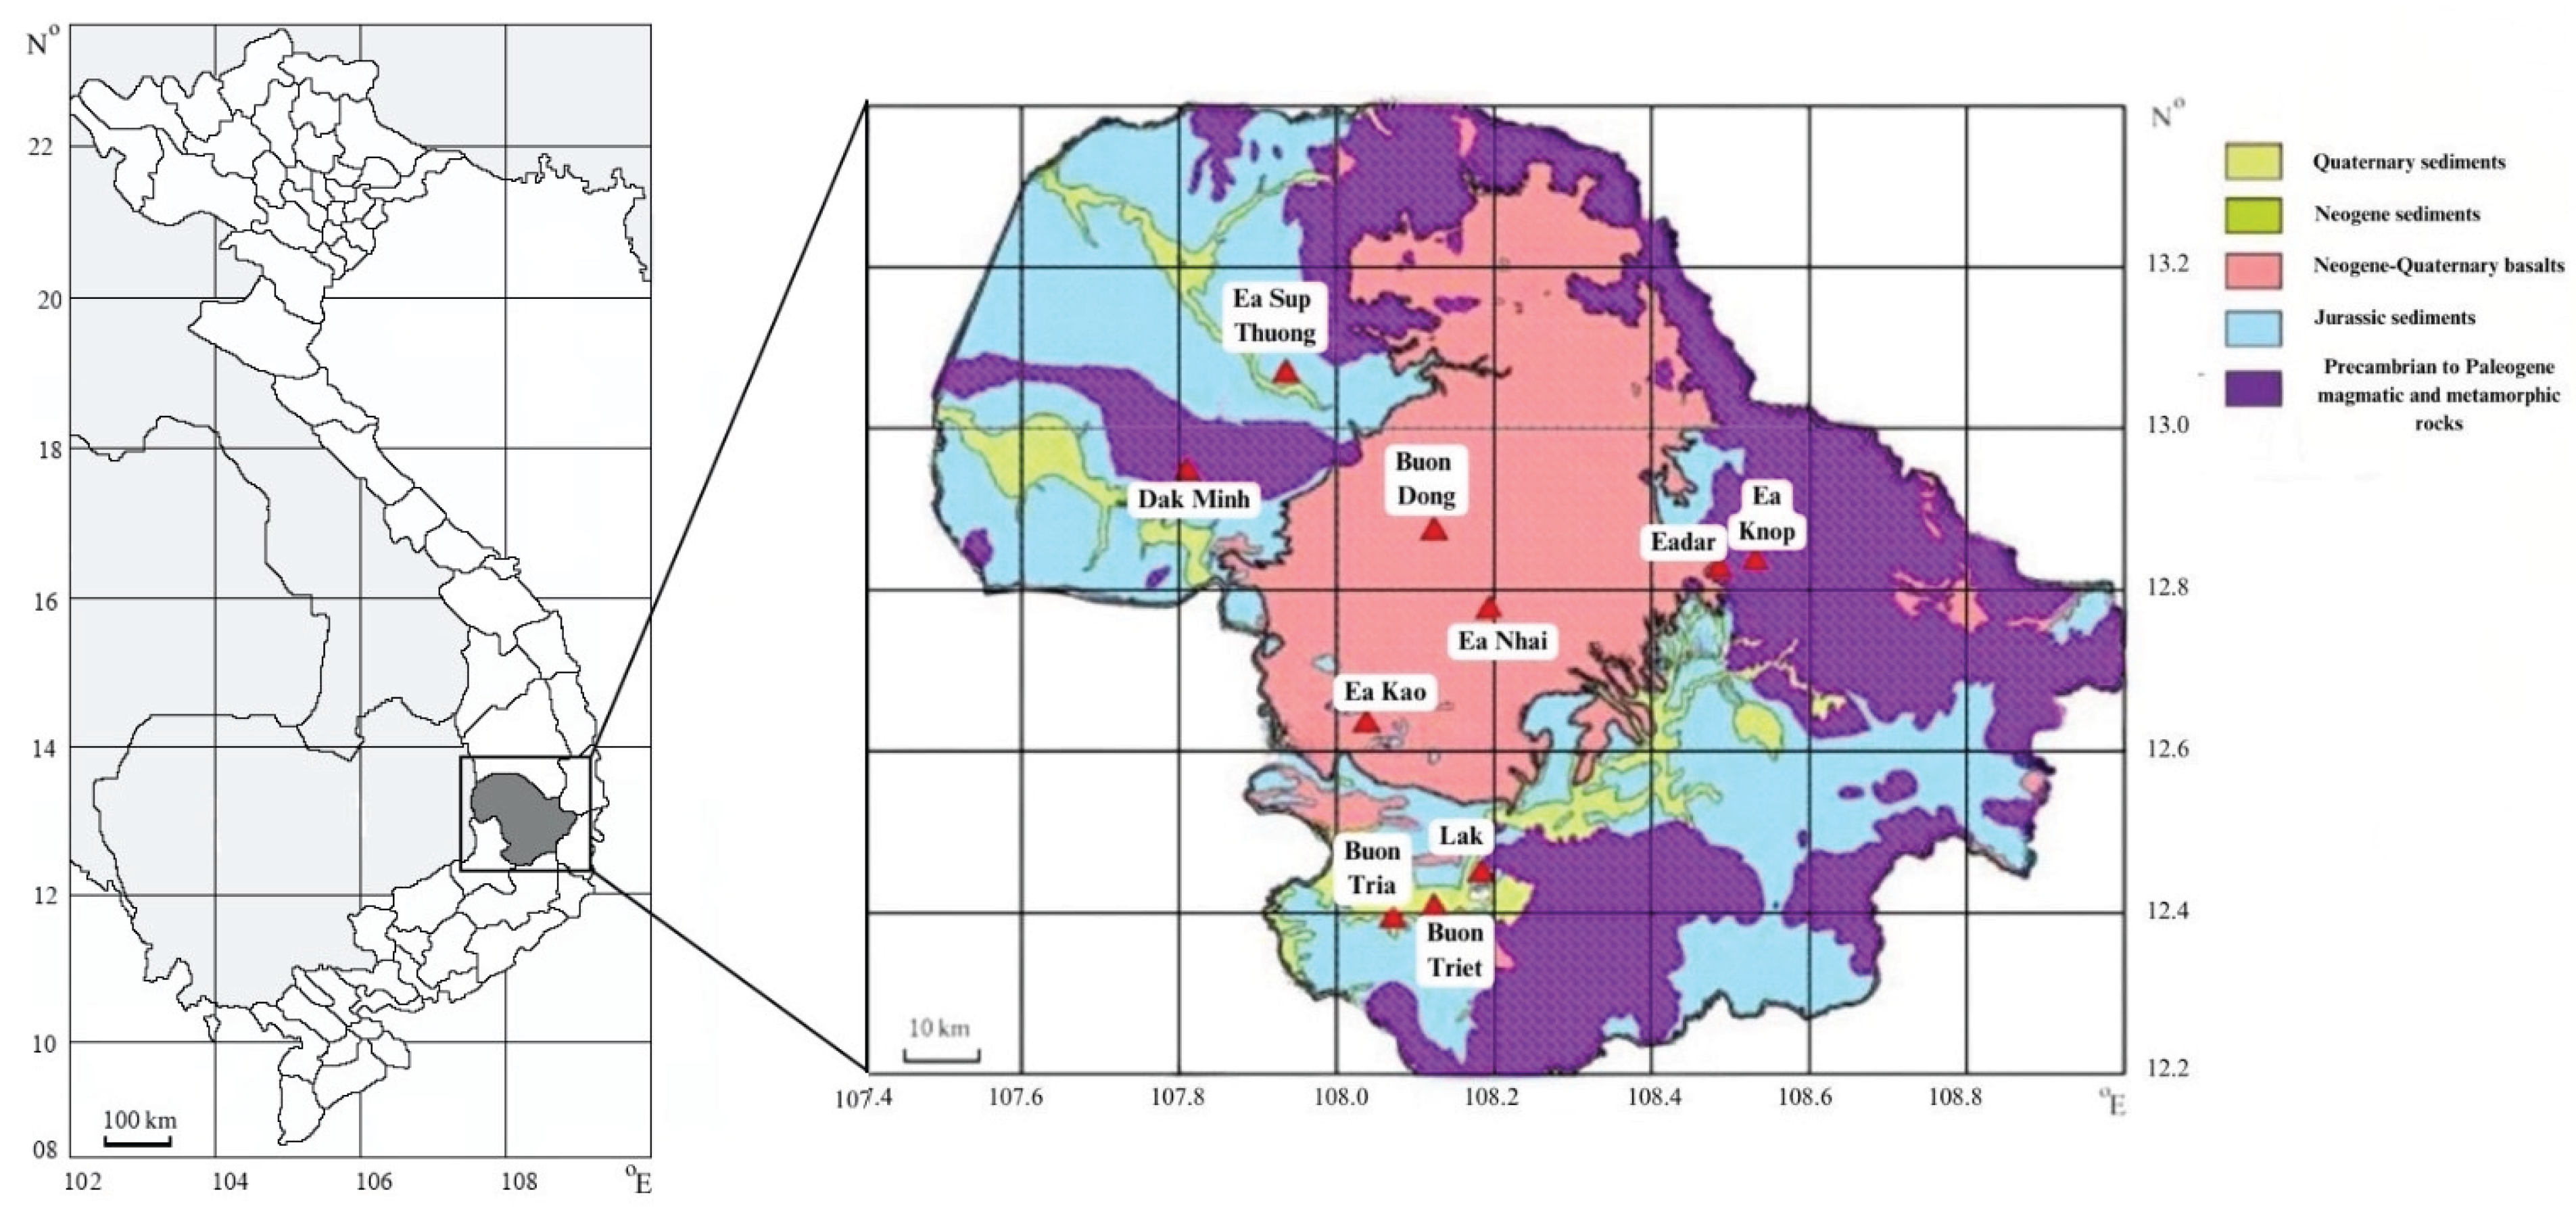
Figure 2.
Cluster dendrogram for bulk element content (a), EFAls (b), and EFFes (c).
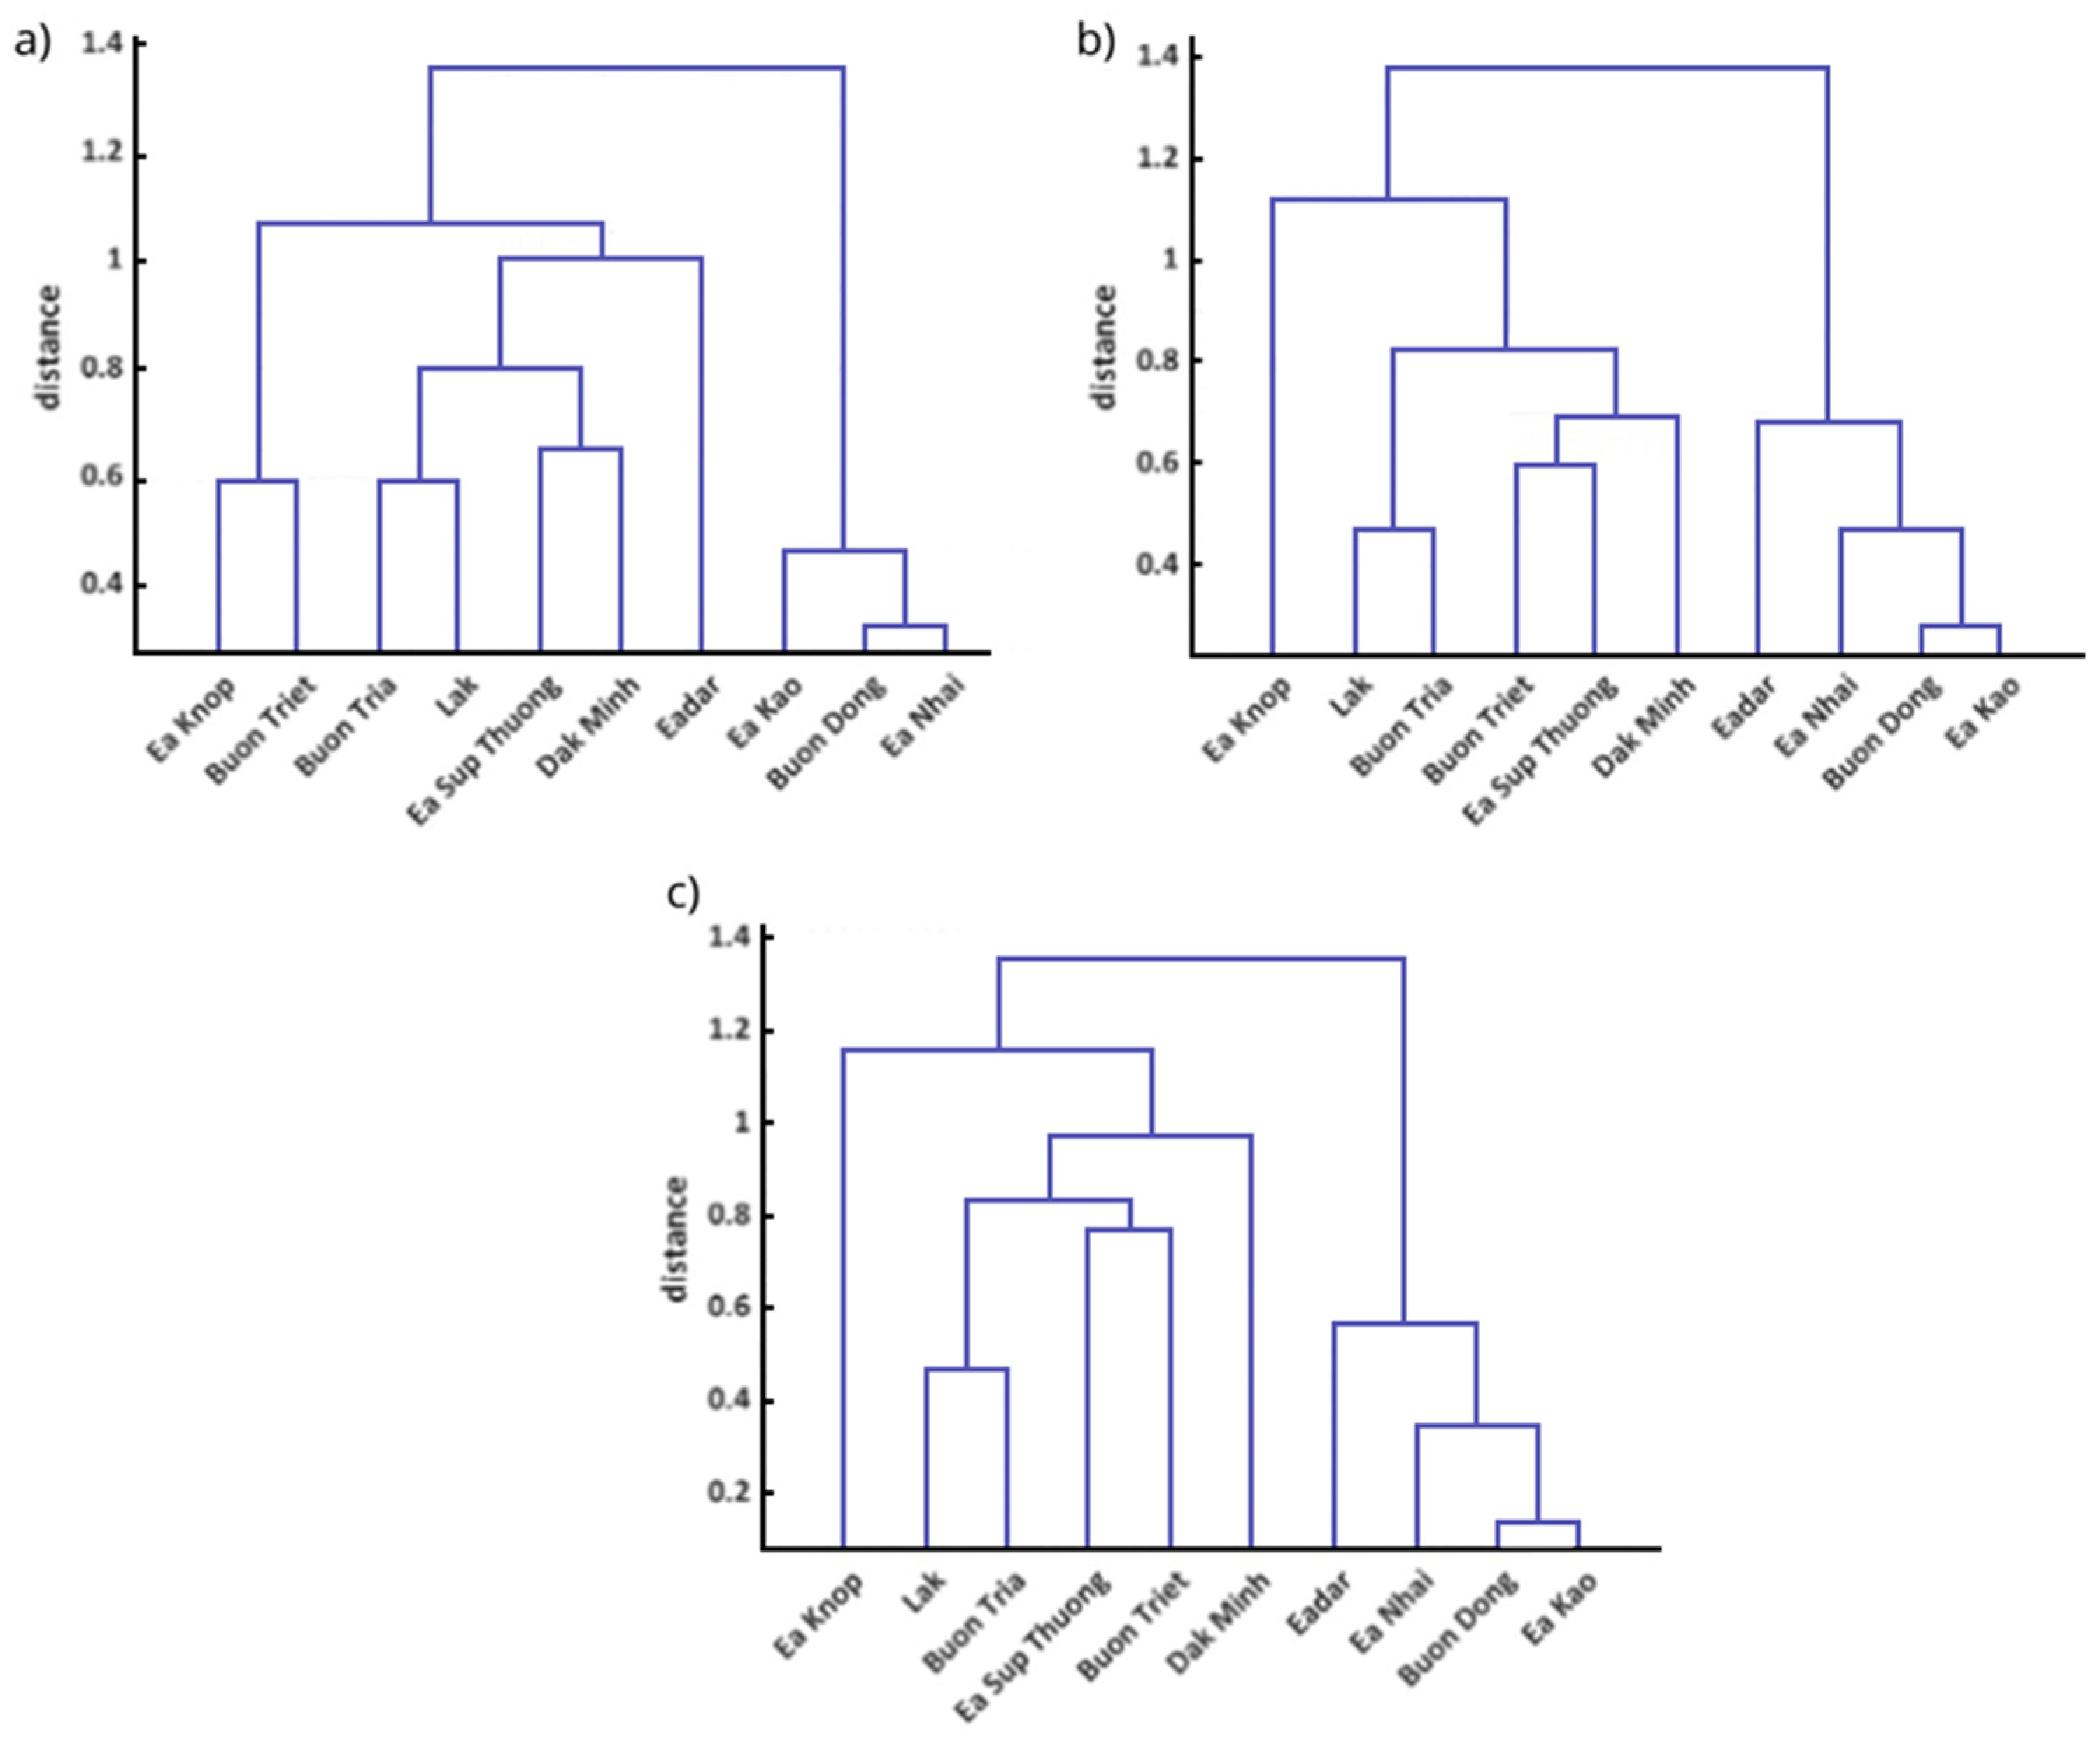
Figure 3.
Pearson correlation matrix for EFFes (r values in black are significant at p=0.05).
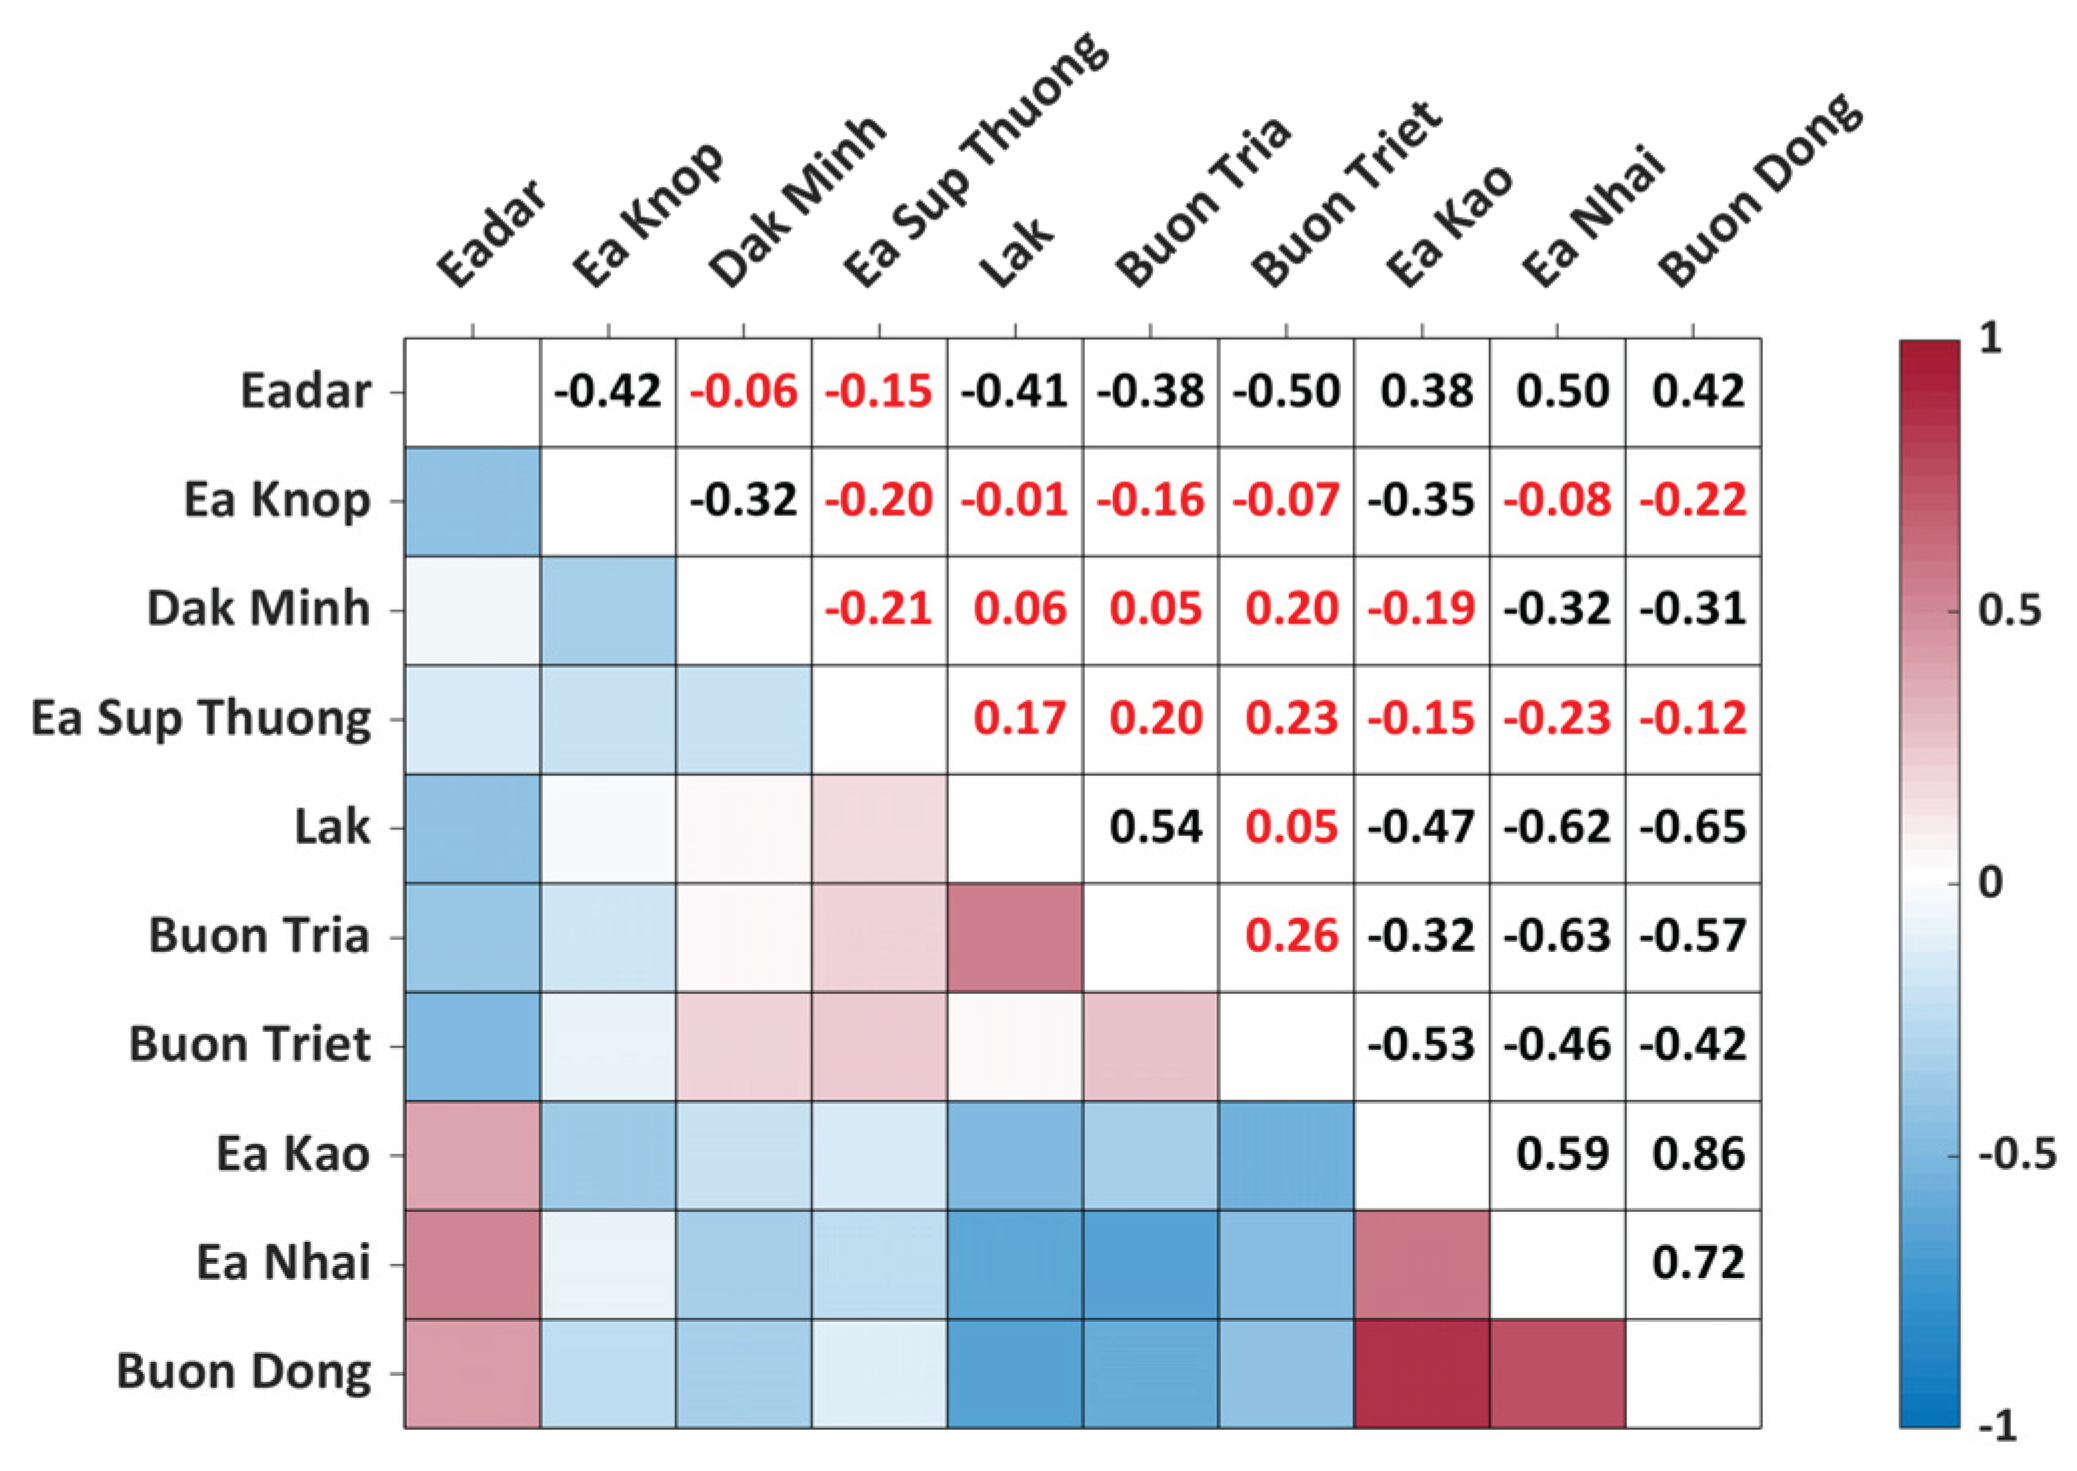
Figure 4.
PCA plots for bulk element content (a), EFAls (b), and EFFes (c). 1 – Eadar, 2 – Ea Knop, 3 – Dak Minh, 4 – Ea Sup Thuong, 5 – Lak, 6 – Buon Tria, 7 – Buon Triet, 8 – Ea Kao, 9 – Ea Nhai, 10 – Buon Dong.
Figure 4.
PCA plots for bulk element content (a), EFAls (b), and EFFes (c). 1 – Eadar, 2 – Ea Knop, 3 – Dak Minh, 4 – Ea Sup Thuong, 5 – Lak, 6 – Buon Tria, 7 – Buon Triet, 8 – Ea Kao, 9 – Ea Nhai, 10 – Buon Dong.
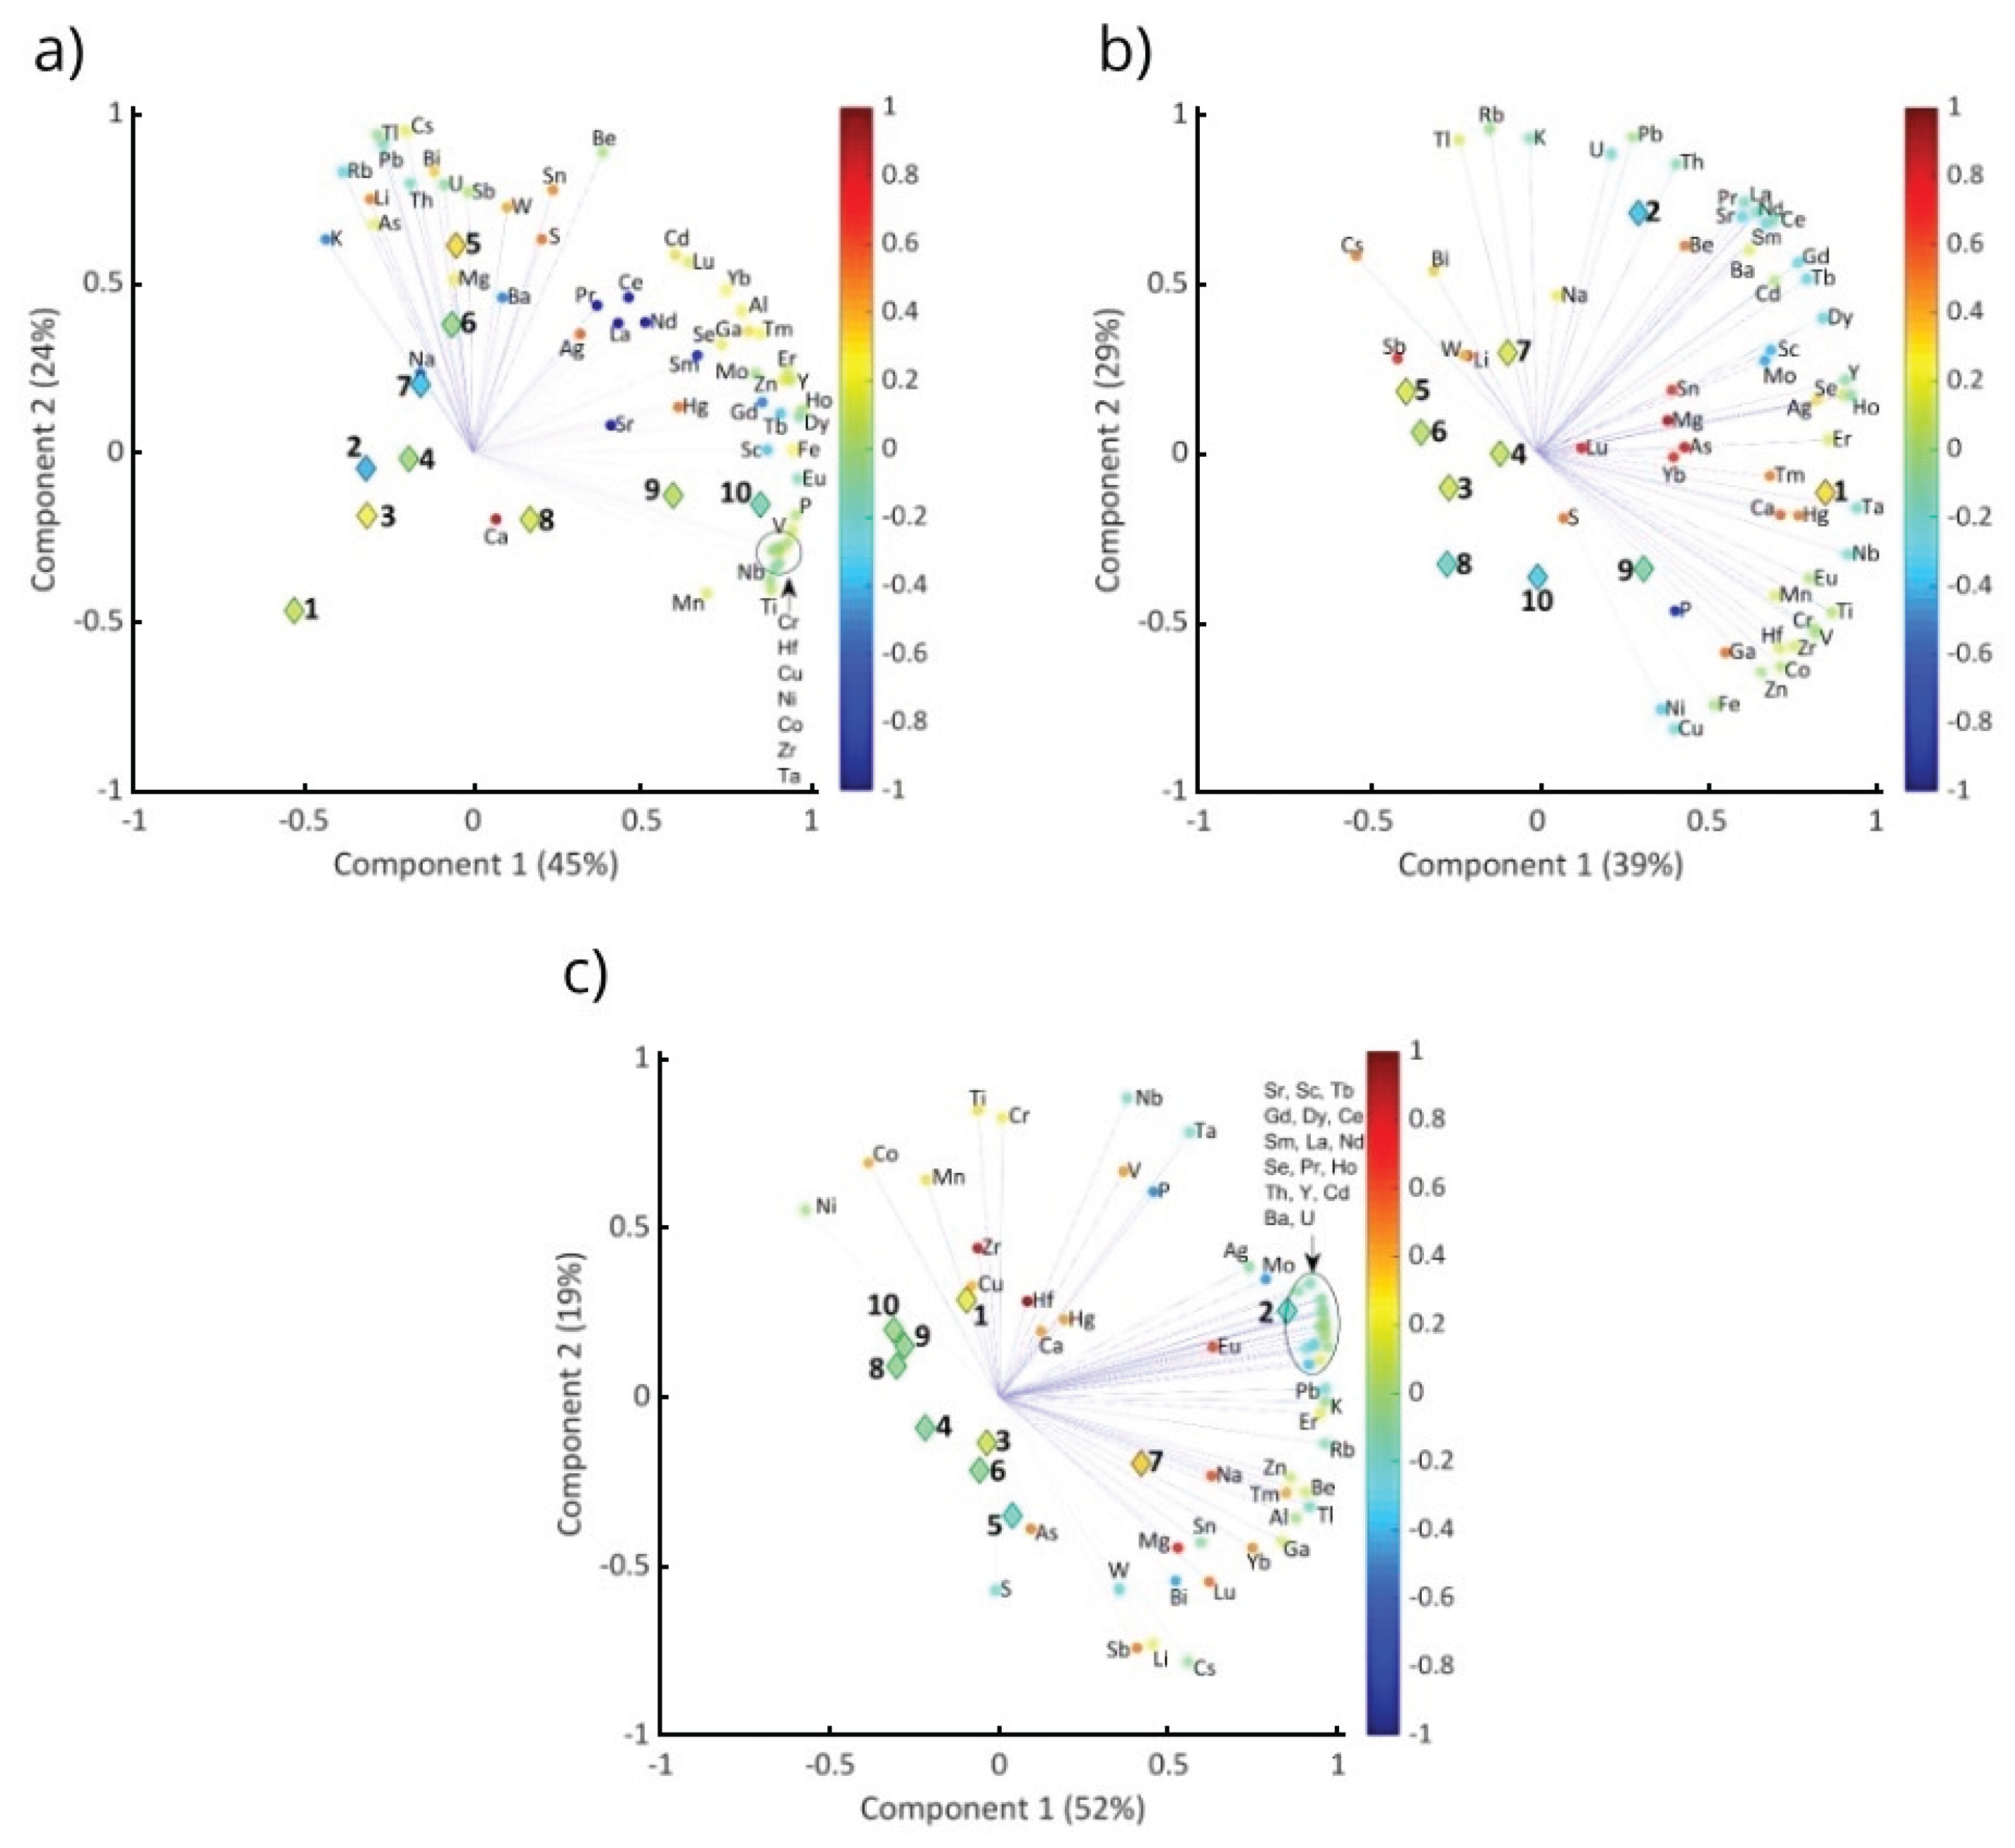
Figure 5.
Bulk REE contents in lake sediments (in μg g−1).
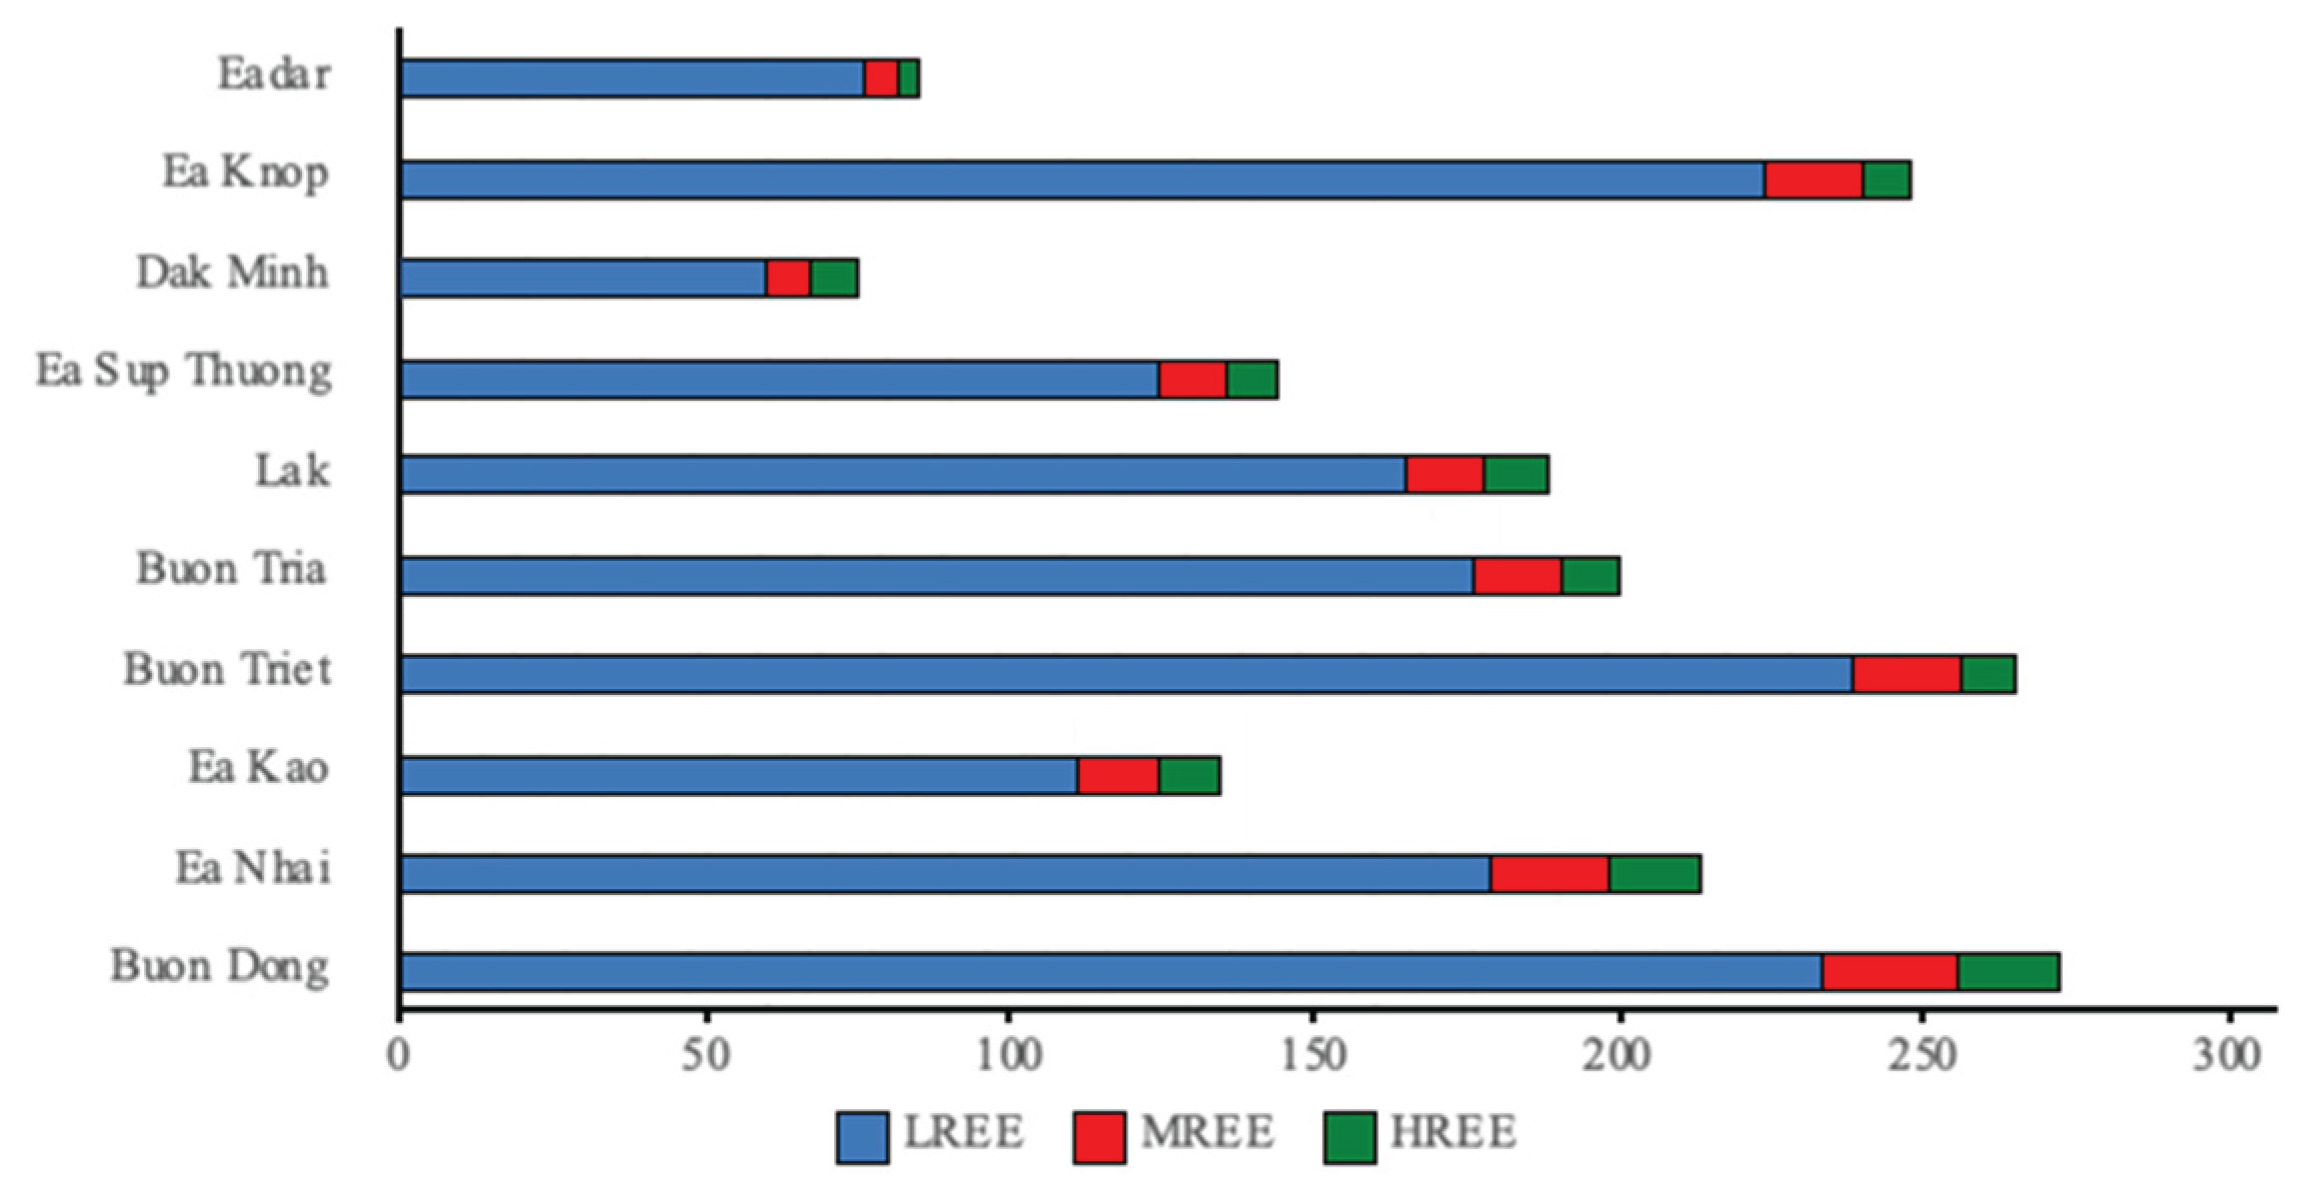
Figure 6.
Pearson correlation matrix for EFFes (r values in black are significant at p=0.05).
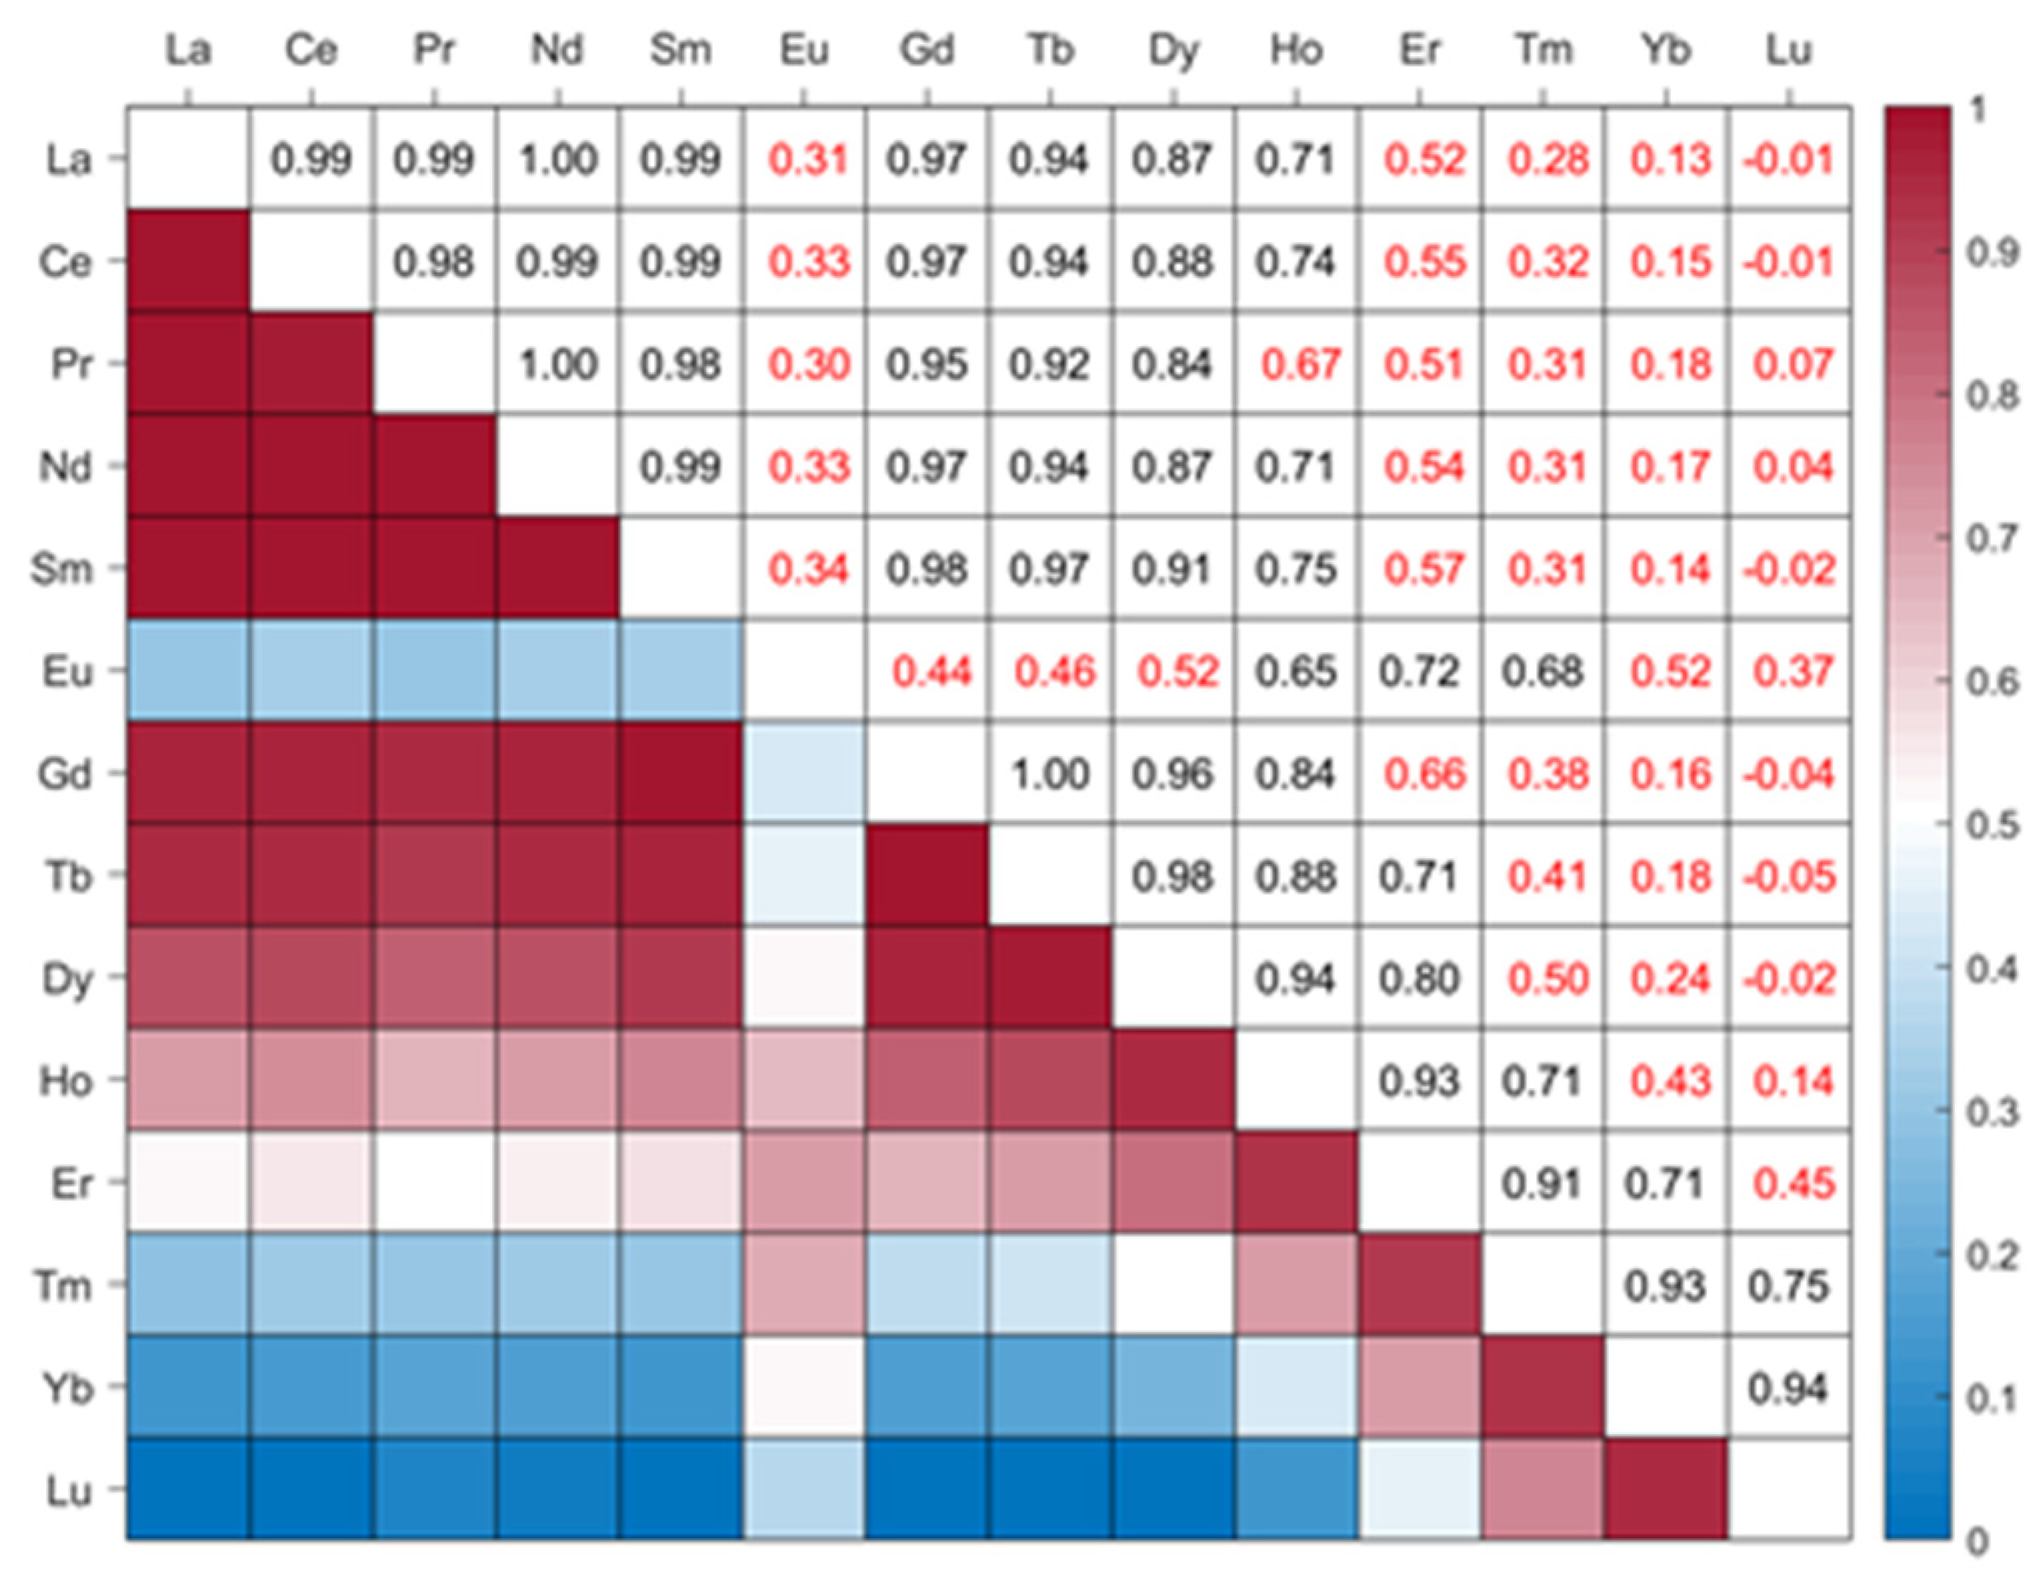
Figure 7.
Standardized REE contents according to NASC.
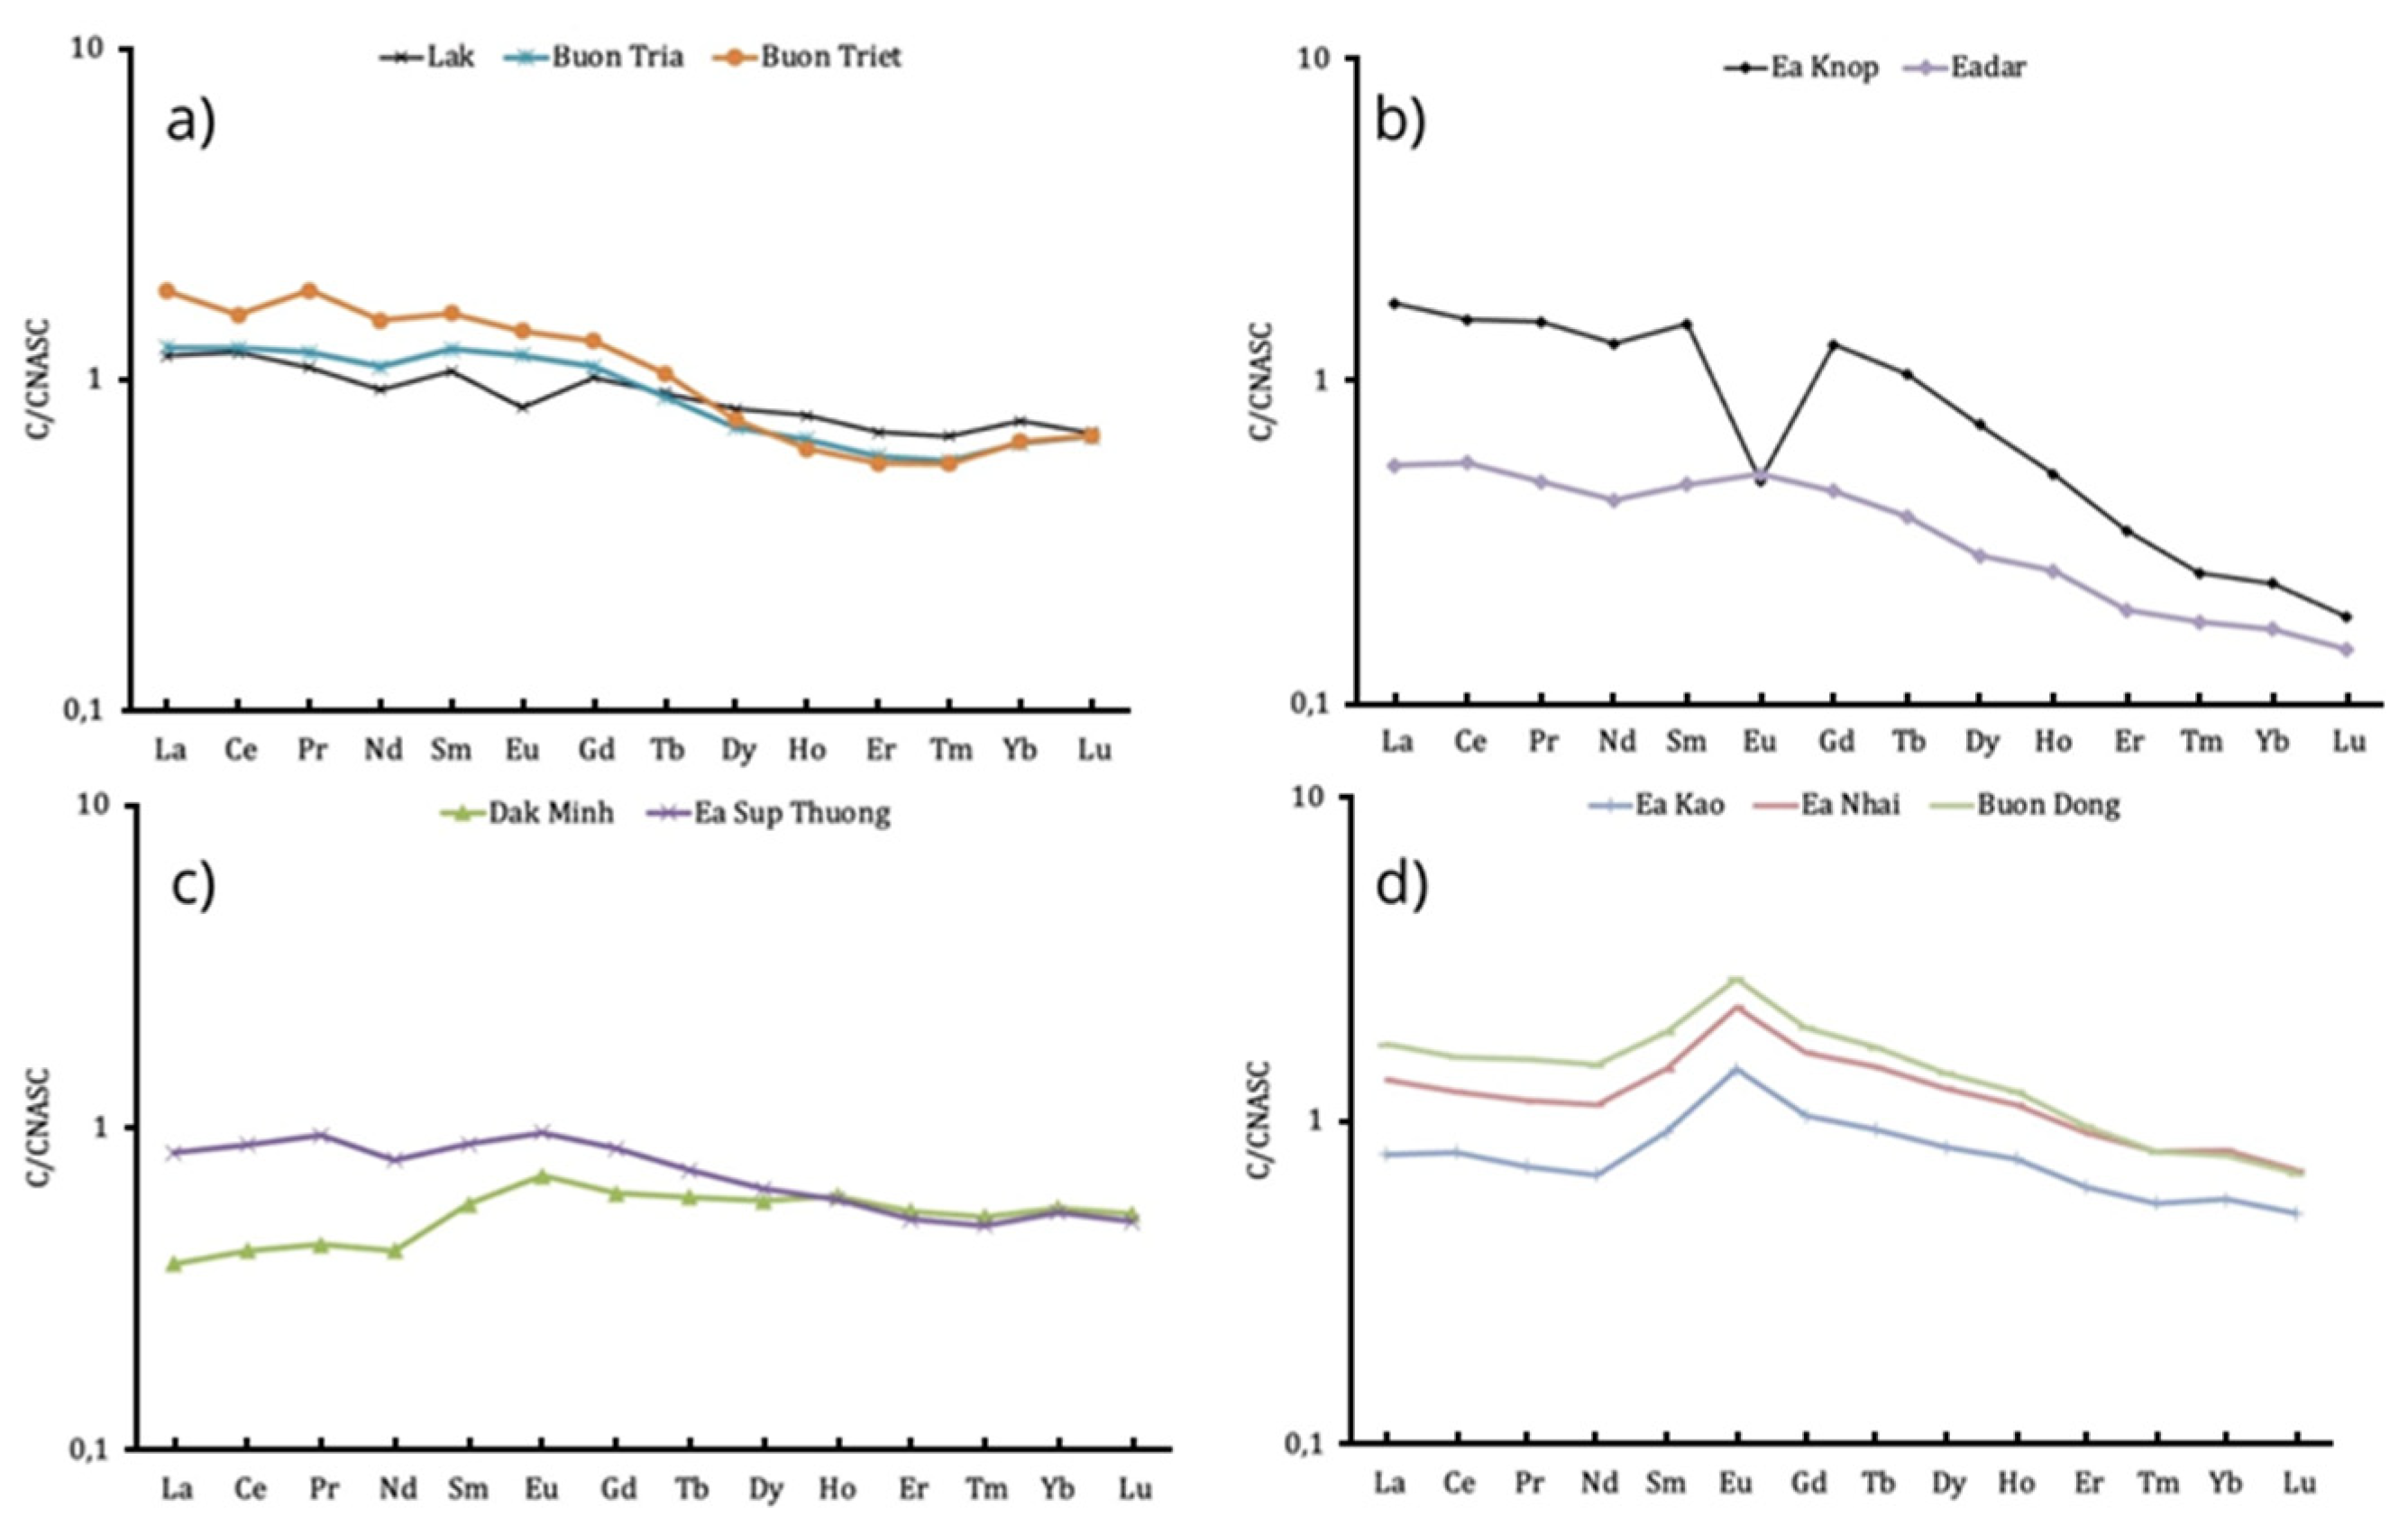

Table 1.
TOC and granulometric fractions of the sediments of the Dak Lak lakes (in % of dw).
| Lake | Year of creation | TOC | Granulometric fractions | |||
| Gravel | Sand | Silt | Clay | |||
| Eadar | 1984 | 1.31 | 4.90 | 83.26 | 11.84 | 0.00 |
| Ea Knop | 1985-1986 | 0.71 | 0.65 | 72.97 | 26.38 | 0.00 |
| Dak Minh | 1981 | 1.92 | 2.19 | 37.17 | 58.02 | 2.62 |
| Ea Sup Thuong | 2000-2005 | 2.35 | 19.37 | 15.53 | 63.22 | 1.88 |
| Lak | Natural lake | 8.41 | 0.00 | 6.80 | 86.11 | 7.10 |
| Buon Tria | 1980 | 4.84 | 0.00 | 0.12 | 97.31 | 2.57 |
| Buon Triet | 1987 | 1.91 | 0.00 | 0.26 | 92.76 | 6.98 |
| Ea Kao | 1976-1986 | 3.05 | 0.00 | 0.72 | 92.62 | 6.66 |
| Ea Nhai | 1988 | 4.99 | 0.00 | 7.01 | 91.86 | 1.13 |
| Buon Dong | 2002-2006 | 1.23 | 0.00 | 1.69 | 96.22 | 2.09 |
Table 2.
Mean bulk element contents and EF values in the sediments of Dak Lak lakes.
| Elements | Mean ± SD | EFAlS | EFFeS | EFAlf | EFFef | Reference values | |
| [33] | [35] | ||||||
| Major elements, in % | |||||||
| Na | 0.12±0.16 | 0.14±0.17 | 0.14±0.22 | 0.09±0.11 | 0.09±0.14 | 0.96 | 0.79 |
| Mg | 0.27±0.12 | 0.18±0.09 | 0.15±0.09 | 0.25±0.13 | 0.21±0.13 | 1.50 | 0.57 |
| Al | 9.20±4.02 | 1.00 | 0.83±0.30 | 1.00 | 0.82±0.30 | 8.00 | 4.30 |
| P | 0.07±0.06 | 0.89±0.44 | 0.67±0.30 | 0.42±0.21 | 0.31±0.14 | 0.07 | 0.08 |
| S | 0.06±0.05 | 0.23±0.14 | 0.18±0.11 | 1.49±0.89 | 1.15±0.73 | 0.24 | 0.02 |
| K | 0.86±0.70 | 0.34±0.32 | 0.35±0.43 | 0.44±0.42 | 0.45±0.55 | 2.66 | 1.10 |
| Ca | 0.13±0.06 | 0.09±0.09 | 0.07±0.05 | 0.05±0.05 | 0.03±0.03 | 1.60 | 1.70 |
| Ti | 0.99±0.91 | 2.14±1.97 | 1.42±0.29 | 1.71±1.57 | 1.12±0.69 | 0.46 | 0.31 |
| Mn | 0.08±0.08 | 0.96±0.99 | 0.65±0.16 | 0.88±0.90 | 0.58±0.44 | 0.09 | 0.05 |
| Fe | 7.38±4.38 | 1.35±0.48 | 1.00 | 1.37±0.49 | 1.00 | 4.72 | 2.50 |
| Trace elements, in μg g−1 | |||||||
| Li | 21.12±14.01 | 0.31±0.16 | 0.26±0.16 | 0.54±0.29 | 0.46±0.28 | 66 | 20 |
| Be | 1.83±0.78 | 0.58±0.19 | 0.49±0.28 | 0.62±0.20 | 0.52±0.30 | 3 | 1.50 |
| Sc | 15.44±9.38 | 1.12±0.55 | 0.93±0.69 | 0.79±0.39 | 0.64±0.48 | 13 | 10 |
| V | 156.79±103.93 | 1.12±0.59 | 0.82±0.24 | 1.56±0.82 | 1.13±0.33 | 130 | 50 |
| Cr | 120.09±92.09 | 1.24±0.83 | 0.86±0.33 | 1.20±0.81 | 0.82±0.32 | 90 | 50 |
| Co | 32.88±26.93 | 1.58±1.11 | 1.08±0.46 | 1.07±0.76 | 0.73±0.31 | 19 | 15 |
| Ni | 89.42±102.84 | 1.04±0.83 | 0.69±0.44 | 1.52±1.22 | 0.99±0.64 | 68 | 25 |
| Cu | 41.71±31.44 | 0.79±0.36 | 0.59±0.20 | 0.96±0.44 | 0.70±0.24 | 45 | 20 |
| Zn | 81.55±40.67 | 0.75±0.13 | 0.59±0.14 | 0.64±0.11 | 0.50±0.12 | 95 | 60 |
| Ga | 22.95±10.09 | 1.06±0.10 | 0.86±0.25 | 1.08±0.11 | 0.87±0.25 | 19 | 10 |
| As | 6.03±4.69 | 0.51±0.52 | 0.39±0.31 | 0.61±0.60 | 0.45±0.36 | 13 | 6 |
| Se | 1.68±0.60 | 2.77±1.07 | 2.24±1.10 | 2.98±1.15 | 2.37±1.17 | 0.60 | 0.30 |
| Rb | 57.98±48.37 | 0.41±0.36 | 0.43±0.47 | 0.62±0.54 | 0.63±0.70 | 140 | 50 |
| Sr | 55.90±23.26 | 0.20±0.15 | 0.19±0.21 | 0.22±0.16 | 0.20±0.23 | 300 | 150 |
| Y | 19.64±7.65 | 0.71±0.20 | 0.59±0.3 | 0.50±0.14 | 0.41±0.20 | 26 | 20 |
| Zr | 139.19±105.92 | 0.81±0.52 | 0.57±0.26 | 0.28±0.18 | 0.19±0.09 | 160 | 250 |
| Nb | 35.15±35.12 | 3.17±2.82 | 2.20±1.75 | 0.94±0.84 | 0.64±0.51 | 11 | 20 |
| Mo | 1.67±1.03 | 0.59±0.30 | 0.49±0.38 | 0.55±0.28 | 0.45±0.35 | 2.60 | 1.50 |
| Ag | 0.09±0.02 | 1.47±1.12 | 1.17±0.85 | 1.10±0.85 | 0.87±0.63 | 0.07 | 0.05 |
| Cd | 0.07±0.02 | 0.24±0.09 | 0.21±0.13 | 0.11±0.04 | 0.08±0.05 | 0.30 | 0.40 |
| Sn | 2.70±1.69 | 0.42±0.20 | 0.35±0.19 | 0.34±0.16 | 0.28±0.15 | 6 | 4 |
| Sb | 0.57±0.35 | 0.34±0.19 | 0.30±0.22 | 0.14±0.08 | 0.12±0.09 | 1.50 | 2 |
| Cs | 4.22±4.45 | 0.72±0.59 | 0.69±0.63 | 0.49±0.39 | 0.46±0.42 | 5 | 4 |
| Ba | 356.16±123.16 | 0.64±0.32 | 0.57±0.43 | 0.69±0.35 | 0.60±0.45 | 580 | 290 |
| Hf | 3.38±2.33 | 1.11±0.59 | 0.81±0.32 | 0.28±0.15 | 0.20±0.08 | 2.80 | 6 |
| Ta | 1.94±1.66 | 2.44±1.93 | 1.79±1.43 | 0.52±0.41 | 0.38±0.30 | 0.80 | 2 |
| W | 1.82±2.13 | 0.85±0.70 | 0.74±0.74 | 0.16±0.14 | 0.14±0.14 | 1.80 | 5 |
| Hg | 0.04±0.02 | 0.10±0.09 | 0.08±0.04 | 0.45±0.40 | 0.32±0.19 | 0.40 | 0.05 |
| Tl | 0.43±0.37 | 0.29±0.21 | 0.29±0.26 | 0.22±0.15 | 0.21±0.20 | 1.40 | 1 |
| Pb | 25.51±17.24 | 1.34±0.98 | 1.29±1.37 | 0.96±0.71 | 0.91±0.97 | 20 | 15 |
| Bi | 0.33±0.45 | 0.65±0.64 | 0.61±0.68 | 0.76±0.75 | 0.70±0.77 | 0.43 | 0.20 |
| Th | 14.39±9.59 | 1.31±1.09 | 1.25±1.49 | 0.84±0.71 | 0.80±0.95 | 12 | 10 |
| U | 3.40±2.63 | 0.94±0.81 | 0.93±1.15 | 0.62±0.54 | 0.60±0.75 | 3.70 | 3 |
| Rare earth elements, in μg g−1 | |||||||
| La | 37.20±16.52 | 0.43±0.3 | 0.39±0.42 | 0.56±0.39 | 0.51±0.54 | 92 | 38 |
| Ce | 80.52±30.73 | 1.46±0.93 | 1.31±1.29 | 0.62±0.39 | 0.54±0.54 | 59 | 75 |
| Pr | 8.67±3.69 | 1.64±1.06 | 1.50±1.52 | 0.62±0.40 | 0.56±0.56 | 5.6 | 8 |
| Nd | 32.21±13.13 | 1.41±0.85 | 1.27±1.23 | 0.61±0.36 | 0.54±0.52 | 24 | 30 |
| Sm | 6.59±2.57 | 1.06±0.60 | 0.95±0.89 | 0.61±0.34 | 0.53±0.50 | 6.40 | 6 |
| Eu | 1.55±0.92 | 1.42±0.57 | 1.10±0.45 | 0.51±0.21 | 0.39±0.16 | 1 | 1.50 |
| Gd | 5.85±2.30 | 0.92±0.45 | 0.80±0.66 | 0.53±0.26 | 0.45±0.38 | 6.40 | 6 |
| Tb | 0.83±0.32 | 0.82±0.37 | 0.70±0.55 | 0.44±0.20 | 0.37±0.29 | 1 | 1 |
| Dy | 4.18±1.66 | 0.87±0.31 | 0.74±0.48 | 0.43±0.15 | 0.36±0.23 | 4.60 | 5 |
| Ho | 0.74±0.29 | 0.59±0.16 | 0.48±0.24 | 0.38±0.10 | 0.31±0.15 | 1.20 | 1 |
| Er | 2.02±0.79 | 0.75±0.16 | 0.61±0.25 | 0.33±0.07 | 0.27±0.11 | 2.50 | 3 |
| Tm | 0.27±0.10 | 1.25±0.26 | 1.02±0.39 | 0.27±0.06 | 0.22±0.08 | 0.20 | 0.50 |
| Yb | 1.77±0.67 | 0.62±0.13 | 0.51±0.22 | 0.29±0.06 | 0.24±0.10 | 2.60 | 3 |
| Lu | 0.26±0.10 | 0.33±0.08 | 0.28±0.13 | 0.31±0.08 | 0.26±0.12 | 0.70 | 0.40 |
Disclaimer/Publisher’s Note: The statements, opinions and data contained in all publications are solely those of the individual author(s) and contributor(s) and not of MDPI and/or the editor(s). MDPI and/or the editor(s) disclaim responsibility for any injury to people or property resulting from any ideas, methods, instructions or products referred to in the content. |
© 2025 by the authors. Licensee MDPI, Basel, Switzerland. This article is an open access article distributed under the terms and conditions of the Creative Commons Attribution (CC BY) license (http://creativecommons.org/licenses/by/4.0/).
Copyright: This open access article is published under a Creative Commons CC BY 4.0 license, which permit the free download, distribution, and reuse, provided that the author and preprint are cited in any reuse.


