
Submitted:
21 February 2025
Posted:
24 February 2025
You are already at the latest version
Abstract
This study examines speleothems, sediments, rock, and water to assess geochemical and mineralogical processes in deep karst systems. Focusing on Slovačka jama cave (-1,320 m deep) and the Velebita cave system (-1,026 m deep), we identify elemental and mineralogical anomalies that provide valuable records of element transport, mineral formation, and paleoenvironmental changes. Heavy metal anomalies at 300–400 m of depth in Slovačka jama indicate a complex interplay of geological conditions, geomor-phological processes, atmospheric deposition, and potential anthropogenic influences. Factor analysis reveals two elemental associations: (1) Fe, Pb, Cu, and Zn, linked to ter-rigenous aluminosilicates, and (2) Cd, Cr, Mo, and Ni, suggesting airborne or geological sources. Mineralogical analysis confirms the dominance of calcite, with quartz, clay minerals, feldspars, magnetite, and goethite also detected. High magnetic susceptibility values in sediment-rich samples suggest Fe-rich mineral inputs from weathering, biogenic activity, or industrial sources. Ba anomalies in feldspar-rich samples and Sr accumulation at depth indicate distinct geochemical processes. These findings enhance our understanding of deep karst geochemistry, crucial for paleoenvironmental reconstructions and groundwater protection.
Keywords:
Dinaric karst
; deep caves
; geochemistry
; mineralogy
; magnetic susceptibility
1. Introduction
The Croatian karst is primarily situated in the Dinaric karst, globally recognized as the locus typicus of Classical Karst, with a smaller portion extending into isolated karst areas of the Pannonian Basin [1]. Karst landscapes are among the most complex and hydrologically dynamic environments on Earth, characterized by high permeability, rapid water flow, and intricate interactions between surface and underground processes [2,3]. Despite its significance, the geochemistry and mineralogy of Croatian caves remained largely unexplored until recent years.
To address this research gap, a study was launched in 2016 with the aim of identifying speleothem proxies suitable for paleoenvironmental reconstructions [4]. The primary focus was to analyze the elemental composition and mineralogy of speleothems from various Croatian karst sites and assess how distinct climatic, geological, geomorphological and hydrological conditions influence their characteristics. A total of 37 speleothem samples from 32 caves across different geomorphological and climatic zones were analyzed. The elemental composition of 30 elements was determined using ICP-MS, while mineral phases—including calcite, quartz, dolomite, muscovite/illite, chlorite, and plagioclase—were identified via XRD. Among the most abundant elements, in addition to calcium, those exceeding 500 mg/kg included Al, Fe, Si, and Mg. Statistical analysis using boxplot methods revealed significant anomalies in the deep caves of Northern Velebit, particularly in Lukina jama, where extreme values were recorded for Pb, Cu, Zn, Mn, Ni, Cr, Co, Ba, K, Mg, Li, Be, Al, U, Si, Ti, W, Fe, and As. These findings align with previous studies indicating that deep karst environments often record significant geochemical anomalies due to their complex hydrological and tectonic histories [4,5].
Given that the most pronounced anomalies were identified in the deep caves of Velebit Mountain, a new study was initiated to investigate geochemical and mineralogical variations at depths of up to 1,320 m in Slovačka jama cave and 1,026 m in the Velebita cave system. These caves are located within a geologically complex karst terrain shaped by intensive tectonics, particularly during the Neotectonic period, which, in conjunction with prolonged karstification, has resulted in intricate subsurface structures (Figure 1). Recent research suggests that such deep cave environments provide valuable records of past climatic and geochemical conditions, making them critical sites for paleoenvironmental studies [6,7].
The study of karst systems is not only important for understanding past environmental changes but also has direct implications for water resource management. Karst aquifers are highly vulnerable to contamination due to their rapid recharge and direct connectivity between surface and groundwater systems [8]. It is estimated that approximately 25% of the world’s population relies on groundwater extracted from karst aquifers [9]. Understanding the hydrogeochemical dynamics of these systems is particularly challenging due to their extreme heterogeneity [10,11]. Investigations in deep caves offer a unique opportunity for in situ sampling, measuring and analyses of karst processes in deep karst (>1.000 m), shedding light on the mechanisms controlling element mobility, mineral formation, and potential anthropogenic impacts [12] influencing epiphreatic and phreatic zone important for regional aquifer characteristics.
In our study, we expand upon previous research by analyzing multiple sampling media—including speleothems, cave clastic sediments, and water chemistry—to assess their geochemical and mineralogical properties and identify potential interactions. Such multi-proxy approaches remain relatively rare in karst research, particularly concerning cave sediments and water chemistry. However, several relevant studies provide useful comparisons. For instance, Rozkowski et al. [13] examined the migration and concentration of heavy metals in infiltration waters within a carbonate massif, linking these variations to both natural mobility and anthropogenic influences. Similarly, Pons-Branchu et al. [14] utilized urban speleothems to reconstruct heavy metal pollution histories in shallow groundwater systems, demonstrating how speleothem chemistry can serve as a long-term record of environmental changes. Other studies have explored the role of cave sediments and particulate matter in element transport, with Allan et al. [15] analyzing lead concentrations and isotopic compositions in Belgian caves to distinguish between anthropogenic and natural sources. More recently, Xu and Zeng [16,17] investigated heavy metal contamination in cave water and suspended particulate matter, respectively, underscoring the importance of geochemical monitoring in karst systems.
The primary aim of this study is to systematically investigate geochemical and mineralogical variations in deep karst cave environments, assess the potential interactions between different sampling media, and evaluate their implications for paleoenvironmental reconstructions and pollution monitoring.
2. Materials and Methods
2.1. Sample Preparation and Analysis
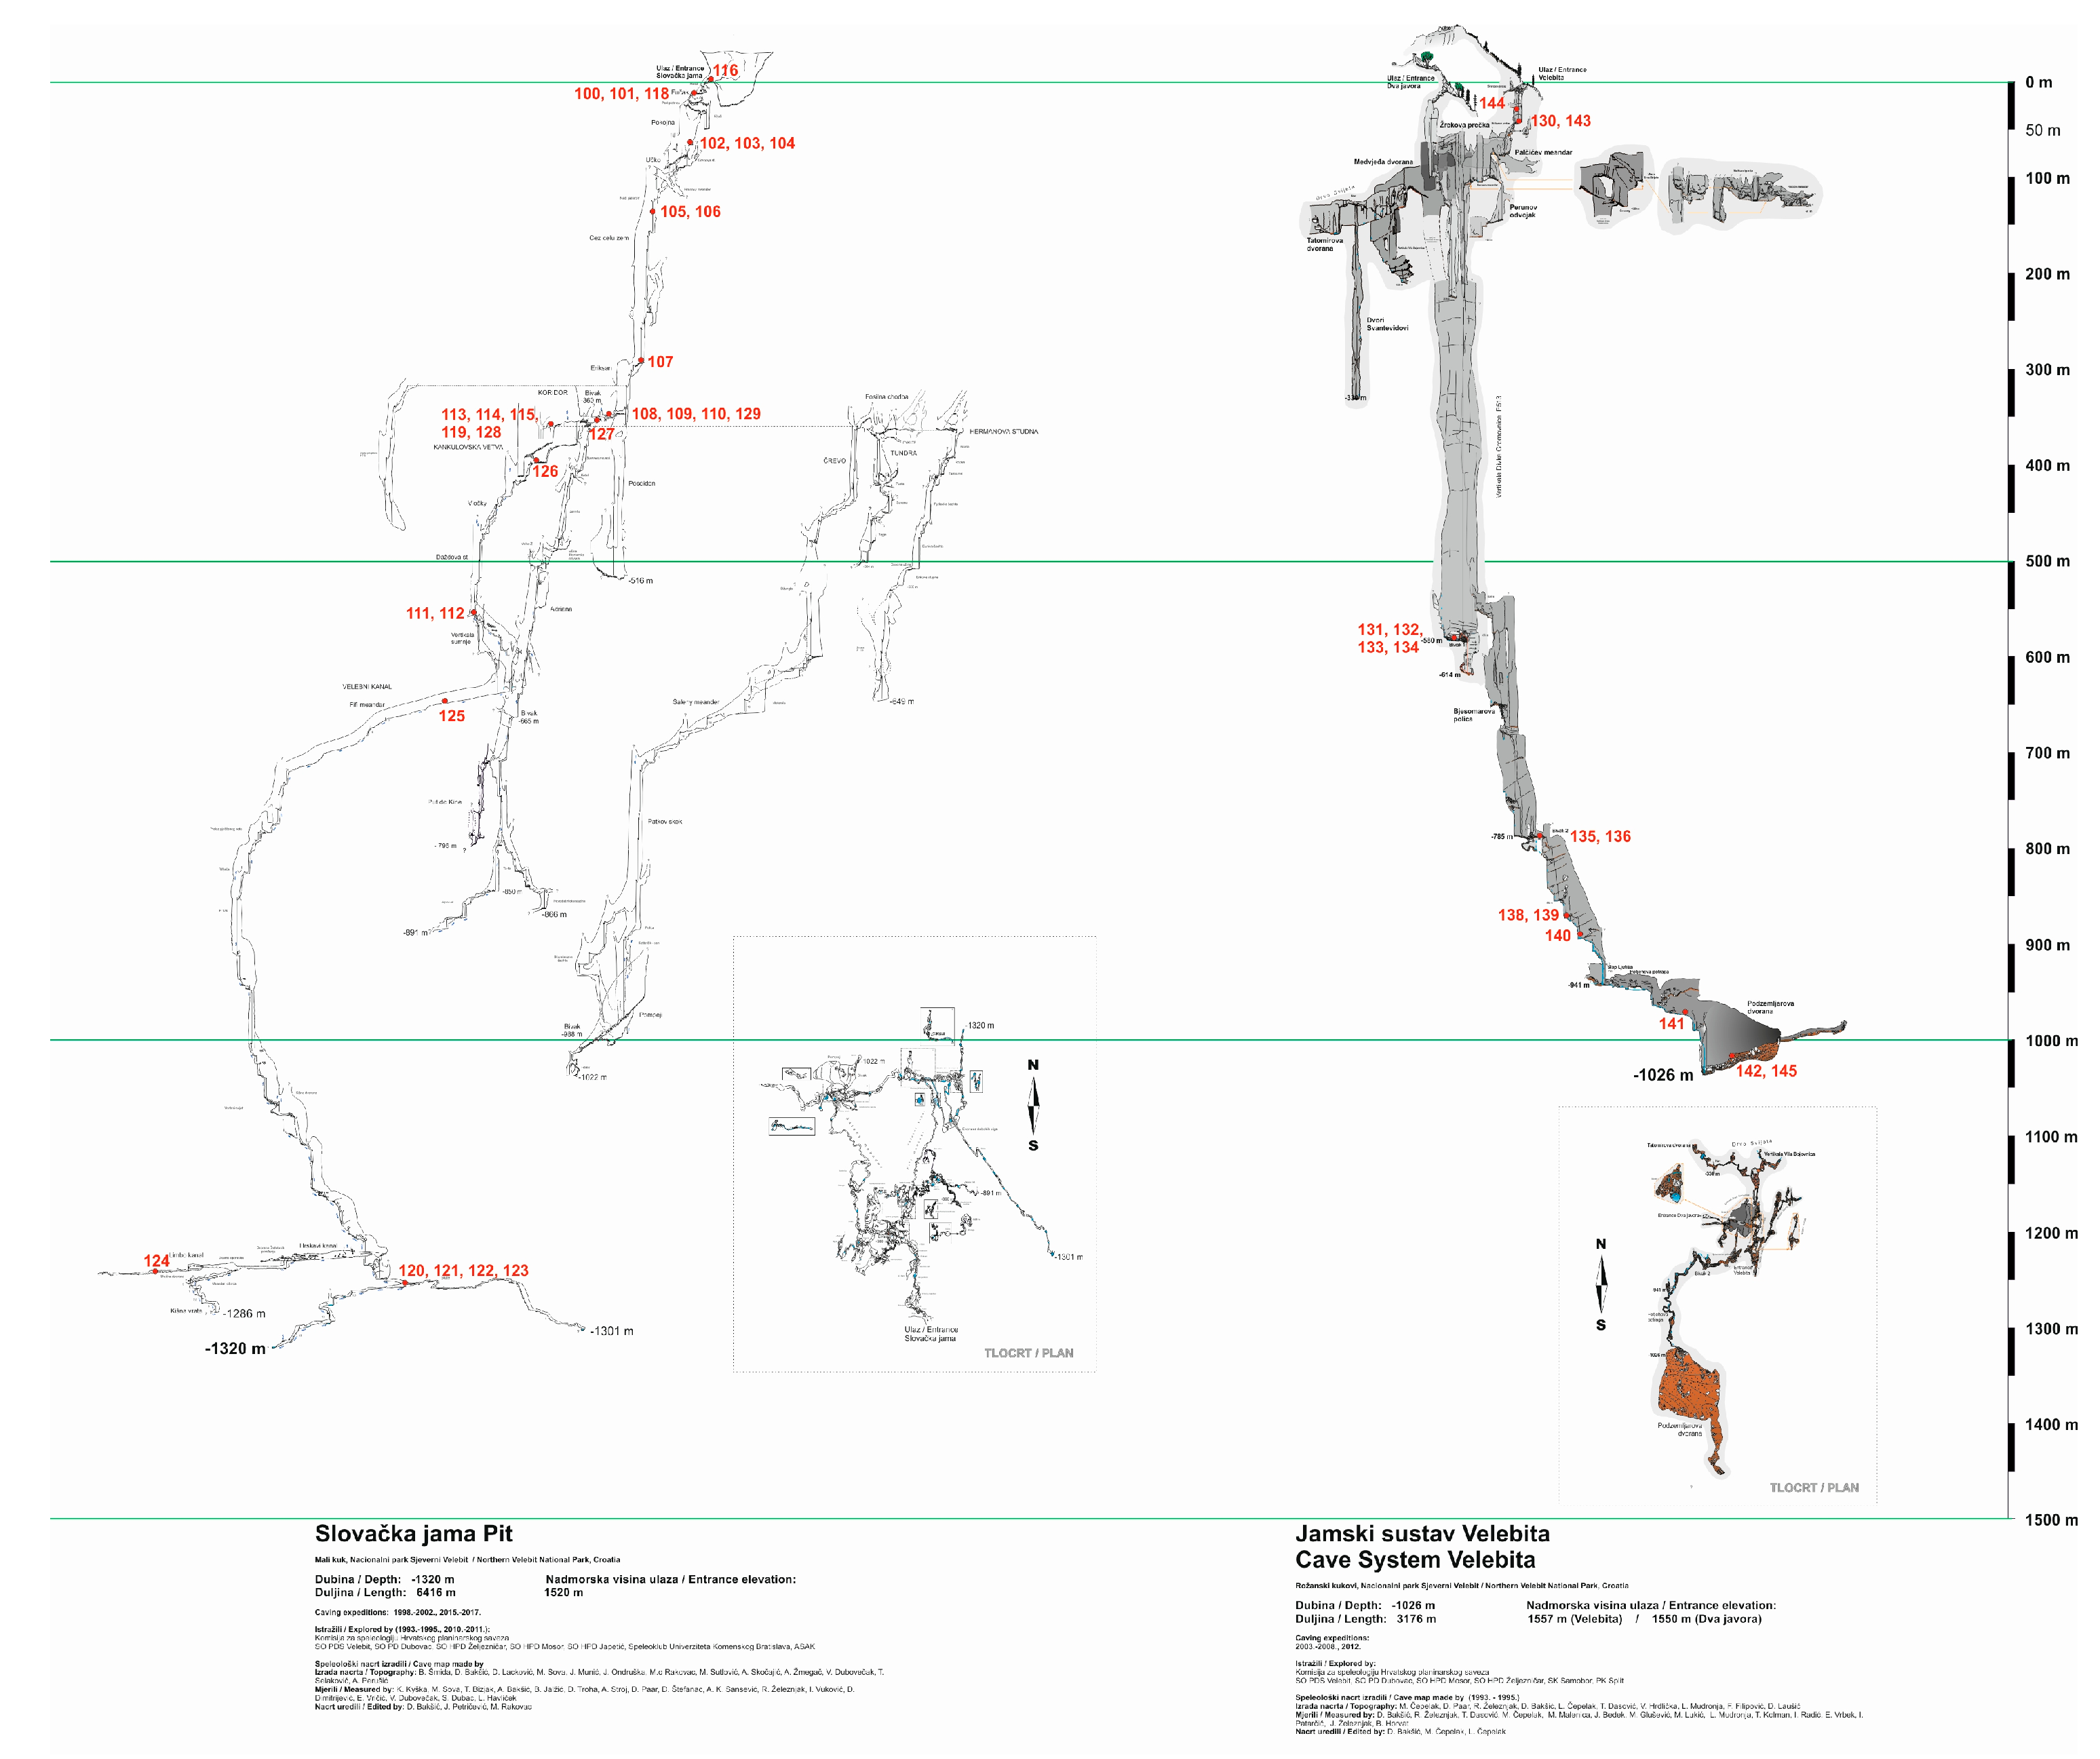
Speleothems for this study were collected with minimal disturbance to the cave environment, ensuring that natural formations remained intact. The sampling locations in the Velebita cave system and Slovačka jama cave are shown in Figure 2. Samples were collected from sites where carbonate precipitation and karst drainage networks facilitate speleothem growth [18,19,20,21]. These locations were carefully selected to ensure representative data on geochemical and mineralogical processes within the deep karst environment.
Samples were carefully handled to prevent contamination, washed with distilled water, air-dried, and then homogenized using a Retsch RM 200 mortar grinder. Whole speleothems were crushed to obtain representative powders incorporating all growth layers. From these, 1 g of material was used for ICP-MS and XRD analysis.
For elemental analysis, 0.1 g of powdered sample was digested in a mixture of suprapur nitric and puriss hydrochloric acid, heated in an Anton Paar Multiwave 3000 Oven following ISO 11466 standards. ICP-MS (Elan 9000, Perkin Elmer) was used to determine elemental concentrations, employing internal standards (Ge, Rh, In, Re) according to ISO 17294-1 and ISO 17294-2. Precision (RSD) was within 10%, and accuracy was verified using reference material (RTC CNS392-050), with results aligning within 15% of certified values. Only two samples (ZSDV-64, ZSDV-70) had values below the quantification limit for Tl (5.4%).
Mineralogical composition was identified using X-ray diffraction (XRD) with a Philips X-Pert MPD diffractometer, analyzed via Powder Diffraction File (1997) and X’Pert HighScore software. Semi-quantitative mineralogy followed [22].
Magnetic susceptibility (MS) was measured using an SM30 (ZH Instruments) susceptibility meter, capable of detecting low-magnetic and diamagnetic materials such as limestone and quartz. Measurements were performed three times per sample, with the mean value recorded to ensure accuracy.
2.2. Statistical Analysis
Statistical analyses were conducted using Statistica 6.0 [23] and included:
a) Descriptive Statistics: Basic parameters (mean, median, standard deviation, skewness, kurtosis) were calculated to summarize the dataset. Pearson’s correlation coefficients were determined to assess relationships between elements (p < 0.05).
b) Boxplot Analysis: Used to identify anomalies in sediment samples based on interquartile range, with outliers and extreme values defined according to Tukey [24] and Reimann et al. [25].
c) Cluster Analysis (Q-mode): Performed to group similar samples using a hierarchical method, distinguishing sample clusters rather than elemental correlations [26].
3. Results and Discussion
3.1. Mineralogical Analysis Using X-Ray Diffraction
Mineralogical analysis using X-ray diffraction (XRD) identified 10 minerals across the samples: carbonates (calcite, dolomite), silicates (quartz, clay minerals—kaolinite, muscovite, chlorite, montmorillonite, and feldspar—plagioclase), spinels (magnetite), and oxihydroxides (goethite). This method is qualitative, with a detection limit of ~5%.
As expected, calcite was present in all samples due to the karstic environment, where speleothems form by limestone dissolution and carbonate precipitation (Table A1). Dolomite appeared in only three rock samples from Slovačka jama (ZSDV-118, ZSDV-122, ZSDV-123), suggesting localized geochemical variations. In eight samples, only calcite was detected (e.g., ZSDV-101, ZSDV-111, ZSDV-113).
Quartz, the second most abundant mineral, was found in 36 of 45 samples, likely originating from fine-grained clastic sediments introduced into the cave system [4]. Similar findings were reported in karstic river sediments [29].
Among clay minerals, muscovite and chlorite were most common, followed by kaolinite and montmorillonite. Samples containing at least two clay minerals (e.g., ZSDV-105, ZSDV-107, ZSDV-110) often coincided with geochemical anomalies and high magnetic susceptibility (MS). Notably, ZSDV-105 and ZSDV-107, from the same vertical channel of Slovačka jama, displayed strong similarities despite a 145 m elevation difference.
Feldspars (plagioclase) were detected in only four samples (ZSDV-112, ZSDV-126, ZSDV-130, ZSDV-133), all from channel-bottom sediments in Slovačka jama and Velebita cave system. Among Fe-bearing minerals, magnetite and goethite were identified in samples from Slovačka jama, with ZSDV-110 being the only one containing both. These minerals may indicate past hydrothermal influences or iron mobilization within the cave system.
The relationships between mineralogical composition, ICP-MS element concentrations, and magnetic susceptibility will be further explored in the discussion.
3.2. ICP-MS Analysis, Magnetic Susceptibility, and Elemental Anomalies
ICP-MS analysis results for speleothems and water samples are presented in Table A2 and Table A3. While elemental concentrations in speleothems will be statistically analyzed in later sections, water sample data were not statistically evaluated due to the limited number of results (n = 3).
Magnetic susceptibility (MS) values, expressed in 10⁻³ SI units, range from 0.000 to 0.168, with the highest value recorded in ZSDV-107 (Table A9). MS variations will be discussed in relation to elemental composition in later sections.
Elemental anomalies identified using the boxplot statistical method (Table A4) indicate that ZSDV-107 has the highest number of anomalies, followed by ZSDV-127. Outliers and extremes were observed for multiple elements, suggesting localized geochemical or environmental influences. These patterns will be further explored in the discussion.
3.3. Q-Modality Cluster Analysis
Q-mode cluster analysis results are presented in Table A5 and Table A6. Three clusters were identified:
- Cluster 1 (Deepest, avg. depth 664.25 m): Composed of 8 sediments, 4 speleothems, and 4 rock samples, showing a moderate concentration of heavy metals.
- Cluster 2 (Intermediate, avg. depth 440.25 m): Contains 10 rocks, 9 speleothems, and 1 sediment sample, with the lowest heavy metal concentrations.
- Cluster 3 (Shallowest, avg. depth 323.89 m): Includes 8 sediments and 1 rock sample, exhibiting the highest heavy metal concentrations (except for Ni), suggesting accumulation near the surface due to airborne pollution, soil leaching, and surface runoff.
Heavy metals appear to migrate downward, accumulating first in shallow cave sections before being rinsed and redeposited in deeper zones. These transport mechanisms require further investigation.
Strontium concentrations notably increase in the deepest sections, but current data are insufficient to draw firm conclusions, warranting further research. Additionally, calcium concentrations in speleothems are lowest in shallow sections, nearly four times lower than in the middle depth, where they peak.
3.4. Factor Analysis
Factor analysis was performed on 16 variables, including sample depth and elemental concentrations (Al, Be, Ca, Cd, Co, Cr, Cu, Fe, Li, Mn, Ni, Pb, Si, Sr, Zn). The results explained 83.7% of total variability, indicating a strong statistical model. Factor scores (Table A8) indicate the degree of influence of each factor on individual samples, while factor loadings (Table A7) reveal relationships between variables.
Interpretation of Factors
Factor 1: Dominated by the aluminosilicate component, indicating high influence from soil and non-carbonate rocks. Ca shows a strong negative correlation, while Fe and Mn likely originate from natural aluminosilicates. Zn, Pb, and Co may have either natural or anthropogenic sources but strongly correlate with this factor.
Factor 2: Primarily associated with Cd, Cr, and Ni, forming a distinct elemental group. Their origin could be either atmospheric deposition from distant pollution sources or natural geological processes, differing from elements in Factor 1.
Factor 3: Shows negative correlations with depth and Sr, consistent with Q-mode cluster analysis, which indicated that Sr concentrations increase with depth.
These factors provide valuable insights into the geochemical processes affecting element distribution in the studied cave system.
3.5. Discussion
This section integrates mineralogical, geochemical, and geophysical data to explain the origin of detected elements and minerals, their distribution, and interactions within the cave system.
3.5.1. Mineralogy and Magnetic Susceptibility (MS) Relationships
Samples containing only calcite (or calcite + dolomite) exhibited very low MS values (≤0.002 × 10⁻³ SI units) and showed few or no elemental anomalies. A notable exception was sample ZSDV-123, where an Mg anomaly coincided with the presence of dolomite, confirming its natural origin. This sample, collected from a horizontal channel at the bottom of Slovačka jama, suggests the presence of dolomitic bedrock at depth, though current geological maps lack subsurface detail.
In contrast, samples containing clay minerals displayed higher MS values and numerous elemental anomalies. The most abundant clay minerals were chlorite and muscovite, with kaolinite and montmorillonite present in smaller amounts. Chlorite, commonly found in metamorphic and volcanic environments, is known to contain Fe and Mn, which may explain the observed high MS values. It is likely formed through low-grade metamorphism or weathering of mafic minerals (e.g., pyroxenes, amphiboles, biotite).
3.5.2. Elements and Magnetic Susceptibility (MS) Relationships
Table A10 presents the correlations between magnetic susceptibility (MS) and chemical elements in the studied samples. MS exhibits strong to excellent correlations with Al, Ba, Be, Bi, Ca, Co, Cu, Fe, Li, Mn, Pb, Rb, Ti, Tl, and Zn, suggesting that MS can serve as a reliable proxy for detecting locations with elevated concentrations of these elements.
3.5.3. Potential Sources of Clay Minerals and Heavy Metals
Clay minerals in the samples studied may originate from multiple sources:
- Terra rossa contribution: Similar to findings from Istria (Durn et al., 2007), terra rossa in karst regions often forms from insoluble residues of limestone and dolomite, but can also contain aeolian dust, volcanic debris, and transported sedimentary particles. These external sources may have introduced heavy metals over geological timescales.
- Aeolian and volcanic inputs: Past atmospheric processes could have deposited metal-rich dust and volcanic ash, leading to localized heavy metal anomalies.
- Hydrothermal activity: Though not confirmed, hydrothermal processes might have contributed to mineral transformations and heavy metal enrichment in deeper cave sediments.
3.5.4. Feldspars and Their Geochemical Significance
Feldspars (plagioclase) were detected in only four samples, often alongside clay minerals. While no major anomalies were associated with feldspar-rich samples, Ba anomalies were identified in ZSDV-130 and ZSDV-133. Since alkaline barium feldspars can form through Ba substitution for K in feldspar structures, it is likely that crystallization processes in igneous or metamorphic rocks played a role in Ba enrichment.
3.5.5. Iron Minerals and Their Origins
Two Fe-rich minerals were detected:
- Magnetite (spinels) – Found in cave sediments, possibly originating from:
a) Natural sources, such as weathering of bauxites (known to occur in Velebit Mt.).
b) Biogenic activity, as some microorganisms can precipitate magnetite.
c) Anthropogenic pollution, transported via airborne deposition.
- 2.
- Goethite (oxyhydroxides) – Typically forms through lateritic weathering and was found in samples where Fe anomalies were detected.
Samples ZSDV-107 and ZSDV-127, both from Slovačka jama, exhibited Fe anomalies and contained magnetite, suggesting an unusual geochemical environment in these sediments.
3.5.6. An Unusual Geochemical Outlier
Sample ZSDV-107 (285 m depth, Slovačka jama) displayed:
- The highest MS value (0.168 × 10⁻³ SI units).
- A complex mineralogical composition (calcite, quartz, all four clay minerals, magnetite).
- Multiple elemental anomalies, including extremes for Al, B, Co, Mn, Na, Tl and outliers for Ba, Be, Cr, Cu, Fe, K, Pb, Rb, Ti, U, Zn.
These anomalies suggest a unique depositional or geochemical process, potentially involving multiple metal sources (natural and anthropogenic), deep sediment accumulation, and prolonged geochemical transformations. Further geochemical and isotopic studies are needed to fully understand its formation.
3.5.7. Factor Analysis and Elemental Associations
Factor analysis revealed a distinct grouping of Cd, Cr, and Ni, separate from other heavy metals. This suggests:
- Different sources or transport mechanisms compared to Zn, Pb, and Co.
- Possible atmospheric deposition (long-range transport of industrial pollutants).
- Alternatively, a unique natural geological source distinct from the aluminosilicate fraction.
Our results indicate that heavy metal anomalies in cave sediments and speleothems can be attributed to a combination of natural geochemical processes and potential atmospheric deposition. Similar findings were reported by Rozkowski et al. [13], who examined heavy metal transport within the unsaturated and saturated zones of a carbonate massif in Poland. Their study highlighted the influence of infiltration processes on metal migration, which aligns with our observations of metal transport from shallow to deep cave sections in Slovačka jama and the Velebita cave system. The accumulation of elements like Pb, Zn, and Cu in cave sediments suggests both allochthonous input (surface-derived material) and internal redistribution within the karst system.
Moreover, our analysis supports the idea that speleothems can serve as long-term environmental archives, recording changes in metal concentrations over time. Pons-Branchu et al. [30] demonstrated that speleothems in urban settings provide valuable records of historical heavy metal pollution, showing enrichment in Pb, Mn, V, Cu, Cd, and Al due to anthropogenic contamination. While our study is focused on deep karst environments rather than urban speleothems, the detection of Cd, Cr, and Ni as a distinct elemental association (factor analysis) raises the possibility of airborne metal deposition from distant pollution sources, a hypothesis also considered in their research.
The role of lead in karst environments has been extensively studied, with Allan et al. [15] demonstrating how Pb concentrations and isotopic ratios in speleothems can be used to trace atmospheric pollution since the Industrial Revolution. While Pb anomalies in our samples could originate from natural sources (aluminosilicate components), the presence of additional metals associated with industrial activity suggests that long-range atmospheric transport may also contribute. Further isotopic analysis could help differentiate between these sources.
Overall, the combined use of mineralogical, geochemical, and statistical methods provided a comprehensive understanding of element distribution in deep karst environments, highlighting both natural and anthropogenic influences on cave sediments.
4. Conclusions and Future Research
This study highlights the complex geochemical interactions in deep karst environments, with speleothems and sediments serving as important archives of elemental transport and potential pollution pathways. Our results align with findings by Rozkowski et al. [13], Pons-Branchu et al. [30], and Allan et al. [15], all of whom investigated metal migration and accumulation in carbonate environments. The detection of heavy metal anomalies in sediments and speleothems suggests that karst systems are influenced by both natural geochemical processes and possible anthropogenic inputs.
Mineralogical analysis confirmed that calcite is the dominant mineral in all samples, as expected in a karst environment, while quartz was present in most samples, likely introduced via fine-grained clastic sediments. Clay minerals, including muscovite, chlorite, kaolinite, and montmorillonite, were found to be associated with higher magnetic susceptibility (MS) and heavy metal anomalies, indicating their role in metal transport. Feldspars, though rare, were linked to barium anomalies, suggesting the formation of alkaline barium feldspars. The presence of iron minerals such as magnetite and goethite, particularly in cave sediments, points to multiple possible origins, including natural sources such as bauxites, biogenic activity, or even airborne pollution.
Geochemical and statistical analyses provided additional insights into element distribution and transport within the cave system. Samples composed solely of calcite or calcite with dolomite exhibited the lowest MS values, indicating minimal influence from non-carbonate materials, whereas samples containing clay minerals displayed elevated MS values and a high number of elemental anomalies, supporting the hypothesis that clays play a significant role in metal retention. Boxplot analysis identified the highest number of anomalies in samples ZSDV-107 and ZSDV-127, suggesting a complex geochemical environment. Q-mode cluster analysis revealed that heavy metals are more concentrated in shallow cave sections, likely due to airborne deposition or surface leaching, with subsequent transport and accumulation in deeper parts of the cave system. Factor analysis identified cadmium, chromium, and nickel as a distinct group, indicating a different origin from other heavy metals, potentially related to atmospheric deposition or specific geological sources.
While this research has significantly advanced the understanding of deep cave geochemistry, several aspects require further investigation. Future studies should include more detailed geological mapping at depth, as current geological maps provide only surface-level data and cannot fully explain subsurface variations. Geophysical methods such as seismic profiling could help clarify the distribution of carbonate and non-carbonate rock units. Additionally, stable isotope analysis of heavy metals (e.g., Pb, Sr) could aid in distinguishing between natural and anthropogenic sources. Investigating the role of aeolian dust and past volcanic activity in mineral deposition would also help to better understand the origins of clay minerals and associated elements.
Future research should focus on stable isotope analysis of heavy metals, particularly Pb, to better determine the origin of these anomalies. Further monitoring of atmospheric deposition in the region could also help assess the role of long-range transport of pollutants, as suggested by studies on urban speleothems. Additionally, expanding the spatial and depth range of sampling will improve our understanding of metal transport mechanisms and their implications for karst hydrology and groundwater protection.
Supplementary Materials
The following supporting information can be downloaded at the website of this paper posted on Preprints.org, Figure S1; Figure S2; Table S1-S13.
Author Contributions
Conceptualization, D.P., S.F.-B. and N.B.; methodology, K.M. and S.F.-B., D.P. and N.B.; software, S.F.-B., D.P.; analysis, S.F.-B., N.B., D.P. and K.M.; investigation, D.P., S.F.-B. and N.B..; collection data in the field, D.P..; writing—original draft preparation, D.P., S.F.-B. and N.B.; writing—review and editing, supervised the work, D.P., S.F.-B. and N.B. All authors have read and agreed to the published version of the manuscript.
Funding
This research was partially supported by the Northern Velebit National Park, Croatia and research funding in the Department of Geography at the Faculty of Science, University of Zagreb.
Data Availability Statement
The data will be made available on request.
Acknowledgments
The authors thank Prof. Nenad Tomašić for assistance with mineralogical analysis. We acknowledge the support provided by the Josip Juraj Strossmayer Water Institute, Main Water Laboratory (MWL), especially Mag. Simana Milović. We thank the members of the Speleological Society Velebit and Speleological Committee of CMA, Zagreb, for their assistance in field work. We also appreciate the journal’s reviewers for taking their precious time to review the manuscript.
Conflicts of Interest
The authors declare no conflicts of interest.
Appendix A

Table A1.
Mineral (phase) composition of speleothem samples. Sign “+” means that sample contains this mineral.
Table A1.
Mineral (phase) composition of speleothem samples. Sign “+” means that sample contains this mineral.
| Sample | Calcite | Quartz | Kaolinite | Muscovite | Chlorite | Montmorill. | Magnetite | Goethite | Plagioclase | Dolomite |
| ZSDV-100 | + | + | ||||||||
| ZSDV-101 | + | |||||||||
| ZSDV-102 | + | + | ||||||||
| ZSDV-103 | + | + | ||||||||
| ZSDV-104 | + | + | + | |||||||
| ZSDV-105 | + | + | + | + | + | |||||
| ZSDV-106 | + | + | ||||||||
| ZSDV-107 | + | + | + | + | + | + | + | |||
| ZSDV-108 | + | + | ||||||||
| ZSDV-109 | + | + | ||||||||
| ZSDV-110 | + | + | + | + | + | + | + | |||
| ZSDV-111 | + | |||||||||
| ZSDV-112 | + | + | + | + | + | + | ||||
| ZSDV-113 | + | |||||||||
| ZSDV-114 | + | + | + | + | ||||||
| ZSDV-115 | + | + | + | + | + | |||||
| ZSDV-116 | + | + | + | + | ||||||
| ZSDV-118 | + | + | + | |||||||
| ZSDV-119 | + | + | + | + | + | |||||
| ZSDV-120 | + | + | ||||||||
| ZSDV-121 | + | + | + | + | ||||||
| ZSDV-122 | + | + | + | + | ||||||
| ZSDV-123 | + | + | ||||||||
| ZSDV-124 | + | + | + | + | ||||||
| ZSDV-125 | + | + | ||||||||
| ZSDV-126 | + | + | + | + | ||||||
| ZSDV-127 | + | + | + | + | + | |||||
| ZSDV-128 | + | + | + | + | + | + | ||||
| ZSDV-129 | + | + | ||||||||
| ZSDV-130 | + | + | + | + | + | + | ||||
| ZSDV-131 | + | + | ||||||||
| ZSDV-132 | + | |||||||||
| ZSDV-133 | + | + | + | + | + | |||||
| ZSDV-134 | + | + | + | + | ||||||
| ZSDV-135 | + | + | + | |||||||
| ZSDV-136 | + | + | ||||||||
| ZSDV-138 | + | + | ||||||||
| ZSDV-139 | + | + | ||||||||
| ZSDV-140 | + | |||||||||
| ZSDV-141 | + | |||||||||
| ZSDV-142 | + | + | ||||||||
| ZSDV-143 | + | + | ||||||||
| ZSDV-144A | + | |||||||||
| ZSDV-144B | + | + | ||||||||
| ZSDV-145 | + |
Table A2.
Results of ICP-MS analysis of 30 chemical elements in solid samples.
| Sample |
Al mg/ kg |
B mg/ kg |
Ba mg/ kg |
Be mg/ kg |
Bi mg/ kg |
Ca mg/ kg |
Cd mg/ kg |
Co mg/ kg |
Cr mg/ kg |
Cs mg/ kg |
Cu mg/ kg |
Fe mg/ kg |
K mg/ kg |
Li mg/ kg |
Mg mg/ kg |
| ZSDV -100 | 473 | 0,679 | 6,95 | 0,033 | 0,236 | 81855 | 0,054 | 0,391 | 3,78 | 0,436 | 1,62 | 1618 | 129 | 2,66 | 101 |
| ZSDV -101 | 251 | 0,596 | 3,20 | 0,015 | 0,071 | 92465 | 0,040 | 0,287 | 4,93 | 0,532 | 0,660 | 558 | 94,2 | 5,18 | 156 |
| ZSDV -102 | 472 | 0,760 | 8,21 | 0,036 | 0,213 | 74620 | 0,047 | 0,470 | 2,95 | 0,553 | 1,20 | 1387 | 136 | 2,75 | 200 |
| ZSDV -103 | 375 | 0,253 | 3,60 | 0,020 | 0,098 | 86836 | 0,044 | 0,350 | 3,52 | 1,0 | 0,831 | 793 | 56,8 | 2,72 | 92,6 |
| ZSDV -104 | 3502 | 2,19 | 35,3 | 0,156 | 1,36 | 49249 | 0,076 | 1,29 | 10,9 | 6,79 | 5,76 | 9876 | 731 | 14,1 | 377 |
| ZSDV -105 | 4113 | 9,96 | 61,5 | 0,175 | 0,664 | 90203 | 0,153 | 1,98 | 12,4 | 2,07 | 4,20 | 5570 | 1143 | 5,56 | 507 |
| ZSDV -106 | 409 | 1,73 | 4,85 | 0,015 | 0,103 | 128213 | 0,043 | 0,587 | 3,80 | 0,252 | 0,590 | 517 | 269 | 3,77 | 300 |
| ZSDV -107 | 13737 | 13,1 | 112 | 0,452 | 2,0 | 3732 | 0,374 | 5,64 | 31,9 | 4,56 | 9,30 | 26293 | 1923 | 22,2 | 738 |
| ZSDV -108 | 320 | 0,363 | 5,63 | 0,012 | 0,053 | 114421 | 0,031 | 0,531 | 3,58 | 0,170 | 0,545 | 500 | 76,7 | 0,618 | 45,2 |
| ZSDV -109 | 180 | 0,145 | 7,82 | 0,016 | 0,072 | 87355 | 0,086 | 0,450 | 2,68 | 0,140 | 0,750 | 664 | 27,5 | 0,844 | 105 |
| ZSDV -110 | 6171 | 4,90 | 71,2 | 0,273 | 1,12 | 26950 | 0,443 | 3,44 | 20,2, | 3,32 | 4,62 | 16480 | 853 | 23,9 | 321 |
| ZSDV -111 | 30,8 | 0,145 | 0,845 | <0,005 | 0,023 | 106600 | 0,017 | 0,293 | 2,34 | <0,030 | 0,373 | 65,6 | 12,8 | 0,085 | 520 |
| ZSDV -112 | 1719 | 0,694 | 46,4 | 0,091 | 0,481 | 64409 | 0,069 | 1,09 | 6,55 | 1,12 | 2,15 | 4898 | 569 | 3,06 | 389 |
| ZSDV -113 | 122 | 0,144 | 2,12 | 0,010 | 0,044 | 88824 | 0,045 | 0,408 | 2,41 | 0,107 | 0,539 | 424 | 22,6 | 0,619 | 209 |
| ZSDV -114 | 1962 | 0,602 | 10,5 | 0,105 | 0,323 | 75638 | 0,384 | 1,28 | 7,38 | 1,47 | 2,0 | 8520 | 328 | 9,94 | 190 |
| ZSDV -115 | 1983 | 0,667 | 11,4 | 0,090 | 0,364 | 40678 | 0,232 | 0,959 | 7,61 | 1,19 | 2,12 | 6664 | 327 | 5,01 | 125 |
| ZSDV -116 | 3938 | 3,40 | 40,7 | 0,195 | 2,95 | 35985 | 0,394 | 1,62 | 39,9 | 4,13 | 6,92 | 14301 | 762 | 18,1 | 534 |
| ZSDV -118 | 125 | 0,203 | 2,71 | 0,011 | 0,045 | 82359 | 0,018 | 0,323 | 1,73 | 0,168 | 0,496 | 361, | 42,2 | 1,11 | 274 |
| ZSDV -119 | 2779 | 1,26 | 15,5 | 0,175 | 1,18 | 55298 | 0,366 | 2,23 | 25,6 | 2,58 | 4,03 | 12326 | 317 | 14,8 | 213 |
| ZSDV -120 | 19,5 | <0,100 | 13,1 | <0,005 | <0,030 | 79182 | 0,067 | 0,319 | 11,6 | <0,030 | 0,441 | 84,2 | 8,28 | 0,047 | 634 |
| ZSDV -121 | 1851 | 0,804 | 31,8 | 0,105 | 0,884 | 72333 | 0,147 | 1,15 | 6,50 | 1,69 | 2,10 | 4454 | 323 | 3,89 | 712 |
| ZSDV -122 | 923 | 2,0 | 7,47 | 0,035 | 0,169 | 66825 | 0,090 | 0,600 | 6,28 | 0,815 | 2,23 | 3845 | 767 | 1,09 | 396 |
| ZSDV -123 | 105 | 0,205 | 1,57 | 0,011 | 0,044 | 69173 | 0,020 | 0,309 | 2,70 | 0,064 | 0,462 | 459 | 63,5 | 0,100 | 6630 |
| ZSDV -124 | 2396 | 2,13 | 21,0 | 0,138 | 0,715 | 54126 | 0,505 | 1,37 | 8,49 | 1,25 | 3,58 | 8733 | 701 | 4,70 | 329 |
| ZSDV -125 | 11,3 | <0,100 | 0,545 | <0,005 | 0,154 | 113734 | 0,072 | 0,264 | 12,0 | <0,030 | 0,298 | 77,5 | 4,67 | 0,068 | 10,3 |
| ZSDV -126 | 1505 | 0,660 | 23,3 | 0,078 | 0,505 | 71445 | 0,058 | 1,02 | 6,31 | 1,05 | 3,67 | 4241 | 461 | 3,23 | 379 |
| ZSDV -127 | 11202 | 7,18 | 76,1 | 0,503 | 2,46 | 15950 | 0,323 | 5,84 | 35,8 | 6,55 | 7,68 | 28640 | 1167 | 41,8 | 500 |
| ZSDV -128 | 7388 | 3,74 | 63,5 | 0,370 | 1,71 | 28058 | 0,213 | 3,69 | 17,8 | 5,56 | 6,65 | 20436 | 1338 | 29,5 | 504 |
| ZSDV -129 | 85,9 | <0,100 | 0,917 | <0,005 | <0,030 | 94922 | 0,047 | 0,319 | 2,52 | 0,069 | 0,460 | 257 | 14,6 | 0,300 | 19,4 |
| ZSDV -130 | 4733 | 2,05 | 138 | 0,302 | 1,56 | 13320 | 0,105 | 2,62 | 14,8 | 3,46 | 5,98 | 17600 | 1502 | 15,2 | 1069 |
| ZSDV -131 | 12,0 | 8,35 | 40,5 | 12,5 | 5,40 | 4,12 | 0,198 | 54,2 | 1,86 | 72,8 | 68,2 | 0,089 | 0,685 | 183 | 4,44 |
| ZSDV -132 | 3,70 | 17,7 | 9,68 | 25,6 | 0,779 | 2,45 | 0,495 | 32,7 | 1,03 | 191 | 32,6 | 0,047 | 0,604 | 123 | 1,24 |
| ZSDV -133 | 12,5 | 4,52 | 22,1 | 6,33 | 3,04 | 4,14 | 0,272 | 57,5 | 1,36 | 125 | 80,3 | 0,115 | 1,03 | 100 | 3,41 |
| ZSDV -134 | 5,66 | 5,55 | 14,5 | 9,71 | 1,40 | 2,16 | 0,318 | 44,2 | 1,19 | 84,8 | 49,6 | 0,061 | 0,501 | 114 | 1,53 |
| ZSDV -135 | 47,6 | 7,07 | 26,5 | 16,2 | 13,0 | 24,9 | 0,503 | 148 | 1,79 | 52,0 | 386 | 0,700 | 2,23 | 147 | 9,66 |
| ZSDV -136 | 115 | 2,80 | 132 | 6,10 | 7,85 | 13,0 | 0,186 | 108 | 1,50 | 26,8 | 342 | 0,622 | 0,912 | 77,3 | 9,14 |
| ZSDV-138 | 7,91 | 3,40 | 82,1 | 7,44 | 1,05 | 1,40 | 0,081 | 22,2 | 0,870 | 107 | 36,8 | 0,075 | 1,06 | 81,5 | 1,07 |
| ZSDV-139 | 560 | 7,67 | 116 | 21,7 | 31,9 | 43,7 | 0,782 | 98,5 | 2,45 | 30,7 | 1068 | 1,62 | 4,29 | 212 | 24,5 |
| ZSDV-140 | 11,0 | 3,98 | 16,0 | 6,85 | 0,730 | 1,64 | 0,250 | 20,4 | 0,523 | 11,3 | 38,3 | 0,079 | 0,292 | 69,6 | 0,892 |
| ZSDV-141 | 73,3 | 5,07 | 11,7 | 6,83 | 1,43 | 0,898 | 0,150 | 18,7 | 1,19 | 47,0 | 40,2 | 0,131 | 0,600 | 113 | 1,27 |
| ZSDV-142 | 477 | 8,24 | 36,0 | 18,0 | 20,2 | 22,9 | 0,656 | 80,7 | 1,63 | 38,7 | 496 | 1,18 | 2,25 | 98,1 | 14,0 |
| ZSDV-143 | 0,767 | 5,0 | 29,6 | 7,35 | 0,251 | 0,176 | 0,359 | 2,76 | 1,35 | 116 | 5,41 | 0,009 | 0,975 | 137 | 0,711 |
| ZSDV-144A | 70,6 | 3,58 | 31,0 | 6,14 | 5,50 | 11,6 | 0,098 | 76,5 | 0,830 | 85,5 | 287 | 0,264 | 0,900 | 68,4 | 4,10 |
| ZSDV-144B | 16,1 | 5,08 | 15,2 | 7,20 | 0,827 | 0,650 | 0,039 | 15,0 | 1,22 | 93,4 | 29,0 | 0,038 | 0,870 | 104 | 0,739 |
| ZSDV-145 | 126 | 5,45 | 17,3 | 7,50 | 6,76 | 7,66 | 0,202 | 106 | 0,772 | 18,1 | 214 | 0,308 | 0,920 | 76,7 | 5,08 |
Table A3.
Results of ICP-MS analysis of 30 chemical elements in three water samples.
| Sample |
Al µg/L |
As µg/L |
B µg/L |
Ba µg/L |
Be µg/L |
Ca mg/L |
Cd µg/L |
Co µg/L |
Cr µg/L |
Cs µg/L |
Cu µg/L |
Fe µg/L |
K mg/L |
Li µg/L |
Mg mg/L |
||
| M07 | 30,3 | 0,441 | 2,85 | 5,45 | <0,005 | 37,1 | 0,020 | 0,097 | 0,260 | <0,030 | 1,72 | 38,4 | 0,900 | 0,226 | <0,500 | ||
| M10 | 19,7 | 0,380 | 2,49 | 3,93 | <0,005 | 34,8 | <0,010 | 0,085 | 0,127 | <0,030 | 2,33 | 13,7 | 0,200 | 0,227 | <0,500 | ||
| M20 | 64,1 | 0,355 | 2,85 | 3,70 | <0,005 | 35,1 | <0,010 | 0,090 | 0,162 | <0,030 | 1,06 | 14,3 | 0,250 | 0,157 | <0,500 | ||
| Sample |
Mn µg/L |
Mo µg/L |
Na mg/L |
Ni µg/L |
Pb µg/L |
Rb µg/L |
Sb µg/L |
Si mg/L |
Sn µg/L |
Sr µg/L |
Ti µg/L |
Tl µg/L |
U µg/L |
V µg/L |
Zn µg/L |
||
| M07 | 1,22 | 0,088 | 0,860 | 0,557 | 0,411 | 0,475 | 0,207 | 1,30 | 0,060 | 29,0 | 0,732 | 0,004 | 0,212 | 0,443 | 1,58 | ||
| M10 | 0,509 | 0,043 | 0,620 | 2,90 | 0,190 | 0,216 | 0,036 | 1,16 | <0,020 | 30,1 | 0,579 | <0,003 | 0,153 | 0,316 | 1,38 | ||
| M20 | 0,607 | 0,065 | 0,610 | 0,649 | <0,010 | 0,237 | 0,081 | 1,04 | <0,020 | 27,8 | 0,534 | <0,003 | 0,141 | 0,283 | 1,28 | ||
Table A4.
Anomalies (extremes and outliers) determined by boxplot method.
| Sample | Extreme | Outlier |
| ZSDV -100 | - | - |
| ZSDV -101 | - | Sr |
| ZSDV -102 | - | - |
| ZSDV -103 | - | - |
| ZSDV -104 | - | Cs |
| ZSDV -105 | B, Na | - |
| ZSDV -106 | Na | |
| ZSDV -107 | Al, B, Co, Mn, Na, Tl | Ba, Be, Cr, Cu, Fe, K, Pb, Rb, Ti, U, Zn |
| ZSDV -108 | - | - |
| ZSDV -109 | - | - |
| ZSDV -110 | Mn | Co, Tl |
| ZSDV -111 | - | - |
| ZSDV -112 | - | - |
| ZSDV -113 | - | - |
| ZSDV -114 | - | - |
| ZSDV -115 | - | - |
| ZSDV -116 | Mo, Ni, Pb | Bi, Cr |
| ZSDV -118 | - | Sb |
| ZSDV -119 | Mo, Ni | - |
| ZSDV -120 | Mo, Sr | Ni |
| ZSDV -121 | Sr | - |
| ZSDV -122 | - | - |
| ZSDV -123 | Mg | - |
| ZSDV -124 | Cd | |
| ZSDV -125 | Mo, Ni | - |
| ZSDV -126 | - | - |
| ZSDV -127 | Al, Co, Li, Tl | B, Be, Bi, Cr, Cs, Fe, Pb, Rb, Zn |
| ZSDV -128 | - | Al, Co, Li, Mn, Na, Pb, Tl |
| ZSDV -129 | - | - |
| ZSDV -130 | Ba, Na | Rb |
| ZSDV -131 | Cd, Cr, Mo, Ni | - |
| ZSDV -132 | Mo | Cr, Ni |
| ZSDV -133 | - | Ba, Be, Na |
| ZSDV -134 | - | - |
| ZSDV -135 | - | - |
| ZSDV -136 | - | - |
| ZSDV-138 | - | - |
| ZSDV-139 | - | - |
| ZSDV-140 | Mo, Ni | Cr |
| ZSDV-141 | - | - |
| ZSDV-142 | Cs, Mo, Ni | - |
| ZSDV-143 | - | - |
| ZSDV-144A | - | - |
| ZSDV-144B | Cr, Mo, Ni | Cd |
| ZSDV-145 | Na | - |
Table A5.
Members of obtained clusters and distances from respective cluster centers.
| Cluster Number 1 | Cluster Number 2 | Cluster Number 3 | ||||||
| Distance | Distance | Distance | ||||||
| ZSDV-100 | 2296,907 | ZSDV-101 | 986,315 | ZSDV-107 | 3840,709 | |||
| ZSDV-102 | 1160,563 | ZSDV-103 | 1949,649 | ZDSV-110 | 707,108 | |||
| ZSDV-104 | 3505,504 | ZSDV-105 | 1746,685 | ZSDV-115 | 3650,59 | |||
| ZSDV-112 | 780,491 | ZSDV-106 | 5148,341 | ZSDV-116 | 2335,307 | |||
| ZSDV-114 | 1327,349 | ZSDV-108 | 2782,85 | ZSDV-127 | 2383,742 | |||
| ZSDV-118 | 2442,552 | ZSDV-109 | 1859,763 | ZSDV-128 | 995,872 | |||
| ZSDV-119 | 2682,862 | ZDSV-111 | 1447,447 | ZSDV-130 | 1696,761 | |||
| ZSDV-120 | 2068,802 | ZSDV-113 | 1608,54 | ZSDV-133 | 630,79 | |||
| ZSDV-121 | 615,082 | ZSDV-125 | 2667,503 | ZSDV-134 | 857,839 | |||
| ZSDV-122 | 428,126 | ZSDV-129 | 568,616 | |||||
| ZSDV-123 | 1283,476 | ZSDV-131 | 1669,34 | |||||
| ZSDV-124 | 2634,997 | ZSDV-132 | 1892,675 | |||||
| ZSDV-126 | 454,429 | ZSDV-138 | 241,428 | |||||
| ZSDV-135 | 3506,321 | ZSDV-139 | 113,224 | |||||
| ZSDV-136 | 979,731 | ZSDV-140 | 851,933 | |||||
| ZSDV-141 | 2363,343 | ZSDV-142 | 923,613 | |||||
| ZSDV-143 | 1501,29 | |||||||
| ZSDV-144A | 1315,248 | |||||||
| ZSDV-144B | 1271,849 | |||||||
| ZSDV-145 | 274,117 | |||||||
Table A6.
Mean values of 10 elements and two other parameters for 3 obtained clusters. Element's contents are given in mg/kg, elevation in m.
Table A6.
Mean values of 10 elements and two other parameters for 3 obtained clusters. Element's contents are given in mg/kg, elevation in m.
| Cluster - No. 1 | Cluster - No. 2 | Cluster - No. 3 | |
| Cave | 1,19 | 1,50 | 1,33 |
| Depth | 664,25 | 440,25 | 323,89 |
| Al | 1402,22 | 352,46 | 6420,78 |
| B | 1,04 | 0,86 | 4,40 |
| Ba | 17,68 | 5,55 | 79,56 |
| Be | 0,08 | 0,02 | 0,32 |
| Bi | 0,48 | 0,10 | 1,72 |
| Ca | 68916,31 | 98196,25 | 23043,11 |
| Cd | 0,13 | 0,13 | 0,26 |
| Co | 0,91 | 0,46 | 3,06 |
| Cr | 7,50 | 23,33 | 30,18 |
| Cs | 1,47 | 5,56 | 4,00 |
| Cu | 2,24 | 0,75 | 5,82 |
| Fe | 4795,51 | 644,85 | 17686,45 |
| K | 353,35 | 101,23 | 1105,11 |
| Li | 4,90 | 1,24 | 20,72 |
| Mg | 725,63 | 153,69 | 608,00 |
| Mn | 53,62 | 13,11 | 248,00 |
| Mo | 12,66 | 66,92 | 19,33 |
| Na | 19,88 | 33,59 | 71,88 |
| Ni | 19,66 | 100,34 | 35,48 |
| Pb | 5,99 | 1,02 | 27,53 |
| Rb | 9,40 | 1,45 | 31,43 |
| Sb | 0,36 | 0,22 | 0,49 |
| Si | 86,01 | 20,21 | 113,50 |
| Sn | 1,21 | 1,10 | 2,00 |
| Sr | 405,19 | 63,50 | 46,96 |
| Ti | 204,47 | 39,59 | 599,00 |
| Tl | 0,26 | 0,07 | 0,96 |
| U | 1,46 | 0,68 | 2,39 |
| V | 106,01 | 128,59 | 123,47 |
| Zn | 4,55 | 1,40 | 16,02 |
Table A7.
Factor Loadings (varimax normalized; Marked loadings are >0.7).
| Factor - 1 | Factor - 2 | Factor - 3 | |
| Depth | -0,124302 | -0,023993 | -0,819019 |
| Al | 0,954821 | 0,040576 | 0,065068 |
| Be | 0,964641 | 0,013376 | 0,052559 |
| Ca | -0,910654 | -0,035486 | 0,071048 |
| Cd | 0,367832 | 0,870409 | 0,002824 |
| Co | 0,943561 | 0,088319 | 0,060373 |
| Cr | 0,097057 | 0,956666 | 0,030635 |
| Cu | 0,965842 | 0,043518 | 0,106860 |
| Fe | 0,987710 | 0,045008 | 0,063385 |
| Li | 0,928842 | 0,059540 | 0,121091 |
| Mn | 0,860786 | 0,107496 | 0,059534 |
| Ni | -0,183442 | 0,940852 | 0,034932 |
| Pb | 0,792268 | 0,117471 | 0,138042 |
| Si | 0,722576 | 0,023701 | 0,062805 |
| Sr | -0,060724 | -0,024627 | -0,804648 |
| Zn | 0,979650 | 0,057248 | 0,111071 |
| Expl.Var | 9,380962 | 2,606750 | 1,405087 |
| Prp.Totl | 0,586310 | 0,162922 | 0,087818 |
Table A8.
Factor Scores for analyzed samples.
| Factor - 1 | Factor - 2 | Factor - 3 | |
| ZSDV-100 | -0,44969 | -0,468335 | 0,91344 |
| ZSDV-101 | -0,66168 | -0,423453 | 0,83505 |
| ZSDV-102 | -0,44930 | -0,507157 | 0,74082 |
| ZSDV-103 | -0,61171 | -0,481194 | 0,81870 |
| ZSDV-104 | 0,65183 | -0,469277 | 0,74884 |
| ZSDV-105 | 0,34543 | -0,280647 | 0,72149 |
| ZSDV-106 | -0,77655 | -0,455562 | 0,83723 |
| ZSDV-107 | 2,91683 | 0,220452 | 0,07686 |
| ZSDV-108 | -0,76396 | -0,477140 | 0,54742 |
| ZSDV-109 | -0,59976 | -0,389911 | 0,39858 |
| ZDSV-110 | 1,57251 | 1,230746 | 0,06671 |
| ZDSV-111 | -0,80161 | -0,501358 | 0,12572 |
| ZSDV-112 | -0,03876 | -0,442072 | -0,02598 |
| ZSDV-113 | -0,68940 | -0,468341 | 0,36007 |
| ZSDV-114 | 0,18179 | 0,138592 | 0,29450 |
| ZSDV-115 | 0,16931 | -0,151257 | 0,20318 |
| ZSDV-116 | 1,48445 | 0,983193 | 0,95783 |
| ZSDV-118 | -0,70573 | -0,550535 | 0,84204 |
| ZSDV-119 | 0,88586 | 0,531137 | 0,26291 |
| ZSDV-120 | -0,34931 | -0,095727 | -4,94046 |
| ZSDV-121 | 0,13086 | -0,249879 | -2,03191 |
| ZSDV-122 | -0,13940 | -0,339670 | -1,09632 |
| ZSDV-123 | -0,56206 | -0,484421 | -1,03985 |
| ZSDV-124 | 0,47950 | 0,399545 | -1,17644 |
| ZSDV-125 | -0,87972 | -0,012148 | 0,13909 |
| ZSDV-126 | -0,01168 | -0,483615 | 0,24995 |
| ZSDV-127 | 2,75371 | 0,126628 | 0,10225 |
| ZSDV-128 | 1,96719 | -0,195167 | 0,15930 |
| ZSDV-129 | -0,76242 | -0,443131 | 0,47835 |
| ZSDV-130 | 1,28806 | -0,439484 | 0,58186 |
| ZSDV-131 | -0,82480 | 4,817560 | -0,06662 |
| ZSDV-132 | -0,72776 | 0,154602 | 0,02479 |
| ZSDV-133 | 1,22900 | -0,462031 | -0,21315 |
| ZSDV-134 | 1,10399 | -0,353444 | -0,18035 |
| ZSDV-135 | 0,67268 | -0,338948 | -0,41738 |
| ZSDV-136 | -0,08725 | -0,449788 | -0,31604 |
| ZSDV-138 | -0,71929 | -0,485320 | -0,28463 |
| ZSDV-139 | -0,70896 | -0,517329 | -0,27965 |
| ZSDV-140 | -0,74195 | 1,245226 | -0,42709 |
| ZSDV-141 | -0,59604 | -0,507463 | -0,55998 |
| ZSDV-142 | -0,72349 | 0,332592 | -0,55415 |
| ZSDV-143 | -0,86040 | -0,486455 | 0,96571 |
| ZSDV-144A | -0,85409 | -0,514546 | 0,99775 |
| ZSDV-144B | -1,02319 | 3,184189 | 0,74276 |
| ZSDV-145 | -0,71303 | -0,439658 | -0,58319 |
Table A9.
Magnetic susceptibility measured in cave samples from Velebit Mt.
| Sample | ZSDV -100 | ZSDV -101 | ZSDV -102 | ZSDV -103 | ZSDV -104 | ZSDV -105 | ZSDV -106 | ZSDV -107 | ZSDV -108 | ZSDV -109 | ZSDV -110 |
| MS (10-3 SI units) | 0.008 | 0.000 | 0.014 | 0.000 | 0.047 | 0.043 | 0.002 | 0.168 | 0.002 | 0.001 | 0.064 |
| Sample | ZSDV -111 | ZSDV -112 | ZSDV -113 | ZSDV -114 | ZSDV -115 | ZSDV -116 | ZSDV -118 | ZSDV -119 | ZSDV -120 | ZSDV -121 | ZSDV -122 |
| MS (10-3 SI units) | 0.000 | 0.094 | 0.000 | 0.026 | 0.009 | 0.070 | 0.000 | 0.038 | 0.000 | 0.033 | 0.005 |
| Sample | ZSDV -124 | ZSDV -125 | ZSDV -126 | ZSDV -127 | ZSDV -128 | ZSDV -129 | ZSDV -130 | ZSDV -131 | ZSDV -132 | ZSDV -133 | ZSDV -134 |
| MS (10-3 SI units) | 0.015 | 0.001 | 0.099 | 0.024 | 0.069 | 0.002 | 0.152 | 0.003 | 0.002 | 0.089 | 0.060 |
| Sample | ZSDV -135 | ZSDV -136 | ZSDV-138 | ZSDV-139 | ZSDV-140 | ZSDV-141 | ZSDV-142 | ZSDV-143 | ZSDV-144A | ZSDV-144B | ZSDV-145 |
| MS (10-3 SI units) | 0.042 | 0.008 | 0.002 | 0.005 | 0.001 | 0.000 | 0.003 | 0.000 | 0.002* | 0.001* | 0.000 |
Table A10.
Correlations between MS and determined chemical elements. Correlations are significant at p < ,05000 N=45.
Table A10.
Correlations between MS and determined chemical elements. Correlations are significant at p < ,05000 N=45.
| Al | B | Ba | Be | Bi | Ca | Cd | Co | Cr | Cs | Cu | Fe | K | Li | Mg | |
| MS | 0,73 | 0,59 | 0,87 | 0,75 | 0,71 | -0,75 | 0,19 | 0,69 | 0 | -0,01 | 0,8 | 0,74 | 0,84 | 0,57 | 0,09 |
| Mn | Mo | Na | Ni | Pb | Rb | Sb | Si | Sn | Sr | Ti | Tl | U | V | Zn | |
| MS | 0,7 | -0,15 | 0,56 | -0,14 | 0,6 | 0,81 | 0,31 | 0,59 | 0,53 | -0,1 | 0,78 | 0,64 | 0,51 | 0,04 | 0,72 |
References
- Bognar, A.; Faivre, S.; Buzjak, N.; Pahernik, M.; Bočić, N. Recent Landform Evolution in the Dinaric and Pannonian Regions of Croatia. In Recent Landform Evolution: The Carpatho–Balkan–Dinaric Region; Lóczy, D., Stankoviansky, M., Kotarba, A., Eds.; Springer: Cham, Switzerland, 2012; pp. 313–344. [Google Scholar]
- White, W. B. Cave Geology; Cambridge University Press: Cambridge, UK, 2007. [Google Scholar]
- Sasowsky, I.D.; Mylroie, J. Studies of Cave Sediments: Physical and Chemical Records of Paleoclimate; Springer: Dordrecht, The Netherlands, 2004. [Google Scholar]
- Paar, D.; Frančišković-Bilinski, S.; Buzjak, N.; Maldini, K.; Milović, S.; Pichler, S. Geochemical and Mineralogical Characterization of Speleothems from the Karst of Croatia as Potential Sources of Data for Environmental Research. J. Geochem. Explor. 2016, 167, 20–37. [Google Scholar] [CrossRef]
- Surić, M. Speleothem-Based Quaternary Research in Croatian Karst – A Review. Quat. Int. 2018, 490, 113–122. [Google Scholar] [CrossRef]
- Höpker, R.; Müller, T.; Schmidt, F.; Becker, J. Recent Developments in Cave Sediment Studies. J. Karst Res. 2024, 58, 233–245. [Google Scholar]
- Çil, E.; Kaya, Ö.; Yılmaz, H.; Demir, A. Speleothem Geochemistry and Paleoenvironmental Interpretations. Earth Sci. J. 2023, 49, 120–135. [Google Scholar]
- Muri, G.; Kralj, P.; Krajcar Bronić, I.; Horvatinčić, N. Karst Aquifers and Their Vulnerability to Contamination. Hydrogeol. J. 2013, 21, 765–779. [Google Scholar]
- Chen, J.; Wang, S.; Liu, Y.; Zhang, Q.; Zhao, H. Groundwater Extraction from Karst Aquifers: A Global Perspective. Water Resour. Res. 2017, 53, 890–905. [Google Scholar]
- Kuhta, M.; Brkić, M. Hydrogeochemical Dynamics of Karst Systems. Environ. Geol. 2008, 56, 567–580. [Google Scholar]
- Paar, D.; Mance, D.; Stroj, A.; Pavić, M. Northern Velebit (Croatia) Karst Hydrological System: Results of a Preliminary ²H and ¹⁸O Stable Isotope Study. Geol. Croat. 2019, 72, 205–213. [Google Scholar] [CrossRef]
- Addesso, R.; De Waele, J.; Cafaro, S.; Baldantoni, D. Geochemical Characterization of Clastic Sediments Sheds Light on Energy Sources and on Alleged Anthropogenic Impacts in Cave Ecosystems. Int. J. Earth Sci. 2022, 111, 919–927. [Google Scholar] [CrossRef]
- Rozkowski, J.; Rozkowski, K.; Rahmonov, O. Heavy Metals in the Unsaturated and Saturated Zone of the Upper Jurassic Carbonate Massif in the Vicinity of Krakow. J. Elementol. 2015, 20, 395–406. [Google Scholar] [CrossRef]
- Pons-Branchu, E.; Takahashi, C.; Frisia, S.; Borsato, A. Urban Speleothems as Records of Heavy Metal Pollution. Sci. Total Environ. 2015, 512, 435–448. [Google Scholar]
- Allan, M.; Fagel, N.; Van Rampelbergh, M.; Baldini, J.; Riotte, J.; Cheng, H.; Edwards, R.L.; Gillikin, D.; Quinif, Y.; Verheyden, S. Lead Concentrations and Isotope Ratios in Speleothems as Proxies for Atmospheric Metal Pollution Since the Industrial Revolution. Chem. Geol. 2015, 401, 140–150. [Google Scholar] [CrossRef]
- Xu, H.; Li, Y.; Wang, X.; Zhang, L. Heavy Metal Contamination in Cave Water Systems. Hydrogeol. Contam. Transp. 2020, 12, 123–135. [Google Scholar]
- Zeng, J.; Han, G.L.; Yang, K.H. Assessment and Sources of Heavy Metals in Suspended Particulate Matter in a Tropical Catchment, Northeast Thailand. J. Clean. Prod. 2020, 265, Article 121898. [Google Scholar] [CrossRef]
- Zupan Hajna, N. Speleothem Records and Karst Hydrology. J. Karst Hydrogeol. 2011, 28, 403–415. [Google Scholar]
- Surić, D.; Barešić, J.; Lončar, T.; Peh, Z. Evolution of Speleothem Deposition in Croatian Caves: Implications for Paleoenvironmental Changes. J. Karst Geochem. 2005, 21, 105–120. [Google Scholar]
- Surić, D.; Perica, D.; Tibljaš, D. Multi-Year Geochemical Analysis of Speleothems: A New Perspective on Karst Hydrology. Geochim. Cosmochim. Acta 2009, 73, 245–260. [Google Scholar]
- Bonacci, O. Karst Hydrology: With Special Reference to Dinaric Karst; Springer-Verlag: Berlin, Germany, 1987. [Google Scholar]
- Boldrin, A.; Juračić, M.; Mengazzo Vitturi, L.; Rabitti, S.; Rampazzo, G. Sedimentation of River-Borne Material in a Shallow Shelf Sea: Adiga River, Adriatic Sea. Mar. Geol. 1992, 103, 473–485. [Google Scholar] [CrossRef]
- StatSoft, Inc. STATISTICA (Data Analysis Software System), Version 6; StatSoft, Inc.: 2001. Available online: www.statsoft.com.
- Tukey, J.W. Exploratory Data Analysis; Addison-Wesley: Reading, PA, USA, 1977. [Google Scholar]
- Reimann, C.; Filzmoser, P.; Garrett, R.G. Background and Threshold: Critical Comparison of Methods of Determination. Sci. Total Environ. 2005, 346, 1–16. [Google Scholar] [CrossRef]
- Kaufman, L.; Rousseeuw, P. Finding Groups in Data; John Wiley & Sons: New York, NY, USA, 1990. [Google Scholar]
- Halamić, J.; Peh, Z.; Bukovec, D.; Miko, S.; Galović, L. A Factor Model of the Relationship Between Stream Sediment Geochemistry and Adjacent Drainage Basin Lithology, Medvednica Mt., Croatia. Geol. Croat. 2001, 54, 37–51. [Google Scholar] [CrossRef]
- Davis, J.C. Statistics and Data Analysis in Geology, 3rd ed.; John Wiley & Sons: Hoboken, NJ, USA, 2002. [Google Scholar]
- Frančišković-Bilinski, S.; Scholger, R.; Bilinski, H.; Tibljaš, D. Magnetic, Geochemical and Mineralogical Properties of Sediments from Karst and Flysch Rivers of Croatia and Slovenia. Environ. Earth Sci. 2014, 72, 3939–3953. [Google Scholar] [CrossRef]
- Pons-Branchu, E.; Ayrault, S.; Roy-Barman, M.; Bordier, L.; Borst, W.; Branchu, P.; Douville, E.; Dumont, E. Three Centuries of Heavy Metal Pollution in Paris (France) Recorded by Urban Speleothems. Sci. Total Environ. 2015, 518, 86–96. [Google Scholar] [CrossRef]
Figure 1.
Position of Velebita cave system and Slovačka jama cave on the geological map of Velebit Mt. Litostratigraphical legend: J1 – limestones and dolomites (Lower Jurassic), J3 - limestones and dolomites (Upper Jurassic), Pg, Ng – carbonate breccia (Peleogene, Neogene). Map: Croatian Geological Survey (2009): Geological map of the Republic of Croatia M 1:300,000, Zagreb.
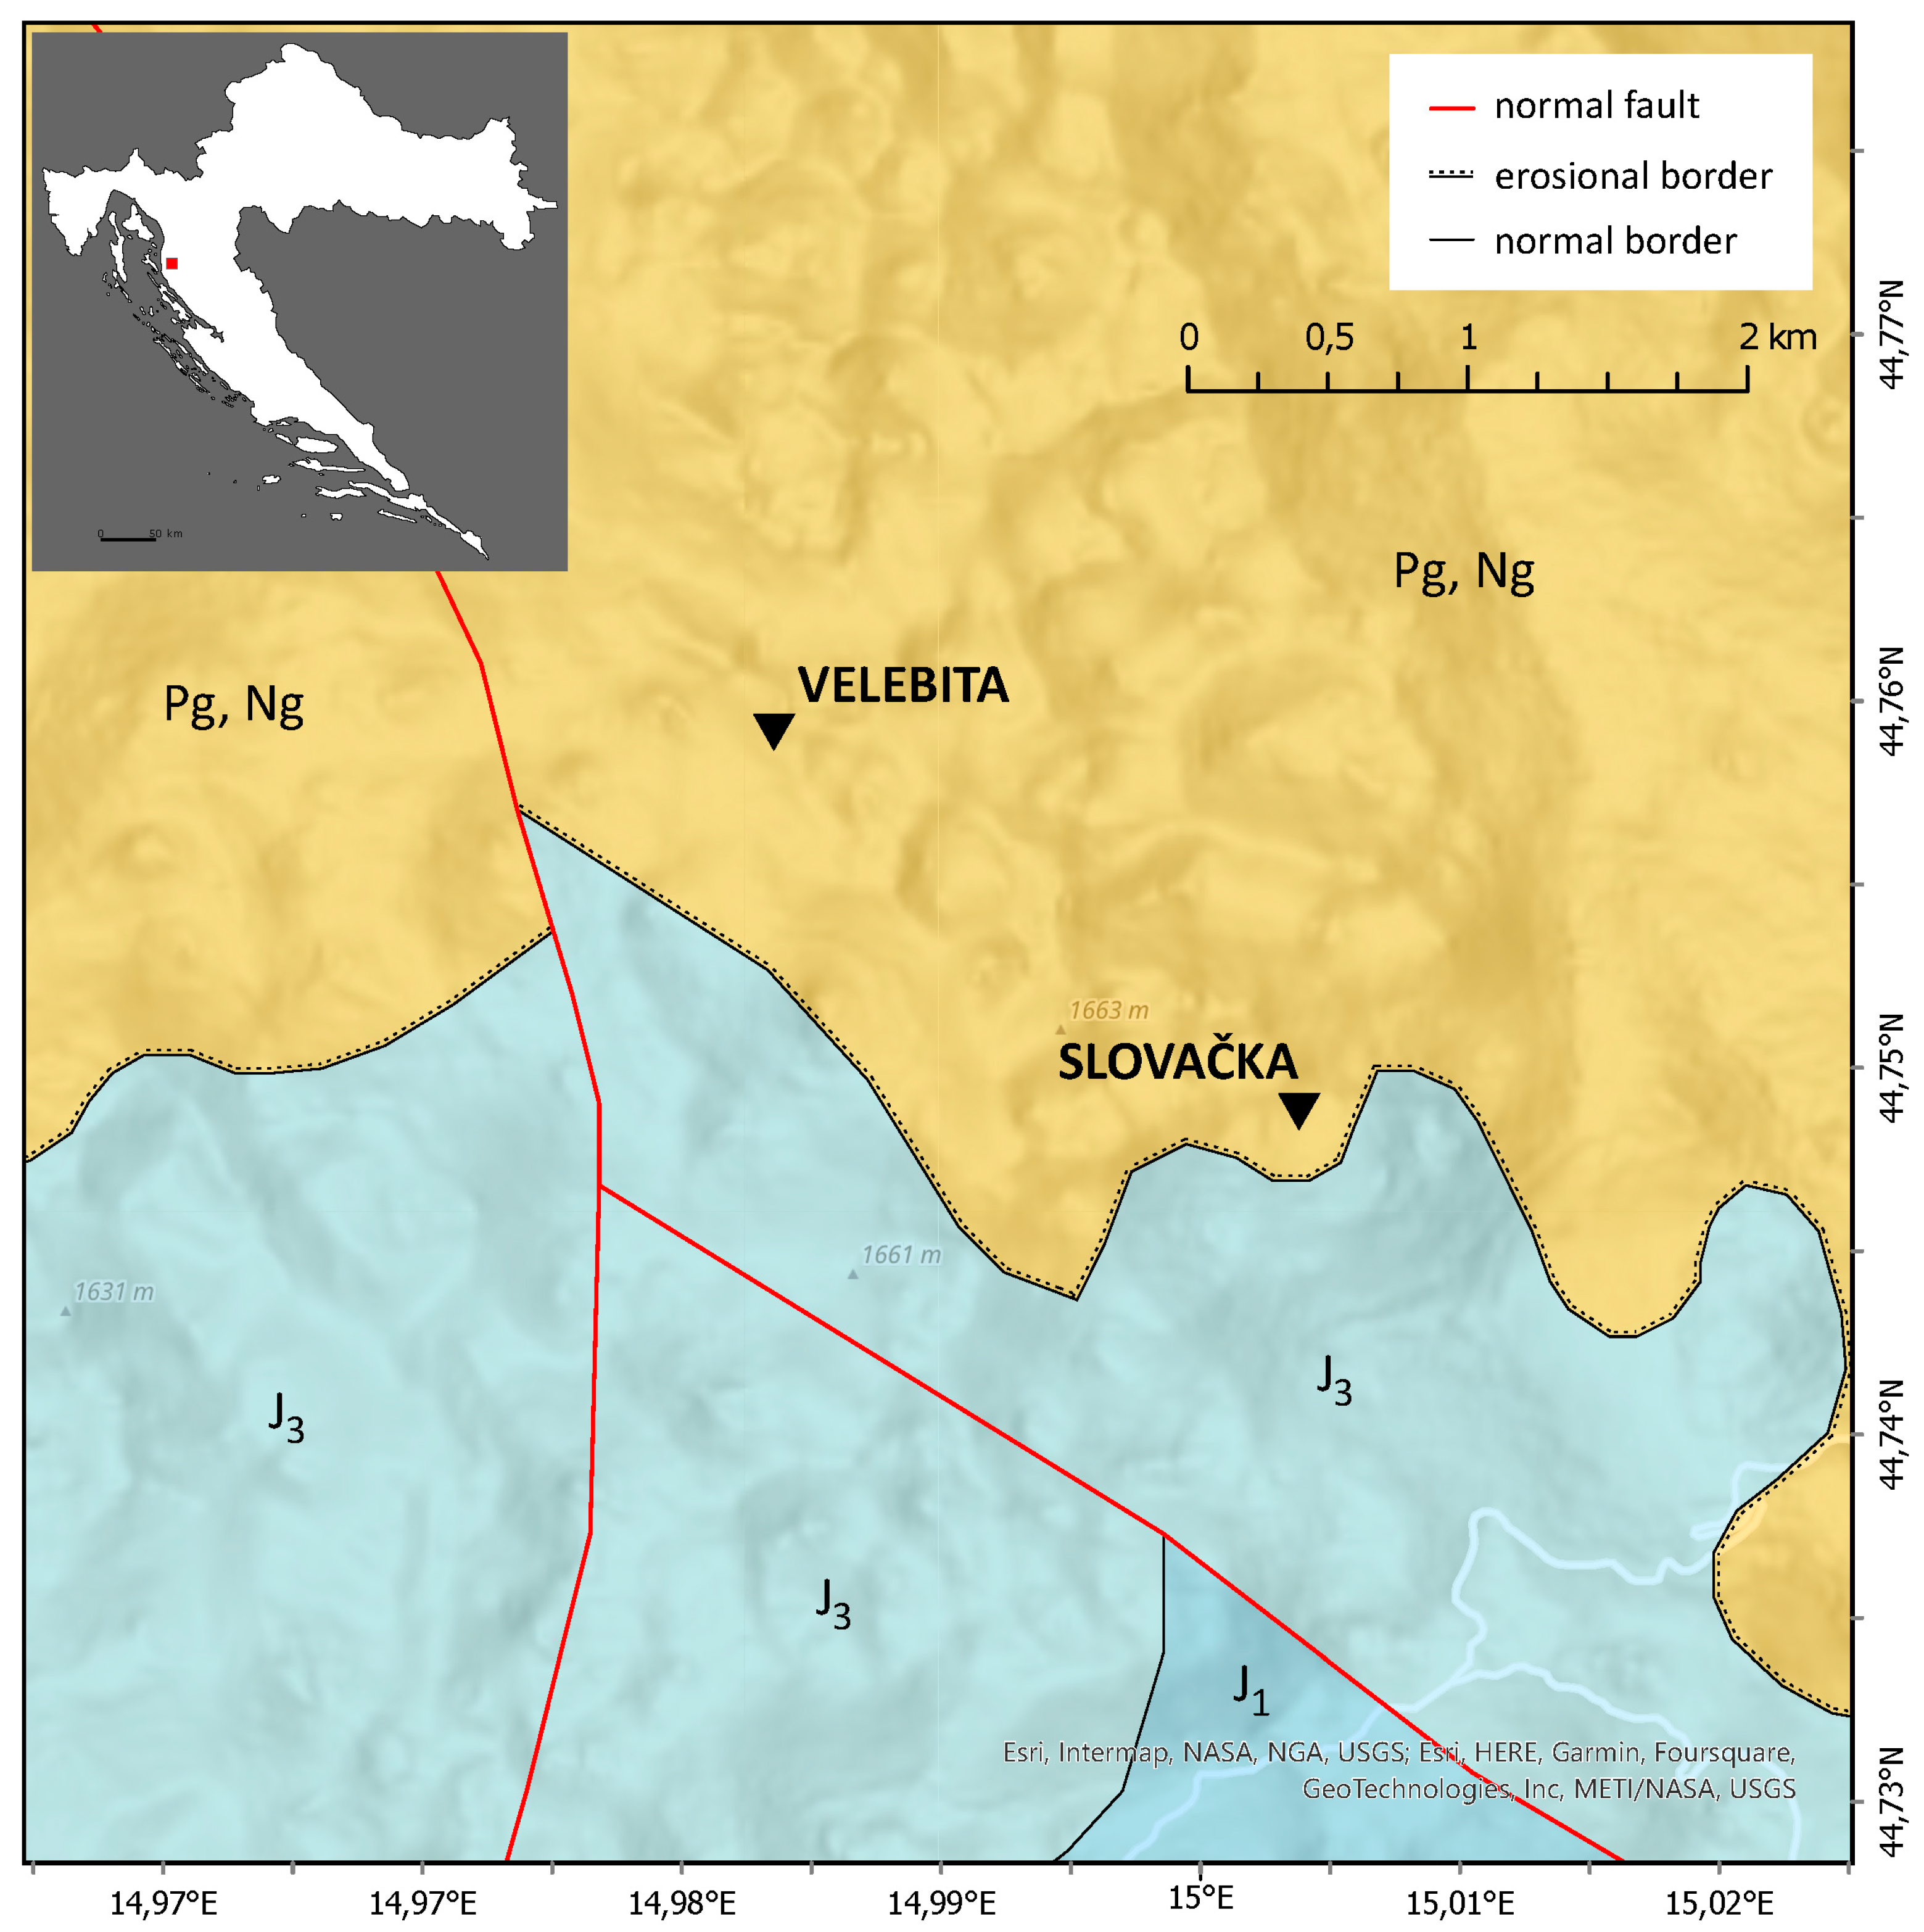
Figure 2.
Sampling locations in Slovačka jama and Velebita cave system, Velebit Mt., Croatia. Map: Speleological Committee of CMA (1993-2017).
Figure 2.
Sampling locations in Slovačka jama and Velebita cave system, Velebit Mt., Croatia. Map: Speleological Committee of CMA (1993-2017).
Disclaimer/Publisher’s Note: The statements, opinions and data contained in all publications are solely those of the individual author(s) and contributor(s) and not of MDPI and/or the editor(s). MDPI and/or the editor(s) disclaim responsibility for any injury to people or property resulting from any ideas, methods, instructions or products referred to in the content. |
© 2025 by the authors. Licensee MDPI, Basel, Switzerland. This article is an open access article distributed under the terms and conditions of the Creative Commons Attribution (CC BY) license (http://creativecommons.org/licenses/by/4.0/).
Copyright: This open access article is published under a Creative Commons CC BY 4.0 license, which permit the free download, distribution, and reuse, provided that the author and preprint are cited in any reuse.


