
Submitted:
18 June 2025
Posted:
19 June 2025
You are already at the latest version
Abstract
The Tuztaşı low-sulfidation epithermal Au–Ag deposit (Biga Peninsula, Türkiye) records a multi-stage hydrothermal history that can be decoded through the trace- and rare-earth-element (REE) chemistry of quartz. High-precision LA-ICP-MS analysis of five representative quartz samples (23 ablation spots; 10 analytically robust) reveal two fluid stages. Early fluids were cold, dilute meteoric waters (δ¹⁸O₍H₂O₎ ≈ –6.8 to +0.7 ‰), whereas later fluids circulated deeper, interacted with felsic basement rocks, and evolved chemically. Mineralized quartz displays marked enrichment in As (raw mean = 2 854 ± 6 821 ppm; filtered mean = 70 ± 93 ppm; one spot 16 775 ppm), K (498 ± 179 ppm), and Sb (57.8 ± 113 ppm), coupled with low Ti/Al (< 0.005) and elevated Ge/Si (0.14–0.65 µmol mol⁻¹). Chondrite-normalized REE patterns show pronounced but heterogeneous LREE enrichment ((La/Yb)ₙ ≤ 45.3; ΣLREE/ΣHREE up to 10.8) and strongly positive Eu anomalies (δEu ≤ 9.3) with slightly negative Ce anomalies (δCe ≈ 0.29); negligible Ce–Eu covariance (r² ≈ 0.05) indicates discrete redox pulses. These signatures pinpoint chemically evolved, reducing fluids conducive to Au–Ag deposition. By contrast, barren quartz is characterized by lower pathfinder-element contents, flatter REE profiles, higher Ti/Al, and subdued Eu anomalies. A composite exploration toolkit emerges: As > 700 ppm, As/Sb > 25, Ti/Al < 0.005, Ge/Si > 0.15 µmol mol⁻¹, and δEu ≫ 1 reliably demarcate ore-bearing zones when integrated with δ¹⁸O data, fluid-inclusion microthermometry, and structural mapping. The study provides one of the first systematic applications of integrated trace-element and REE analysis of quartz to a Turkish low-sulfidation epithermal system, offering a transferable template for vectoring mineralization in analogous settings worldwide
Keywords:
Türkiye
; low-sulfidation epithermal gold
; quartz geochemistry
; trace elements
; rare earth elements (REE)
; geochemical exploration
; hydrothermal fluid evolution
; redox controls
1. Introduction
Quartz, second only to feldspar in crustal abundance, occurs in igneous, metamorphic, sedimentary and hydrothermal rocks [1] . Its crystallization spans a remarkable temperature range: in some hydrothermal veins quartz can precipitate at ≈ 50 °C [2], whereas melt-inclusion studies show that felsic magmas may stabilize quartz up to roughly 750–900 °C [3]. Because the mineral is highly resistant to chemical alteration, it preserves fluid inclusions and stable-isotope signatures for millions of years, providing a dependable archive for reconstructing the thermal and chemical evolution of hydrothermal systems [4].
Within hydrothermal systems, migrating hot fluids transport both heat and dissolved components [5]. As these solutions move through the crust, evolving pressure, temperature, pH, and redox conditions govern the extent to which quartz sequesters trace and rare-earth elements—either in its lattice or in enclosed fluid inclusions. Element budgets shift systematically with fluid evolution: cathodoluminescence-guided LA-ICP-MS maps of vein quartz demonstrate that Al, Ti and Li variations follow SEM-CL growth zoning [6], while large datasets from porphyry- and epithermal-style deposits show stage-dependent Li/Al, Ti–Ge and As–Sb patterns in quartz that track ore-forming processes [7]. Once incorporated, these elements serve as geochemical proxies, recording the physicochemical conditions prevailing during metal precipitation [5,8].
Recent advances in LA-ICP-MS now permit micrometre-scale measurement of trace and rare-earth elements in quartz with reproducibility better than ~10 % RSD [9,10]. These datasets reveal systematic Al, Ti, Li and Ge variations that correlate with cathodoluminescence (CL) growth zones and fluid-evolution stages across porphyry, epithermal, IOCG, orogenic-gold and MVT deposits [2]. Building on this framework, recent studies have distinguished successive vein generations via Al/Ti, Sb/Ti and Ge/Ti ratios [12] and tracked fluid evolution in the Bilihe porphyry Au deposit using combined Ti, Al, Li and Ge mapping [13]. Against this backdrop a focused LA-ICP-MS investigation of quartz from the Tuztaşı low-sulfidation system can clarify its multi-stage mineralisation history while providing new geochemical vectors for exploring analogous deposits in western Türkiye.
Western Anatolia’s Biga Peninsula is a major locus of Cenozoic magmatism and metallogeny within Turkey. Geologically, it sits at the western tip of the Sakarya Zone, within the Alpine-Himalayan orogenic belt, and was assembled during Early Tertiary collisions of Palaeozoic–Mesozoic terranes [14,15]. The region’s basement, the Kazdağı Massif, records multiple episodes of metamorphism and magmatism since [15] the Middle Carboniferous, with three main tectonostratigraphic zones trending NW–SE [15]. High-K calc-alkaline to shoshonitic magmatism during the Oligo–Miocene was instrumental in forming major porphyry, epithermal, and skarn-type Au–Cu–polymetallic deposits in the Western Tethys Metallogenic Belt [16,17,18]. The distribution of these systems is closely linked to Cenozoic post-collisional extension and crustal thickening. Gold and copper mineralization in Biga is mainly controlled by fault systems formed under alternating compressional and extensional regimes [19]. High-sulfidation systems (e.g., Alanköy, Karaayı, Kirazlı) are widespread [20], whereas intermediate-sulfidation (e.g., Şahinli, Tespihdere) and low-sulfidation (e.g., Küçükdere, Madendağ) deposits are less common [21,22,23].
The Tuztaşı gold mineralization is situated in northwestern Turkey, within the villages of Tuztaşı and Uzunalan (Ayvacık district) and Alakeçi, Yassıbağ, and Serhat (Bayramiç district), Çanakkale Province. Located in the Biga Peninsula, Tuztaşı represents a well-preserved example of a low-sulfidation epithermal system [22,24,25]. This mineralization developed within amphibolite and schist lithologies of the Sütüven Formation, hosted along multiple generations of quartz veins that reflect distinct hydrothermal stages. In the present study, quartz samples obtained from the primary gold-bearing vein system were subjected to detailed analysis of trace element and rare earth element (REE) concentrations using LA-ICP-MS.
The principal objective of this research is to elucidate the temporal evolution of the hydrothermal fluids responsible for the Tuztaşı gold deposit and to delineate the behavior of trace elements and REEs that reflect variations in the gold content of quartz. A concurrent aim is to evaluate the utility of quartz mineral chemistry as an indicative tool in the exploration for similar deposit types. Accordingly, the trace element content and REE fractionation patterns in quartz were meticulously examined, and the relationship between these chemical signatures and gold precipitation was assessed. Anomalies observed in highly redox-sensitive elements, notably Cerium (Ce) and Europium (Eu), have yielded insights into the oxidation-reduction conditions of the hydrothermal fluids, thereby contributing to an enhanced understanding of the mineralization processes. The findings from this work not only reveal the metallogenic characteristics of the Tuztaşı mineralization but also provide crucial data for a more precise classification of this system within the broader context of epithermal gold deposits.
In this respect, the study is among the initial and more distinctive investigations in Turkey to systematically appraise quartz mineral chemistry, integrating both REE and trace element data, within low-sulfidation epithermal gold systems. The comprehensive approach, which considers multi-component fluid evolution and incorporates contributions from both clastic and magmatic sources, is expected to offer valuable direction for the exploration of other gold deposits in the region.
2. Materials and Methods
The Trace and rare earth element (REE) concentrations in quartz from the Main Quartz Vein (MQV) were determined by LA-ICP-MS at the İstanbul University-Cerrahpaşa Geochronology and Geochemistry Laboratory. Analyses were conducted on a Perkin Elmer NexION 2000 ICP-MS instrument, coupled to an ESI NWR 213 nm solid-state laser ablation system, using a 50 µm spot size, 20 seconds background, 30 seconds ablation, and 30 seconds washout; helium (0.5 L min⁻¹) served as the carrier gas, with a laser fluence of 5 J/cm², repetition rate of 10 Hz, and scan speed of 5 µm/s. External calibration employed BCR-2G for major elements (Al, K, Ti), NIST SRM 612 for trace elements (As, Sb, Pb, Zn), and NIST SRM 610 for REE, while silicon (Si, 29.76 wt%) was used as the internal standard. Detection limits were approximately 0.01 ppm for Au and Ag, 0.1–1 ppm for other trace elements, and 0.01–0.05 ppm for REE.
A total of 23 laser ablation spots were targeted across five quartz samples. Among these, ten spots yielded reliable trace/REE signals and form the basis for the geochemical interpretations discussed herein.
Cerium (Ce) and europium (Eu) anomalies were calculated using chondrite-normalized values as follows:
where the subscript “n” denotes chondrite-normalized values, using the normalization constants of Sun and McDonough [26]. Data reduction and quality control—including checks on signal stability, detection limits, and potential spectral interferences—were carried out using the SILLS software package [10].
Ce anomaly (δCe) = Ceₙ / √(Laₙ × Prₙ)
Eu anomaly (δEu) = Euₙ / √(Smₙ × Gdₙ)
3. Results
3.1. Geology of Study Area
The Tuztaşı gold mineralization developed along a NW-SE trending fault zone that transects the upper levels of the Kazdağı Massif within the Biga Peninsula [27]. The Sütüven Formation, which hosts the deposit, is mainly composed of amphibolite, gneiss, metagranite, and intercalated marble bands. Gneisses display pronounced foliation, while metagranites locally exhibit transitional granite–gneiss textures. Aplite veins within these units are rich in muscovite and plagioclase.
To the southwest, the Çetmi Ophiolitic Melange forms a complex assemblage of serpentinite, diabase, gabbro, sandstone, and limestone blocks. The Evciler Pluton, of granitic composition, is intensely cataclastically deformed along its contact with the Kazdağı Massif, displaying fractured and foliated granite textures.
The region is structurally shaped by NW-SE trending thrust and strike-slip faults. The Şelale Detachment Fault delineates the boundary between the Kazdağı Massif and the Çetmi Melange. Concurrently, the NE-SW trending Uzunalan Fault tectonically juxtaposes serpentinite and limestone blocks of the melange with amphibolite, marble, and metagranite units of the Sütüven Formation. The Evciler Fault, exhibiting a dextral strike-slip component, creates a distinct structural separation between the Evciler Pluton and the metamorphic units of the massif. In addition, synthetic and antithetic faults locally offset quartz and aplite veins by several centimeters to meters (Figure 1).
Gold mineralization is concentrated within the Main Quartz Vein (MQV), which trends approximately N50°E, dips \~40°NE, and reaches 2 km in length and 3–8 m in thickness. The MQV crosscuts sequences of amphibolite–marble and metagranite and is mainly composed of quartz, chalcedony, and opal, with localized development of hematite, goethite, pyrite, and marcasite. Surface samples show disseminated pyrite and free gold, reflecting post-vein oxidation processes.
3.2. Quartz Mineral Chemistry
Trace- and rare-earth-element concentrations were measured by LA-ICP-MS on five quartz samples from the Main Quartz Vein (MQV), representing both mineralized and barren domains. A total of 23 laser-ablation spots were positioned systematically to give representative coverage of the vein.
3.2.1. Trace Element Contents
Analyses of the mineralized quartz spots show that gold ranges from 0.03 to 22.34 ppm and averages 4.9 ± 8.6 ppm (detection limit 0.01 ppm; see Table 1). Silver is somewhat more variable, between 0.23 and 48.78 ppm, with a mean of 15.2 ± 19.9 ppm. On the same samples the mean concentrations are: As 2 854 ± 6 821 ppm, Sb 57.8 ± 113 ppm, Se 5.7 ± 12 ppm, Pb 280 ± 632 ppm, Zn 406 ± 902 ppm, Al 2 771 ± 1 213 ppm, K 498 ± 179 ppm, Ti 26.5 ± 25.7 ppm, Ge 1.72 ± 0.37 ppm and Sn 0.40 ± 0.44 ppm. These standard-deviation values include both analytical error and natural scatter. One sample (73-4) contains exceptionally high As (16 775 ppm) and Zn (2 245 ppm); its inclusion pulls the overall means upwards. Filtered statistics without that outlier are listed in (Table 1), where As falls to 70 ± 93 ppm and Zn to 14 ± 14 ppm.
Element levels in barren quartz are much lower: gold sits at the detection limit (< 0.04 ppm), silver averages about 4.4 ± 3.9 ppm, arsenic 53 ± 47 ppm, antimony 14 ± 6 ppm, aluminium 6 165 ± 3 611 ppm, potassium roughly 1 780 ± 2 114 ppm and titanium about 39 ± 51 ppm. The contrast underscores the different temperature-pH–redox regimes recorded by the mineralized and barren zones, and reveals how the As–Sb–Zn-rich fluids were unevenly distributed along the vein.
Arsenic displays a highly skewed distribution (Figure 2). One mineralized spot (sample 73-4) yielded 16 775 ppm As—>10× higher than any other analysis—resulting in a raw mean of 2 854 ± 6 821 ppm for mineralized quartz (n = 10). Because this single outlier inflates the mean and standard deviation, we report both the raw statistics and a filtered dataset (As = 70 ± 93 ppm; n = 9) that excludes 73-4. Unless stated otherwise, discussion and comparative plots use the filtered values.
3.2.2. REE Distribution and Fractionation Parameters
Chondrite-normalised REE patterns were evaluated for the ten analytically robust laser-ablation spots (five mineralized, five barren) selected from different parts of the Main Quartz Vein (Table 2). Total REE contents (ΣREE) range from 1.62 to 312.04 ppm, with a mean of 40.7 ppm. The light-to-heavy REE ratio (ΣLREE/ΣHREE) spans 0.21–10.84 (average = 2.9), indicating pronounced but heterogeneous LREE enrichment relative to HREE.
Cerium anomalies, calculated as δCe = Ceₙ / √(Laₙ × Prₙ), vary from 0.11 to 0.89 (mean = 0.29), whereas europium anomalies, calculated as δEu = Euₙ / √(Smₙ × Gdₙ), range from 0.63 to 9.31 (mean = 4.33). The strongly positive δEu values imply a significant Eu²⁺ component, compatible with reducing conditions and/or feldspar breakdown.
Fractionation indices likewise vary widely:
(La/Yb)ₙ = 0.31–45.26 (mean = 12.6)
(La/Sm)ₙ = 0.31–12.77 (mean = 3.83)
Together, these data reveal marked REE heterogeneity within the vein and highlight zones that combine extreme LREE enrichment with pronounced positive Eu anomalies—features that may trace fluid pathways and redox gradients active during ore formation.
4. Discussion
4.1. Characteristics of the Ore-Forming Fluid: Integrated Evidence from REE and Oxygen Isotopes
The hydrothermal fluids that generated the Tuztaşı low-sulfidation epithermal deposit evolved through progressive interaction with felsic basement rocks and fluctuating redox conditions. These changes are recorded in the rare-earth-element (REE) signature of hydrothermal quartz [6] and in its oxygen-isotope composition [28,29].
4.1.1. Evolution of Ore-Forming Fluids: REE and δ¹⁸O Evidence
A total of 23 LA-ICP-MS spot analyses were performed on both mineralized and barren quartz samples. In mineralized quartz, chondrite-normalized REE patterns exhibit a marked enrichment of light rare earth elements (LREEs) relative to heavy rare earth elements (HREEs). The (La/Yb)ₙ ratio varies from 0.31 to 45.26, with an average of approximately 12.6, while the (La/Sm)ₙ ratio ranges from 0.31 to 12.77, averaging around 3.83. In contrast, barren quartz displays flatter normalized profiles and significantly lower LREE/HREE ratios, indicating limited interaction with REE-rich lithologies.
Among the mineralized samples, the europium anomaly is calculated as:
δEu = Euₙ / √(Smₙ × Gdₙ)
The values range from 0.63 to 9.31, with a mean of approximately 4.33. These strong positive anomalies reflect the stabilization and retention of Eu²⁺ under reducing conditions. In contrast, the cerium anomaly is defined as:
and varies between 0.11 and 0.89 (mean ≈ 0.29), indicating that Ce remained predominantly in the trivalent state (Ce³⁺), with limited oxidative conversion to Ce⁴⁺. The weak correlation between δEu and δCe (R² ≈ 0.05) implies that these anomalies developed independently under distinct redox conditions [28,30].
δCe = Ceₙ / √(Laₙ × Prₙ)
Oxygen isotope analyses conducted on the same quartz samples yield δ¹⁸O₍Qz₎ values between 6.6 ‰ and 8.6 ‰. Using a quartz–water fractionation factor of approximately 9.4 ‰—appropriate for homogenization temperatures around 213 °C [31,32], these values correspond to calculated fluid δ¹⁸O₍H₂O₎ values between –6.8 ‰ and +0.7 ‰. These values are typical of low-salinity meteoric waters in low-sulfidation epithermal systems [33].
Taken together, the REE systematics and δ¹⁸O signatures define a two-stage hydrothermal evolution.
- I.
- Meteoric Influx Stage: Early hydrothermal fluids were dominated by cold, dilute meteoric waters (δ¹⁸O₍H₂O₎ ≈ –6.8 ‰ to +0.7 ‰) with minimal LREE enrichment.
- II.
- Deep Circulation and Felsic–Rock Interaction: As fluids penetrated deeper into the crust, they interacted with REE-bearing, felsic lithologies (i.e., the Evciler Pluton and Sütüven Formation). These granitic and metagranitic rocks, rich in feldspar and mica, contributed LREEs and Eu²⁺ to the evolving fluids, producing REE patterns with (La/Yb)ₙ values up to 45.26 and pronounced positive δEu anomalies.
This geochemical evolution fostered conditions favourable for Au–Ag precipitation, particularly during late-stage cooling and localized redox fluctuations [34,35]. The Tuztaşı system thus reflects a transition from meteoric-dominated fluids to chemically evolved, reducing fluids—a transformation tracked effectively by combined REE and δ¹⁸O evidence.
Comparable geochemical trends have been observed in other systems. For instance, in the Shihu Au deposit (China), quartz exhibits only weak LREE enrichment and negative Eu–Ce anomalies, attributed to limited felsic rock interaction and less evolved fluid compositions [36]. In contrast, the Geyer Sn-skarn (Germany) and the Cerro de Pasco high-sulfidation system (Peru) both show quartz-hosted REE patterns that are sharply LREE-enriched and carry pronounced positive Eu anomalies—features interpreted as the result of direct magmatic input and prolonged fluid–rock interaction with felsic intrusions [37,38]. The Tuztaşı system exhibits a remarkably similar geochemical trajectory, highlighting the role of felsic host rocks in shaping the REE signature and redox conditions of ore-forming fluids.
4.1.2. Redox Control on Eu–Ce Anomalies
Anomalies in cerium and europium concentrations preserved in mineralized quartz offer valuable insights into redox conditions during ore formation at Tuztaşı. The europium anomaly, expressed as
ranges from 0.63 to 9.31, with an average value of 4.33. These elevated δEu values indicate significant stabilization of Eu²⁺ under reducing conditions. In contrast, cerium shows a different behavior. The cerium anomaly, calculated as
varies from 0.11 to 0.89 (mean ≈ 0.29), such negative δCe values indicate that a significant fraction of Ce³⁺ was oxidised to Ce⁴⁺ and removed from the fluid phase, pointing to locally more oxidising conditions during quartz growth [8,30].
δEu = Euₙ / √(Smₙ × Gdₙ)
δCe = Ceₙ / √(Laₙ × Prₙ)
Figure 3a shows Pathfinder δEu plotted against δCe; the negligible correlation (R² ≈ 0.05) indicates that europium and cerium anomalies did not form contemporaneously but record at least two distinct redox pulses. The strong positive Eu anomaly (δEu = 0.63–9.31) points to stabilisation of Eu²⁺ under transiently reducing conditions. Such Eu²⁺ enrichment is commonly generated when acidic, reducing fluids destabilise feldspar—especially plagioclase—liberating Eu that partitions into the fluid as Eu²⁺ before being sequestered in quartz or fluorite [8]. In contrast, the muted Ce anomaly (δCe = 0.11–0.89) implies that Ce remained largely trivalent, with only limited oxidation to Ce⁴⁺ [30]. In contrast, δCe values ranging from 0.11 to 0.89—significantly lower than 1—indicate that a substantial portion of Ce³⁺ in the fluid phase was oxidized to Ce⁴⁺ and subsequently removed through precipitation or adsorption. Thus, these anomalies record relatively short-lived oxidizing episodes during quartz precipitation [30].
In some other deposits (e.g., Shihu, China), δCe and δEu values have been reported to increase and decrease in tandem, reflecting limited redox fluctuations during a single fluid pulse—specifically, partial oxidation of Ce and simultaneous partial reduction of Eu [36]. In contrast, at Tuztaşı, there is no meaningful correlation between δEu and δCe (Figure 3a, R² ≈ 0.05), indicating that Eu²⁺ enrichment occurred during short-lived reducing phases, whereas Ce behavior reflects more oxidizing intervals.
Taken together, these redox-sensitive anomalies are consistent with the broader hydrothermal evolution inferred from REE fractionation patterns and δ¹⁸O data. Prolonged fluid–rock interaction with felsic basement rocks likely maintained reducing conditions that favored Eu²⁺ enrichment [8,30]. In contrast, the absence of a δEu–δCe correlation, along with the presence of distinct Ce anomalies, points to intermittent oxidative inputs—possibly triggered by transient shifts in fluid pathways or minor mixing with shallow, oxidized groundwater. These localized redox oscillations likely created micro-environments favorable for Au–Ag precipitation [35]. Taken together, the decoupled behavior of δEu and δCe in mineralized quartz points to complex, stage-specific redox dynamics during fluid evolution. When interpreted alongside REE distribution and oxygen isotope signatures, these anomalies provide a nuanced geochemical record of the conditions that governed ore precipitation in the Tuztaşı epithermal system
4.2. REE Fractionation Mechanisms
Mineralized quartz from the Tuztaşı low-sulfidation epithermal system shows a pronounced enrichment of light REEs over heavy REEs, as reflected by high chondrite-normalized (La/Yb)ₙ and (La/Sm)ₙ ratios—an outcome best explained by ligand-controlled complexation coupled with ongoing fluid–rock interaction [30,39].
LA-ICP-MS spot analyses targeting quartz growth zones yielded the following averages in mineralised quartz: (La/Yb)ₙ = 0.31–45.26 (mean = 12.6) and (La/Sm)ₙ = 0.31–12.77 (mean = 3.83). Such pronounced LREE enrichment implies that La, Ce and Nd must have been efficiently mobilised into the hydrothermal fluid. The feldspar- and mica-rich gneisses and metagranites of the Sütüven Formation and the adjacent Evciler Pluton contain accessory allanite and monazite, which are plausible primary LREE reservoirs and therefore the most likely solid sources for the liberated REE budget during hydrothermal alteration [29].
Thermodynamic Context: Experimental data show that at moderate to high temperatures (≈ 200–400 °C) and slightly acidic pH (4–6), LREEs form stable chloride (LREE–Cl) and carbonate (LREE–CO₃) complexes that greatly enhance their solubility [39]. As the fluids cool or pH rises, these complexes break down, promoting LREE precipitation into quartz or micro-inclusions [40]. Fluid-inclusion salinities of 2–5 wt % NaCl eq. in Tuztaşı quartz are likewise consistent with the predominance of neutral LREE–Cl⁰ and carbonate LREE–CO₃⁻ species [41].
Conversely, HREEs preferentially form complexes with phosphate, sulfate or fluorine ligands—minerals that are scarce in Tuztaşı wall rocks. Consequently, HREEs remain largely immobile or are locked in resistant accessory phases, accounting for their depletion in quartz (no monazite-hosted HREE phases were observed in Sütüven samples).
Elevated (La/Yb)ₙ and (La/Sm)ₙ ratios in Tuztaşı quartz therefore record a dynamic fractionation regime in which early fluid–rock interaction mobilised LREEs, whereas subsequent cooling and redox shifts drove their precipitation. Grouped frequency plots of these ratios (Figure 3a for (La/Yb)ₙ and Figure 3b for (La/Sm)ₙ) clearly separate “Mineralised” from “Barren” quartz populations. A similar LREE-rich signature has been reported from the Geyer Sn-skarn in Germany and from quartz veins of the Potosí district in Bolivia, where sustained interaction with felsic crust governs REE geochemistry [42].
4.3. Significance of REE and Trace Element Distributions in Ore-Forming Processes
Comparison of mineralised and barren quartz from the Tuztaşı vein reveals statistically robust contrasts in both trace elements and REE contents, shedding light on the fluid conditions that controlled gold precipitation. These contrasts define reliable geochemical criteria for distinguishing ore-bearing zones from barren alteration halos.
Aluminium provides the clearest discriminator. Mineralised quartz contains 2771 ± 1213 ppm Al, whereas barren quartz reaches values as high as 6165 ppm. High Al in barren material likely reflects (i) higher crystallisation temperatures and/or (ii) stronger pH buffering, either of which enhances Al³⁺ incorporation via H⁺-substitution mechanisms in the quartz lattice [11,43]. Conversely, lower Al in mineralised quartz implies precipitation from cooler, chemically evolved fluids—conditions favourable for Au deposition (see Table 2). This Al depletion aligns with higher As, K and Sb contents, reinforcing the link between reduced Al uptake and ore-forming fluid evolution.
Titanium concentrations also differ markedly: mineralised quartz averages 26.5 ± 25.7 ppm Ti, whereas barren quartz averages 39 ± 51 ppm. Such depletion implies cooler crystallisation, because Ti⁴⁺ incorporation in quartz decreases exponentially with temperature (Thomas et al. 2012; Wark and Watson 2006). Consistently, the Ti/Al ratio—a sensitive proxy for growth temperature and redox state—is lower in mineralised quartz (0.0041 ± 0.0004) than in barren samples (0.0084 ± 0.0008), underscoring its value as a thermal-redox vector for ore targeting ([44]; Table 2).
REE fractionation patterns reinforce this contrast. Mineralised quartz shows markedly higher (La/Yb)ₙ ratios (mean ≈ 12.6), reflecting strong LREE enrichment, whereas barren quartz displays flatter chondrite-normalised patterns and lower LREE/HREE slopes. These differences likely stem from prolonged interaction between hydrothermal fluids and REE-bearing felsic host rocks under reducing conditions [42].
Redox-sensitive anomalies provide further insight. δCe values remain slightly negative in mineralized quartz (mean ≈ 0.29), while δEu anomalies are strongly positive (mean ≈ 4.33). This pattern suggests that gold precipitation occurred under moderately reducing conditions sufficient to stabilize Eu²⁺ but insufficient for extensive oxidation of Ce³⁺ to Ce⁴⁺ [8,30]. These trends are summarized in Table 2.
Trace elements such as As, K and Sb show marked enrichment in ore-bearing quartz. After exclusion of the single high-As outlier, arsenic still averages ~70 ± 93 ppm, roughly seven times higher than in barren quartz, while potassium reaches ~500 ± 180 ppm. In addition, the As/Sb ratio clusters around 31 in mineralised spots but remains < 5 in barren quartz, underscoring a pronounced chemical break across the vein. Although no community-wide threshold has been codified, studies of quartz from other low-sulfidation and intermediate-sulfidation systems document similar enrichment of As relative to Sb in late, ore-proximal stages (e.g., Gao et al.[7]). In the Tuztaşı dataset, ratios >25 consistently coincide with textural evidence for fluid conduits and therefore constitute a practical geochemical vector toward the Au-Ag deposition front (Table 2).
Collectively, these results support a multi-element geochemical model for identifying productive quartz veins. The data suggest that ore-forming fluids at Tuztaşı evolved from meteoric waters toward chemically mature systems with enhanced LREE content and Eu²⁺ stability under reducing conditions, enabling gold precipitation in structurally favorable zones.
4.4. Quartz Chemistry as a Vectoring Tool for Gold Exploration
Trace elements such as As, K and Sb are markedly enriched in ore-bearing quartz from the Main Quartz Vein: the filtered averages are As = 70 ± 93 ppm, K = 498 ± 179 ppm and Sb = 57.8 ± 3.4 ppm, compared with much lower levels in barren samples (Table 2). In addition, the mean As/Sb ratio of ≈ 31 is well above the >25 threshold that characterises fluid up-flow zones in many epithermal and porphyry systems; comparable As–Sb enrichments (and their use as exploration vectors) are documented in the global compilation of quartz-trace-element data by Gao et al. [7].
Potassium enrichment probably reflects tiny sericite/illite or K-feldspar inclusions introduced during wall-rock alteration; this mechanism—together with the overall Al-substitution control on quartz trace element budgets—has been demonstrated for hydrothermal veins at Butte and other porphyry Cu systems by Rusk et al. [45].
The single outlier that contains >16 000 ppm As (sample 73-4) may signify a short-lived input of magmatic vapour, which can selectively concentrate semi-metals such as As by several orders of magnitude; selective metal partitioning into magmatic vapour versus brine was quantified in the Yankee Lode study of Audétat et al. [46].
Taken together, the thresholds As > 700 ppm, As/Sb > 25 and elevated K provide a reliable geochemical vector that distinguishes mineralised segments of the Tuztaşı vein from barren quartz.
The As/Sb ratio—which averages ≈ 31 ± 3 at Tuztaşı—stands out as a practical exploration filter: values > 25 commonly mark fluid up-flow zones and ore-proximal quartz [7] (Gao et al. 2022). When this ratio is paired with petrographic criteria such as red cathodoluminescence (CL) zoning, it delineates high-priority drill or surface targets far more effectively than single-element thresholds alone (Table 2).
Physicochemical Indicators: Ti/Al and Ge/Si Ratios
The Ti/Al ratio in quartz reflects growth temperature, whereas its combined behaviour with Ge/Si is sensitive to fluid redox state. Mineralised Tuztaşı quartz records a significantly lower Ti/Al = 0.0041 ± 0.0004 than barren quartz (0.0084 ± 0.0008), signifying crystallisation from cooler fluids, consistent with the temperature-dependent Ti solubility calibrated by Wark & Watson [44] and refined for pressure effects by Thomas et al. [47].
Concurrently, Ge/Si is higher in mineralised samples (0.14–0.65 µmol mol⁻¹) than in barren ones (≤ 0.12 µmol mol⁻¹). The combination of low Ti/Al and elevated Ge/Si matches the trend documented by Rusk et al. [11] who showed that Ge enrichment and Ti depletion coincide with reduced, Au-depositional stages in epithermal quartz. Together these ratios therefore constitute a robust vector toward Au–Ag ore, pinpointing cooler, mildly reducing fluid pathways within the Tuztaşı vein. Likewise, the Ge/Si ratio—0.14–0.65 µmol mol⁻¹ in mineralised quartz versus 0.03–0.12 µmol mol⁻¹ in barren quartz—indicates selective Ge enrichment under chemically evolved fluid conditions. Because germanium and gold can be co-transported in low-salinity, slightly reducing fluids, elevated Ge/Si values are a useful proxy for zones of enhanced metal-carrying capacity ([11]; Table 2). These element patterns benchmark Tuztaşı against other deposit styles and emphasise its distinctive low-sulfidation epithermal signature (Figure 4).
Redox-Sensitive Anomalies: δCe and δEu
The contrasting magnitudes of the two anomalies give an additional exploration vector. Strongly positive δEu (mean ≈ 4.3) implies sustained reducing conditions capable of stabilising Eu²⁺, whereas slightly negative δCe (mean ≈ 0.29) indicates that Ce remained largely trivalent and was not oxidised to Ce⁴⁺. The resulting Eu–Ce decoupling—well documented as a redox proxy in hydrothermal quartz by Bau (1996) and Monecke et al. (2002)—pinpoints segments of the vein where Eu²⁺-favourable conditions promoted gold precipitation while Ce chemistry was essentially unaffected (see Table 2).
Additional Indicators: Sn, Fluid Inclusion Data
Mineralized quartz also contains an average of 0.40 ppm Sn—modest, yet significant when considered alongside As and LREE enrichment. This may indicate deep interaction with tin-bearing granitic sources. Fluid inclusion data further support the interpretation of chemically evolved fluids: average homogenization temperatures of ~213 °C and low salinities (~2–5 wt.% NaCl eq.) are consistent with LS epithermal models [25].
Exploration Guidelines and Practical Recommendations
Based on the geochemical signatures observed in the Tuztaşı low-sulfidation epithermal system, the following vectoring criteria are proposed for field application. These indicators integrate trace element geochemistry, redox-sensitive anomalies, and fluid inclusion characteristics to support efficient drill targeting and geochemical mapping.
- I.
- Prioritise zones where arsenic exceeds 700 ppm, antimony is greater than 50 ppm, and the As/Sb ratio exceeds 25—especially in samples displaying red cathodoluminescent (CL) zoning or fluid-inclusion trails.
- II.
- Target quartz veins with Ti/Al ratios below 0.005 and Ge/Si ratios greater than 0.15 µmol mol⁻¹. These thresholds mark intervals affected by cool, metal-bearing, and chemically evolved hydrothermal fluids.
- III.
- Map δEu and δCe anomalies as redox tracers. Strongly positive δEu values accompanied by neutral to slightly negative δCe values are characteristic of fluid pulses associated with ore deposition fronts.
- IV.
- Use Al and Ti concentrations as mineralogical proxies for growth conditions. Quartz with Al < 3000 ppm and Ti < 30 ppm typically represents low-temperature, late-stage mineralizing phases.
- V.
- Integrate δ¹⁸O and fluid inclusion data where available, to constrain meteoric water input and fluid evolution trends throughout the hydrothermal system.
These combined criteria—derived from detailed analytical results (Section 4.1 to Section 4.4) and supported by the compositional trends in Table 2—highlight the utility of quartz geochemistry as a sensitive, cost-effective exploration tool. When used in conjunction with petrographic and structural observations, these geochemical vectors can greatly improve targeting precision and reduce the risk of false anomalies during early-stage exploration in epithermal terranes.
5. Conclusions
This investigation demonstrates that the trace- and rare-earth-element (REE) chemistry of hydrothermal quartz offers an incisive window into the physicochemical evolution of the Tuztaşı low-sulfidation epithermal Au–Ag system and provides a practical geochemical toolkit for exploration in similar terranes. High-resolution LA-ICP-MS analyses, integrated with quartz δ¹⁸O data, reveal a two-stage fluid history: (i) an early influx of low-salinity meteoric waters and (ii) subsequent deep circulation and prolonged interaction with felsic basement rocks of the Kazdağı Massif and Evciler Pluton. This transition is recorded by pronounced but heterogeneous LREE enrichment ((La/Yb)ₙ up to 45.3) and strongly positive Eu anomalies (δEu up to 9.3), in concert with slightly negative Ce anomalies. The negligible Ce–Eu covariance (r² ≈ 0.05) indicates that Eu²⁺ stabilization and Ce oxidation occurred during discrete redox pulses, underscoring episodic fluid mixing and fluctuating redox states during ore precipitation.
Systematic contrasts between mineralized and barren quartz confirm the sensitivity of specific trace-element and elemental-ratio proxies to these evolving conditions. Mineralized specimens are characterized by elevated As (filtered avg. 70 ± 93 ppm; raw median 759 ppm; locally > 16 000 ppm in a single spot) and Sb, high K (~500 ppm on average in the filtered dataset; raw median ≈ 836 ppm), low Ti/Al (<0.005), and enriched Ge/Si (>0.15 µmol mol⁻¹), all diagnostic of chemically evolved, reducing fluids capable of transporting and precipitating precious metals. In parallel, markedly positive δEu and depleted δCe values pinpoint zones where Eu²⁺-stabilizing, Au-favourable redox conditions prevailed. Collectively, these parameters delineate a robust geochemical footprint that distinguishes ore-bearing veins from barren equivalents.
From an exploration standpoint, the study validates quartz geochemistry as a rapid, cost-effective vectoring method during early-stage prospect evaluation. Threshold values such as As >700 ppm, As/Sb >25, Ti/Al <0.005, and δEu ≫ 1 emerge as reliable indicators of proximity to mineralized zones, especially when integrated with fluid-inclusion microthermometry, and structural mapping. Adoption of these criteria will sharpen drill-hole targeting, reduce exploration risk, and complement conventional pathfinder-element assays in LS epithermal terrains.
Beyond its practical implications, this work represents one of the first systematic applications of integrated trace-element and REE analysis of quartz to LS epithermal deposit. The approach clarifies the metallogenic evolution of the Biga Peninsula and provides a transferable template for assessing fluid pathways, redox controls, and metal precipitation mechanisms in analogous systems worldwide. Future research combining in-situ isotopic analyses (e.g., δD, δ¹⁸O of fluid inclusions), high-spatial-resolution CL imaging, and reactive-transport modelling will further refine our understanding of quartz-hosted geochemical records and enhance their utility in mineral exploration.
Author Contributions
Conceptualization, methodology, investigation, formal analysis, validation, data curation, resources, visualization, software, writing—original draft preparation, writing—review and editing, supervision, project administration, and funding acquisition: Fatih Özbaş; Scientific review and intellectual input: Ahmed Touil and Essaid Bilal. All authors have read and agreed to the published version of the manuscript.
Data Availability Statement
All relevant data supporting the findings of this study are presented within the article. No supplementary datasets were deposited in public repositories.
Acknowledgments
The authors extend their sincere gratitude to Prof. Dr. Nurullah Hanilçi for his valuable scientific insights and constructive feedback, which greatly contributed to the interpretation and contextualization of the results. We also thank Prof. Dr. Namık Aysal, Dr. Öğr. Üyesi Gönenç Göçmengil, and Res. Asst. Dr. Fatma Şişman Tükel for their kind support during the LA-ICP-MS analyses. During the preparation of this manuscript, the authors used ChatGPT (OpenAI, San Francisco, CA, USA) for language refinement, assistance in drafting selected figures, and support in the organization and interpretation of data analyses. The authors have thoroughly reviewed and edited all AI-assisted content and take full responsibility for the final interpretations, methods, and conclusions presented herein. We further acknowledge the handling editor and anonymous reviewers for their constructive comments and valuable suggestions, which helped to improve the overall clarity and scientific quality of the manuscript.
Conflicts of Interest
The authors declare no conflicts of interest. The funders had no role in the design of the study; in the collection, analyses, or interpretation of data; in the writing of the manuscript; or in the decision to publish the results.
References
- Götze, J.; Möckel, R. Quartz: Deposits, Mineralogy and Analytics; Springer, 2012;
- Morey, G.W.; Fournier, R.O.; Rowe, J.J. The Solubility of Quartz in Water in the Temperature Interval from 25° to 300° C. Geochim. Cosmochim. Acta 1962, 26, doi:10.1016/0016-7037(62)90027-3. [CrossRef]
- Webster, J.D.; Thomas, R. Silicate Melt Inclusions in Felsic Plutons: A Synthesis and Review. Melt Inclusions Plutonic Rocks 2006, 36, 165–188.
- Wilkinson, J.J. Fluid Inclusions in Hydrothermal Ore Deposits. Lithos 2001, 55, 229–272.
- Redmond, P.B.; Einaudi, M.T.; Inan, E.E.; Landtwing, M.R.; Heinrich, C.A. Copper Deposition by Fluid Cooling in Intrusion-Centered Systems: New Insights from the Bingham Porphyry Ore Deposit, Utah. Geology 2004, 32, 217–220.
- Landtwing, M.R.; Pettke, T. Relationships between SEM-Cathodoluminescence Response and Trace-Element Composition of Hydrothermal Vein Quartz. Am. Mineral. 2005, 90, 122–131, doi:10.2138/am.2005.1548. [CrossRef]
- Gao, S.; Zou, X.; Hofstra, A.H.; Qin, K.; Marsh, E.E.; Bennett, M.M.; Li, G.; Jiang, J.; Su, S.; Zhao, J.; et al. Trace Elements in Quartz: Insights Into Source and Fluid Evolution in Magmatic-Hydrothermal Systems. Econ. Geol. 2022, 117, 1415–1428, doi:10.5382/ECONGEO.4943. [CrossRef]
- Monecke, T.; Kempe, U.; Götze, J. Genetic Significance of the Trace Element Content in Metamorphic and Hydrothermal Quartz: A Reconnaissance Study. Earth Planet. Sci. Lett. 2002, 202, 709–724.
- Flem, B.; Larsen, R.B.; Grimstvedt, A.; Mansfeld, J. In Situ Analysis of Trace Elements in Quartz by Using Laser Ablation Inductively Coupled Plasma Mass Spectrometry. Chem. Geol. 2002, 182, 237–247, doi:10.1016/S0009-2541(01)00292-3. [CrossRef]
- Guillong, M.; Hametner, K.; Reusser, E.; Wilson, S.A.; Günther, D. Preliminary Characterisation of New Glass Reference Materials (GSA-1G, GSC-1G, GSD-1G and GSE-1G) by Laser Ablation-Inductively Coupled Plasma-Mass Spectrometry Using 193 Nm, 213 Nm and 266 Nm Wavelengths. Geostand. Geoanalytical Res. 2005, 29, 315–331, doi:10.1111/j.1751-908x.2005.tb00903.x. [CrossRef]
- Rusk, B.G.; Lowers, H.A.; Reed, M.H. Trace Elements in Hydrothermal Quartz: Relationships to Cathodoluminescent Textures and Insights into Vein Formation. Geology 2008, 36, 547–550, doi:10.1130/G24580A.1. [CrossRef]
- Rottier, B.; Casanova, V. Trace Element Composition of Quartz from Porphyry Systems: A Tracer of the Mineralizing Fluid Evolution. Miner. Depos. 2021, 56, 843–862, doi:10.1007/s00126-020-01009-0. [CrossRef]
- Hong, J.; Zhai, D.; Keith, M. Quartz Texture and the Chemical Composition Fingerprint of Ore-Forming Fluid Evolution at the Bilihe Porphyry Au Deposit, NE China. Am. Mineral. 2024, 109, 1203–1219, doi:10.2138/am-2022-8840. [CrossRef]
- Siyako, M.; Burkan, K.A.; Ve Okay, A.I. Biga ve Gelibolu Yarımadalarının Tersiyer Jeolojisi ve Hidrokarbon Olanakları. TPJD Bülteni 1 (3): 183--199 1989.
- Okay, A.I.; Siyako, M.; Bürkan, K., A. Biga Yarımadası’nın Jeolojisi ve Tektonik Evrimi. TPJD. Bülteni 1990, 2, 83–121.
- Altunkaynak, Ş.; Genç, Ş.C. Petrogenesis and Time-Progressive Evolution of the Cenozoic Continental Volcanism in the Biga Peninsula, NW Anatolia (Turkey). Lithos 2008, 102, 316–340, doi:https://doi.org/10.1016/j.lithos.2007.06.003. [CrossRef]
- Yigit, O. A Prospective Sector in the Tethyan Metallogenic Belt: Geology and Geochronology of Mineral Deposits in the Biga Peninsula, NW Turkey. Ore Geol. Rev. 2012, 46, 118–148, doi:10.1016/j.oregeorev.2011.09.015. [CrossRef]
- Aysal, N. Mineral Chemistry, Crystallization Conditions and Geodynamic Implications of the Oligo–Miocene Granitoids in the Biga Peninsula, Northwest Turkey. J. Asian Earth Sci. 2015, 105, 68–84, doi:https://doi.org/10.1016/j.jseaes.2015.03.026. [CrossRef]
- Sánchez, M.G.; McClay, K.R.; King, A.R.; Wijbrams, J.R. Cenozoic Crustal Extension And Its Relationship To Porphyry Cu-Au-(Mo) And Epithermal Au-(Ag) Mineralization İn The Biga Peninsula, Northwestern Turkey. 2016, doi:10.5382/SP.19.05. [CrossRef]
- Leroux, G.M. Stratigraphic and Petrographic Characterization of HS Epithermal Au-Ag Mineralization at the TV Tower District, Biga Peninsula, NW Turkey, University of British Columbia, 2016.
- Bozkaya, G.; Banks, D.A.; Ozbas, F.; Wallington, J. Fluid Processes in the Tesbihdere Base-Metal-Au Deposit: Implications for Epithermal Mineralization in the Biga Peninsula, NW Turkey. Cent. Eur. J. Geosci. 2014, 6, 148–169, doi:10.2478/s13533-012-0169-9. [CrossRef]
- Yılmaz, H. Stream Sediment Geochemical Exploration for Gold in the Kazdaǧ Dome in the Biga Peninsula, Western Turkey. Turkish J. Earth Sci. 2007, 16, 33–55.
- Yigit, O. Mineral Deposits of Turkey in Relation to Tethyan Metallogeny: Implications for Future Mineral Exploration. Econ. Geol. 2009, 104, 19–51, doi:10.2113/gsecongeo.104.1.19. [CrossRef]
- Özbaş, F. Tuztaşı (Çanakkale) Altın Cevherleşmesini Oluşturan Çözeltilerin Kökeni ve Karakteristikleri, İSTANBUL ÜNİVERSİTESİ-CERRAHPAŞA, 2023.
- Özbaş, F.; Hanilçi, N. Quartz Textures, Mineral Chemistry and Fluid Inclusion Features of Tuztaşı Low-Sulphidation Au Mineralization: Implication to It’s Formation. Geochemistry 2024, 85, doi:10.1016/j.chemer.2024.126220. [CrossRef]
- Sun, S.S.; McDonough, W.F. Chemical and Isotopic Systematics of Oceanic Basalts: Implications for Mantle Composition and Processes. Geol. Soc. Spec. Publ. 1989, 42, 313–345, doi:10.1144/GSL.SP.1989.042.01.19. [CrossRef]
- Duru, M.; Pehlivan, Ş.; Şentürk, Y. New Results on the Lithostratigraphy of the Kazdağ Massif in Northwest Turkey. Turkish J. Earth Sci. 2004, 13, 177–186.
- Moncada, D.; Mutchler, S.; Nieto, A.; Reynolds, T.J.; Rimstidt, J.D.; Bodnar, R.J. Mineral Textures and Fluid Inclusion Petrography of the Epithermal Ag-Au Deposits at Guanajuato, Mexico: Application to Exploration. J. Geochemical Explor. 2012, 114, 20–35, doi:10.1016/j.gexplo.2011.12.001. [CrossRef]
- Gysi, A.P.; Williams-Jones, A.E. Hydrothermal Mobilization of Pegmatite-Hosted REE and Zr at Strange Lake, Canada: A Reaction Path Model. Geochim. Cosmochim. Acta 2013, 122, 324–352, doi:10.1016/j.gca.2013.08.031. [CrossRef]
- Bau, M. Controls on the Fractionation of Isovalent Trace Elements in Magmatic and Aqueous Systems: Evidence from Y/Ho, Zr/Hf, and Lanthanide Tetrad Effect. Contrib. to Mineral. Petrol. 1996, 123, 323–333, doi:10.1007/s004100050159. [CrossRef]
- Friedman, I.; O’Neil, J.R. Compilation of Stable Isotope Fractionation Factors of Geochemical Interest; 1977;
- Taylor, H. Oxygen and Hydrogen Isotope Relationships in Hydrothermal Mineral Deposits. Geochemistry Hydrothermal Ore Depos. 1997, 236–277.
- Hedenquist, J.W.; Lowenstern, J.B. The Role of Magmas in the Formation of Hydrothermal Ore Deposits. Nature 1994, 370, 519–527, doi:10.1038/370519a0. [CrossRef]
- Simmons, S.F.; White, N.C.; John, D.A. Geological Characteristics of Epithermal Precious and Base Metal Deposits. 2005.
- Heinrich, C.A. Fluid-Fluid Interactions in Magmatic-Hydrothermal Ore Formation. Rev. Mineral. Geochemistry 2007, 65, 363–387, doi:10.2138/rmg.2007.65.11. [CrossRef]
- Cao, Y.; Li, S.; Yao, M.; Zhang, H. Significance of Quartz REE Geochemistry, Shihu Gold Deposit, Western Hebei Province, North China, Using LA-ICP-MS. Front. Earth Sci. China 2010, 4, 337–344, doi:10.1007/s11707-010-0136-z. [CrossRef]
- Mlynarczyk, M.S.J.; Williams-Jones, A.E. The Role of Collisional Tectonics in the Metallogeny of the Central Andean Tin Belt. Earth Planet. Sci. Lett. 2005, 240, 656–667, doi:10.1016/j.epsl.2005.09.047. [CrossRef]
- Meyer, N.; Burisch, M.; Gutzmer, J.; Krause, J.; Scheibert, H.; Markl, G. Mineral Chemistry of the Geyer SW Tin Skarn Deposit: Understanding Variable Fluid/Rock Ratios and Metal Fluxes. Miner. Depos. 2024, 85–111, doi:10.1007/s00126-024-01297-w. [CrossRef]
- Migdisov, A.A.; Williams-Jones, A.E. Hydrothermal Transport and Deposition of the Rare Earth Elements by Fluorine-Bearing Aqueous Liquids. Miner. Depos. 2014, 49, 987–997, doi:10.1007/s00126-014-0554-z. [CrossRef]
- Li, Z.X.; Zhang, S.B.; Zheng, Y.F.; Wu, S.T.; Li, W.C.; Sun, F.Y.; Liang, T. Mobilization and Fractionation of HFSE and REE by High Fluorine Fluid of Magmatic Origin during the Alteration of Amphibolite. Lithos 2022, 420–421, 106701, doi:10.1016/j.lithos.2022.106701. [CrossRef]
- Wood, S.A. The Aqueous Geochemistry of the Rare-Earth Elements and Yttrium. 2. Theoretical Predictions of Speciation in Hydrothermal Solutions to 350°C at Saturation Water Vapor Pressure. Chem. Geol. 1990, 88, 99–125, doi:10.1016/0009-2541(90)90106-H. [CrossRef]
- Romer, R.L.; Kroner, U. Phanerozoic Tin and Tungsten Mineralization-Tectonic Controls on the Distribution of Enriched Protoliths and Heat Sources for Crustal Melting. Gondwana Res. 2016, 31, 60–95, doi:10.1016/j.gr.2015.11.002. [CrossRef]
- Götze, J.; Plötze, M.; Habermann, D. Origin, Spectral Characteristics and Practical Applications of the Cathodoluminescence (CL) of Quartz - A Review. Mineral. Petrol. 2001, 71, 225–250, doi:10.1007/s007100170040. [CrossRef]
- Wark, D.A.; Watson, E.B. TitaniQ: A Titanium-in-Quartz Geothermometer. Contrib. to Mineral. Petrol. 2006, 152, 743–754, doi:10.1007/s00410-006-0132-1. [CrossRef]
- Rusk, B. Cathodoluminescent Textures and Trace Elements in Hydrothermal Quartz. Quartz Depos. Mineral. Anal. 2012, 307–329.
- Audétat, A.; Günther, D.; Heinrich, C.A. Formation of a Magmatic-Hydrothermal Ore Deposit: Insights with LA-ICP- MS Analysis of Fluid Inclusions. Science (80-. ). 1998, 279, 2091–2094, doi:10.1126/science.279.5359.2091. [CrossRef]
- Thomas, J.B.; Watson, E.B.; Spear, F.S.; Shemella, P.T.; Nayak, S.K.; Lanzirotti, A. TitaniQ under Pressure: The Effect of Pressure and Temperature on the Solubility of Ti in Quartz. Contrib. to Mineral. Petrol. 2010, 160, 743–759, doi:10.1007/s00410-010-0505-3. [CrossRef]
- Götze, J.; Pan, Y.; Müller, A. Mineralogy and Mineral Chemistry of Quartz: A Review. Mineral. Mag. 2021, 85, 639–664, doi:10.1180/mgm.2021.72. [CrossRef]
- Cook, N.J.; Ciobanu, C.L.; Pring, A.; Skinner, W.; Shimizu, M.; Danyushevsky, L.; Saini-Eidukat, B.; Melcher, F. Trace and Minor Elements in Sphalerite: A LA-ICPMS Study. Geochim. Cosmochim. Acta 2009, 73, 4761–4791, doi:10.1016/j.gca.2009.05.045. [CrossRef]
- Deditius, A.P.; Reich, M.; Simon, A.C.; Suvorova, A.; Knipping, J.; Roberts, M.P.; Rubanov, S.; Dodd, A.; Saunders, M. Nanogeochemistry of Hydrothermal Magnetite. Contrib. to Mineral. Petrol. 2018, 173, 1–20, doi:10.1007/s00410-018-1474-1. [CrossRef]
- Catchpole, H.; Kouzmanov, K.; Putlitz, B.; Seo, J.H.; Fontboté, L. Zoned Base Metal Mineralization in a Porphyry System: Origin and Evolution of Mineralizing Fluids in the Morococha District, Peru. Econ. Geol. 2015, 110, 39–71, doi:10.2113/econgeo.110.1.39. [CrossRef]
- Monnier, L.; Salvi, S.; Pochon, A.; Melleton, J.; Béziat, D.; Lach, P.; Bailly, L. Antimony in Quartz as a Vector to Mineralization: A Statistical Approach from Five Variscan Sb Occurrences (France). J. Geochemical Explor. 2021, 221, doi:10.1016/j.gexplo.2020.106705. [CrossRef]
- Altunkaynak, Ş.; Sunal, G.; Aldanmaz, E.; Genç, C.Ş.; Dilek, Y.; Furnes, H.; Foland, K.A.; Yang, J.; Yildiz, M. Eocene Granitic Magmatism in NW Anatolia (Turkey) Revisited: New Implications from Comparative Zircon SHRIMP U-Pb and 40Ar-39Ar Geochronology and Isotope Geochemistry on Magma Genesis and Emplacement. Lithos 2012, 155, 289–309, doi:10.1016/j.lithos.2012.09.008. [CrossRef]
Figure 1.
Geological map of the Tuztaşı district showing major lithologies, structural elements (Şelale detachment, Uzunalan and Serhat faults) and locations of the Main Quartz Vein (MQV), West Quartz Vein (WQV) and South Quartz Vein (SQV). Modified from MTA (1962). Scale = 1:25 000.
Figure 1.
Geological map of the Tuztaşı district showing major lithologies, structural elements (Şelale detachment, Uzunalan and Serhat faults) and locations of the Main Quartz Vein (MQV), West Quartz Vein (WQV) and South Quartz Vein (SQV). Modified from MTA (1962). Scale = 1:25 000.
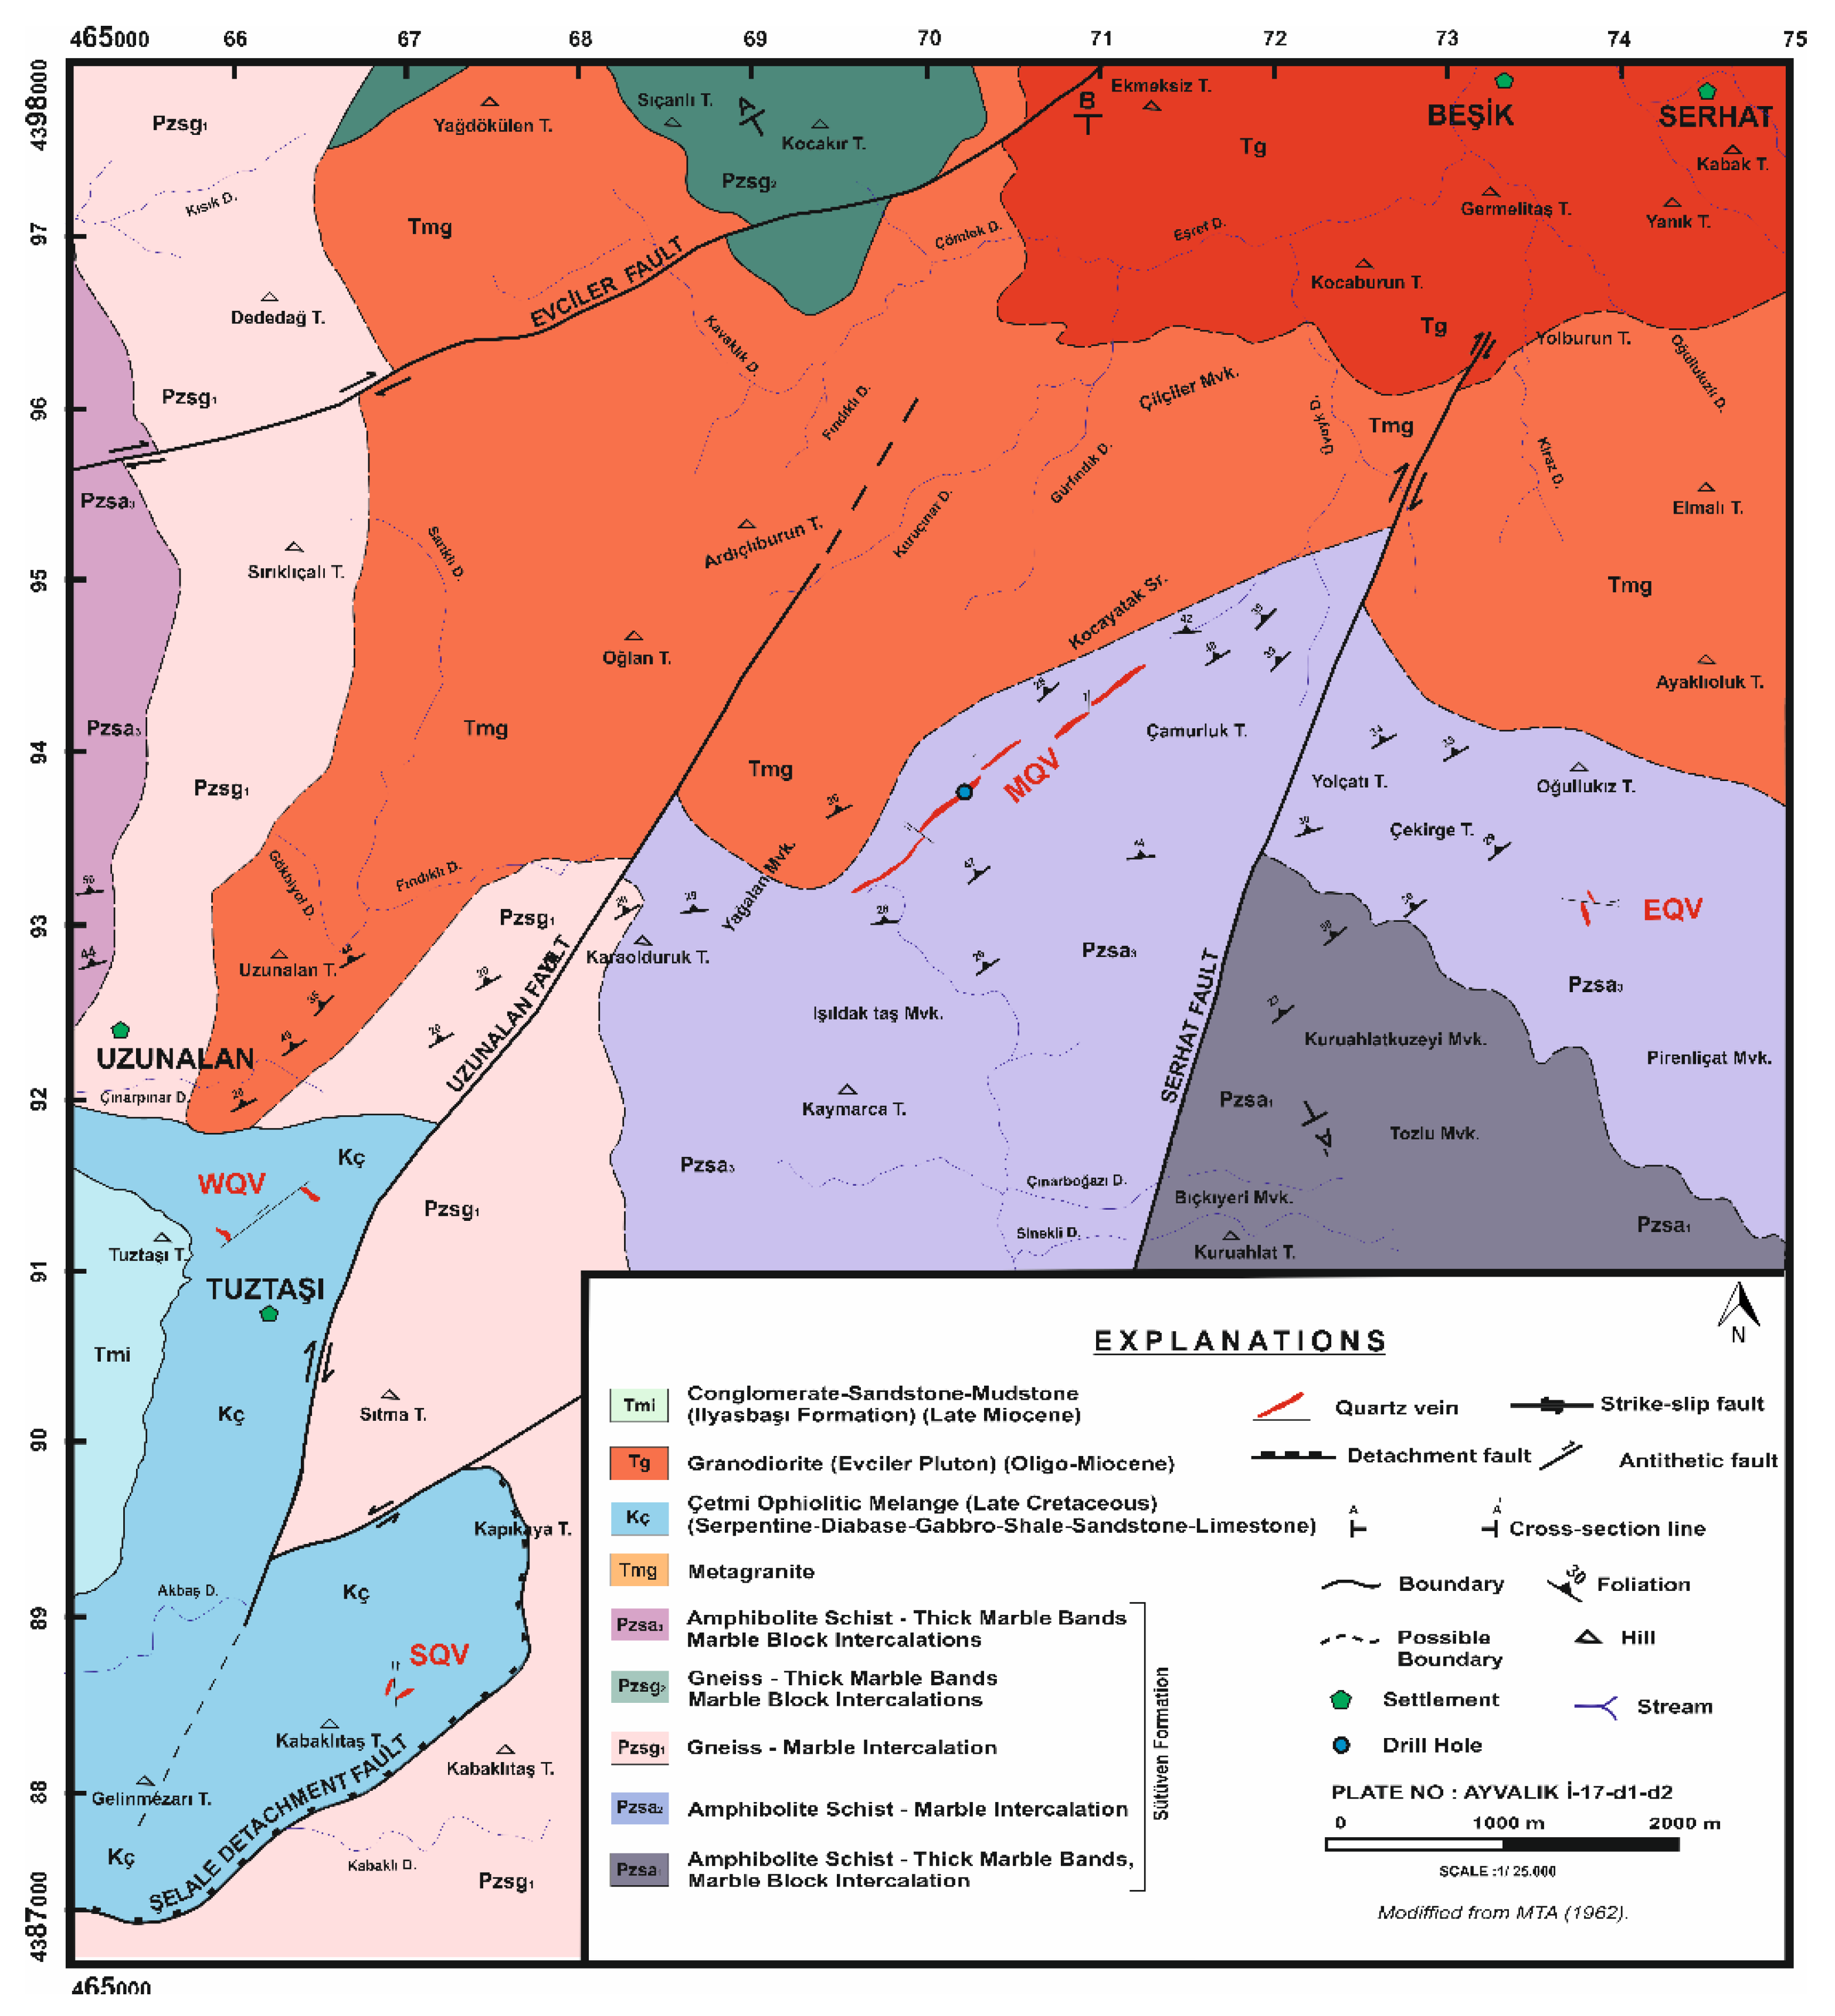
Figure 2.
Log-scale box-plots of arsenic concentrations in mineralized (n = 5) and barren (n = 5) quartz from Tuztaşı. Central line = median; box = inter-quartile range; whiskers = min–max (outlier excluded). Red star marks the single outlier in sample 73-4 (As = 16 775.9 ppm), which is omitted from the statistical box.
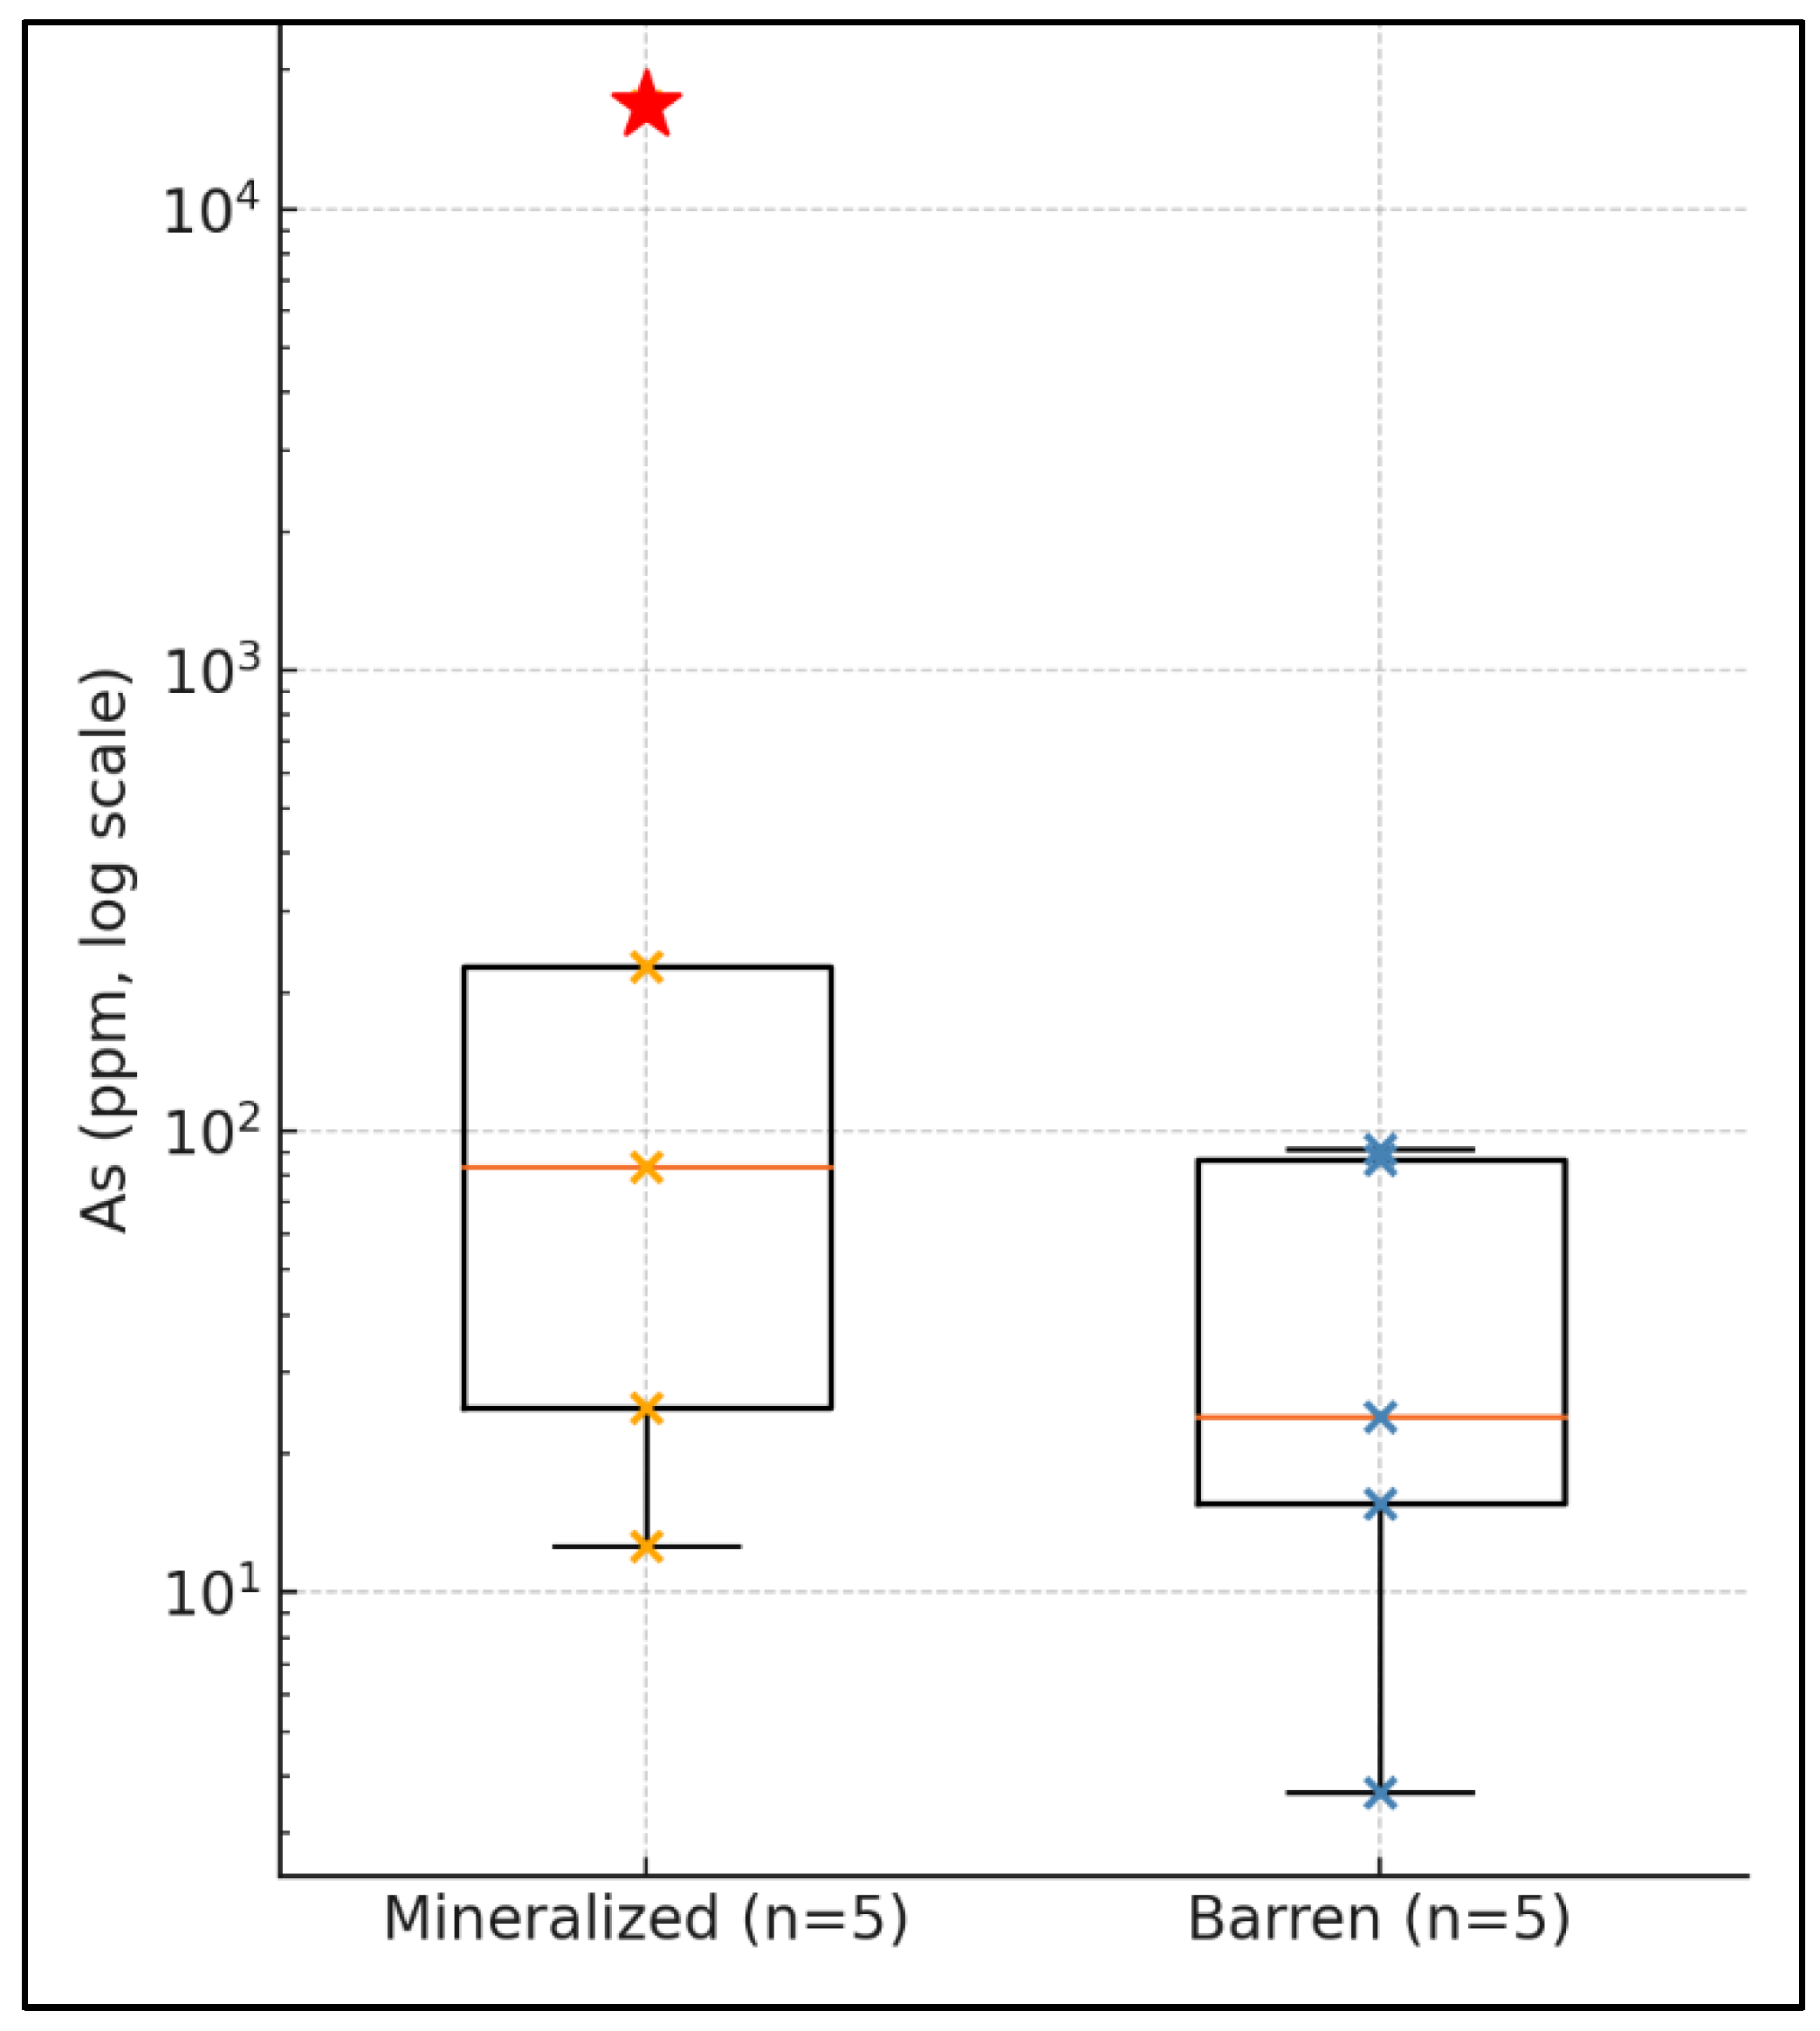
Figure 3.
Trace-element discrimination diagrams for Tuztaşı quartz. (a) δEu versus δCe highlighting the decoupled Eu-Ce behaviour; dashed lines at δCe = 1 and δEu = 1 mark zero-anomaly thresholds. (b) Al versus Ti plot (ppm) emphasising lower Ti/Al ratios in mineralized quartz. Red circles = mineralized; blue triangles = barren.
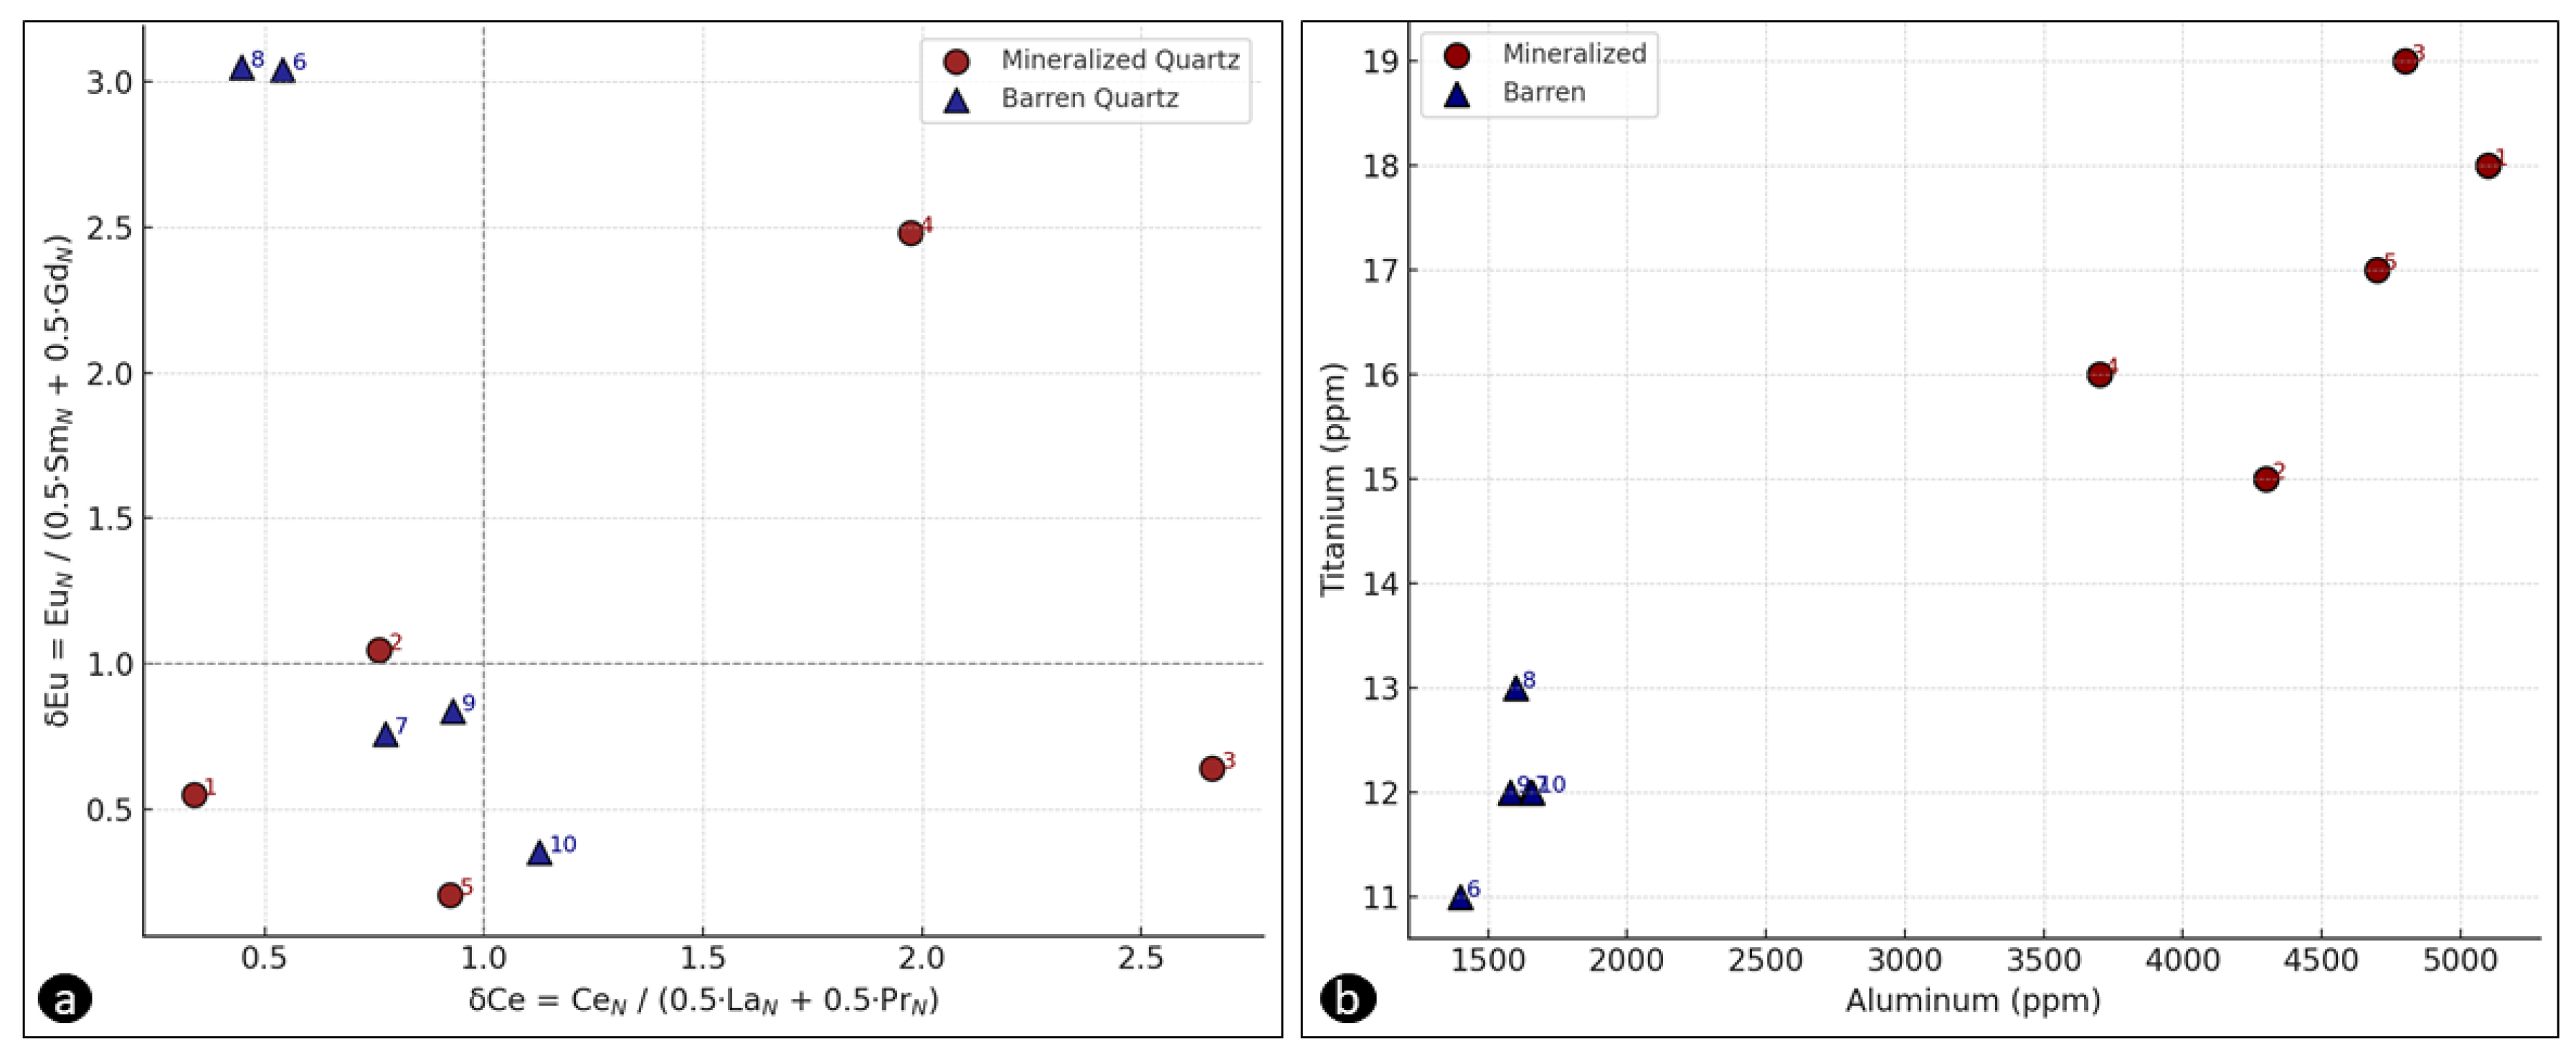
Figure 4.
Log-scale spider diagram comparing average trace-element concentrations in Tuztaşı mineralized quartz (filtered means; As = 70 ppm, outlier 73-4 removed) with typical signatures for low-sulfidation epithermal, orogenic gold, porphyry, IOCG and MVT quartz [53]. Elements are plotted in order Al, K , Ti, Ge, As, Sn, Sb; dashed gridlines mark one-log intervals. (Note: Raw outlier and median values are given in Table 1.).
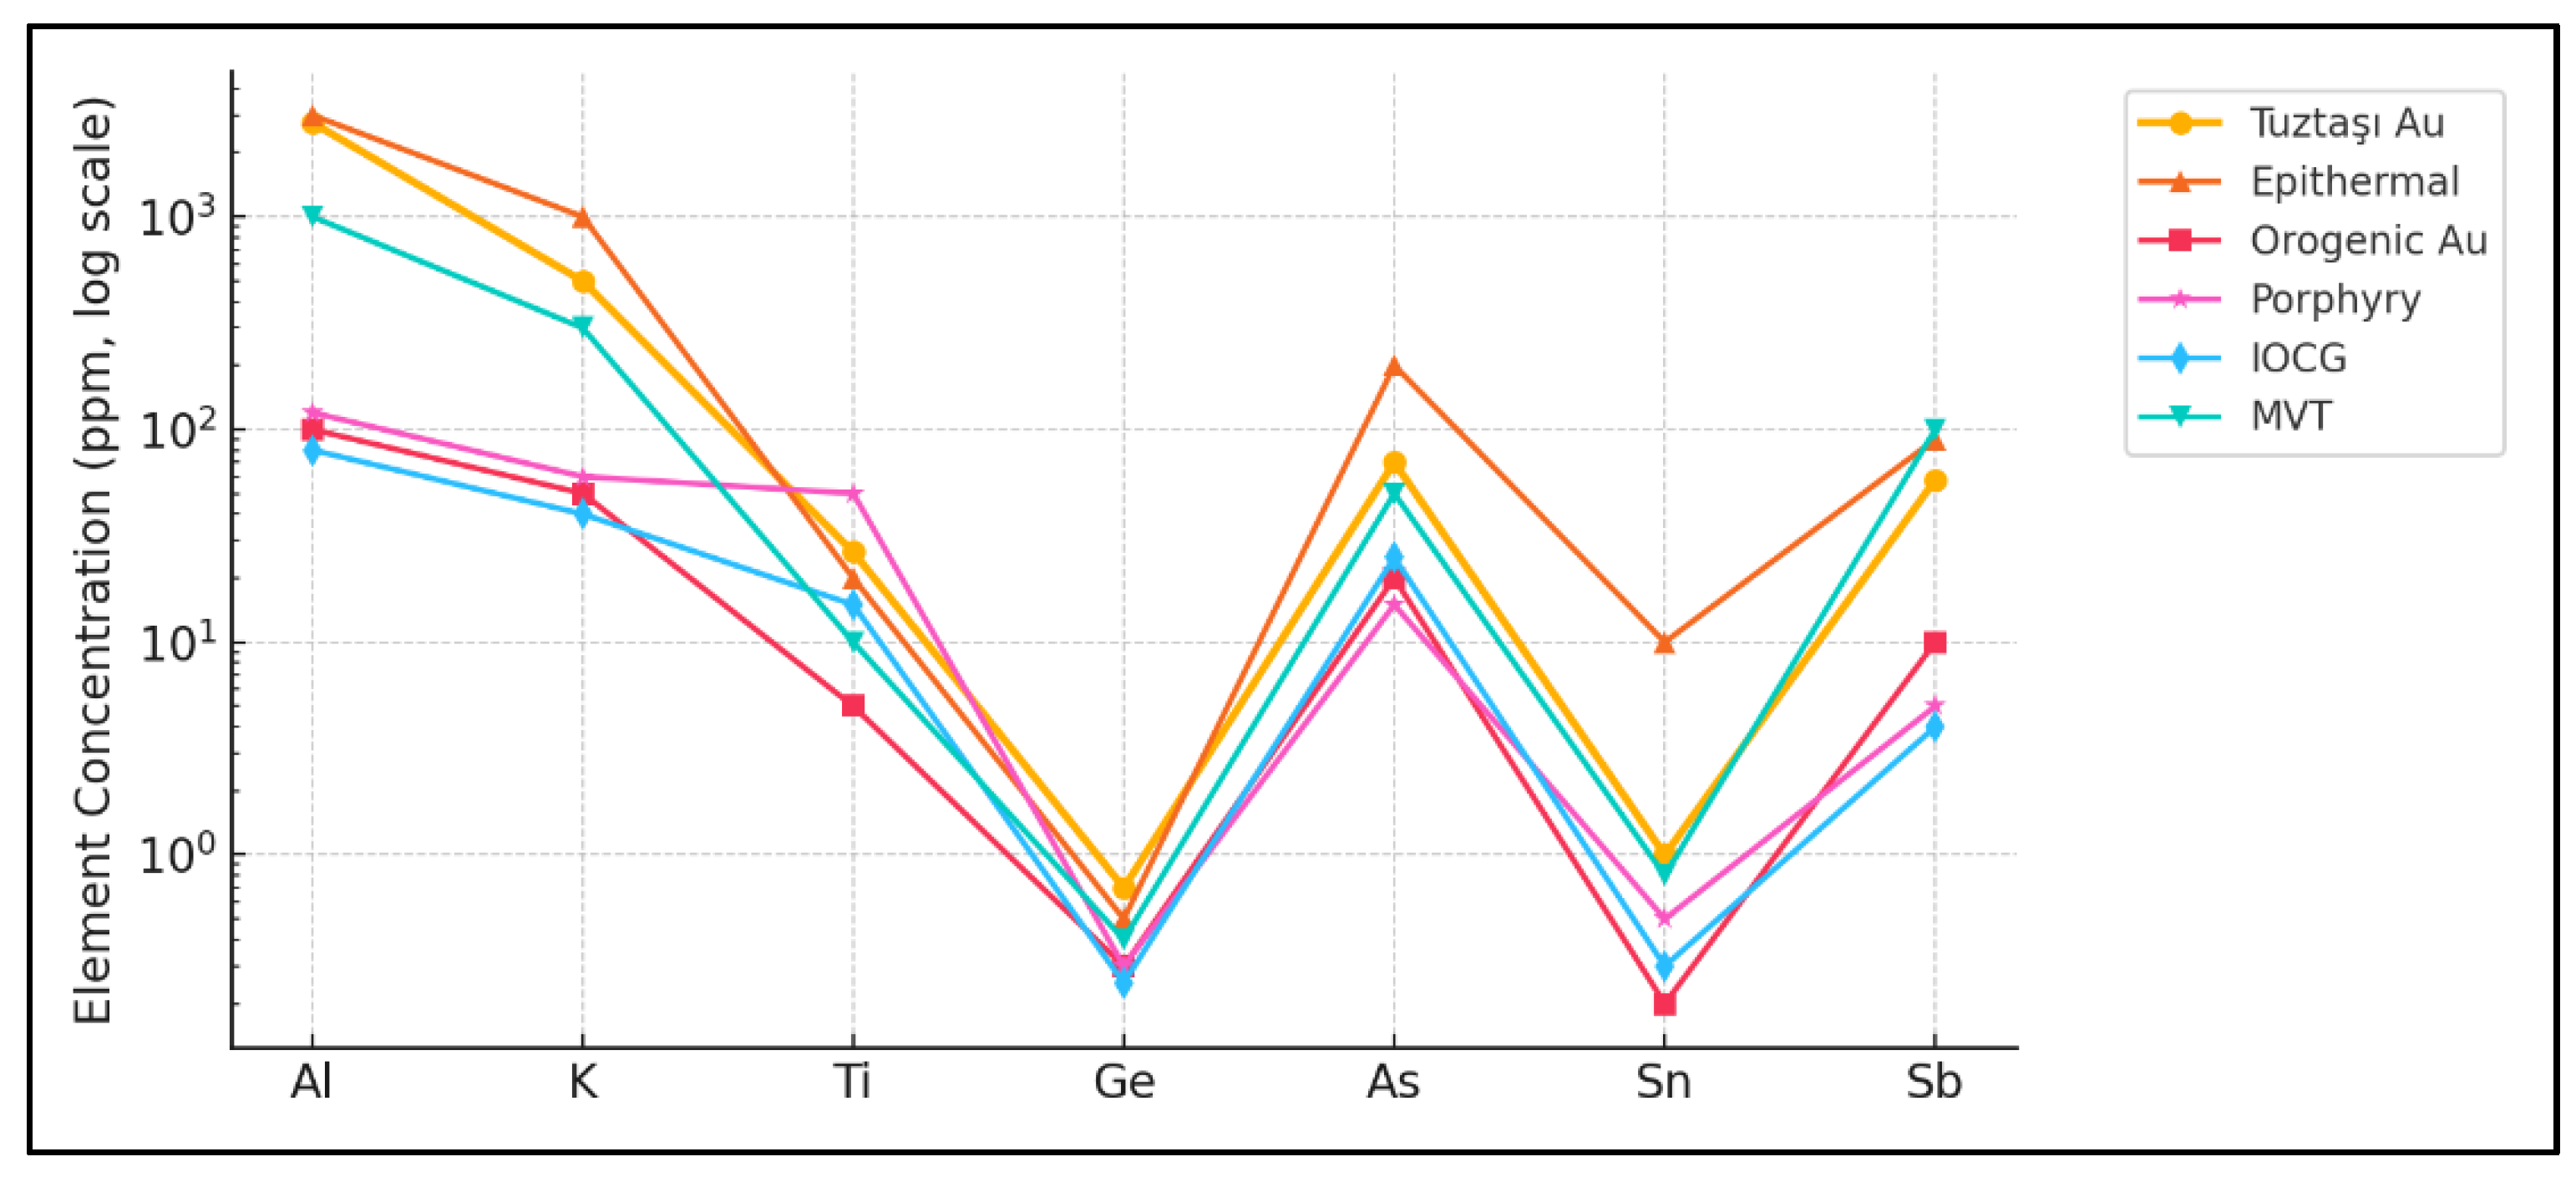

Table 1.
Major and trace-element compositions (ppm) of representative quartz samples from the Tuztaşı low-sulfidation Au-Ag system. All non-REE data (Au, Ag, Al, K, Ti, Ge, As, Sn, Sb, Zn, Se, Pb) were previously reported in Özbaş & Hanilçi [25] and are reproduced here for comparison; REE parameters (ΣREE, ΣLREE/ΣHREE, δCe, δEu, (La/Yb)_N, (La/Sm)_N) are new to this study. Values are expressed in ppm unless otherwise noted; Ge is likewise reported in ppm (1.8 ppm ≈ 0.36 µmol mol⁻¹). Mineralized samples (M) occupy columns 1–5, barren samples (B) columns 6–10. n.d. = not detected. The As outlier in sample 73-4 (16 775.9 ppm) is italicised and excluded from filtered statistics.
| Element | 73-1 (M) | 73-4 (M) | 73-5V (M) | 73-6 (M) | 16-80-7 (M) | 73-3 (B) | 16-80-3 (B) | 16-80-4 (B) | 16-80-5 (B) | 10b-1 (B) |
|---|---|---|---|---|---|---|---|---|---|---|
| Au | 2.031 | 2.323 | 22.336 | 3.861 | 1.161 | n.d. | 0.192 | n.d. | n.d. | 0.034 |
| Ag | 9.601 | 11.635 | 48.782 | 29.946 | 1.334 | 0.227 | 5.483 | 7.148 | 1.682 | 1.415 |
| Al | 2310 | 4912 | 1234 | 2683 | 4157 | 2440 | 8718 | 3045 | 18556 | 3233 |
| K | 478 | 767 | 639 | 264 | 881 | 433 | 3275 | 407 | 21290 | 5358 |
| Ti | 6 | 39 | 55 | 54 | 64 | 3 | 75 | 2 | 4 | 4 |
| Ge | 2.2 | 1.8 | 1.2 | 2 | 2.1 | 1.7 | 1 | 1.4 | 1.3 | 1.3 |
| As | 12.6 | 16775.9 | 227 | 83.7 | 25.1 | 24 | 86.7 | 3.7 | 15.6 | 92 |
| Sn | 0.3 | 0.1 | 1 | 0.9 | 0.3 | 0.1 | 0.3 | 0 | 0.1 | 0.2 |
| Sb | 10 | 289 | 8 | 13 | 20 | 10 | 10 | 17 | 18 | 18 |
| Zn | 20004 | 2245.18 | 98.304 | 64.059 | 11.134 | 6.478 | 11.423 | 1.399 | 8.329 | 5.986 |
| Se | 0.329 | 30.023 | 3.269 | 0.58 | 0.43 | n.d. | n.d. | n.d. | n.d. | n.d. |
| Pb | 8.29 | 1569.47 | 40.524 | 21.816 | 3.493 | 40.012 | 12.581 | 0.393 | 2.229 | 7.673 |
| La | 1.595 | 33.901 | 5.364 | 0.544 | 2.809 | 0.388 | 0.986 | 0.089 | 8.077 | 0.442 |
| Ce | 0.293 | 21.385 | 8.423 | 1.328 | 2.094 | 0.133 | 0.679 | 0.058 | 5.841 | 0.511 |
| Pr | 0.137 | 22.334 | 0.965 | 0.801 | 1.726 | 0.104 | 0.766 | 0.171 | 4.504 | 0.465 |
| Nd | 0.048 | 20.763 | 0.532 | 0.309 | 1.201 | 0.038 | 0.673 | 0.087 | 3.917 | 0.258 |
| Sm | 0.117 | 20.697 | 0.771 | 0.061 | 1.581 | 0.02 | 0.898 | 0.186 | 2.282 | 0.64 |
| Eu | 0.039 | 21.911 | 0.342 | 0.186 | 0.291 | 0.073 | 0.359 | 0.607 | 1.583 | 0.345 |
| Gd | 0.025 | 21.172 | 0.297 | 0.089 | 1.248 | 0.028 | 0.046 | 0.212 | 1.498 | 1.321 |
| Tb | 0.044 | 19.496 | 0.178 | 0.198 | 1.228 | 0.186 | 0.515 | 0.17 | 0.78 | 0.215 |
| Dy | 0.041 | 22.136 | 0.207 | 0.185 | 0.971 | 0.057 | 0.557 | 0.702 | 0.349 | 0.25 |
| Ho | 0.132 | 22.376 | 0.179 | 0.005 | 1.749 | 0.276 | 0.218 | 0.255 | 0.271 | 0.094 |
| Er | 0.067 | 21.928 | 0.189 | 0.112 | 1.928 | 0.027 | 0.709 | 0.554 | 0.447 | 0.083 |
| Tm | 0.099 | 20.93 | 0.097 | 0.124 | 1.439 | 0.096 | 0.571 | 0.384 | 0.33 | 0.324 |
| Yb | 0.025 | 20.417 | 0.097 | 0.109 | 0.929 | 0.114 | 0.384 | 0.207 | 0.199 | 0.218 |
| Lu | 0.029 | 22.597 | 0.237 | 0.276 | 1.645 | 0.083 | 0.123 | 0.337 | 0.219 | 0.157 |
| Y | 0.004 | 1.644 | 0.006 | 0.001 | 0.106 | 0.001 | 0.016 | 0.001 | 0.013 | 0.004 |
| ΣREE | 2.693 | 312.04 | 17.884 | 4.328 | 21.127 | 1.625 | 7.502 | 3.636 | 30.311 | 5.327 |
| ΣLREE/ΣHREE | 4.74 | 0.7 | 11.07 | 2.77 | 0.86 | 0.79 | 1.28 | 0.21 | 6.02 | 1 |
| δCe | 0.15 | 0.19 | 0.89 | 0.48 | 0.23 | 0.16 | 0.19 | 0.11 | 0.23 | 0.27 |
| δEu | 2.18 | 3.16 | 2.16 | 7.62 | 0.63 | 9.31 | 5.33 | 9.23 | 2.58 | 1.13 |
| (La/Yb)N | 45.26 | 1.18 | 39.23 | 3.54 | 2.15 | 2.41 | 1.82 | 0.31 | 28.79 | 1.44 |
| (La/Sm)N | 8.97 | 1.08 | 4.58 | 5.87 | 1.17 | 12.77 | 0.72 | 0.31 | 2.33 | 0.69 |
Table 2.
Key trace- and rare-earth-element (REE) indicators that distinguish mineralized from barren quartz in the Tuztaşı low-sulfidation epithermal Au–Ag system. Reported values are filtered means ± 1 SD (n = 5 mineralized; n = 5 barren); raw medians are shown in parentheses where a single outlier spot (sample 73-4) was excluded. Typical ranges for LS-epithermal quartz from the literature are provided for comparison. Abbreviations: LREE = light rare-earth elements; HREE = heavy rare-earth elements; δCe and δEu = chondrite-normalized Ce and Eu anomalies; n.d. = not detected. Filtered means exclude the single outlier spot 73-4 (As = 16 775 ppm, K = 767 ppm). Raw medians are shown in parentheses for transparency.
| Geochemical Indicator | Tuztaşı Value (filtered dataset) | General Significance in (Low-Sulfidation) Epithermal Systems & Interpretation Context for Tuztaşı | Key Citations/Supporting Literature |
|---|---|---|---|
| High Arsenic (As) | 70 ± 93 ppm (raw median ≈ 759 ppm; locally 16 775 ppm) | High As in quartz is a common pathfinder for gold. In epithermal systems, As-rich fluids indicate proximity to mineralization. Quartz in epithermal veins is often As-rich. The high values at Tuztaşı suggest an As-bearing hydrothermal system linked to gold. | Gao et al.,[7]; this study |
| High Potassium (K) | 498 ± 179 ppm (raw median ≈ 836 ppm) | K in quartz is often hosted in fluid inclusions or micro-inclusions of K-bearing minerals (e.g., K-feldspar, sericite/illite). Elevated K reflects the composition of the hydrothermal fluid and interaction with K-rich host rocks (e.g., granitic rocks, potassic alteration). The Tuztaşı values suggest K-rich fluids and/or micro-inclusions, consistent with interaction with felsic rocks. | Götze et al., [48]; this study |
| High Aluminum (Al) | 2771 ± 1213 ppm | Al content in hydrothermal quartz is influenced by temperature, growth rate, Al activity in the fluid, and pH. High Al (up to several thousand ppm) is known from epithermal quartz, indicating rapid crystallization or specific fluid compositions. Tuztaşı values are within the range reported for epithermal quartz. | Götze et al., [48]; Rusk et al., [11] |
| Cerium anomaly (δCe) | mean 0.29 ± 0.23 (0.11–0.89) | Neutral to predominantly negative Ce anomalies (δCe < 1) in hydrothermal quartz reflect fluid oxidation state (Ce³⁺ oxidizes to less mobile Ce⁴⁺). This study suggests redox events governed Ce⁴⁺ sequestration. | Monecke et al., [8]; this study |
| Europium anomaly (δEu) | mean 4.33 ± 3.00 (0.63–9.31) | Strong positive Eu anomalies (δEu > 1) in quartz indicate reducing conditions (Eu²⁺ stability) and/or interaction with Eu-enriched sources (e.g., fluids interacting with granitic rocks where plagioclase alteration releases Eu²⁺). | Monecke et al., [8]; this study |
| Ti/Al Ratio | 0.0041 ± 0.0004 (barren 0.0084 ± 0.0008) | Epithermal quartz typically has Al/Ti ratios of 100 – 10 000 (Ti/Al ≈ 0.0001 – 0.01). Lower Ti/Al in Tuztaşı’s mineralized quartz (0.004) lies at the low end of this range and indicates cooler, more evolved ore fluids. | Wark & Watson [44]; this study |
| Ge/Si Ratio | 0.14–0.65 µmol mol⁻¹ | Germanium substitutes for Si in quartz. Elevated Ge/Si in mineralized quartz reflects specific fluid sources, temperatures, or pH conditions favorable for mineralization. | Götze et al., [48]; this study |
| Uranium & Thorium | U = 1.27 ± 0.13 ppm; Th = 0.58 ± 0.06 ppm | U and Th are generally low in quartz but can be included as micro-inclusions or as uranyl ions. Elevated U and Th suggest fluid interaction with U-Th-bearing rocks (e.g., granitic/metagranitic). Tuztaşı’s meteoric fluids interacted with granitic rocks, a potential source. | Götze et al., [48]; this study |
| As/Sb Ratio | 30.9 ± 3.1 | As and Sb are characteristic in epithermal systems. The As/Sb ratio varies with fluid source, temperature, and redox. A consistent As/Sb ratio at Tuztaşı can be a useful fingerprint for mineralization style. | Cooke et al., [49]; this study |
| Titanium content (Ti) | 26.5 ± 25.7 ppm (LS-epithermal typical < 50–80 ppm) | Epithermal quartz typically contains low Ti (< 50–80 ppm). While Tuztaşı’s average Ti (26.5 ppm) is comfortably within this epithermal range, it is still markedly lower than the Ti contents characteristic of magmatic or high-temperature porphyry quartz and is therefore considered “low” for distinguishing epithermal from higher-T systems. | Rusk [45]; Wark & Watson [44] |
| Economic impact | Reduced sampling/analysis costs by up to ~50 % | Using quartz chemistry as a direct geochemical vector can reduce exploration costs by optimizing drilling targets and minimizing bulk geochemical surveys. This allows faster and more focused prospectivity assessment. | Deditius et al., [50]; Catchpole [51]; Monnier [52] |
Disclaimer/Publisher’s Note: The statements, opinions and data contained in all publications are solely those of the individual author(s) and contributor(s) and not of MDPI and/or the editor(s). MDPI and/or the editor(s) disclaim responsibility for any injury to people or property resulting from any ideas, methods, instructions or products referred to in the content. |
© 2025 by the authors. Licensee MDPI, Basel, Switzerland. This article is an open access article distributed under the terms and conditions of the Creative Commons Attribution (CC BY) license (http://creativecommons.org/licenses/by/4.0/).
Copyright: This open access article is published under a Creative Commons CC BY 4.0 license, which permit the free download, distribution, and reuse, provided that the author and preprint are cited in any reuse.


