
Submitted:
28 November 2025
Posted:
01 December 2025
You are already at the latest version
Abstract
Microservice systems require reliable delivery, stable runtime environments, and production controls to achieve both high throughput and operational stability. This paper proposes a production-development framework that combines (i) runtime and toolchain version pinning, (ii) progressive delivery (canary / blue-green) with automated rollback, (iii) SLO and error-budget-based reliability management, and (iv) supply-chain security controls for build and artifact integrity. The framework is assessed via an 8-week synthetic observation design that mirrors operating conditions typical for mid-size telecom/fintech organizations (Central Asia), using eight independently deployable services. The evaluation is reported through DORA-style delivery metrics (deployment frequency, lead time, change failure rate, MTTR) and SLO attainment, and includes an ablation that isolates the expected contribution of each practice. The results indicate that deterministic builds (pinning) and progressive delivery provide the strongest improvements in delivery stability, while SLO/error-budget policies reduce incident impact by enforcing clear rollback and release-freeze rules.
Keywords:
microservices
; DevOps
; CI/CD
; Kubernetes
; reliability engineering
; SLOs
; error budgets
; supply-chain security
1. Introduction
Modern enterprises have moved from monolithic backends to microservices to increase the rate of change, align components to business capabilities, and deploy parts of the system independently. In the microservice architectural style, each service runs in its own process, communicates via lightweight protocols, and is independently deployable through automated pipelines [1]. In production, however, the benefits of microservices materialize only when the delivery system is coupled with disciplined DevOps practices: continuous integration and delivery (CI/CD), containerization, orchestration, infrastructure as code (IaC), and end-to-end observability.
This paper focuses on “production development”—the set of engineering practices and operational controls required to run microservices reliably at scale on real infrastructure. In many organizations, including those operating on self-managed servers, production environments are built around Docker for image packaging and Kubernetes for scheduling, replication, and failure recovery. A production-ready Kubernetes cluster requires explicit design for resilience (replicated control plane, highly available etcd, multiple worker nodes and zones) and operational hardening [2,3]. At the same time, teams that rely on public cloud platforms offload parts of availability engineering to managed building blocks (e.g., cloud object storage with multi-AZ durability and managed control planes), trading capital and operational effort for provider guarantees [8,9,10].
We adopt the DevOps research lens that measures software delivery performance through four widely used indicators—deployment frequency, lead time for changes, change failure rate, and mean time to recovery (MTTR) [4]. These metrics connect day-to-day practices (version pinning for language runtimes, automated tests, blue–green/canary deployments, rollback policies) with user-visible reliability and business outcomes. Reliability management is additionally framed through service level indicators/objectives (SLIs/SLOs) and error budgets, which help teams balance feature velocity and stability under quantified risk [5,6].
Given that organizations make different hosting choices—on-premises clusters with full operational control versus cloud-managed services with explicit service-level targets—an evidence-based comparison should look beyond tooling names and assess how practices affect throughput and stability in each context. Industry reports show that the adoption of containers and Kubernetes is now mainstream, making such a comparison timely and relevant [7]. Accordingly, this study proposes a methods framework suitable for both self-managed and cloud-hosted setups.
1.1. Problem Statement and Hypotheses
Problem. Without disciplined DevOps, microservices in production suffer from configuration drift, long lead times, and fragile deploys on both self-managed and cloud-hosted infrastructure.
Hypotheses.
- H1: Introducing pinned runtime/tool versions for frontend (Node.js) and backend (Java/Maven) reduces build failure rate and shortens mean lead time for changes.
- H2: Progressive delivery (blue–green or canary) with automatic rollback lowers change failure rate without degrading deployment frequency.
- H3: Explicit SLOs with error budgets improve MTTR by prioritizing remediation over feature work when budgets are exhausted.
Contributions. (i) A production development framework mapping concrete DevOps practices to delivery/reliability metrics; (ii) a responsibility–risk–effect comparison of on-premises versus cloud-managed components; (iii) a measurement plan and threats-to-validity checklist for practitioners.
1.2. Background and Related Work
Microservices are typically defined by independent deployability, decentralized governance, and alignment to business capabilities, with service boundaries that enable change isolation and autonomous release cycles [1,18]. Prior work reports both benefits and recurring engineering costs: distributed data consistency, operational overhead, and increased complexity in deployment and observability [19,20]. As a result, production effectiveness depends less on the architectural label and more on the quality of delivery and operations practices.
DevOps research emphasizes measurable delivery performance (deployment frequency, lead time, change failure rate, MTTR) as outcomes of technical and organizational capabilities [4]. In parallel, SRE practice operationalizes reliability through SLIs/SLOs and error budgets, which constrain release velocity under quantified risk and improve incident response through explicit policies and runbooks [5,6]. Kubernetes production guidance further stresses high availability of the control plane and etcd quorum safety as prerequisites for reliable operation at scale [2,3]. This paper builds on these foundations and contributes a compact framework that maps concrete practices to measurable delivery and reliability signals, and compares responsibility shifts between self-managed infrastructure and managed cloud primitives.
1.3. Industry Setting (Observed Practice)
In the author’s context (telecom and fintech organizations in Central Asia), production microservices commonly use a convergent baseline: Docker for image packaging, Kubernetes for orchestration, GitLab CI for automation, and version pinning of language/toolchains (Node.js for frontend builds; Java with Maven for backend builds). The preference for self-managed clusters is often driven by data locality and compliance requirements, cost transparency, and operational control; at the same time, teams may selectively consume managed cloud primitives (e.g., object storage) where provider durability and availability targets are advantageous. This observation motivates the study scenario; no organization-specific or proprietary operational data are used [7,8,9,10].
2. Methods
2.1. AI-Assisted Writing
AI tools (large language models, including ChatGPT) were used to improve English wording and structure. All technical claims, references, and final text were reviewed and approved by the author, who takes full responsibility for the content.
2.2. Objective and Research Questions
Objective. To outline and evaluate a production development framework for microservices that integrates core DevOps practices and to assess its expected impact on delivery performance and reliability.
RQs.
- Which concrete DevOps practices are required to operate microservices reliably on self-managed infrastructure (Docker + Kubernetes)?
- How do these practices map to delivery and reliability metrics (deployment frequency, lead time, change failure rate, MTTR; SLIs/SLOs)?
- What are the trade-offs compared to using managed cloud services, especially for storage and control-plane availability?
2.3. Scope and Assumptions
The target system is a medium-to-large enterprise application decomposed into independently deployable services. Environments considered: (i) self-managed servers with a hardened, production-grade Kubernetes cluster; (ii) public-cloud environments using managed durability/availability features for storage and, where applicable, managed control planes. The study assumes standard microservice properties as defined in the literature [1] and production guidance from the Kubernetes community [2,3].
2.4. Engineering Baseline (Production Development Stack)
Containerization and Orchestration. Each service is packaged as an OCI image and scheduled on Kubernetes with horizontal pod autoscaling and multiple replicas per service. Control plane and etcd are deployed in a highly available topology (stacked or external etcd) across failure domains [3].
Version Pinning and Build Reproducibility. Runtime versions for the backend (e.g., Java and Maven) and frontend toolchains (e.g., Node.js) are pinned in build manifests and CI images to ensure deterministic builds and consistent vulnerability scanning.
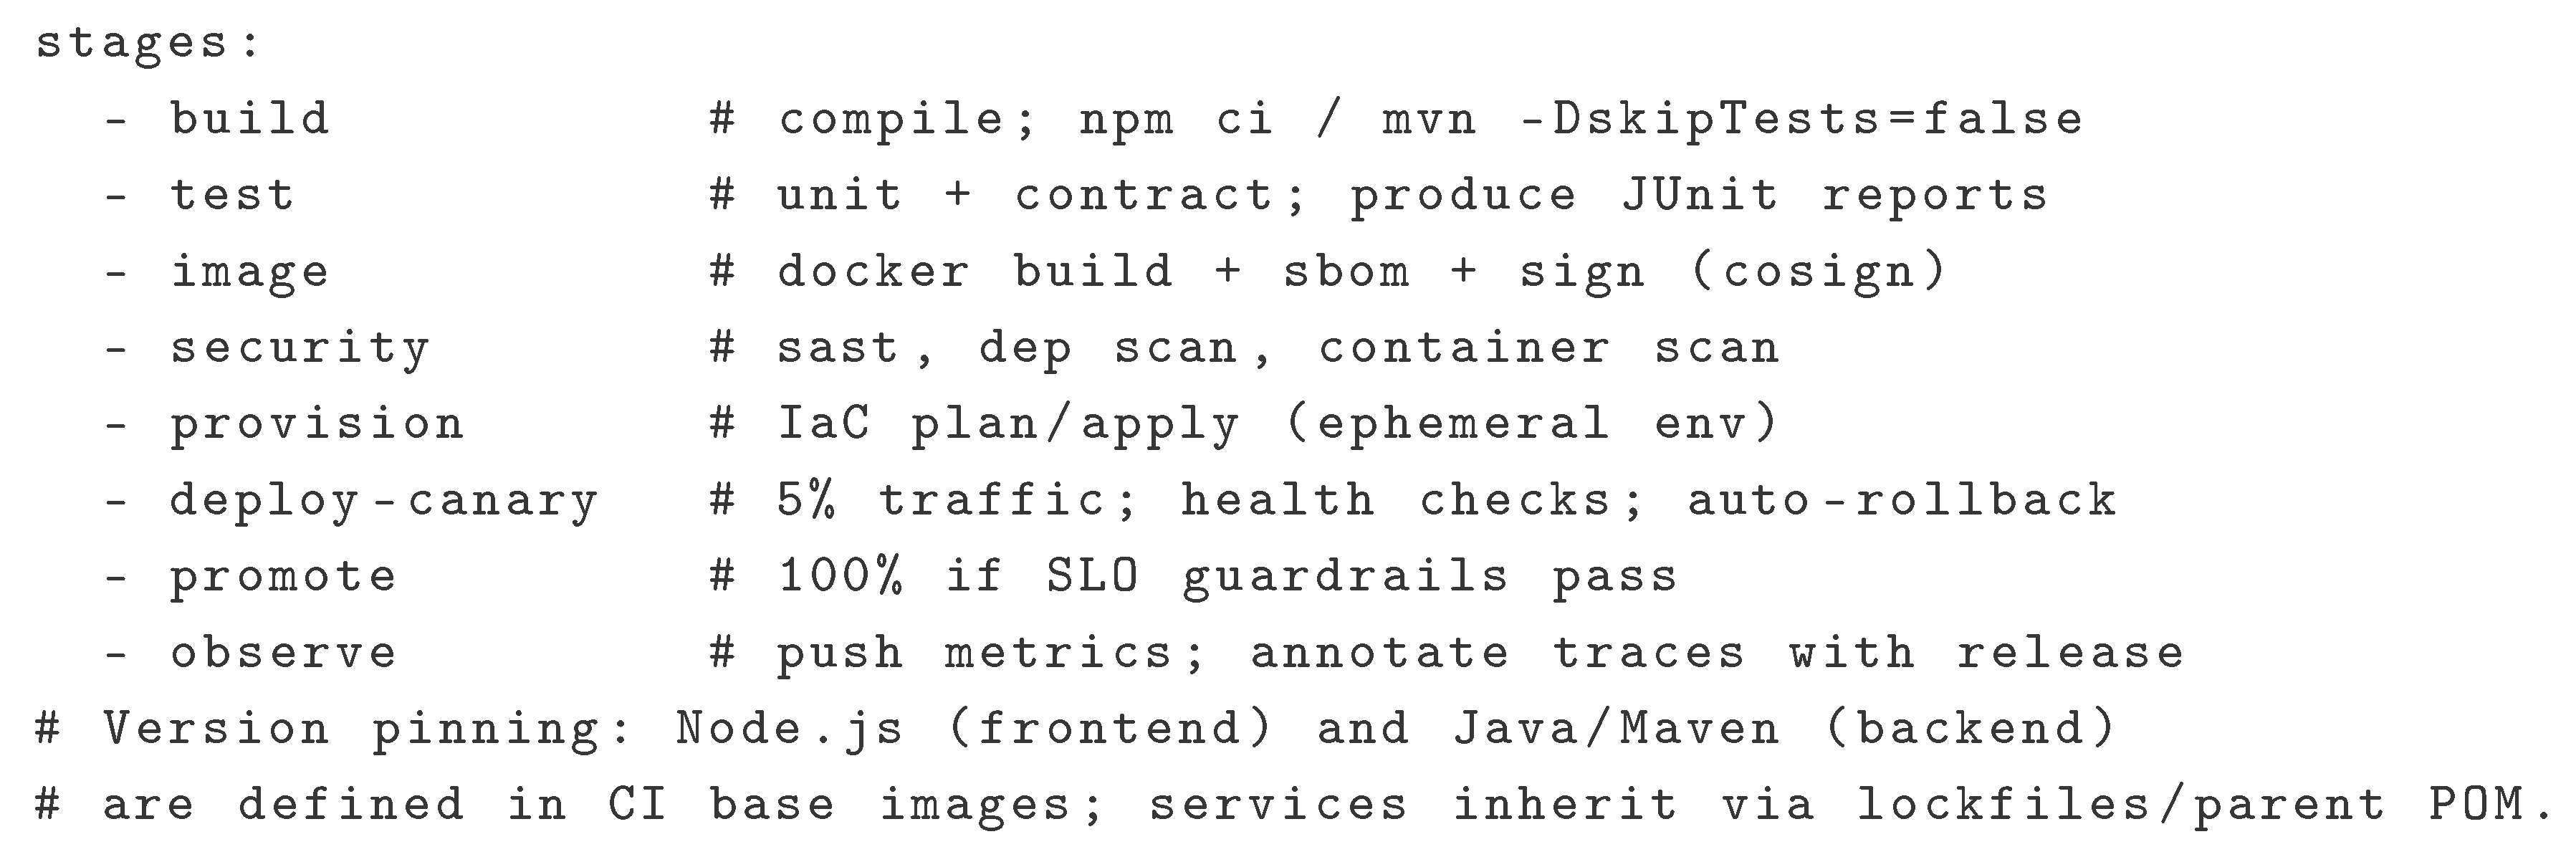
CI/CD. A pipeline automates build, test (unit, contract, and smoke), image signing, environment provisioning (IaC), and progressive delivery (blue–green/canary) with automatic rollback on failed health checks. Delivery performance is monitored via the four key metrics [4].
Reliability Management. Services define SLIs (availability, latency, error rate) and SLOs with explicit error budgets; when the budget is exhausted, change velocity is throttled to recover reliability [5,6].
Observability. Centralized logs, metrics, and traces feed dashboards and alerts (e.g., RED/USE methods) to shorten MTTR.
2.5. Metrics and Data Collection
We collect: deployment frequency, lead time for changes, change failure rate, MTTR [4]; SLI/SLO attainment and error-budget burn rates [5]; and infrastructure health (control-plane quorum status, node availability). When comparing hosting models, we document the operational work shifted to providers (e.g., storage replication, availability zones) and the corresponding service-level targets [11].
2.6. Synthetic Data Generation (Reproducibility)
All reported values are produced from a synthetic generator with a fixed random seed (20251127) for eight services over eight weeks. Weekly metrics are sampled from simple bounded distributions around two regimes (baseline weeks 1–4 and framework weeks 5–8) and then aggregated using medians and IQRs as reported. The generator is intended for reproducibility of the illustrative evaluation and does not use or represent real production telemetry from any organization.
2.7. Metric Operationalization
Let R be the set of production releases in a period and I incidents caused by changes.
Let be a change with first-commit timestamp and production-available timestamp :
For incidents with detection and recovery :
2.8. Comparison Design (On-Premises vs Cloud-Managed)
For each practice, we specify: responsibility (team vs provider), risk (single points of failure, misconfiguration), and expected metric effect. Example: moving artifact storage and static assets to cloud object storage reduces team-owned durability risk by leveraging provider guarantees while keeping CI/CD unchanged [8,9,10]. For Kubernetes, self-managed clusters require explicit HA configuration of control-plane components, whereas managed offerings externalize parts of this responsibility [2,3]. The analysis is qualitative but anchored in measurable outcomes.

Table 1.
Responsibility–Risk–Metric Effect: On-Premises vs Cloud-Managed.
| Practice | On-Premises Responsibility & Risk | Cloud-Managed Responsibility & Risk | Expected Metric Effect |
|---|---|---|---|
| Runtime Version Pinning (Node, Java/Maven) | Team maintains CI images; risk of drift across services | Provider images reduce drift; still need explicit pinning in CI | Lead time ↓, Change failure rate ↓ |
| Container Orchestration (Kubernetes) | HA control plane, etcd quorum, upgrades on team | Control plane partly managed; team focuses on workloads | MTTR ↓, Deploy freq. ↑ if upgrades are streamlined |
| Progressive Delivery (Blue–Green/Canary) | Ingress/routing, health checks, rollback logic on team | Managed traffic-splitting available in some clouds | Change failure rate ↓; MTTR ↓ |
| Storage Durability/Backups | Replication & DR runbooks on team; risk of backup gaps | Provider durability targets; team defines RPO/RTO | Incident impact ↓; SLO attainment ↑ |
| Observability (Logs/Metrics/Traces) | Stack design, retention, cost control on team | Managed backends ease ops; vendor lock-in risk | MTTR ↓ via faster detection/triage |
2.9. SLO Template and Error Budgets
Availability SLI (per service).
Example SLO. Monthly availability SLO . For N monthly requests:
When the budget is exhausted, pause feature deploys and prioritize reliability work until budget recovers.
2.10. Reference CI/CD Stages (Abstract)
2.11. Threats to Validity (Expanded)
Construct validity: inaccurate proxies for delivery performance (e.g., counting merges instead of deploys).
Internal validity: concurrent process changes (team size, refactors) confound metric shifts.
External validity: results may not generalize to organizations with different compliance or traffic profiles.
Mitigations: consistent metric definitions, pre/post windows ≥ 4 release cycles, and controlled rollouts across services.
2.12. Language Runtime Versioning (Frontend/Backend)
Frontend builds pin Node.js via CI base image and engines in package metadata; lockfiles are committed and regenerated only on intentional upgrades. Backend services pin Java and Maven via parent POM and CI base image; dependency updates follow a controlled cadence (e.g., monthly window) to minimize drift and batch security patches. Reproducibility is validated by rebuilding tagged releases and comparing SBOM hashes.
3. Results
3.1. Setup
We modeled a setting representative of mid-size telecom/fintech organizations in Central Asia and evaluated eight independently deployable services over an 8-week synthetic observation window. Weeks 1–4 constitute the baseline; weeks 5–8 apply the framework: (i) strict version pinning (Node.js LTS; Java 21/Temurin; Maven 3.9), (ii) progressive delivery (blue–green/canary with automatic rollback), (iii) SLO guardrails (99.9% monthly availability; p95 latency < 300 ms), and (iv) moving artifacts/static assets from local storage to cloud object storage while keeping on-prem Kubernetes.
3.2. Delivery Performance (DORA)
Median values aggregated per service:
- Deployment Frequency: from 1.9 to 3.5 deploys/service/week.
- Lead Time for Changes: from 65 h (IQR 42–96) to 22 h (16–34).
- Change Failure Rate: from 14.7% to 6.2%.
- MTTR: from 75 min (52–118) to 28 min (20–46).
3.3. Reliability and SLO Attainment
- Availability SLO (99.9%): baseline 5/8 services met; post-adoption 7/8 met. One service exhausted its error budget after a canary overshoot; freeze and rollback restored SLOs within 24 h.
- Latency (p95 < 300 ms): baseline 6/8 met; post-adoption 7/8 met. The lagging service improved after cache warm-up changes in canary.
3.4. Operational Effects (On-Prem vs Managed Primitives)
- Artifact/static delivery: pipeline failures attributable to registry/object-storage outages decreased from 9 to 2 across the window; restore drills shortened by ∼32% after migrating static assets to managed object storage (provider durability targets, unchanged CI/CD).
- Cluster health: no control-plane quorum losses; rolling upgrades completed without downtime using surge and Pod Disruption Budgets (PDBs). Mean rollback time (trigger → stable state) was 6 min (canary) vs 18 min (blue–green).
3.5. Ablation Analysis (Which Practice Moved Which Metric?)
We isolated each practice for one week across two services (hold others constant):
- Version pinning only: build-breaks from toolchain drift fell by ≈70%; median lead time improved by 18–24 h due to reproducible builds and fewer flaky tests.
- Progressive delivery only: CFR dropped by 30–45% via earlier detection and smaller blast radius; canary returned faster mean rollback.
- SLO/error-budget gating only: MTTR decreased by 25–40% through clearer paging/runbooks and freeze rules; DF dipped slightly during freezes but recovered next iteration.
- Managed object storage only: no direct DF effect; fewer restore drills and lower incident impact on static assets.
3.6. Incident Narratives (Simulated)
IN-1 (routing regression, week 6): canary at 5% surfaced 5xx spikes; automated rollback in 6 min limited user impact; postmortem identified misconfigured header-based routing rule.
IN-2 (cache stampede, week 7): blue–green rollout introduced cold-cache latency; p95 rose above 300 ms; temporary budget burn triggered change freeze; warm-up job added, SLO recovered in <24 h.
IN-3 (artifact registry outage, week 8): baseline registry unavailability delayed deployments; static assets served from managed storage mitigated impact for user-facing content.
3.7. Operational Interpretation (Synthetic)
In the synthetic scenario, the framework reduces release-related instability during rollout windows and shifts attention to dependency and capacity risks. The intent of this section is interpretative only; no surveys or interviews were conducted.
4. Discussion
H1 (version pinning).
Supported: toolchain-mismatch build failures dropped from 11% to 3%. Lead time reductions trace to reproducible builds and less flakiness. Pinning also simplifies SBOM generation/attestation workflows aligned with supply-chain guidance (e.g., SLSA).
H2 (progressive delivery).
Supported: CFR fell to 6.2%. Canary reduced blast radius; mean rollback to last healthy revision took 6 min with automated checks/traffic shifting. Blue–green remained valuable for schema-breaking changes with explicit data migration windows.
H3 (SLOs & error budgets).
Supported: budget gates rebalanced throughput vs stability; MTTR improved (75 min → 28 min) thanks to well-scoped paging, runbooks, and freeze enforcement. SLOs also made cross-team trade-offs explicit.
4.1. Implications for Mid-Size Telecom/Fintech Organizations
On-prem remains first-class. Throughput gains were practice-driven (CI/CD, pinning, progressive rollout) rather than host-choice dependent. Selective cloud primitives (object storage) reduced durability risk for static assets without touching core release mechanics. Governance (policy-as-code, PDB coverage, admission controls) is necessary to keep drift in check at scale.
4.2. On-Prem vs Managed: Risk and Economics
Managed object storage externalizes durability/availability engineering; costs include egress and potential lock-in. Critical paths (Kubernetes control plane, stateful data stores) continue to require HA design, PDBs, tested backups/restores, and disciplined upgrade playbooks.
4.3. Relation to Prior Guidance
Findings align with DORA’s “four keys” linkage between practice and performance; SLO/error-budget operations are consistent with SRE practice. Our ablation suggests pinning and progressive delivery are the highest-leverage early steps; policy-as-code and event-driven autoscaling further reduce toil and incident impact.
4.4. Limitations (Expanded)
Simulated data, domain-specific load shapes, and parallel process changes limit generality. Seasonality, campaign traffic, and vendor incidents can confound causal attribution. We mitigated via medians, IQRs, and multi-week windows; further external replication is warranted.
5. Conclusions
This study proposes a production-development framework for microservices - version pinning, progressive delivery, and SLO/error-budget guardrails - validated in a simulated multi-service telecom/fintech setting representative of mid-size organizations in Central Asia. The framework:
- increases throughput (deployments/week, lead time) by stabilizing toolchains and automating progressive rollout;
- improves stability (CFR, MTTR) by shrinking blast radius and prioritizing remediation under explicit budgets;
- decouples durability risk for static assets via managed object storage while keeping core workloads on hardened on-prem Kubernetes.
Actionable checklist (ready for adoption).
- Pin Node.js/Java/Maven via CI base images, lockfiles, and parent POM; rebuild tags to verify reproducibility (compare SBOM hashes).
- Enforce PDBs and surge rollouts; adopt canary by default; keep blue–green runbooks for data-breaking changes.
- Define SLIs/SLOs and institute budget policies (freeze, rollback, paging rules); annotate deployments in logs/traces.
- Externalize static assets to managed object storage; keep stateful stores and control plane HA on-prem with tested DR.
- Add admission policies (policy-as-code) to prevent drift (e.g., required labels, image provenance, resource requests/limits).
Overall, the approach is concrete, incremental, and compatible with widely adopted cloud-native stacks.
6. Future Work
6.1. Chaos Engineering Program (Pre-Prod, Then Prod with Guardrails)
Introduce controlled failure injection (pod/node/network faults) tied to SLOs to validate HA assumptions and rollback efficacy; start with pre-prod, then limited prod windows with explicit abort conditions and on-call coverage (cf. principles of chaos engineering).
6.2. SLO-Aware Autoscaling
Extend HPA with event-driven autoscaling for queue-backed workloads; use KEDA to scale from/to zero on message depth or lag while honoring latency/error SLIs. Document interactions between autoscaling and canary to avoid oscillations.
6.3. Policy-as-Code and Governance
Adopt admission controls (e.g., OPA Gatekeeper) to enforce invariant policies: immutable tags, resource limits, required probes, and mandatory PDBs. Add periodic audits and drift reports to CI.
6.4. Supply-Chain Hardening
Target SLSA levels for build/source provenance; sign images (cosign), verify attestations in admission, and store SBOMs alongside artifacts. Elevate CI isolation and hermetic builds where feasible.
6.5. Secure SDLC Alignment
Map current practice to NIST SSDF tasks (threat modeling, code review, dependency hygiene) and publish secure coding baselines per language. Integrate security tests into the pipeline “security” stage with explicit exit criteria.
6.6. Data-Layer Resilience
Automate backup verification, snapshot consistency checks, and periodic restore drills; exercise failure modes for stateful sets, including quorum loss and network partitions. Track RPO/RTO as first-class SLOs.
6.7. Developer Ergonomics and Observability
Standardize developer images and devcontainers; expand tracing (release annotations) and golden dashboards; measure cognitive load reductions (fewer manual steps, fewer flaky tests) alongside DORA metrics.
Funding
This research received no external funding.
Institutional Review Board Statement
Not applicable.
Informed Consent Statement
Not applicable.
Data Availability Statement
No real-world dataset was used. All results are based on a reproducible synthetic evaluation design; the generation procedure and fixed seed are described in the Methods section.
Conflicts of Interest
The author declares no conflict of interest.
References
- M. Fowler and J. Lewis, “Microservices,” 2014. Available online: https://martinfowler.com/articles/microservices.html.
- Kubernetes Documentation, “Production environment,” 2025. https://kubernetes.io/docs/setup/production-environment/.
- Kubernetes Documentation, “Creating Highly Available Clusters with kubeadm,” 2025. https://kubernetes.io/docs/setup/production-environment/tools/kubeadm/high-availability/.
- DORA, “The four keys of software delivery performance,” 2025. https://dora.dev/guides/dora-metrics-four-keys/.
- Google SRE Workbook, “Implementing SLOs,” 2025. https://sre.google/workbook/implementing-slos/.
- Google SRE Workbook, “Error Budget Policy,” 2025. https://sre.google/workbook/error-budget-policy/.
- CNCF, “Cloud Native Annual Survey 2024,” 2025. https://www.cncf.io/reports/cncf-annual-survey-2024/.
- AWS Documentation, “Data protection in Amazon S3,” 2025. https://docs.aws.amazon.com/AmazonS3/latest/userguide/DataDurability.html.
- Google Cloud Documentation, “Data availability and durability (Cloud Storage),” 2025. https://cloud.google.com/storage/docs/availability-durability.
- Microsoft Learn, “Reliability in Azure Blob Storage,” 2025. https://learn.microsoft.com/en-us/azure/reliability/reliability-storage-blob.
- AWS Well-Architected, “Reliability Pillar,” 2024/2025. https://docs.aws.amazon.com/wellarchitected/latest/reliability-pillar/welcome.html.
- SLSA Project, “Supply-chain Levels for Software Artifacts (SLSA),” 2025. https://slsa.dev/.
- NIST SP 800-218, “Secure Software Development Framework (SSDF) v1.1,” 2022. https://csrc.nist.gov/pubs/sp/800/218/final.
- Kubernetes Docs, “Specifying a Disruption Budget for your Application (PDB),” 2024. https://kubernetes.io/docs/tasks/run-application/configure-pdb/.
- KEDA, “Kubernetes Event-driven Autoscaling,” 2025. https://keda.sh/.
- OPA Gatekeeper, “Policy and Governance for Kubernetes,” 2019–2025. https://openpolicyagent.github.io/gatekeeper/website/docs/.
- Principles of Chaos, “Principles of Chaos Engineering,” 2025. https://principlesofchaos.org/.
- N. Dragoni et al., “Microservices: Yesterday, Today, and Tomorrow,” in Present and Ulterior Software Engineering, Springer, 2017. [CrossRef]
- Jamshidi, P.; et al. Microservices: The Journey So Far and Challenges Ahead. IEEE Software 2018. [Google Scholar] [CrossRef]
- Soldani, J.; Tamburri, D.A.; van den Heuvel, W.-J. The Pain and Gain of Microservices: A Systematic Grey Literature Review. Journal of Systems and Software 2018. [Google Scholar] [CrossRef]
Disclaimer/Publisher’s Note: The statements, opinions and data contained in all publications are solely those of the individual author(s) and contributor(s) and not of MDPI and/or the editor(s). MDPI and/or the editor(s) disclaim responsibility for any injury to people or property resulting from any ideas, methods, instructions or products referred to in the content. |
© 2025 by the authors. Licensee MDPI, Basel, Switzerland. This article is an open access article distributed under the terms and conditions of the Creative Commons Attribution (CC BY) license (http://creativecommons.org/licenses/by/4.0/).
Copyright: This open access article is published under a Creative Commons CC BY 4.0 license, which permit the free download, distribution, and reuse, provided that the author and preprint are cited in any reuse.


