
Submitted:
11 January 2024
Posted:
12 January 2024
You are already at the latest version
Abstract
Manufacturing environments, characterized by rapid, unpredictable changes, uncertainties, risks, and uncontrollable fluctuations, pose significant challenges to minimizing disruptions in processes. This study introduces an innovative approach that prioritizes curbing risk propagation among processes to enhance robustness. It emphasizes the integration of engineering management principles and modular design within manufacturing. Adopting a system engineering perspective, all manufacturing process activities are viewed as interrelated components within a unified system. By employing Axiomatic Design (AD) theory and the Design Structure Matrix (DSM) method, manufacturing process architecture is modularized, yielding heightened robustness. The proposed mathematical model equips engineering and manufacturing managers with a potent tool for designing robust processes while adeptly managing system complexity. The study's outcomes underscore a substantial enhancement in modularization, leading to elevated overall robustness in manufacturing processes. To validate the methodology, the architectural design of manufacturing processes is examined in a real-case scenario, specifically the Barez Industrial Group in Iran. This verification substantiates the 'manufacturing processes' of the case, presenting an optimally modularized architecture. The results affirm the proposed approach's efficacy, demonstrating improved modularization that contributes to bolstered robustness in manufacturing processes.
Keywords:
Axiomatic Design (AD) Theory
; Design Structure Matrix (DSM)
; Engineering Management
; Manufacturing Architecture Modularization
; Manufacturing Management
; Modular System Architecture
; Robustness
1. Introduction
To manufacture a product, effective and efficient utilization of technical personnel, physical resources, and information is crucial (Chang, 2005; Sharon et al., 2011). The responsibility for this crucial task is generally assigned to engineering management (Savage et al., 2019). Engineering management is a diverse field that combines the principles of engineering, business administration, and management to plan, design, organize, supervise, and lead technical projects, teams, and organizations. It applies engineering and management principles to ensure that engineering projects are completed on time, within budget, and to the required quality standards. The responsibilities of an engineering manager include coordinating and collaborating with different stakeholders involved in a project, such as engineers, clients, vendors, and regulatory bodies, while managing people, resources, and risk. Engineering management encompasses a broad range of topics, including technology management, quality control, project management, cost analysis, design, procurement, construction, commissioning, project control, quality assurance/quality control, project service, and more. Ultimately, engineering management aims to effectively and efficiently utilize technical personnel, physical resources, and information to produce products or services that meet an organization's goals and objectives (Lannes, 2001; Farr et al., 2001; Daughton, 2017; Savage et al., 2019).
The resource allocation, decision-making processes, and the overall organizational strategy are handled by manufacturing management to ensure effective operations (Womack and Jones, 2003; Chang, 2005; Jacobs et al., 2011). In this regard, manufacturing management can significantly impact engineering management (Ahmad et al., 2017).
Based on the provided definition, manufacturing management refers to the planning, coordination, and control of the production process to ensure that goods are produced efficiently, on time, and to the required quality standards. It involves managing the resources and activities involved in the manufacturing process, including people, materials, equipment, and information. (Stevenson, 2019).
Inefficient manufacturing management can lead to suboptimal use of resources, delays in production schedules, and reduced productivity, negatively impacting engineering management. On the other hand, by implementing effective manufacturing management systems, organizations can optimize resource allocation and streamline decision-making processes. This can result in improved production processes and increased efficiency in utilizing technical personnel and physical resources. (Chase et al., 1998; Jacobs et al., 2004; Slack et al., 2010; Egilmez et al., 2018).
Often, manufacturing environments may experience various rapid and sudden changes, a lot of uncertainty, unforeseen risks, unpredictable events, and/or uncontrollable fluctuations (Mollajan et al., 2023). Considering that manufacturing management assumes the role of overseeing resource allocation, decision-making processes, and the overarching organizational strategy, it is crucial that the manufacturing management is capable enough of identifying, analyzing, and mitigating potential risks that may arise during the production process. This includes risks related to equipment failure, supply chain disruptions, safety hazards, quality issues, and other factors that may impact the production process or product quality (Pallagst et al., 2013; Selviaridis et al., 2014; Egilmez et al., 2018).
The poor design of manufacturing processes can significantly contribute to the occurrence and propagation of operational risks (Rahmani and Thomson, 2011; Mollajan et al., 2021; Mollajan et al., 2022). A poorly designed manufacturing process architecture lacks alignment with good design principles, leading to complexity, low modularity, inefficient resource allocation, and limited flexibility. This deficiency increases the risk of errors, defects, and safety hazards, while hindering adaptation to evolving requirements and unforeseen challenges. Inefficient processes drive up production costs, waste materials, and introduce more errors. They also impede problem identification and resolution, resulting in delays and complications. Poor process design also limits visibility and hampers process improvement over time (Rahmani and Thomson, 2011). On the other hand, A well-designed manufacturing process architecture offers benefits to manufacturing and engineering management. It facilitates bottleneck detection and improvement identification, supported by comprehensive documentation and efficient communication channels. Real-time monitoring enables prompt issue detection and resolution, enhancing overall efficiency (Cheng et al., 2012). Effective design is crucial in minimizing the likelihood of operational risks and their potential impact on manufacturing processes (Mollajan et al., 2023).
The design of manufacturing processes has a cascading effect on engineering management in addition to manufacturing management. In fact, design and management of manufacturing processes have a significant impact on engineering management. Engineering teams bear the responsibility of designing, implementing, and improving these processes, which necessitates specific skills and expertise aligned with the complexity and level of automation employed. Furthermore, the effectiveness of engineering management systems, including quality control and continuous improvement programs, relies on the underlying architecture of manufacturing. Therefore, the design of manufacturing processes architecture falls within the scope of engineering management responsibilities, offering an opportunity for them to make a substantial impact.
Achieving a well-designed architecture for manufacturing processes is crucial, and manufacturing management plays a pivotal role in contributing to engineering management. One of the most effective and critical ways in which manufacturing management can make this contribution is by actively participating in the design phase of a product. By involving manufacturing experts from the outset, potential production and assembly challenges can be identified and addressed proactively, resulting in an optimized manufacturing process. This collaborative approach ensures the development of an efficient and streamlined process, ultimately leading to the creation of high-quality products.
2. Design of Robust Architecture for Manufacturing Processes
When it comes to manufacturing processes, particularly in the face of environmental disturbances, the significance of robustness cannot be overstated. A robust design for manufacturing processes is key to ensuring that a manufacturing process can withstand, adapt to, and recover from any unforeseen disruptions that may arise.
Al-Refaie (2011) contributed to the understanding and modeling of robustness, highlighting the need for comprehensive methodologies that consider the various factors influencing performance. Koc et al. (2011) conducted a study on process parameter variation in worm hydroforming, aiming to optimize quality, robustness, and capability. They employed response surface analysis with a Box-Behnken design to optimize parameters and evaluate process capability using univariate indices such as Cp and Cpk. However, the study did not consider the interrelationships among response variables and noise variables, indicating the need to account for these factors in robustness assessments. The challenges associated with noise variables in robustness studies were highlighted by Mevik et al. (2001) and Robinson, Borror, and Myers (2004). Their work emphasized the limitations of certain designs, such as BBD, in effectively accounting for noise variables, which are crucial for studying robustness.
Scholz-Reiter et al. (2011) suggested improving robustness by enhancing production capacities through resource utilization optimization. They explore how optimizing resource utilization can contribute to robustness in production systems. Karimi and Djokoto (2012) also discussed the topic of robust stability analysis, further emphasizing the importance of accounting for uncertainties and disturbances in manufacturing processes. Kusumoto et al. (2012), they also discuss robust management in manufacturing systems, focusing on product and process robustness. They emphasize the importance of state-space analysis and structured analysis tools in achieving robustness. Alem and Morabito (2012) implement a robust optimization scheduling approach in furniture manufacturing. Their study surpasses deterministic worst-case methods in most situations, demonstrating the effectiveness of robust optimization techniques in improving robustness in manufacturing processes. Meyer et al. (2013) conducted research to analyze the influence of capacity adjustments on the performance robustness of different operational key figures in manufacturing systems. Their study investigated the trade-off between the robustness of operational performance and cost-efficiency, emphasizing the importance of systems being able to withstand fluctuations and disturbances to maintain high performance and profitability. Mondal et al. (2013) focused on the measurement and modeling of robustness in serial multi-stage manufacturing processes. They employed sensitivity analysis and sensitivity matrices to evaluate and measure the robustness of these processes. The authors highlighted the complexities and interactions present in multi-stage processes, emphasizing the need for a comprehensive understanding of robustness measurement. However, they acknowledged that their methods were more suitable for large batch production scenarios and may not be effective in situations such as one-kilogram production. Additionally, Mondal (2013) introduced a modeling approach that incorporated input-output and in-process parameters to assess and model process robustness in manufacturing systems. They demonstrated the application of their approach through a numerical example involving a two-stage worm gear manufacturing process. Malmström et al. (2013) explored the relationship between resource constraints and robustness in smaller companies. Their findings contribute to understanding the challenges faced by these companies in achieving and maintaining high levels of robustness. Montgomery (2013) emphasized the importance of interaction effects and noise variables in achieving robustness in design and manufacturing. He highlighted the need to understand their impact and efficiently incorporate them in experiments. Montgomery also discussed the relationship between process capability and robustness, emphasizing the need for further modeling and understanding. These insights contribute to the understanding of robust design and process robustness. Xiong et al. (2013) conducted research on evaluating the robustness of production systems. They introduced indicators related to material variances, free capacity, and the overlap between slack periods and machine failure. Their studies explored the system's ability to handle disruptions and maintain smooth operations. Additionally, they focused on evaluating robustness in a flexible job shop problem using the concept of float time. Their research provided valuable insights into the impact of machine and tool breakdowns on the robustness of production systems. Becker et al. (2013) defined MS robustness as the ratio of feasible operations with disruptions of a specific machine to the total feasible operations without disruptions. The specific details or context of their research are not mentioned in the text. Sharda and Banerjee (2013) presented a mathematical optimization model for designing a robust manufacturing system (MS). Their model incorporated factors such as processing times, equipment failure and repairs, and product demand to improve performance in the face of uncertainties. The model aimed to minimize makespan, mean work-in-progress (WIP), and the number of machines, considering these uncertainties during the design process. Mondal et al. (2014) critically reviewed robust approaches for measuring and modeling process robustness in product and manufacturing processes. This research contributed to understanding the effectiveness of existing methodologies and techniques in assessing and modeling process robustness. Taguchi's concept of process robustness emphasized designing processes less sensitive to variations and disruptions for consistent performance. Stricker and Lanza (2014) conducted research that supports the importance of robustness in production systems. They utilized the Value-at-Risk (VaR) measure as an indicator of robustness and explored its implications in uncertain environments. Their work contributes to the understanding of robustness and its role in the success of production systems. Bebera and Becker (2014) focused on exploring the relationship between the topological characteristics and dynamic behavior in manufacturing networks. They highlighted the importance of the network's static structure, represented by its topology, and the material flow within the network in influencing factors such as performance and robustness. Varas et al. (2014) contributed to the field of robust optimization by demonstrating its benefits in reducing variability and uncertainty in production schedules. Their work specifically focused on a sawmill scenario, highlighting the effectiveness of robust optimization strategies. Benderbal et al. (2015) emphasized the significance of technical disruptions in production systems. They analyzed the impact of these disruptions on system robustness and focus on optimizing schedules and designs. Tian et al. (2015) introduced sensitivity analysis to analyze the effects of machining parameters in the electrical discharge machining process. Their research focused on understanding the sensitivity of these parameters and their impact on the overall process. Putnik et al. (2015) studied the impact of system size and network structure on the robustness of production networks under changing demand. They defined robustness as the ratio of production rate with perturbations to production rate without perturbations, exploring the relationship between system characteristics and robustness. Their research assessed robustness in manufacturing systems, without specifying the approach or measure used. Benderbal et al. (2015) explored robustness in a reconfigurable production system using an average-based measure that quantified potential delays from machine failure. Their study highlighted various approaches to measuring robustness, including time span, float time, and average-based measures, providing insights into the system's ability to handle variations and disruptions. Stricker et al. (2015), their work reinforces the notion that high robustness is associated with costs. They provide insights into the trade-off between robustness and cost considerations in manufacturing systems. Giannetti and Ransing (2016) improved output quality in the steel foundry industry using tolerance synthesis to assess process robustness. Their robustness indicator, a likelihood ratio, compared the likelihood of achieving the expected output using modified input parameter regions. Validation of their methodology demonstrated its potential in improving output quality. Zhao et al. (2016) investigated the performance evaluation of the axial ventilator in the turbofan engine lubrication system. Their study aimed to assess the sensitivity of the ventilator's performance to different factors. Meyer (2016) examined the role of redundancy in achieving robustness in manufacturing system performance. The study derived specific definitions of robustness and redundancy for the manufacturing context and explored indicators such as nestedness and elementary flux modes. Analysis of different manufacturing system configurations revealed a significant correlation between redundancy and robustness. These findings emphasized the potential of incorporating robustness in the design of manufacturing systems. Boorla and Howard (2016) contribute to the discussion of robust management in manufacturing systems. They highlight the significance of robustness measures and analysis in ensuring the resilience of products and manufacturing processes. Sakhaii et al. (2016) further contribute to the topic of technical disruptions in production systems. Their research explores the optimization of system characteristics and the impact of these disruptions. Moslemi et al. (2017) focus on modeling robustness in multistage manufacturing systems, introducing process capability as a surrogate measure of robustness. They utilize response surfaces and a robust coefficient estimation method to analyze quality characteristics. The results demonstrate the superiority of the robust multistage process and highlight the relationship between robustness and capability in multistage manufacturing. This research contributes to understanding robustness in multistage processes and the use of robustness indices as surrogates. Zeng and Yen (2017), their work focuses on the impact of global value chains on production systems. They highlight how optimizing costs in these chains can increase vulnerability to factors like geo-political disputes and transportation issues, further emphasizing the need for robustness.
Zhang et al. (2017), their research primarily focuses on ensuring robustness in manufacturing systems through technology control. They address the importance of technological advancements and control mechanisms in achieving robustness. Himmiche et al. (2018) conducted a study on the impact of disturbances and uncertainties on meeting deadlines in a production system. They evaluated various machine capacity plans and assessed the likelihood of meeting deadlines under these conditions. Additionally, their research focused on addressing technical disruptions, such as machine and tool breakdowns, and optimizing system characteristics to enhance robustness. Efthymiou et al. (2018) explore robustness in the aerospace domain, applying their metric in a supplier flow workshop. Their approach quantifies capability and enhances controllability across scenarios using likelihood-based indicators. The case study showcases the practical application of their approach, providing valuable insights into production system robustness in the aerospace industry. Pagone et al. (2019) focused on the association between high robustness and costs. They contribute to the understanding of the economic implications of achieving and maintaining robustness in manufacturing operations.
Frederico et al. (2020) addressed the challenges posed by digitization in production systems. They highlight the need for rapid adaptation to new technologies, business models, and competitors, underscoring the importance of robustness in these dynamic environments. Martín et al. (2020) illustrated the benefits of a robust optimization approach in achieving high robustness at lower costs in an automotive supplier context. Their study compared the performance of the robust optimization approach with heuristic planning approaches for production schedules, emphasizing the cost-effectiveness of the robust optimization strategy.
Hyder et al. (2021) tackled uncertainty and sustainability in cloud manufacturing, exploring tools and proposing a Collaborative Cloud Service Platform (CCSP) to enhance supplier-customer-manufacturer relations while considering robustness and sustainability in service composition. Stockmann et al. (2021) emphasized a holistic approach to assess robustness in production systems, considering tradeoffs between performance, resource requirements, and output. Their methodology evaluated robustness from an input-throughput-output perspective, connecting it with adjacent capabilities for a comprehensive understanding of production system robustness. Liang and Li (2022) explored cooperation uncertainty's impact on robustness in manufacturing service systems (MSS). They proposed a methodology treating MSS as a network of service subsystems to identify critical paths and standardize cooperation mechanisms for enhanced robustness.
Exhibit 1 presents a comprehensive overview of the significant aspects of the present study, in comparison to the relevant studies found in the literature. The table showcases the diverse range of studies in the literature, which primarily concentrate on various aspects such as developing mathematical/statistical methods, presenting informative process capability indices, incorporating robust design principles, introducing useful robustness measures, and considering the complexity of interrelationships among manufacturing processes to tackle the issue of robustness in manufacturing process structure. Additionally, a select few of these studies also approach the problem from systems engineering perspective, specifically addressing the concept of system architecture. To achieve such robustness, a system engineering approach is adopted in the present study. This approach recognizes that all activities involved in forming the manufacturing process should be viewed as an integrated system, working together harmoniously to enhance its robustness. It is worth noting that within this category of studies, only a limited number of works propose modularization as an effective approach for achieving robustness in manufacturing processes. Exhibit 1 provides an overview of studies that utilize the Axiomatic Design (AD) theory to modularize the system architecture and contribute to the design of robust manufacturing processes. However, the literature review reveals that the focus has mainly been on the allocated architecture of the system, neglecting the significance of the process architecture in system robustness. According to the AD theory (Suh 2001), the physical components of the system, which are part of the physical architecture, are influenced by a set of process variables (such as men, machines, methods, and materials) belonging to the process architecture. Therefore, this study emphasizes the importance of considering modularity in the process architecture, as it indirectly supports modularity in the allocated architecture. In other words, examining the modularity of the process domain architecture is crucial for the effective allocation of components within the physical system. The literature currently lacks a clear understanding of how modularization of manufacturing processes architecture can effectively enhance the robustness of the system architecture while minimizing system complexity. This gap emphasizes the need for a mathematical model that elucidates the relationship between manufacturing processes architecture robustness and system architecture modularization. Such a model would provide valuable support to systems engineers in designing robust manufacturing processes architecture.
The purpose of this study is to address this significant gap in the literature and develop a mathematical model that precisely defines the proposed approach. By clarifying the relationship between manufacturing processes architecture and system architecture through modularization, the model aims to facilitate the creation of a robust characteristic in the manufacturing processes architecture while ensuring controlled system complexity.
To modularize the system architecture and consider the identified modules more effectively, this study employs the DSM methodology.
The paper is organized as follows: The introduction provides an overview of the study. Section 2 discusses the robust architecture for manufacturing processes, including a literature review and identification of research gaps. Section 3 presents background materials related to the topic. In Section 4, the research method and mathematical model development are described, specifically focusing on the relationship between "modularity" and the property of "robustness of manufacturing processes." Section 5 offers a case study that applies the robustness analysis method to manufacturing processes in Barez Industrial Group, an Iranian company. Finally, Section 6 concludes the paper by discussing the conclusions drawn from the robustness analysis method and providing practical recommendations.

Exhibit 1.
Features of the present research comparing with the relevant researches.
| Features | ||||||||
|---|---|---|---|---|---|---|---|---|
| Development of a Statistical/Mathematical Optimization Model | Process Capability Indices Consideration | Utilization of Robust Design Principle | Utilization of Response Surface Methodology | Development of Measurement of Robustness | Complexity of Interrelationship in Manufacturing Processes | Consideration of Manufacturing Processes Architecture | Modularization of Manufacturing Processes Architecture | |
| This Research | ✓ | ✓ | ✓ | ✓ | ✓ | ✓ | ✓ | ✓ |
| Al-Refaie (2011) | ✓ | ✓ | ✓ | ✓ | ✓ | |||
| Koc et al. (2011) | ✓ | ✓ | ✓ | ✓ | ✓ | |||
| Mevik et al. (2001) | ✓ | ✓ | ✓ | ✓ | ✓ | |||
| Robinson, Borror, and Myers (2004) | ✓ | ✓ | ✓ | ✓ | ✓ | |||
| Nourelfath (2011) | ✓ | ✓ | ✓ | ✓ | ✓ | |||
| Scholz-Reiter et al. (2011) | ✓ | ✓ | ✓ | ✓ | ✓ | |||
| Karimi and Djokoto (2012) | ✓ | ✓ | ✓ | ✓ | ✓ | |||
| Kusumoto et al. (2012) | ✓ | ✓ | ✓ | ✓ | ✓ | |||
| Alem and Morabito (2012) | ✓ | ✓ | ✓ | ✓ | ✓ | |||
| Meyer et al. (2013) | ✓ | ✓ | ✓ | ✓ | ✓ | |||
| Mondal et al. (2013) | ✓ | ✓ | ✓ | ✓ | ✓ | ✓ | ||
| Malmström et al. (2013) | ✓ | ✓ | ✓ | ✓ | ✓ | |||
| Montgomery (2013) | ✓ | ✓ | ✓ | ✓ | ✓ | ✓ | ||
| Mondal et al. (2013) | ✓ | ✓ | ✓ | ✓ | ✓ | |||
| Becker et al. (2013) | ✓ | ✓ | ✓ | ✓ | ✓ | |||
| Sharda and Banerjee (2013) | ✓ | ✓ | ✓ | ✓ | ✓ | |||
| Xiong et al. (2013) | ✓ | ✓ | ✓ | ✓ | ✓ | ✓ | ||
| Mondal et al. (2014) | ✓ | ✓ | ✓ | ✓ | ✓ | |||
| Stricker and Lanza (2014) | ✓ | ✓ | ✓ | ✓ | ✓ | |||
| Bebera and Becker (2014) | ✓ | ✓ | ✓ | ✓ | ✓ | |||
| Varas et al. (2014) | ✓ | ✓ | ✓ | ✓ | ✓ | ✓ | ||
| Benderbal et al. (2015) | ✓ | ✓ | ✓ | ✓ | ✓ | ✓ | ||
| Tian et al. (2015) | ✓ | ✓ | ✓ | ✓ | ✓ | |||
| Putnik et al. (2015) | ✓ | ✓ | ✓ | ✓ | ✓ | |||
| Benderbal et al. (2015) | ✓ | ✓ | ✓ | ✓ | ✓ | |||
| Stricker et al. (2015) | ✓ | ✓ | ✓ | ✓ | ✓ | |||
| Giannetti and Ransing (2016) | ✓ | ✓ | ✓ | ✓ | ✓ | |||
| Zhao et al. (2016) | ✓ | ✓ | ✓ | ✓ | ✓ | |||
| Meyer (2016) | ✓ | ✓ | ✓ | ✓ | ✓ | |||
| Boorla and Howard (2016) | ✓ | ✓ | ✓ | ✓ | ✓ | |||
| Sakhaii et al. (2016) | ✓ | ✓ | ✓ | ✓ | ✓ | |||
| Moslemi et al. (2017) | ✓ | ✓ | ✓ | ✓ | ✓ | |||
| Zeng and Yen (2017) | ✓ | ✓ | ✓ | ✓ | ✓ | |||
| Zhang et al. (2017) | ✓ | ✓ | ✓ | ✓ | ✓ | |||
| Himmiche et al. (2018) | ✓ | ✓ | ✓ | ✓ | ✓ | |||
| Efthymiou et al. (2018) | ✓ | ✓ | ✓ | ✓ | ✓ | |||
| Pagone et al. (2019) | ✓ | ✓ | ✓ | ✓ | ✓ | |||
| Frederico et al. (2020) | ✓ | ✓ | ✓ | ✓ | ✓ | |||
| Martín et al. (2020) | ✓ | ✓ | ✓ | ✓ | ✓ | |||
| Hyder et al. (2021) | ✓ | ✓ | ✓ | ✓ | ✓ | |||
| Stockmann et al. (2021) | ✓ | ✓ | ✓ | ✓ | ✓ | |||
| Liang and Li (2022) | ✓ | ✓ | ✓ | ✓ | ✓ | |||
3. Background Material
3.1. Robustness
There is a wide variety of definitions for robustness. According to Carlson and Doyle (2002), robustness is “the maintenance of some desired system characteristic despite fluctuations in the behavior of its component parts or its environment”. Fricke and Schulz (2005) define robustness as “a system’s ability to be insensitive towards changing environments. Robust systems deliver their intended functionality under varying operating conditions without being changed”. We use the definition by Barber and Salido (2011): robustness is the ability of a system to withstand stress, pressure, perturbations, unpredictable changes or variability in its operating environment without loss of functionality.
3.2. Axiomatic Design (AD) Theory
The Axiomatic Design (AD) Theory is a coherent framework rooted in techniques and logical thought processes, aimed at conducting design activities in a systematic and scientific manner (Suh, 1990). The primary elements employed within AD encompass 'Domains', 'Mapping and Zigzagging', the 'Independence (First) Axiom', and the 'Information (Second) Axiom'.
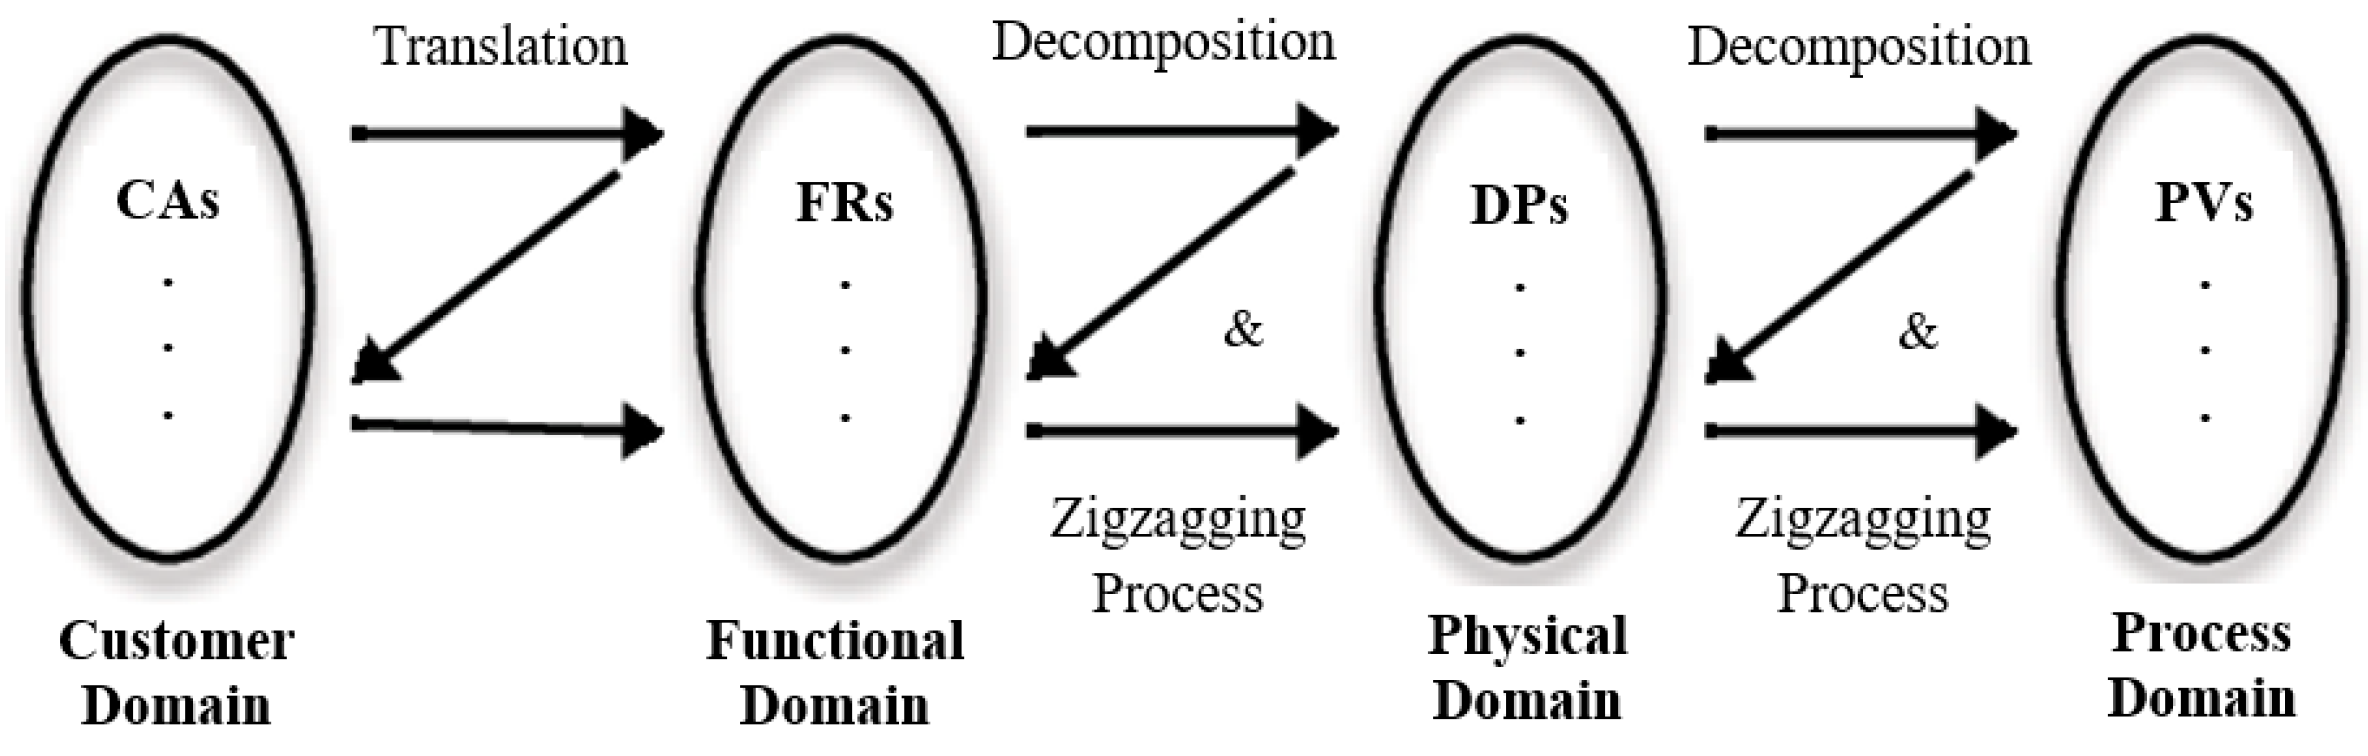
The Axiomatic Design (AD) method is a well-structured approach established to guide design activities across four distinct design domains: the 'Customer Domain', the 'Functional Requirements (FRs) Domain', the 'Physical or Design Parameters (DPs) Domain', and the 'Process Variables (PVs) Domain' (as depicted in Exhibit 2). The customer domain encapsulates customer attributes (CAs). These attributes' elements need to be transformed into functional requirements (FRs) and constraints (Cs) within the functional domain. To fulfil these FRs, design parameters (DPs) are established within the physical domain. Ultimately, to bring the system into production, process variables (PVs) are defined within the process domain. The design process operates as a dynamic interplay between two adjacent domains, cascading in a top-to-bottom manner, commencing at the system level and progressively delving into sublevels of finer detail until a comprehensive representation of the system of interest emerges. The linkage between two contiguous domains is aptly named the 'zigzagging' process, achieved by methodically breaking down the system into smaller design components (as illustrated in Exhibit 2).
Exhibit 2.
Design domains in Axiomatic Design (AD) theory
The AD theory offers two design axioms for gauging the quality of solutions and provides guidance on how to assess and choose from various alternatives (Suh, 2001).
- Independence Axiom: Preserve the autonomy of the FRs (DPs). This axiom emphasizes that each FR (DP) should maintain its autonomy. Therefore, system designers face a pivotal challenge in disassembling intricate systems into subsystems characterized by independent FRs (DPs).
- Information Axiom: Minimize the informational complexity of a design. This axiom asserts that among designs adhering to the Independence Axiom, the one with the lowest informational complexity is regarded as the optimal design choice. The informational complexity associated with a particular FR (DP) quantifies the likelihood of achieving a given FR (DP) successfully (Suh, 2001).
In allocation between functional and physical domains, the informational complexity of a design with a single FR and DP can be expressed as the logarithm of the reciprocal of the probability of system success in fulfilling the FR (P, Equation 1);
Where ‘I’ denotes the information content, measured in bits (logarithm to base 2), and signifies the extent of effort needed to accomplish the given FR.
With the assumption of a uniform probability density function (pdf), the information content ‘I’ can be formulated as depicted in Equation (2);
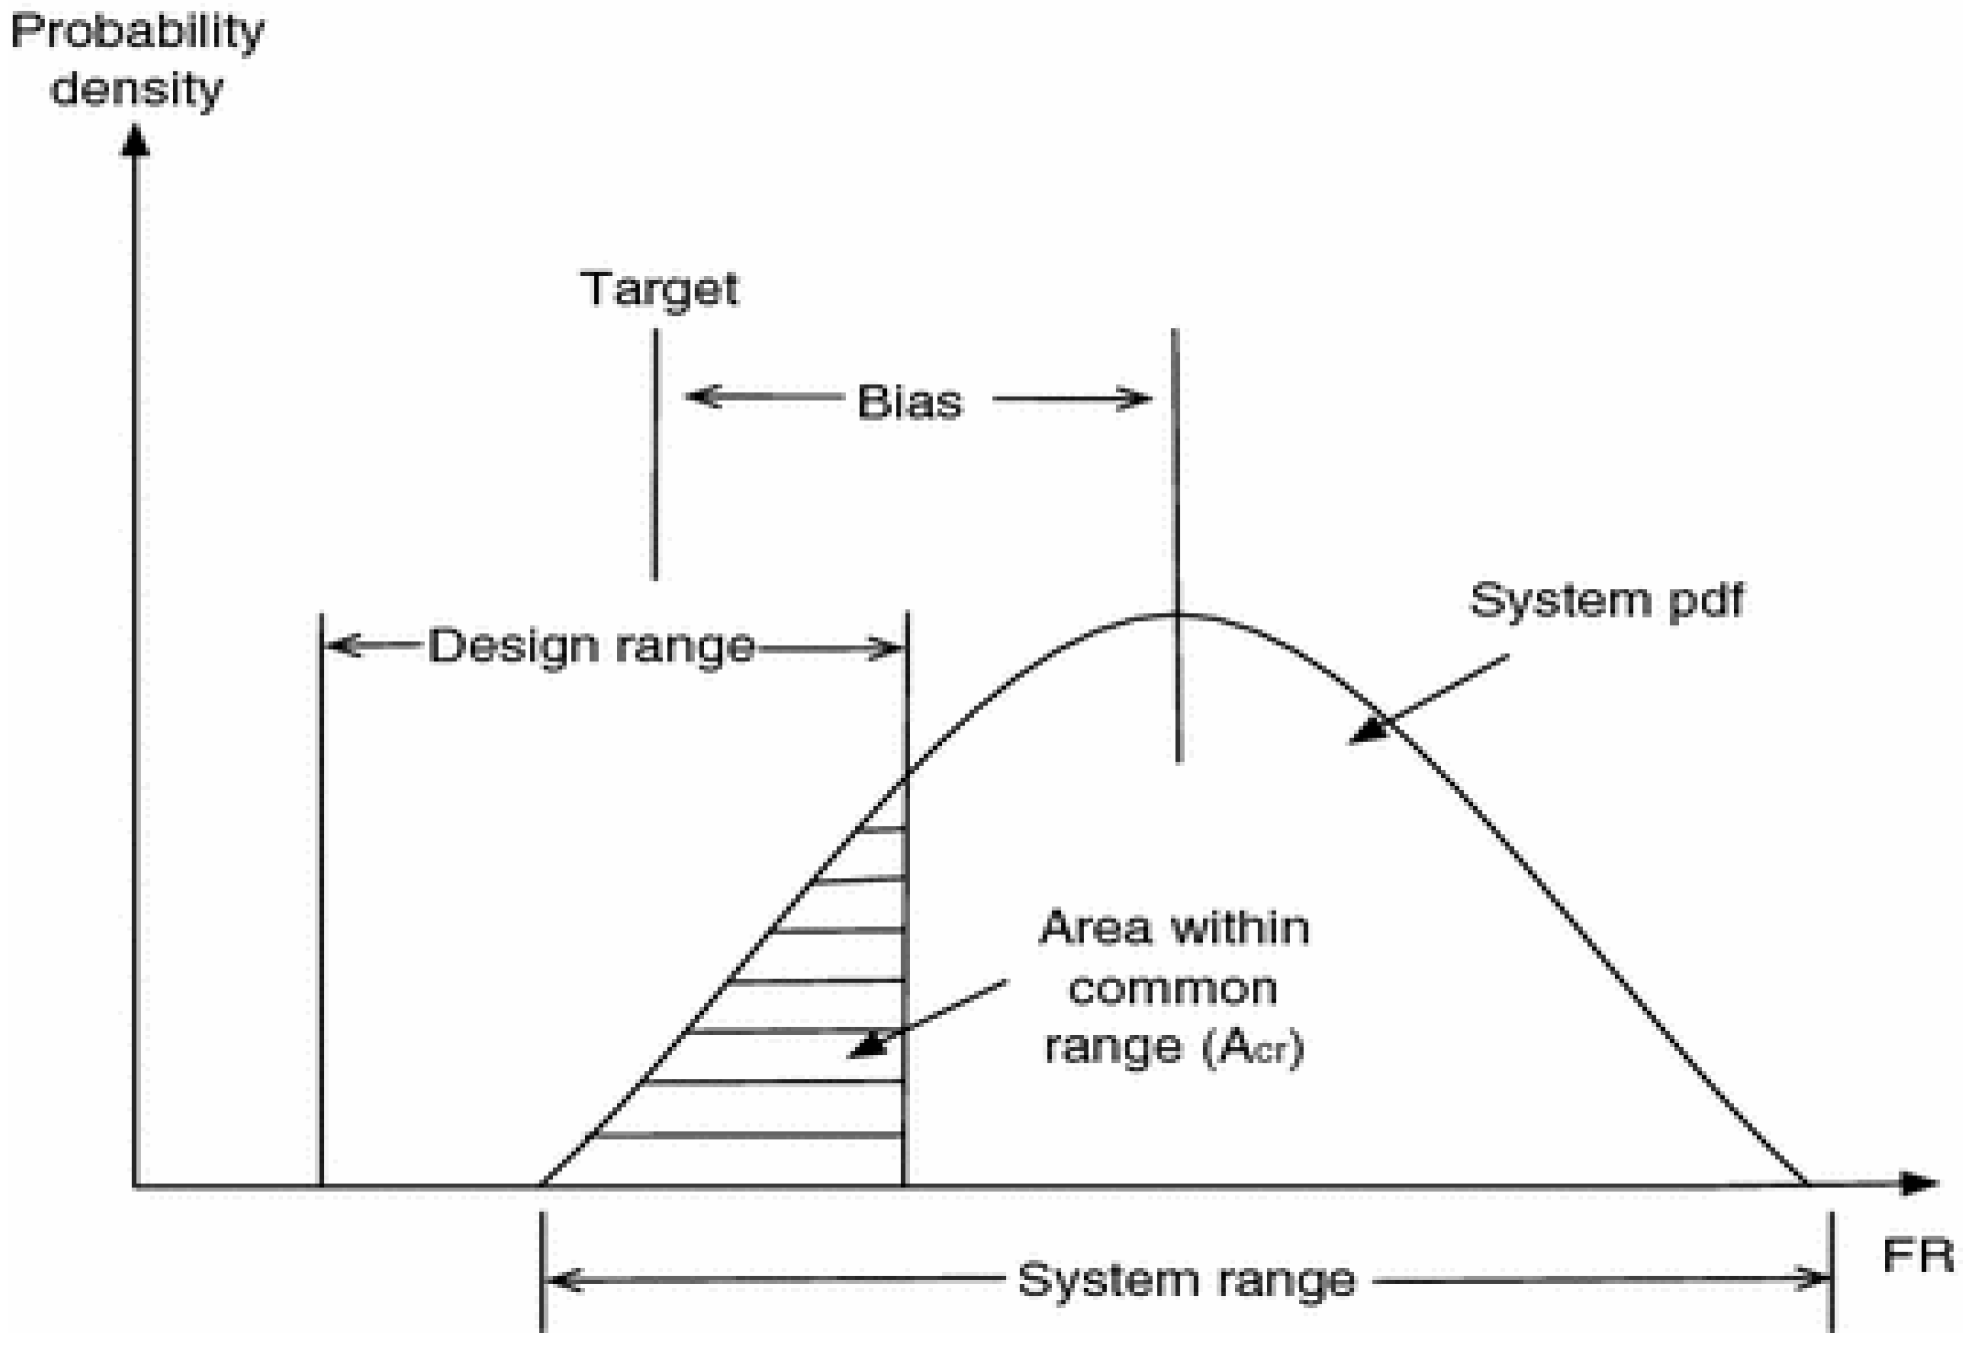
The system range's extent is represented as SR, calculated from the probability density function of the FR. In essence, the SR of a particular FR signifies the performance range, PR, linked with the FR in question. The shared range's size, CR, constitutes the segment of the earlier mentioned area within the design range, DR, as illustrated in Exhibit 3. The DR defines the admissible scope linked to the relevant FR.
In the context of an uncoupled design involving n FRs (DPs), the aggregate information is formulated according to Equation (3);
where ‘Pi’ represents the probability of FRi (DPi) being fulfilled by DPi (PVi).
Exhibit 3.
Probability of success in fulfilling a functional requirement (FR).
3.3. Design Structure Matrix (DSM) Methodology
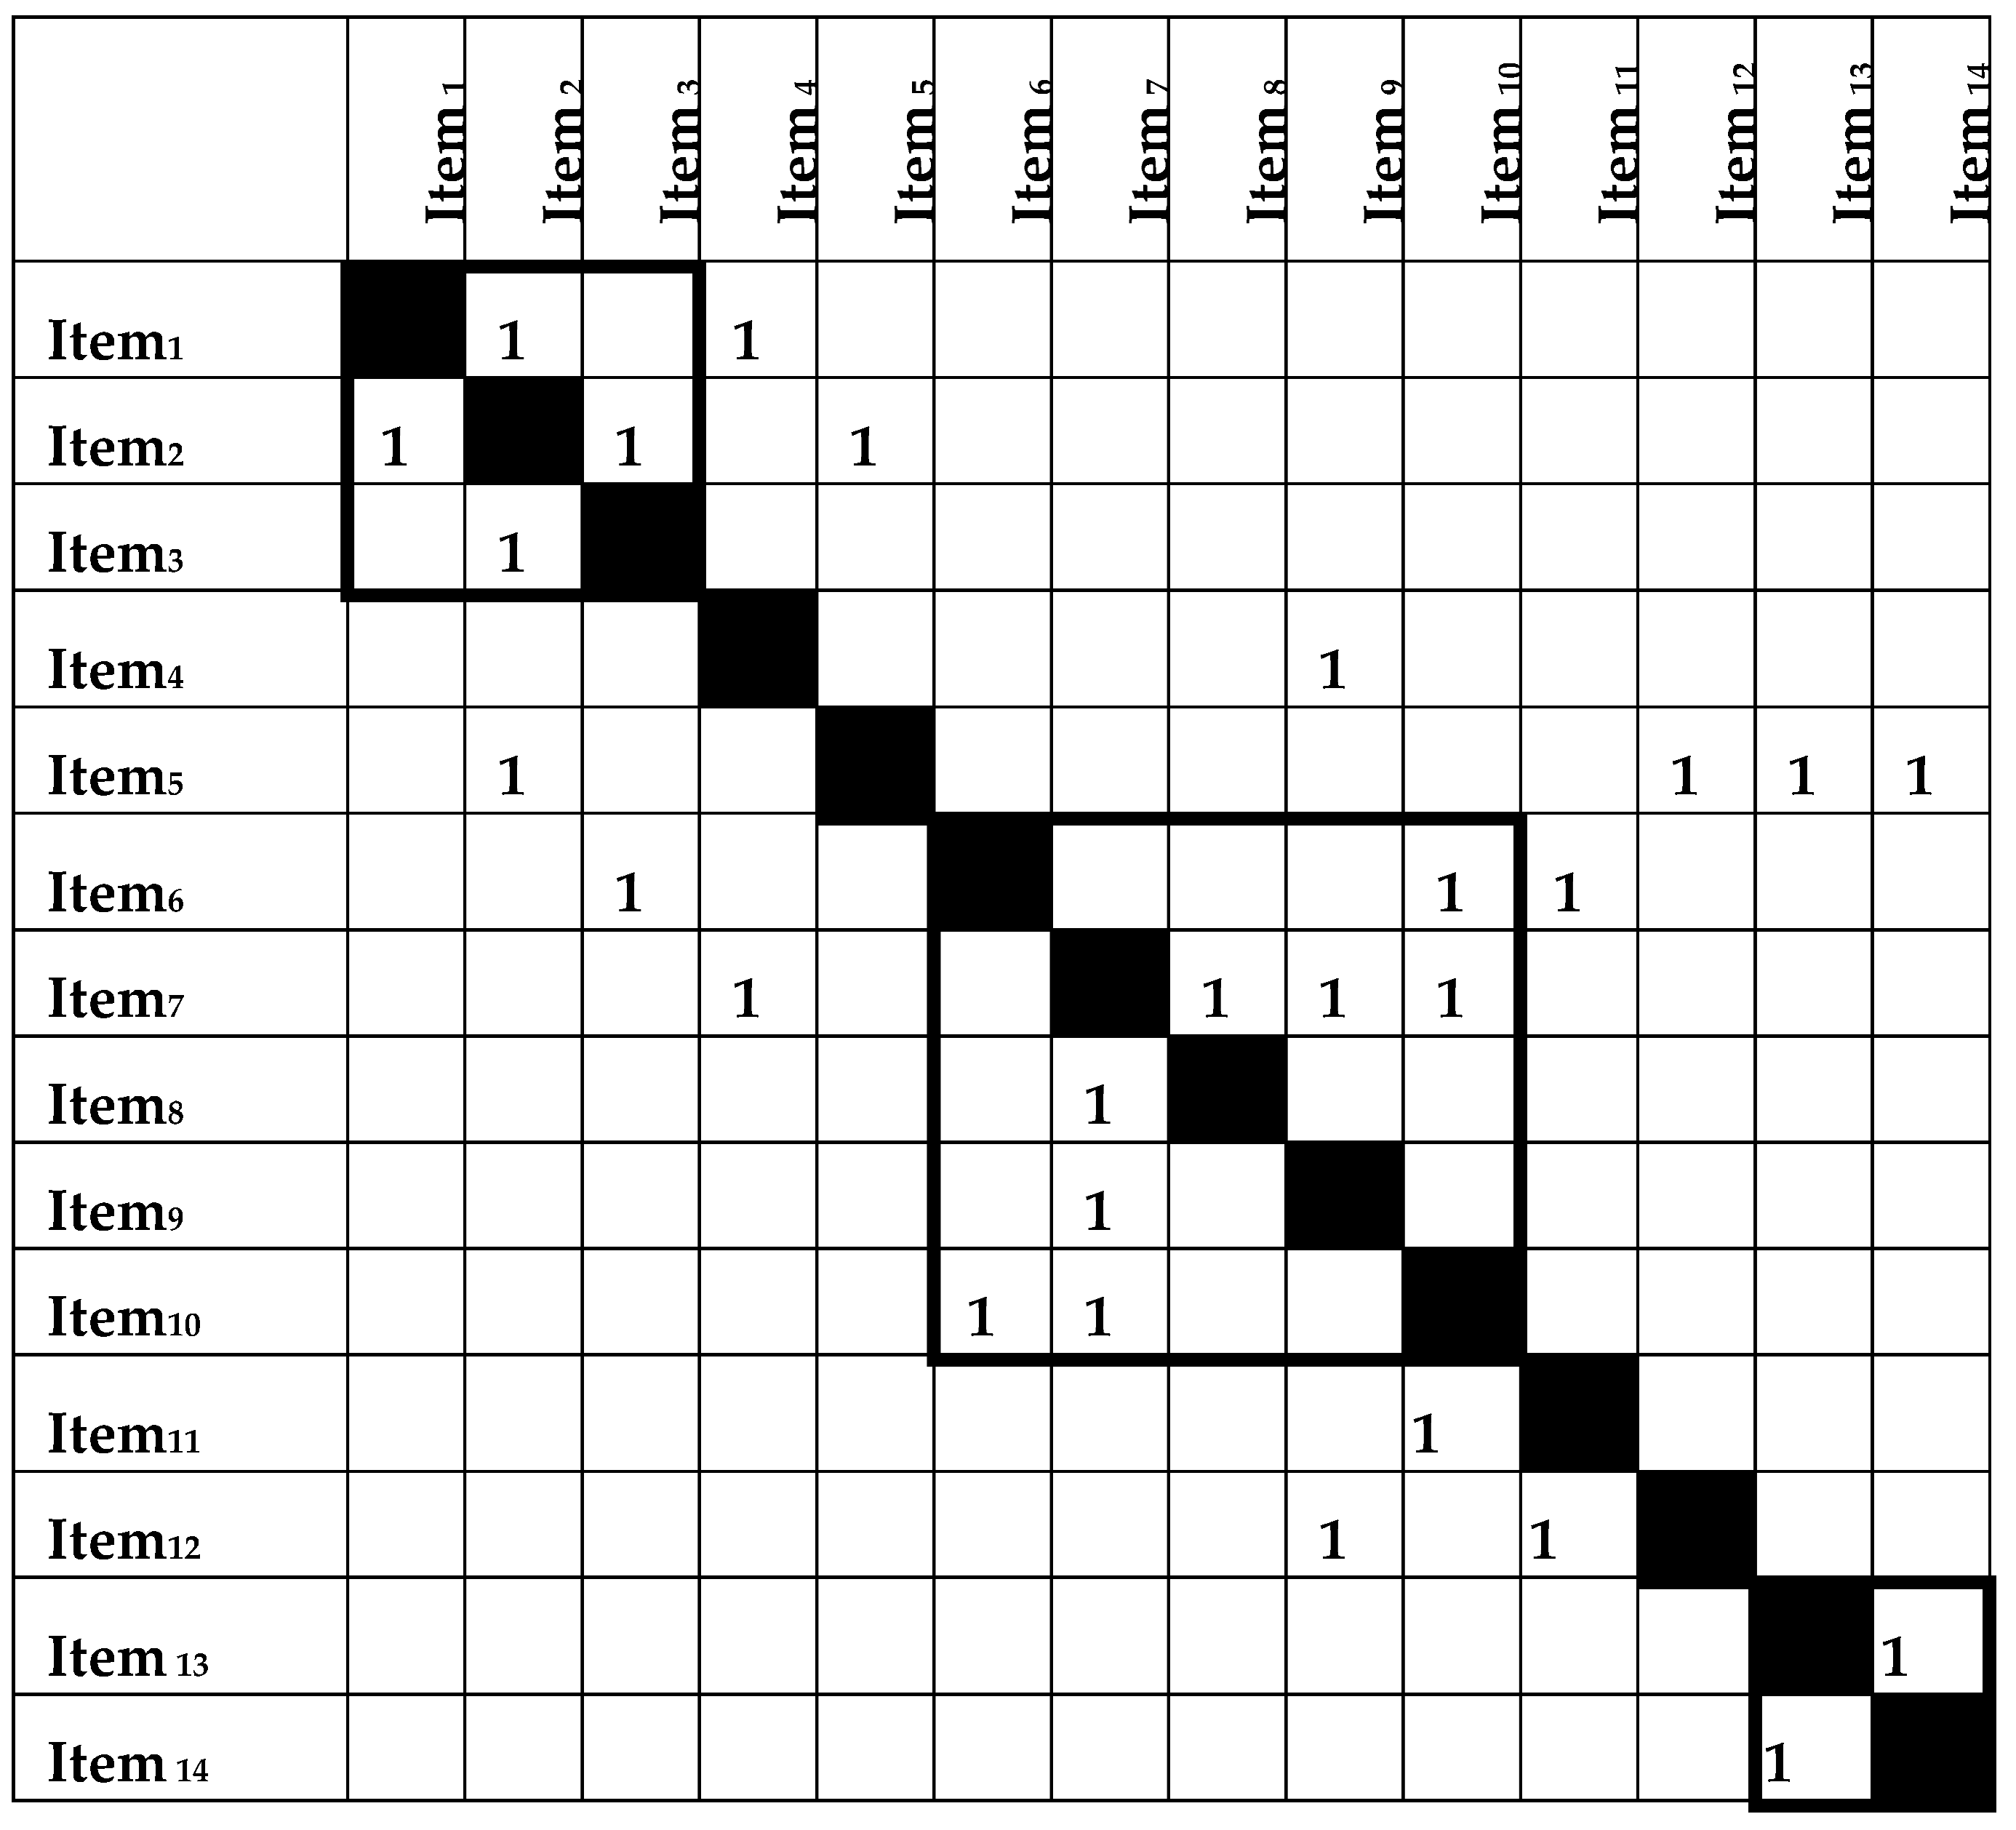
A Design Structure Matrix (DSM) stands as a potent method for illustrating intricate interdependencies among components within a system. Serving as a versatile and straightforward modelling tool, the DSM aids in the design, depiction, and management of systems. The DSM encapsulates a system's architecture by denoting interactions and dependencies among its elements. Forming a binary square matrix with m columns and rows, along with n non-zero elements, where m symbolizes the nodes and n signifies the directed connections linking them, the DSM captures the intrinsic structure. Within a set of m elements within a system, the corresponding DSM takes shape as an m×m matrix, wherein the system elements occupy row and column headings, following the same order. Precedence relationships manifest in the matrix's off-diagonal entries. In a binary DSM, the value of entry ij (column i, row j) is one (or marked by "X" or "●") when element j depends on element i (i.e., i feeds j), while otherwise, it remains zero (or left vacant). Sequentially aligning the elements as they appear in the DSM, marks below the diagonal denote forward information from element i to j, and those above the diagonal embody feedback information from element j to i.
Central to DSM analysis is the aspiration to minimize feedback loops, achieved by orchestrating the sequencing of processes/elements, thereby facilitating a lower-triangular DSM formation. The marks above the diagonal signify feedback couplings, contrasting with the sub-diagonal marks denoting feed-forward couplings. The above-diagonal markings connote iterative interactions, which should ideally be reduced as much as feasible. However, when feedback marks cannot be eliminated, the implicated elements can be categorized into iterative sub-cycles. In Exhibit 4, for example, items (1, 2, 3) and items (6, 7, 8, 9, 10) fall into two such iterative sub-cycles.
Typically, the realization of this objective necessitates a two-step approach: partitioning and tearing (Eppinger and Browning, 2012; Huang et al., 2015), holds promise for achieving optimal results.
Exhibit 4.
Design Structure Matrix (DSM) illustrating the interconnections among elements within the system.
Exhibit 4.
Design Structure Matrix (DSM) illustrating the interconnections among elements within the system.
 |
3.4. Modularity in System Architecture
Definition
The literature review underscores the wide array of definitions associated with the term 'Modularity' (Gershenson et al., 2003; Lameche et al., 2017). Generally, the definition of modularity emanates from the characterization of the constituent modules within a system. In essence, these definitions can primarily be categorized into two groups: 'Structural' definitions (These pertain to the relationships and interactions among the system components (Browning, 2001)). 'Architectural' definitions (These address the connections between system components and the functions established at a specific abstraction level within the functional domain (Stone et al., 2000), or through the relationships between models of physical and/or logical representations of systems (Faulconbridge and Ryan, 2014; Kruchten, 1995)). Regarding the notion of modularization within each of these classes, a comprehensive elucidation has been provided by Efatmaneshnik et al. (2018). In general, the process of modularization aims to maximize the dependency within modules while minimizing relations or interactions between modules (Baldwin and Clark, 2003; Gershenson et al., 2003).
3.5. Measures of Modularity for an Individual Architecture (Functional/Physical / Process Architecture)
Various modularity indices assess system architecture. Jung and Simpson (2017), Bonvoisin et al. (2016) reviewed many. Tools like modularity matrix (Dahmus et al., 2001), heuristics (Stone et al., 2000), DSM (Steward, 1981), axiomatic design (Suh, 2001), etc., identify modules. This study chooses DSM for module identification, considering its benefits.
To gauge modularity using the Design Structure Matrix (DSM) methodology, the literature offers a range of metrics (Yu, Yassine, and Goldberg, 2007; Hölttä-Otto and de Weck, 2007; Hölttä-Otto et al., 2012). The research emphasizes studying important interactions between element pairs. Among various modularity measures, focus is on those developed from interactions among the elements. Notably, five key metrics stand out: 'Grouping Capability Index (GCI)', 'Grouping Efficacy', 'Grouping Efficiency', 'Utilization Rate (U)', and 'Modularization Function' (Mikkola, 2006; Mikkola and Gassmann, 2003), which have been frequently utilized (Gupta, 2019; Al-Bashir et al., 2016).
Before proceeding to the measures, establishing notation is beneficial. Let N1 be the count of 1s in diagonal blocks, N2 be the count of 0s in diagonal blocks, N3 be the count of 0s in off-diagonal blocks, and N4 be the count of 1s in off-diagonal blocks. Moreover, N1+N2 indicates the total number of elements (0s and 1s) in diagonal blocks, and N3+N4 represents the total number of elements (0s and 1s) in off-diagonal blocks. The following section provides a detailed outline of the measures.
- Grouping capability index
The Grouping Capability Index (GCI) signifies the capacity of a collection of interdependent entities to establish a module (Equation (4)).
- 2.
- Grouping efficacy
Grouping efficacy, denoted as τ, quantifies the ability of a module or group to perform a task. It is contingent on the successful clustering of elements within a group. (Equation (5)).
- 3.
- Grouping efficiency
Grouping efficiency, represented as η, serves as a measure of the fit quality for a modular solution within a module. A higher η value indicates a more suitable modular arrangement. η (Equation (6)) symbolizes the relative capacity of components to form a module or group, as well as the compactness of a module.
and are expressed by Equations (7) and (8), respectively.
Where, q is a weighting factor (0<q<1);
- 4.
- Utilization rate
Utilization rate, denoted as U, indicates the extent to which components within a given system are dedicated to forming modules and how effectively they contribute to building modular systems (Equation (9)).
- 5.
- Modularization Function
The Modularization Function, denoted as M(u), was initially developed by Mikkola and Gassmann (2003), and subsequently refined by Mikkola (2006).
Where ‘u’ signifies the count of distinctive elements/components encompassed within an architecture; "N" denotes the total number of standard and unique components, calculated as N = nSTD + u; 𝛿 represents the average intensity of coupling among elements/components and modules; "s" indicates the substitutability factor of unique elements/components within other systems. Additionally, there exists a relationship between 𝛿 (coupling intensity) and "k" (number of interfaces in a module), expressed as 𝛿∼ (𝑘/𝑛), where "n" represents the count of components in a module.
3.6. Measure of Modularity between Two Adjacent Domains
It is possible to determine a quantitative measure of independence for a given design matrix. Suh (2001) proposes two metrics of independence: reangularity, R, and semangularity, S. Reangularity evaluates the orthogonality between DPs and serves as a measure of interdependence.
The angle between the DP axes is denoted by θ (Equation 11). To provide additional clarity on the concept of reangularity, let us examine a two-dimensional case.
where represents the entry (i, j) of the DM and relates DPj to FRi (i, j = 1, 2). Equation (12) can be rewritten as
where
From linear algebra,
For the nth dimensional case, reangularity is
The metric S quantifies the angular relationship between the axes of DPs and FRs, evaluating the correlation between a given FR and any pair of DPs. In terms of coupling, S represents the magnitude of the diagonal elements in a normalized DM. In the case of an nth-dimensional scenario,
Both R and S have a maximum value of 1, corresponding to an uncoupled (ideal) design. As the degree of coupling increases, both reangularity and semangularity decrease. In particular, when R or S is equal to 0, the design is considered fully coupled.
3.7. Metrics for System Robustness
System robustness reflects the degree of system coupling. According to the mathematical equations for R and S, it is clear that, as both R and S belong to the interval [0,1], the larger R and S are, the greater R*S is. Concerning the information content of a system, I, the smaller the information content is, the smaller is the variability of the system where (R*S)/I becomes larger and can be employed to quantify the robustness of a system (Gao and He, 2015).
3.8. Robustness Analysis Method
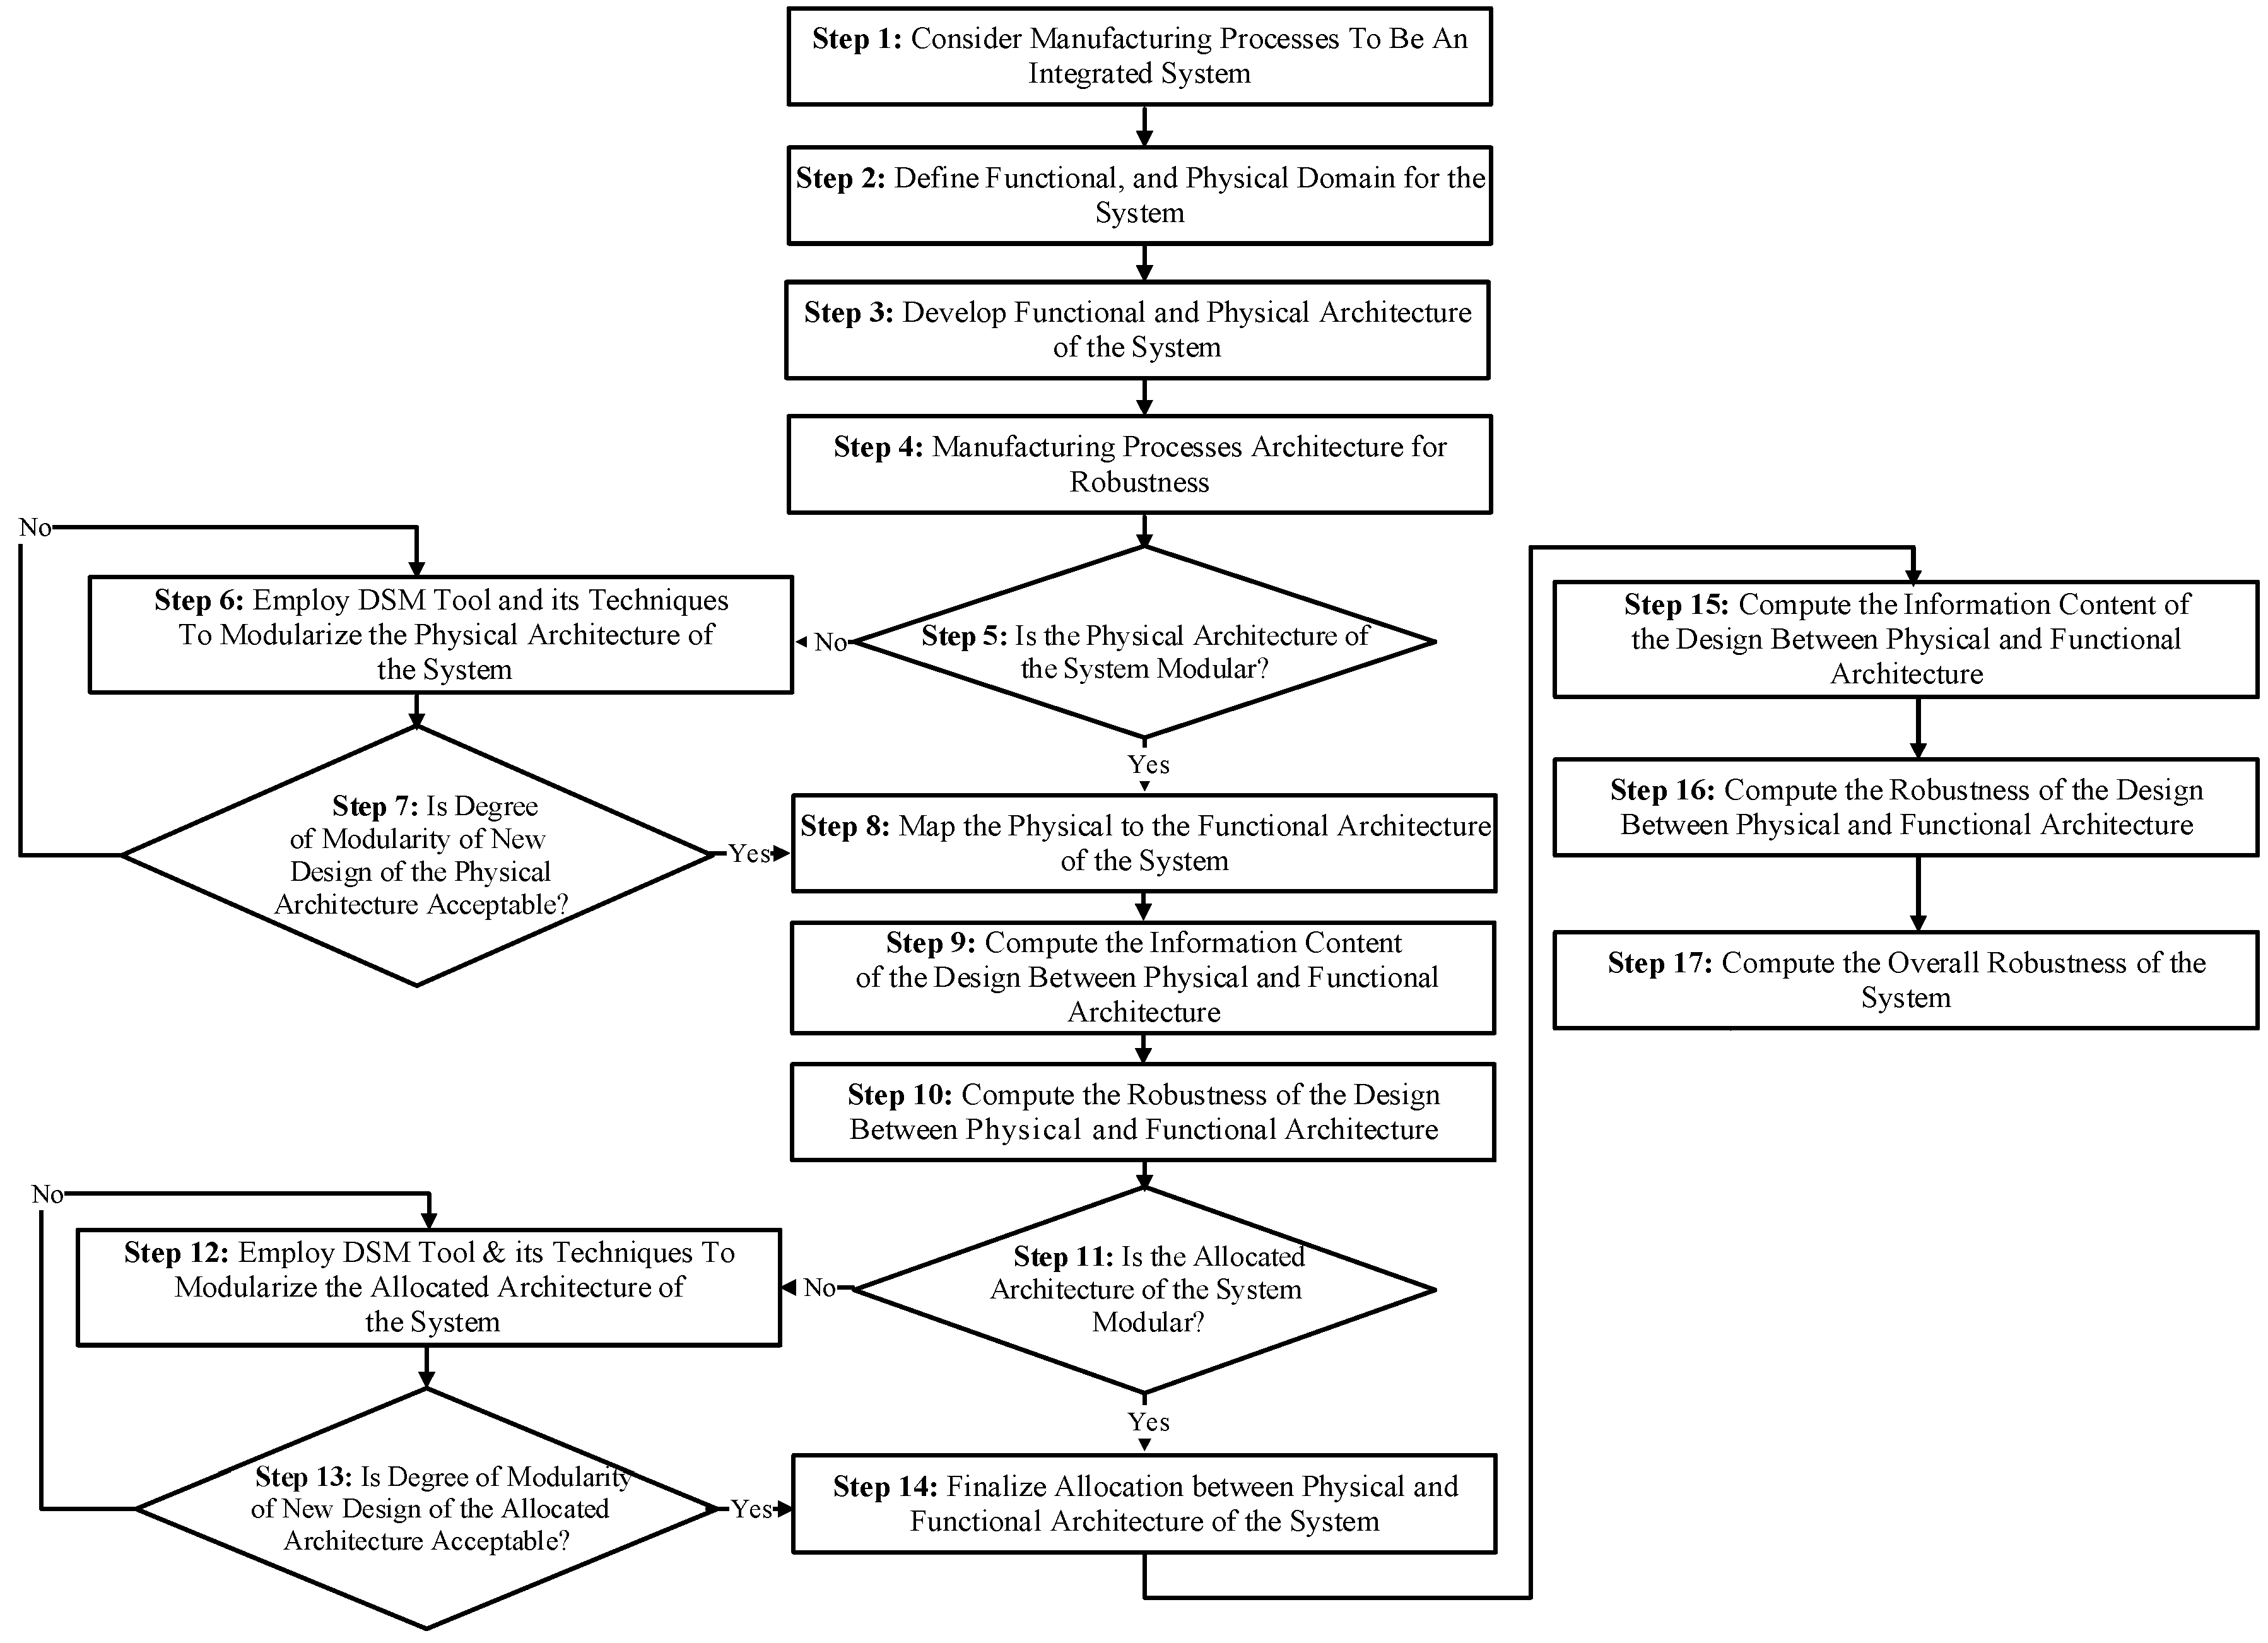
The robustness analysis method looks at the relationship among contract clauses and evaluates alternative sequences. Managers can then choose the best organization of clauses to improve modularization and overall contract robustness. The steps of the method are described below and presented schematically in Exhibit 5:
- Steps 1 Consider manufacturing processes as an integrated system
- Step 2, 3 Develop functional and physical architecture of the system
- Step 4 Design manufacturing processes architecture for robustness
- Steps 5, 6, 7 use DSM to modularize the physical architecture of the system
- Step 8 Map the physical to the functional architecture of the system
- Step 9, 10 Calculate system architecture's information content and robustness
- Steps 11, 12, 13 use AD theory to modularize the mapping between the new physical architecture and the functional architecture
- Step 14, 15 Recompute system architecture's information content and robustness
- Step 16 compute the overall robustness of the system.
Exhibit 5.
Methodology for the Robust Analysis Method.
3.9. Contribution of the Study: Modularity and Robustness
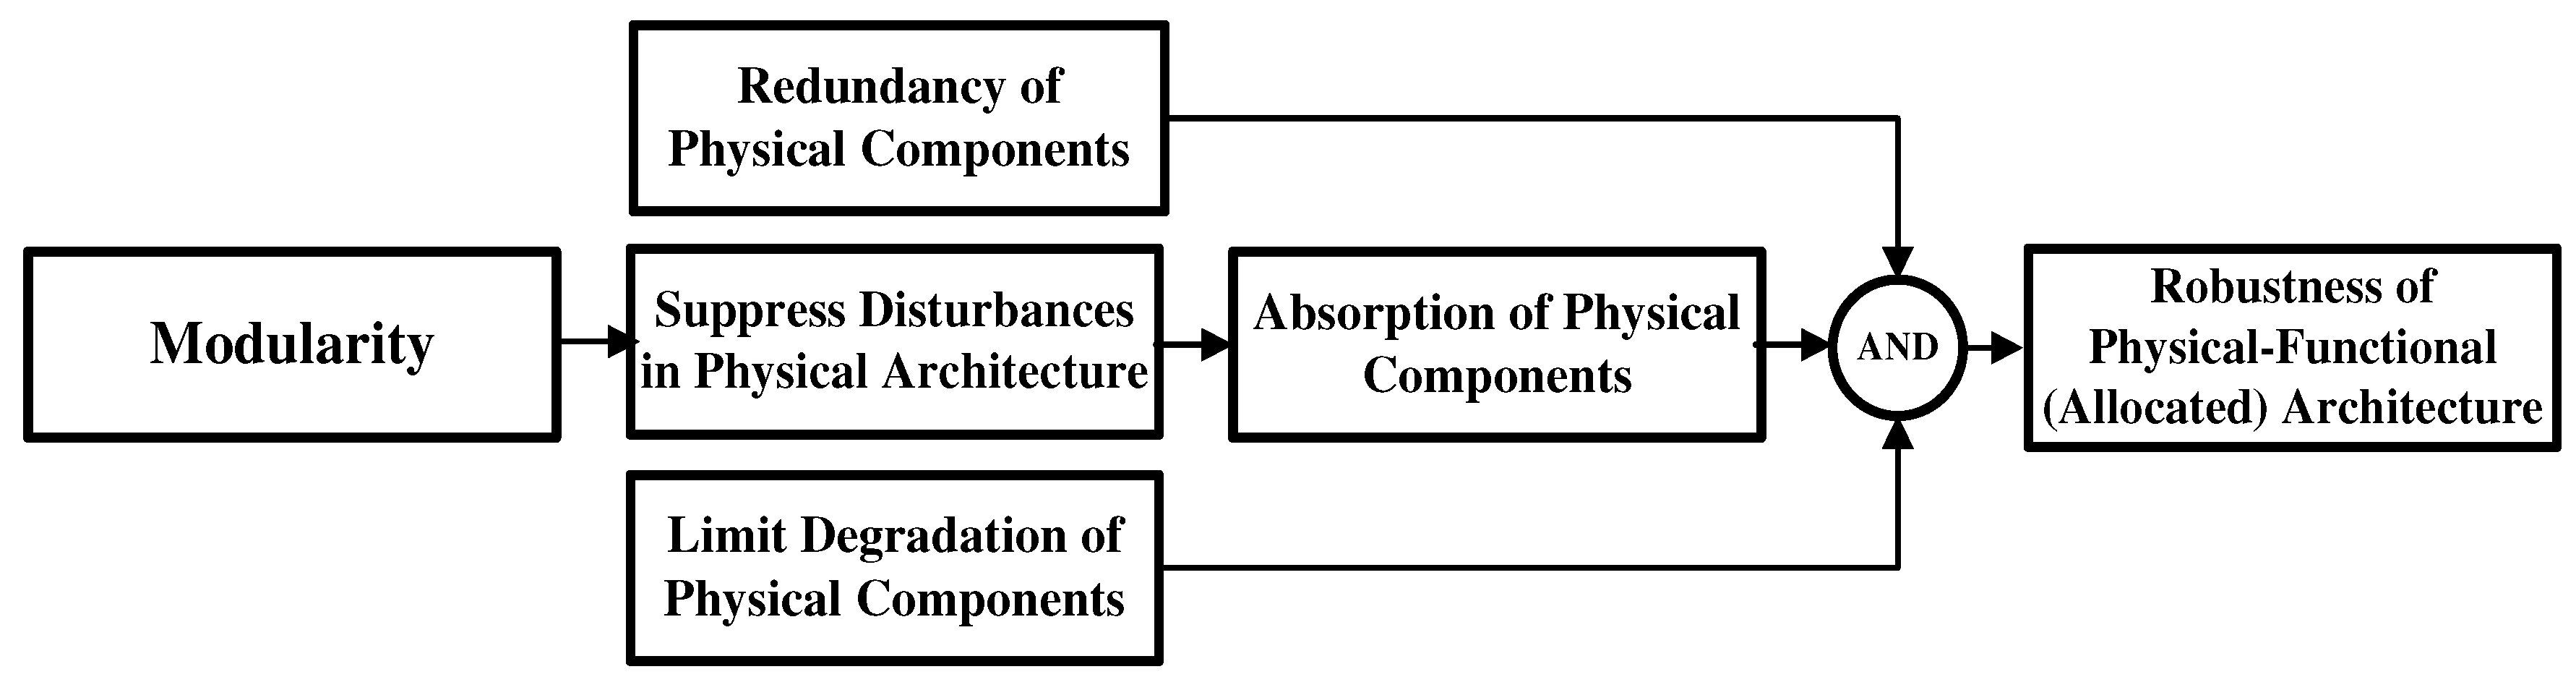
Once robustness is analysed, mapping between a contract’s functional and physical architectures needs to be done, and determination of how well the physical elements satisfy the functional elements needs to be evaluated. A literature review of design robustness has indicated that both physical component redundancy and limiting the degradation of physical components have been mentioned by several authors (Jackson and Ferris, 2013; Jackson et al., 2015). In the present study, the focus is on avoiding propagation of failure/disruption/ disturbance, i.e., suppression of disturbances and redundancy in some of physical component in the physical architecture. To avoid propagation failures in a contract, the functional and physical components should not be coupled and the physical components should be independent. Robustness is achieved by having a significant level of modularity that avoids propagation of noise from an affected/impaired module or clause to other modules. Following is a mathematical investigation that demonstrates that modularity suppresses disturbances in the physical architecture as shown in Exhibit 6, where better modularity leads to better contact clauses, and ultimately, greater project success. The mathematical analysis underpins the use of AD Theory and DSM in the robustness analysis method.
Exhibit 6.
Modularity and Robustness.
3.10. Modularity and System Variance
System robustness can be improved by minimizing variance. In a multi-FR design, the prerequisite for minimizing variance is the satisfaction of the independence axiom. To mathematically consider the relationship for coupling, i.e., the absence of modularity and system variance, consider an n dimensional case
where (i=1, 2, …, n) represents the ith module in FRs domain,
(i=1, 2, …, n) represents the ith module in DPs domain,
represents a DM which associates DP-based modules with FR-based modules, and
(i=1, 2, .., n and j=1, 2, .., n) are DM submatrices that have one or more dimensions where (j=1, 2, .., n) is allocated to the (i=1, 2, …, n).
In addition, represents the transposition of the matrix.
is expressed as
where represents the domain of FR-based modules (the functional domain), and represents the domain of DP-based modules (the physical domain).
The random variability of , i.e., can be expressed as
where represents random variability of . It is clear that and are
where represents the random variability in (i=1, 2, …, m), and represents the random variability in (j=1, 2, …, m).
The transposition of equation (20) is
Therefore, the variance of the is
where E expresses the mathematical expectation. Hence, the variance of , , is
where represents the variance-covariance matrix for .
Assume that the DP-based modules, , are statistically independent of each other.
Hence,
where represents the variance or variance-covariance matrix of module and (i=1, 2, …, m) when the module is one dimensional or multi-dimensional. Then,
Hence,
Moreover, the system variance,
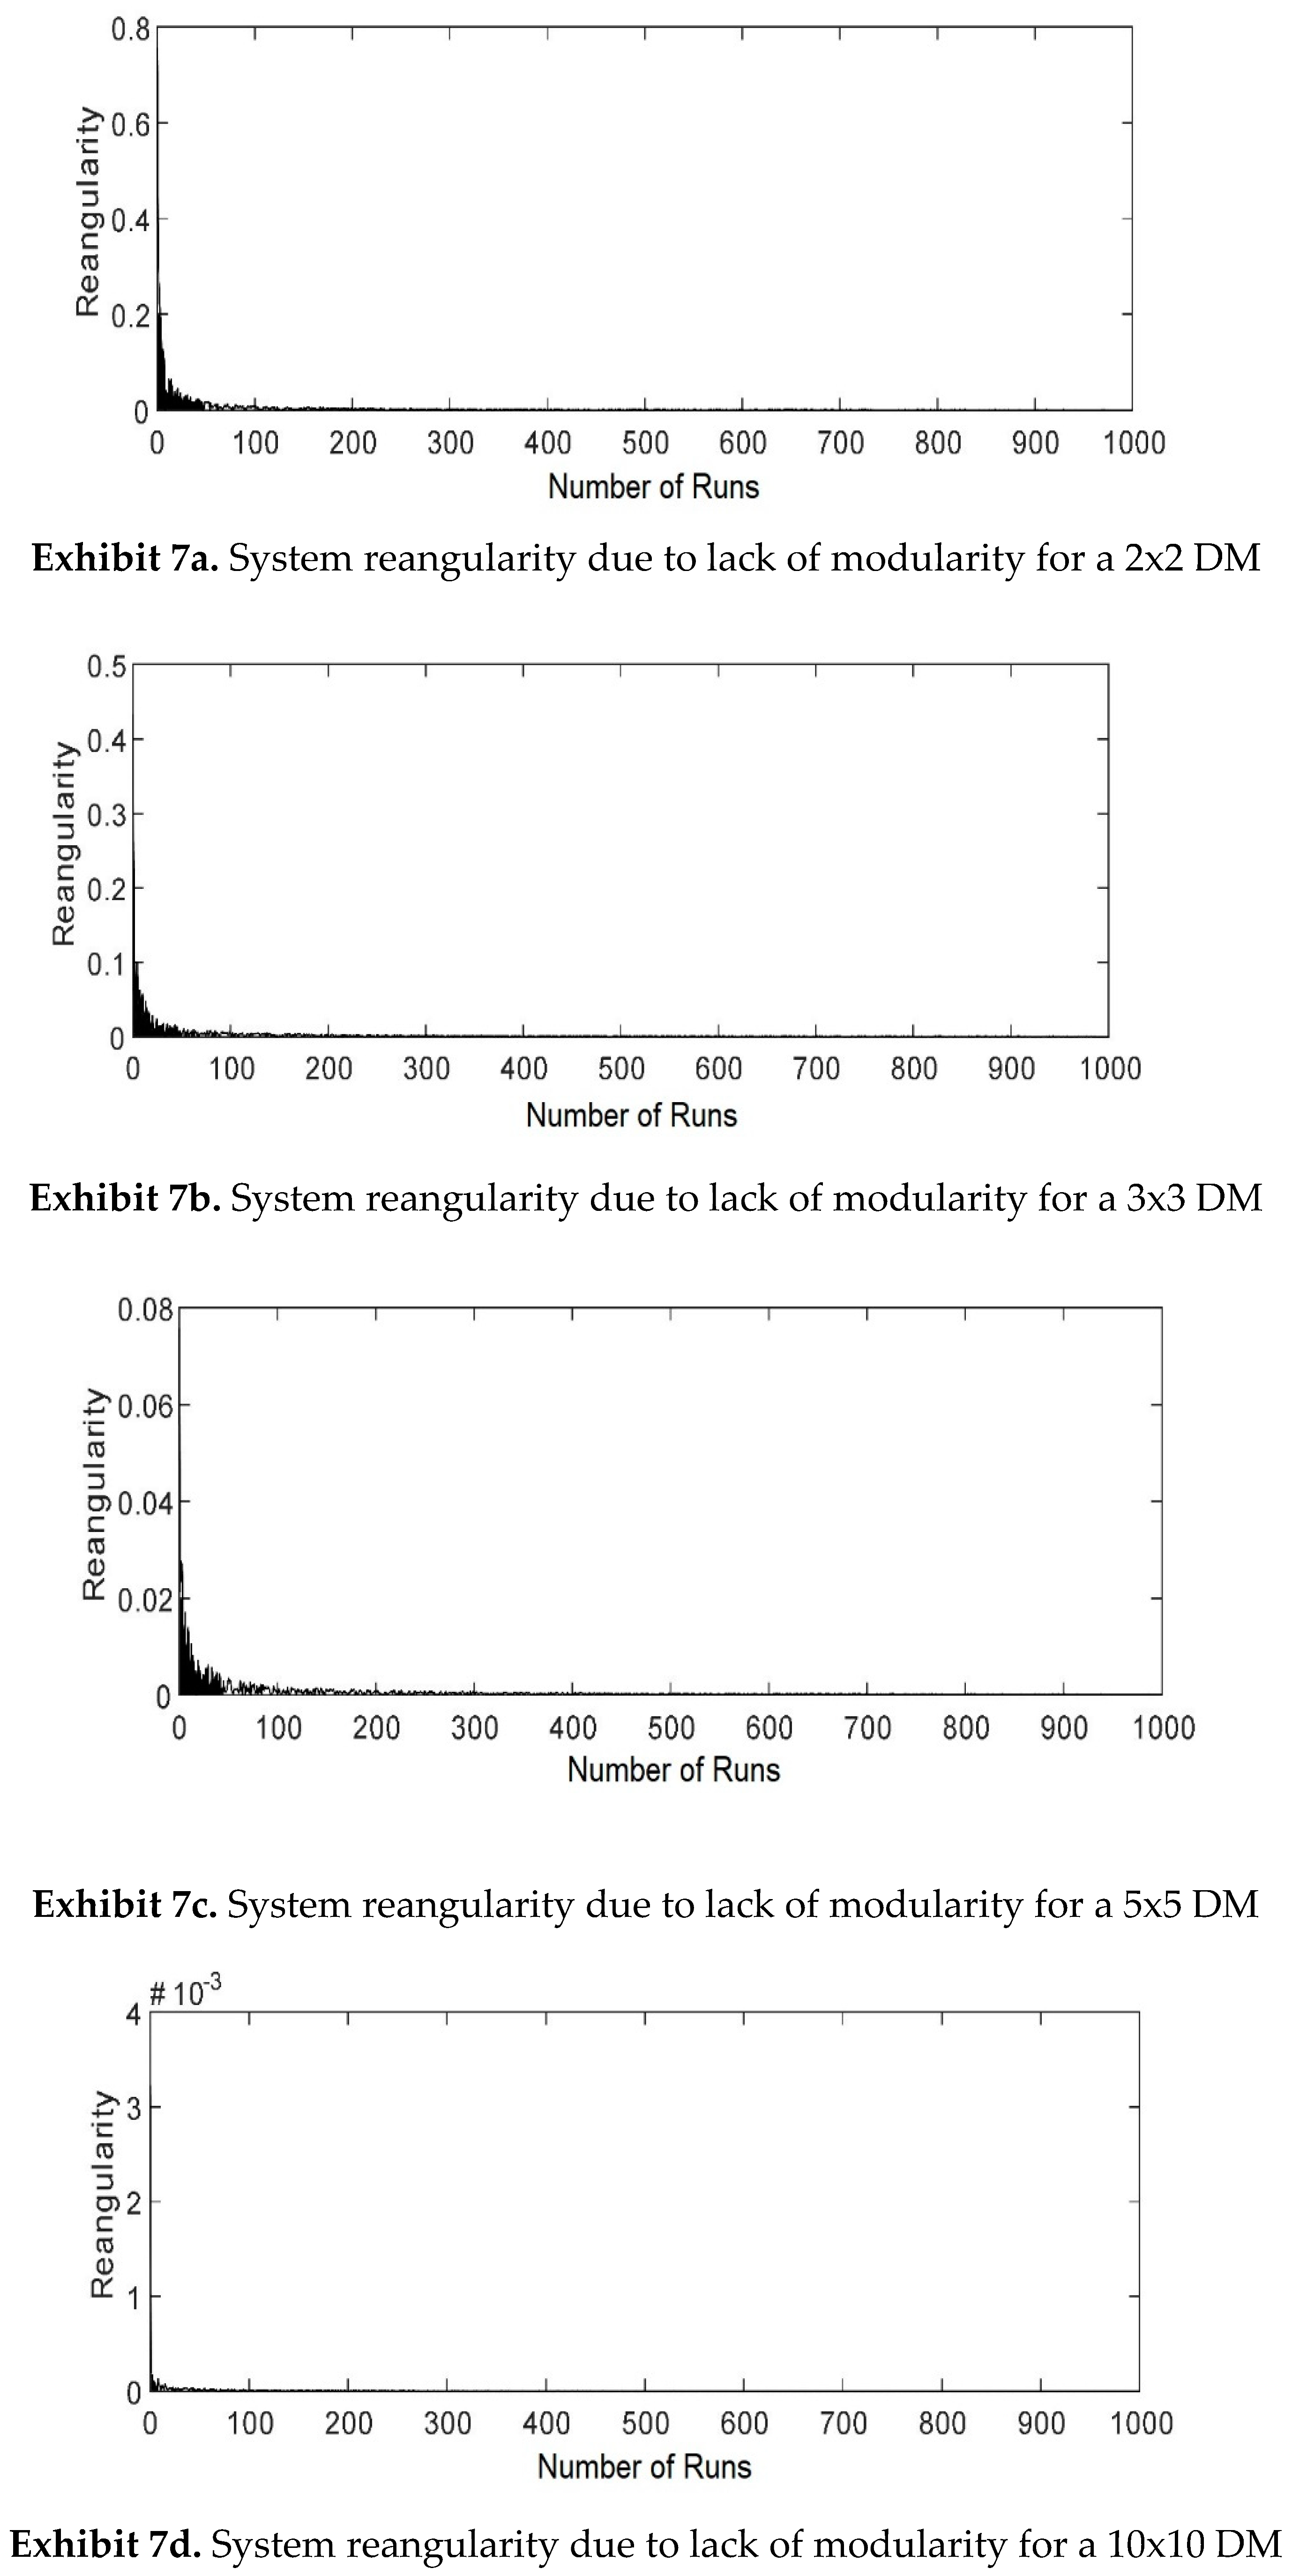
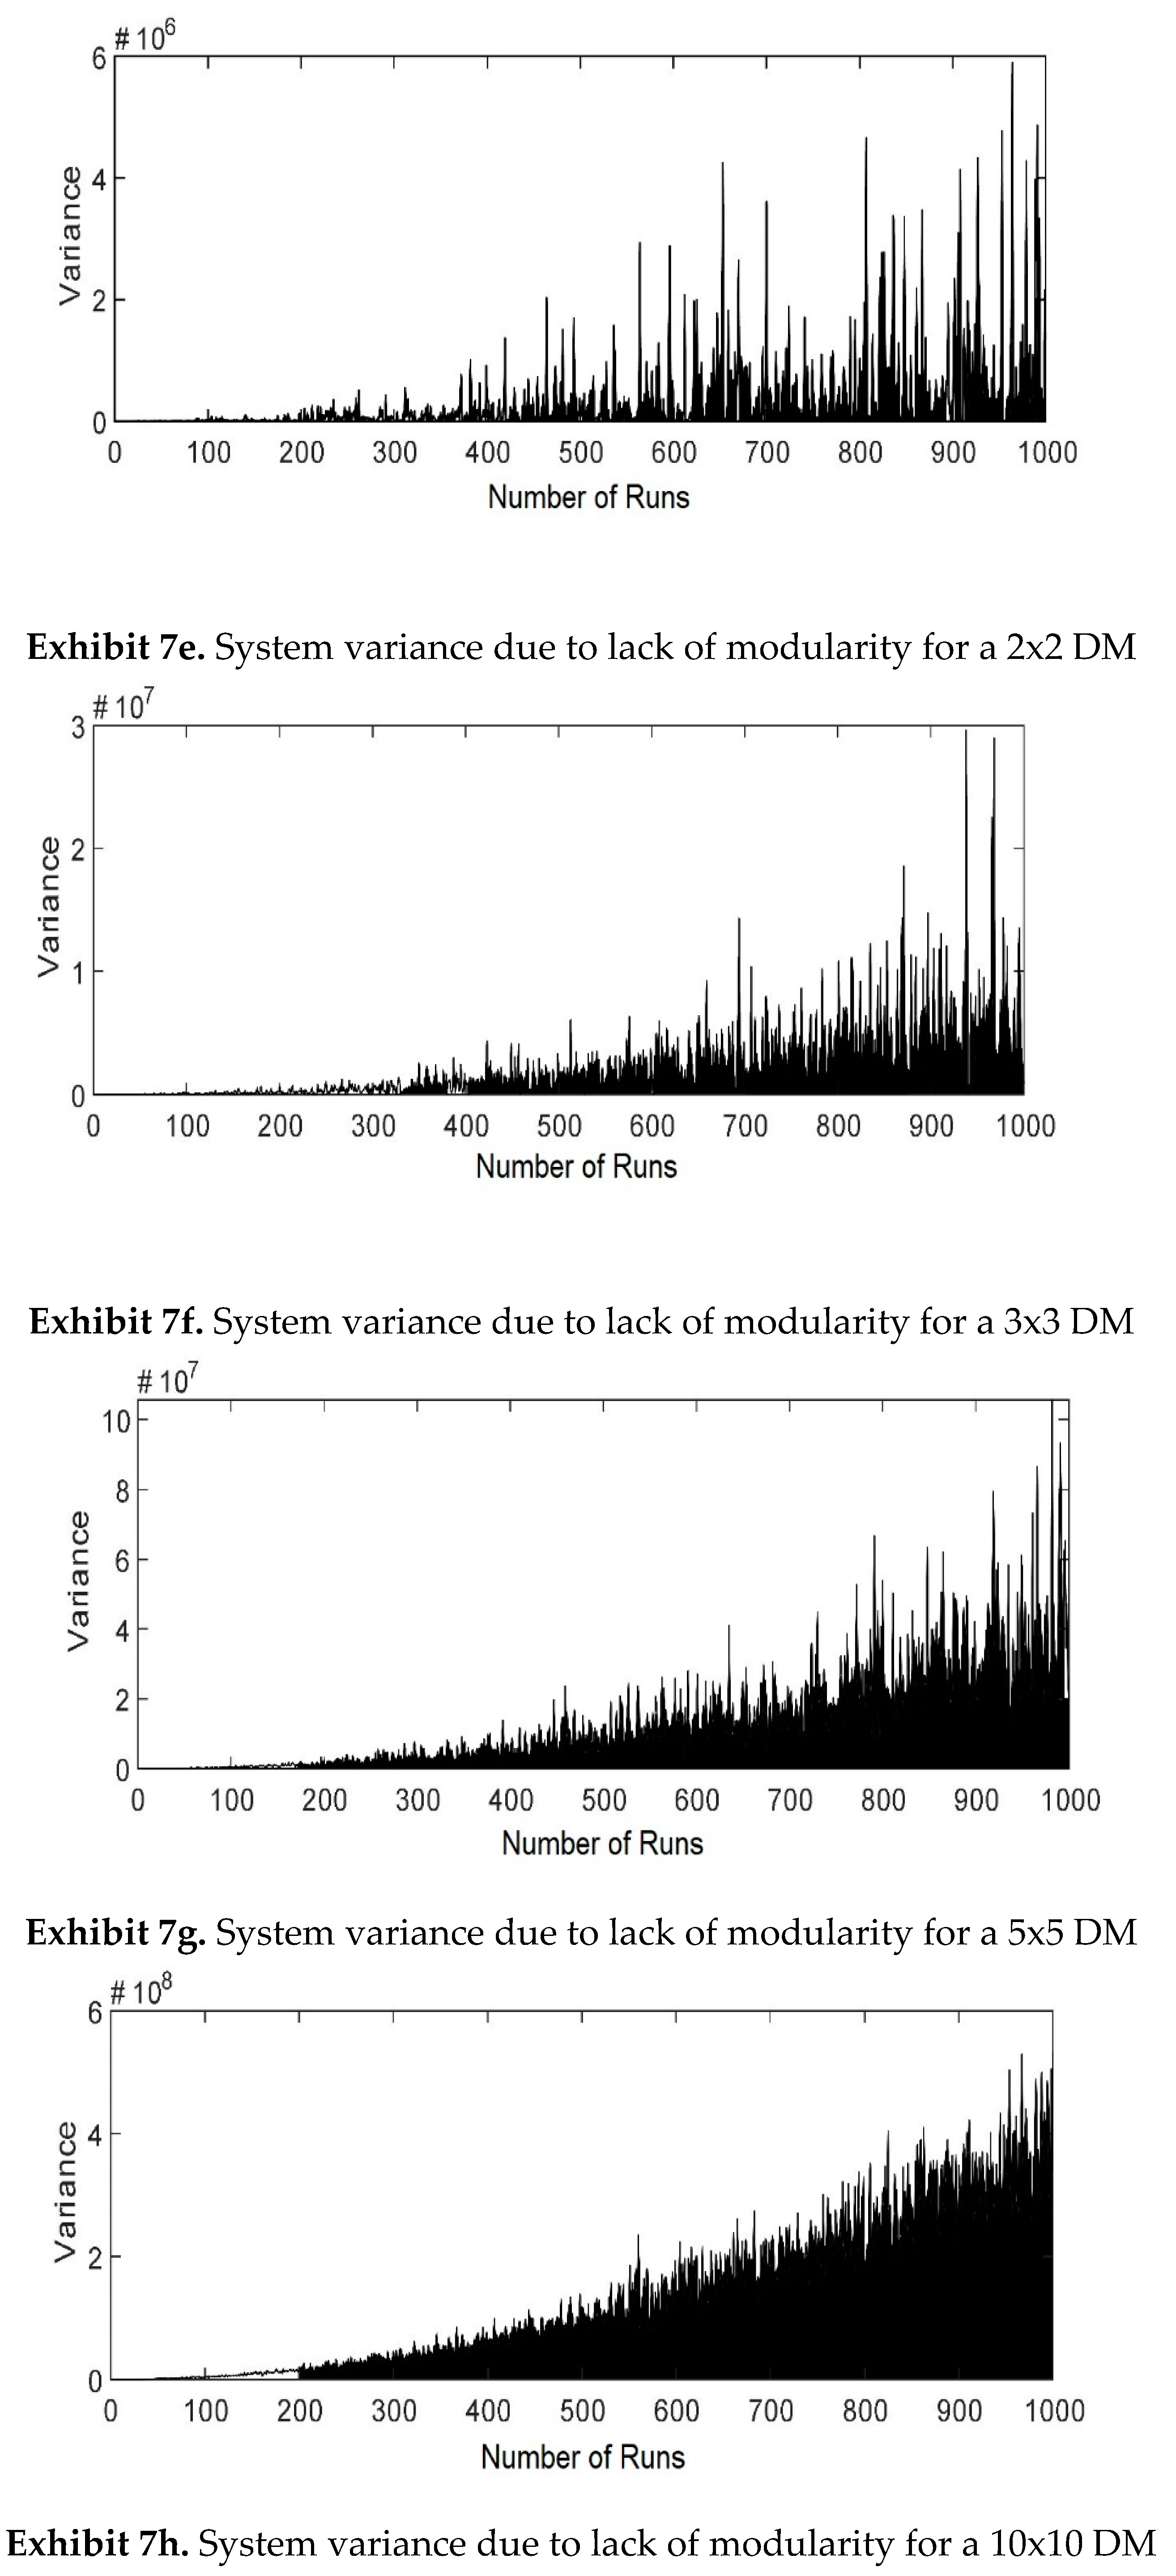
The larger the off-diagonal entries become, the higher is the system variance, i.e., a higher system variance indicates a more coupled system design. The development of a simple, well-defined equation to clarify the relationship between reangularity/semangularity and the lack of modularity may not be easy. However, the behavior of semangularity and reangularity with respect to the magnitude of off-diagonal entries of the DM are relatively similar. To demonstrate the degree of coupling, i.e., the lack of system modularity, for DMs with higher dimensions, computer simulation was used for four square DMs with sizes of 2×2, 3×3, 5×5, and 10×10 that were randomly generated 1000 times. The magnitude of the off-diagonal elements was gradually increased as the number of runs increased, which showed the effect of coupling on semangularity/reangularity and system variance. Exhibits 7a-d show reangularity versus lack of modularity where reangularity becomes smaller as the size of off-diagonal elements increases. Exhibits 7e-h show system variance versus lack of modularity where system variance becomes larger as the size of off-diagonal elements increases. This underlines the need to reduce the coupling among contract clauses as done in the robustness analysis method.
3.11. Modularization of the Allocated Architecture (Mapping between Two Adjacent Domains)
The allocated architecture of a contract refers to the organization of physical elements that yields a design solution which satisfies the functional requirements of a contract. Therefore, modularity of the allocated architecture is essential to achieving a robust contract. Sometimes, due to possible disruptions in project conditions, redundant clauses are used to increase a contract’s reliability to have a better chance of project success. When creating modules, then, it is important to determine whether there is any clause or module that is redundant since the use of redundant elements may result in a loss of contract modularity.
Concerning the improvement of contract reliability, the present study adopts the notion of redundancy from AD theory where in redundant designs there are more DPs than FRs to satisfy the FRs (Suh, 2001; Park, 2007; Heo and Lee, 2007; Gonçalves-Coelho et al., 2012). For instance, a contract objective may be described by a few clauses in such a way that if the most appropriate clause is not able to satisfy the objective, other associated clauses, as redundant elements, can be used to meet the objective. Nevertheless, contract modularity must be ensured. The following two subsections provide more detail about the modularization of the allocated architecture in the absence and presence of redundant physical modules.
3.12. Modularization of the Allocated Architecture in the Absence of Redundant Physical Modules
To map between DP-based and FR-based domains, consider a multi-FR design
where represents the ith module in the functional domain (i=1, 2, .., n), and represents the ith module in the physical domain (i=1, 2, .., n).
Note that or can be a module which can encompass only one element or several fully/partially coupled elements. Using equation (34), the derivative of , i.e.,
Or
where, represents the derivation of . If or is a module of only one element, equation (36) can be utilized straightforwardly. However, when or is a vector which includes several fully/partially coupled elements, equation (36) needs to be expressed as the following. Let and (i=1, 2, …, n) be a vector that includes a specific subset of FRs and DPs, respectively. Then,
And
It is assumed that FRs are independent of each other whereas the associated DPs are partially/fully coupled to each other. Therefore, can be expressed as
where represents the jth module in the physical domain with k1 DP elements,
represents the pth member of jth module (p=1, 2, …, k1),
represents the qth member of the jth module (q=1, 2, …, k1), and
represents the entry (p,q) in matrix X and signifies the degree of dependency between and (p=1, 2, …, k1 ; q=1, 2, …, k1).
Matrix X in which all diagonal elements are zero is employed to express that every element of is coupled with the remaining elements. Then,
In addition, assume that A is the design matrix ( which allocates DPs into FRs that belong to the module . Therefore,
Incorporating equation (40) into equation (41)
Let
Then, equation (43) is
Using equation (44), the derivative of , i.e., (i=1, 2, …, n), is
Where
In order to compute , consider . Now, is
Therefore,
And,
Hence,
And
Or
where (.
must be within the required tolerance; thus,
where is the desired change in due to a change in , and is the required tolerance.
In an uncoupled design, must be equal to . The deviation from this ideal condition, , is given by or where or is a module of only one element (case I) or a vector (case II) that includes several fully/partially coupled elements. For an uncoupled system, the required tolerance, must be ≥ or ≥ in case I or II.
For case I,
and for case II,
Specifically, for case I, consider , then,
Or,
Using equation (54)
Specifically, for case II, consider , then,
Or,
Therefore,
Equation (61) provides a criterion for determining when the off-diagonal elements of a basic matrix can be disregarded.
3.13. Independence and Tolerance Theorem
An independence and tolerance theorem can be formulated as follows: In case I, a design is considered uncoupled when the specified tolerance, , exceeds...
Therefore, the non-diagonal elements of the design matrix can be disregarded. If the (k= 1, 2, ..., n), which represents the stiffnesses relating changes of to the changes of , are constant, then...
If , then, the design is uncoupled.
3.14. B. Modularization of the Allocated Architecture in Presence of Redundant Physical Modules
In this case, there are more than , resulting in random variability (or noise) introduced by the excess that can affect the variability of . It's crucial for the variability to remain within the design range to ensure proper functionality. Therefore,
The random variability in is denoted as , and the variability of is represented by In an ideal one- design, only a single is necessary, as any additional introduce the possibility of random variability. The first term on the right-hand side (RHS) of equation (65) accounts for the compensation effect of the primary , which is selected to vary , while the second term represents the cumulative random variability or noise introduced by any extra . To ensure proper functionality, it's crucial to adjust the error term in two possible ways to achieve .
- Setting the coefficient () that corresponds to any additional to zero involves eliminating all random variability from every , which is not practical given the variability that arises during manufacturing and assembly.
- To address the issue of random variability in , it's necessary to set all values of except for the chosen to be fixed during operations, allowing that specific to vary . This step is equivalent to setting the second term on the RHS of equation (65) as a constant. Once this adjustment is made, the next step involves adjusting to compensate for any accumulated errors by setting the first and second terms on the RHS equal to one another. Then,
This approach eliminates the random fluctuations that may arise from additional units used during operations, while ensuring that the tolerance range specified in the design is met for . The primary unit must be capable of compensating for any random variations resulting from the use of extra units.
3.15. B. 2. Multi- Design
In a multi- design where the number of units exceeds that of units, the design becomes redundant and each unit may be affected by multiple units. Consequently,
Let's consider the following scenario: {} represents the selected to fulfill the vector {}, with the number of in {} being equal to the number of in {}. The vector {}Extra, which appears as the second term on the right-hand side of equation (67), contains redundant that remain after {} satisfies {}, but these extra may not be explicitly known. The square matrix [Square DM] represents the relationship between {} and {}, while [Extra Matrix] describes how the extra affect the . To ensure compliance with the independence axiom, [Square DM] should be either diagonal or triangular. On the other hand, [Extra Matrix] can take any form, including a full matrix, and still satisfy the independence axiom as long as [Square DM] is diagonal or triangular. Specifically, let's look at a special case of equation (67) where we are dealing with a multi- design consisting of k and numerous .
where represents the ith (i=1, 2, …, k) module in the functional domain,
represents the jth (j=1, 2, …, n) module in the physical domain,
represents the pth member of jth module in the physical domain for (p=1, 2, …, k1), and represents the sub-design matrix within DM and relates DPs of to the associated FRs of to satisfy them.
The first term on the right-hand side (RHS) of Equation (68) represents an uncoupled design, while the second term depicts a fully coupled design. However, even with the presence of the second term, this design can still be treated as an uncoupled design if we establish a fixed value for through . We can then use , ,… and to ensure the independence of , , … and . In such cases, the design range of would be:
and
When the diagonal design matrix of the first term on the right-hand side (RHS) of Equation (68) is substituted with a triangular matrix in Equation (71), the resultant design can be treated as a decoupled design
Random variability in through can be counteracted by using fixed values for , , …, and , provided that any extra terms are fixed first and remain the same across all locations where they are used. In this manner, the design range may be achieved using (j=1, 2, …, k), which is:
is the primary controller for . are secondary controllers chosen to satisfy , with a secondary effect on due to off-diagonal elements. is not a primary controller and is the source of random variability. (j=1, 2, …, k) should be set first according to the sequence defined by the triangular matrix to control the corresponding (j=1, 2, …, k). The variability caused by the extra terms can be fixed by eliminating (j=k, k+1, …, n) through fixing . Finally, can be controlled using . If Square DM, the first term on the right-hand side of equation (73), is a full matrix, the design is coupled, which violates the independence axiom. In this case, it is not possible to satisfy the independence of each when unknown introduce random variability.
The previous discussion holds significant implications for designing a robust system that satisfies multiple simultaneously. In a multi- design, the selection of , , and must meet the same set of conditions. However, in a decoupled multi- design, we must also satisfy an additional condition for the elements of a triangular design matrix.
If equation (74) is not satisfied, it indicates an unacceptable design resulting from choosing the wrong . For instance, consider a scenario where diagonal elements have a smaller magnitude than off-diagonal elements. This implies that and , selected to control and , respectively, have a greater impact on than has on . In extreme cases, when one of the diagonal elements is significantly smaller than the off-diagonal elements, the design becomes coupled because one can influence more than two . Additionally, if the number of is less than the number of due to one or more diagonal elements being zero, the design becomes coupled due to an insufficient number of
4. Application
This study focuses on verifying the proposed methodology for analysing the robustness of manufacturing processes in the Iranian tire industry, specifically within 'Barez Industrial Group,' an enterprise based in Tehran, Iran, specializing in Tire Manufacturing since its establishment in 1984.
The manufacturing processes under investigation are the 'system of interest' (SOI), and their architecture is analysed in this study. Considering the dynamic nature of manufacturing environments, the study emphasizes the system's ability to cope with rapid changes. The existing architecture is examined from the perspective of robustness, aiming to identify any shortcomings or limitations. If significant weaknesses are detected, the study proposes a new architecture design based on the engineering design methodology presented in this research, ensuring the system's capability for robustness. By addressing the critical point of verifying the proposed methodology and emphasizing the importance of robustness in manufacturing processes, this study contributes valuable insights to the field of tire manufacturing and engineering design practices within 'Barez Industrial Group.'
4.1. Functional Architecture of the SOI
In step 2 of the research method, the functional architecture of the system of interest (SOI) is addressed and its constituent elements are studied. Applying the Axiomatic Design (AD) theory, the elements of the SOI within the functional domain of the system are identified, considering the elements as 'Functional Requirements' and tagging them with FRs. Exhibit 8 presents and describes these FRs of the SOI.
Exhibit 8.
Description of the leaf functional requirements (FRs) of the SOI.
| Code | Description | Code | Description |
|---|---|---|---|
| FR1111 | Organize meetings for the research committee. | FR1139 | Request the required tests and follow up on the test. |
| FR1112 | Make a decision about the annual budget. | FR113,10 | Prepare and archive APQP file documents. |
| FR1113 | Define new projects for the offices. | FR113,11 | Prepare documents and archive SQA documents. |
| FR1114 | Decide on the duration of projects. | FR113,12 | Check and prepare a product requirements chart, and turn it into a technical specification. |
| FR1115 | Complete the project charter. | FR113,13 | Perform the process of improvement and change. |
| FR1121 | Conduct phenomenological studies of the project. | FR1141 | Check test requests. |
| FR1122 | Select the initial formulation. | FR1142 | Coordinate to receive tires from the production line. |
| FR1123 | Produce the experimental mixture. | FR1143 | Plan to take the test. |
| FR1124 | Evaluate the results. | FR1144 | Run the test. |
| FR1125 | Optimize the formulation. | FR1145 | Review and analyze results. |
| FR1126 | Produce a prototype. | FR1146 | Generate test reports. |
| FR1127 | Acknowledge the research objectives. | FR1151 | Manage knowledge of the combined design process and the final product in all design aspects. |
| FR1128 | Design the production process for in-line mixing. | FR1152 | Support the knowledge management process to fix product line defects. |
| FR1129 | Prepare mixed pre-production samples. | FR1153 | Manage previous knowledge within the organization. |
| FR112,10 | Prepare pre-production stage tires. | FR1154 | Coordinate the holding of internal seminars. |
| FR112,11 | Validate to achieve project goals. | FR1155 | Coordinate and disseminate new sciences in the field of tire production. |
| FR112,12 | Perform daily line production. | FR1156 | Receive and archive lessons learned related to research and development projects. |
| FR112,13 | Prepare the mixture reference recipe and deliver it to the Research and Development Documentation Center. | FR1157 | Publish lessons learned at the organization level. |
| FR112,14 | Prepare project documentation and store a copy in the archive of the mixture design office and deliver another copy to the documentation center. | FR1221 | Select the size and brand of comparable tires. |
| FR1131 | Design the template profile and pattern. | FR1222 | Request to buy. |
| FR1132 | Simulate and certify the design. | FR1223 | Determine the test and its standard. |
| FR1133 | Prepare template drawings. | FR1231 | Issue processes based on design department ORDERS. |
| FR1134 | Prepare the Common Technical Document (CTD). | FR1232 | Check the production notifications sent by the process department to decide on issuing or not issuing the process. |
| FR1135 | Build the ORDER design. | FR1233 | Prepare PFMEA for all radial tire production processes. |
| FR1136 | Issue the manufacturing process. | FR1234 | Investigate and eliminate the reasons for the non-functioning of the radial tire in the test center tests. |
| FR1137 | Issue the baking process. | FR1235 | Carry out projects defined in meetings. |
| FR1138 | Experimentally construct and cook, then examine defects and uniformity. | FR1236 | Prepare and update work standards for different parts of radial riding. |
4.2. Originate the Functional Architecture of the SOI in DSM Representation.
Following steps 3-6 of the method, the DSM tool portrays the functional architecture of the system of interest (SOI). Exhibit 9 shows the original architecture design. Positive values above the diagonal in the original DSM signify substantial coupling, suggesting changes in one element affect others. To curtail change propagation, a beneficial solution called 'modularization' is suggested.
Exhibit 9.
Displaying the initial SOI design using a Numerical Design Structure Matrix

4.3. Significance of Each System Element within the Functional Architecture of the SOI
4.3.1. Initial Significance of Each System Element
Each SOI element's significance is assessed by 'C1' (system architecture dependency) and 'C2' (element's info dependency on architecture). 'C1' gauges system's reliance on an element, while 'C2' measures element's info contribution and input from the system.
For insights into element significance, percentage average dependencies are calculated from the original Numerical Design Structure Matrix (NDSM) of the architecture. Exhibits 10 and 11 display this, providing a comprehensive view of individual element importance and role in the SOI;
Exhibit 10.
Percentage of information provided by each system element for the entire system (NDSM
rows).
Exhibit 10.
Percentage of information provided by each system element for the entire system (NDSM
rows).
| Code | Percentage (%) | Code | Percentage (%) | Code | Percentage (%) |
|---|---|---|---|---|---|
| FR1121 | 0.57 | FR1231 | 1.36 | FR1157 | 1.87 |
| FR1115 | 0.6 | FR1138 | 1.38 | FR1152 | 1.9 |
| FR1129 | 0.69 | FR1235 | 1.38 | FR112,11 | 1.96 |
| FR112, 10 | 0.73 | FR1113 | 1.44 | FR1223 | 2.04 |
| FR1124 | 0.83 | FR1112 | 1.52 | FR1136 | 2.25 |
| FR1154 | 0.87 | FR1142 | 1.55 | FR1137 | 2.26 |
| FR1123 | 0.88 | FR1131 | 1.55 | FR1146 | 2.44 |
| FR1236 | 0.96 | FR112,13 | 1.55 | FR1134 | 2.49 |
| FR1233 | 0.99 | FR1232 | 1.56 | FR113,13 | 2.64 |
| FR1111 | 1.04 | FR1221 | 1.56 | FR1156 | 2.75 |
| FR1234 | 1.11 | FR112,12 | 1.59 | FR1145 | 2.87 |
| FR1155 | 1.12 | FR1222 | 1.6 | FR1144 | 3.11 |
| FR1125 | 1.19 | FR1133 | 1.64 | FR1141 | 3.17 |
| FR1139 | 1.25 | FR1128 | 1.68 | FR113,11 | 3.72 |
| FR1132 | 1.27 | FR1153 | 1.74 | FR113,12 | 3.92 |
| FR1122 | 1.29 | FR1143 | 1.77 | FR112,14 | 3.94 |
| FR1127 | 1.31 | FR1114 | 1.79 | FR1151 | 4.34 |
| FR1126 | 1.32 | FR1135 | 1.82 | FR113,10 | 5.85 |
Exhibit 11.
Percentage of information input received by each system element from the entire system
(NDSM columns).
Exhibit 11.
Percentage of information input received by each system element from the entire system
(NDSM columns).
| Code | Percentage (%) | Code | Percentage (%) | Code | Percentage (%) |
|---|---|---|---|---|---|
| FR1111 | 0.85 | FR112,14 | 1.56 | FR1145 | 2.13 |
| FR1112 | 0.94 | FR1131 | 1.77 | FR1146 | 1.76 |
| FR1113 | 1.13 | FR1132 | 1.35 | FR1151 | 1.82 |
| FR1114 | 1.3 | FR1133 | 1.88 | FR1152 | 1.84 |
| FR1115 | 0.63 | FR1134 | 2.83 | FR1153 | 1.72 |
| FR1121 | 1.62 | FR1135 | 2.18 | FR1154 | 0.99 |
| FR1122 | 2.08 | FR1136 | 2.36 | FR1155 | 1.42 |
| FR1123 | 1.92 | FR1137 | 2.22 | FR1156 | 1.98 |
| FR1124 | 1.94 | FR1138 | 1.44 | FR1157 | 1.97 |
| FR1125 | 2.01 | FR1139 | 1.28 | FR1221 | 1.57 |
| FR1126 | 1.79 | FR113,10 | 3.53 | FR1222 | 2.07 |
| FR1127 | 1.64 | FR113,11 | 3.83 | FR1223 | 1.74 |
| FR1128 | 1.9 | FR113,12 | 4.13 | FR1231 | 1.33 |
| FR1129 | 1.68 | FR113,13 | 2.93 | FR1232 | 1.97 |
| FR112,10 | 1.59 | FR1141 | 2.41 | FR1233 | 1.43 |
| FR112,11 | 2.38 | FR1142 | 1.04 | FR1234 | 1.51 |
| FR112,12 | 2.01 | FR1143 | 1.8 | FR1235 | 1.4 |
| FR112,13 | 1.46 | FR1144 | 2.51 | FR1236 | 1.43 |
(NDSM)Exhibits 12 and 13 are included to provide a clearer visual representation of
the information presented in Tables 10 and 11, respectively;
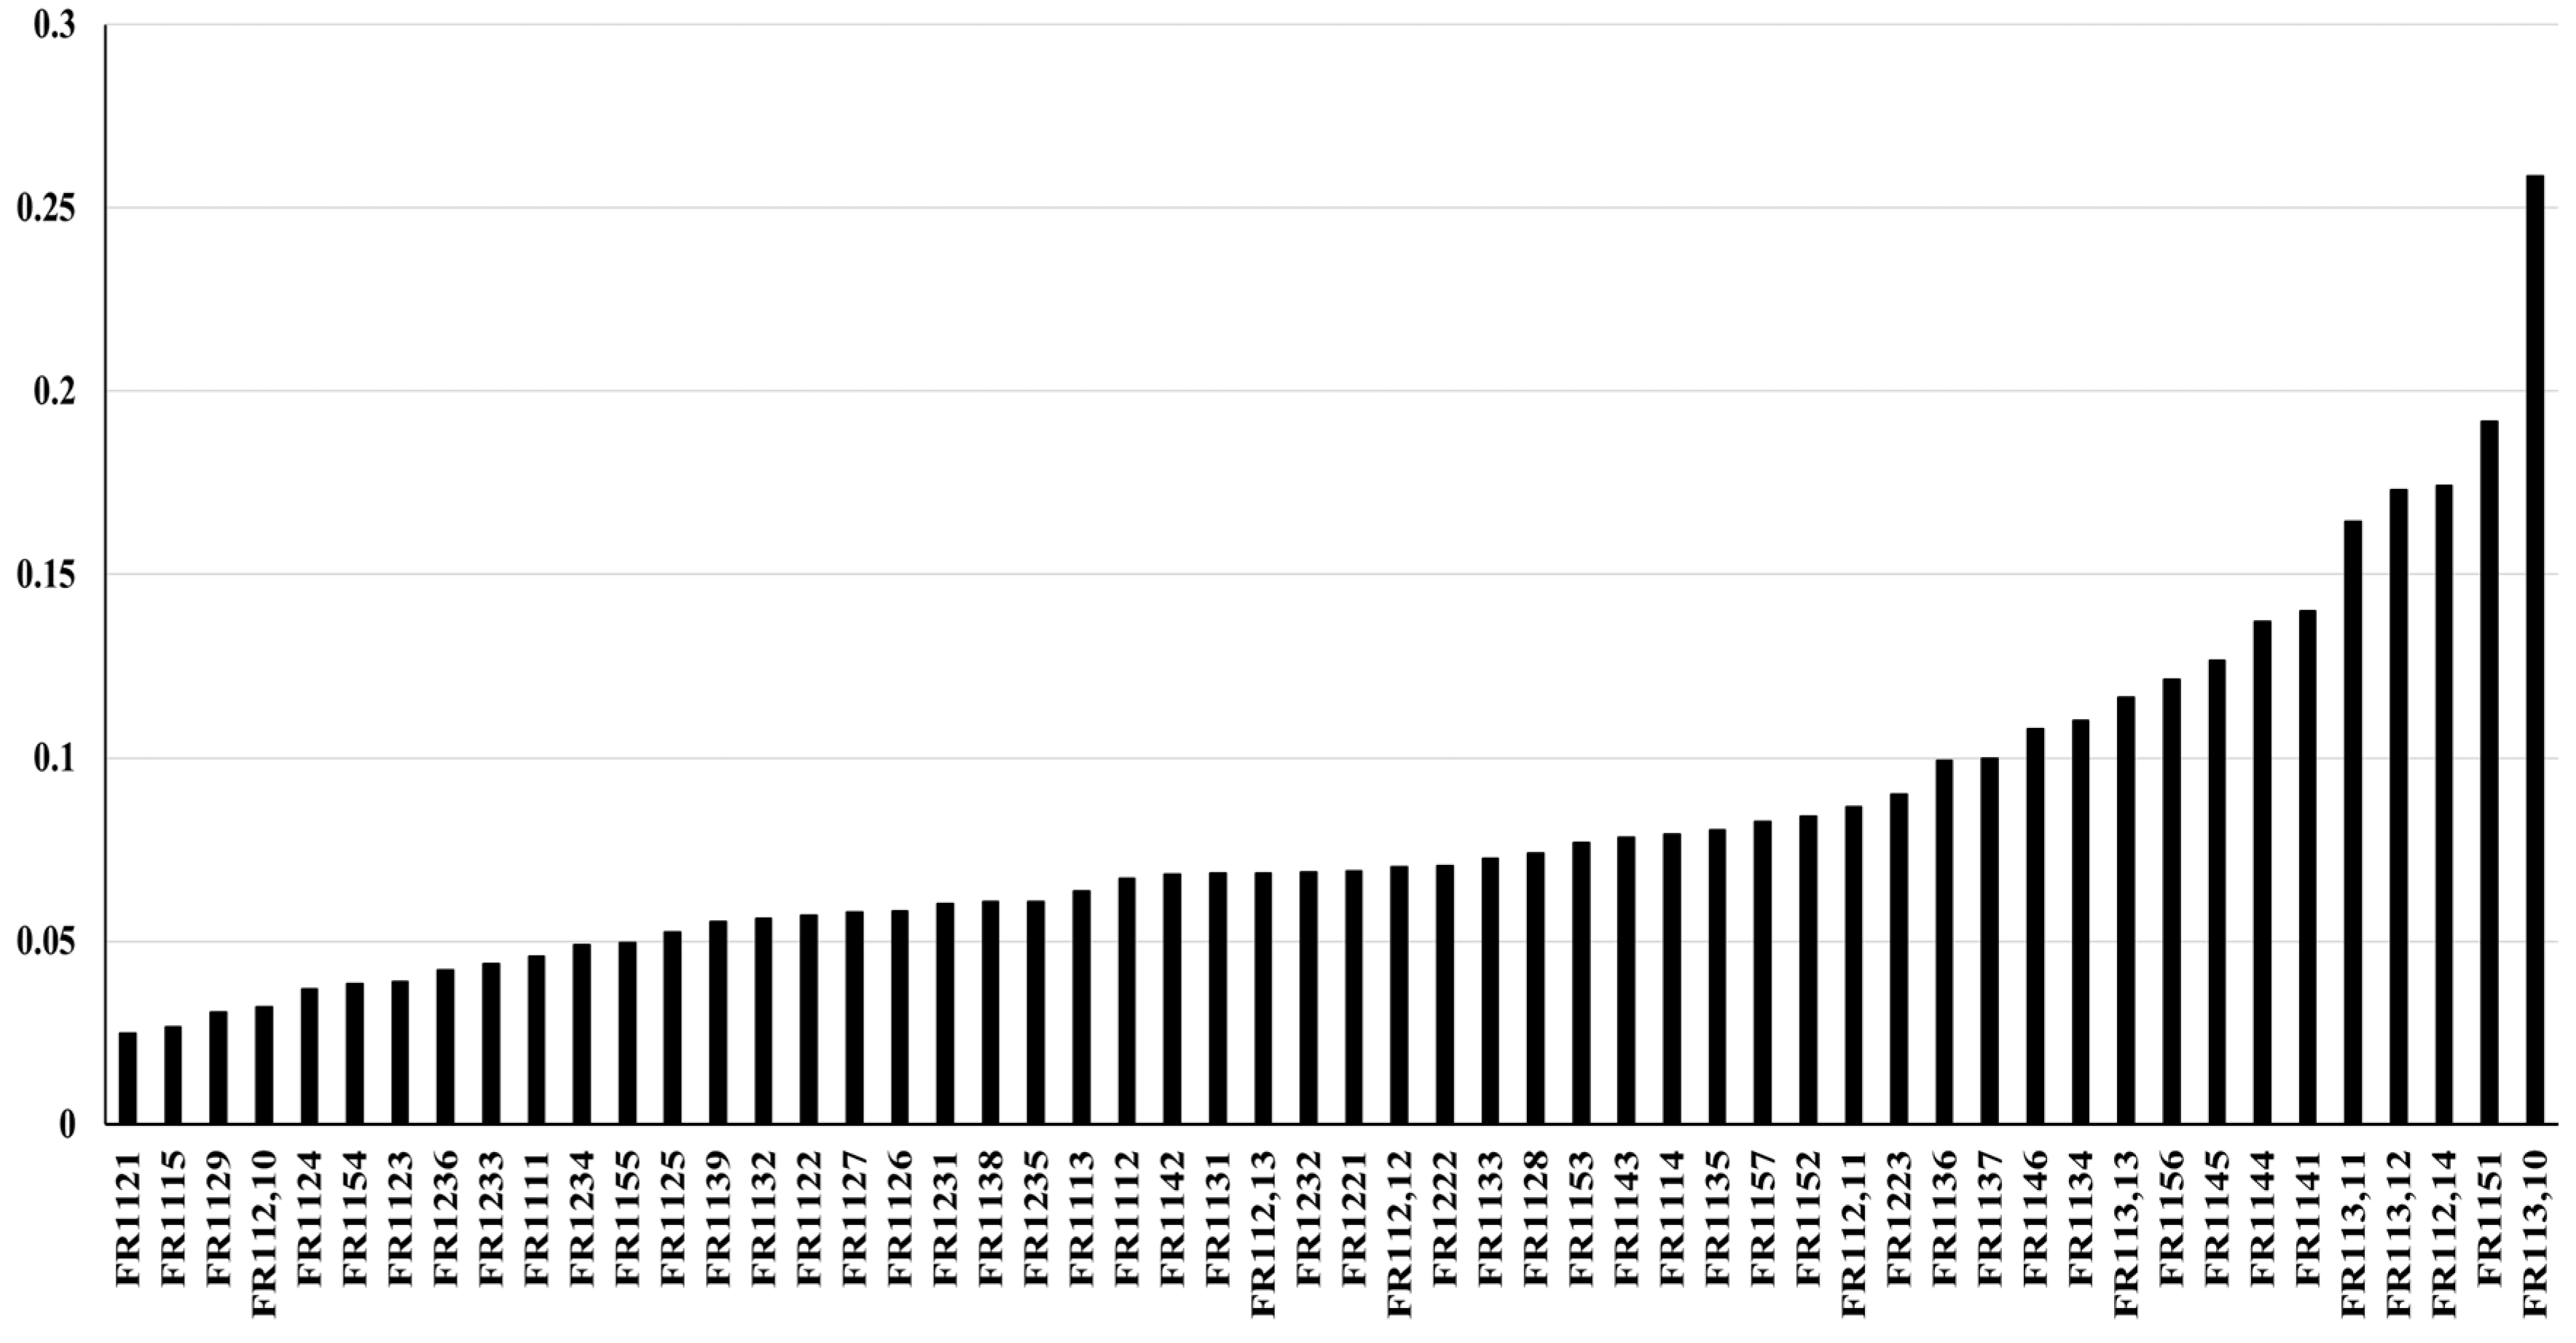
Exhibit 12.
Prioritization of the proportion of information contribution from each system element to
the entire SOI (NDSM rows).
Exhibit 12.
Prioritization of the proportion of information contribution from each system element to
the entire SOI (NDSM rows).
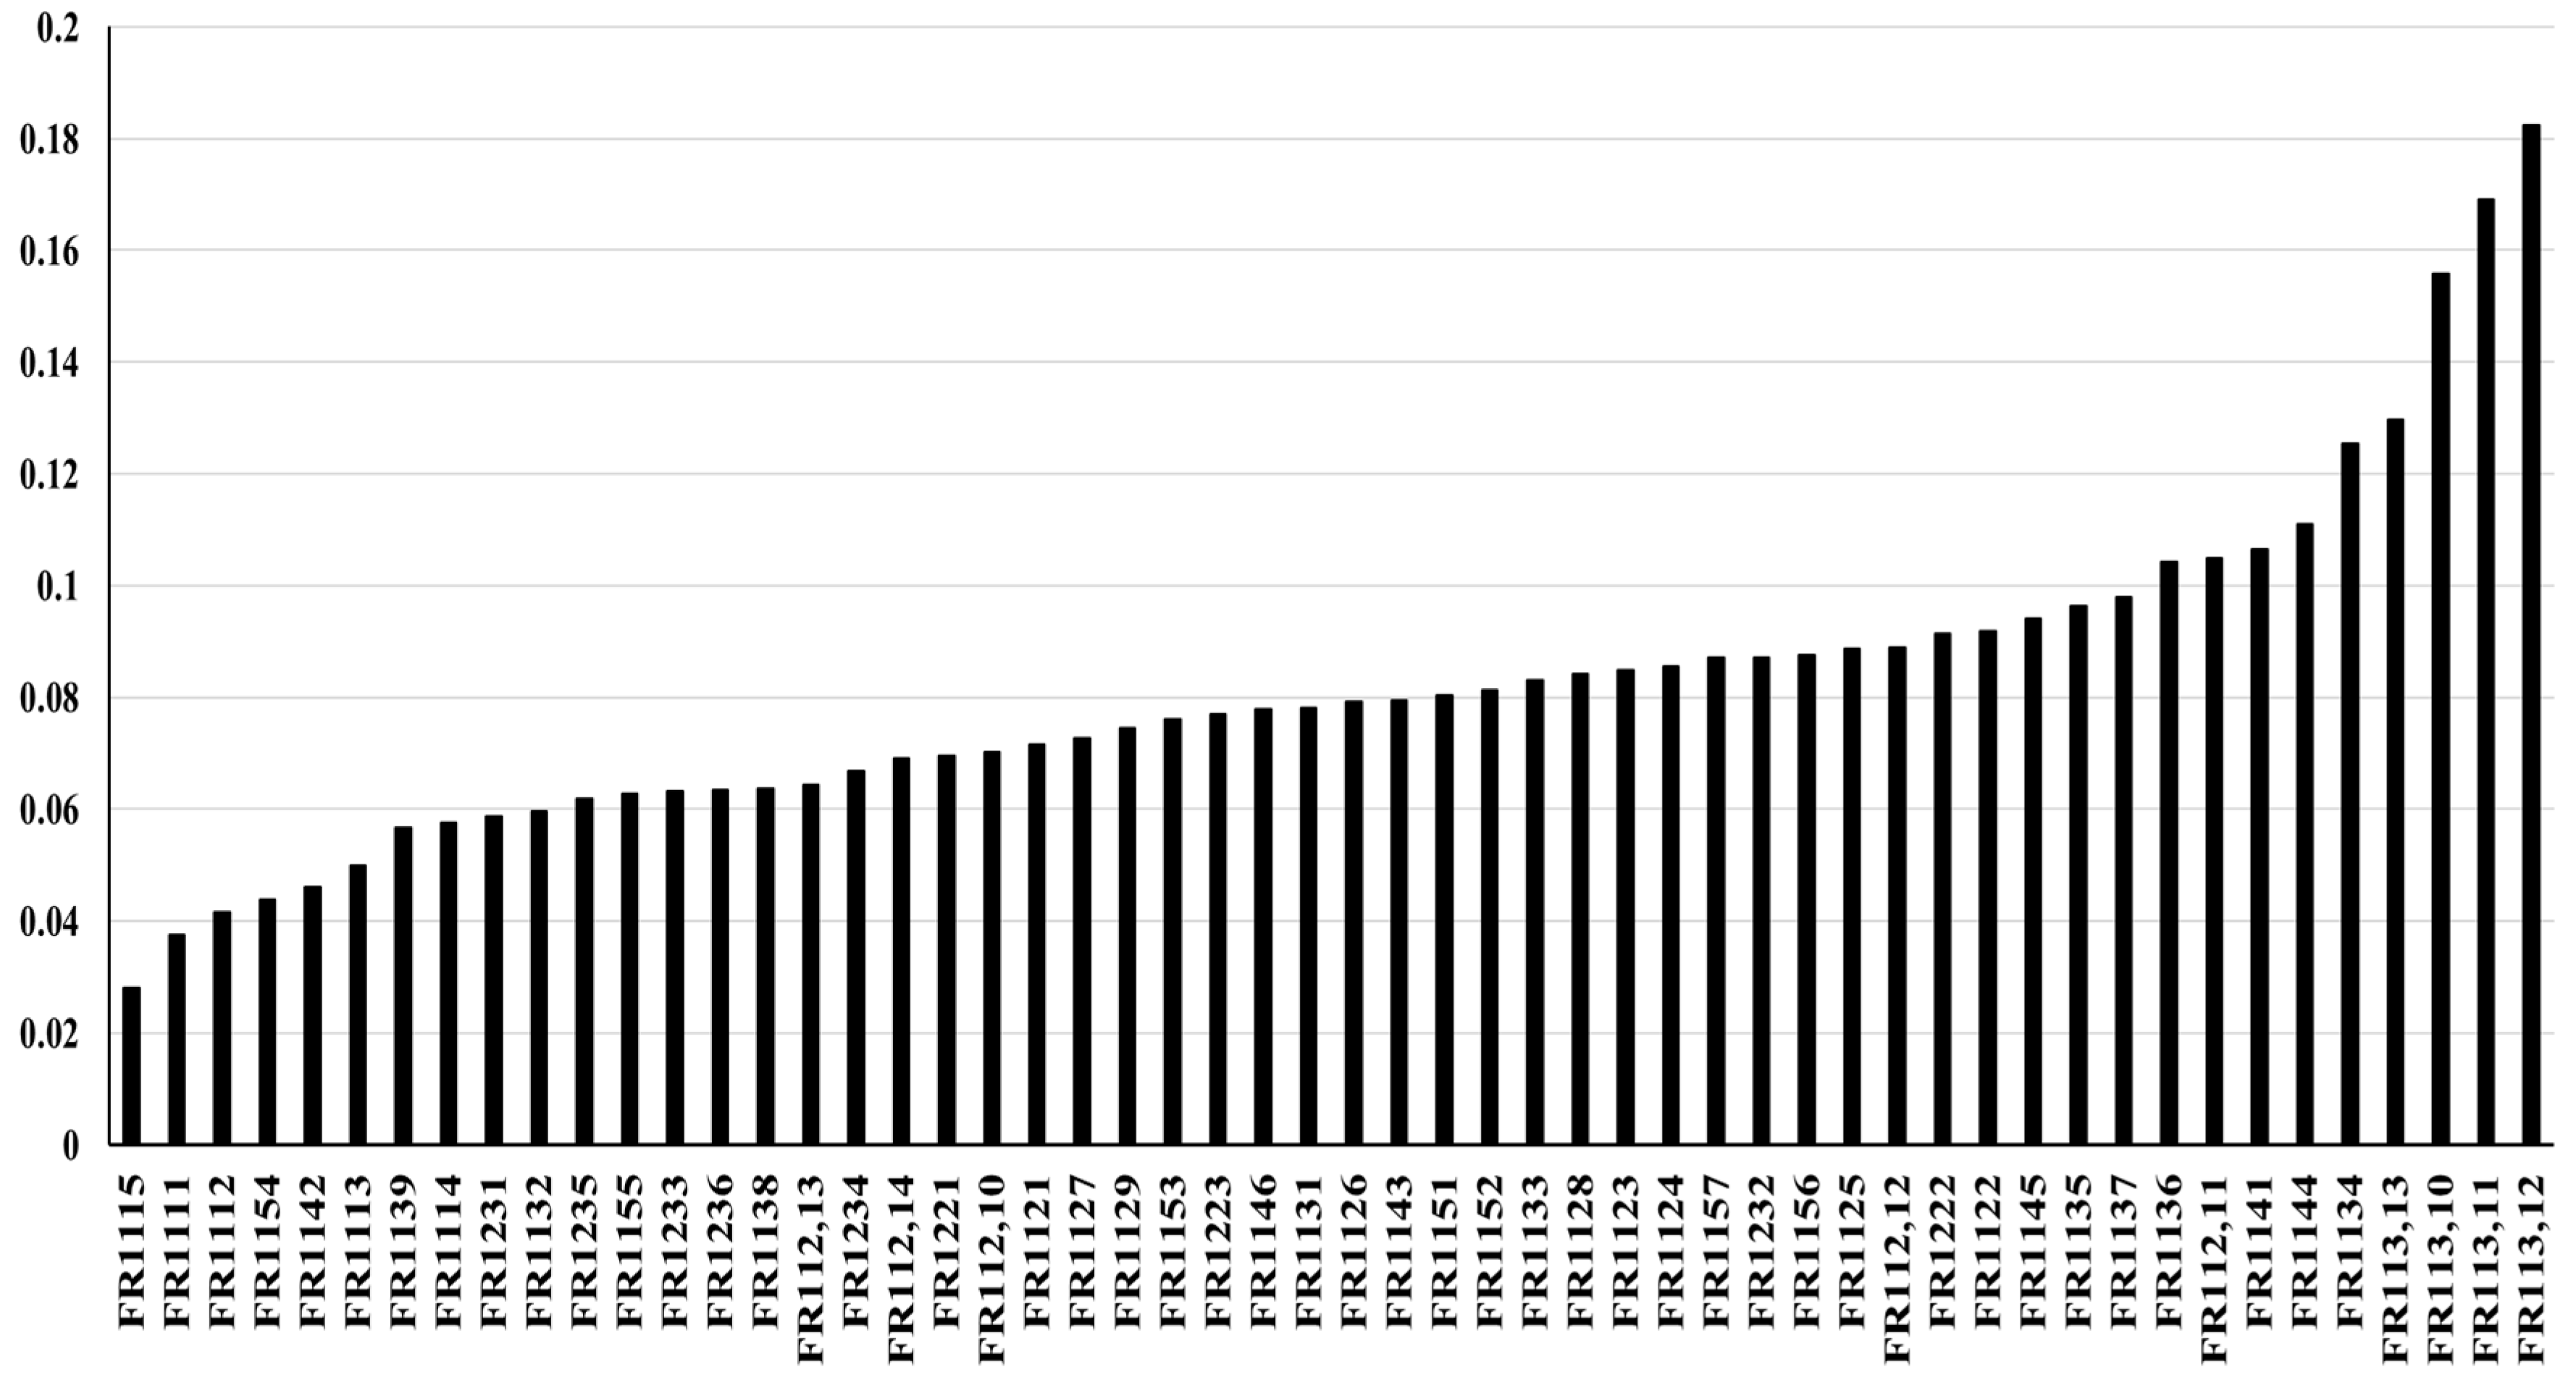
Exhibit 13.
Prioritization of the percentage of information input received by each system element from
the entire SOI (NDSM columns).
Exhibit 13.
Prioritization of the percentage of information input received by each system element from
the entire SOI (NDSM columns).
Furthermore, Exhibit 14 offers a comparison between the 'percentage of information feed that each system element can provide' and the 'percentage of information inputs that each system element receives' for/from the entire SOI;
Exhibit 14.
Comparing the information contribution and input percentages for each system element
within the entire system.
Exhibit 14.
Comparing the information contribution and input percentages for each system element
within the entire system.
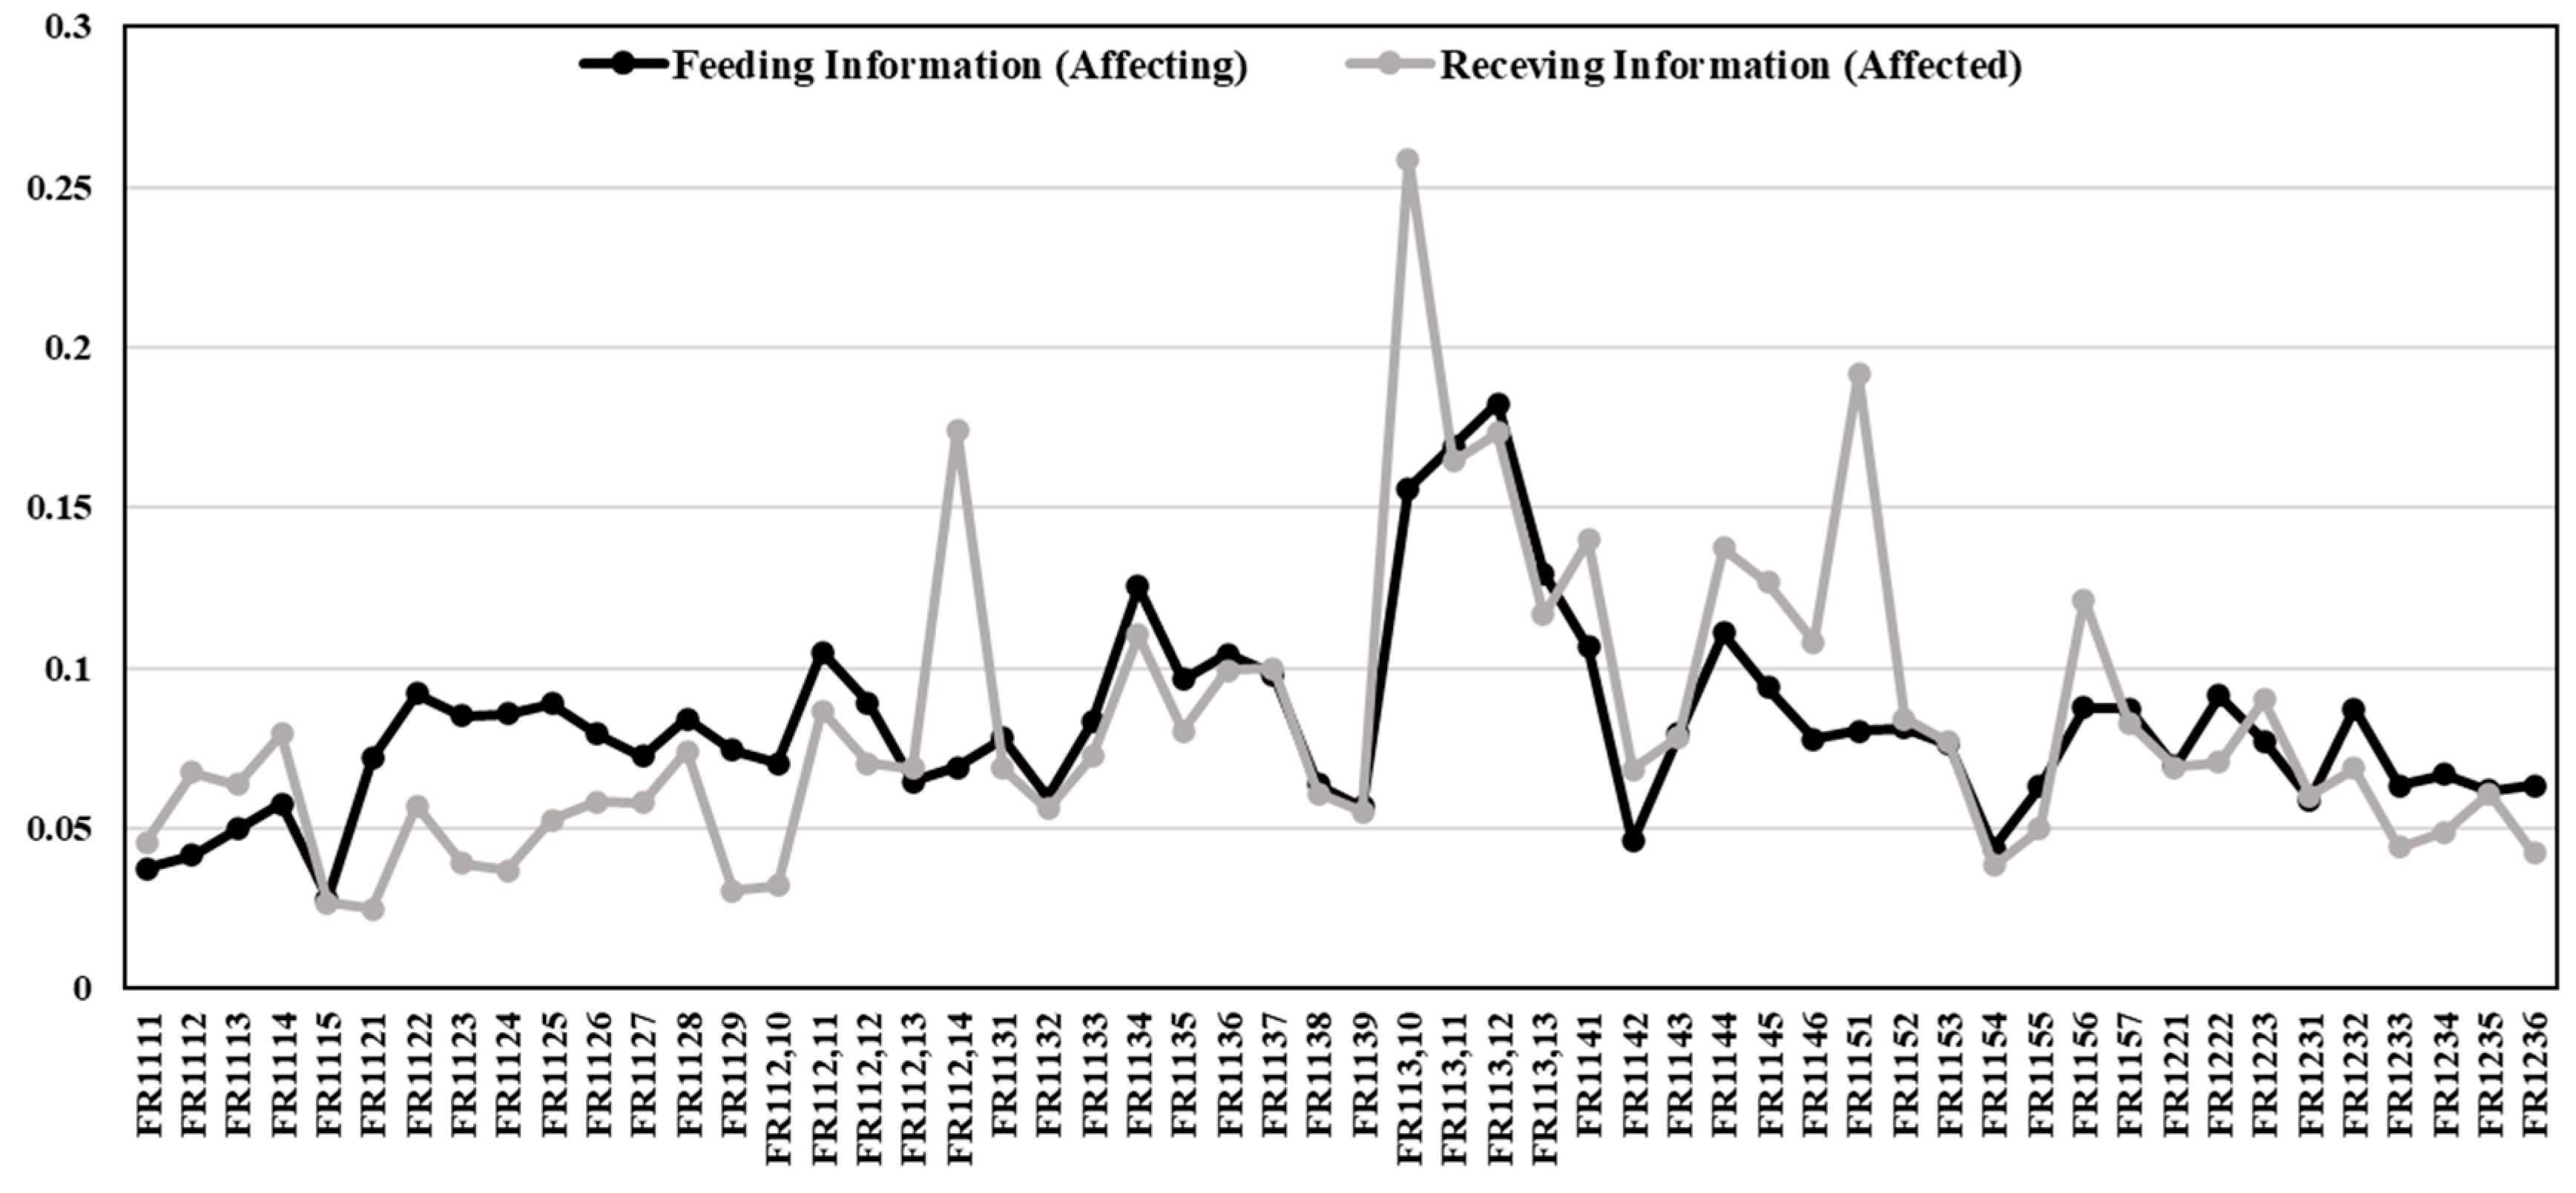
As observed in the aforementioned figures, it is evident that the criteria C1 and C2 for each system element are not identical. For instance, while elements 'FR113,10', 'FR113,11', and 'FR113,12' demonstrate maximal percentage of information feed they can provide for the entire system (i.e., C1), they also receive the highest percentage of information inputs from the entire system (i.e., C2). However, it is essential to avoid potential misinterpretation, as the significance of each process (i.e., each node of the network representing the system architecture of the SOI) should be evaluated based on both criteria concurrently.
To achieve this, the present study utilizes a weighting method known as the 'compound measure,' proposed within this research. The subsequent section will delve into further details about this approach.
4.3.2. Compound Weights of each system element
To establish a singular weight for each element, two criteria, namely 'C1' and 'C2' are introduced with equal values (i.e., WC1 = 0.5, WC2 = 0.5). Subsequently, two Multi-Criteria Decision Making (MCDM) weighting methods, 'SAW' and 'TOPSIS,' are utilized. The resulting weights obtained through these methods are collectively referred to as 'Compound Weights' in this study.
Exhibit 15 displays the final compound weights of each element within the SOI, based on the outcomes derived from the SAW and TOPSIS methods.
Exhibit 15.
Compound weight of each element of the SOI.
| SAW | TOPSIS | FRs | SAW | TOPSIS | |
|---|---|---|---|---|---|
| FR1111 | 0.009 | 0.005 | FR1139 | 0.013 | 0.010 |
| FR1112 | 0.012 | 0.010 | FR113,10 | 0.045 | 0.059 |
| FR1113 | 0.013 | 0.010 | FR113,11 | 0.038 | 0.044 |
| FR1114 | 0.015 | 0.014 | FR113,12 | 0.040 | 0.047 |
| FR1115 | 0.006 | 0.000 | FR113,13 | 0.028 | 0.031 |
| FR1121 | 0.012 | 0.010 | FR1141 | 0.027 | 0.032 |
| FR1122 | 0.018 | 0.016 | FR1142 | 0.013 | 0.011 |
| FR1123 | 0.015 | 0.013 | FR1143 | 0.018 | 0.017 |
| FR1124 | 0.015 | 0.013 | FR1144 | 0.028 | 0.032 |
| FR1125 | 0.017 | 0.015 | FR1145 | 0.024 | 0.028 |
| FR1126 | 0.016 | 0.014 | FR1146 | 0.020 | 0.022 |
| FR1127 | 0.015 | 0.013 | FR1151 | 0.029 | 0.037 |
| FR1128 | 0.018 | 0.017 | FR1152 | 0.019 | 0.019 |
| FR1129 | 0.013 | 0.011 | FR1153 | 0.017 | 0.017 |
| FR112,10 | 0.012 | 0.010 | FR1154 | 0.009 | 0.005 |
| FR112,11 | 0.022 | 0.023 | FR1155 | 0.013 | 0.010 |
| FR112,12 | 0.018 | 0.018 | FR1156 | 0.023 | 0.026 |
| FR112,13 | 0.015 | 0.013 | FR1157 | 0.019 | 0.019 |
| FR112,14 | 0.025 | 0.033 | FR1221 | 0.016 | 0.014 |
| FR1131 | 0.017 | 0.015 | FR1222 | 0.019 | 0.018 |
| FR1132 | 0.013 | 0.010 | FR1223 | 0.019 | 0.019 |
| FR1133 | 0.018 | 0.017 | FR1231 | 0.013 | 0.011 |
| FR1134 | 0.027 | 0.030 | FR1232 | 0.018 | 0.017 |
| FR1135 | 0.020 | 0.020 | FR1233 | 0.013 | 0.009 |
| FR1136 | 0.023 | 0.025 | FR1234 | 0.013 | 0.011 |
| FR1137 | 0.022 | 0.024 | FR1235 | 0.014 | 0.012 |
| FR1138 | 0.014 | 0.012 | FR1236 | 0.012 | 0.009 |
Exhibit 16 presents a comparison of the compound weight of each element obtained from both the TOPSIS method and the SAW method, alongside the weights originally computed (i.e., weights obtained from C1 and C2 only).
Exhibit 16.
Comparing the compound weights of each element with their original individual weights.
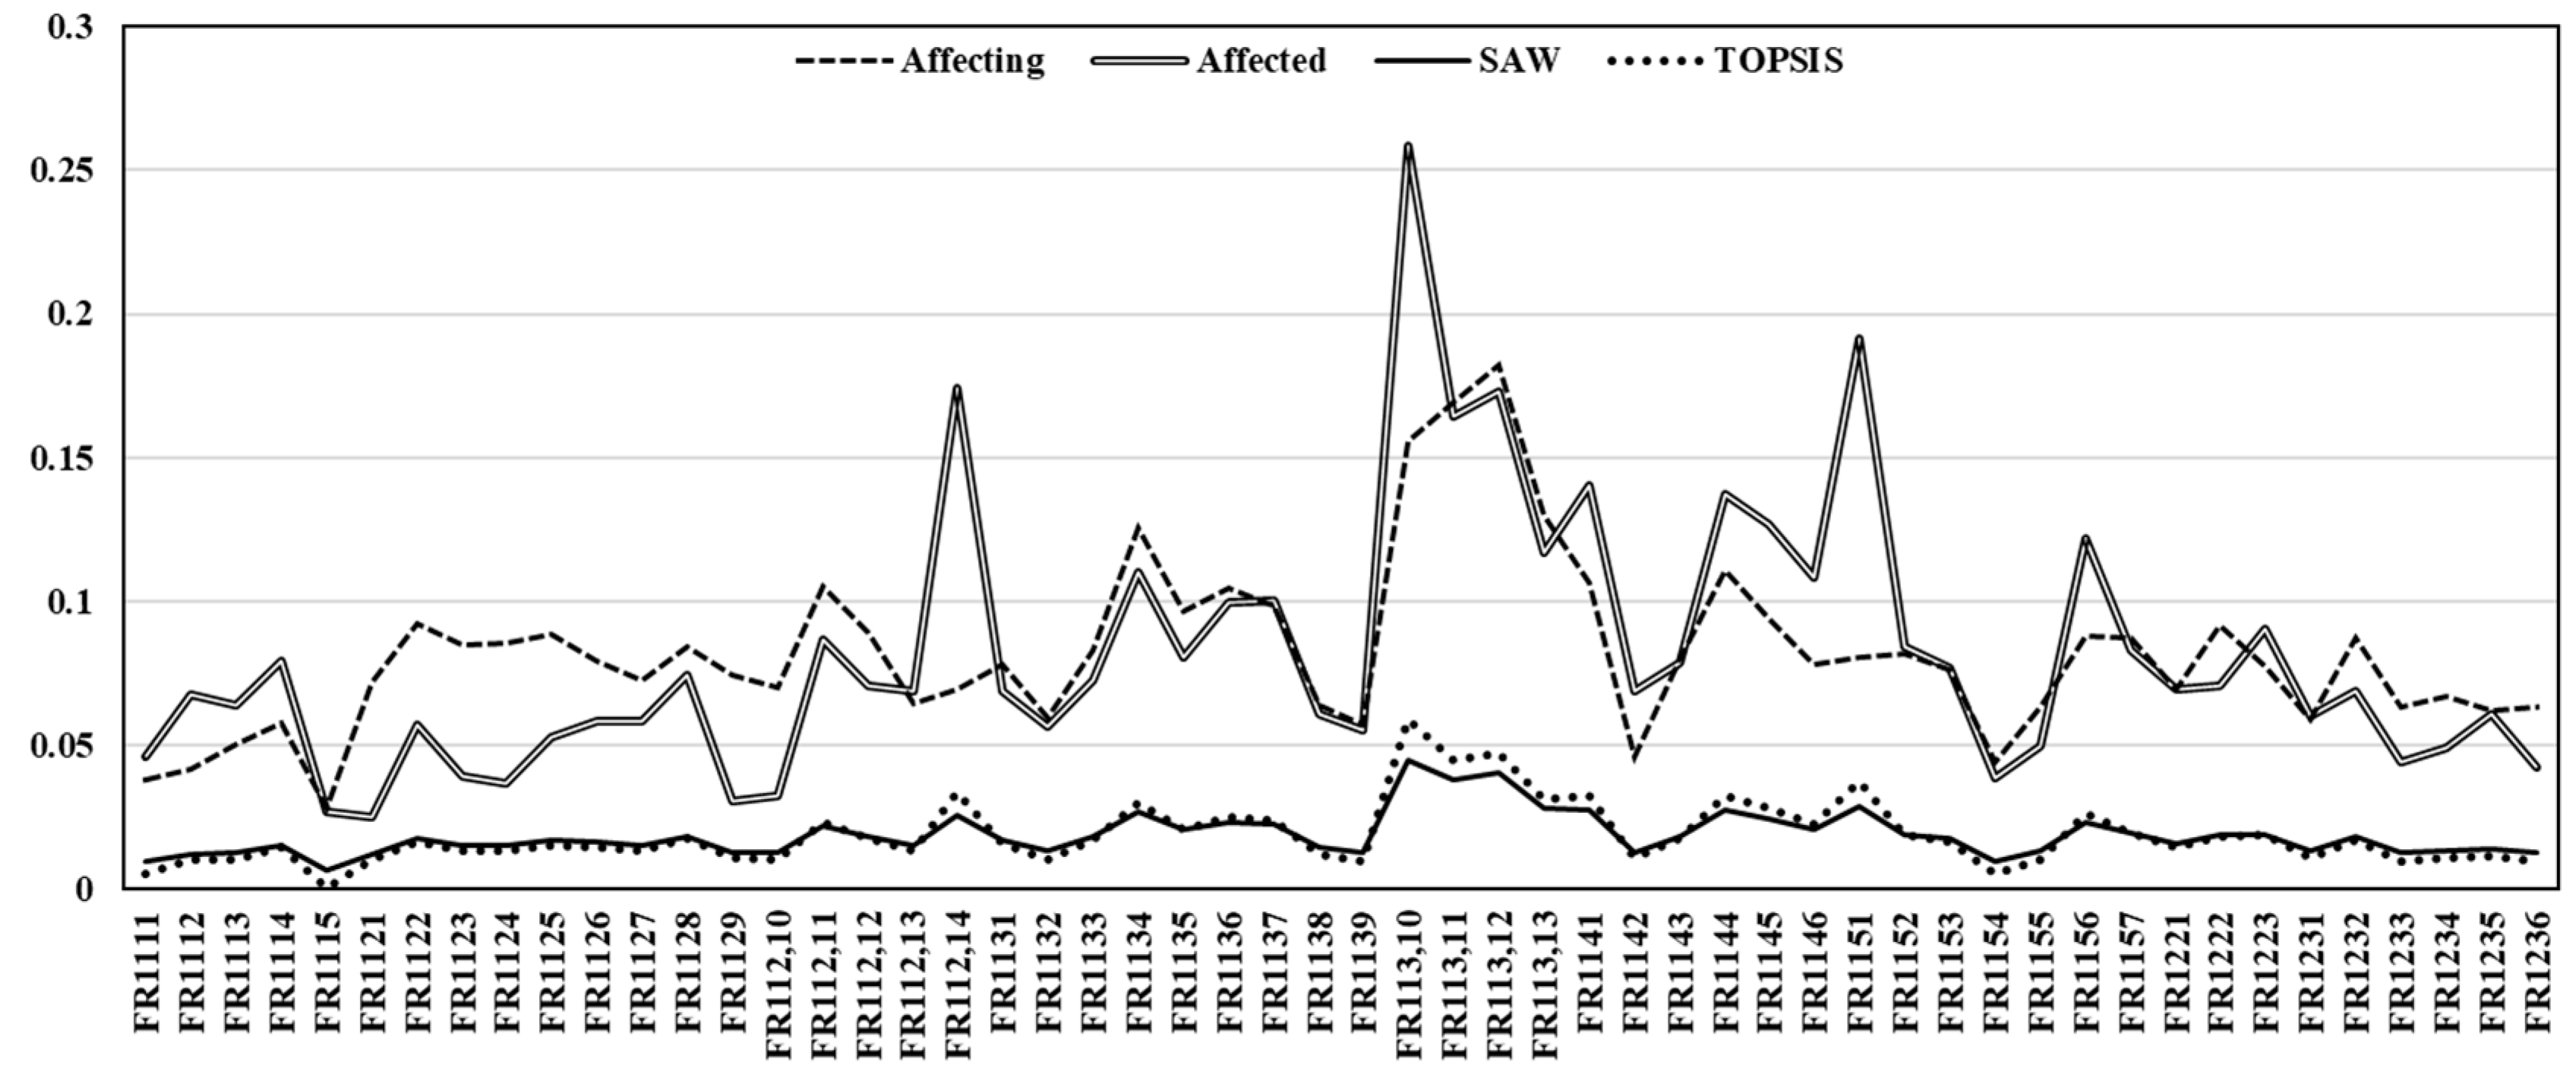
As the figure illustrates, there are considerable differences between the original weights and the weights obtained from applying the MCDM methods. However, the latter weights (i.e., weights given by the SAW and TOPSIS methods) are nearly similar, while also being more reasonable and acceptable.
Given the considerable similarity between the results obtained from the SAW and TOPSIS methods, for the sake of simplicity and without losing generality, the weights given by the TOPSIS method are used to continue the analyses. Exhibit 17 presents the updated prioritization of the elements based on the compound weights derived from the TOPSIS method;
Exhibit 17.
Prioritization of elements according to their compound weights determined by the TOPSIS method.
Exhibit 17.
Prioritization of elements according to their compound weights determined by the TOPSIS method.
| System Element | Priority | Compound Weight | System Element | Priority | Compound Weight |
|---|---|---|---|---|---|
| FR113,10 | 29 | 0.0449 | FR1131 | 20 | 0.0168 |
| FR113,12 | 31 | 0.0404 | FR1125 | 10 | 0.0167 |
| FR113,11 | 30 | 0.0378 | FR1126 | 11 | 0.0160 |
| FR1151 | 39 | 0.0286 | FR1221 | 46 | 0.0157 |
| FR113,13 | 32 | 0.0281 | FR1127 | 12 | 0.0151 |
| FR1144 | 36 | 0.0276 | FR1114 | 4 | 0.0151 |
| FR1141 | 33 | 0.0272 | FR112,13 | 18 | 0.0150 |
| FR1134 | 23 | 0.0269 | FR1123 | 8 | 0.0149 |
| FR112,14 | 19 | 0.0255 | FR1124 | 9 | 0.0148 |
| FR1145 | 37 | 0.0243 | FR1138 | 27 | 0.0141 |
| FR1136 | 25 | 0.0231 | FR1235 | 53 | 0.0139 |
| FR1156 | 44 | 0.0230 | FR1234 | 52 | 0.0135 |
| FR1137 | 26 | 0.0224 | FR1231 | 49 | 0.0134 |
| FR112,11 | 16 | 0.0220 | FR1132 | 21 | 0.0132 |
| FR1146 | 38 | 0.0204 | FR1155 | 43 | 0.0130 |
| FR1135 | 24 | 0.0203 | FR1129 | 14 | 0.0127 |
| FR1157 | 45 | 0.0193 | FR1139 | 28 | 0.0127 |
| FR1222 | 47 | 0.0187 | FR1113 | 3 | 0.0126 |
| FR1152 | 40 | 0.0187 | FR1233 | 51 | 0.0125 |
| FR1223 | 48 | 0.0187 | FR1142 | 34 | 0.0125 |
| FR112,12 | 17 | 0.0184 | FR1236 | 54 | 0.0124 |
| FR1128 | 13 | 0.0181 | FR112,10 | 15 | 0.0123 |
| FR1232 | 50 | 0.0180 | FR1121 | 6 | 0.0118 |
| FR1143 | 35 | 0.0179 | FR1112 | 2 | 0.0118 |
| FR1133 | 22 | 0.0178 | FR1154 | 42 | 0.0094 |
| FR1122 | 7 | 0.0175 | FR1111 | 1 | 0.0093 |
| FR1153 | 41 | 0.0173 | FR1115 | 5 | 0.0062 |
Consequently, the updated prioritization of the elements can be of significant assistance to managers, enabling them to identify the most and least crucial elements with greater reliability. This, in turn, offers valuable practical insights for making decisions that prioritize robustness.
Exhibit 18.
Displaying the initial SOI design in the NDSM with updated weights.

4.4. Modularization of the Functional Architecture of the SOI
As highlighted in the preceding section, reducing the coupling identified within the functional architecture of the SOI is crucial. According to the principles of DSM methodology, the existence of coupling is inferred from positive values of upper-diagonal entries in the original DSM. However, it is important to note that not all positive values necessarily indicate a significant strength between the involved elements. In certain cases, some interactions between two elements may be negligible, and as a result, the associated values for those entries can be replaced by zero instead. This approach allows us to focus on the more substantial interactions while mitigating the impact of insignificant ones.
Based on the aforementioned logic, elite members of the SOI were interviewed to determine a set of candidate cut-off points for ignoring the strength of interaction between a given pair of elements. The cut-off point refers to a specific value below which the interactions can be disregarded. As a result, the values '0.10', '0.11', '0.11', '0.12', '0.13', '0.14', and '0.15'—each reflecting the strength of interaction between system elements—are introduced as acceptable candidates for identifying an appropriate cut-off point.
For each candidate, the associated NDSM representation of the functional architecture of interest is presented in Appendix A (Exhibits A1-A6). To diminish the coupling, the partitioning technique is applied for each of the resulted architecture. Exhibits 19–24 display the outcomes.
Exhibit 19.
Developing a modular design for the SOI architecture with a cutting-point set at 0.10 (Design I).
Exhibit 19.
Developing a modular design for the SOI architecture with a cutting-point set at 0.10 (Design I).
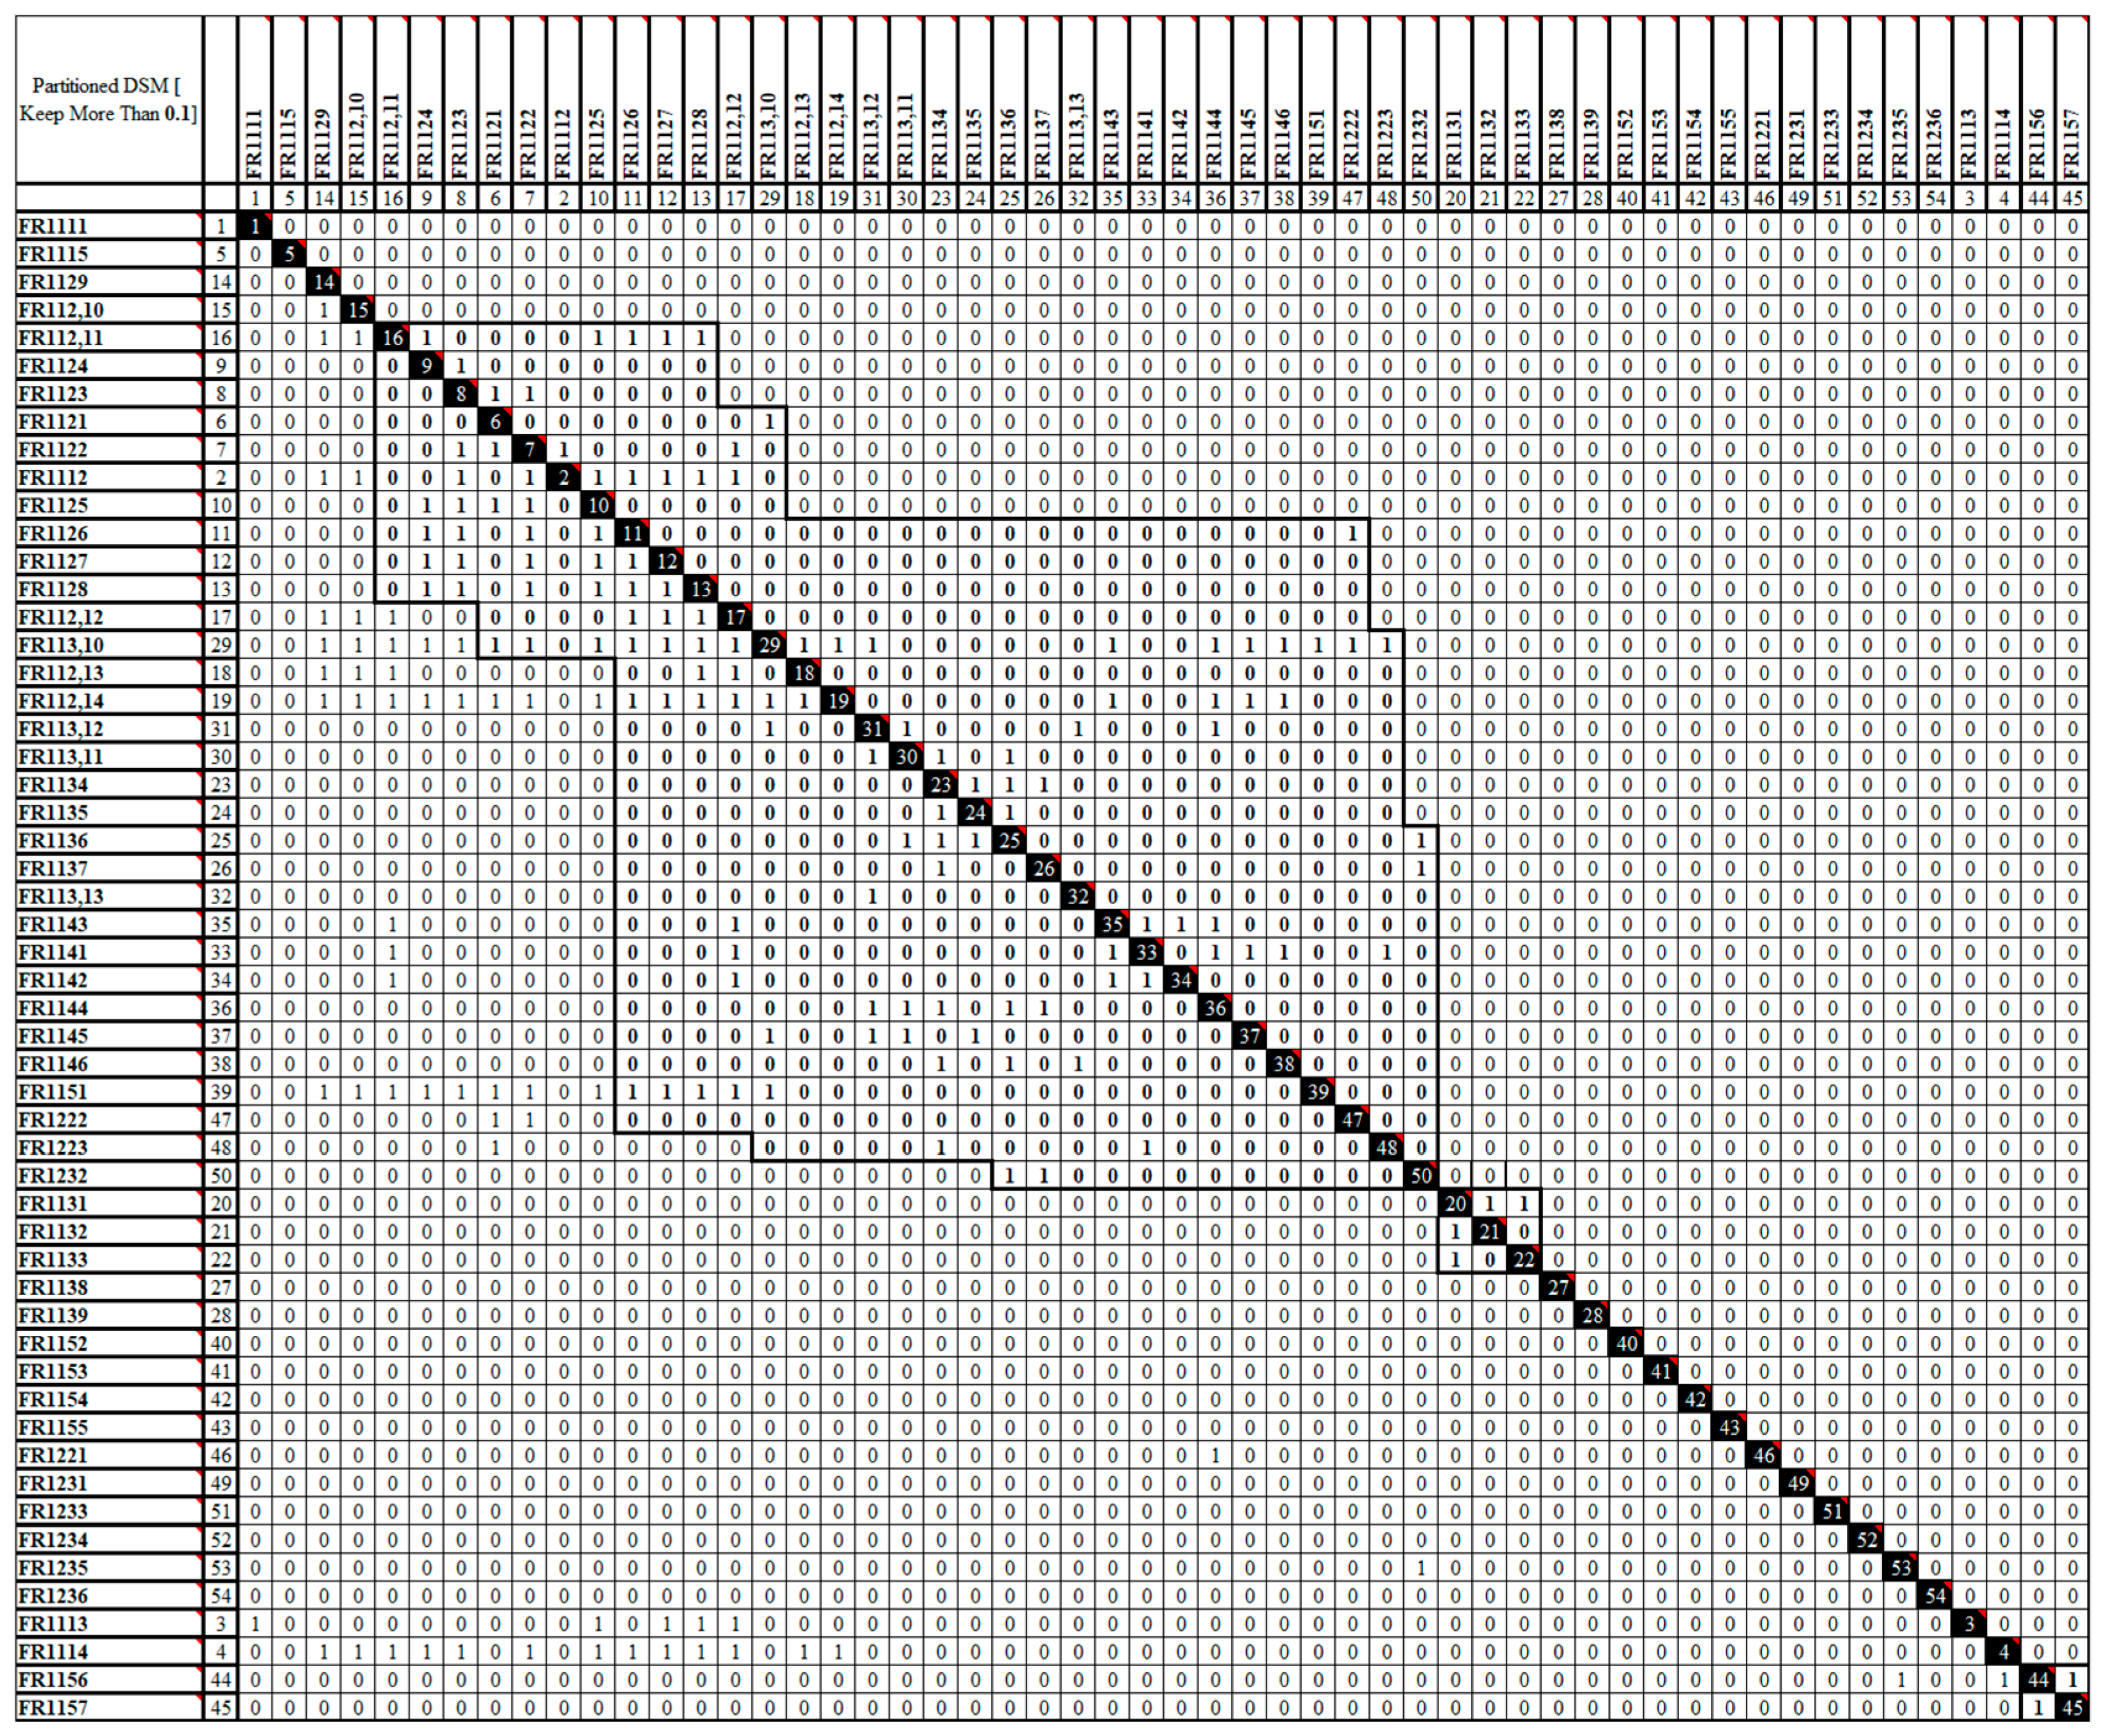
Exhibit 20.
Developing a modular design for the SOI architecture with a cutting-point set at 0.11 (Design II).
Exhibit 20.
Developing a modular design for the SOI architecture with a cutting-point set at 0.11 (Design II).
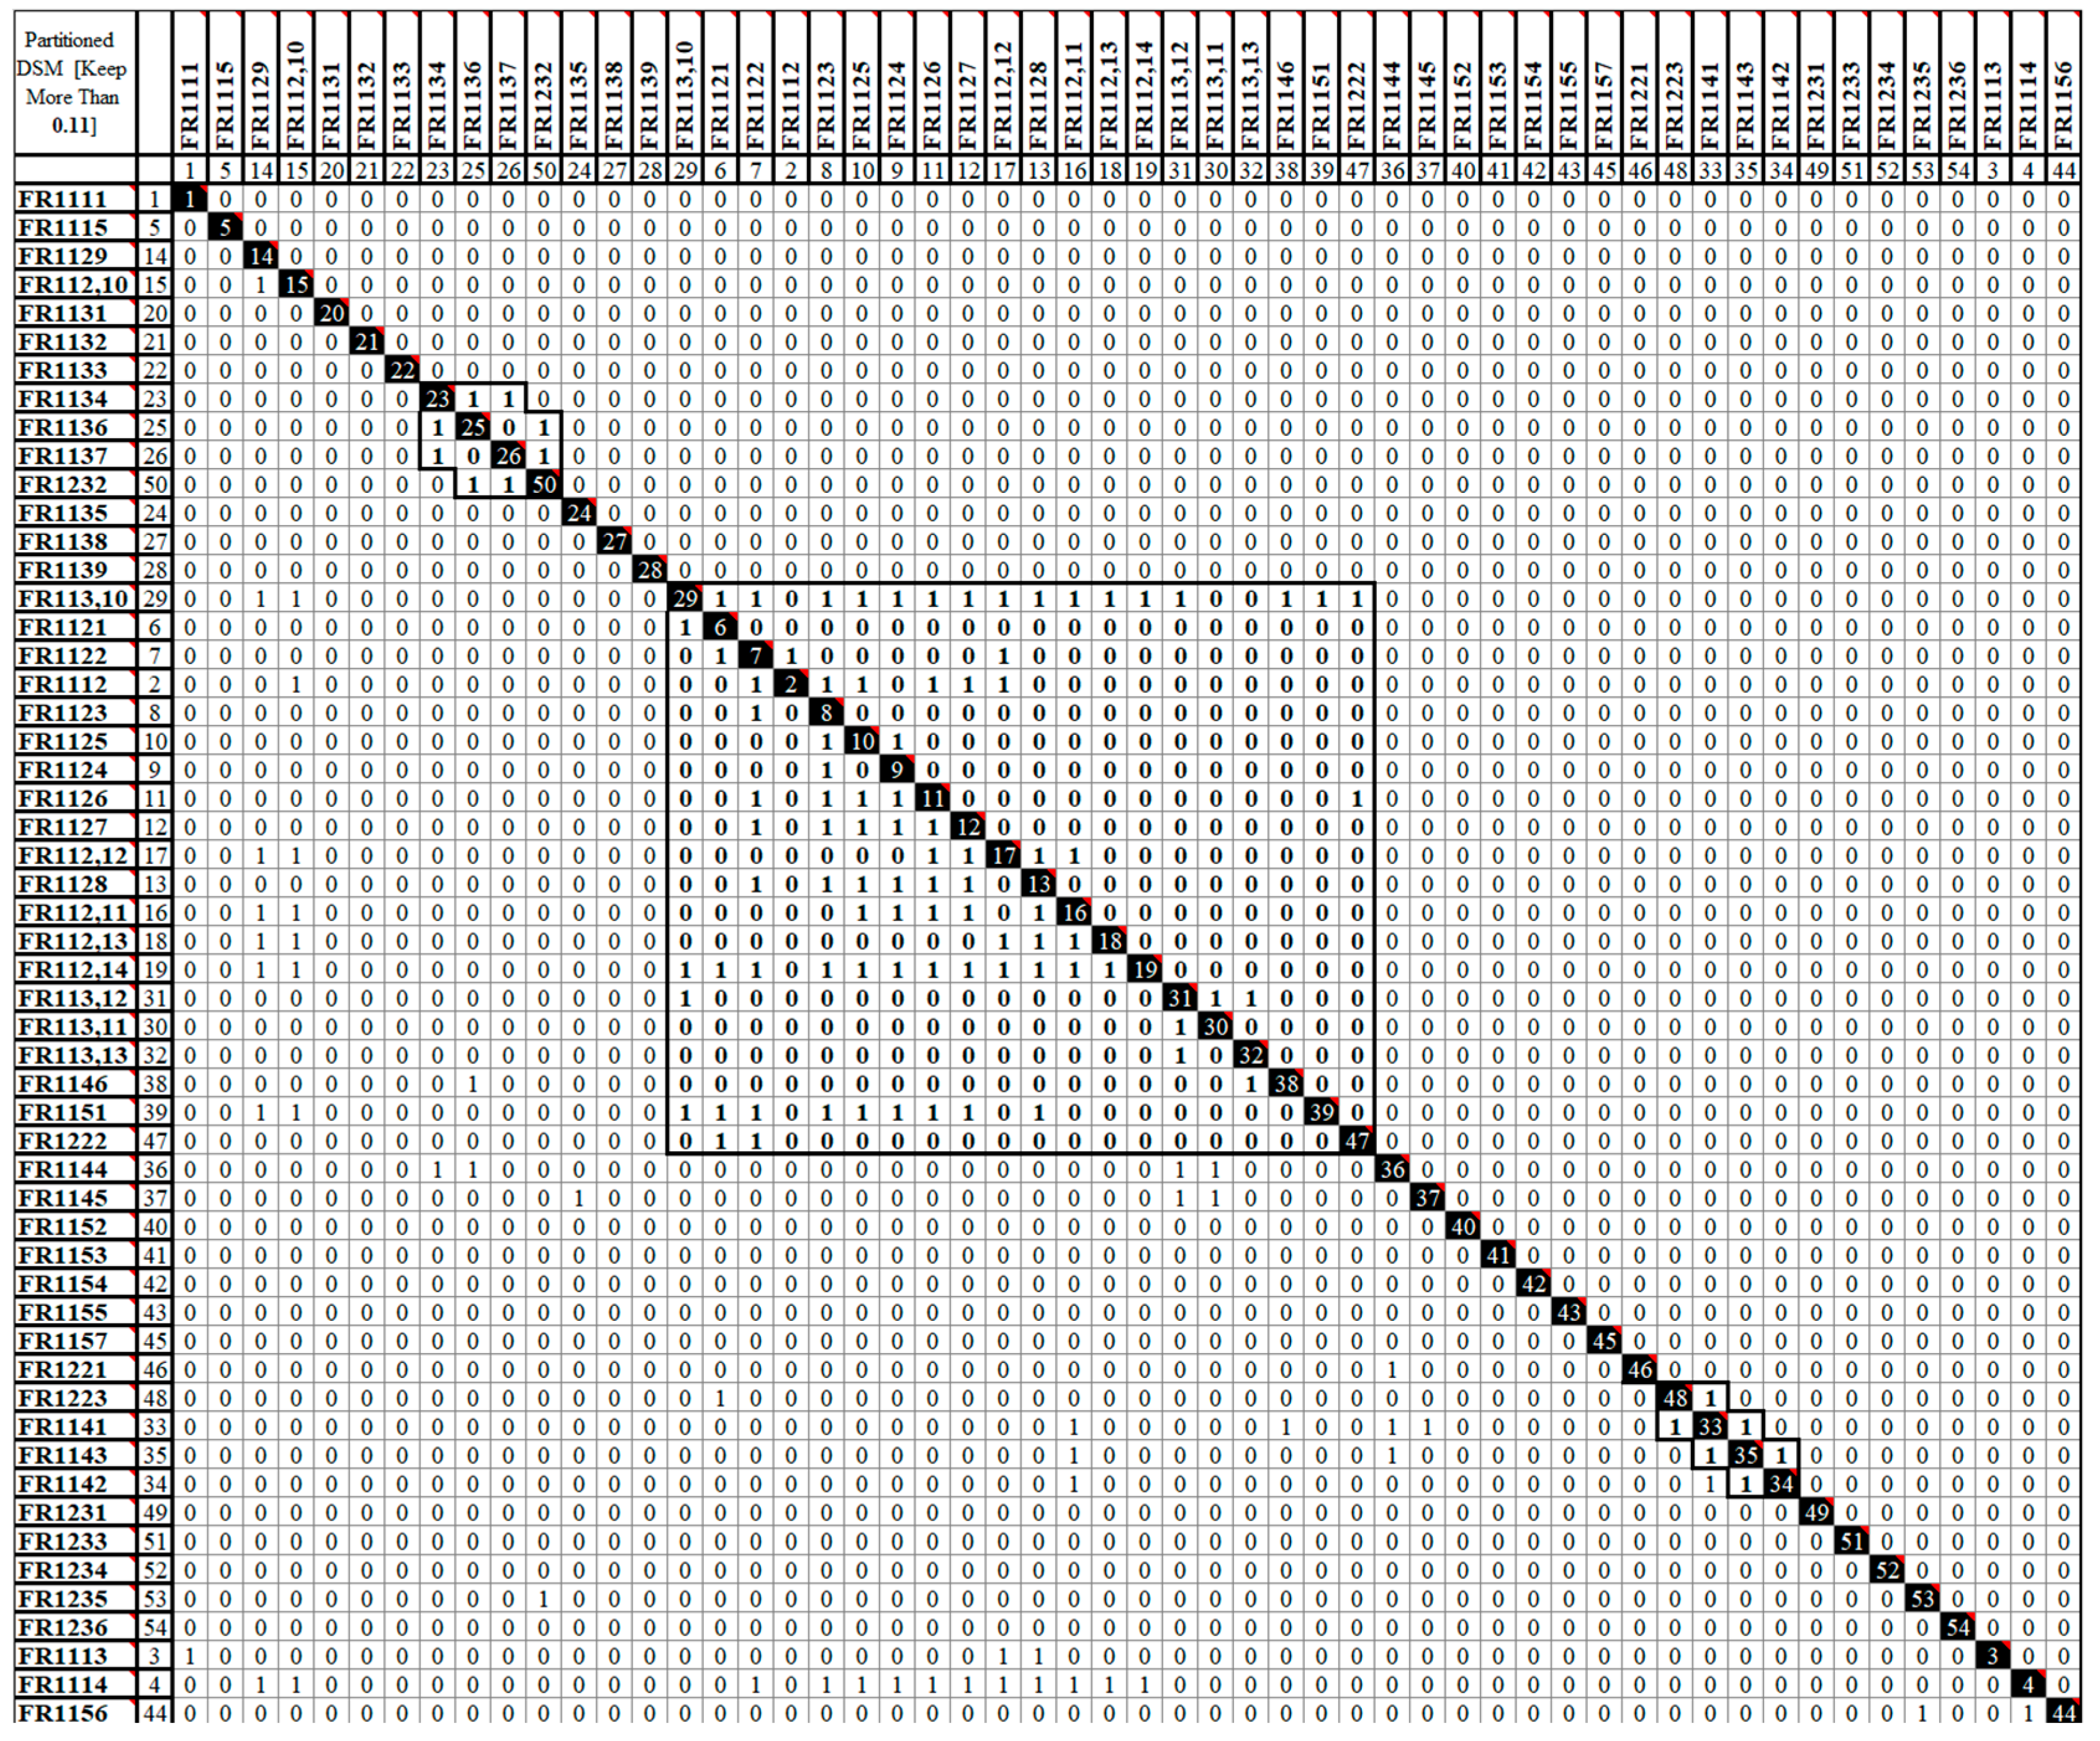
Exhibit 21.
Developing a modular design for the SOI architecture with a cutting-point set at 0.12 (Design III)
Exhibit 21.
Developing a modular design for the SOI architecture with a cutting-point set at 0.12 (Design III)
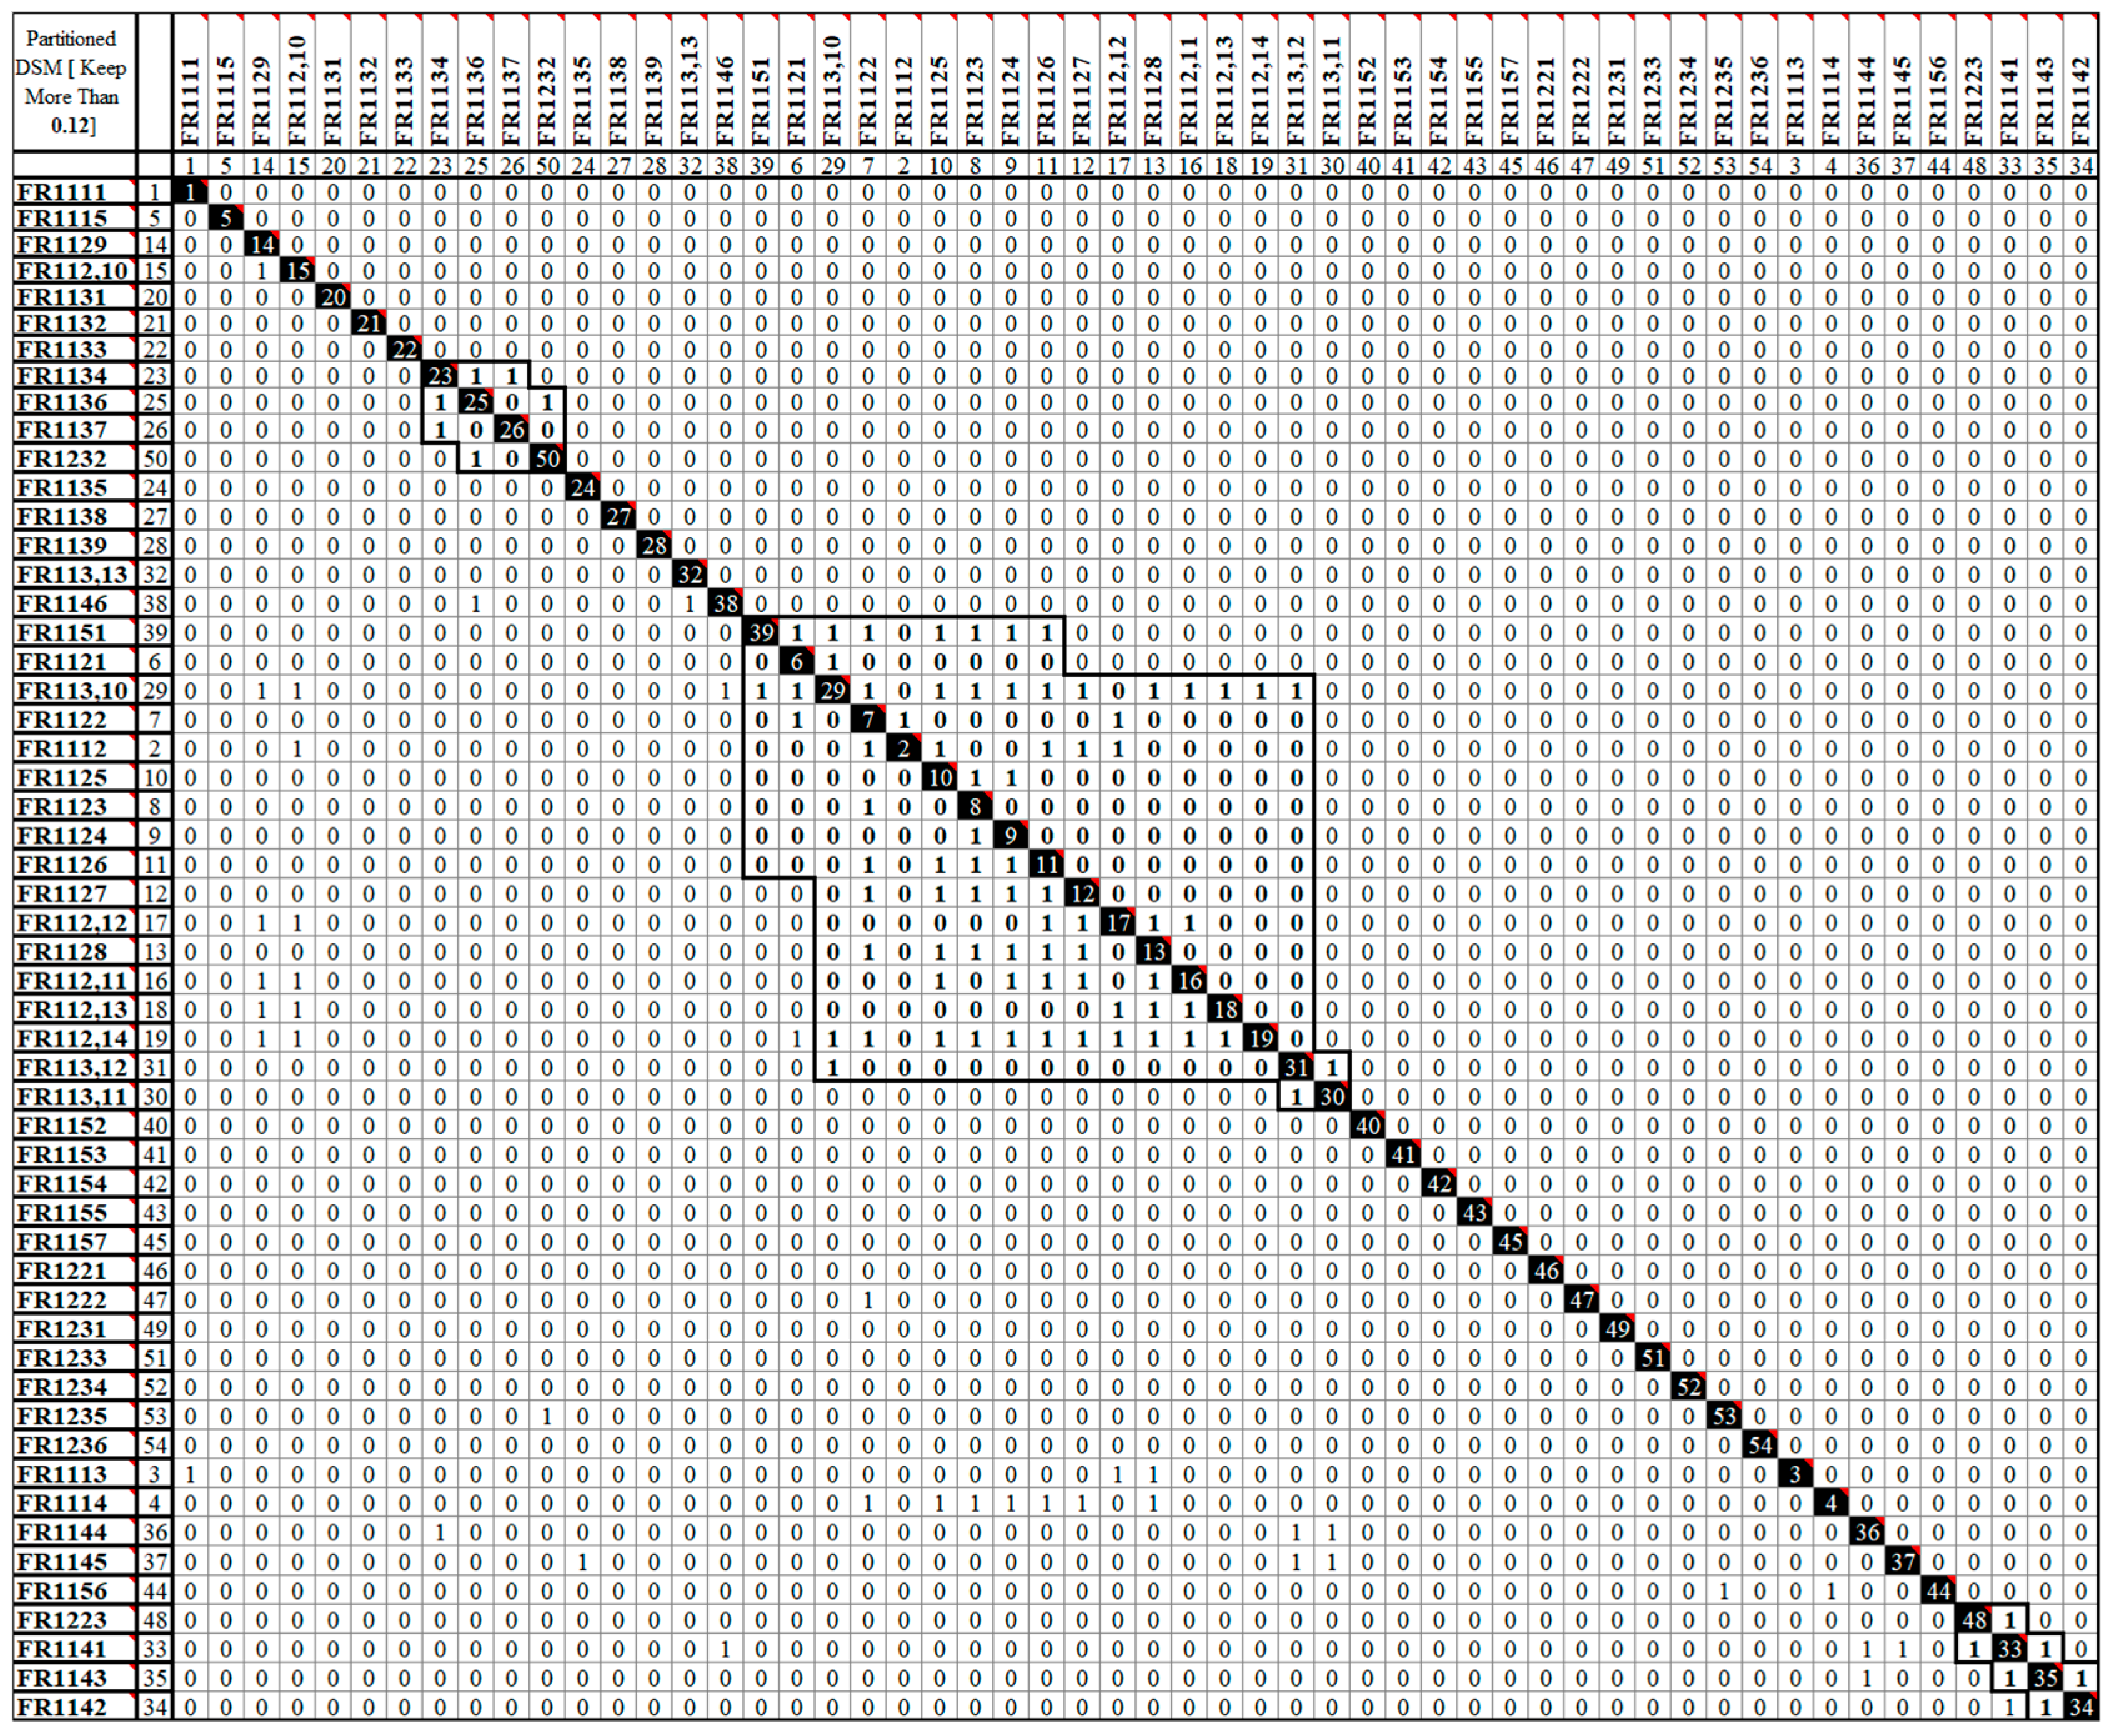
Exhibit 22.
Developing a modular design for the SOI architecture with a cutting-point set at 0.13 (Design IV).
Exhibit 22.
Developing a modular design for the SOI architecture with a cutting-point set at 0.13 (Design IV).
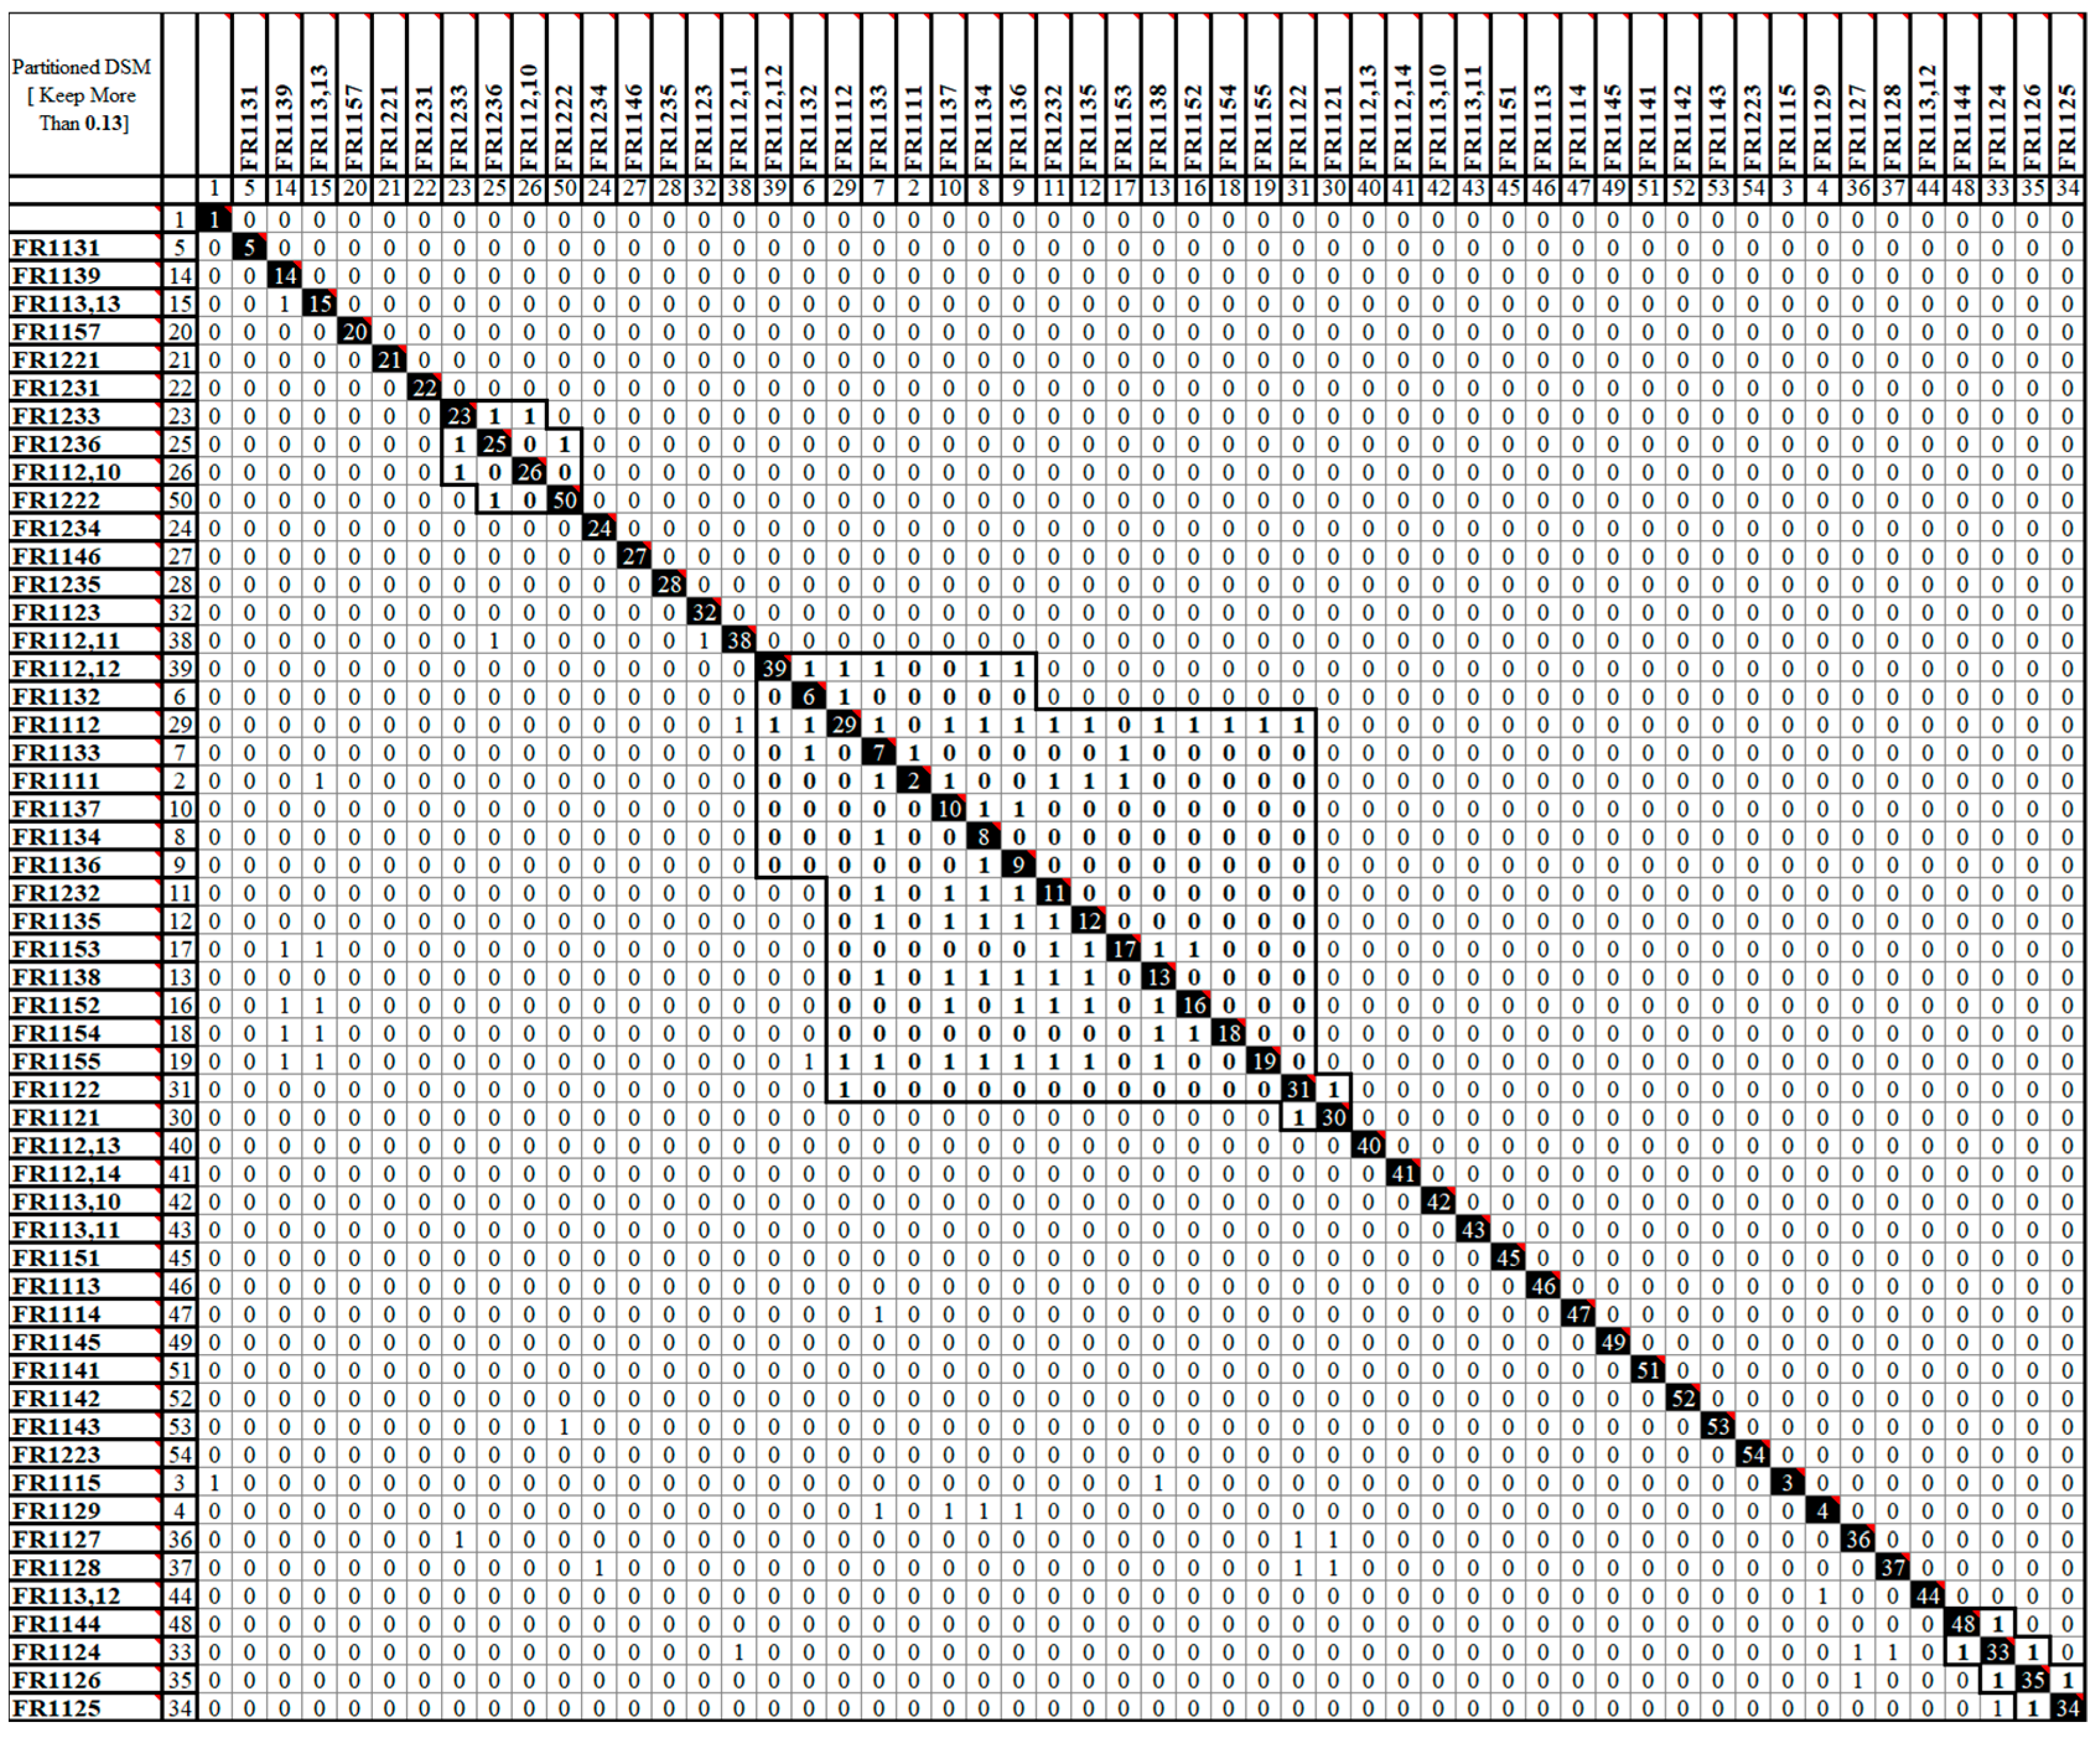
Exhibit 23.
Developing a modular design for the SOI architecture with a cutting-point set at 0.14 (Design V).
Exhibit 23.
Developing a modular design for the SOI architecture with a cutting-point set at 0.14 (Design V).
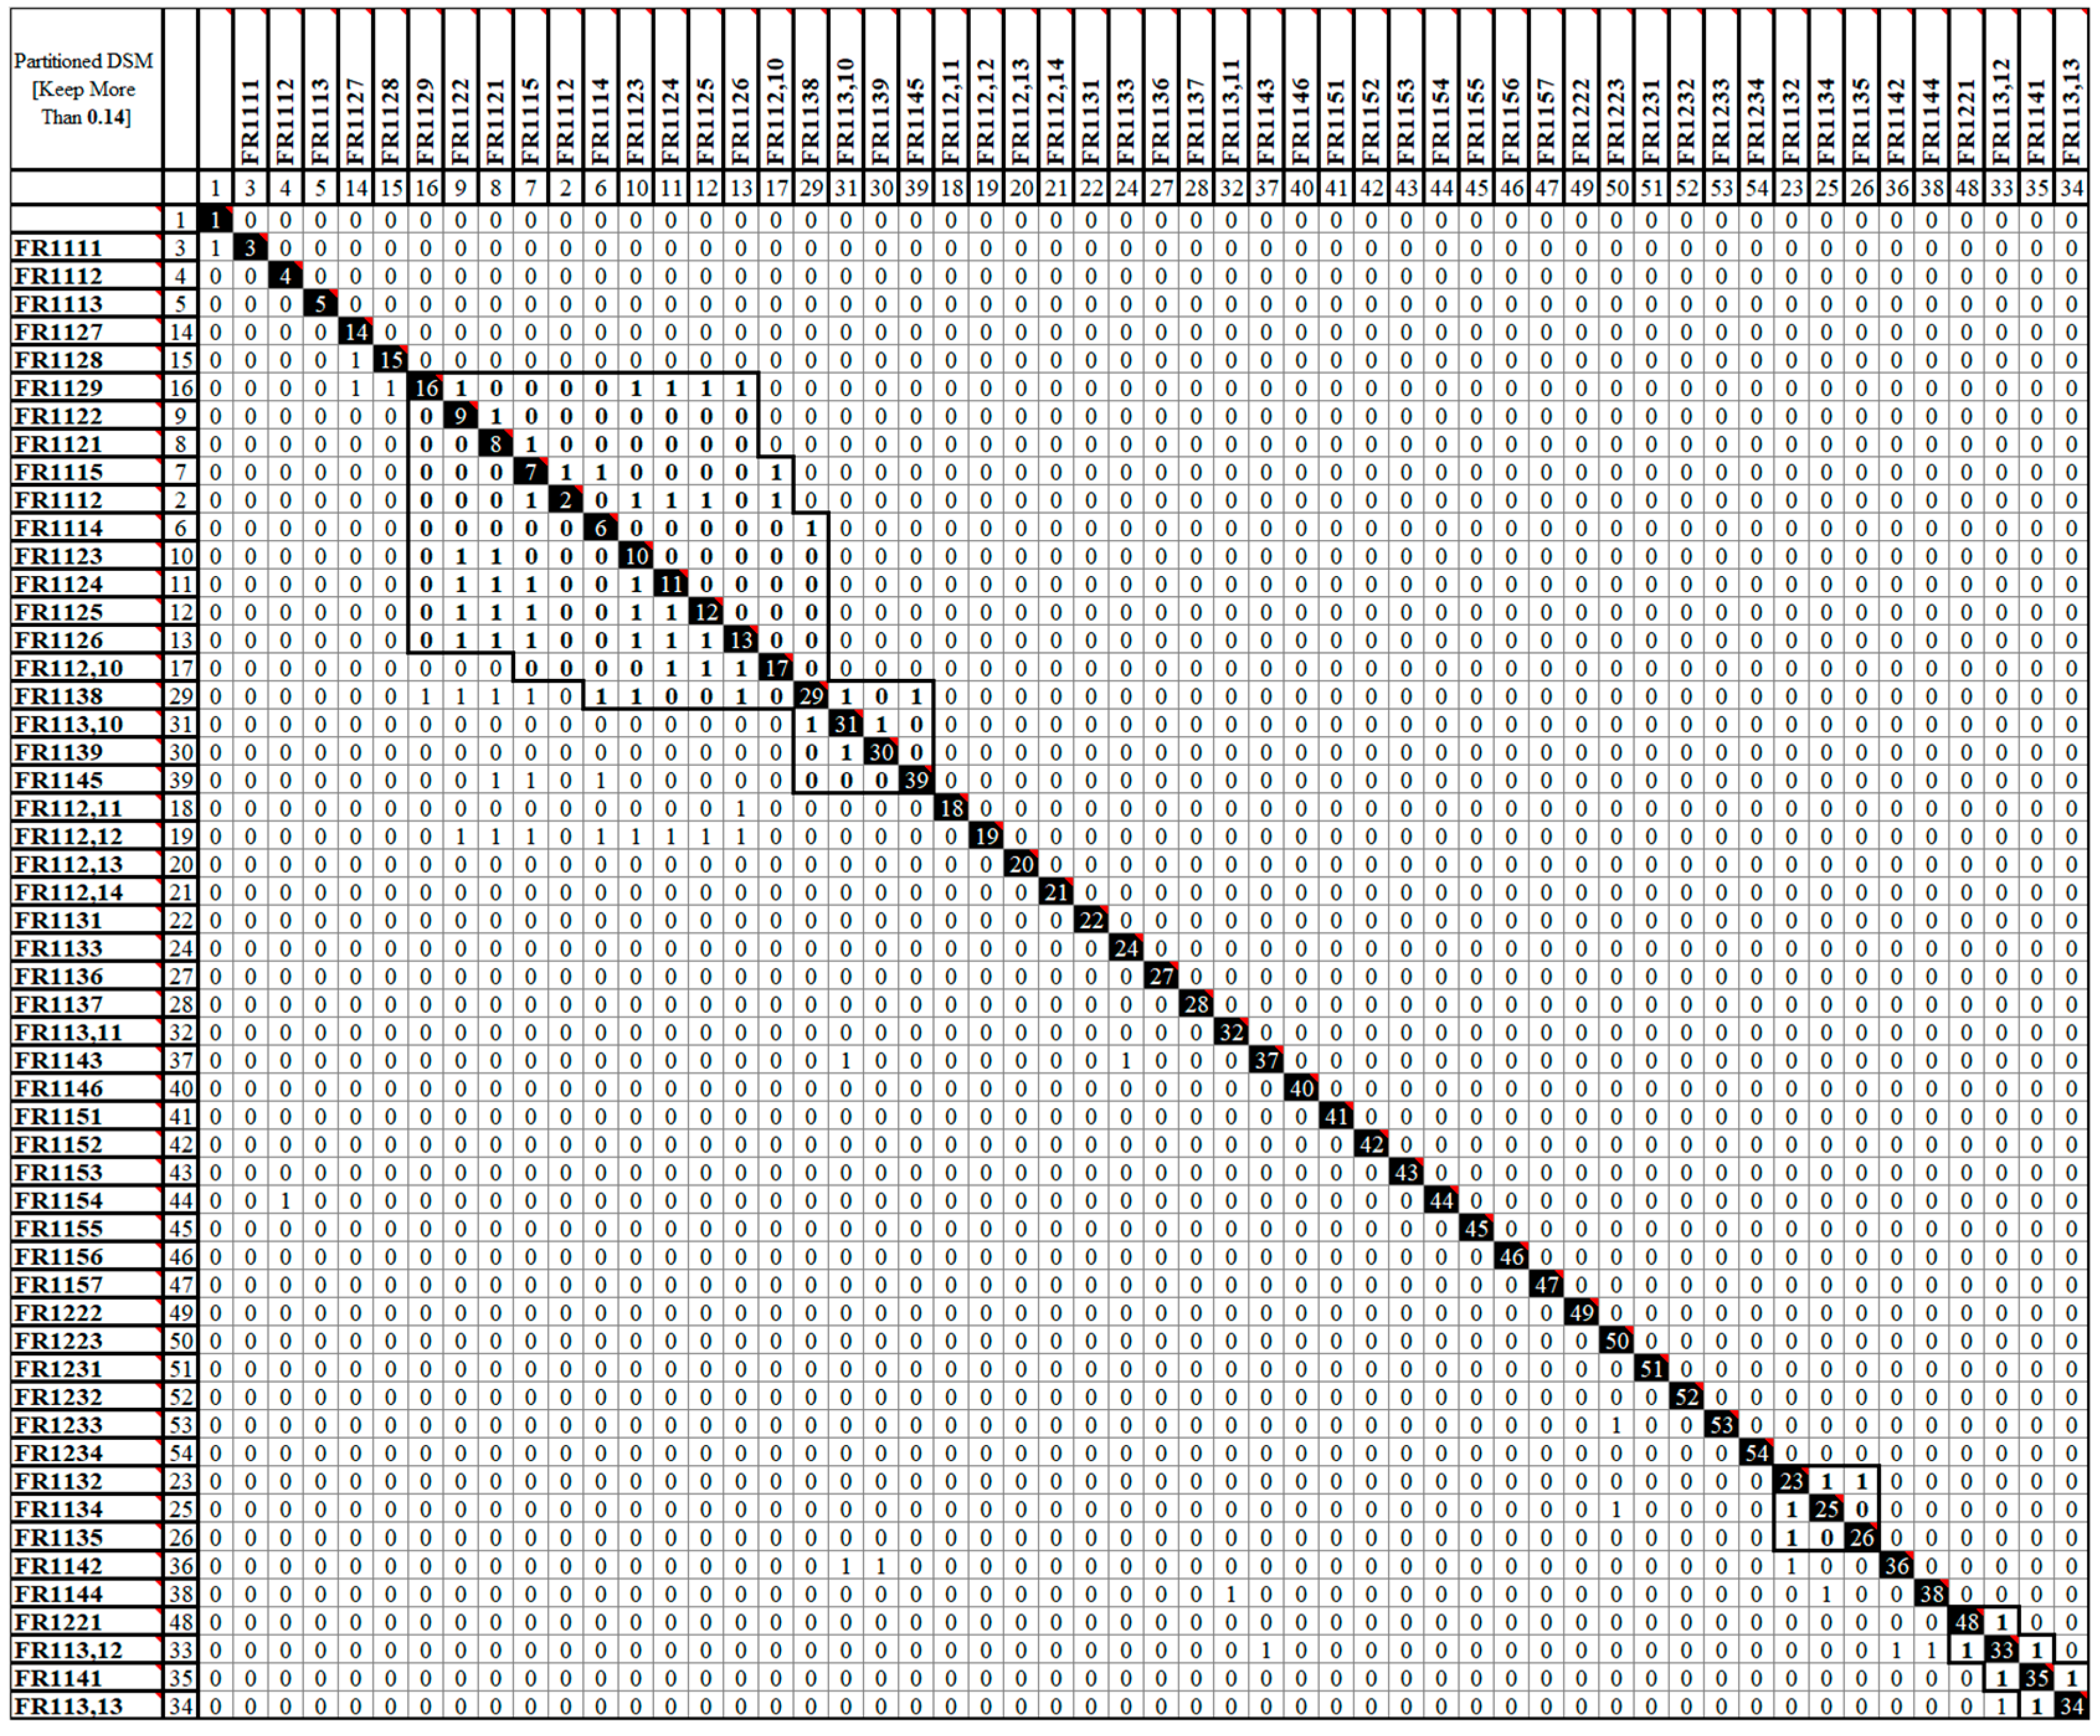
Exhibit 24.
Developing a modular design for the SOI architecture with a cutting-point set at 0.15 (Design VI).
Exhibit 24.
Developing a modular design for the SOI architecture with a cutting-point set at 0.15 (Design VI).
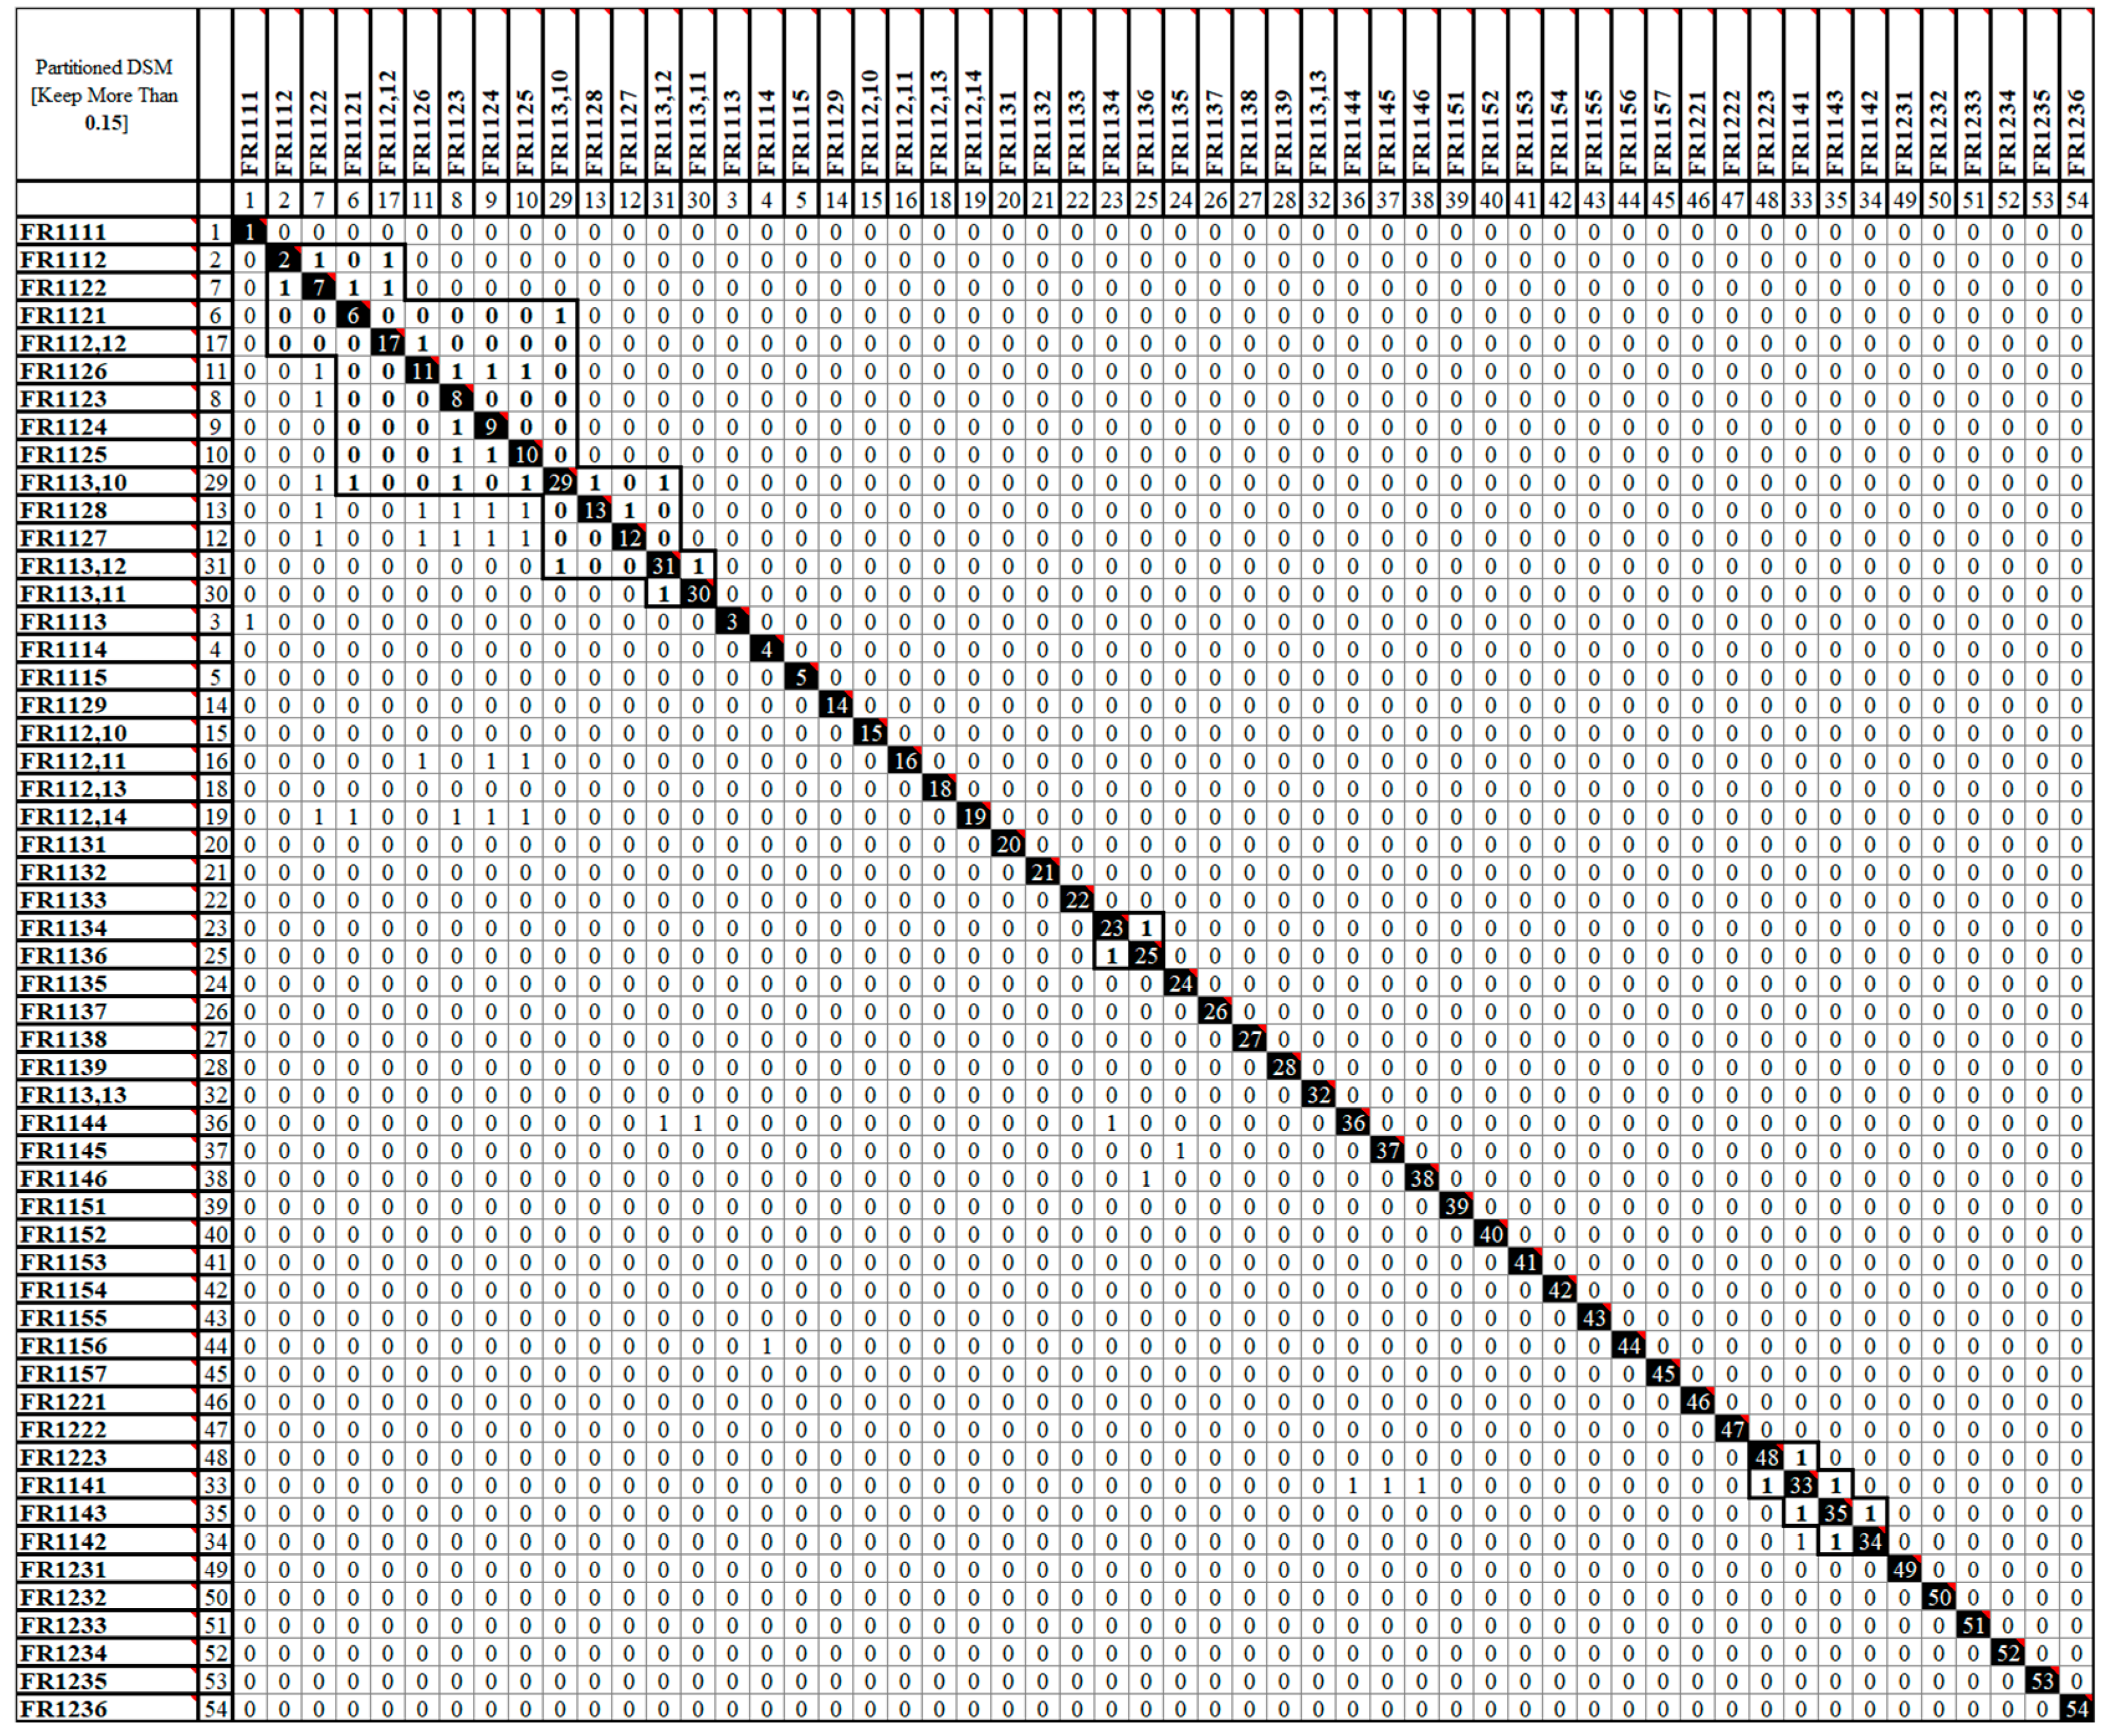
Exhibit 25 presents all the fundamental information (i.e., N1-N4) necessary for computing the criteria, introduced in section 2.3.2, used to measure the architecture modularity;
Exhibit 25.
Fundamental details regarding the introduced measures of modularity.
| Ns Designs |
N1 | N2 | N3 | N4 |
|---|---|---|---|---|
| Design I | 131 | 499 | 2226 | 60 |
| Design II | 101 | 295 | 2469 | 51 |
| Design III | 86 | 144 | 2645 | 41 |
| Design IV | 80 | 146 | 2656 | 34 |
| Design V | 54 | 86 | 2742 | 34 |
| Design VI | 30 | 44 | 2810 | 32 |
Using the information provided in Exhibit 25, Exhibit 26 compares the modularity of all six presented designs (i.e., Designs I-VI). Based on the applied criteria, it is concluded that 'Design VI' for the functional architecture of the SOI exhibits the highest modularity. Therefore, in terms of modularity, this specific design is considered the most optimal for the architecture. Notably, 'Design VI' introduces a new sequence to enhance the architecture while effectively removing significant coupling;
Exhibit 26.
Assessing the degree of modularity for Designs I through VI.
| Presented Designs | Modularity Measures | ||||
| Grouping Capability Index (GCI) | Grouping Efficacy | Grouping Efficiency | Utilization Rate (U) | ||
| Design I | 0.68 | -0.42 | 0.60 | 0.21 | |
| Design II | 0.66 | -0.71 | 0.62 | 0.25 | |
| Design III | 0.68 | -5.05 | 0.68 | 0.37 | |
| Design IV | 0.70 | -2.50 | 0.67 | 0.35 | |
| Design V | 0.61 | 27.00 | 0.69 | 0.38 | |
| Design VI | 0.48 | 26.67 | 0.70 | 0.40 | |
Exhibits 27a-27d display the scores of each design concerning the modularity measures utilized in Exhibit 26.
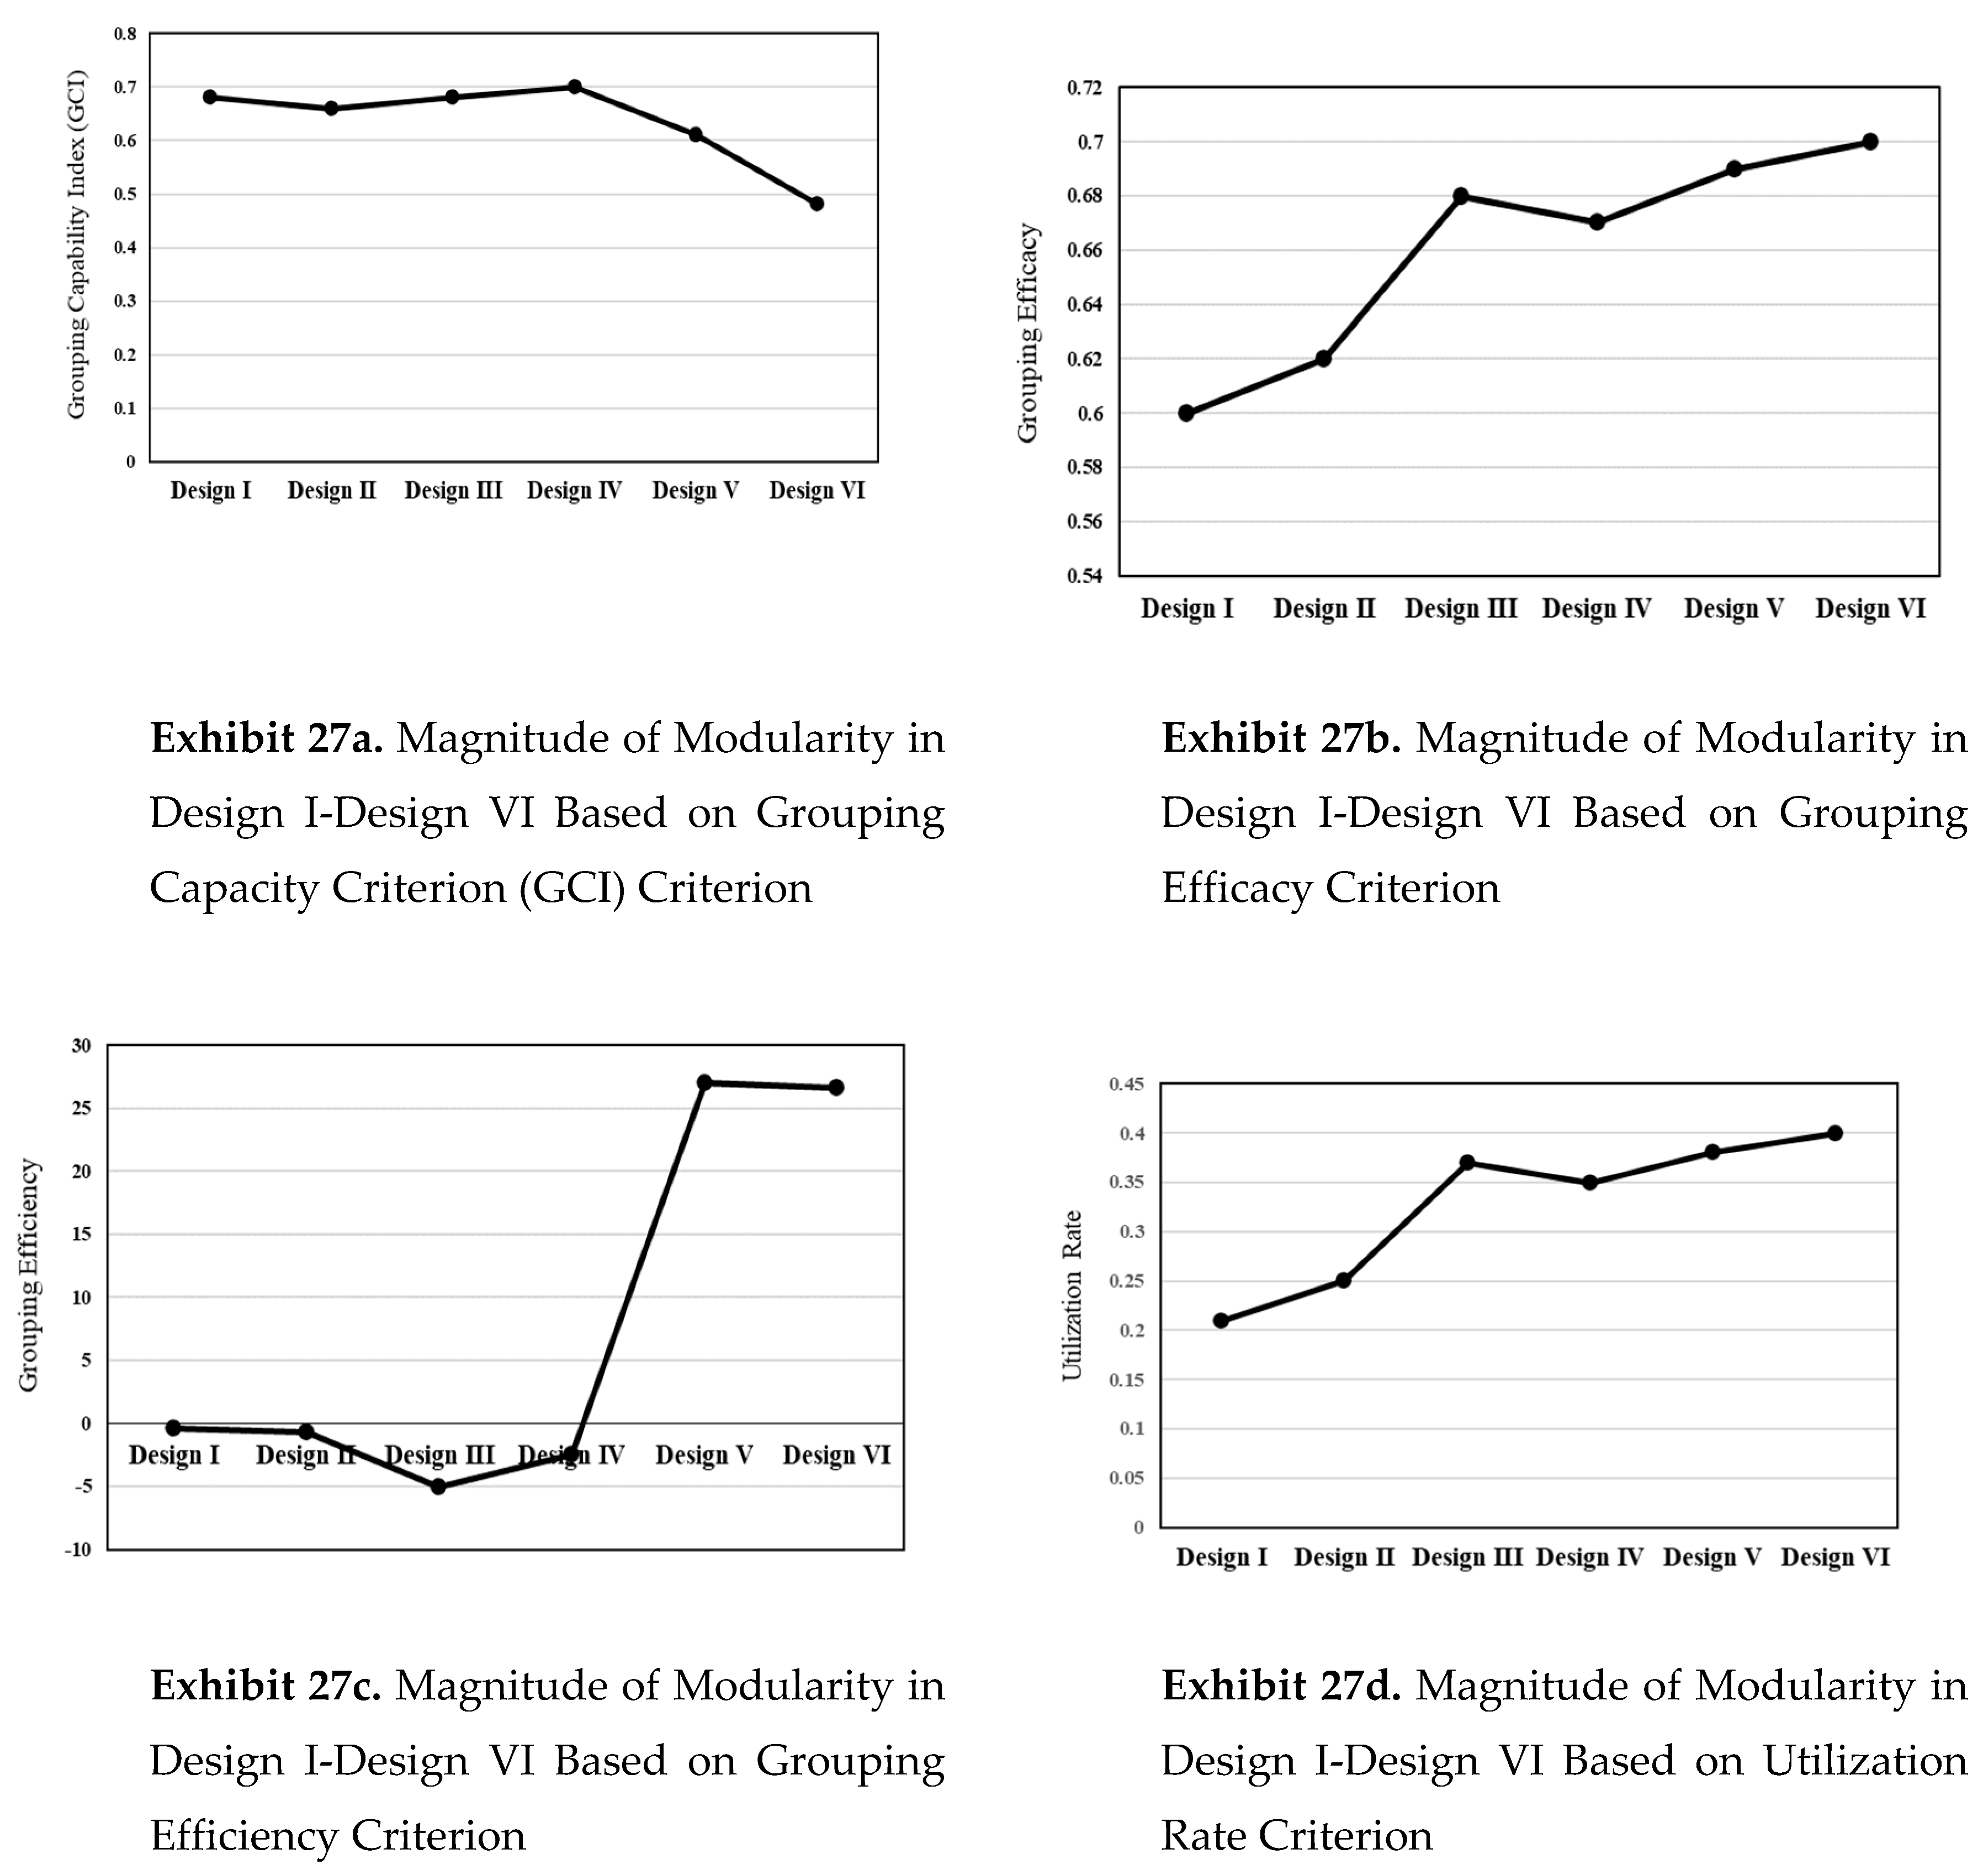
Using the modularity measure of the 'modularization function,' the thirty-eight hierarchical sub-systems are compared based on the strength of coupling within the involved modules (Exhibit 28). The modules included in this analysis are referred to as the unique components of the modularization function.;
Based on Exhibit 28, the SOI in the best design for the physical architecture is optimally organized into thirty-eight hierarchical subsystems. The achieved modularity for the functional architecture of the SOI is considered acceptable.
Exhibit 28.
Reorganizing the functional architecture into 38 hierarchical sub-systems, inspired by 'Design VI'
Exhibit 28.
Reorganizing the functional architecture into 38 hierarchical sub-systems, inspired by 'Design VI'
| Modules | Components | Number of Interfaces within Module | ) | Number of Interfaces within Sub-System | ||
|---|---|---|---|---|---|---|
| Sub-System1 | M1 | FR1111 | 0 | 0 | 0 | 0 |
| Sub-System2 | M2 | FR1112 | 13 | 13 | 0 | 0 |
| FR1122 | 0 | 0 | ||||
| FR1121 | ||||||
| FR112,12 | ||||||
| FR1126 | ||||||
| FR1123 | ||||||
| FR1124 | ||||||
| FR1125 | ||||||
| FR113,10 | ||||||
| FR1128 | ||||||
| FR1127 | ||||||
| FR113,12 | ||||||
| FR113,11 | ||||||
| Sub- System3 | M3 | FR1113 | 0 | 0 | 0 | 0 |
| Sub- System4 | M4 | FR1114 | 0 | 0 | 0 | 0 |
| Sub-System5 | M5 | FR1115 | 0 | 0 | 0 | 0 |
| Sub- System6 | M6 | FR1129 | 0 | 0 | 0 | 0 |
| Sub-System7 | M7 | FR112,10 | 0 | 0 | 0 | 0 |
| Sub- System8 | M8 | FR112,11 | 0 | 0 | 0 | 0 |
| Sub-System9 | M9 | FR112,13 | 0 | 0 | 0 | 0 |
| Sub- System10 | M10 | FR112,14 | 0 | 0 | 0 | 0 |
| Sub-System11 | M11 | FR1131 | 0 | 0 | 0 | 0 |
| Sub- System12 | M12 | FR1132 | 0 | 0 | 0 | 0 |
| Sub-System13 | M13 | FR1133 | 0 | 0 | 0 | 0 |
| Sub- System14 | M14 | FR1134 | 1 | 1 | 0 | 0 |
| FR1136 | ||||||
| Sub- System15 | M15 | FR1135 | 0 | 0 | 0 | 0 |
| Sub-System16 | M16 | FR1137 | 0 | 0 | 0 | 0 |
| Sub- System17 | M17 | FR1138 | 0 | 0 | 0 | 0 |
| Sub-System18 | M18 | FR1139 | 0 | 0 | 0 | 0 |
| Sub- System19 | M19 | FR113,13 | 0 | 0 | 0 | 0 |
| Sub-System20 | M20 | FR1144 | 0 | 0 | 0 | 0 |
| Sub- System21 | M21 | FR1145 | 0 | 0 | 0 | 0 |
| Sub- System22 | M22 | FR1146 | 0 | 0 | 0 | 0 |
| Sub-System23 | M23 | FR1151 | 0 | 0 | 0 | 0 |
| Sub- System24 | M24 | FR1152 | 0 | 0 | 0 | 0 |
| Sub-System25 | M25 | FR1153 | 0 | 0 | 0 | 0 |
| Sub- System26 | M26 | FR1154 | 0 | 0 | 0 | 0 |
| Sub-System27 | M27 | FR1155 | 0 | 0 | 0 | 0 |
| Sub- System28 | M28 | FR1156 | 0 | 0 | 0 | 0 |
| Sub-System29 | M29 | FR1157 | 0 | 0 | 0 | 0 |
| Sub- System30 | M30 | FR1221 | 0 | 0 | 0 | 0 |
| Sub-System31 | M31 | FR1222 | 0 | 0 | 0 | 0 |
| Sub-System32 | M32 | FR1223 | 3 | 3 | 0 | 0 |
| FR1141 | ||||||
| FR1143 | ||||||
| FR1142 | ||||||
| Sub-System33 | M33 | FR1231 | 0 | 0 | 0 | 0 |
| Sub-System34 | M34 | FR1232 | 0 | 0 | 0 | 0 |
| Sub-System35 | M35 | FR1233 | 0 | 0 | 0 | 0 |
| Sub-System36 | M36 | FR1234 | 0 | 0 | 0 | 0 |
| Sub-System37 | M37 | FR1235 | 0 | 0 | 0 | 0 |
| Sub-System38 | M38 | FR1236 | 0 | 0 | 0 | 0 |
Regarding the optimal design VI, it is crucial to mention that among all developed subsystems (i.e., subsystems 1-38), subsystem2, subsystem32, and subsystem14 are particularly susceptible to any adjustments due to the presence of coupled elements. For these subsystems, additional techniques like the 'tearing technique' may prove more helpful if all the necessary information for making required assumptions is available.
4.5. Optimal Modularized Design Properties for SOI Functional Architecture and Its Robust Contribution
Through the development of the optimal modular design for the functional architecture of the SOI, the following properties have been achieved:
- The information flow in the optimal design for the functional architecture follows a top-down approach, where elements placed at a higher priority require little to no information from other elements, while elements at a lower priority may require more information.
- The information flow in the optimal design is optimally organized into thirty-eight hierarchical subsystems, ensuring that all necessary information to fulfill the architecture and adapt to new situations is readily available.
- The information flow in the optimal design is now clearer, simpler, more agile, and more traceable.
- The achieved modularity in the architecture provides numerous possibilities for robustness. Among the presented subsystems (i.e., subsystems 1-38), many places can be easily identified and adjusted to enhance the architecture's robustness in response to new situations.
- The optimal design highlights places in the architecture where modifications are challenging due to the presence of coupled elements. These places are susceptible to any change or modification, and as a result, they remain unchanged in all possible architectures achieved through adaptation operations. These places are referred to as common platforms.
4.6. Investigating Functional Architecture Robustness and Optimal Design Selection
According to steps 7-10 of the proposed methodology, a simulation study aimed at assessing the robustness of the modularized architecture is conducted, encompassing Designs I to VI. This analysis entails evaluating the capacity of each design to withstand varying levels of complexity, which is indicative of the information content that can be accommodated by each architectural element. The outcomes of this evaluation are outlined in Exhibit 29 and Exhibit 30.
Exhibit 29 provides an in-depth examination of the functional integration within the System of Interest (SOI), yielding insights into the cohesive functioning of its constituent components. This analysis facilitates the comprehension of the restorative or adaptive effort necessitated in response to damage or modifications. This observation holds true for both the inherent design and the novel modular configurations embraced by the SOI. Of particular interest is the comparative evaluation illuminated by Exhibit 30. This comparison underscores a discernible dissimilarity between the exigencies of the original design and the alternative modular constructs. A quantitative assessment, quantified in temporal and resource-intensive terms (Bits), reveals a pronounced differential in the demands imposed by the original versus modular design paradigms. This divergence is further elucidated in Exhibit 30, a visual representation that vividly accentuates these variances. Notably, Design VI emerges as a salient exemplar within this analysis, distinctly showcasing its heightened robustness relative to the original design. Exhibit 30 supplements this discernment by delineating the correlation between system resilience and complexity. The graph emphasizes a positive link between simple design and effective problem-solving and robustness. In short, avoiding excessive complexity boosts the system's ability to adeptly handle challenges.
Exhibit 29.
Complexity (work volume) of each SOI element under perturbation (Designs I-VI).
| Elements of System Architecture | Design I | Design II | Design III | Design IV | Design V | Design VI |
|---|---|---|---|---|---|---|
| FR1111 | 6.49 | 4.57 | 2.52 | 2.43 | 1.92 | 1.19 |
| FR1112 | 5.18 | 4.74 | 2.99 | 2.01 | 1.98 | 1.19 |
| FR1113 | 5.33 | 3.38 | 3.21 | 2.36 | 1.93 | 1.24 |
| FR1114 | 6.38 | 4.87 | 3.11 | 2.41 | 1.73 | 1.19 |
| FR1115 | 6.38 | 4.44 | 3.02 | 2.31 | 1.83 | 1.18 |
| FR1121 | 9.79 | 4.54 | 2.67 | 2.18 | 1.89 | 1.24 |
| FR1122 | 9.77 | 3.45 | 2.83 | 2.17 | 1.87 | 1.24 |
| FR1123 | 5.54 | 3.8 | 2.77 | 2.01 | 1.77 | 1.24 |
| FR1124 | 7.78 | 3.42 | 2.57 | 2.03 | 1.68 | 1.2 |
| FR1125 | 7.74 | 3.81 | 2.85 | 2.33 | 1.78 | 1.2 |
| FR1126 | 5.25 | 4.42 | 3.04 | 2.09 | 1.7 | 1.22 |
| FR1127 | 8.56 | 3.53 | 2.73 | 2.03 | 1.83 | 1.23 |
| FR1128 | 6.65 | 4.19 | 3.1 | 2.09 | 1.9 | 1.18 |
| FR1129 | 5.3 | 4.58 | 3.25 | 2.01 | 1.98 | 1.18 |
| FR112,10 | 5.59 | 3.96 | 2.52 | 2.33 | 1.84 | 1.2 |
| FR112,11 | 5.99 | 3.6 | 3.15 | 2.37 | 1.72 | 1.21 |
| FR112,12 | 8.94 | 4.54 | 2.77 | 2.24 | 1.74 | 1.19 |
| FR112,13 | 6.48 | 3.68 | 2.8 | 2.36 | 1.81 | 1.24 |
| FR112,14 | 5.26 | 4.84 | 2.55 | 2.21 | 1.71 | 1.22 |
| FR1131 | 5.36 | 4.06 | 2.95 | 2.3 | 1.87 | 1.19 |
| FR1132 | 5.41 | 4.47 | 3.13 | 2.11 | 1.7 | 1.18 |
| FR1133 | 5.31 | 3.47 | 2.9 | 2.13 | 1.71 | 1.2 |
| FR1134 | 9.04 | 3.66 | 2.71 | 2 | 1.81 | 1.19 |
| FR1135 | 6.38 | 4.29 | 2.88 | 2.11 | 1.93 | 1.22 |
| FR1136 | 6.35 | 3.44 | 2.97 | 2.04 | 1.83 | 1.21 |
| FR1137 | 6.61 | 3.41 | 2.75 | 2.19 | 1.68 | 1.19 |
| FR1138 | 6.99 | 3.53 | 2.77 | 2.17 | 1.75 | 1.2 |
| FR1139 | 5.25 | 4.09 | 2.73 | 2.2 | 1.75 | 1.24 |
| FR113,10 | 7.47 | 3.54 | 3.32 | 2.41 | 1.91 | 1.23 |
| FR113,11 | 6.17 | 3.64 | 2.98 | 2.09 | 1.94 | 1.2 |
| FR113,12 | 5.93 | 4.9 | 2.92 | 2.15 | 1.95 | 1.19 |
| FR113,13 | 7.98 | 3.97 | 2.52 | 2.03 | 1.88 | 1.22 |
| FR1141 | 8.94 | 4.26 | 3.3 | 2.46 | 1.92 | 1.24 |
| FR1142 | 5.85 | 3.51 | 3.03 | 2.27 | 1.75 | 1.18 |
| FR1143 | 6.84 | 4.2 | 2.67 | 2.28 | 1.95 | 1.19 |
| FR1144 | 7.13 | 3.44 | 2.51 | 2.06 | 1.95 | 1.24 |
| FR1145 | 5.73 | 3.34 | 2.62 | 2.31 | 1.81 | 1.23 |
| FR1146 | 9.2 | 3.77 | 2.83 | 2.06 | 1.77 | 1.23 |
| FR1151 | 8.47 | 4.28 | 2.75 | 2.1 | 1.89 | 1.18 |
| FR1152 | 6.91 | 3.94 | 2.72 | 2.17 | 1.73 | 1.23 |
| FR1153 | 8.97 | 3.72 | 2.75 | 2.03 | 1.71 | 1.23 |
| FR1154 | 9.1 | 3.82 | 3.08 | 2.26 | 1.81 | 1.22 |
| FR1155 | 6.38 | 4.36 | 3.06 | 2.31 | 1.89 | 1.21 |
| FR1156 | 7.33 | 4.16 | 3.07 | 2.12 | 1.73 | 1.22 |
| FR1157 | 7.75 | 4.8 | 2.69 | 2.39 | 1.89 | 1.23 |
| FR1221 | 6.94 | 4.15 | 3.16 | 2.4 | 1.88 | 1.18 |
| FR1222 | 7.89 | 4.16 | 2.77 | 2.34 | 1.73 | 1.2 |
| FR1223 | 9.29 | 3.58 | 2.97 | 2.26 | 1.96 | 1.18 |
| FR1231 | 6.94 | 4.66 | 2.51 | 2.29 | 1.85 | 1.2 |
| FR1232 | 7.02 | 4.97 | 3.06 | 2.48 | 1.97 | 1.21 |
| FR1233 | 9.98 | 4.2 | 3.02 | 2.36 | 1.8 | 1.25 |
| FR1234 | 5.53 | 3.74 | 2.6 | 2.14 | 1.91 | 1.23 |
| FR1235 | 8.84 | 4.69 | 3.09 | 2.17 | 1.97 | 1.22 |
| FR1236 | 6 | 3.7 | 3.32 | 2.24 | 1.77 | 1.2 |
Upon close examination of Exhibit 30, Design VI emerges as the optimal candidate among the array of six distinct modular designs. Notably, Design VI exhibits a pronounced proclivity for effectively navigating challenging scenarios. This proclivity underscores its pre-eminence within the spectrum of designs under scrutiny, particularly in comparison to the original design.
Exhibit 30.
Comparison of robustness factor of each system element among the Designs I–VI.
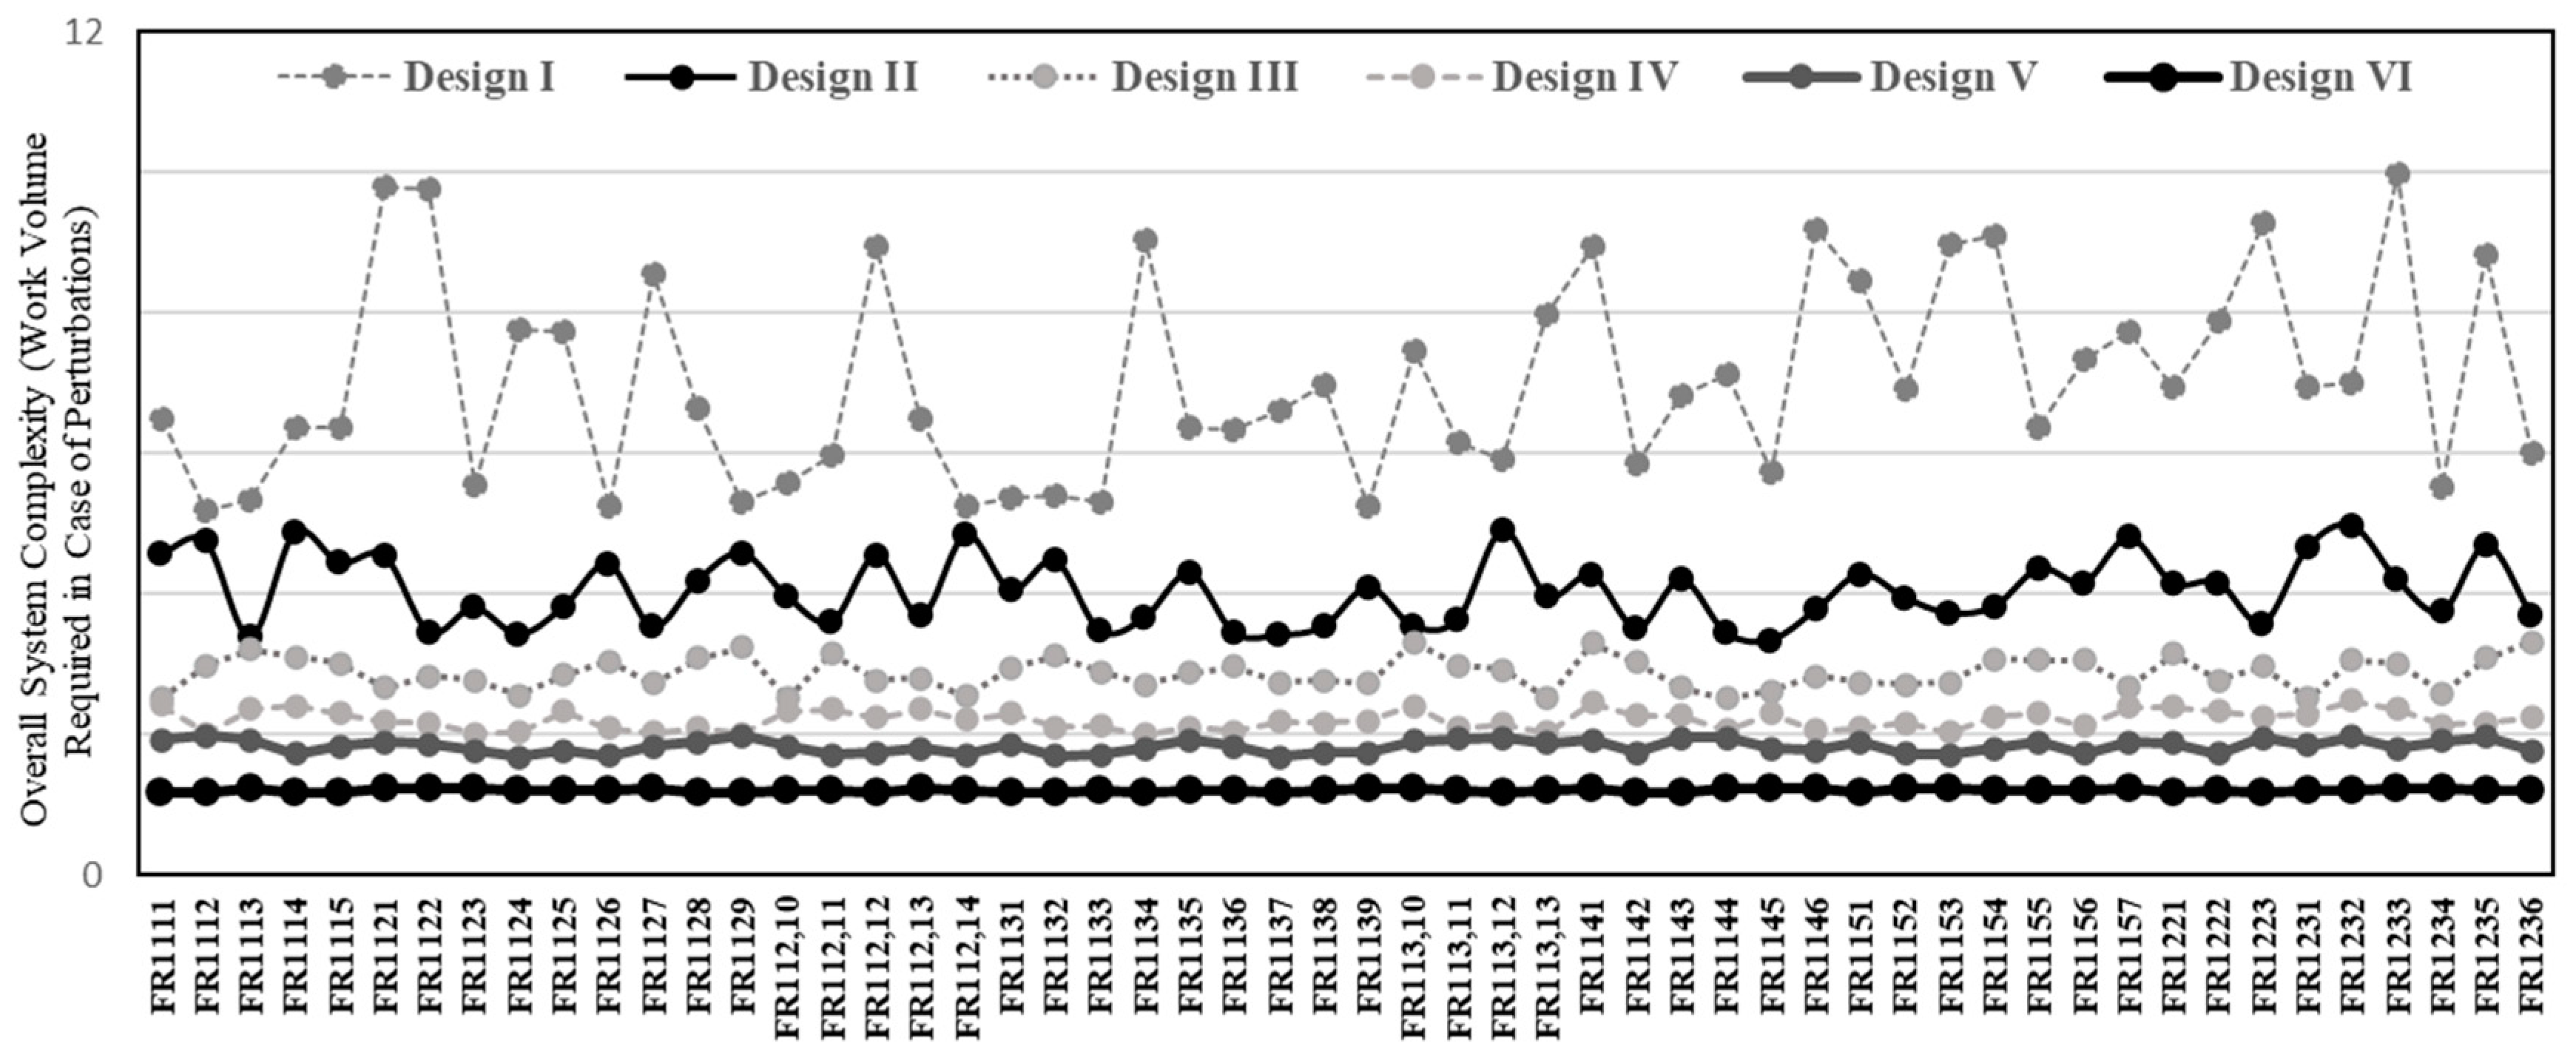
Analogous to a formidable sentinel within the realm of design configurations, Design VI assumes the role of an architectural vanguard. Its singular aptitude lies in the augmentation of the System of Interest's (SOI) structural robustness and stability. Evidently, this revelation signifies Design VI's unique potential to substantially elevate the quality of the SOI's system architecture, thereby endowing it with a heightened capacity to navigate exigent circumstances.
Exhibit 30 provides empirical support for this observation, wherein the comparative assessment of robustness operations across all six modular designs showcases Design VI as being intrinsically associated with the most modest complexities. This distinct trait bestows upon modularized Design VI a superior capability in effectuating robustness operations within the broader system architecture of the SOI. This assertion holds particularly true when juxtaposed against the original SOI design, further validating Design VI's exceptional competence in orchestrating structural fortitude amidst deviations from anticipated circumstances.
5. Discussion and Conclusion
In this study, we addressed the challenges faced by manufacturing processes in dynamic environments characterized by rapid changes, uncertainties, risks, and uncontrollable fluctuations. Our objective was to enhance the overall robustness of manufacturing processes through an innovative approach that integrates engineering management principles and modular design. By adopting a systems engineering perspective, we treated all manufacturing process activities as interrelated elements of an integrated system, aiming to prevent the spread of risks and disruptions among various processes.
Our research revealed a profound relationship between manufacturing management and engineering management. Manufacturing management plays a pivotal role in overseeing resource allocation, decision-making processes, and the overall organizational strategy for effective operations. Inefficient manufacturing management can lead to suboptimal use of resources, delays in production schedules, and reduced productivity, negatively impacting engineering management. On the other hand, effective manufacturing management systems can optimize resource allocation, streamline decision-making processes, and result in improved production processes and increased efficiency in utilizing technical personnel and physical resources.
Engineering management, in turn, is responsible for overseeing the design, development, and improvement of manufacturing processes. The effectiveness of engineering management systems, including quality control and continuous improvement programs, relies on the underlying architecture of manufacturing. A well-designed manufacturing process architecture is crucial in minimizing the likelihood of operational risks and their potential impact on manufacturing processes.
Our findings showcased a significant improvement in modularization, leading to enhanced overall robustness in manufacturing processes. This highlights the importance of engineering management's proactive involvement in the design phase of manufacturing processes. By engaging manufacturing experts from the outset, potential production and assembly challenges can be addressed proactively, resulting in an optimized and robust manufacturing process.
Furthermore, our research emphasizes the importance of modularity within the manufacturing process architecture. Considering modularity in the process domain architecture indirectly supports modularity in the allocated architecture, fostering a comprehensive approach that optimizes component allocation within the physical system.
Additionally, we highlighted the significance of redundancy in certain system elements, as it enhances system reliability while preserving modularity. Engineering management's consideration of redundancy offers another avenue to enhance the overall robustness of manufacturing processes.
The successful integration of engineering management principles with modular design strategies introduces new avenues for enhancing robustness and efficiency in manufacturing processes. By proactively engaging engineering management in the design phase and applying our modularization approach, manufacturing organizations can enhance their overall system robustness and improve their capacity to respond to changing circumstances effectively.
Looking ahead, our research calls for further investigations into the interplay between manufacturing management and engineering management. Understanding the dynamics of this relationship will allow organizations to optimize resource allocation and streamline decision-making processes while fostering a culture of collaboration and knowledge exchange between engineering and manufacturing teams.
Moreover, our study opens avenues for future research in the development of comprehensive strategies that address other essential dimensions of manufacturing processes. Studies focused on process legality, reliability, adaptability, and recoverability will contribute to a more comprehensive understanding of resilient manufacturing processes.
Develop a resilience framework for manufacturing processes that encompasses not only robustness but also other dimensions such as flexibility, adaptability, and recoverability. This framework would provide a holistic view of manufacturing process resilience and guide decision-makers in making informed choices to enhance overall system resilience.
Author Contributions
All authors have equally contributed to every aspect of the manuscript.
Conflicts of Interest
The authors have no conflict of interest.
Appendix A
Exhibit A1.
DSM representation of the SOI architecture for cutting point 0.10.

Exhibit A2.
DSM representation of the SOI architecture for cutting point 0.11.
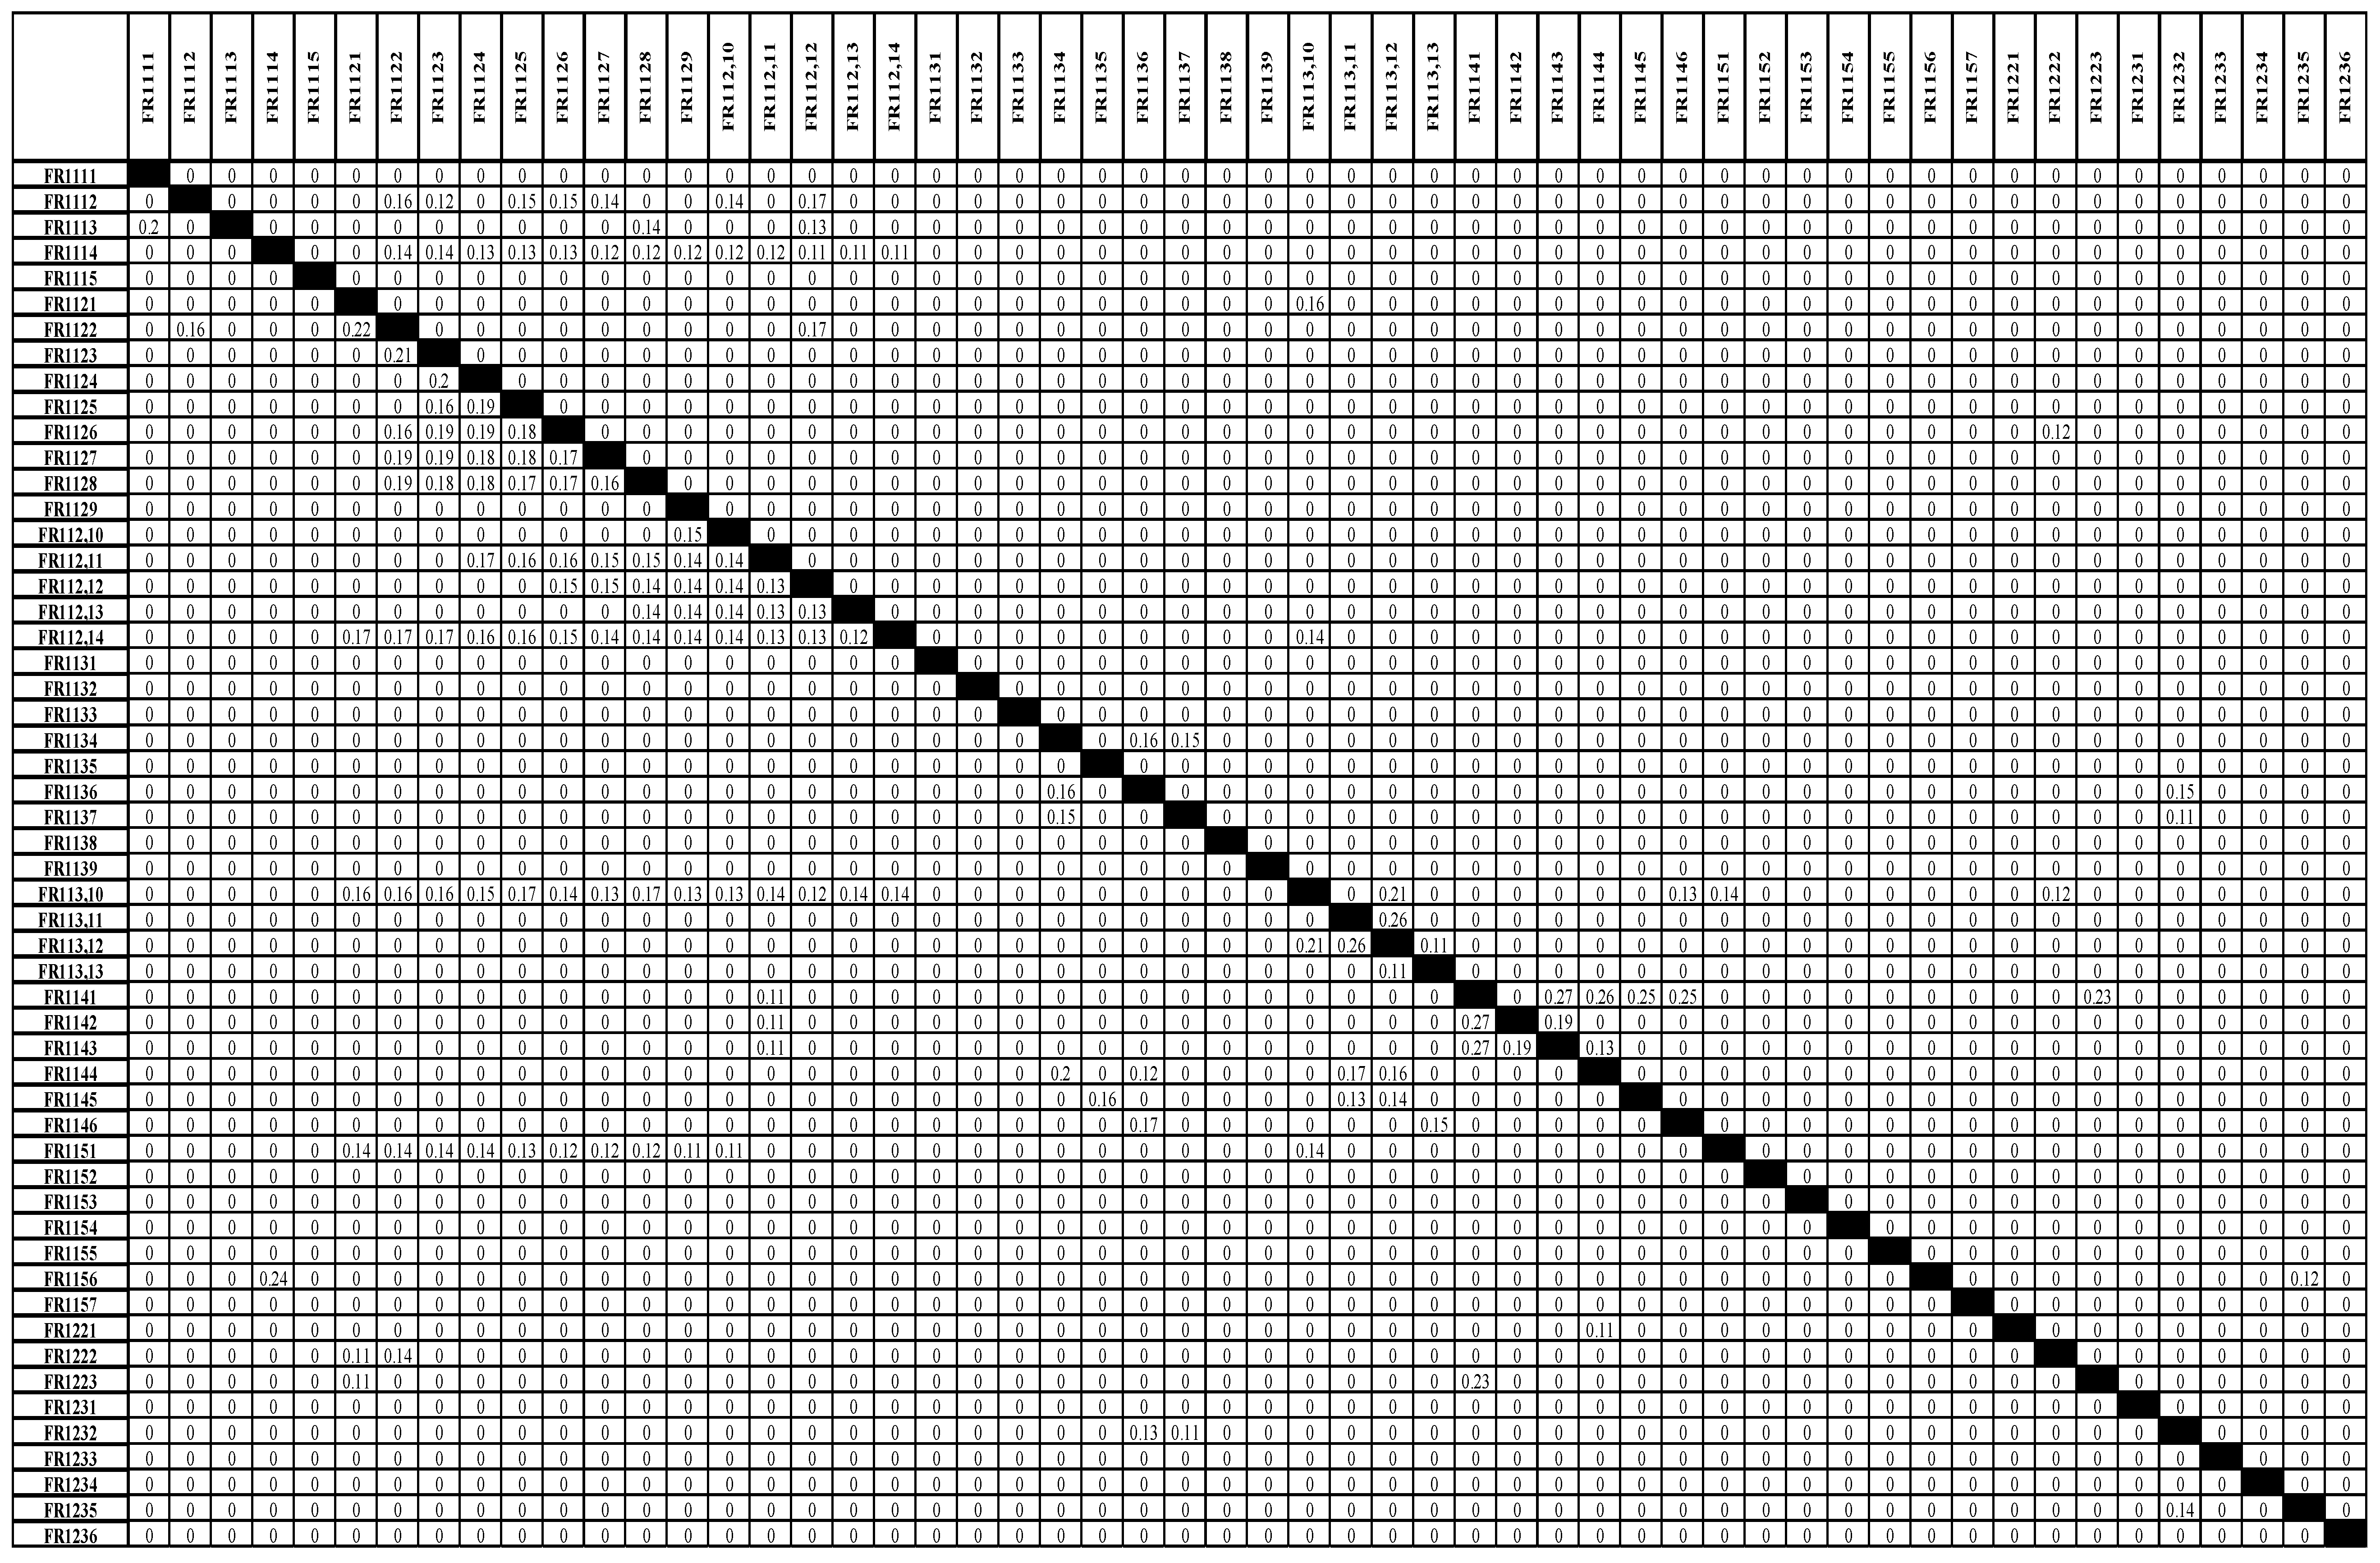
Exhibit A3.
DSM representation of the SOI architecture for cutting point 0.12.

Exhibit A4.
DSM representation of the SOI architecture for cutting point 0.13.

Exhibit A5.
DSM representation of the SOI architecture for cutting point 0.14.
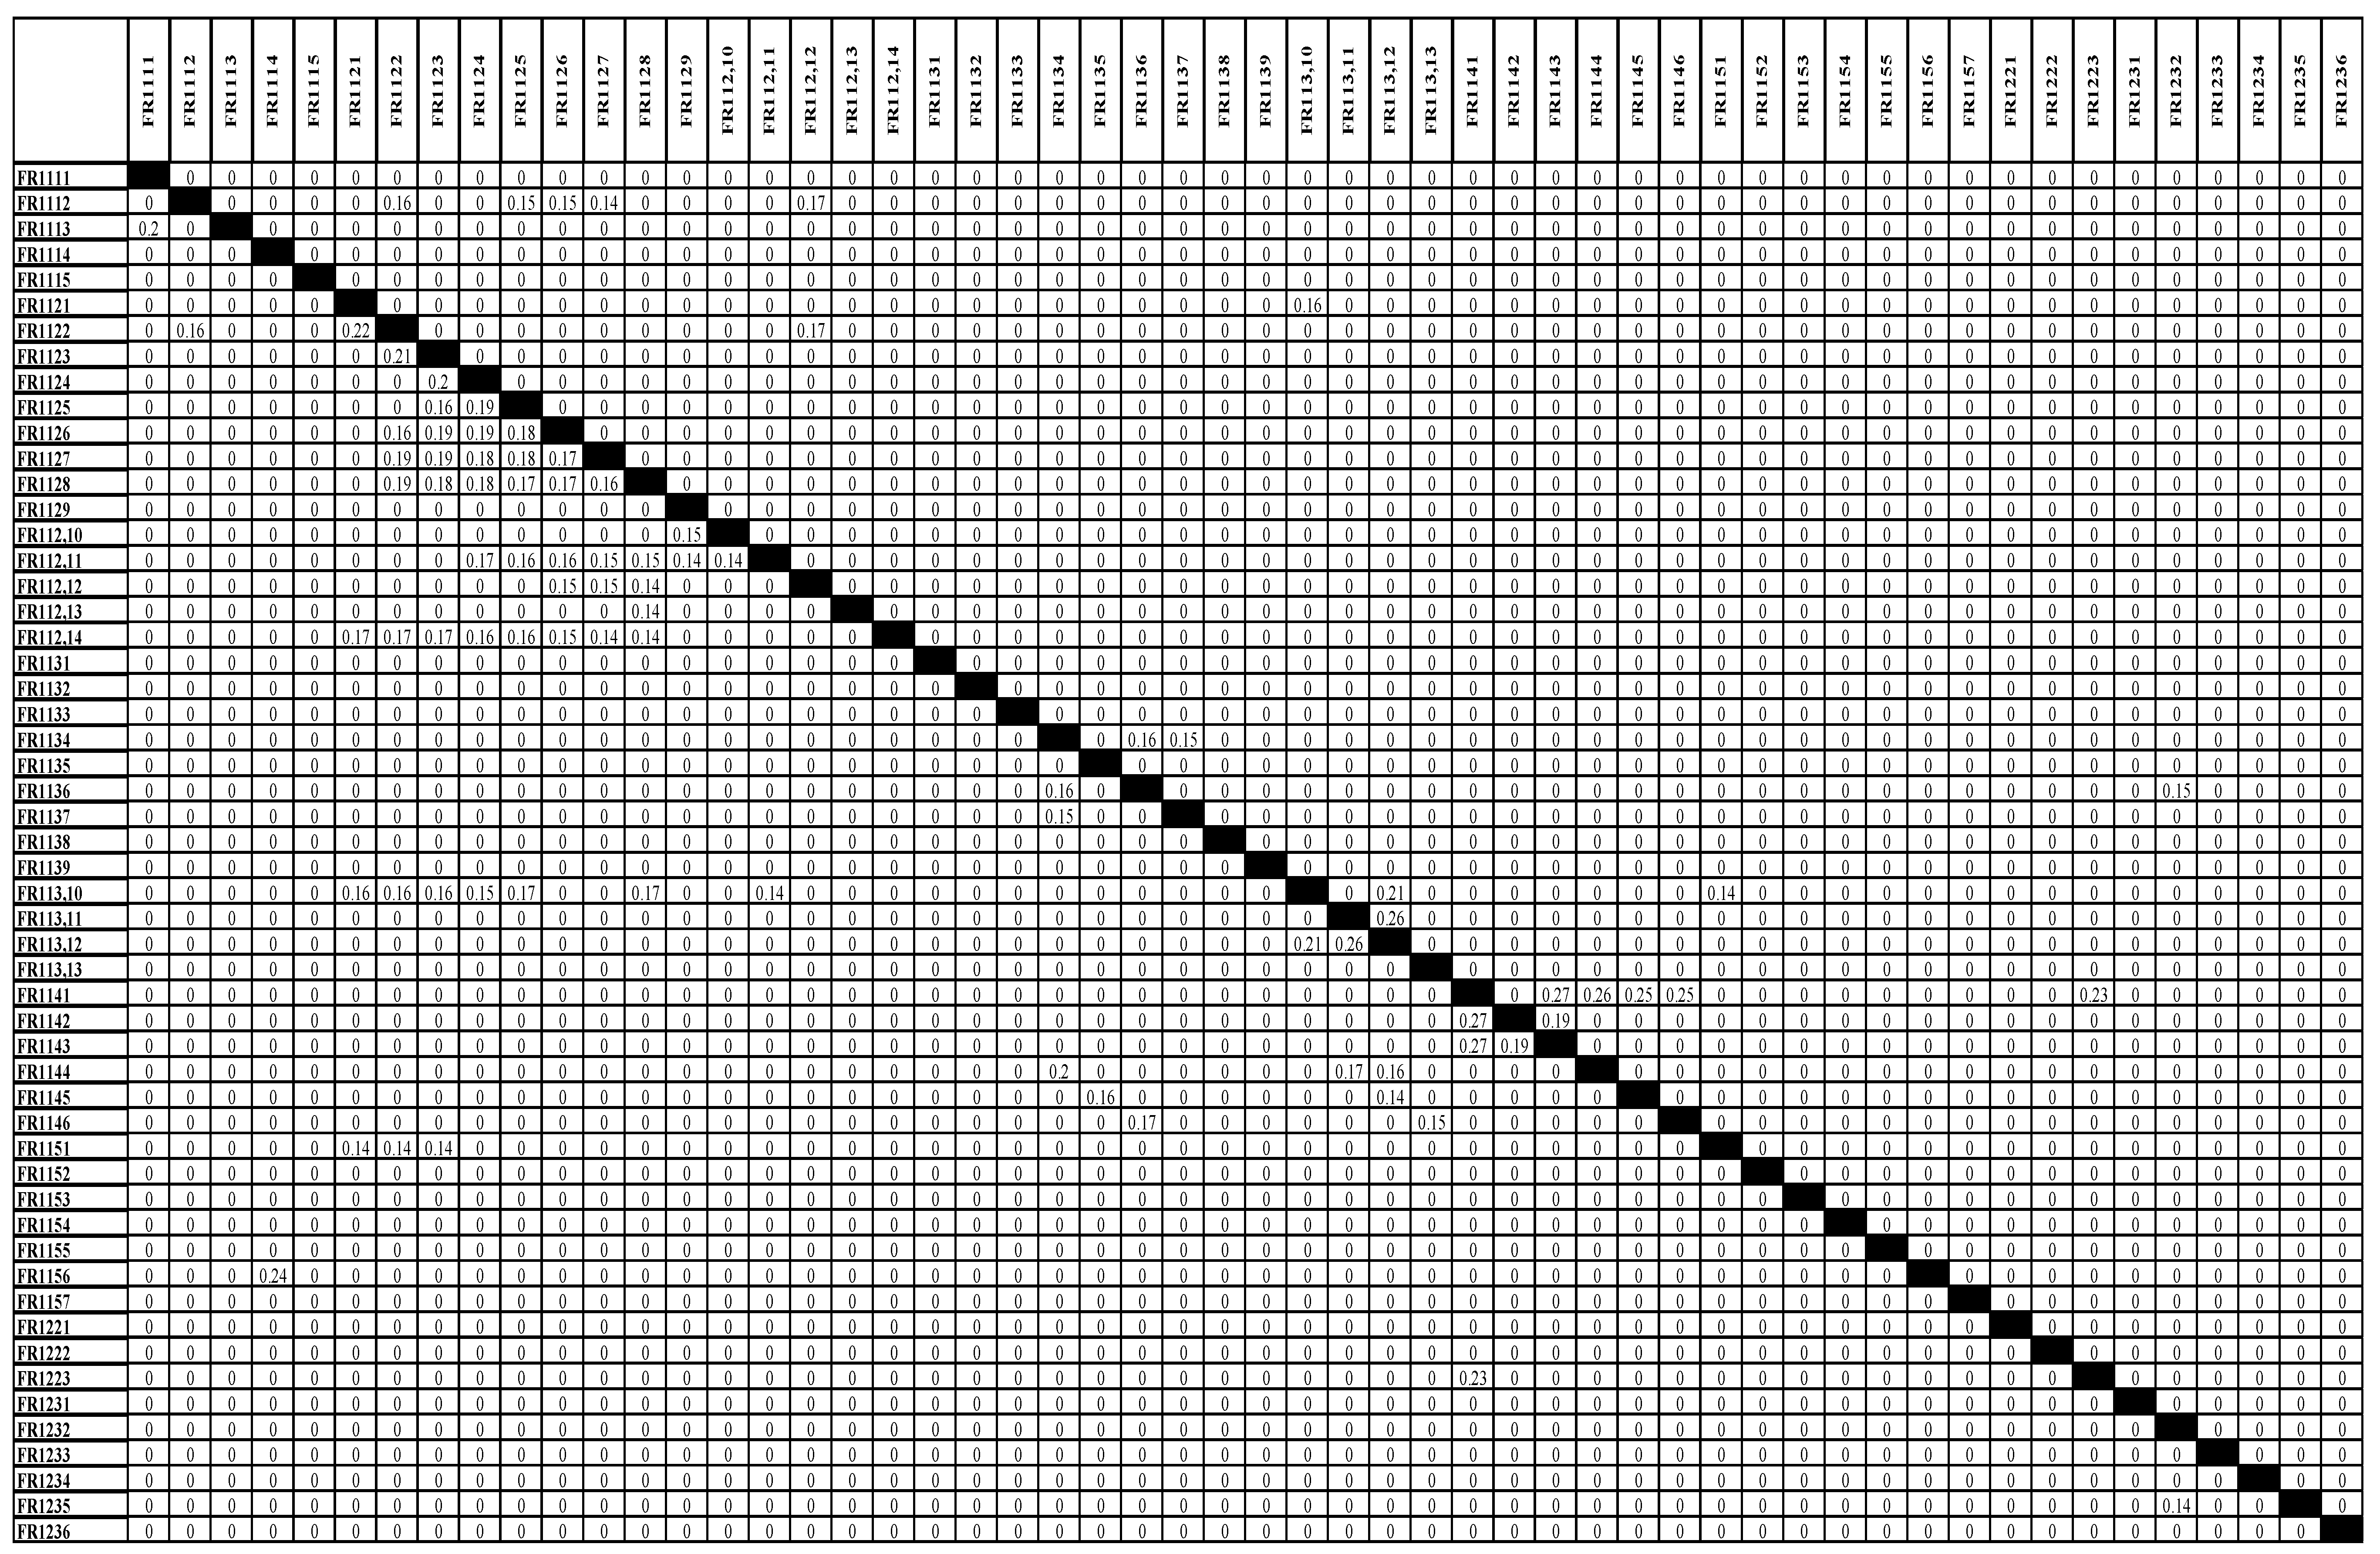
Exhibit A6.
DSM representation of the SOI architecture for cutting point 0.15.References.
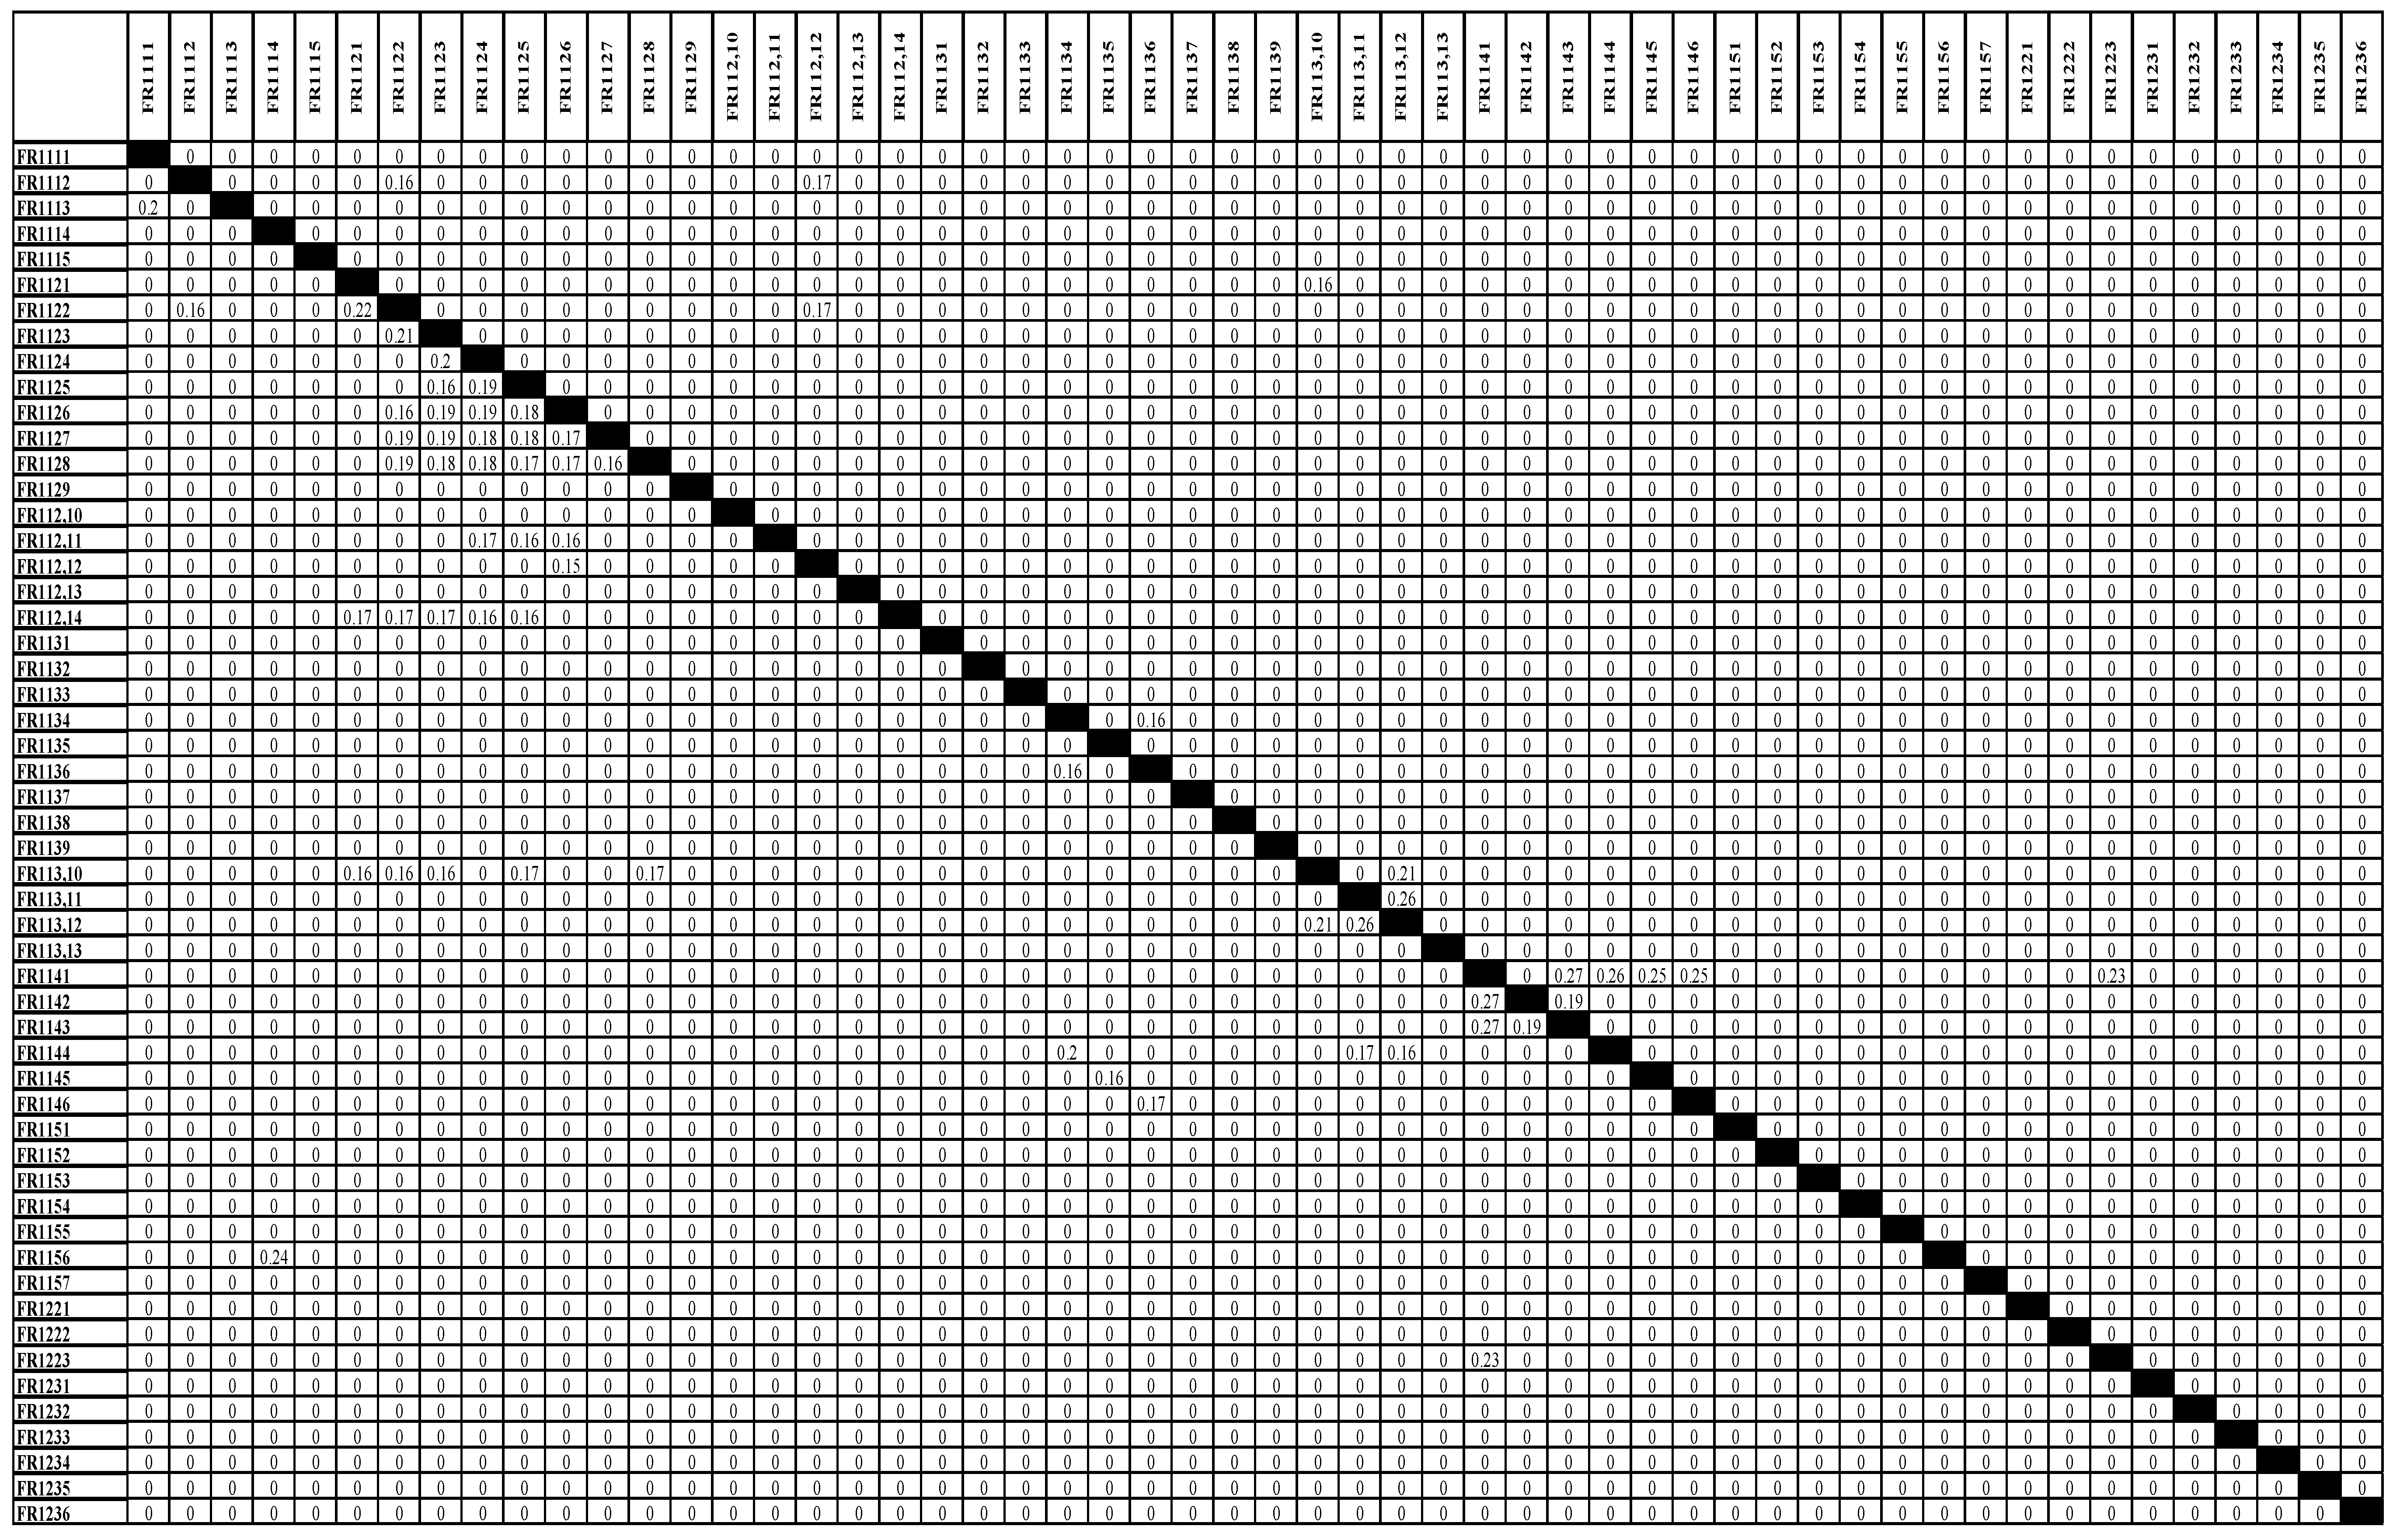
References
- Ahmad, M.A.H.; Iteng, R.; Rahim, M.K.I.A. Impact of quality management practices on manufacturing performance. International Journal of Supply Chain Management 2017, 6, 279–283. [Google Scholar]
- Alem, D.J.; Morabito, R. A robust optimization approach to the short-term planning of furniture production. Journal of Scheduling 2012, 15, 243–255. [Google Scholar]
- Ali, S.; Maciejewski, A.A.; Siegel, H.J.; Kim, J.K. (2003, April). Definition of a robustness metric for resource allocation. In Proceedings International Parallel and Distributed Processing Symposium (pp. 10-pp). IEEE.
- Al-Refaie, A. Optimising Correlated QCHs in Robust Design using Principal Components Analysis and DEA Techniques. Production Planning & Control 2011, 22, 676–689. [Google Scholar]
- Barber, F.; Salido, M.A. Robustness, stability, recoverability, and reliability in constraint satisfaction problems. Knowledge and Information Systems 2015, 44, 719–734. [Google Scholar] [CrossRef]
- Beber, M.E.; Becker, T. Towards an understanding of the relation between topological characteristics and dynamic behavior in manufacturing networks. Procedía Cirp 2014, 19, 21–26. [Google Scholar] [CrossRef]
- Becker, T.; Meyer, M.; Windt, K. (2013). A network theory approach for robustness measurement in dynamic manufacturing systems. In Disruptive supply network models in future industrial systems: configuring for resilience and sustainability. Symposium Proceedings. Institute for Manufacturing, University of Cambridge.
- Benderbal, R.; Ait-Kadi, D.; Gharbi, A. Robust production planning in a sawmill. European Journal of Operational Research 2015, 240, 827–838. [Google Scholar]
- Bernardes, E.S.; Hanna, M.D. A theoretical review of flexibility, agility and responsiveness in the operations management literature. International Journal of Operations and Production Management 2009, 29, 30–53. [Google Scholar] [CrossRef]
- Bevilacqua, M.; Braglia, M.; Carmignani, G.; Zammori, F.; Castellano, D. A multi-criteria and risk-based approach for supplier selection in food supply chain. International Journal of Logistics Systems and Management 2017, 26, 212–238. [Google Scholar]
- Beyer, H.-G.; Sendhoff, B. Robust optimization: A comprehensive survey. Computer Methods in Applied Mechanics and Engineering 2007, 196, 3190–3218. [Google Scholar] [CrossRef]
- Bokrantz, J.; Skoogh, A.; Ylipää, T.; Stahre, J. Handling of production disturbances in the manufacturing industry. Journal of Manufacturing Technology Management 2016, 27, 1054–1075. [Google Scholar] [CrossRef]
- Bonnemeier, S.; Burianek, F.; Reichwald, R. Revenue models for integrated customer solutions: Concept and organizational implementation. Journal of Revenue and Pricing Management 2010, 9, 228–238. [Google Scholar] [CrossRef]
- Boorla, S.M.; Howard, T.J. Production monitoring system for understanding product robustness. Advances in Production Engineering & Management 2016, 11, 159–172. [Google Scholar]
- Carlson, J.M.; Doyle, J. Complexity and robustness. Proceedings of the National Academy of Sciences of the United States of America 2002, 99, 2538–2545. [Google Scholar] [CrossRef]
- Carroll, G. Robustness and linear contracts. American Economic Review 2015, 105, 536–563. [Google Scholar] [CrossRef]
- Carroll, G.; Meng, D. Robust contracting with additive noise. Journal of Economic Theory 2016, 166, 586–604. [Google Scholar] [CrossRef]
- Carroll, G.; Meng, D. Locally robust contracts for moral hazard. Journal of Mathematical Economics 2016, 62, 36–51. [Google Scholar] [CrossRef]
- Chang, C.M. (2005). Engineering management: Challenges in the new millennium. Pearson Education India.
- Chase, R.B.; Aquilano, N.J.; Jacobs, F.R. (1998). Production and operations management: Manufacturing and services. (No Title).
- Chen, X.; Zhang, X.; Xing, L. A novel hybrid imperialist competitive algorithm for multi-objective flexible job-shop scheduling problem. Journal of Intelligent Manufacturing 2017, 28, 1191–1207. [Google Scholar]
- Cheng, Q.; Zhang, G.; Gu, P.; Shao, X. A product module identification approach based on axiomatic design and design structure matrix. Concurrent Engineering 2012, 20, 185–194. [Google Scholar] [CrossRef]
- Daughton, W. Trends in Engineering Management Education From 2011–2015. Engineering Management Journal 2017, 29, 55–58. [Google Scholar] [CrossRef]
- Demirkesen, S.; Ozorhon, B. Measuring project management performance: Case of construction industry. Engineering Management Journal 2017, 29, 258–277. [Google Scholar] [CrossRef]
- Desai, S.; James-Moore, M.; Karmarkar, U. The Impact of Manufacturing Process Design on Operational Performance. Production and Operations Management 2017, 26, 1661–1677. [Google Scholar]
- Durach, C.F.; Wieland, A.; Machuca, J.A.D. Antecedents and dimensions of supply chain robustness: A systematic literature review. International Journal of Physical Distribution & Logistics Management 2015, 45, 118–137. [Google Scholar]
- Efthymiou, K.; Shelbourne, B.; Greenhough, M.; Turner, C. Evaluating manufacturing systems robustness: an aerospace case study. Procedia CIRP 2018, 72, 653–658. [Google Scholar] [CrossRef]
- Egilmez, G.; Heavey, C.; Pagano, A. Design for Risk Management in Manufacturing Systems. Journal of Manufacturing Systems 2018, 48, 38–47. [Google Scholar]
- Egri, P.; Gyulai, D.; Kadar, B.; Monostori, L. Production planning on supply network and plant levels: the robust planet approach. ERCIM News 2016, 105, 14–15. [Google Scholar]
- Farr, J.V.; Lee, M.A.; Metro, R.A.; Sutton, J.P. Using a systematic engineering design process to conduct undergraduate engineering management capstone projects. Journal of Engineering Education 2001, 90, 193–197. [Google Scholar] [CrossRef]
- Fayezi, S.; O'Loughlin, A.; Zutshi, A.; Sohal, A.; Das, A. What impacts do industry 4.0 technologies have on supply chain robustness? A systematic literature review and future research directions. International Journal of Operations and Production Management 2020, 40, 365–396. [Google Scholar]
- Frederico, G.F.; de Sousa Jabbour, A.B.L.; Filho, M.G.; Chiappetta Jabbour, C.J. Environmental performance measurement in green supply chains: A systematic literature review and future research directions. Journal of Cleaner Production 2020, 253, 119932. [Google Scholar]
- Fricke, E.; Schulz, A.P. Design for changeability (DfC): Principles to enable changes in systems throughout their entire lifecycle. Systems Engineering 2005, 8, 342–359. [Google Scholar] [CrossRef]
- Fu, Y.; Li, M.; Chen, F. Impact propagation and risk assessment of requirement changes for software development projects based on design structure matrix. International Journal of Project Management 2012, 30, 363–373. [Google Scholar] [CrossRef]
- Gao, K.; He, Y.; He, Z.; Gu, C. Reliability-based robustness modeling approach for manufacturing system design based on fuzzy design axioms. 8th International Symposium on Computational Intelligence and Design (ISCID) 2015, 1, 619–623. [Google Scholar]
- Goetze, U.; Hinnen, G.; Salge, T.O. Performance measurement systems in purchasing and supply management: A review. Journal of Purchasing and Supply Management 2019, 25, 100547. [Google Scholar]
- Govindan, K.; Khodaverdi, R.; Vafadarnikjoo, A. Intuitionistic fuzzy based DEMATEL method for developing green practices and performances in a green supply chain. Expert Systems with Applications 2015, 42, 7207–7220. [Google Scholar] [CrossRef]
- Gupta, A.D. Transformation in the mindsets and skillsets of engineering students through a course in engineering management. Engineering Management Journal 2017, 29, 135–143. [Google Scholar]
- Hämäläinen, J.; Mustonen-Ollila, E.; Lintukangas, K.; Lautkaski, R. Simulation-based benchmarking of production concepts in early-phase process development. Production Planning & Control 2019, 30, 508–523. [Google Scholar]
- Hämäläinen, J.; Mustonen-Ollila, E.; Lintukangas, K.; Lautkaski, R. A simulation-based framework for the benchmarking of production concepts in the early phases of process development. International Journal of Production Research 2020, 58, 1459–1474. [Google Scholar]
- Hanseth, O.; Nordström, C. Designing robust e-business processes: What we learned from a series of action research projects. MIS Quarterly 2005, 177–197. [Google Scholar]
- He, L.; Zuo, Y.; Zhao, L. Development of a life cycle robustness index for engineering system robustness design. Reliability Engineering & System Safety 2016, 145, 184–192. [Google Scholar]
- He, Y.; Gao, L. Identifying key nodes for controlling propagation of failures in manufacturing process networks. International Journal of Production Research 2019, 57, 3659–3678. [Google Scholar]
- He, Y.; Gao, K.; Wang, D. Robustness modeling for complex manufacturing system design based on fuzzy set theory. Journal of Manufacturing Systems 2017, 43, 283–297. [Google Scholar]
- He, Y.; Zhao, X. Robustness measurement of manufacturing system based on fuzzy mathematics and design structure matrix. International Journal of Production Research 2016, 54, 323–338. [Google Scholar]
- Högström, P.; Ingwald, A. Factory physics principles applied to a flow assembly line: a case study on capacity allocation and production scheduling. Production Planning & Control 2017, 28, 1162–1173. [Google Scholar]
- Huang, D.; Cao, G.; Chai, T. Effect of Production Control Strategies on the Robustness of Manufacturing Systems. Engineering Management Journal 2016, 28, 107–121. [Google Scholar]
- Hutzschenreuter, T.; Kleindienst, I. Strategy-Process Research: What Have We Learned and What Is Still to Be Explored. Journal of Management 2006, 32, 673–720. [Google Scholar] [CrossRef]
- Hutzschenreuter, T.; Pedersen, T.; Dörrenbächer, C. Advancing international business research: Reflections and future directions. Journal of International Business Studies 2019, 50, 555–570. [Google Scholar]
- Janjevic, M.; Radojevic, G. The role of resilient thinking in sustainable supply chain management. Journal of Business Continuity & Emergency Planning 2017, 11, 178–185. [Google Scholar]
- Jia, F.; Tian, H.; Hu, A.J.; Liu, Y. Supply chain robustness: Definition, review and theoretical foundation. European Journal of Operational Research 2019, 275, 771–787. [Google Scholar]
- Jia, F.; Zhao, Q.; Tian, H. Supply chain robustness: Metrics, strategies and implications. International Journal of Production Economics 2016, 181, 161–173. [Google Scholar]
- Johnson, M.P.; Thomas, B. The impact of uncertainty and ambiguity on the production of novel pre-prototype components. Journal of Engineering Design 2014, 25, 382–407. [Google Scholar]
- Johansson, M.P.; Jönsson, P. Factors affecting the economic efficiency of high-performance production systems—A multiple case study. Journal of Manufacturing Technology Management 2015, 26, 78–92. [Google Scholar]
- Kang, W.; Shin, S.; Son, Y. A framework for supply chain robustness management: design and operational strategies under demand uncertainty. International Journal of Production Research 2017, 55, 3504–3520. [Google Scholar]
- Kato, S.; Smalley, A. (2014). Engineering management: Creating and managing world-class operations. Pearson Higher Ed.
- Kaylani, H.; Al-Ashaab, A. Assessment of water quality in the river using mathematical model. Management Science Letters 2016, 6, 677–686. [Google Scholar]
- Kehl, L.; Durach, C.F. The impact of supply chain disruptions on customer satisfaction: Insights from the German automotive industry. Journal of Business Logistics 2017, 38, 308–328. [Google Scholar]
- Kelton, D.; Sadowski, R.P.; Sturrock, D.T. (2015). Simulation with Arena. McGraw-Hill Education.
- Keshtkar, H.; Noori, S. A practical model for economic order quantity with shortage for substitutable items in a two-level supply chain network. Computers & Industrial Engineering 2013, 66, 47–56. [Google Scholar]
- Khan, M.M.; Khan, N.A.; Noman, A.A. Developing a mathematical model for selection of suppliers in a supply chain. Journal of Industrial Engineering International 2015, 11, 245–260. [Google Scholar]
- Khan, M.M.; Noman, A.A.; Iqbal, A. A multi-objective facility location model for sustainable supply chain network design. Journal of Industrial & Management Optimization 2018, 14, 1007–1037. [Google Scholar]
- Khan, M.M.; Tariq, M.; Khan, N.A. Application of AHP and Fuzzy TOPSIS for supplier selection problem: A case study of automotive sector. Expert Systems with Applications 2014, 41, 2475–2488. [Google Scholar]
- Kiesmüller, G.P.; Kouvelis, P. The value of quick response capability in supply chains. Management Science 2005, 51, 1811–1826. [Google Scholar]
- Kocabasoglu, C.; Prahinski, C. Predictors of supply chain innovation capability. Journal of Business Logistics 2008, 29, 257–281. [Google Scholar]
- Kocaoglu, D.F.; Ozdemir, D. A systematic review of robust design optimization: Status quo and future research directions. Structural and Multidisciplinary Optimization 2019, 60, 1157–1194. [Google Scholar]
- Kocaoglu, D.F.; Yılmaz, T. A state-of-the-art survey of robust design methodology. Journal of Engineering Design 2014, 25, 171–198. [Google Scholar]
- Kocabasoglu-Hillmer, C.; Denizel, M. Supply chain management: A mixed-integer programming model and computational analysis. Computers & Operations Research 2008, 35, 3520–3540. [Google Scholar]
- Kock, A.; Gemünden, H.G. Antecedents to systematic planning in product development: A contingency perspective on the impact of environmental dynamism and level of new product development. International Journal of Innovation Management 2016, 20, 1650025. [Google Scholar]
- Kodali, R.; Lee, W.; Lee, J.H. A review of robust design concepts in complex engineering systems. Procedia Manufacturing 2018, 26, 582–589. [Google Scholar]
- Kocabiyikoglu, A.; Gülpinar, N.; Pekgun, P. Supply chain disruption risks: perspectives from the automotive industry. Supply Chain Management: An International Journal 2016, 21, 627–641. [Google Scholar]
- Kocabiyikoglu, A.; Pekgun, P. Exploring supply chain robustness in the context of operational disruptions: insights from the automotive industry. Journal of Manufacturing Technology Management 2017, 28, 524–542. [Google Scholar]
- Kocabiyikoglu, A.; Pekgun, P.; Zhang, Y. An empirical investigation of supply chain robustness in the context of operational disruptions: Evidence from the automotive industry. International Journal of Production Economics 2016, 182, 43–62. [Google Scholar]
- Kocabiyikoglu, A.; Pekgun, P.; Zhang, Y. (2017). Supply chain disruption management and the automotive industry. In Supply Chain Disruption Management and the Automotive Industry (pp. 1-12). Springer.
- Kocaoglu, D.F.; Pagnanelli, F. A framework to evaluate the robustness of complex engineering systems considering technological, market, and organizational uncertainties. Journal of Engineering Design 2020, 31, 467–494. [Google Scholar]
- Ko, H.J.; Evans, G.W. A genetic algorithm-based heuristic for the dynamic integrated forward/reverse logistics network for 3PLs. Computers & Operations Research 2007, 34, 346–366. [Google Scholar]
- Ko, H.J.; Park, S.Y. A case study on applying QFD to prioritize customer requirements in an integrated product development environment. Computers & Industrial Engineering 2009, 56, 257–270. [Google Scholar]
- Krieger, M.A.; Shang, J. Two-level robust optimization for multi-objective portfolio selection with uncertain returns. European Journal of Operational Research 2019, 277, 933–944. [Google Scholar]
- Kryvinska, N.; Strauss, C. (2015). Management of trust and robustness in Open Innovation. In Towards a Vision for Information Technology in Civil Engineering (pp. 401-411). CRC Press.
- Kuik, R.; Kuik, D. Dissemination and application of knowledge from research and development (R&D) in manufacturing companies. Journal of Manufacturing Technology Management 2008, 19, 592–614. [Google Scholar]
- Kunene, K.; Ojah, K.; Olugu, E.U. Developing a risk-resilience index for supply chain networks using an integrated BWM-DEA methodology. Journal of Manufacturing Systems 2019, 53, 149–164. [Google Scholar]
- Kurucz, E.C.; Colbert, B.A.; Wheeler, D.; Kastberg, H. Designing robustness and efficiency in supply chain networks with demand uncertainty. European Journal of Operational Research 2019, 277, 540–554. [Google Scholar]
- Kutlu, A.C.; Aksoy, P.; Anil, N. A decision-making methodology for global supply chain risk management. Production Planning & Control 2018, 29, 126–138. [Google Scholar]
- Kutlu, A.C.; Karagülle, A.; Üçal Sarı, I. Integrated green supply chain management: Current state, future directions, and opportunities. Journal of Cleaner Production 2020, 277, 123039. [Google Scholar]
- Kwon, Y.W.; Lee, H.K.; Cho, S.B. A framework of global supply chain robustness management: Concept and case study. Sustainability 2018, 10, 3007. [Google Scholar]
- Lam, J.S.; Ong, K.S. Portfolio optimization for supply chain: An analytical approach. European Journal of Operational Research 2007, 182, 1257–1271. [Google Scholar]
- Lantz, B.; Fox, J. (2014). Machine Learning With R. Packt Publishing Ltd.
- Larsson, A.; Skoogh, A. A management model for robustness in the manufacturing industry. Journal of Manufacturing Technology Management 2012, 23, 36–51. [Google Scholar]
- Le, L.B.; Pham, D.T.; Dimov, S.S. Bayesian networks for design of robust products using real-time data. IEEE Transactions on Systems, Man, and Cybernetics: Systems 2016, 48, 67–80. [Google Scholar]
- Lee, H.; Lee, K. Open innovation in the automotive industry. European Journal of Innovation Management 2015, 18, 259–280. [Google Scholar]
- Lee, J.H.; Jin, H.; Kocaoglu, D.F. Assessing the robustness of complex engineering systems using Bayesian networks. Engineering Optimization 2019, 51, 1964–1981. [Google Scholar]
- Lee, M.C.; Chen, W.C. Green supply chain management and the selection of suppliers using the third-party logistics (3PL) provider. African Journal of Business Management 2012, 6, 888–900. [Google Scholar]
- Lee, M.C.; Chen, W.C.; Lan, T.M. Using Fuzzy QFD for Green Supply Chain Management. American Journal of Engineering and Applied Sciences 2015, 8, 611–618. [Google Scholar]
- Lee, M.C.; Chen, W.C.; Yang, M.T. Using Grey Relational Analysis and Fuzzy QFD to Select Suppliers for Green Supply Chain Management. American Journal of Engineering and Applied Sciences 2014, 7, 507–514. [Google Scholar]
- Lee, S.M.; Lee, D.H. Dynamic performance measurement system (DPMS) for production lines using KPIs, Fuzzy DEMATEL, and ANP. Applied Soft Computing 2015, 28, 173–184. [Google Scholar]
- Lee, S.M.; Oh, J. Evaluation of innovation capabilities of manufacturing companies in Korea. Technological Forecasting and Social Change 2017, 125, 306–317. [Google Scholar]
- Lee, Y.H.; Shin, S. Analysis of the impact of uncertainty on performance in two-echelon supply chain systems. International Journal of Production Research 2018, 56, 247–267. [Google Scholar]
- Lei, L.I.U.; Zhang, X. Assessment of supply chain robustness using a system dynamics model. Circuits, Systems, and Signal Processing 2015, 34, 3421–3443. [Google Scholar]
- Lei, X.; Wang, J.; Chen, Y.; Dong, W. Modeling robust design for product development and manufacturing with correlated parameters. Engineering Optimization 2016, 48, 234–251. [Google Scholar]
- Liao, Y.H.; Chang, H.C. A green supply chain management strategic model for assessment of environmental risks. Mathematical Problems in Engineering 2014, 2014. [Google Scholar]
- Lin, W.T.; Tang, M.L.; Tsai, Y.H. Development of the ergonomic design decision-making process for personal computers. Human Factors and Ergonomics in Manufacturing & Service Industries 2019, 29, 186–195. [Google Scholar]
- Löfsten, H.; Lindelöf, P. Science parks and the growth of new technology-based firms—Academic-industry links, innovation and markets. Research Policy 2002, 31, 859–876. [Google Scholar] [CrossRef]
- Lu, J.; Ren, Y.; Zhang, D.; Cai, J. Collaborative supply chain management and decision-making under uncertainty: A review. International Journal of Production Economics 2017, 207, 96–114. [Google Scholar]
- Lu, W.M.; Huang, C.C. Application of grey relational analysis for evaluating the performance of hot spring hotels in Taiwan. International Journal of Hospitality Management 2010, 29, 494–503. [Google Scholar]
- Lu, W.M.; Shang, K.C. Performance evaluation model for the green supply chain management of electronics industry. International Journal of Production Economics 2009, 122, 1–9. [Google Scholar]
- Lutz, E.; Fernández-Cardador, A.; del Caño, A.G.; García-Dastugue, S.J. Competing through resilience: the Spanish automaker supplier network. International Journal of Production Research 2015, 53, 1079–1095. [Google Scholar]
- MacCormack, A.; MacMillan, I.C.; Prahalad, C.K. Technology cycles, innovation streams, and ambidextrous organizations: Organization renewal through innovation streams and strategic change. Industrial and Corporate Change 1988, 18, 337–366. [Google Scholar]
- Maier, A.M.; Moultrie, J. Influence of timing, supplier and cost on performance of incremental and radical innovation projects. International Journal of Operations & Production Management 2010, 30, 1299–1326. [Google Scholar]
- Maleki, M.; Vahdani, B.; Mousavi, S.M.; Tavakkoli-Moghaddam, R. A three-objective robust optimization model for logistics network design in a hybrid uncertain environment: NSGA-II and NRGA. Journal of Industrial Engineering International 2014, 10, 1–18. [Google Scholar]
- Manuj, I.; Mentzer, J.T. Global supply chain risk management. Journal of Business Logistics 2008, 29, 133–155. [Google Scholar] [CrossRef]
- Martinez, A.B.; Barajas, R.L. Modelling integrated production-distribution planning in make-to-order supply chains with a fuzzy model. International Journal of Production Research 2015, 53, 3599–3619. [Google Scholar]
- Mcgrath, R.G. A real options logic for initiating technology positioning investments. The Academy of Management Review 1997, 22, 974–996. [Google Scholar] [CrossRef]
- Mishra, D.; Sharma, R. Grey DEMATEL approach for analysis of Indian automobile sector. Grey Systems: Theory and Application 2014, 4, 29–46. [Google Scholar]
- Mladenović, G.; Petrović, D. **Hooke and Jeeves} revisited: Synthesis and analysis of new direct search method. European Journal of Operational Research 2012, 223, 423–438. [Google Scholar]
- Monostori, L.; Kádár, B.; Bauernhansl, T. Cyber-physical systems in manufacturing. CIRP Annals 2016, 65, 621–641. [Google Scholar] [CrossRef]
- Montoya-Torres, J.R.; Peña, A.J.; Arango, J.A. A simulation-based optimization approach to the supply chain robustness. Computers & Industrial Engineering 2013, 65, 327–340. [Google Scholar]
- Morais, D.C.; Vaz, A.I.F.; Barbosa-Povoa, A.P.; Novais, A.Q. An integrated approach for the design of supply chains under a supply disruption scenario. Computers & Chemical Engineering 2015, 81, 249–267. [Google Scholar]
- Moraga, M.A. Multinational firms and the location of innovative activity. The Economic Journal 2001, 111, 183–197. [Google Scholar]
- Mortenson, M.J.; Karim, A. Application of the Taguchi robust design method for optimising a gas turbine. International Journal of Production Research 2009, 47, 4537–4552. [Google Scholar]
- Mosadegh Sedghy, B.; Asgharpour, M.J. A multi-objective robust optimization approach for the multi-product multi-site aggregate production planning problem under supply disruption risks. Computers & Operations Research 2016, 74, 1–11. [Google Scholar]
- Moser, R.; Göx, R. Competitive advantage through customer orientation–The role of customer centricity in firm performance in the automotive industry. Journal of Retailing and Consumer Services 2017, 37, 139–147. [Google Scholar]
- Moser, R.; Urban, S. Building competitive advantage with business models–The case of the automotive industry. International Journal of Innovation Management 2016, 20, 1650001. [Google Scholar]
- Mukherjee, K.; Kumar, R.R.; Kumar, A.; Antony, J. Identifying and prioritizing critical success factors of total quality management (TQM) in Indian automobile industries using analytic hierarchy process (AHP) approach. Total Quality Management & Business Excellence 2017, 28, 1002–1025. [Google Scholar]
- Naim, M.M.; Wikner, J. Production and inventory control: Co-ordination and optimization. International Journal of Production Economics 1994, 35, 35–44. [Google Scholar]
- Nakamura, H.; Ōno, K. (1988). The Toyota production system: An integrated approach to just-in-time. Industrial Engineering and Management Press.
- Narayanan, V.K. Contingency plans and management strategy: Determinants of the strategy of contingent price increases. Academy of Management Journal 1985, 28, 571–586. [Google Scholar]
- Naumann, S.; Reßing, M. Robust design and optimisation of automotive control systems. IFAC-PapersOnLine 2017, 50, 1116–1121. [Google Scholar]
- Ng, K.M.; Lam, H.Y. Robustness optimization of production lines under uncertain demand and supply disruptions. International Journal of Production Economics 2016, 171, 307–317. [Google Scholar]
- Ng, K.M.; Lam, H.Y. Design of robust production lines for uncertain demand and supply disruptions using multi-objective optimization. Computers & Industrial Engineering 2019, 136, 211–222. [Google Scholar]
- Ngai, E.W.; Chau, D.C.; Chan, T.F. Information technology, operational, and management competencies for supply chain agility: Findings from case studies. Journal of Strategic Information Systems 2011, 20, 232–249. [Google Scholar] [CrossRef]
- Ngo, V.A.; Ogunlana, S.O. Developing a method for quantitative assessment of business process agility. Engineering, Construction and Architectural Management 2015, 22, 347–370. [Google Scholar]
- Nof, S.Y.; Gershenson, J.K. (2007). Handbook of automation, computation, and control: Volume 3: Systems and components. John Wiley & Sons.
- Nordin, N.; Deros, B.M. Theoretical model on the relationship of integrated supply chain management practices, lean practices and supply chain performance among manufacturing companies in Malaysia. Procedia Manufacturing 2015, 2, 222–229. [Google Scholar]
- Nordin, N.; Zakuan, N.; Tahar, R.M. Relationships between green supply chain practices and performance of Malaysian manufacturers. Journal of Manufacturing Technology Management 2016, 27, 613–638. [Google Scholar]
- Nukman, Y.; Zakuan, N.; Jusoh, A. Supply chain integration: A review of lean and agile approaches. Benchmarking: An International Journal 2018, 25, 65–89. [Google Scholar]
- Ocampo, L.; Montoya-Torres, J.R.; Poler, R. A review of quantitative models for supply chain risk management: Bibliometric analysis. Spanish Journal of Marketing-ESIC 2015, 19, 44–61. [Google Scholar]
- Oke, A.; Gopalakrishnan, M. Managing disruptions in supply chains: A case study of a retail supply chain. International Journal of Production Economics 2009, 118, 168–174. [Google Scholar] [CrossRef]
- Orlikowski, W.J. The duality of technology: Rethinking the concept of technology in organizations. Organization Science 1992, 3, 398–427. [Google Scholar] [CrossRef]
- Orlikowski, W.J. Knowing in practice: Enacting a collective capability in distributed organizing. Organization Science 2002, 13, 249–273. [Google Scholar] [CrossRef]
- Orlikowski, W.J. The sociomateriality of organisational life: considering technology in management research. Cambridge Handbook of Strategy as Practice 2010, 200–227. [Google Scholar] [CrossRef]
- Orlikowski, W.J.; Barley, S.R. Technology and institutions: What can research on information technology and research on organizations learn from each other? MIS Quarterly 2001, 25, 145–165. [Google Scholar] [CrossRef]
- Orlikowski, W.J.; Scott, S.V. Sociomateriality: challenging the separation of technology, work and organization. Academy of Management Annals 2008, 2, 433–474. [Google Scholar] [CrossRef]
- Osyk, B.A.; Goncharova, O.N. Analysis of the distribution of competitiveness of enterprises. Journal of Advanced Research in Law and Economics 2015, 3, 1044–1050. [Google Scholar]
- Özkaya, E.; Nagi, R. The effects of disruptions on the performance of an assemble-to-order supply chain with multiple suppliers. European Journal of Operational Research 2007, 179, 933–951. [Google Scholar]
- Özkaya, E.; Nagi, R. Simultaneous selection of suppliers and determination of lot sizes in an assemble-to-order environment. IIE Transactions 2009, 41, 520–536. [Google Scholar]
- Özkaya, E.; Nagi, R. A simulation study of the effects of disruptions on the performance of an assemble-to-order supply chain. IIE Transactions 2010, 42, 53–68. [Google Scholar]
- Padmanabhan, V.; Gilbert, S.M. Transforming distribution logistics: An organizational perspective. International Journal of Logistics Management 1997, 8, 1–18. [Google Scholar]
- Pan, K.; Yang, D.; Wang, Y. Cross-border e-commerce model selection for a firm under integrated government control and revenue sharing contract. International Journal of Production Economics 2016, 182, 42–55. [Google Scholar]
- Park, K.H.; Park, M.S.; Kim, D.W.; Kim, H.G. Modelling the effects of human errors on the recovery of a manufacturing system. International Journal of Production Research 2015, 53, 4530–4543. [Google Scholar]
- Park, K.H.; Park, M.S.; Lee, S.W. Framework for the recovery of a manufacturing system from production disruptions. International Journal of Production Research 2013, 51, 812–829. [Google Scholar]
- Park, K.H.; Park, M.S.; Lee, S.W. A modeling framework for analyzing the propagation of production disruptions in a manufacturing system. International Journal of Production Research 2014, 52, 4395–4409. [Google Scholar]
- Park, M.S.; Kim, Y.S.; Park, K.H. A structured approach to mitigate the risks of production disruptions: Using ontologies. Journal of Manufacturing Systems 2013, 32, 416–426. [Google Scholar]
- Parmar, B.L. Role of business process reengineering (BPR) and enterprise resource planning (ERP) implementation in higher education. Indian Journal of Economics and Business 2005, 4, 149–157. [Google Scholar]
- Patel, J.B.; Sollish, F.; Fiksel, J. (2011). The supply chain resilience guide. Deloitte Consulting LLP.
- Pauwels, P.; Matthyssens, P. The development of international manufacturing networks in Asia. Journal of Operations Management 2004, 22, 157–174. [Google Scholar]
- Pennings, J.M.; Harianto, F. The diffusion of technological innovation in the commercial banking industry. Strategic Management Journal 1992, 13, 29–46. [Google Scholar] [CrossRef]
- Penrose, E. (1959). The theory of the growth of the firm. Oxford University Press.
- Peppard, J.; Ward, J. (2016). The strategic management of information systems: Building a digital strategy. John Wiley & Sons.
- Pettigrew, A.M. (2003). Innovative forms of organizing: Research in organizations and management. Sage Publications.
- Pflaum, A.; Puchert, H. Improving overall equipment effectiveness (OEE) in complex assembly systems by utilizing material transport systems–an industrial case study. Procedia CIRP 2017, 60, 218–223. [Google Scholar]
- Plonka, A.; Denzinger, J. Multi-objective robust optimization of supply chains considering disruption risks. Computers & Operations Research 2011, 38, 24–32. [Google Scholar]
- Plonka, A.; Denzinger, J. Robust supply chain optimization under disruption risks. International Journal of Production Economics 2015, 169, 36–47. [Google Scholar]
- Porter, M.E. (1980). Competitive strategy: Techniques for analyzing industries and competitors. Free Press.
- Porter, M.E. (1985). Competitive advantage: Creating and sustaining superior performance. Free Press.
- Porter, M.E. What is strategy? Harvard Business Review 1996, 74, 61–78. [Google Scholar]
- Pottinger, G.; Spekman, R. Measuring supply chain effectiveness: The importance of a systems perspective. International Journal of Physical Distribution & Logistics Management 2005, 35, 744–761. [Google Scholar]
- Prahalad, C.K.; Hamel, G. The core competence of the corporation. Harvard Business Review 1990, 68, 79–91. [Google Scholar]
- Preiss, K.; Reichel, A.; Leimeister, J.M.; Krcmar, H. Toward ambidextrous open innovation in small and medium sized enterprises–The role of external and internal resources. Creativity and Innovation Management 2014, 23, 305–317. [Google Scholar]
- Proctor, R.W.; Van Zandt, T. (2008). Human factors in simple and complex systems. Taylor & Francis.
- Proctor, T. **De-skilling} and reskilling in the international automobile industry. International Journal of Human Resource Management 1998, 9, 792–812. [Google Scholar]
- Pujawan, I.N.; Geraldin, L.R. A literature review on supply chain management research. Sustainable Supply Chains, Operations, and Marketing: Theories and Practice 2016, 17–38. [Google Scholar]
- Pujawan, N.; Gunasekaran, A. Special issue on operations and supply chain management in the era of Industry 4.0. Computers & Industrial Engineering 2019, 133, 1–3. [Google Scholar]
- Qin, S.; Huang, G.Q. A framework for supply chain design with uncertain disruption. International Journal of Production Economics 2007, 108, 222–234. [Google Scholar]
- Qin, S.; Huang, G.Q.; Wang, Q. Supply chain network design under demand uncertainty. International Journal of Production Economics 2008, 116, 61–73. [Google Scholar]
- Quaddus, M.A.; Siddiquee, N.A.; Xu, X. Modelling performance measurement of green supply chain management practices using Best-Worst Method. Omega 2017, 66, 283–296. [Google Scholar]
- Radner, R. Collusion, efficiency, and antitrust policy. The Bell Journal of Economics 1986, 47–69. [Google Scholar]
- Raghunathan, S.; Raghunathan, B. Information system innovation as a core competency: A tool for technology transfer. Journal of Engineering and Technology Management 1994, 11, 21–45. [Google Scholar]
- Rajesh, R.; Ravi, V. Analysis of interactions among the barriers of reverse logistics. Journal of Manufacturing Systems 2015, 37, 648–658. [Google Scholar]
- Ramanathan, U.; Gunasekaran, A. Supply chain collaboration: Impact of success in long-term partnerships. International Journal of Production Research 2014, 52, 188–204. [Google Scholar] [CrossRef]
- Rana, N.P.; Dwivedi, Y.K. Redefining adoption: A review of the innovation-decision literature. European Journal of Marketing 2015, 49, 1152–1209. [Google Scholar]
- Raz, T.; Fadlalla, A.M. Risk management in supply chain: A real options approach. Computers & Industrial Engineering 2012, 62, 357–361. [Google Scholar]
- Reis, M.L.; Porto, G.S. The impact of environmental uncertainty and project management offices (PMOs) on the relationships among risk management, planning and success. International Journal of Project Management 2015, 33, 871–884. [Google Scholar]
- Reyes-Palomar, A.S.; Ramírez-González, G.; Ponce-Cueto, E. A literature review of resilient supplier selection strategies. Journal of Manufacturing Systems 2018, 49, 156–167. [Google Scholar]
- Rezapour, S.; Farahani, R.Z. Competitive supply chain network design: An overview of classifications, models, solution techniques and applications. Omega 2010, 45, 92–118. [Google Scholar]
- Ribeiro, P.J.; Miranda, V. A novel global optimization algorithm inspired by natural selection. Physics Letters A 2006, 358, 71–75. [Google Scholar]
- Robinson, H.; Caldentey, R.; Van Mieghem, J.A. A robust optimization approach to supply chain management. Operations Research 2007, 55, 831–844. [Google Scholar]
- Rodan, S.; Galunic, C. More than network structure: How knowledge heterogeneity influences managerial performance and innovativeness. Strategic Management Journal 2004, 25, 541–562. [Google Scholar] [CrossRef]
- Roger, E.M. (2003). Diffusion of innovations. Simon and Schuster.
- Rogers, D.S.; Tibben-Lembke, R.S. Going backwards: Reverse logistics trends and practices. Reverse logistics 1999, 1–27. [Google Scholar]
- Rungtusanatham, M.J.; Salvador, F. The impacts of production complexity and time on the sources of slack in operations. Journal of Operations Management 2007, 25, 1067–1087. [Google Scholar]
- Russo, I.; Cosenz, F.; Talaia, M. Exploring supply chain management practices: An exploratory case study from the automotive sector. Supply Chain Management: An International Journal 2018, 23, 395–415. [Google Scholar]
- Saberi, S.; Kouhizadeh, M.; Sahebjamnia, N. A robust optimization model for logistics planning in an uncertain environment: A real case study. Computers & Industrial Engineering 2017, 105, 170–181. [Google Scholar]
- Saeed, K.A.; Helo, P. Integrating the JIT production philosophy with maintenance and quality management: A state-of-the-art survey. International Journal of Production Economics 2007, 107, 324–335. [Google Scholar]
- Saeed, K.A.; Helo, P.T.; Hussain, M. An analysis of the literature on heat exchanger fouling: Where are we today? Heat Transfer Engineering 2008, 29, 351–360. [Google Scholar]
- Sahebjamnia, N.; Torabi, S.A. A robust optimization model for sustainable and resilient closed-loop supply chain network design considering contingency plan. International Journal of Production Economics 2013, 146, 185–198. [Google Scholar]
- Sahebjamnia, N.; Torabi, S.A. A new multi-objective stochastic model for resilient and green supply chain network design considering carbon policies. Applied Mathematical Modelling 2015, 39, 3173–3193. [Google Scholar]
- Sahebjamnia, N.; Torabi, S.A. A robust optimization model for closed-loop supply chain network design with uncertain demand and return. Computers & Operations Research 2016, 73, 163–176. [Google Scholar]
- Sahebjamnia, N.; Torabi, S.A.; Mansouri, S.A. Robust closed-loop supply chain network design under uncertainty. Computers & Operations Research 2015, 54, 193–209. [Google Scholar]
- Sahebjamnia, N.; Torabi, S.A.; Mansouri, S.A. Sustainable closed-loop supply chain network design under uncertainty. Futures 2016, 83, 56–71. [Google Scholar]
- Sahebjamnia, N.; Torabi, S.A.; Mansouri, S.A. A Benders’ decomposition algorithm for designing a sustainable closed-loop supply chain network with responsiveness and quality level. Computers & Operations Research 2017, 78, 315–335. [Google Scholar]
- Sahebjamnia, N.; Torabi, S.A.; Zahiri, B. Multi-objective robust optimization model for sustainable and resilient closed-loop supply chain network design under uncertainty. Computers & Industrial Engineering 2018, 120, 255–273. [Google Scholar]
- Sahinidis, N.V. BARON: A general purpose global optimization software package. Journal of Global Optimization 1996, 8, 201–205. [Google Scholar] [CrossRef]
- Sahinidis, N.V.; Tawarmalani, M. (2002). BARON 7.0. Technical Report, Chemical Engineering Department, Carnegie Mellon University, Pittsburgh.
- Sakawa, M.; Kato, K. Interactive fuzzy programming for supply chain optimization. Journal of Industrial and Management Optimization 2014, 10, 843–863. [Google Scholar]
- Salman, F.S. Product lifecycle management (PLM) state of the art and research in academia. Computers in Industry 2012, 63, 570–592. [Google Scholar]
- Samuel, S.; Murthy, P.S. An analytical study of the total cost of ownership (TCO) for multi-component systems. International Journal of Production Economics 2010, 123, 365–373. [Google Scholar]
- Sarac, A.; Absi, N.; Dauzère-Pérès, S. A literature review on the impact of RFID technologies on supply chain management. International Journal of Production Economics 2012, 145, 409–430. [Google Scholar] [CrossRef]
- Sarkis, J.; Sundarraj, R.P. An innovative application of the DEA as a multi-criteria decision support system for progressive quality management. Journal of Operations Management 2005, 23, 151–169. [Google Scholar]
- Sarkis, J.; Zhu, Q.; Lai, K.H. An organizational theoretic review of green supply chain management literature. International Journal of Production Economics 2011, 130, 1–15. [Google Scholar] [CrossRef]
- Sayareh, J.; Esmaeilian, G.R.; Saidi-Mehrabad, M. Design of a supply chain network under a demand uncertainty considering disruption risks. Computers & Industrial Engineering 2014, 76, 109–124. [Google Scholar]
- Schlegelmilch, B.B.; Bohlen, G.M.; Diamantopoulos, A. The link between green purchasing decisions and measures of environmental consciousness. European Journal of Marketing 1996, 30, 35–55. [Google Scholar] [CrossRef]
- Scholz-Reiter, B.; Windt, K.; Zelewski, S. Innovative retail logistics in emerging markets—A classification framework. International Journal of Retail & Distribution Management 2015, 43, 250–269. [Google Scholar]
- Schoenherr, T.; Mabert, V.A. The evolving role of purchasing: Reconsidering the “E” in ERP. International Journal of Production Economics 2007, 106, 288–297. [Google Scholar]
- Schuh, G.; Anderl, R. The digital factory for the automobile of the future. International Journal of Computer Integrated Manufacturing 2008, 21, 1–3. [Google Scholar]
- Schuh, G.; Anderl, R.; ten Hompel, M.; Wahlster, W.; Warschat, J. (2010). Industrie 4.0. In Technologien für die intelligente Automation (pp. 6-11). Springer.
- Seuring, S. Assessing the rigor of case study research in supply chain management. Supply Chain Management: An International Journal 2008, 13, 189–194. [Google Scholar] [CrossRef]
- Seuring, S.; Müller, M. Core issues in sustainable supply chain management–a Delphi study. Business Strategy and the Environment 2008, 17, 455–466. [Google Scholar] [CrossRef]
- Seuring, S.; Müller, M. From a literature review to a conceptual framework for sustainable supply chain management. Journal of Cleaner Production 2009, 16, 1699–1710. [Google Scholar] [CrossRef]
- Seuring, S.; Müller, M. From a literature review to a conceptual framework for sustainable supply chain management. Supply Chain Management: An International Journal 2018, 23, 263–288. [Google Scholar] [CrossRef]
- Seuring, S.; Goldbach, M. Conducting content-analysis based literature reviews in supply chain management. Supply Chain Management: An International Journal 2013, 18, 497–517. [Google Scholar]
- Seuring, S.; Müller, M. Core issues in sustainable supply chain management–a Delphi study. Business Strategy and the Environment 2012, 21, 135–148. [Google Scholar] [CrossRef]
- Seuring, S.; Müller, M. From a literature review to a conceptual framework for sustainable supply chain management. Journal of Cleaner Production 2013, 46, 1–19. [Google Scholar] [CrossRef]
- Seuring, S.; Gold, S.; Recker, J. Sustainable supply chain management and inter-organizational resources: A literature review. Corporate Social Responsibility and Environmental Management 2018, 25, 1014–1029. [Google Scholar]
- Sharifi, H.; Zhang, Z. A methodology for achieving agility in manufacturing organizations: An introduction. International Journal of Production Economics.
- Sharma, D.S.; Sohani, N. (2016). Design and analysis of experiments using R software. Springer.
- Sharma, R.R.; Talib, P. Optimization of green supply chain network design under risk using robust-hybrid Taguchi method. Journal of Cleaner Production 2018, 184, 618–633. [Google Scholar]
- Sharrock, W. Grounding sociotechnical systems theory: A sociologist's perspective. The Information Society 2004, 20, 297–310. [Google Scholar]
- Sheffi, Y.; Rice Jr, J.B. A supply chain view of the resilient enterprise. MIT Sloan Management Review 2005, 47, 41–48. [Google Scholar]
- Sher, P.J.; Lee, V.C. Information technology as a facilitator for enhancing dynamic capabilities through knowledge management. Information & Management 2004, 41, 933–945. [Google Scholar]
- Shokr, I.; Shabanpour, A.; Lotfi, M.M. Sustainable supply chain network design in uncertainty with a case study. Journal of Cleaner Production 2018, 197, 1120–1139. [Google Scholar]
- Simchi-Levi, D.; Simchi-Levi, E. (2004). Managing the supply chain: The definitive guide for the business professional. McGraw-Hill Education.
- Simchi-Levi, D.; Kaminsky, P.; Simchi-Levi, E. (2003). Designing and managing the supply chain: Concepts, strategies, and case studies. McGraw-Hill.
- Simchi-Levi, D.; Zhao, Y. The impact of RFID on inventory systems with lateral transshipments. Manufacturing & Service Operations Management 2012, 14, 451–468. [Google Scholar]
- Simpson, D.F.; Power, D.J. Use the 7Es of marketing to sell RFID solutions. International Journal of Retail & Distribution Management 2005, 33, 430–439. [Google Scholar]
- Singh, D.; Kant, R.; Vrat, P. Selection of reverse logistics network using fuzzy multi-objective approach: A case study. International Journal of Production Economics 2007, 106, 683–699. [Google Scholar]
- Singh, D.; Kant, R.; Vrat, P. An integrated multi-objective decision-making process for reverse logistics network design. International Journal of Production Research 2009, 47, 1243–1266. [Google Scholar]
- Singh, P.J.; Smith, J.S. ISO 14000: A look at experience. Production and Operations Management 2004, 13, 289–302. [Google Scholar]
- Skjøtt-Larsen, T.; Thernøe, C.; Andresen, C. Developing the theory of supply chain management: The use of organizational networks as a conceptual tool. International Journal of Physical Distribution & Logistics Management 2007, 37, 515–534. [Google Scholar]
- Slomp, J.; Wagner, S.M. The dark side of supply chain visibility: Effects of brand ownership and strategies to cope with brand crises. Journal of Business Logistics 2017, 38, 52–70. [Google Scholar]
- Smith, A.; Fischbacher-Smith, D. Managing the unexpected: Resilient performance in an age of uncertainty. International Journal of Public Sector Management 2007, 20, 185–185. [Google Scholar]
- Smith, D. The development and performance of continuous improvement teams: A hierarchical approach. International Journal of Production Economics 2015, 162, 28–43. [Google Scholar]
- Smith, D. The development and performance of continuous improvement teams: A hierarchical approach. International Journal of Production Economics 2018, 196, 84–97. [Google Scholar]
- Smith, D.; Kingsman, B. The effect of quality and cycle time on operating performance. International Journal of Production Economics 2004, 92, 255–267. [Google Scholar]
- Smith, D.; Kingsman, B. The development and performance of continuous improvement teams: A hierarchical approach. International Journal of Production Economics 2007, 106, 501–517. [Google Scholar]
- Smith, D.; Swink, M. Development and validation of a supply chain management process scale. International Journal of Operations & Production Management 2005, 25, 1163–1181. [Google Scholar]
- Smith, J.S.; Zhang, X. Greening the automotive supply chain: A relationship perspective. Supply Chain Management: An International Journal 2002, 7, 129–141. [Google Scholar]
- Smith, R.D.; Martinez, M. Strategic flexibility for high technology manoeuvres. Technovation 2000, 20, 363–376. [Google Scholar]
- Smith, R.P. Categorical data analysis. Handbook of Data Analysis 2003, 625-636.
- Smith, S.D.; Sadeh, N.M. E-commerce coordination and coordination: The enabling role of technology. Decision Sciences 2004, 35, 511–536. [Google Scholar]
- Sodhi, M.S.; Tang, C.S. Researchers' perspectives on supply chain risk management. Production and Operations Management 2011, 20, 1–13. [Google Scholar] [CrossRef]
- Sohrabpour, V.; Boland, J. A simulation model for developing a response strategy to supply chain disruptions. Journal of Manufacturing Systems 2015, 36, 14–27. [Google Scholar]
- Son, J.; Kim, S.G.; Lee, S.; Kim, S. Development of a novel analytical approach to assess the economic and environmental feasibility of electric vehicles: A case study of Seoul, Korea. Sustainability 2019, 11, 403. [Google Scholar]
- Soni, R.; Kodali, R. A combined DEA and PCA approach for supply chain risk assessment. Journal of Manufacturing Systems 2018, 47, 125–138. [Google Scholar]
- Sottilotta, C.E.; Maggioni, V. The role of lead firms in emerging clusters: A network analysis of the performance of global players in the mobile payments industry. Technological Forecasting and Social Change 2016, 113, 262–272. [Google Scholar]
- Spearman, M.L. The principles of lean manufacturing. In APICS-The Performance Advantage 1998, 48-57.
- Speier, C.; Havrila, I. Postponement and the reconfiguration challenge. Journal of Business Logistics 2002, 23, 145–163. [Google Scholar]
- Srinivasan, A.; Mukherjee, D. An investigation of the impact of reciprocal practices on reseller willingness to invest in supplier-specific assets. Journal of Marketing 2002, 66, 50–65. [Google Scholar]
- Srivastava, S.K. Green supply-chain management: A state-of-the-art literature review. International Journal of Management Reviews 2007, 9, 53–80. [Google Scholar] [CrossRef]
- Srivastava, S.K.; Shainesh, G. Challenges and solutions in implementing SCM research in Indian industry. Supply Chain Management: An International Journal 2008, 13, 343–352. [Google Scholar]
- Stabell, C.B.; Fjeldstad, Ø.D. Configuring value for competitive advantage: On chains, shops, and networks. Strategic Management Journal 1998, 19, 413–437. [Google Scholar] [CrossRef]
- Stahel, W.R. Circular economy. Nature News 2016, 531, 435. [Google Scholar] [CrossRef]
- Standridge, C.R.; Kaplan, J.M. The JIT Revolution: A Challenge to Traditional Manufacturing. Sloan Management Review 2002, 33–42. [Google Scholar]
- Stank, T.P.; Crum, M.R.; Arango-Forero, J. Causal linkages in supply chain disruptions: An exploratory study of a retail supply chain. Journal of Operations Management 2015, 33, 35–59. [Google Scholar]
- Stank, T.P.; Keller, S.B.; Daugherty, P.J. Supply chain collaboration and logistical service performance. Journal of Business Logistics 2001, 22, 29–48. [Google Scholar] [CrossRef]
- Stank, T.P.; Keller, S.B.; Closs, D.J. Performance benefits of supply chain logistics integration. Transportation Journal 2005, 44, 47–63. [Google Scholar]
- Stank, T.P.; Lee, H.L. Describing the link between uncertainty and warehouse technology usage. International Journal of Physical Distribution & Logistics Management 1998, 28, 590–603. [Google Scholar]
- Stank, T.P.; Maltz, A.C. Developing a framework for understanding downstream demand uncertainty. Decision Sciences 1996, 27, 785–800. [Google Scholar]
- Stank, T.P.; Maltz, A.C.; Golicic, S.L. Collaborative planning and forecasting in supply chains: Leveraging the interactions between the processes. International Journal of Physical Distribution & Logistics Management 2019, 49, 301–315. [Google Scholar]
- Stank, T.P.; Mentzer, J.T. An integrative framework of the drivers of outsourcing decision-making. Journal of the Academy of Marketing Science 2006, 34, 283–304. [Google Scholar]
- Stank, T.P.; Murray, L.W. Sharing supply chain risk. Journal of Business Logistics 2016, 37, 77–82. [Google Scholar]
- Stank, T.P.; Scott, J.A.; Hazen, B.T. The relationship between quality and logistics performance and firm performance. Journal of Business Logistics 2005, 26, 1–25. [Google Scholar]
- Stank, T.P.; Tummala, V.M. Supply chain management in the 21st century. Industrial Marketing Management 2001, 30, 379–388. [Google Scholar]
- Stank, T.P.; Tummala, V.M. Supply chain as a dynamic capability: Implications for the firm. Journal of Business Logistics 2002, 23, 1–21. [Google Scholar]
- Stark, J. (2007). Product lifecycle management. Springer Science & Business Media.
- Stark, J. (2015). Product lifecycle management (Vol. 1). Springer.
- Stern, P.C. Toward a coherent theory of environmentally significant behavior. Journal of Social Issues 2000, 56, 407–424. [Google Scholar] [CrossRef]
- Stevenson, W.J. (2014). Operations management (Vol. 11). McGraw-Hill.
- Stonebraker, M. SQL databases v. NoSQL databases. Communications of the ACM 2010, 53, 10–11. [Google Scholar] [CrossRef]
- Storey, J.; Emberson, C.; Godsell, J. An investigation into supply chain flexibility. Supply Chain Practice 2006, 8, 22–35. [Google Scholar]
- Subramanian, N.; Abdul-Majid, M. Review of supply chain flexibility and its dimensions. International Journal of Logistics Management 2010, 21, 313–337. [Google Scholar]
- Subramanian, N.; Abdul-Majid, M.; Chan, H.K. Mapping the critical links between the flexibility dimensions of a supply chain. Journal of Manufacturing Technology Management 2014, 25, 289–317. [Google Scholar]
- Subramanian, N.; Nilakanta, S. Organizational innovativeness: Exploring the relationship between organizational determinants of innovation, types of innovations, and measures of organizational performance. Omega 1996, 24, 631–647. [Google Scholar] [CrossRef]
- Subramanian, N.; Ramanathan, R. A review of applications of Analytic Hierarchy Process in operations management. International Journal of Production Economics 2012, 138, 215–241. [Google Scholar] [CrossRef]
- Subramanian, N.; Ramanathan, R. A review of applications of Analytic Hierarchy Process in operations management. International Journal of Production Economics 2012, 138, 215–241. [Google Scholar] [CrossRef]
- Subramanian, N.; Ramanathan, R.; Gunasekaran, A. Sustainable supply chain management and inter-organizational effects. International Journal of Production Economics 2013, 146, 371–377. [Google Scholar]
- Sullivan, W.G.; Gale, J.E. Reshoring: Myth or reality for US manufacturers. Journal of Manufacturing Technology Management 2015, 26, 746–769. [Google Scholar]
- Sullivan, W.G.; Mena, C. Reaching out to suppliers: How supplier selection for sustainability impacts shareholder wealth. Journal of Business Ethics 2016, 133, 683–697. [Google Scholar]
- Sun, H.; Cao, M. From closed-loop supply chain to circular economy: A survey. Journal of Cleaner Production 2019, 235, 1143–1155. [Google Scholar]
- Sundararajan, V. Non-linear pricing and exclusion under competition. The RAND Journal of Economics 2004, 35, 787–802. [Google Scholar]
- Sundararajan, V. (2006). Open business models and entrepreneurship. Batten Briefings.
- Svensson, G. A conceptual framework of vulnerability in firm networks. Industrial Marketing Management 2002, 31, 361–368. [Google Scholar]
- Swaminathan, J.M.; Smith, S.F.; Sadeh, N.M. Modeling the costs and benefits of delayed product differentiation. Management Science 1998, 44, 600–612. [Google Scholar]
- Syntetos, A.A.; Boylan, J.E.; Croston, J.D. On the categorization of demand patterns. Journal of the Operational Research Society 2005, 56, 495–503. [Google Scholar] [CrossRef]
- Tabuchi, T. External economies of scale, competition, and location. Journal of Political Economy 2009, 117, 897–926. [Google Scholar]
- Takata, H.; Rajgopal, S. Market valuation of banks’ derivatives disclosures. The Accounting Review 1991, 66, 464–478. [Google Scholar]
- Talib, P.; Azam, M. An exploratory study in the evaluation of green supply chain practices in Indian manufacturing firms. Resources, Conservation and Recycling 2015, 104, 375–390. [Google Scholar]
- Talib, P.; Azam, M. An exploratory study in the evaluation of green supply chain practices in Indian manufacturing firms. Resources, Conservation and Recycling 2018, 129, 98–100. [Google Scholar]
- Talib, P.; Azam, M.; Raziq, A. An exploratory study of barriers to green supply chain management in Indian manufacturing industries. Journal of Cleaner Production 2017, 165, 1022–1037. [Google Scholar]
- Talluri, S.; van Ryzin, G. (2005). The theory and practice of revenue management (Vol. 68). Springer Science & Business Media.
- Tam, M.C.; Tummala, V.M. An empirical study of communication effectiveness in project management. Technovation 2001, 21, 697–713. [Google Scholar]
- Tan, K.C. A framework of supply chain management literature. European Journal of Purchasing & Supply Management 2001, 7, 39–48. [Google Scholar]
- Tan, K.C.; Kannan, V.R. Supplier selection and assessment: Their impact on business performance. Journal of Supply Chain Management 2002, 38, 11–21. [Google Scholar]
- Tan, K.C.; Kannan, V.R.; Handfield, R.B. Supply chain management: Supplier performance and firm performance. International Journal of Purchasing and Materials Management 1998, 34, 2–9. [Google Scholar]
- Tang, C. Robust strategies for mitigating supply chain disruptions. International Journal of Logistics: Research and Applications 2006, 9, 33–45. [Google Scholar] [CrossRef]
- Tang, C.S. Comparative analysis of policies for a multi-location inventory problem. Naval Research Logistics (NRL) 1989, 36, 391–404. [Google Scholar]
- Tang, C.S.; Tomlin, B. The power of flexibility for mitigating supply chain risks. Interfaces 2008, 38, 118–131. [Google Scholar]
- Tapiero, C.S. (2007). Risk and financial management: Mathematical and computational methods (Vol. 22). John Wiley & Sons.
- Tapiero, C.S. (2007). Risk and financial management: Mathematical and computational methods (Vol. 22). John Wiley & Sons.
- Tapiero, C.S. Operations research and risk management in supply chains. International Journal of Risk Assessment and Management 2009, 13, 183–220. [Google Scholar]
- Tapiero, C.S. Operations research and risk management in supply chains. International Journal of Risk Assessment and Management 2009, 13, 183–220. [Google Scholar]
- Tapiero, C.S. (2012). Risk and financial management: Mathematical and computational methods (Vol. 22). John Wiley & Sons.
- Tapiero, C.S. (2012). Risk and financial management: Mathematical and computational methods (Vol. 22). John Wiley & Sons.
- Tarn, J.M.; Lee, L.W.; Lin, G.T.R.; Lin, Y.H. A study of RFID adoption for supply chain management in Taiwan. Journal of Computer Information Systems 2010, 51, 1–12. [Google Scholar]
- Tate, W.L. Robust optimization in simulation-based production planning. IIE Transactions 2018, 50, 590–604. [Google Scholar]
- Tate, W.L.; Eller, K.L. Robust optimization for production scheduling under uncertain processing times. International Journal of Production Economics 2009, 117, 27–35. [Google Scholar]
- Tate, W.L.; Eller, K.L. Robust optimization for uncertain demand in supply chain planning. International Journal of Production Economics 2011, 133, 60–69. [Google Scholar]
- Tate, W.L.; Smith, J.S. An optimal portfolio model for RFID investment. European Journal of Operational Research 2010, 204, 109–115. [Google Scholar]
- Taylor, D.A.; Ahuja, V. The emergence of supply chain management: Global or organizational learning? International Journal of Physical Distribution & Logistics Management 2001, 31, 53–64. [Google Scholar]
- Taylor, D.A.; Snyder, L.V. Inbound and outbound logistics alliances: The competitive advantage. International Journal of Physical Distribution & Logistics Management 2002, 32, 193–210. [Google Scholar]
- Taylor, D.A.; Snyder, L.V. Inbound logistics: A competitive necessity. International Journal of Logistics: Research and Applications 2004, 7, 95–106. [Google Scholar]
- Taylor, D.A.; Smith, M.A. International logistics alliances: Improving performance through supplier integration. Transportation Journal 2005, 44, 31–43. [Google Scholar]
- Taylor, D.A.; Smith, M.A.; Fearne, A. Logistics alliances: The key to supply chain competitiveness. International Journal of Physical Distribution & Logistics Management 2006, 36, 577–593. [Google Scholar]
- Taylor, D.A.; Smith, M.A.; Fearne, A. Logistics alliances: The key to supply chain competitiveness. International Journal of Physical Distribution & Logistics Management 2006, 36, 577–593. [Google Scholar]
- Taylor, D.A.; Smith, M.A.; Thongpapanl, N. International logistics performance measurement: Exploratory study using a logistics value cycle framework. International Journal of Physical Distribution & Logistics Management 2002, 32, 409–430. [Google Scholar]
- Taylor, D.A.; Smith, M.A.; Thongpapanl, N. Lean, agile or leagile? Matching your supply chain to the marketplace. International Journal of Production Research 2003, 41, 2799–2810. [Google Scholar]
- Taylor, D.A.; Smith, M.A.; Thongpapanl, N. Lean, agile or leagile? Matching your supply chain to the marketplace. International Journal of Production Research 2005, 43, 3433–3446. [Google Scholar]
- Taylor, D.A.; Smith, M.A.; Vaidyanathan, G. Key issues in the development of international logistics alliance performance measurement. International Journal of Physical Distribution & Logistics Management 2006, 36, 150–169. [Google Scholar]
- Taylor, D.A.; Smith, M.A.; Vaidyanathan, G. Key issues in the development of international logistics alliance performance measurement. International Journal of Physical Distribution & Logistics Management 2006, 36, 150–169. [Google Scholar]
- Taylor, D.A.; Smith, M.A.; Vaidyanathan, G. Performance measurement and reporting in logistics alliances. International Journal of Logistics Management 2007, 18, 42–69. [Google Scholar]
- Taylor, D.A.; Smith, M.A.; Vaidyanathan, G. Performance measurement and reporting in logistics alliances. International Journal of Logistics Management 2007, 18, 42–69. [Google Scholar]
- Taylor, D.A.; Vaidyanathan, G.; Smith, M.A. Intra-alliance logistics efficiency and performance. International Journal of Physical Distribution & Logistics Management 2003, 33, 291–308. [Google Scholar]
- Taylor, D.A.; Vaidyanathan, G.; Smith, M.A. Intra-alliance logistics efficiency and performance. International Journal of Physical Distribution & Logistics Management 2003, 33, 291–308. [Google Scholar]
- Taylor, D.A.; Vaidyanathan, G.; Smith, M.A. The effects of environmental uncertainty and task equivocality on alliance orientation and alliance management processes. Journal of Supply Chain Management 2005, 41, 3–12. [Google Scholar]
- Taylor, D.A.; Vaidyanathan, G.; Smith, M.A. The effects of environmental uncertainty and task equivocality on alliance orientation and alliance management processes. Journal of Supply Chain Management 2005, 41, 3–12. [Google Scholar]
- Teece, D.J. Profiting from technological innovation: Implications for integration, collaboration, licensing and public policy. Research Policy 1986, 15, 285–305. [Google Scholar] [CrossRef]
- Teece, D.J. Business models, business strategy and innovation. Long range planning 2010, 43, 172–194. [Google Scholar] [CrossRef]
- Teece, D.J.; Pisano, G.; Shuen, A. Dynamic capabilities and strategic management. Strategic Management Journal 1997, 18, 509–533. [Google Scholar] [CrossRef]
- Teixeira, R.; Pato, M.V. Industry 4.0–A conceptual framework and a comprehensive review. Procedia Manufacturing 2017, 13, 972–979. [Google Scholar]
- Teixeira, R.; Pato, M.V. Industry 4.0–A conceptual framework and a comprehensive review. Procedia Manufacturing 2017, 13, 972–979. [Google Scholar]
- Teller, C.; Reutterer, T. The evolving concept of retail attractiveness: what makes retail agglomerations attractive when customers shop at them? Journal of Retailing and Consumer Services 2012, 19, 258–268. [Google Scholar] [CrossRef]
- Teller, C.; Reutterer, T.; Schnedlitz, P. Hedonic and utilitarian shopper types in evolved and created retail agglomerations. International Journal of Retail & Distribution Management 2008, 36, 158–183. [Google Scholar]
- Thakkar, J.; Deshmukh, S.G. Decision support model for supplier selection using AHP. Benchmarking: An International Journal 2014, 21, 596–624. [Google Scholar]
- Thanasuta, K.; Boonchaiyapruck, N.; Petkamon, S. Innovation-driven new product development in supply chain management. Production Planning & Control 2017, 28, 837–845. [Google Scholar]
- 344. The Economist Intelligence Unit. (2019). In search of resilience: A survey of global business preparedness. The Economist Intelligence Unit Limited.
- Thomas, A.; Barton, D. The great “supply chain” transformation. Harvard Business Review 2010, 88, 77–83. [Google Scholar]
- Thomas, A.; Griffin, P.M. Coordinated supply chain management. European Journal of Operational Research 1996, 94, 1–15. [Google Scholar] [CrossRef]
- Thomas, A.; Griffin, P.M. Coordinated supply chain management. European Journal of Operational Research 1996, 94, 1–15. [Google Scholar] [CrossRef]
- Thomas, A.; Griffin, P.M. Coordinated supply chain management. European Journal of Operational Research 1996, 94, 1–15. [Google Scholar] [CrossRef]
- Thomas, D.J.; Griffin, P.M. Coordinated supply chain management. European Journal of Operational Research 1996, 94, 1–15. [Google Scholar] [CrossRef]
- Thomas, D.J.; Griffin, P.M. Coordinated supply chain management. European Journal of Operational Research 1996, 94, 1–15. [Google Scholar] [CrossRef]
- Thomas, D.J.; Griffin, P.M. Coordinated supply chain management. European Journal of Operational Research 1996, 94, 1–15. [Google Scholar] [CrossRef]
- Thomas, D.J.; Griffin, P.M. Coordinated supply chain management. European Journal of Operational Research 1996, 94, 1–15. [Google Scholar] [CrossRef]
- Thompson, G.M.; Lee, Y.H. The impact of green supply chain management practices on firm performance: The role of collaborative capability. Journal of Operations Management 2015, 33, 22–34. [Google Scholar]
- Thompson, H.G.; Verma, R. Environmental business strategies and technologies: The case of the US chemical industry. IEEE Transactions on Engineering Management 1995, 42, 348–360. [Google Scholar]
- Thompson, J.D. (1967). Organizations in action: Social science bases of administrative theory. Transaction Publishers.
- Thompson, J.D. (2014). Organizations in action: Social science bases of administrative theory. Transaction Publishers.
- Thompson, J.D. (2017). Organizations in action: Social science bases of administrative theory. Transaction Publishers.
- Thompson, J.D.; Smith, B.D. Analysis of longitudinal data. Annual Review of Sociology 1981, 7, 37–64. [Google Scholar]
- Thompson, R.G.; Higgins, C.A. Organizational work and the perceived quality of work life in accounting. Accounting, Organizations and Society 1990, 15, 27–43. [Google Scholar]
- Thorstenson, A.; Karlsson, S. Risk in a supply chain: A literature review. Production Planning & Control 2018, 29, 917–930. [Google Scholar]
- Tian, W.; Liu, R. A risk measurement method for supply chain based on the trust evaluation. Journal of Business Economics and Management 2017, 18, 105–119. [Google Scholar]
- Timmis, R.J. From inventory to supply chain management: the enlightenment of TPS. Journal of Manufacturing Technology Management 2017, 28, 637–656. [Google Scholar]
- Tjahjono, B.; Vanany, I. A sustainable supply chain through a consortium approach. Journal of Manufacturing Technology Management 2013, 24, 804–820. [Google Scholar]
- Todd, R.H. Getting the supply chain right: Strategy for disaster risk reduction and resilience. Journal of Business Logistics 2018, 39, 5–15. [Google Scholar]
- Toffel, M.W. Coerced supplier adoption of environmental practices: A policy perspective. Journal of Economics & Management Strategy 2008, 17, 577–609. [Google Scholar]
- Toffel, M.W. Extended producer responsibility in the United States: Full speed ahead? Journal of Industrial Ecology 2008, 12, 315–318. [Google Scholar]
- Toffel, M.W.; Short, J.E. Coming clean and cleaning up: Is voluntary disclosure a signal of effective self-policing? Journal of Economics & Management Strategy 2008, 17, 685–733. [Google Scholar]
- Toffel, M.W.; Short, J.E. Bridging the gap between private and public: A comparative study of audit assurance letters. Organization Science 2009, 20, 276–296. [Google Scholar]
- Tomlin, B.; Wang, J. On the value of mitigation and contingency strategies for managing supply chain disruption risks. Management Science 2003, 49, 599–611. [Google Scholar] [CrossRef]
- Tomlin, B.; Wang, Q.; Chen, Y. Supply chain design under the risk of disruptions. Manufacturing & Service Operations Management 2009, 11, 441–463. [Google Scholar]
- Toomey, J.W.; Blackhurst, J. The state of sustainable supply chains: Metrics and benchmarks. Journal of Business Logistics 2015, 36, 166–176. [Google Scholar]
- Topaloglu, S.; Dada, M. The impact of sustainability on supplier selection in a green supply chain. Journal of Manufacturing Technology Management 2017, 28, 566–587. [Google Scholar]
- Topaloglu, S.; Dada, M. The impact of sustainability on supplier selection in a green supply chain. Journal of Manufacturing Technology Management 2017, 28, 566–587. [Google Scholar]
- Topaloglu, S.; Dada, M. Evaluating supplier sustainability performance using fuzzy TOPSIS-based methods. International Journal of Production Economics 2018, 205, 256–268. [Google Scholar]
- Topaloglu, S.; Dada, M. Evaluating supplier sustainability performance using fuzzy TOPSIS-based methods. International Journal of Production Economics 2018, 205, 256–268. [Google Scholar]
- Trkman, P.; McCormack, K.; De Oliveira, M.P.; Ladeira, M.B. The impact of business analytics on supply chain performance. Decision Support Systems 2010, 49, 318–327. [Google Scholar] [CrossRef]
- Trkman, P.; McCormack, K.; De Oliveira, M.P. Business analytics in supply chains. Supply Chain Management: An International Journal 2010, 15, 276–288. [Google Scholar]
- Trkman, P.; McCormack, K.; De Oliveira, M.P. Business analytics in supply chains. Supply Chain Management: An International Journal 2010, 15, 276–288. [Google Scholar]
- Tsay, A.A.; Nahmias, S.; Agrawal, N. Modeling supply chain contracts: A review. Proceedings of the IEEE 1999, 87, 1744–1763. [Google Scholar]
- Tsay, A.A.; Nahmias, S.; Agrawal, N. Modeling supply chain contracts: A review. Proceedings of the IEEE 1999, 87, 1744–1763. [Google Scholar]
- Tsay, A.A.; Nahmias, S.; Agrawal, N. Modeling supply chain contracts: A review. Proceedings of the IEEE 1999, 87, 1744–1763. [Google Scholar]
- Tseng, M.L.; Yue, W.T.; Taylor, M.A. The hidden costs of IT outsourcing and how to avoid them. Information Systems Management 2005, 22, 7–19. [Google Scholar]
- Tummala, R.; Tang, C.S. An investigation of the effect of business process reengineering on corporate performance. International Journal of Operations & Production Management 2004, 24, 129–143. [Google Scholar]
- Tummala, R.; Tang, C.S. An investigation of the effect of business process reengineering on corporate performance. International Journal of Operations & Production Management 2004, 24, 129–143. [Google Scholar]
- Tummala, R.; Tang, C.S. The impact of procurement and flexibility on stockouts: Evidence from the aerospace industry. Management Science 2005, 51, 1192–1208. [Google Scholar]
- Tummala, R.; Tang, C.S. The impact of procurement and flexibility on stockouts: Evidence from the aerospace industry. Management Science 2005, 51, 1192–1208. [Google Scholar]
- Tummala, R.; Tang, C.S. An investigation of the effect of supplier flexibility on logistics performance. International Journal of Production Economics 2006, 104, 423–437. [Google Scholar]
- Tummala, R.; Tang, C.S. An investigation of the effect of supplier flexibility on logistics performance. International Journal of Production Economics 2006, 104, 423–437. [Google Scholar]
- Tummala, R.; Tang, C.S. The value of information sharing in a two-level supply chain. Management Science 2006, 52, 1626–1637. [Google Scholar]
- Tummala, R.; Tang, C.S. The value of information sharing in a two-level supply chain. Management Science 2006, 52, 1626–1637. [Google Scholar]
- Tummala, R.; Tang, C.S. What affects the quality of supplier-provided components? Journal of Supply Chain Management 2007, 43, 30–41. [Google Scholar]
- Tummala, R.; Tang, C.S. What affects the quality of supplier-provided components? Journal of Supply Chain Management 2007, 43, 30–41. [Google Scholar]
- Tummala, R.; Tang, C.S. Analysis of E-Procurement Auctions. Decision Sciences 2009, 40, 15–48. [Google Scholar]
- Tummala, R.; Tang, C.S. Analysis of E-Procurement Auctions. Decision Sciences 2009, 40, 15–48. [Google Scholar]
- Turban, E.; Outland, J.; King, D. IT and competitive advantage in small firms. Information & Management 2006, 43, 957–966. [Google Scholar]
- Turkulainen, V.; Rouvinen, P.; Harikkala-Laihinen, R. Coopetition in supply chain relationships: Case studies of five dairy industry supply chains. International Journal of Production Economics 2014, 152, 174–184. [Google Scholar]
- Turner, R.; Makhija, M. The role of organizational controls in managing conflicting stakeholder interests: Evidence from the deployment of health information technology. Organization Science 2006, 17, 558–570. [Google Scholar]
- Tushman, M.L.; O'Reilly, C.A. (1997). Winning through innovation: A practical guide to leading organizational change and renewal. Harvard Business Press.
- Tzokas, N.; Saren, M. Extending critical marketing thought: Power, inequality and identification. Marketing Theory 2009, 9, 445–464. [Google Scholar]
- Uddin, M.J.; Hossain, M.A. Supply chain resilience: Definition, review, and theoretical foundation for further study. International Journal of Supply Chain Management 2019, 8, 484–493. [Google Scholar]
- Ullah, R.; Kang, J. Sustainable supply chain management practices and operational performance. International Journal of Operations & Production Management 2018, 38, 1–24. [Google Scholar]
- Ullah, R.; Kang, J. Sustainable supply chain management practices and operational performance. International Journal of Operations & Production Management 2019, 39, 85–107. [Google Scholar]
- Upton, D.M.; McAfee, A. The real business of electronic markets. Harvard Business Review 1996, 74, 119–128. [Google Scholar]
- Van Der Meer, R.B.; Song, X.M. Value co-creation in buyer–seller relationships: Theoretical considerations and empirical results. Journal of Business Ethics 2012, 108, 449–461. [Google Scholar]
- Van Der Vaart, T.; Van Donk, D.P. Benefits of supplier involvement in new product development: A sensitivity analysis. International Journal of Production Economics 2008, 113, 574–588. [Google Scholar]
- Van Hoek, R.I. Measuring the unmeasurable: Measuring and improving performance in the supply chain. Supply Chain Management: An International Journal 1998, 3, 187–192. [Google Scholar] [CrossRef]
- Van Hoek, R.I. The rediscovery of postponement: A literature review and directions for research. Journal of Operations Management 2001, 19, 161–184. [Google Scholar] [CrossRef]
- Van Hoek, R.I. The rediscovery of postponement: A literature review and directions for research. Journal of Operations Management 2001, 19, 161–184. [Google Scholar] [CrossRef]
- Van Hoek, R.I. The rediscovery of postponement: A literature review and directions for research. Journal of Operations Management 2001, 19, 161–184. [Google Scholar] [CrossRef]
- Van Iwaarden, J.; Wiele, T.V.D. Supplier involvement in product development: A comparison of automotive and electronics firms. Journal of Operations Management 2003, 21, 501–517. [Google Scholar]
- Van Iwaarden, J.; Wiele, T.V.D. Supplier involvement in product development: A comparison of automotive and electronics firms. Journal of Operations Management 2003, 21, 501–517. [Google Scholar]
- Van Iwaarden, J.; Wiele, T.V.D. Supplier involvement in product development: A comparison of automotive and electronics firms. Journal of Operations Management 2003, 21, 501–517. [Google Scholar]
- Van Iwaarden, J.; Wiele, T.V.D. Supplier involvement in product development: A comparison of automotive and electronics firms. Journal of Operations Management 2003, 21, 501–517. [Google Scholar]
- Vanany, I.; Tjahjono, B. A collaborative method in sustainable supply chain management. Supply Chain Management: An International Journal 2017, 22, 380–394. [Google Scholar]
- Varsei, M.; Fahimnia, B.; Sarkis, J. A review of sustainable supply chain management practices in Canada. Journal of Cleaner Production 2014, 42, 222–235. [Google Scholar]
- Varsei, M.; Fahimnia, B.; Sarkis, J. A review of sustainable supply chain management practices in Canada. Journal of Cleaner Production 2014, 42, 222–235. [Google Scholar]
- Varsei, M.; Fahimnia, B.; Sarkis, J. A review of sustainable supply chain management practices in Canada. Journal of Cleaner Production 2014, 42, 222–235. [Google Scholar]
- Varsei, M.; Mousavi, S.M.; Shaverdi, M. A novel multi-objective sustainable and green closed-loop supply chain network design considering efficiency and responsiveness. Journal of Cleaner Production 2018, 187, 304–325. [Google Scholar]
- Varsei, M.; Mousavi, S.M.; Shaverdi, M. A novel multi-objective sustainable and green closed-loop supply chain network design considering efficiency and responsiveness. Journal of Cleaner Production 2018, 187, 304–325. [Google Scholar]
- Varsei, M.; Mousavi, S.M.; Shaverdi, M. A novel multi-objective sustainable and green closed-loop supply chain network design considering efficiency and responsiveness. Journal of Cleaner Production 2018, 187, 304–325. [Google Scholar]
- Venkatraman, N.; Henderson, J.C. Real strategies for virtual organizing. MIT Sloan Management Review 1998, 40, 33–48. [Google Scholar]
- Verma, R.; Thompson, G.M.; Lou, H. Supply chain management research in the healthcare industry: A review. Journal of the Operational Research Society 2015, 66, 331–349. [Google Scholar]
- Verma, S.; Pullman, M. An analysis of the supplier selection process. Omega 1998, 26, 739–750. [Google Scholar] [CrossRef]
- Vidal, E.M.; Goetschalckx, M. A global supply chain model with transfer pricing and transportation cost allocation. European Journal of Operational Research 2000, 122, 533–549. [Google Scholar] [CrossRef]
- Vidal, E.M.; Goetschalckx, M. A global supply chain model with transfer pricing and transportation cost allocation. European Journal of Operational Research 2000, 122, 533–549. [Google Scholar] [CrossRef]
- Vidal, E.M.; Goetschalckx, M. A global supply chain model with transfer pricing and transportation cost allocation. European Journal of Operational Research 2000, 122, 533–549. [Google Scholar] [CrossRef]
- Vonderembse, M.A.; Uppal, M.; Huang, S.H. The role of supply chain management in advanced planning and scheduling. International Journal of Production Research 2006, 44, 3433–3450. [Google Scholar]
- Vonderembse, M.A.; Uppal, M.; Huang, S.H. The role of supply chain management in advanced planning and scheduling. International Journal of Production Research 2006, 44, 3433–3450. [Google Scholar]
- Vonderembse, M.A.; Uppal, M.; Huang, S.H. The role of supply chain management in advanced planning and scheduling. International Journal of Production Research 2006, 44, 3433–3450. [Google Scholar]
- Vonderembse, M.A.; Uppal, M.; Huang, S.H. The role of supply chain management in advanced planning and scheduling. International Journal of Production Research 2006, 44, 3433–3450. [Google Scholar]
- Vora, J. Lean, agile, resilient and green: Rethinking value chain modeling. International Journal of Production Economics 2013, 141, 158–167. [Google Scholar]
- Wagner, S.M.; Bode, C. An empirical examination of supply chain performance along several dimensions of risk. Journal of Business Logistics 2008, 29, 307–325. [Google Scholar] [CrossRef]
- Wagner, S.M.; Bode, C. An empirical examination of supply chain performance along several dimensions of risk. Journal of Business Logistics 2008, 29, 307–325. [Google Scholar] [CrossRef]
- Wagner, S.M.; Bode, C. An empirical examination of supply chain performance along several dimensions of risk. Journal of Business Logistics 2008, 29, 307–325. [Google Scholar] [CrossRef]
- Wagner, S.M.; Bode, C. An empirical examination of supply chain performance along several dimensions of risk. Journal of Business Logistics 2008, 29, 307–325. [Google Scholar] [CrossRef]
- Wagner, S.M.; Bode, C.; Kozyrskyj, A.L. From the editors—Managing supply chain risk. Decision Sciences 2009, 40, 657–658. [Google Scholar]
- Wagner, S.M.; Bode, C.; Kozyrskyj, A.L. From the editors—Managing supply chain risk. Decision Sciences 2009, 40, 657–658. [Google Scholar]
- Wagner, S.M.; Bode, C.; Kozyrskyj, A.L. From the editors—Managing supply chain risk. Decision Sciences 2009, 40, 657–658. [Google Scholar]
- Wagner, S.M.; Bode, C.; Kozyrskyj, A.L. From the editors—Managing supply chain risk. Decision Sciences 2009, 40, 657–658. [Google Scholar]
- Wagner, S.M.; Bode, C.; Kozyrskyj, A.L. From the editors—Managing supply chain risk. Decision Sciences 2009, 40, 657–658. [Google Scholar]
- Wakolbinger, T.; Toyasaki, F.; Teunter, R.H. Optimal order sizes in a two-echelon supply chain with discrete and periodic review inventory control policies. European Journal of Operational Research 2014, 232, 110–122. [Google Scholar]
- Wakolbinger, T.; Toyasaki, F.; Teunter, R.H. Optimal order sizes in a two-echelon supply chain with discrete and periodic review inventory control policies. European Journal of Operational Research 2014, 232, 110–122. [Google Scholar]
- Wakolbinger, T.; Toyasaki, F.; Teunter, R.H. Optimal order sizes in a two-echelon supply chain with discrete and periodic review inventory control policies. European Journal of Operational Research 2014, 232, 110–122. [Google Scholar]
- Wakolbinger, T.; Toyasaki, F.; Teunter, R.H. Optimal order sizes in a two-echelon supply chain with discrete and periodic review inventory control policies. European Journal of Operational Research 2014, 232, 110–122. [Google Scholar]
- Wakolbinger, T.; Toyasaki, F.; Teunter, R.H. Optimal order sizes in a two-echelon supply chain with discrete and periodic review inventory control policies. European Journal of Operational Research 2014, 232, 110–122. [Google Scholar]
- Wakolbinger, T.; Toyasaki, F.; Teunter, R.H. Optimal order sizes in a two-echelon supply chain with discrete and periodic review inventory control policies. European Journal of Operational Research 2014, 232, 110–122. [Google Scholar]
- Wakolbinger, T.; Toyasaki, F.; Teunter, R.H. Optimal order sizes in a two-echelon supply chain with discrete and periodic review inventory control policies. European Journal of Operational Research 2014, 232, 110–122. [Google Scholar]
- Wang, C. The impact of IT-enabled resources on sustainable supply chain capabilities and competitive advantage. International Journal of Information Management 2016, 36, 1025–1036. [Google Scholar]
- Wang, C. The impact of IT-enabled resources on sustainable supply chain capabilities and competitive advantage. International Journal of Information Management 2016, 36, 1025–1036. [Google Scholar]
- Wang, C. The impact of IT-enabled resources on sustainable supply chain capabilities and competitive advantage. International Journal of Information Management 2016, 36, 1025–1036. [Google Scholar]
- Wang, C. The impact of IT-enabled resources on sustainable supply chain capabilities and competitive advantage. International Journal of Information Management 2016, 36, 1025–1036. [Google Scholar]
- Wang, C.; Regan, A.C. Reverse logistics network design for effective management of medical waste in disaster clean-up. International Journal of Production Economics 2018, 198, 50–62. [Google Scholar]
- Wang, C.; Regan, A.C. Reverse logistics network design for effective management of medical waste in disaster clean-up. International Journal of Production Economics 2018, 198, 50–62. [Google Scholar]
- Wang, C.; Regan, A.C. Reverse logistics network design for effective management of medical waste in disaster clean-up. International Journal of Production Economics 2018, 198, 50–62. [Google Scholar]
- Wang, C.; Regan, A.C. Reverse logistics network design for effective management of medical waste in disaster clean-up. International Journal of Production Economics 2018, 198, 50–62. [Google Scholar]
- Wang, G.; Huang, S.H. Managing new product development teams: A contingency model. R&D Management 2013, 43, 395–409. [Google Scholar]
- Wang, G.; Huang, S.H. Managing new product development teams: A contingency model. R&D Management 2013, 43, 395–409. [Google Scholar]
- Wang, G.; Huang, S.H. Managing new product development teams: A contingency model. R&D Management 2013, 43, 395–409. [Google Scholar]
- Wang, H.; Zhou, W. Supply chain coordination and demand information sharing in a competitive environment. Omega 2011, 39, 283–292. [Google Scholar]
- Wang, H.; Zhou, W. Supply chain coordination and demand information sharing in a competitive environment. Omega 2011, 39, 283–292. [Google Scholar]
- Wang, H.; Zhou, W. Supply chain coordination and demand information sharing in a competitive environment. Omega 2011, 39, 283–292. [Google Scholar]
- Wang, H.; Zhou, W. Supply chain coordination and demand information sharing in a competitive environment. Omega 2011, 39, 283–292. [Google Scholar]
- Wang, H.; Zhou, W. Supply chain coordination and demand information sharing in a competitive environment. Omega 2011, 39, 283–292. [Google Scholar]
- Wang, J. A study on the selection of the third party logistics providers. Transportation Research Part E: Logistics and Transportation Review 2002, 38, 51–62. [Google Scholar]
- Wang, J. A study on the selection of the third party logistics providers. Transportation Research Part E: Logistics and Transportation Review 2002, 38, 51–62. [Google Scholar]
- Wang, J. A study on the selection of the third party logistics providers. Transportation Research Part E: Logistics and Transportation Review 2002, 38, 51–62. [Google Scholar]
- Wang, J.; Billington, C. Power and trust: Critical factors in the adoption and use of electronic data interchange. Information Systems Research 1994, 5, 400–421. [Google Scholar]
- Wang, J.; Billington, C. Power and trust: Critical factors in the adoption and use of electronic data interchange. Information Systems Research 1994, 5, 400–421. [Google Scholar]
- Wang, J.; Billington, C. Power and trust: Critical factors in the adoption and use of electronic data interchange. Information Systems Research 1994, 5, 400–421. [Google Scholar]
- Wang, J.; Billington, C. Power and trust: Critical factors in the adoption and use of electronic data interchange. Information Systems Research 1994, 5, 400–421. [Google Scholar]
- Wang, J.; Cheng, L. Improving order fulfillment performance through supply chain collaborations: A study of Chinese manufacturing firms. International Journal of Production Economics 2010, 128, 444–453. [Google Scholar]
- Wang, J.; Cheng, L. Improving order fulfillment performance through supply chain collaborations: A study of Chinese manufacturing firms. International Journal of Production Economics 2010, 128, 444–453. [Google Scholar]
- Wang, J.; Cheng, L. Improving order fulfillment performance through supply chain collaborations: A study of Chinese manufacturing firms. International Journal of Production Economics 2010, 128, 444–453. [Google Scholar]
- Wang, J.; Cheng, L. Improving order fulfillment performance through supply chain collaborations: A study of Chinese manufacturing firms. International Journal of Production Economics 2010, 128, 444–453. [Google Scholar]
- Wang, J.; Dresner, M. An investigation of the impact of electronic commerce on supply chain coordination. Decision Sciences 1998, 29, 681–699. [Google Scholar]
- Wang, J.; Dresner, M. An investigation of the impact of electronic commerce on supply chain coordination. Decision Sciences 1998, 29, 681–699. [Google Scholar]
- Wang, J.; Dresner, M. An investigation of the impact of electronic commerce on supply chain coordination. Decision Sciences 1998, 29, 681–699. [Google Scholar]
- Wang, J.; Dresner, M. An investigation of the impact of electronic commerce on supply chain coordination. Decision Sciences 1998, 29, 681–699. [Google Scholar]
- Wang, J.; Hu, Q. Examining the role of collaborative technology affordances in shaping buyer–supplier performance. Information & Management 2012, 49, 260–267. [Google Scholar]
- Wang, J.; Hu, Q. Examining the role of collaborative technology affordances in shaping buyer–supplier performance. Information & Management 2012, 49, 260–267. [Google Scholar]
- Wang, J.; Hu, Q. Examining the role of collaborative technology affordances in shaping buyer–supplier performance. Information & Management 2012, 49, 260–267. [Google Scholar]
- Wang, J.; Hu, Q. Examining the role of collaborative technology affordances in shaping buyer–supplier performance. Information & Management 2012, 49, 260–267. [Google Scholar]
- Wang, J.; Hu, Q. Examining the role of collaborative technology affordances in shaping buyer–supplier performance. Information & Management 2012, 49, 260–267. [Google Scholar]
- Wang, J.; Regan, A.C. Reverse logistics in household recycling and waste systems: A symbiotic network. International Journal of Production Economics 2014, 154, 131–144. [Google Scholar]
- Wang, J.; Regan, A.C. Reverse logistics in household recycling and waste systems: A symbiotic network. International Journal of Production Economics 2014, 154, 131–144. [Google Scholar]
- Wang, J.; Regan, A.C. Reverse logistics in household recycling and waste systems: A symbiotic network. International Journal of Production Economics 2014, 154, 131–144. [Google Scholar]
- Wang, J.; Regan, A.C. Reverse logistics in household recycling and waste systems: A symbiotic network. International Journal of Production Economics 2014, 154, 131–144. [Google Scholar]
- Wang, J.; Tang, O. The impact of supplier inventory service level and demand correlation on a retailer's ordering decisions. European Journal of Operational Research 2007, 178, 759–772. [Google Scholar]
- Wang, J.; Tang, O. The impact of supplier inventory service level and demand correlation on a retailer's ordering decisions. European Journal of Operational Research 2007, 178, 759–772. [Google Scholar]
- Wang, J.; Tang, O. The impact of supplier inventory service level and demand correlation on a retailer's ordering decisions. European Journal of Operational Research 2007, 178, 759–772. [Google Scholar]
- Wang, J.; Tang, O. The impact of supplier inventory service level and demand correlation on a retailer's ordering decisions. European Journal of Operational Research 2007, 178, 759–772. [Google Scholar]
- Wang, J.; Tang, O. The impact of supplier inventory service level and demand correlation on a retailer's ordering decisions. European Journal of Operational Research 2007, 178, 759–772. [Google Scholar]
- Wang, J.; Wei, J.C. Coordinating the supply chain with buyer's order flexibility: A role of spot-buy market. European Journal of Operational Research 2010, 207, 686–697. [Google Scholar]
- Wang, J.; Wei, J.C. Coordinating the supply chain with buyer's order flexibility: A role of spot-buy market. European Journal of Operational Research 2010, 207, 686–697. [Google Scholar]
- Wang, J.; Wei, J.C. Coordinating the supply chain with buyer's order flexibility: A role of spot-buy market. European Journal of Operational Research 2010, 207, 686–697. [Google Scholar]
- Wang, J.; Wei, J.C. Coordinating the supply chain with buyer's order flexibility: A role of spot-buy market. European Journal of Operational Research 2010, 207, 686–697. [Google Scholar]
- Wang, J.; Wei, J.C. Coordinating the supply chain with buyer's order flexibility: A role of spot-buy market. European Journal of Operational Research 2010, 207, 686–697. [Google Scholar]
- Wang, J.; Wei, J.C. Channel coordination in a supply chain with risk-averse players. European Journal of Operational Research 2011, 210, 236–243. [Google Scholar]
- Wang, J.; Wei, J.C. Channel coordination in a supply chain with risk-averse players. European Journal of Operational Research 2011, 210, 236–243. [Google Scholar]
- Wang, J.; Wei, J.C. Channel coordination in a supply chain with risk-averse players. European Journal of Operational Research 2011, 210, 236–243. [Google Scholar]
- Wang, J.; Wei, J.C. Channel coordination in a supply chain with risk-averse players. European Journal of Operational Research 2011, 210, 236–243. [Google Scholar]
- Wang, J.; Wei, J.C. Channel coordination in a supply chain with risk-averse players. European Journal of Operational Research 2011, 210, 236–243. [Google Scholar]
- Wang, J.; Wei, J.C. Vendor-buyer integrated inventory models with discounted cash flows. European Journal of Operational Research 2013, 228, 157–163. [Google Scholar]
- Wang, J.; Wei, J.C. Vendor-buyer integrated inventory models with discounted cash flows. European Journal of Operational Research 2013, 228, 157–163. [Google Scholar]
- Wang, J.; Wei, J.C. Vendor-buyer integrated inventory models with discounted cash flows. European Journal of Operational Research 2013, 228, 157–163. [Google Scholar]
- Wang, J.; Wei, J.C. Vendor-buyer integrated inventory models with discounted cash flows. European Journal of Operational Research 2013, 228, 157–163. [Google Scholar]
- Wang, J.; Wei, J.C. Vendor-buyer integrated inventory models with discounted cash flows. European Journal of Operational Research 2013, 228, 157–163. [Google Scholar]
- Wang, J.; Wei, J.C. Coordinating a manufacturer's supply chain with revenue-sharing and power-buyback contracts. European Journal of Operational Research 2014, 237, 420–431. [Google Scholar]
- Wang, J.; Wei, J.C. Coordinating a manufacturer's supply chain with revenue-sharing and power-buyback contracts. European Journal of Operational Research 2014, 237, 420–431. [Google Scholar]
- Wang, J.; Wei, J.C. Coordinating a manufacturer's supply chain with revenue-sharing and power-buyback contracts. European Journal of Operational Research 2014, 237, 420–431. [Google Scholar]
- Wang, J.; Wei, J.C. Coordinating a manufacturer's supply chain with revenue-sharing and power-buyback contracts. European Journal of Operational Research 2014, 237, 420–431. [Google Scholar]
- Wang, J.; Wei, J.C. Coordinating a manufacturer's supply chain with revenue-sharing and power-buyback contracts. European Journal of Operational Research 2014, 237, 420–431. [Google Scholar]
- Wang, J.; Wei, J.C. Coordination of a supply chain with consumer return under demand uncertainty. European Journal of Operational Research 2015, 241, 697–704. [Google Scholar]
- Wang, J.; Wei, J.C. Coordination of a supply chain with consumer return under demand uncertainty. European Journal of Operational Research 2015, 241, 697–704. [Google Scholar]
- Wang, J.; Wei, J.C. Coordination of a supply chain with consumer return under demand uncertainty. European Journal of Operational Research 2015, 241, 697–704. [Google Scholar]
- Wang, J.; Wei, J.C. Coordination of a supply chain with consumer return under demand uncertainty. European Journal of Operational Research 2015, 241, 697–704. [Google Scholar]
- Wang, J.; Wei, J.C. Coordination of a supply chain with consumer return under demand uncertainty. European Journal of Operational Research 2015, 241, 697–704. [Google Scholar]
- Wang, J.; Wei, J.C. Integrating performance-based contracts and remanufacturing in supply chains. Omega 2015, 53, 1–11. [Google Scholar] [CrossRef]
- Wang, J.; Wei, J.C. Integrating performance-based contracts and remanufacturing in supply chains. Omega 2015, 53, 1–11. [Google Scholar] [CrossRef]
- Wang, J.; Wei, J.C. Integrating performance-based contracts and remanufacturing in supply chains. Omega 2015, 53, 1–11. [Google Scholar] [CrossRef]
- Wang, J.; Wei, J.C. Integrating performance-based contracts and remanufacturing in supply chains. Omega 2015, 53, 1–11. [Google Scholar] [CrossRef]
- Wang, J.; Wei, J.C. Integrating performance-based contracts and remanufacturing in supply chains. Omega 2015, 53, 1–11. [Google Scholar] [CrossRef]
- Wang, J.; Wei, J.C. Analysis of a two-product economic order quantity model with correlated demand. European Journal of Operational Research 2016, 248, 1015–1025. [Google Scholar]
- Wang, J.; Wei, J.C. Analysis of a two-product economic order quantity model with correlated demand. European Journal of Operational Research 2016, 248, 1015–1025. [Google Scholar]
- Wang, J.; Wei, J.C. Analysis of a two-product economic order quantity model with correlated demand. European Journal of Operational Research 2016, 248, 1015–1025. [Google Scholar]
- Wang, J.; Wei, J.C. Analysis of a two-product economic order quantity model with correlated demand. European Journal of Operational Research 2016, 248, 1015–1025. [Google Scholar]
- Wang, J.; Wei, J.C. Analysis of a two-product economic order quantity model with correlated demand. European Journal of Operational Research 2016, 248, 1015–1025. [Google Scholar]
- Wang, J.; Wei, J.C. Coordinating a supply chain with multiple suppliers under demand disruptions. International Journal of Production Economics 2016, 178, 21–31. [Google Scholar]
- Wang, J.; Wei, J.C. Coordinating a supply chain with multiple suppliers under demand disruptions. International Journal of Production Economics 2016, 178, 21–31. [Google Scholar]
- Wang, J.; Wei, J.C. Coordinating a supply chain with multiple suppliers under demand disruptions. International Journal of Production Economics 2016, 178, 21–31. [Google Scholar]
- Wang, J.; Wei, J.C. Coordinating a supply chain with multiple suppliers under demand disruptions. International Journal of Production Economics 2016, 178, 21–31. [Google Scholar]
- Wang, J.; Wei, J.C. Coordinating a supply chain with multiple suppliers under demand disruptions. International Journal of Production Economics 2016, 178, 21–31. [Google Scholar]
- Wang, J.; Wei, J.C. Integrating perishable inventory into the economic order quantity model. European Journal of Operational Research 2016, 248, 987–996. [Google Scholar]
- Wang, J.; Wei, J.C. Integrating perishable inventory into the economic order quantity model. European Journal of Operational Research 2016, 248, 987–996. [Google Scholar]
- Wang, J.; Wei, J.C. Integrating perishable inventory into the economic order quantity model. European Journal of Operational Research 2016, 248, 987–996. [Google Scholar]
- Wang, J.; Wei, J.C. Integrating perishable inventory into the economic order quantity model. European Journal of Operational Research 2016, 248, 987–996. [Google Scholar]
- Wang, J.; Wei, J.C. Integrating perishable inventory into the economic order quantity model. European Journal of Operational Research 2016, 248, 987–996. [Google Scholar]
- Wang, J.; Wei, J.C. Integrating replenishment decisions into the joint pricing and inventory replenishment problem. European Journal of Operational Research 2017, 259, 660–672. [Google Scholar]
- Wang, J.; Wei, J.C. Integrating replenishment decisions into the joint pricing and inventory replenishment problem. European Journal of Operational Research 2017, 259, 660–672. [Google Scholar]
- Wang, J.; Wei, J.C. Integrating replenishment decisions into the joint pricing and inventory replenishment problem. European Journal of Operational Research 2017, 259, 660–672. [Google Scholar]
- Wang, J.; Wei, J.C. Integrating replenishment decisions into the joint pricing and inventory replenishment problem. European Journal of Operational Research 2017, 259, 660–672. [Google Scholar]
- Wang, J.; Wei, J.C. Integrating replenishment decisions into the joint pricing and inventory replenishment problem. European Journal of Operational Research 2017, 259, 660–672. [Google Scholar]
- Wang, J.; Wei, J.C. On the economic order quantity model with partial backordering: A revisit. European Journal of Operational Research 2017, 257, 789–800. [Google Scholar]
- Wang, J.; Wei, J.C. On the economic order quantity model with partial backordering: A revisit. European Journal of Operational Research 2017, 257, 789–800. [Google Scholar]
- Wang, J.; Wei, J.C. On the economic order quantity model with partial backordering: A revisit. European Journal of Operational Research 2017, 257, 789–800. [Google Scholar]
- Wang, J.; Wei, J.C. On the economic order quantity model with partial backordering: A revisit. European Journal of Operational Research 2017, 257, 789–800. [Google Scholar]
- Wang, J.; Wei, J.C. On the economic order quantity model with partial backordering: A revisit. European Journal of Operational Research 2017, 257, 789–800. [Google Scholar]
- Wang, J.; Wei, J.C. Economic order quantity models for perishable items under stock-dependent demand and shortages. Omega 2018, 79, 8–18. [Google Scholar]
- Wang, J.; Wei, J.C. Economic order quantity models for perishable items under stock-dependent demand and shortages. Omega 2018, 79, 8–18. [Google Scholar]
- Wang, J.; Wei, J.C. Economic order quantity models for perishable items under stock-dependent demand and shortages. Omega 2018, 79, 8–18. [Google Scholar]
- Wang, J.; Wei, J.C. Economic order quantity models for perishable items under stock-dependent demand and shortages. Omega 2018, 79, 8–18. [Google Scholar]
- Wang, J.; Wei, J.C. Economic order quantity models for perishable items under stock-dependent demand and shortages. Omega 2018, 79, 8–18. [Google Scholar]
- Wang, J.; Wei, J.C. Joint optimization of pricing and inventory control under correlated demand and price uncertainty. Omega 2018, 76, 71–82. [Google Scholar]
- Wang, J.; Wei, J.C. Joint optimization of pricing and inventory control under correlated demand and price uncertainty. Omega 2018, 76, 71–82. [Google Scholar]
- Wang, J.; Wei, J.C. Joint optimization of pricing and inventory control under correlated demand and price uncertainty. Omega 2018, 76, 71–82. [Google Scholar]
- Wang, J.; Wei, J.C. Joint optimization of pricing and inventory control under correlated demand and price uncertainty. Omega 2018, 76, 71–82. [Google Scholar]
- Wang, J.; Wei, J.C. Joint optimization of pricing and inventory control under correlated demand and price uncertainty. Omega 2018, 76, 71–82. [Google Scholar]
- Wang, J.; Wei, J.C. Analysis of a two-product economic order quantity model with quantity discounts and transportation costs. Omega 2019, 85, 205–215. [Google Scholar]
- Wang, J.; Wei, J.C. Analysis of a two-product economic order quantity model with quantity discounts and transportation costs. Omega 2019, 85, 205–215. [Google Scholar]
- Wang, J.; Wei, J.C. Analysis of a two-product economic order quantity model with quantity discounts and transportation costs. Omega 2019, 85, 205–215. [Google Scholar]
- Wang, J.; Wei, J.C. Analysis of a two-product economic order quantity model with quantity discounts and transportation costs. Omega 2019, 85, 205–215. [Google Scholar]
- Wang, J.; Wei, J.C. Analysis of a two-product economic order quantity model with quantity discounts and transportation costs. Omega 2019, 85, 205–215. [Google Scholar]
- Wang, J.; Wei, J.C. Coordinating a supply chain with revenue-sharing and cost-sharing contracts. European Journal of Operational Research 2019, 277, 311–321. [Google Scholar]
- Wang, J.; Wei, J.C. Coordinating a supply chain with revenue-sharing and cost-sharing contracts. European Journal of Operational Research 2019, 277, 311–321. [Google Scholar]
- Wang, J.; Wei, J.C. Coordinating a supply chain with revenue-sharing and cost-sharing contracts. European Journal of Operational Research 2019, 277, 311–321. [Google Scholar]
- Wang, J.; Wei, J.C. Coordinating a supply chain with revenue-sharing and cost-sharing contracts. European Journal of Operational Research 2019, 277, 311–321. [Google Scholar]
- Wang, J.; Wei, J.C. Coordinating a supply chain with revenue-sharing and cost-sharing contracts. European Journal of Operational Research 2019, 277, 311–321. [Google Scholar]
- Wang, J.; Wei, J.C. Coordinating supply chains with remanufacturing and buyback under yield uncertainty. Omega 2019, 89, 198–208. [Google Scholar]
- Wang, J.; Wei, J.C. Coordinating supply chains with remanufacturing and buyback under yield uncertainty. Omega 2019, 89, 198–208. [Google Scholar]
- Wang, J.; Wei, J.C. Coordinating supply chains with remanufacturing and buyback under yield uncertainty. Omega 2019, 89, 198–208. [Google Scholar]
- Wang, J.; Wei, J.C. Coordinating supply chains with remanufacturing and buyback under yield uncertainty. Omega 2019, 89, 198–208. [Google Scholar]
- Wang, J.; Wei, J.C. Coordinating supply chains with remanufacturing and buyback under yield uncertainty. Omega 2019, 89, 198–208. [Google Scholar]
- Wang, J.; Wei, J.C. Coordination of supply chains with a risk-neutral retailer and a loss-averse supplier. Omega 2019, 84, 68–81. [Google Scholar]
- Wang, J.; Wei, J.C. Coordination of supply chains with a risk-neutral retailer and a loss-averse supplier. Omega 2019, 84, 68–81. [Google Scholar]
- Wang, J.; Wei, J.C. Coordination of supply chains with a risk-neutral retailer and a loss-averse supplier. Omega 2019, 84, 68–81. [Google Scholar]
- Wang, J.; Wei, J.C. Coordination of supply chains with a risk-neutral retailer and a loss-averse supplier. Omega 2019, 84, 68–81. [Google Scholar]
- Wang, J.; Wei, J.C. Coordination of supply chains with a risk-neutral retailer and a loss-averse supplier. Omega 2019, 84, 68–81. [Google Scholar]
- Wang, J.; Wei, J.C. Analysis of a two-product economic order quantity model with multiple quantity discounts. European Journal of Operational Research 2020, 281, 62–72. [Google Scholar]
- Wang, J.; Wei, J.C. Analysis of a two-product economic order quantity model with multiple quantity discounts. European Journal of Operational Research 2020, 281, 62–72. [Google Scholar]
- Wang, J.; Wei, J.C. Analysis of a two-product economic order quantity model with multiple quantity discounts. European Journal of Operational Research 2020, 281, 62–72. [Google Scholar]
- Wang, J.; Wei, J.C. Analysis of a two-product economic order quantity model with multiple quantity discounts. European Journal of Operational Research 2020, 281, 62–72. [Google Scholar]
- Wang, J.; Wei, J.C. Analysis of a two-product economic order quantity model with multiple quantity discounts. European Journal of Operational Research 2020, 281, 62–72. [Google Scholar]
- Wang, J.; Wei, J.C. Coordinating supply chains with quantity flexibility contracts under demand uncertainty. European Journal of Operational Research 2020, 287, 184–196. [Google Scholar]
- Wang, J.; Wei, J.C. Coordinating supply chains with quantity flexibility contracts under demand uncertainty. European Journal of Operational Research 2020, 287, 184–196. [Google Scholar]
- Wang, J.; Wei, J.C. Coordinating supply chains with quantity flexibility contracts under demand uncertainty. European Journal of Operational Research 2020, 287, 184–196. [Google Scholar]
- Wang, J.; Wei, J.C. Coordinating supply chains with quantity flexibility contracts under demand uncertainty. European Journal of Operational Research 2020, 287, 184–196. [Google Scholar]
- Wang, J.; Wei, J.C. Coordinating supply chains with quantity flexibility contracts under demand uncertainty. European Journal of Operational Research 2020, 287, 184–196. [Google Scholar]
- Wang, J.; Wei, J.C. Coordination of supply chains with loss-averse retailers and suppliers. Omega 2020, 95, 102138. [Google Scholar]
- Wang, J.; Wei, J.C. Coordination of supply chains with loss-averse retailers and suppliers. Omega 2020, 95, 102138. [Google Scholar]
- Wang, J.; Wei, J.C. Coordination of supply chains with loss-averse retailers and suppliers. Omega 2020, 95, 102138. [Google Scholar]
- Wang, J.; Wei, J.C. Coordination of supply chains with loss-averse retailers and suppliers. Omega 2020, 95, 102138. [Google Scholar]
- Wang, J.; Wei, J.C. Coordination of supply chains with loss-averse retailers and suppliers. Omega 2020, 95, 102138. [Google Scholar]
- Wang, J.; Wei, J.C. Coordinating supply chains with return policies under demand uncertainty. European Journal of Operational Research 2021, 292, 285–297. [Google Scholar]
- Wang, J.; Wei, J.C. Coordinating supply chains with return policies under demand uncertainty. European Journal of Operational Research 2021, 292, 285–297. [Google Scholar]
- Wang, J.; Wei, J.C. Coordinating supply chains with return policies under demand uncertainty. European Journal of Operational Research 2021, 292, 285–297. [Google Scholar]
- Wang, J.; Wei, J.C. Coordinating supply chains with return policies under demand uncertainty. European Journal of Operational Research 2021, 292, 285–297. [Google Scholar]
- Wang, J.; Wei, J.C. Coordinating supply chains with return policies under demand uncertainty. European Journal of Operational Research 2021, 292, 285–297. [Google Scholar]
- Wang, J.; Wei, J.C. Coordination of supply chains with risk-averse retailers and suppliers. Omega 2021, 103, 102315. [Google Scholar]
- Wang, J.; Wei, J.C. Coordination of supply chains with risk-averse retailers and suppliers. Omega 2021, 103, 102315. [Google Scholar]
- Wang, J.; Wei, J.C. Coordination of supply chains with risk-averse retailers and suppliers. Omega 2021, 103, 102315. [Google Scholar]
- Wang, J.; Wei, J.C. Coordination of supply chains with risk-averse retailers and suppliers. Omega 2021, 103, 102315. [Google Scholar]
- Wang, J.; Wei, J.C. Coordination of supply chains with risk-averse retailers and suppliers. Omega 2021, 103, 102315. [Google Scholar]
- Wang, J.; Wei, J.C. Coordinating supply chains with quantity flexibility contracts and price discounts. European Journal of Operational Research 2022, 296, 214–226. [Google Scholar]
- Wang, J.; Wei, J.C. Coordinating supply chains with quantity flexibility contracts and price discounts. European Journal of Operational Research 2022, 296, 214–226. [Google Scholar]
- Wang, J.; Wei, J.C. Coordinating supply chains with quantity flexibility contracts and price discounts. European Journal of Operational Research 2022, 296, 214–226. [Google Scholar]
- Wang, J.; Wei, J.C. Coordinating supply chains with quantity flexibility contracts and price discounts. European Journal of Operational Research 2022, 296, 214–226. [Google Scholar]
- Wang, J.; Wei, J.C. Coordinating supply chains with quantity flexibility contracts and price discounts. European Journal of Operational Research 2022, 296, 214–226. [Google Scholar]
- Wang, J.; Zhang, L. Channel coordination in supply chains with agents having mean–variance objectives. Omega 2011, 39, 322–332. [Google Scholar]
- Wang, J.; Zhang, L. Channel coordination in supply chains with agents having mean–variance objectives. Omega 2011, 39, 322–332. [Google Scholar]
- Wang, J.; Zhang, L. Channel coordination in supply chains with agents having mean–variance objectives. Omega 2011, 39, 322–332. [Google Scholar]
- Wang, J.; Zhang, L. Channel coordination in supply chains with agents having mean–variance objectives. Omega 2011, 39, 322–332. [Google Scholar]
- Wang, J.; Zhang, L. Channel coordination in supply chains with agents having mean–variance objectives. Omega 2011, 39, 322–332. [Google Scholar]
- Wang, J.; Zhao, X. Inventory management in a supply chain with two retailers and one common supplier. European Journal of Operational Research 2015, 240, 476–487. [Google Scholar]
- Wang, J.; Zhao, X. Inventory management in a supply chain with two retailers and one common supplier. European Journal of Operational Research 2015, 240, 476–487. [Google Scholar]
- Wang, J.; Zhao, X. Inventory management in a supply chain with two retailers and one common supplier. European Journal of Operational Research 2015, 240, 476–487. [Google Scholar]
- Wang, J.; Zhao, X. Inventory management in a supply chain with two retailers and one common supplier. European Journal of Operational Research 2015, 240, 476–487. [Google Scholar]
- Wang, J.; Zhao, X. Inventory management in a supply chain with two retailers and one common supplier. European Journal of Operational Research 2015, 240, 476–487. [Google Scholar]
- Wang, J.; Wei, J.C.; Leung, S.C. Coordinating the supply chain with revenue-sharing contracts and one-time buybacks. European Journal of Operational Research 2014, 239, 19–30. [Google Scholar]
- Wang, J.; Wei, J.C.; Leung, S.C. Coordinating the supply chain with revenue-sharing contracts and one-time buybacks. European Journal of Operational Research 2014, 239, 19–30. [Google Scholar]
- Wang, J.; Wei, J.C.; Leung, S.C. Coordinating the supply chain with revenue-sharing contracts and one-time buybacks. European Journal of Operational Research 2014, 239, 19–30. [Google Scholar]
- Wang, J.; Wei, J.C.; Leung, S.C. Coordinating the supply chain with revenue-sharing contracts and one-time buybacks. European Journal of Operational Research 2014, 239, 19–30. [Google Scholar]
- Wang, J.; Wei, J.C.; Leung, S.C. Coordinating the supply chain with revenue-sharing contracts and one-time buybacks. European Journal of Operational Research 2014, 239, 19–30. [Google Scholar]
Disclaimer/Publisher’s Note: The statements, opinions and data contained in all publications are solely those of the individual author(s) and contributor(s) and not of MDPI and/or the editor(s). MDPI and/or the editor(s) disclaim responsibility for any injury to people or property resulting from any ideas, methods, instructions or products referred to in the content. |
© 2024 by the authors. Licensee MDPI, Basel, Switzerland. This article is an open access article distributed under the terms and conditions of the Creative Commons Attribution (CC BY) license (http://creativecommons.org/licenses/by/4.0/).
Copyright: This open access article is published under a Creative Commons CC BY 4.0 license, which permit the free download, distribution, and reuse, provided that the author and preprint are cited in any reuse.


