
Submitted:
27 November 2025
Posted:
02 December 2025
You are already at the latest version
Abstract
The study analyzed urban growth (UG) and land surface temperature (LST) of Asaba and Abuja in Nigeria from 1986 to 2022. Landsat 5 TM imagery of 1986, Landsat 7 ETM of 2000, and Landsat OLI/TIRS of 2022, of 30m resolutions, were obtained for the determination of both LST and UG analyses. The UG analysis was subjected to the supervised classification of the maximum likelihood module to generate the different land use/ land cover of the study area. Descriptive statistics involving the frequency and percentage were used for the data analysis. Findings from the study revealed that the mean LST, which was 33.38 °C in 1986, decreased to 28.25 in 2002 and subsequently 28.98oC in 2022, while the built-up Area representing urban development increased from 14% in 1986 to 65% in 2022. The UG was significantly increasing at the rate of 242% while LST increased at 7 °C within the period under consideration. The study concludes that the increase in the built-up area is responsible for the increase in the land surface temperature in Asaba and Abuja Metropolis. The authors recommend that LST parameters be taken into consideration for sustainable urban planning to be achieved in the city. Policymakers at all levels need to scale up measures to mitigate the adverse impact of urban heat islands by suggesting a clustered greening of the entire urban landscape. The study has also provided pathways in addressing the complexity of land surface temperature and the future urban development of the city of Asaba and Abuja.
Keywords:
urban growth
; land surface temperature
; LULC
; urban NDVI
; Asaba Abuja
; Nigeria
1. Introduction
A recent report on global urbanization growth by the United Nations Population Fund (UNFPA,2022) indicates that more than half of the global population now lives in cities and urban centers, with a projection that by 2030, the urban population could exceed 5 billion. The report further revealed that most of the increasing surge in urban growth is expected to occur in developing countries, including Nigeria. Similarly, in 2016, UN-Habitat affirmed that the population of developing countries would double by 2030, with cities expanding to triple their current size.
Although urbanization accounts for the rapid transformation of cities globally, the impact on the environment manifests in changes in loss of biodiversity and habitat, alteration of the hydrological cycle, air pollution, changes in local climate through modification of albedo and conversion of the natural vegetation into other imperious surfaces to meet growing urban demand are some of the major drivers of increase in land surface temperature of urban areas compared to surrounding hinterland (Luo and Wu,2021). However, despite Africa being in the global south on account of underdevelopment, her rate of urban growth is seen as one the fastest in the world from about 28% in 1980 (Roxburgh et al., 2018) to 43% in 2018 and projected to be about 60% by 2050 (Kwofie, et, al, 2022). Unfortunately, most of the urban areas in Africa have been unplanned and unregulated, worsened by the legacy of structural adjustment and colonialism.
Increased urban growth in cities also accounts for land use and land cover (LULC) changes that significantly alter natural vegetation and enhance impervious surfaces, which serve as additional support for heating and land surface temperature changes (Oke, 1982; Swain et al., 2017; Han et al., 2020). The increase in urban growth and land cover is the major driver of reduced vegetation, which further amplifies LST changes; thus LST is an important indicator of urban climate studies (Chen and Zhang, 2017). Urbanization, associated with Land use and land cover changes, also accounts for the phenomenon of Urban Heat Island, a concept that describes how dense populations and concrete buildings contribute to significant warming (Heat) of urban areas (Kanga et al., 2022). The effect of urban heat islands on ecosystems and human thermal comfort is enormous and has been identified as one of the challenges confronting modern cities, particularly in developing countries, given their geographic location in the tropics (Igun and Williams, 2018). The phenomenon of UHI emanates from a reduction in vegetation cover and from the fact that cities are constructed with highly impervious and absorptive materials such as concrete that absorb large amounts of solar radiation, thereby increasing the land surface temperature of urban areas. The increase in surface temperature leads to increased outdoor and indoor thermal discomfort with a concomitant effect on health-related risks (Mushore et al. 2017a, Tarawally et al. 2018 and Obiefunna, et, al,2021). Therefore, it’s imperative to understand the nexus between urban growth and land surface temperature in Nigeria’s growing cities. Land surface temperature (LST) has emerged as an important variable in determining UHI, which is fundamental to our understanding of the Earth’s surface energy balance and surface physical and chemical processes of heat transfer. Furthermore, changes in urban land use and land cover are now increasingly used as an important consideration in explaining land-surface temperature processes at both regional and global scale that serves as feedback mechanisms of the Earth’s energy balance (Gupta, et al., 2023). There is agreement in urban surface temperature modeling that urban areas possess higher thermal capacity, in which the diurnal heat stored during the day is released at night. In predicting land surface temperatures from urban land cover changes, remote sensing, and other geospatial techniques have gained more research attention than the use of meteorological data owing to the sparse and insufficient of meteorological stations in developing countries. Remote sensing and satellite technologies have proved pivotal in understanding the role of urban growth in land temperature studies and risk analysis at different scales (Zhou, et al.,2019)
Studies of the linkage between urban growth and land surface temperature with perspectives from developing countries. Gutpta, et, al, 2023 in their studies of characterizing urban growth and land surface temperature in the western Himalayan cities of India using Remote sensing, revealed in their research that temperature hotspots were highest in urban areas with a strong relationship in LST and biophysical parameters. Also, a comparative study of urban land cover and land use changes in Mumbai and Delhi revealed that the intensity of the UHI was higher in Mumbai than in Delhi due to changes in vegetation cover attributed to urban development (Grover and Singh, 2015). Similarly, Kanga, et, al, (2022), examined the linkage between urban growth and land surface temperature in Bangalore city of India, and the study outcome indicates that the impact of urbanization was evident in Bangalore’s land temperature changes between 2001 and 2021, showing the average temperature increased by 0.34 ◦C per year between the highest UHI events. Achmad et, al, (2022) in their studies of urban growth and its impact on land surface temperature in the industrial city of Aceh, Indonesia, noted that Build-up increased significantly from increased from 2025 ha to 3060.85 ha, while from 2009 to 2018, it increased from 3060.85 to 3783.63 ha. Elsewhere in China, Luo and Wu, (2020) studied the effects of Land surface temperature in the city of Taiyuan, China, and found that the average surface temperature of Taiyuan city has increased by 5.17 °C during the past 24 years from 1990 to 2014, while the impervious surface area has increased by 223.53 km2, which is 1.179 times of that in 1990.
In Nigeria, studies of the impact of the relationship between urban growth and land surface temperature have been investigated in different cities Nwilo et al. (2018) in Lagos, Nigeria estimated the overall increase in the LST using NDVI. However, this index only shows results for only two land surface features, hence neglecting others. Similarly, Nwaerema et al. (2019) in their study of geospatial analysis of land surface in Port Harcourt Metropolis in the Niger Delta region of Nigeria, indicated that LST concentrates more in areas of dense economic activities and urban structures and affirmed the progression of LST in the city which is one of the drivers of heat waves and UHI. Ayansina et, al 2021 focused on various LST intensities over four ecological zones in Nigeria, Obiefuna et, al 2018 analysed LST in response to land cover changes in Lagos, Western Nigeria, while Nwarema, et, al 2019 concentrated on LST and emissivity in both Port Harcourt and Lapai in Northern Nigeria. All studies affirm that a relationship exists between changes in land use and land cover and their influence on land surface temperature variation.
With the increasing rate of human activities in the Niger Delta region of Nigeria as the hub of oil and gas exploration and exploitation, there has been a surge in urban development with a significant impact on land surface temperature leading to urban Heat Island UHI formation in the Region and Land surface temperature changes. Furthermore, the increasing rate of humans induces global warming, coupled with uncontrolled urban growth in Nigerian cities. It has become critical to study the linkage between urban growth and LST in Asaba to develop appropriate management and policy actions for climate change mitigation. Asaba has been expanding rapidly, especially in the last two decades, owing to its status as a state capital and gateway to the eastern corridor of Nigeria. The expansion of Asaba as a modern city with a huge population concentration implies increased conversion of the natural vegetation for urban development, leading to land surface temperature and elevated warming
Similarly, Abuja, Nigeria’s capital, is one of the country’s rapidly expanding cities, although the city has witnessed increased pressure in recent years from population explosion and accelerated urban growth, leading to changes in land use and land cover with implications for Land surface temperature dynamics of the city with corresponding warming of the urban landscape with reduced vegetation cover compared to the rural settings with undisturbed vegetation. Notwithstanding the interest urban growth and land surface temperature studies have generated, only a few studies have been conducted on a comparative assessment of urban growth and land surface temperature variation in Nigeria’s burgeoning cities, and this is the gap the current study intends to fill.
This study therefore was carried out in Asaba, the capital of Delta state in the Niger Delta region and Abuja, the capital of Nigeria. The objective of the study is therefore to examine the spatial pattern of urban growth, changes in land use and cover of Asaba and Abuja from 1986-2020, and to analyze the extent to which the observed changes have impacted on Land surface temperature of the city using high-resolution satellite datasets and GIS techniques. In addition, the study also focuses on the city’s distribution of LST, NDVI, and statistically correlates LST with satellite-derived indices using NDVI
2. Materials and Methods
2.1. The Study Area
The city of Asaba which is the capital of the oil-rich Delta state of Nigeria falls approximately between Latitude 60 40I - 60 15IN and Longitude 6 0 40I E - 60 45I E, is bound on the east and northeast by the River Niger and on the west by the rolling slopes of the Asaba plateau, as shown in Figure 1. Asaba has a population of 3,218,332 (NPC 2006) and a growth rate of about 1.5%. It occupies an area of 300 square kilometers with an average temperature of 32oC and rainfall during the rainy season is 2,700 mm. The River Niger and the Asaba Plateau with its undulating slopes dominate the Asaba landscape. Asaba forms a connector between western, eastern, and northern Nigeria through the River Niger from the north and via the Asaba Niger Bridge, an east-west link and a Nigerian landmark (Enarrube and Atedhor,2015).
Abuja, the Federal Capital Territory (FCT), of Nigeria, is in Nigeria’s North-central region at about 840 m above mean sea level. It is located between Latitude 8°24′ N and 9°28′ N and Longitude 6°40′ E and 7°45′ E with an area of approximately 7760 square kilometers, as shown in Figure 1. The city experiences a wet and dry climatic condition, according to the Koppe classification of climate, with an annual temperature ranging between 30–37 °C and a mean annual total precipitation of approximately 1650 mm per annum (Segun,et al, 2020) The population of Abuja has grown significantly over the years due to the concentration of government ministries, agencies, and parastatals from 364,086 in 1991 to 1,429,801 in 2006 (NPC,2006). The city’s population is further projected to be over 5 million by 2030, with concomitant impact on land-use changes, land surface temperature changes, and a modification of the city’s microclimate.
2.2. Method of Analysis
To assess urban land cover/land use change and its implications on the land surface temperature of the study area, a change detection analysis was performed to determine the nature, extent, and rate of change over time.
2.2.1. Methodology
Image geo-processing for Landuse change and Percentage Change
The study made use of multi-spectral satellite images of Landsat 5TM of 1986; Landsat 7 ETM of 2002 and Landsat 8 OLI/TIRS of 2022; all having some characteristics as presented in Table 1 were used for the landuse/land cover maps. The bands of the images were enhanced by combining image bands from 1 to 7 using the composite tool in ArcGIS 10.7. Information from each land cover class was collected from an extensive field survey before the classification of satellite imagery. The field survey was performed throughout the study area with the use of a global positioning system (GPS) to track the coordinates of the sample points in each land use/land cover. The field work was conducted to ground-truth the status of vegetation cover and development in each study location. Thereafter, supervised classification using maximum likelihood algorithm classifiers in (Lillesand and Kiefer, 1994) was used to classify similar spectral signatures into various classes which included thick vegetation, waterbodies, swamp forest, farmlands and built-up area as found in Asaba Metropolis and in FCT Abuja the landuse included waterbodies, vegetation, bare lands/rock outcrop, farmlands, and built up area. A maximum likelihood classifier was chosen because it is the most widely adopted parametric classification algorithm (Manandhar et al., 2009). The area of each landuse class was computed which was used to compute the landuse change and percentage change in squared kilometers. The percentage change was computed using Equation (1) as given in Enaruvbe and Atedhor (2015).
Where,
d is the difference in the value of the area covered by a land cover category at the initial time point and final time point
t1 is the value of the area covered by a land cover category in the initial time point
y1 and y2 are the base year and final year, respectively.

Table 1.
Characteristics of Landsat Images.
| Study Location | Year | Date Acquired | Sensor | Cloud Cover (%) | Path | Row | Resolution |
| Asaba | 1986 | 26/12/1986 | Landsat 5 TM | 0 | 189 | 056 | 30m x 30m |
| 2002 | 09/12/2002 | Landsat 7 ETM | 0 | 189 | 056 | 30m x 30m | |
| 2022 | 29/12/2022 | Landsat 8 OLI/TIRS | 0 | 189 | 056 | 30m x 30m | |
| FCT Abuja | 1986 | 26/12/1986 | Landsat 7 ETM | 0 | 189 | 054 | 30m x 30m |
| 2002 | 18/12/2002 | Landsat 7 ETM | 0 | 189 | 054 | 30m x 30m | |
| 2022 | 21/12/2022 | Landsat 8 OLI/TIRS | 0 | 189 | 054 | 30m x 30m |
Source: www.earthexplorer.usgs.org, 2024.
The city’s LULC classification system followed a careful review of relevant literature and field observation. The land use/land cover of the study area was categorized into 4 classes comprising built-up area, vegetation, barren land, and water bodies. The built-up areas represent urban infrastructures, while the vegetation depicts agriculture and the natural landscape. The water bodies represent the city’s surface water resources, as shown in Table 2
Image geo-processing for Vegetation Change or Vegetation Health Dynamics
The study made use of the near-real-time data of Moderate Resolution Imaging Spectroradiometer (MODIS) Terra and Aqua Normalized Difference Vegetation Index (NDVI) of 2002 and 2022 just to show the level of vegetation health in the study locations. MODIS Terra and Aqua NDVI was Global 250m resolution and were downloaded from https://earthexplorer.usgs.gov. Values greater than 0.5 indicate dense vegetation, whereas values lower than 0.1 indicate near-zero vegetation such as barren areas, rock, sand, water, snow, and built-up areas (Ahmed, 2016). Only active vegetation has a positive NDVI being typically between about 0.1 and 0.6 values at the higher end of the range, indicating increased photosynthetic activity and a greater density of the canopy (Tarpley et al., 1984). The analysis was carried out in ArcGIS 10.7.
The original mean NDVI values were multiplied by 0.0001 as a multiplication factor to scale the original NDVI value to range from 0 to 1 (Land Processes Distributed Active Archive Center (LP DAAC), 2014). The boundary shapefile of the study area was used to clip the NDVI images of different years.
The formula for NDVI calculation is:
NDVI =(Near-infrared – Red) / (Near-infrared + Red)
Land Surface Temperature
Land surface temperature (LST) data that were acquired from Landsat satellite infrared bands; Band 6 (10.40-12.50 um Thermal) of Landsat 4 & 5 TM; Band 6 (10.40-12.50 um Thermal) of Landsat 7 ETM+ and Band 10 (10.60-11.19 Thermal 1) and Band 11 (11.50-12.51 Thermal 2) of Landsat 8 OLI/TIRS. The procedure of Anandababu et al. (2018) was thereafter used to compute the land surface temperature.
Statistical Analysis
The study employed the use of descriptive statistics involving the use of spatial extent in terms of land use/land cover analysis and land surface temperature. Zonal statistics in the GIS environment were adequately employed in the extraction and analysis of urban growth changes and land surface temperature.
The results of the analysis are presented in maps, tables, and graphs as follows.
3. Results
The composition of the Asaba land use and land cover types in 1986 is shown below in Figure 2.
The Landsat imagery indicates the spread of built-up areas representing urban growth comprising road networks, transportation, and gradual conversion of the natural vegetation into impervious surfaces, although Water bodies and pockets of vegetation can be observed in the environment.
The satellite imagery of the various land cover types of Asaba in 1986 is shown in Figure 2 above. The geospatial analysis indicates the presence of rich vegetal cover, farmlands, water bodies, and wetlands. Built up area representing urban growth in the study is concentrated along the Benin highway and eastern corridor of the city. Vegetation appears undisturbed given the low rate of urbanization during this period.
In Figure 3, The city of Asaba experienced increased urban growth on account of urban infrastructures leading to total transformation of the environment. The continuous expansion of the city to meet growing demands of urban population implies clearing of the vegetation for transformation of the urban landscape.
Urban land use continues to increase in 2022 as the dominant land cover type as shown in Figure 4. The increase in urban growth indicates water bodies and existing vegetation have to pave the way for more construction of impervious surfaces leading to land surface temperature increase in the city
The dynamics of built-up area as part of the city’s land use and land cover from 1986-2022 are shown in Figure 5, indicating that 2022 witnessed the highest level of built-up activities and, by implication, urban growth and reduced vegetation cover
3.1. Land Surface Temperature Analysis
This section presents the results of the LST carried out to examine the rate of changes in the surface temperature of the study area between 1986-2022. The result is presented as follows
The LST map of Asaba in 1986, as shown above in Figure 6, reveals that the highest temperature was from 31.44oC-36.oC while the lowest was 24.13oC-26.74OC. However, the result further indicates that most of the surface warming is concentrated in the city center compared to the western and southeastern parts of the city. The spatial distribution of LST in Asaba is in direct response to the variability of human activities located in different parts of the city.
The year 2002 was characterized by a reduced land surface temperature as LST varied between 27.14oC – 27.96oC °C (minimum LST values) while the maximum LST observed was between 29.66-31.40oC implying low intensity of heat generating anthropogenic activities as presented in Figure 7. The result further indicates that land surface temperature surged in different parts of the city thus heightening Urban warming and heath related risk.
The concentration of urban generating land surface temperature on the city center continued in 2022 as minimum LST values were 28.12 °C-30.81 °C, while the maximum observed LST values were 35.06oC-38.84oC as shown in Figure 8. Thus, the year 2022 can be described as the warmest in the period of the study, given the variability values of the LST. The increased spread of LST around the Benin-Asaba expressway and Nnewi, which is the business hub of the city characterized by concrete buildings, pavement, and high population concentration, accounts for the high LST intensity and high susceptibility to heat disasters.
Table 2.
Land use/Land cover dynamics over Asaba Delta State.
| 1986 | 2002 | 2022 | ||||
| Landuse/Land Cover | Spatial Extent (sq km | Percentage (%) | Spatial Extent (sq km | Percentage (%) | Percentage (%) | |
| Waterbodies | 7.65 | 4.68 | 7.58 | 4.64 | 8.37 | 5.12 |
| Swamp Forest | 27.5 | 16.82 | 25.09 | 15.35 | 16.35 | 10.00 |
| Built Up Area | 23.47 | 14.36 | 47.13 | 28.83 | 65.09 | 39.82 |
| Thick Vegetation | 68.39 | 41.84 | 45.1 | 27.59 | 35.42 | 21.67 |
| Farmland | 36.44 | 22.29 | 38.55 | 23.59 | 38.22 | 23.38 |
| Total | 163.45 | 100.00 | 163.45 | 100.00 | 163.45 | 100.00 |
The composition and percentage change of each land use/land cover type from 1986 to 2022 over Asaba is shown in Table 2. The extent of water bodies and percentage for water bodies in 1986, which was 7.65km and 4.68%, declined to 7.58sq km in 2002 and 4.64 percent respectively. In the same vein, swamp forest with spatial extent of 2.75 in 1986 and 16.82% also declined to 25.09% in 2002 and subsequently 10% in 2022. Buit-up area representing urban growth on the other hand, with 23.47sq km in 1986 and 14.36% of the total LULC in 1986 increased to 47.13% in 2002 and 39% in 2022 in full demonstration as the dominant LULC type
Thick Vegetation is one of the land use types that witnessed significant changes, as it decreased from 68.39sqkm in 1986 and 41% to 45.1sqkm and 27.59% ending up in 2022 with 21.67% 2022. Farmland also increased in size and spatial extent from 36.44sqkm (22%) in 1986 to 38.22sqkm and 23.38% in 2022. The analysis underscores the enormity of the changes and in the LULC composition of the study city
3.2.1. Land Use and Land Cover Changes Over Abuja FCT
The geospatial analysis of the various land cover types for Abuja in 1986 as shown in Figure 9 above. indicates the presence of rich vegetal cover, rock outcrops, surface water bodies and farmlands, water bodies, and wetlands. Built up area representing urban growth in the study is concentrated along the Benin highway and eastern corridor of the city. Vegetation appears undisturbed given the low rate of urbanization during this period.
The LULC analysis for 2002, as shown in Figure 10, indicates increasing spread of urban growth in the north, west, and central parts of Abuja represented by the red colors. The natural vegetation of the city could be observed in the south and eastern corridors of the city
The land use/Land cover change analysis for 2022, as shown in the 2022 map, indicates a progressive concentration of urban activities in the Northwest and southwest parts of the city, as represented by the red colors. The natural vegetation of the city could be observed in the south and eastern sections of the city
The composition and percentage change of each land use/land cover type from 1986 to 2022 over Abuja is shown in Table 3. The outcome of the change detection analysis indicates that bare ground/Rock outcrop with a spatial extent of 987.88sqkm and 13% in 1986 decreased to 719.65sqkm and 7.89% in 2002 and subsequently 9.13% while Farmlands increased both in spatial extent and percentage.
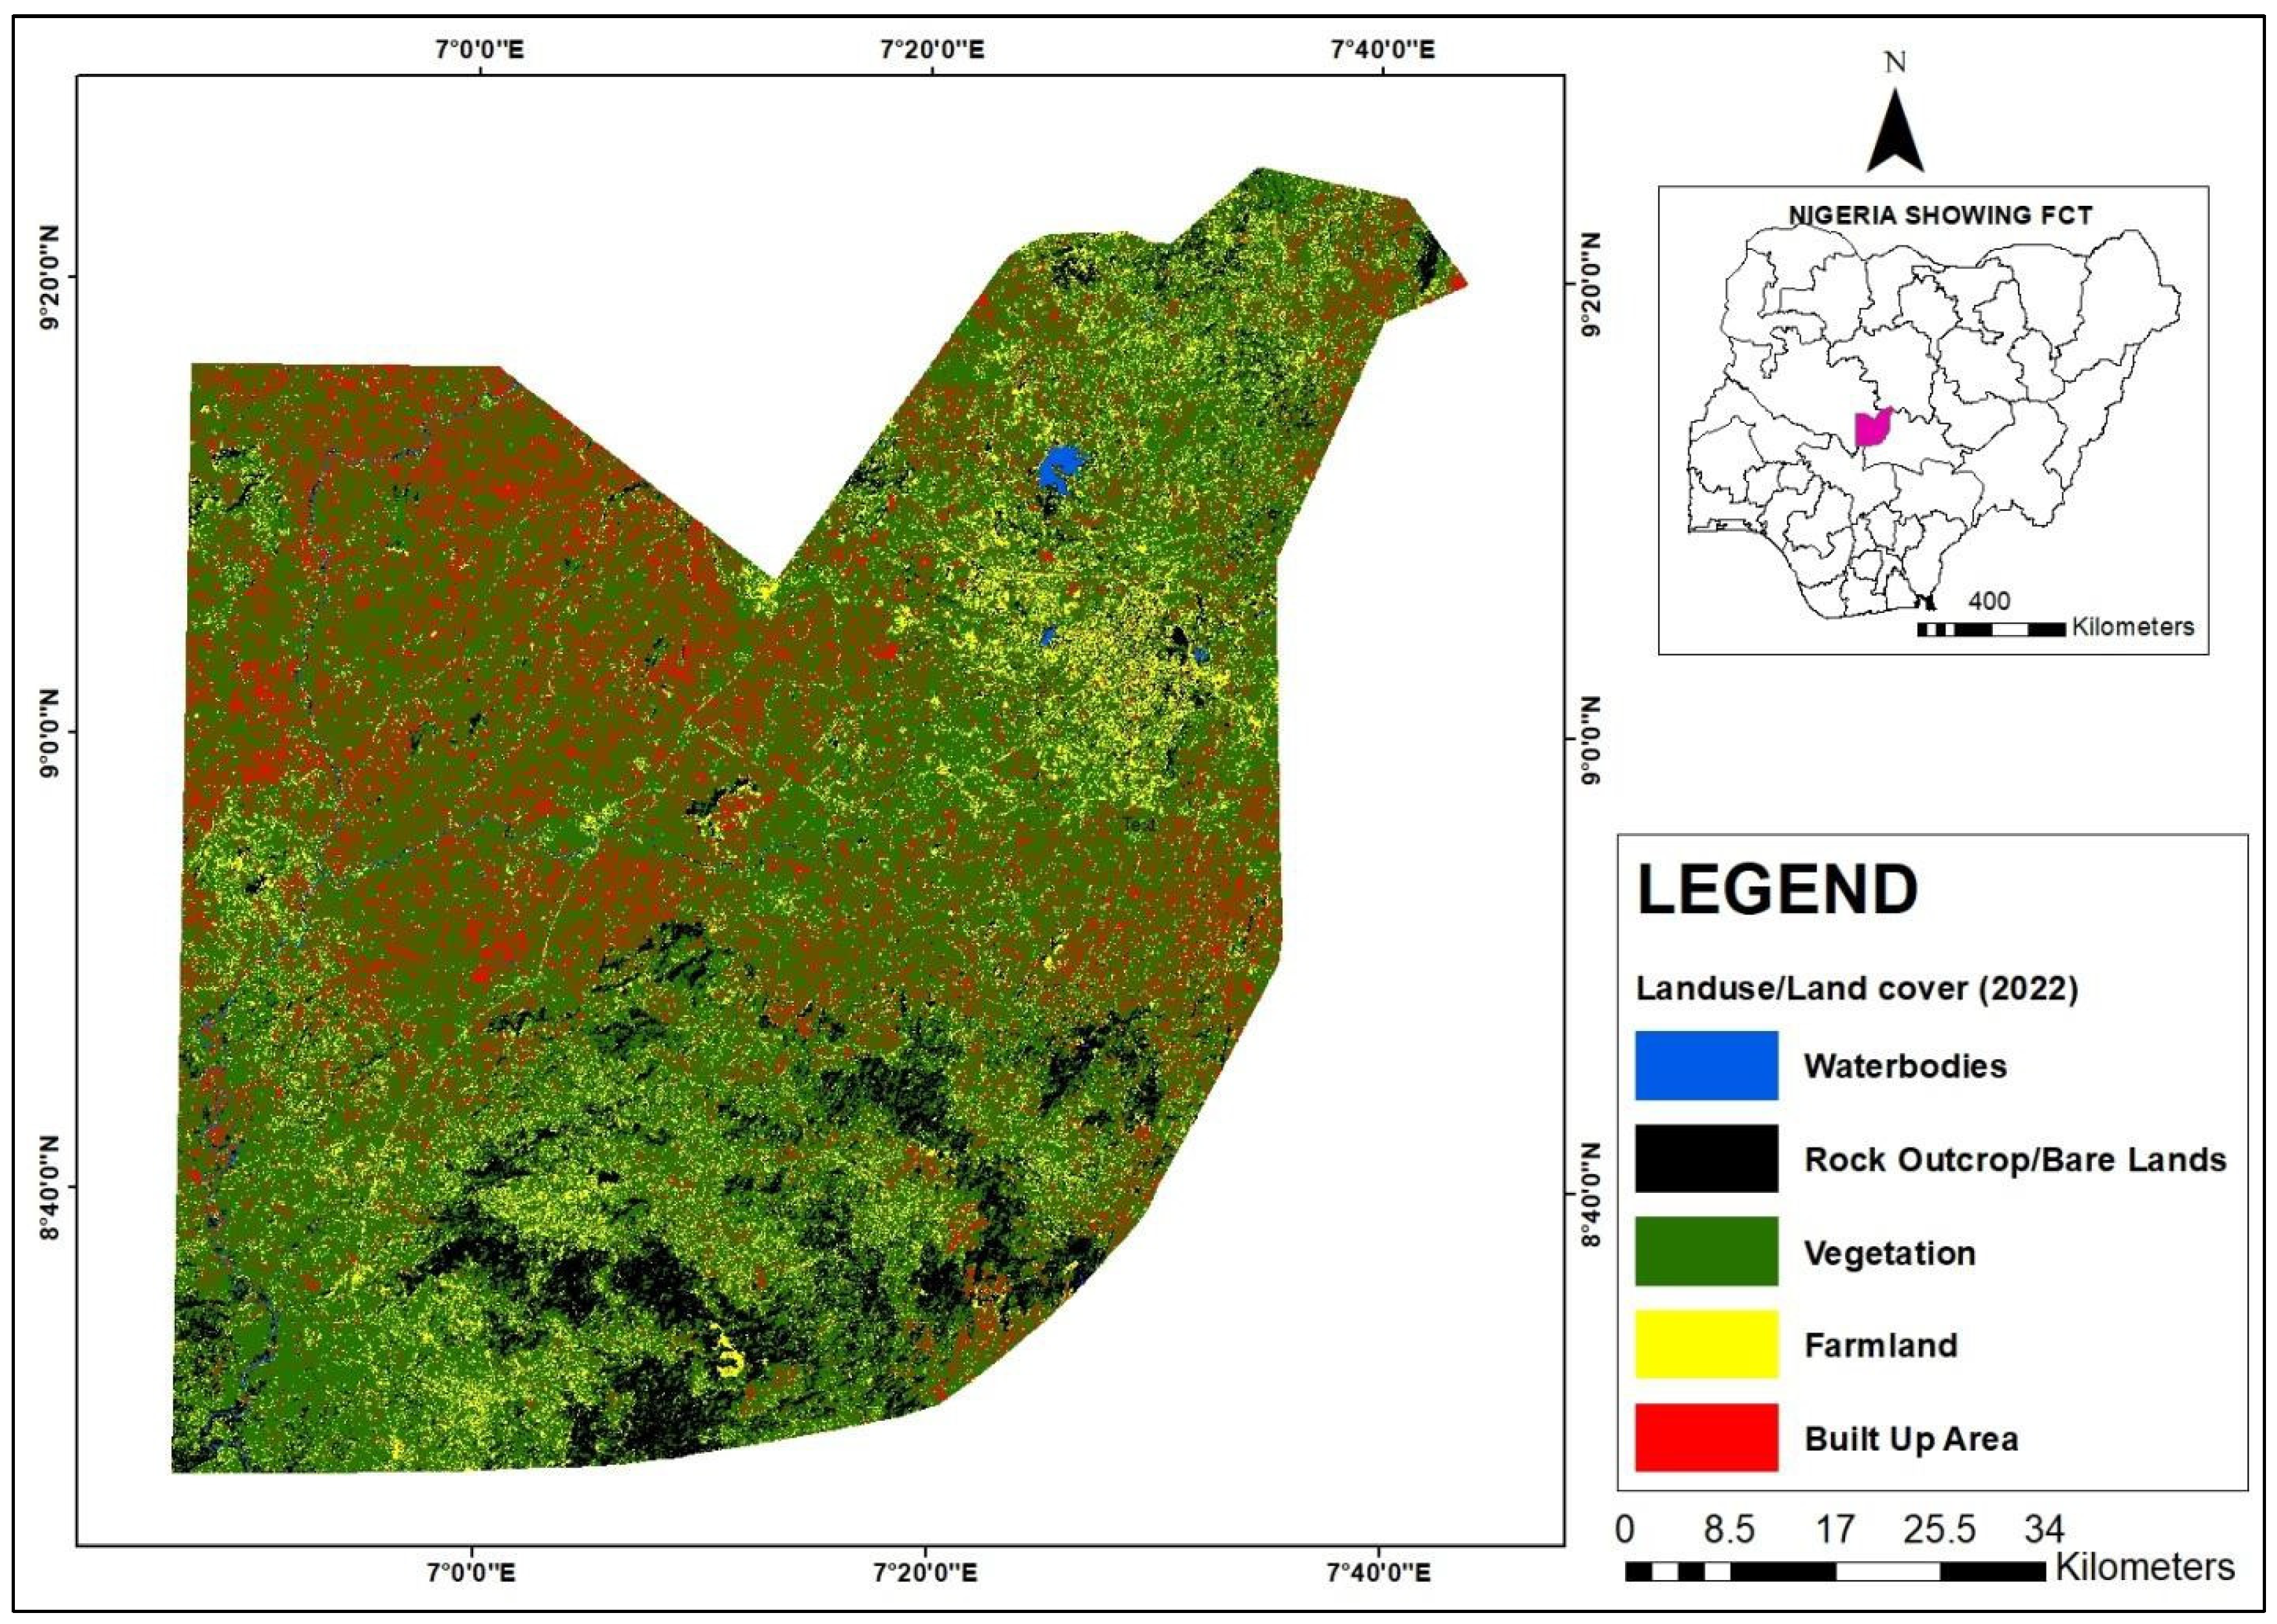
Figure 11.
Abuja Land use/Land cover in 2022.
Table 3.
Land Use and Land Cover Change of Abuja.
| 1986 | 2002 | 2022 | ||||
| Landuse/Land Cover | Spatial Extent (sq km | Percentage (%) | Spatial Extent (sq km | Percentage (%) | Percentage (%) | |
| Waterbodies | 30.11 | 0.40 | 30.86 | 0.41 | 32.84 | 0.43 |
| Bare ground/Rock Outcrop | 987.88 | 13.08 | 719.65 | 9.53 | 689.43 | 9.13 |
| Farmland | 452.81 | 6.00 | 596.09 | 7.89 | 758.48 | 10.04 |
| Vegetation | 5691.47 | 75.36 | 5247.63 | 69.49 | 4959.11 | 65.66 |
| Built Up Area | 389.9 | 5.16 | 957.94 | 12.68 | 1112.31 | 14.73 |
| Total | 7552.17 | 100.00 | 7552.17 | 100.00 | 7552.17 | 100.00 |
Similarly, Vegetation, which natural landscape with a composition of water 5691sqkm and 75% of the total LULC in 1986, declined to 69.49% in 2002 and subsequently 65.6% in 2022. Finally, Built-up Area with a composition of 389.9sqm representing 5% increased to12.68% in 2002 with further increase in 14.73% in 2022.
This shows that urban development has increased significantly from 1986-2022 in Abuja, with implications on the city’s microclimate.
The result of the zonal statistics carried out on both land surface temperature (LST) and the NDVI for both Asaba and Abuja, as shown in Table 4, indicates that the mean temperature of 1986 was 33 °C while that of 2002 was 28.95o C. Temperature variability was also evident in the city of Asaba and Abuja as the mean temperature observed was 28.98o C.
Table 4.
Zonal Statistics Analysis.
| Minimum | Maximum | Mean | Std. Deviation | |
| Temp_2002 | 24.14 | 36.01 | 28.25 | 1.9 |
| Temp 2022 | 27.15 | 31.41 | 28.98 | 0.7 |
| Temp 1986 | 28.13 | 38.85 | 33.38 | 1.8 |
| NDVI 2002 | -0.1999 | 0.9357 | 0.4520 | 0.2 |
| NDVI 2022 | -0.0948 | 0.6938 | 0.3301 | 0.1 |
The NDVI analysis revealed that in 2002, the value was 0.4520, while in 2022, a decrease in the NDVI value of 0.3301 was recorded, highlighting the changes in vegetation cover of the study area
The geospatial analysis of LST over Abuja in 1986 is shown in Figure 12. The result of the analysis indicates huge variability in the city, with the highest LST values being 28.06 °C- 30.95 °C, represented by the red colors, while the natural green vegetation areas have LST values of 16.34 °C- 19.22 °C. The areas mostly affected by the high LST values are the northern and western sections of the city
The trend of LST over Abuja in 2002 indicates progressive increase in warming and LST as the highest LST recorded was 38.6-39.6oC as shown in Figure 13. The year 2002 could be observed as more warmer compared to 1986 as increase in LST values was observed across the entire city. The second highest vales are 36.8-38.5oC followed by 35o while the lowest was 31.4oC
The result of the Land Surface Temperature LST of 2022 for the city of Abuja as shown in Figure 14 indicates that the city was characterized by progressive warming trend as the highest variability values recorded was 41,90-46.55oC followed by 37.25oC-41.89oC respectively. Compared to 1986 and 2002 LST trend, 2022 can be described as the warmest in the study period
3.3. Normalized Difference Vegetation Index (NDVI)
Normalized Difference Vegetation Index (NDVI) is one of the most widely applied tools in urban climate and environmental sciences. In this study, NDVI was mainly applied to characterized was the effect of land use/land cover changes on Land surface temperature of the study areas from 2002 to 2022. The result is presented as follows.
The NDVI spatial map of Asaba, Delta State as presented in Figure 15 reveals marked variability as the lowest values of -0.1999-0.1236 and 0.1236-0,3449 representing the built-up areas. The highest NDVI values of 0.5848-0.9357 indicates healthy and green vegetation while 0.4704-0.5848 indicates undeveloped natural vegetation
The NDVI map of 2022 over Asaba is shown in Figure 16 with the reduced and negative values of -0.0940—0.1212 indicating built-up and barren land. The high NDVI values of 0.4818-0.6936 and 0.3794-0.3794 represents healthy vegetation followed by the values of 0.2756-0.3794
The NDVI map of Abuja, the Federal Capital Territory of Nigeria for 2002 as shown in Figure 17 reveals increasing growth of urban development representing built up areas with the negative NDVI values of 0.0688-0.3402. The healthy and green vegetation is shown by the highest NDVI values of 0.5426-0.7706 and 0.4664-0.5426
The year 2022 in Abuja was further characterized by reduced vegetation cover as built-up areas representing the lowest NDVI values of 0.042-0.242 and 0.243-0.300. Similarly, the highest values of 0.439-0.714 and 0.365-0.438 indicate the presence of green and natural undisturbed vegetation
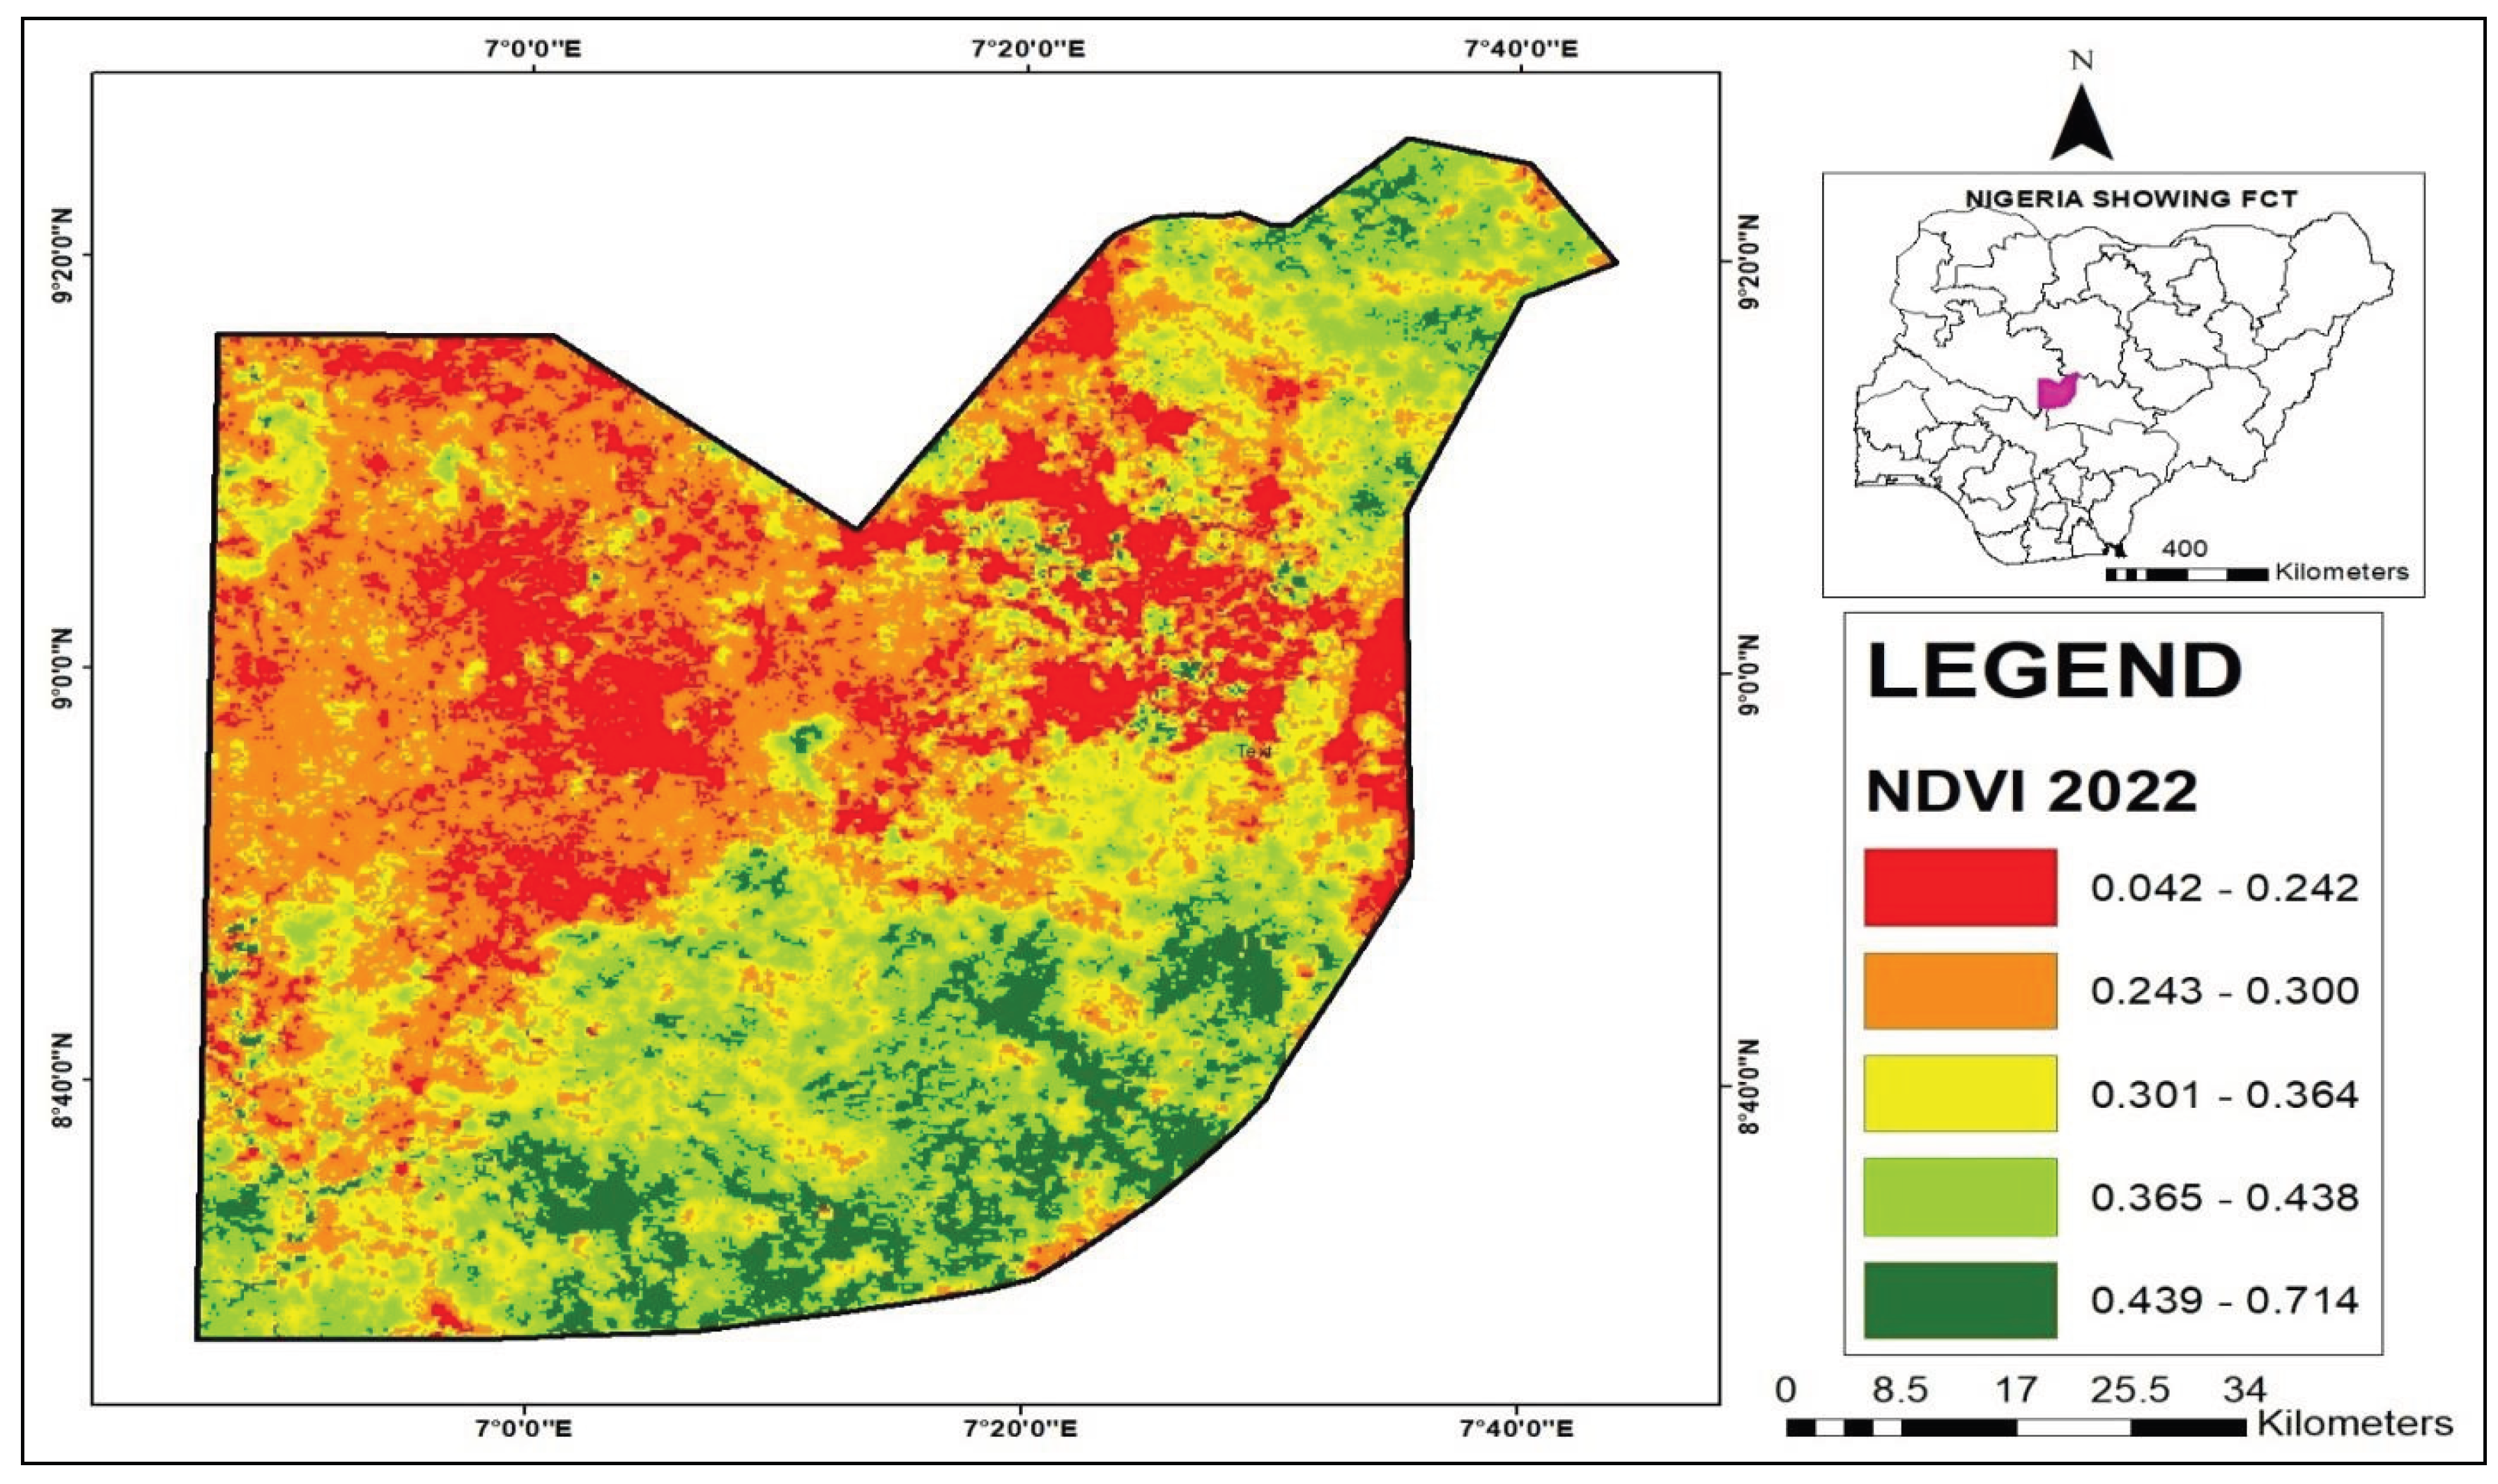
Figure 18.
NDVI Map of Abuja, 2022.
Table 4.
Statistical analysis of LST and NDVI over Asaba and Abuja between 1986 and 2022.
| Descriptive Statistics | |||||
|---|---|---|---|---|---|
| N | Minimum | Maximum | Mean | Std. Deviation | |
| Temp 1986 | 100 | 24.58 | 33.96 | 29.1120 | 1.93714 |
| Temp_2002 | 100 | 27.26 | 30.19 | 29.0289 | .65715 |
| Temp 2022 | 100 | 29.05 | 36.32 | 33.3945 | 1.99928 |
| NDVI 2002 | 100 | -1.00 | .73 | .4457 | .20268 |
| NDVI 2022 | 100 | -1.00 | .67 | .3175 | .18165 |
| Valid N (listwise) | 100 | ||||
Statistical analysis was further used to effectively analyze the relationship between land surface temperature (LST) and NDVI of the two study areas. The LST and NDVI comparison was carried out using several sampling points between 1986 and 2022, as shown in Table 3.
The results of the analysis indicate that the mean LST value of the built-up area of Abuja and Asaba stood at 29 °C in 1986 and 2002. However, in 2022, the mean LST value of the study area increased to 33.3 °C. The result further demonstrates that both Abuja and Asaba experienced an increase in LST by 4.3 °C from 1986-2022, implying increased transformation of the natural environment leading to urban growth associated with modern cities. The pattern of LST shown in this study is likely to increase along this trajectory with a concomitant effect on heat disasters.
With respect to NDVI, the result of the statistical analysis revealed that the mean NDVI values decreased from 0.4457 in 2002 to 0.3175 in 2022, indicating poor and declining vegetation health
3.3. Relationship between LST and NDVI
The Pearson correlation coefficient was used to evaluate the relationship between NDVI and the result of the analysis as shown in Table 4 indicates a statistically significant relationship between LST and NDVI at a 0.01 confidence level, as shown in Table 5. The result reveals a positive correlation between land surface temperatures, an increase in urban growth, and an influx of people in Asaba. which has a direct effect on the city’s land surface temperature and NDVI
Table 5.
Correlations between NDVI and Land Surface Temperature.
| Total Temp | Total NDVI | ||
| Total Temp | Pearson Correlation | 1 | -.333** |
| Sig. (2-tailed) | .000 | ||
| N | 200 | 200 | |
| Total NDVI | Pearson Correlation | -.333** | 1 |
| Sig. (2-tailed) | .000 | ||
| N | 200 | 200 | |
| **. Correlation is significant at the 0.01 level (2-tailed). | |||
The summary change analysis carried out indicates that in 1986, 9.41 changes in water bodies were recorded, while the swamp forest decreased to -40%. However, the built-up area increased to 177% followed by -48% loss in thick vegetation. Similarly, between 2002 and 2022, a percentage change of 10.42 in water bodies was recorded, followed by a -34.83% change in the swamp forest, followed by 38.11% in the built-up area. Thick vegetation experienced a reduction of -21.46% and finally -0.86 percentage in farmlands as shown in Table 6
Table 6.
Percentage of LULC changes for Asaba and Abuja.
| 1986 | 2022 | Rate of Change | Percentage Change | |
| Landuse/Land Cover | Spatial Extent (sq km | Percentage (%) | ||
| Waterbodies | 7.65 | 8.37 | 0.72 | 9.41 |
| Swamp Forest | 27.5 | 16.35 | -11.15 | -40.55 |
| Built Up Area | 23.47 | 65.09 | 41.62 | 177.33 |
| Thick Vegetation | 68.39 | 35.42 | -32.97 | -48.21 |
| Farmland | 36.44 | 38.22 | 1.78 | 4.88 |
| Total | 163.45 | 163.45 | ||
| 2002 | 2022 | Rate of Change | Percentage Change | |
| Landuse/Land Cover | Spatial Extent (sq km | Percentage (%) | ||
| Waterbodies | 7.58 | 8.37 | 0.79 | 10.42 |
| Swamp Forest | 25.09 | 16.35 | -8.74 | -34.83 |
| Built Up Area | 47.13 | 65.09 | 17.96 | 38.11 |
| Thick Vegetation | 45.1 | 35.42 | -9.68 | -21.46 |
| Farmland | 38.55 | 38.22 | -0.33 | -0.86 |
| Total | 163.45 | 163.45 | ||
4. Discussion
The outcome of the geospatial analysis revealed a significant concentration of urban growth in the cities of Asaba and Abuja, particularly along the major transport routes, with the 2002-2022 decade being the most pronounced in terms of increased urban development. The resultant effect of the observed urban growth (UG) on land surface temperature (LST) manifests in the spatial variability of urban LST of 31oC and 36oC in 1986 while in 2002, LST decreased to 29-31oC °C before it leapfrogged in 2022 to 35oC and 39oC respectively.
The increasing pattern of LST variability occasioned by rapid urbanization in Asaba could be observed in 2022 with variability values of 38.07oC °C and 35.84oC for the high and low-warming areas, indicating a composite pattern.
For Abuja, the outcome of the analysis revealed a significant increase in urban growth as the built-up area in 2022 was 12% implying which further shows that 2022 experienced more urban develop[ment. Consequently, the land surface temperature recorded in the city in 1986 was 28-30oC while in 2002, the LST values increased to 38-39oC. However, the LST analysis further indicates that 2022 was the warmest as 41oC was recorded as the LST value.
Similarly, the NDVI analysis for Asaba in 2002 shows a negative value of -0,19 while in 2022, -0.0940 was recorded, implying degrading and stressed vegetation. Furthermore, the NDVI analysis for Abuja, the Federal Capital Territory in 2002 indicates -0.688, while in 2022, 0.042 was recorded. The summary NDVI analysis for both cities shows a pattern of decreasing and stressed vegetation.
The relationship between Land surface temperature and vegetation health using NDVI was examined using a Pearson correlation model, in which the result indicates a positive relationship of 0.333, which is significant at 5% confidence level (2 tail test) in 2020, highlighting the dynamic contribution of Land surface temperature and Vegetation cover of the study domain.
With respect to the rate of change and percentage of change, analysis carried out as shown in Table 6, Significant loss in vegetation comprising swamp forest, farmlands and thick vegetation was observed while built-up area increased all through the study period thus adding further credence to the fact that the warming leading to urban heat Island in several metropolitan cities are been driven by accelerated urban growth and land use/land cover changes as noted by Ideki and Abali,2022.
The findings from this study on the nexus between urban growth and the Land surface temperature of Asaba and Abuja indicate the same narrative of the growing influence of urbanization on land surface temperatures and urban heat islands in several big cities in Nigeria. The pace of urban development on account of changes in land use and land cover in Asaba, the Delta state capital and the F.C.T Abuja in Nigeria, has shown a detrimental impact on the natural landscape as observed from the spatial analysis carried out in the study. This is in agreement with studies conducted by Ayanlande, et, al, 2021 on variation in urban land surface temperature intensity over different ecological zones in Nigeria in which the land surface of the cities was shown to be greatly influenced by spatial and temporal changes in land use and/land cover of the study area as LST was estimated in the study to vary from 0.12 to 1OC yearly with changes projected to be intensified in the city centers and core. The authors further affirmed that changes in land use as observed in this study could affect the spatial pattern of urban LST.
Similarly, a recent study by Guo et, al, 2022 on the contribution of urbanization to land surface temperature in Lagos Nigeria, using MODIS-generated data, revealed that urbanization and global warming are the major drivers of urban land surface temperature changes, contributing more than 60% of urban warming in Lagos alone. Seun et, al 2022 also reported rapid urbanization in South West Nigeria with a projected 20% decline in vegetal cover, leading to an increase in land surface temperature, which was highlighted in this study. The phenomenon of urban growth and land surface temperature has also been studied in Northern Cyprus where Garcia, at al, 2023 highlighted the relationship between Land surface temperature and Land use/Land cover indices. The authors in their study using Landsat imageries noted that a significant increase in LST of urban areas corresponded well with changes in land use/land cover. Studies by Gupta, et, al (2023) on urban growth and land surface temperature in the Western Himalayan cities of India revealed that temperature hotspots were more pronounced in urban areas due to accelerated urban growth, as a significant correlation was observed between LST and the study area’s biophysical parameters.
Given the foregoing, this study has shown that changes in Land use/Land cover can be used to predict urban land surface temperature and changes in urban climate. It’s therefore apparent that the harmful effects of overpopulation and the resultant urbanization have impacted negatively on the functionality of ecosystem services in the studied cities, given the rate at which urbanization is expanding at the expense of dwindling water bodies, forest cover, and soil infertility. While we have looked at the impact of urbanization on natural LULC, there is a need to conduct additional research on the relationship between economic growth and changes in natural ecosystem services.
Conclusion
Urban growth distorts climate variability and increases land surface temperature, which creates urban heat islands. This manifests in changes in urban land cover that tend to alter the spectral signature and emissivity of the land surface as observed using remote sensing techniques. The study employed GIS and Remote Sensing techniques to evaluate the impact of urban growth on the LST from 1986- 2022. The outcome of the analysis indicates that the LULC of Asaba and Abuja has been altered significantly due to industrial, economic, and social activities that would normally be expected to occur in fast-developing capital cities. The built-up area increased from 23.47 sq km (14%) in 1986 to 65.08 sq km, representing 39.82% in 2022, while in Abuja, the study established that the built-up area increased from 389.9 sq km, representing 5% in 1986, to 15% (1112.31Sqkm) respectively.
The UG significantly increased at the rate of 42 sq km while LST increased at 4 °C within the period under consideration. The study further revealed that most areas within the study area experienced an increase in surface temperature due to the concentration of urban structures and population. Also, the study observed that areas with sparse vegetation had high LST compared to areas with dense vegetation, which had low LST. While we examined the impact of urbanization on natural LULC and Land surface temperature variability from a comparative perspective, there is a need to conduct additional studies on the relationship between economic growth and changes in natural ecosystem services. Furthermore, land surface temperature (LST) plays a significant role in analyzing the land surface energy budget, even as LST provides valuable information for developing studies on land–atmosphere interaction. Overall, unsustainable urbanization could impact on the growth of Asaba and Abuja in Nigeria in the coming decades if appropriate urban sustainability measures are not taken into consideration. Therefore, robust policies need to be implemented to address the impact of uncontrolled urban development in the city to mitigate the effects of climate change and UHI effects.
Author Contributions
The first conceptualized the research, including geospatial analysis, while the second author supervised the research, including model validation and review.
Funding
This research received no form of funding from any source.
Data Availability Statement
The LULC and NDVI data used in the study can be accessed using this link: https://earthexplorer.usgs.gov.
Competing Interests
The authors declare that there is no competing interest.
References
- Achmad, A., Fadhly, N., Deli, A. and Ramli, I (2022) Urban growth and its impact on land surface temperature in an industrial city in Aceh, Indonesia. Lett Spat Resour Sci 15, 39–58.
- Ayanda, A (2017) Variations in urban surface temperature: An assessment of land use change impacts over Lagos Metropolis. Weather, 73.
- Ayanda, A; Aigbiremolen, M.I and Oladosi, R.O (2021): Variations in Urban land surface intensity over 4 cities in different ecological zones. Nature Scientific Reports,) 11:20537. [CrossRef]
- Bastwasey (2014) The geomorphological and hydrological evidence of a Holocene deluge in Arabia. Arabian Journal of Geoscience 8 (5).
- Enaruvbe, G.O and Atedhor,G.O (2015) Spatial analysis of Agricultural landuse change in Asaba, Southern Nigeria. Ife journal of science. Vol 17.(1).
- Enaruvbe, G.O. and Atafo, O.P. (2014) Analysis of Deforestation Pattern in the Niger Delta Region of Nigeria. Journal of Land Use Science, 11, 113-130.
- Garcia, D.H; Riza, M and Diaz, J.A (2023) Land surface temperature Relationship with Land use/Land cover indices Leading to the thermal field Variation in the Turkish Republic of Northern Cyprus. Journal of Earth Systems and Environment. 7:561–580. [CrossRef]
- Guo, L; Di, L; Zhang, C; Lin, L; Chen, F and Molla, A. (2022) Evaluating the contribution of urbanization and global climate change to urban land surface temperature change. A case study in Lagos Nigeria. Nature Scientific Reports, 12: 14168. [CrossRef]
- Gupta,R; Sharma, M; Singh, G. and Rajendra, K.J (2023): Characterizing urban growth and land surface temperature in the western Himalayan cities of India using remote sensing and spatial metric. Frontiers in Environmental Science. Front. Environ. Sci. 11:1122935DOI 10.3389/fenvs.2023.1122935.
- Ideki, O and Abali, T.P (2022), Geospatial Assessment of Land Cover Dynamics in the Guinea Savannah Ecological Zone. Journal of Geography, Environment, and Earth Science International, 26(4): 15-24, 2022; Article no. JGEESI.44995. DOI: 10.9734/JGEESI/2022/v26i430344. [CrossRef]
- Igun,E and Williams, E (2018): Impact of Urban land cover change on land surface temperature. Global journal of Enviro.sc management 4(1).
- Kanga, S; Meraj,G; Johnson,B.A; Singh,S.K; Nasef,M; Farioq,M; Kumar,P; Marsazi, A and Sahu,N (2022) Understanding the linkage between urban growth and Land surface temperature – A case study of Banglore City India. Remote Sen.14, 4241.
- Kwofie, S; Nyamekye, C; Boamah, L.A; Adjei, L.O; Arthur. R and Agyapong E (2022) Urban growth nexus to land surface temperature in Ghana, Cogent Engineering, 9:1, 2143045.
- Luo, H and Wu, J (2021): Effects of urban growth on the land surface temperature. A case study of Taiyuan China. Environment, Dev, and sustainability. 23:10787-10813.
- Mushore, T.D; Mutanga, O; Odindi, J and Dube, T (2017) Linking major shifts in land surface temperatures to long term land use and land cover changes: A case of Harare, Zimbabwe. Journal of Urban Climate, Volume 20, 120-134.
- Nwaerema, P; Ologunorisa, T.E, Nwagbara, M.O and Ojeh, N.V (2019) Geospatial dynamics of land surafce temperature of Port Harcourt- Metropolis and Environs. Journal of science publishing group 8(3): 169-177.
- Nwareama, P; Jiya, S.N and Ideki, O (2023): Analysis of Satellite base Land Surface Emissivity (LSE) of Lapai and Environs, Niger State Nigeria. Nwareama, P; Jiya, S.N and Ideki, O. International Journal of Novel Research and Development, IJNRD, Vol. 8, issue 4.
- Nwilo P.C., Olayinka D.N., Obiefuna J.N., Atagbaza A.O., Adzandeh A.E., 2012. Determination of Land Surface Temperature (LST) and potential urban heat island effect in parts of Lagos State using satellite imageries. FUTY Journal of the Environment 7(1), 19–33.
- Obiefuna J. N., 1 Nwilo P. C., Okolie C. J., Emmanuel E. I. and Daramola O.(2018) Dynamics of Land Surface Temperature in Response to Land Cover Changes in Lagos Metropolis. Nigerian Journal of Environmental Sciences and Technology (NIJEST).
- Obiefuna,J.N Okolie, C.J; Nwilo, P.C; Daramola, O.E and Isiofa, L.C (2021): Potential influence of urban sprawl and outdoor thermal comfort in Lagos state, Nigeria. Journal of Questions Geographical. Vol.40, No.1.
- Roxburgh, C., Dörr, N., Leke, A., Tazi-Riffi, A., Van Wamelen, A., Lund, S., and Zeino-Mahmalat, T. (2010). Lions on the move: The progress and potential of African Economies. McKinsey Global Institute.
- Seun, A.I; Ayodele, A.P; Koji, D and Akande, S.O (2022) The potential impact of increased urbanization on land surface temperature over South-West Nigeria, Current Research in Environmental Sustainability, Volume 4,100142, ISSN 2666-0490. [CrossRef]
- Tarawally, M., Xu, w; Hou, W and Mushore, T. (2018) Comparative Analysis of Responses of Land Surface Temperature to Long-Term Land Use/Cover Changes between a Coastal and Inland City: A Case of Freetown and Bo Town in Sierra Leone. Remote Sensing, 10,(1). [CrossRef]
- UNFPA (2022) An Urbanizing World. Available online at https://www.unfpa.org/urbanization.
- UN-Habitat. (2016). World Cities Report 2016Urbanization and development: Emerging futures. [CrossRef]
- United Nations. (2018). World Urbanization Prospects: The 2018 Revision. Key facts: New York, USA.
- Zhou, D., Xiao, J., Bonafoni, S., Berger, C., Deilami, K., Zhou, Y., et al. (2019). Satellite remote sensing of surface urban heat islands: Progress, challenges, and perspectives. Remote Sens. 11, 48. [CrossRef]
Figure 1.
Map of the study area: Asaba and Abuja, FC.T.
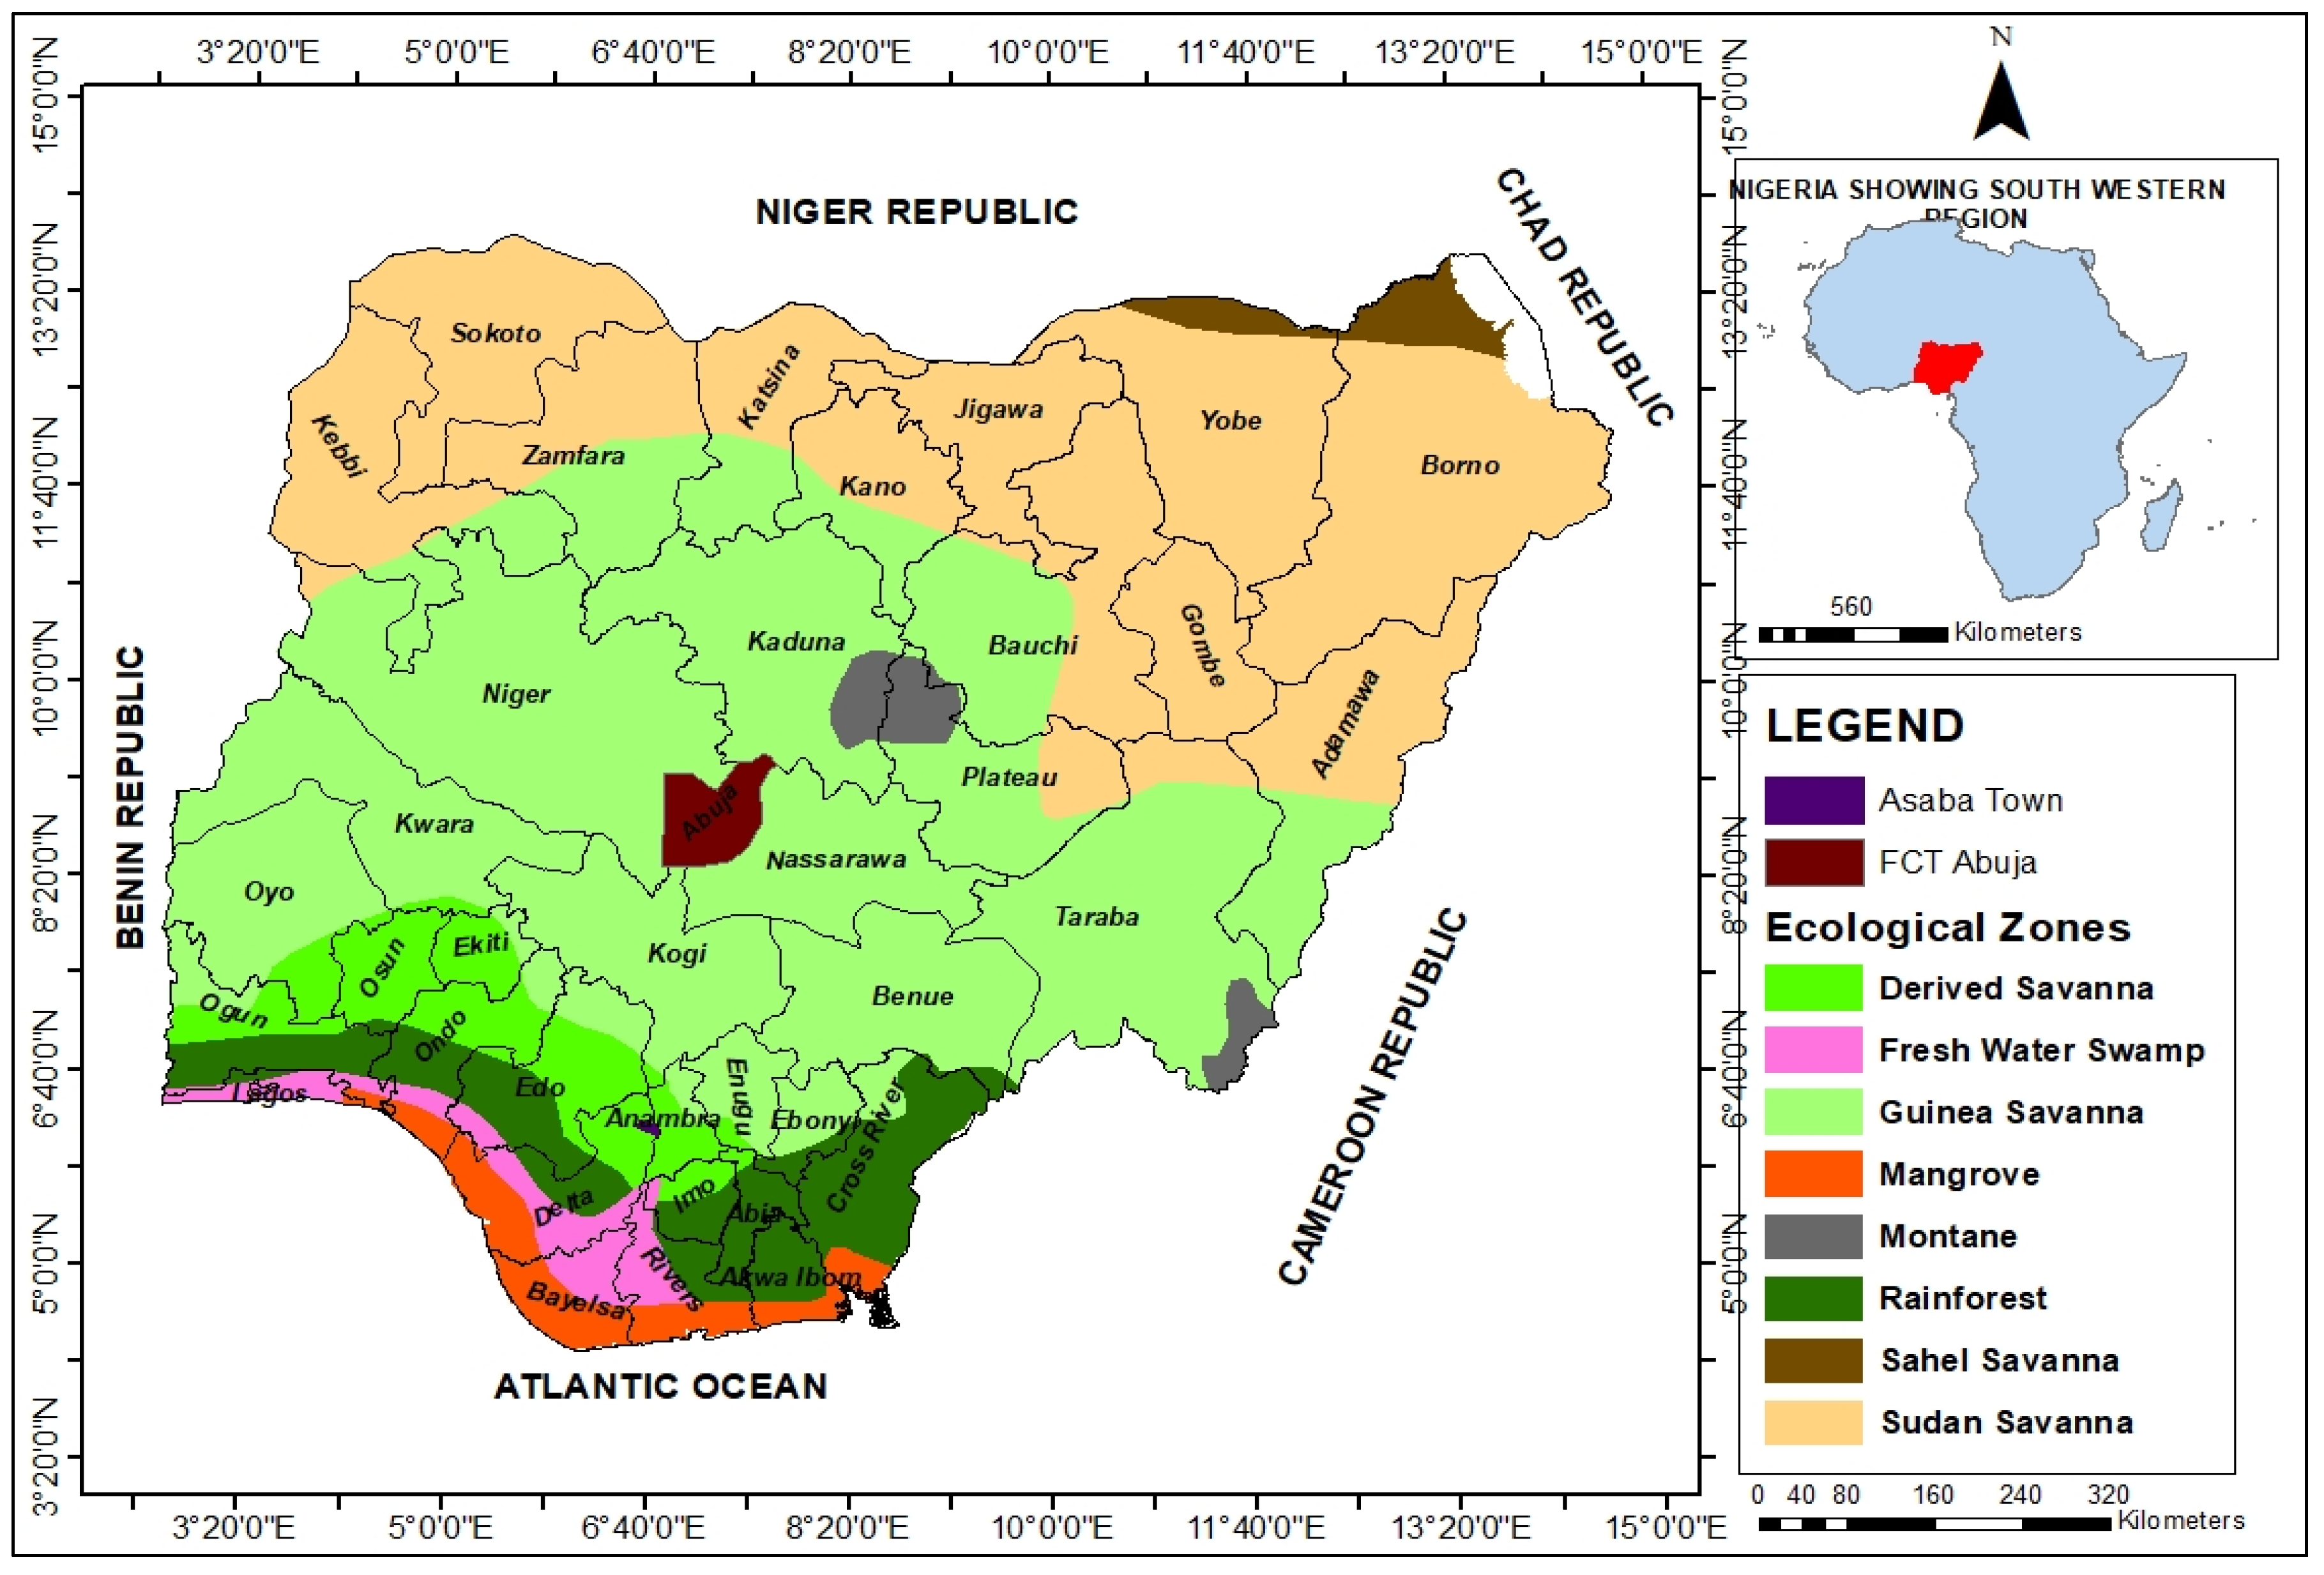
Figure 2.
Asaba Land use/land cover 1986.
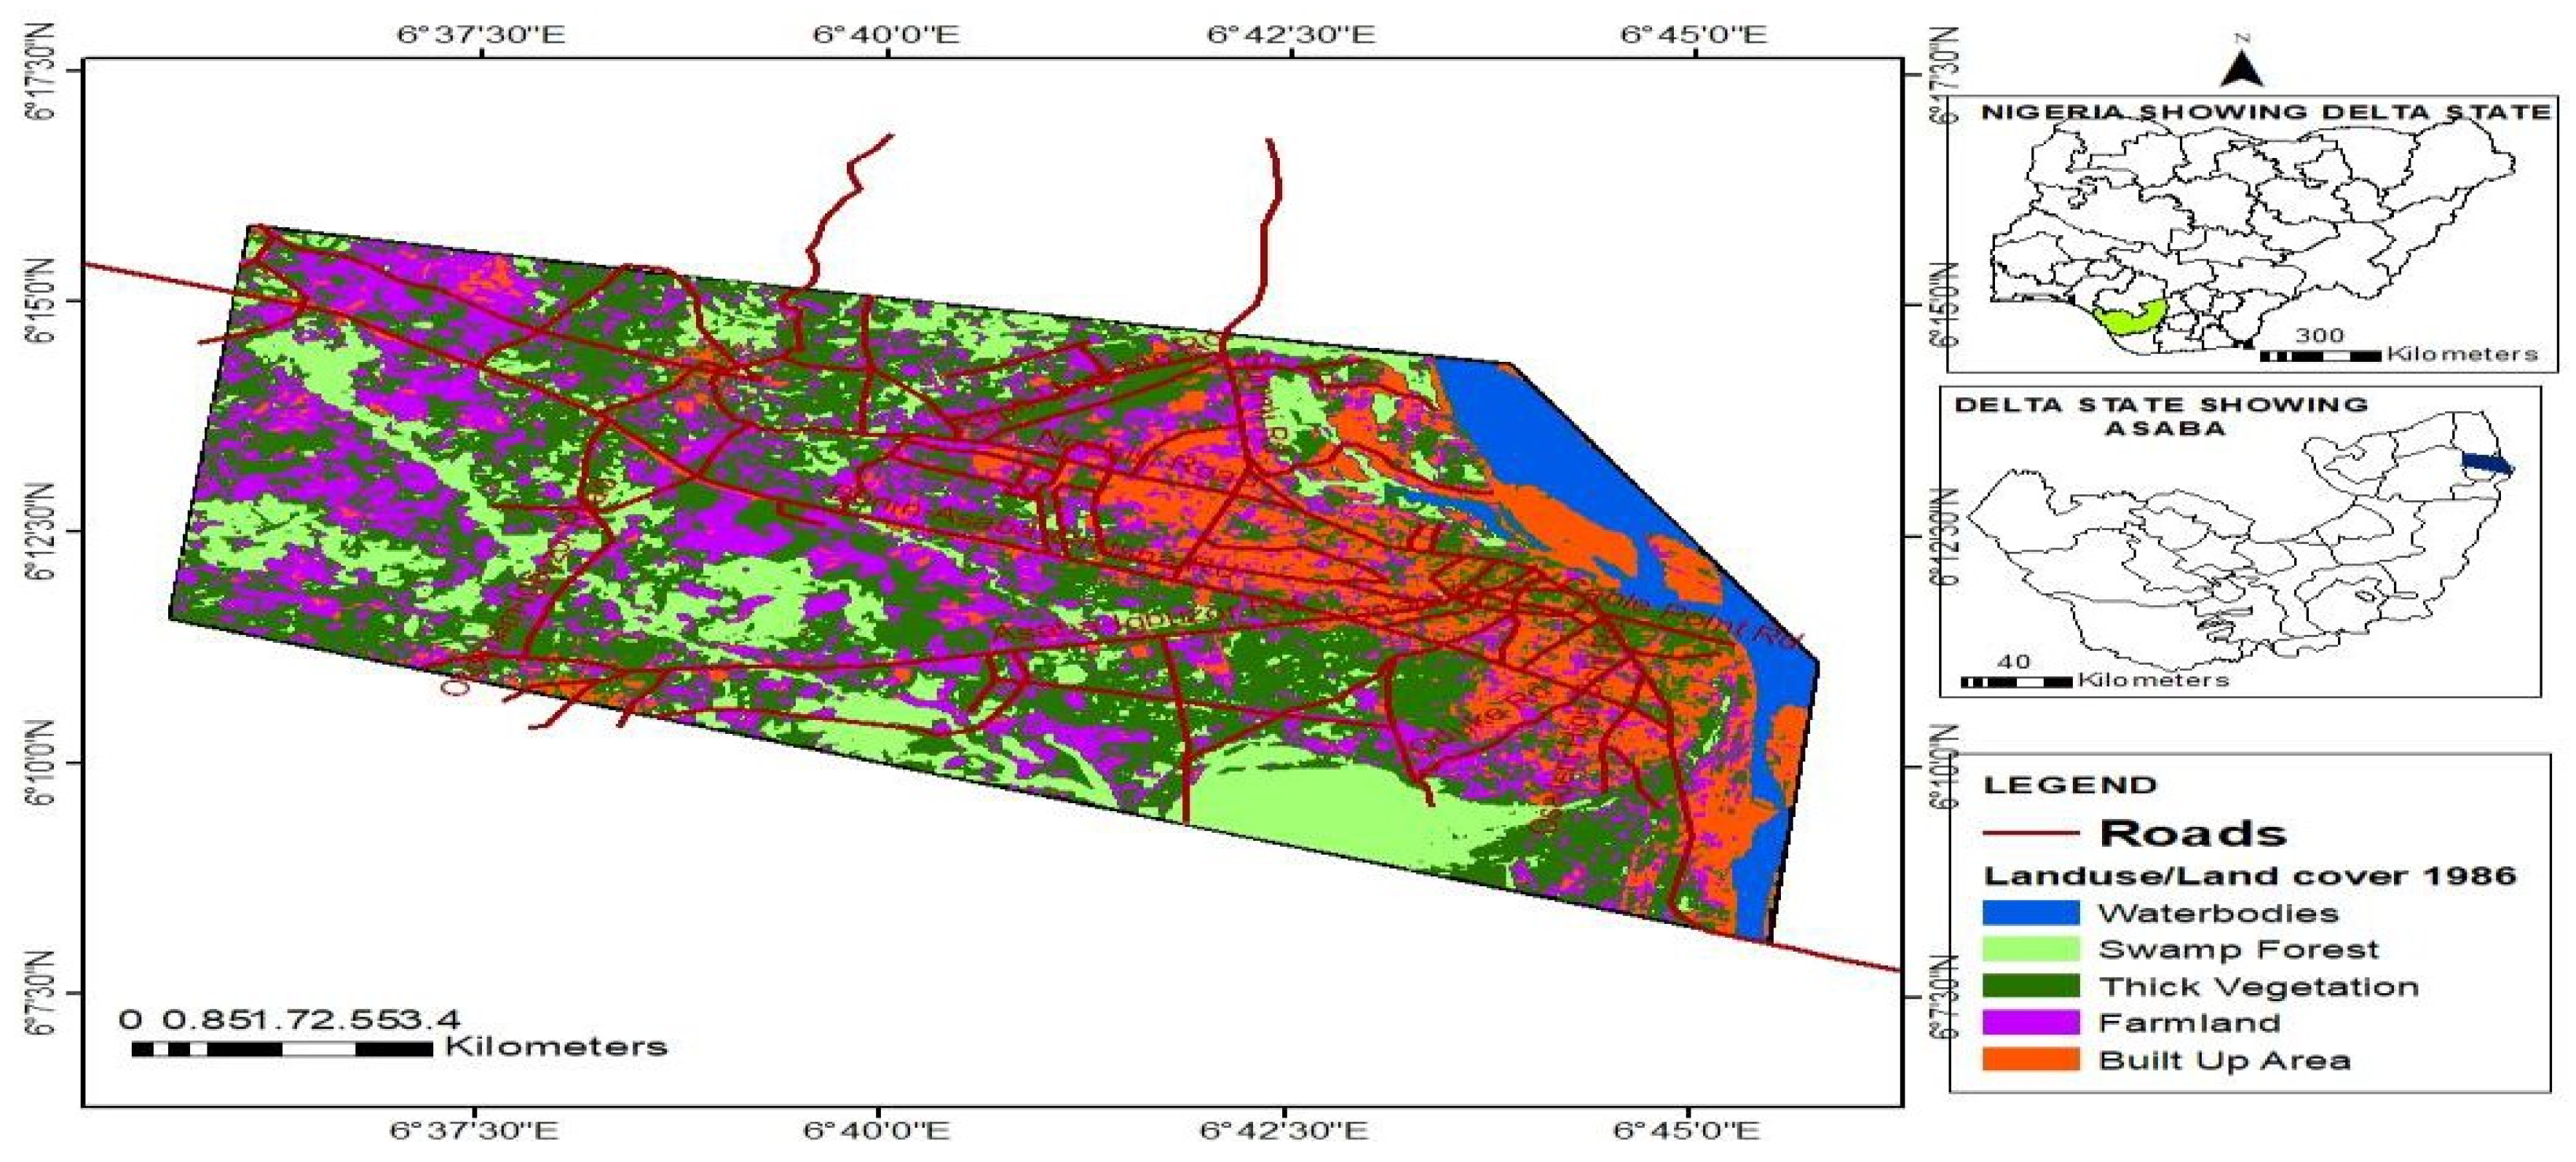
Figure 3.
Asaba land use/Land cover in 2002.
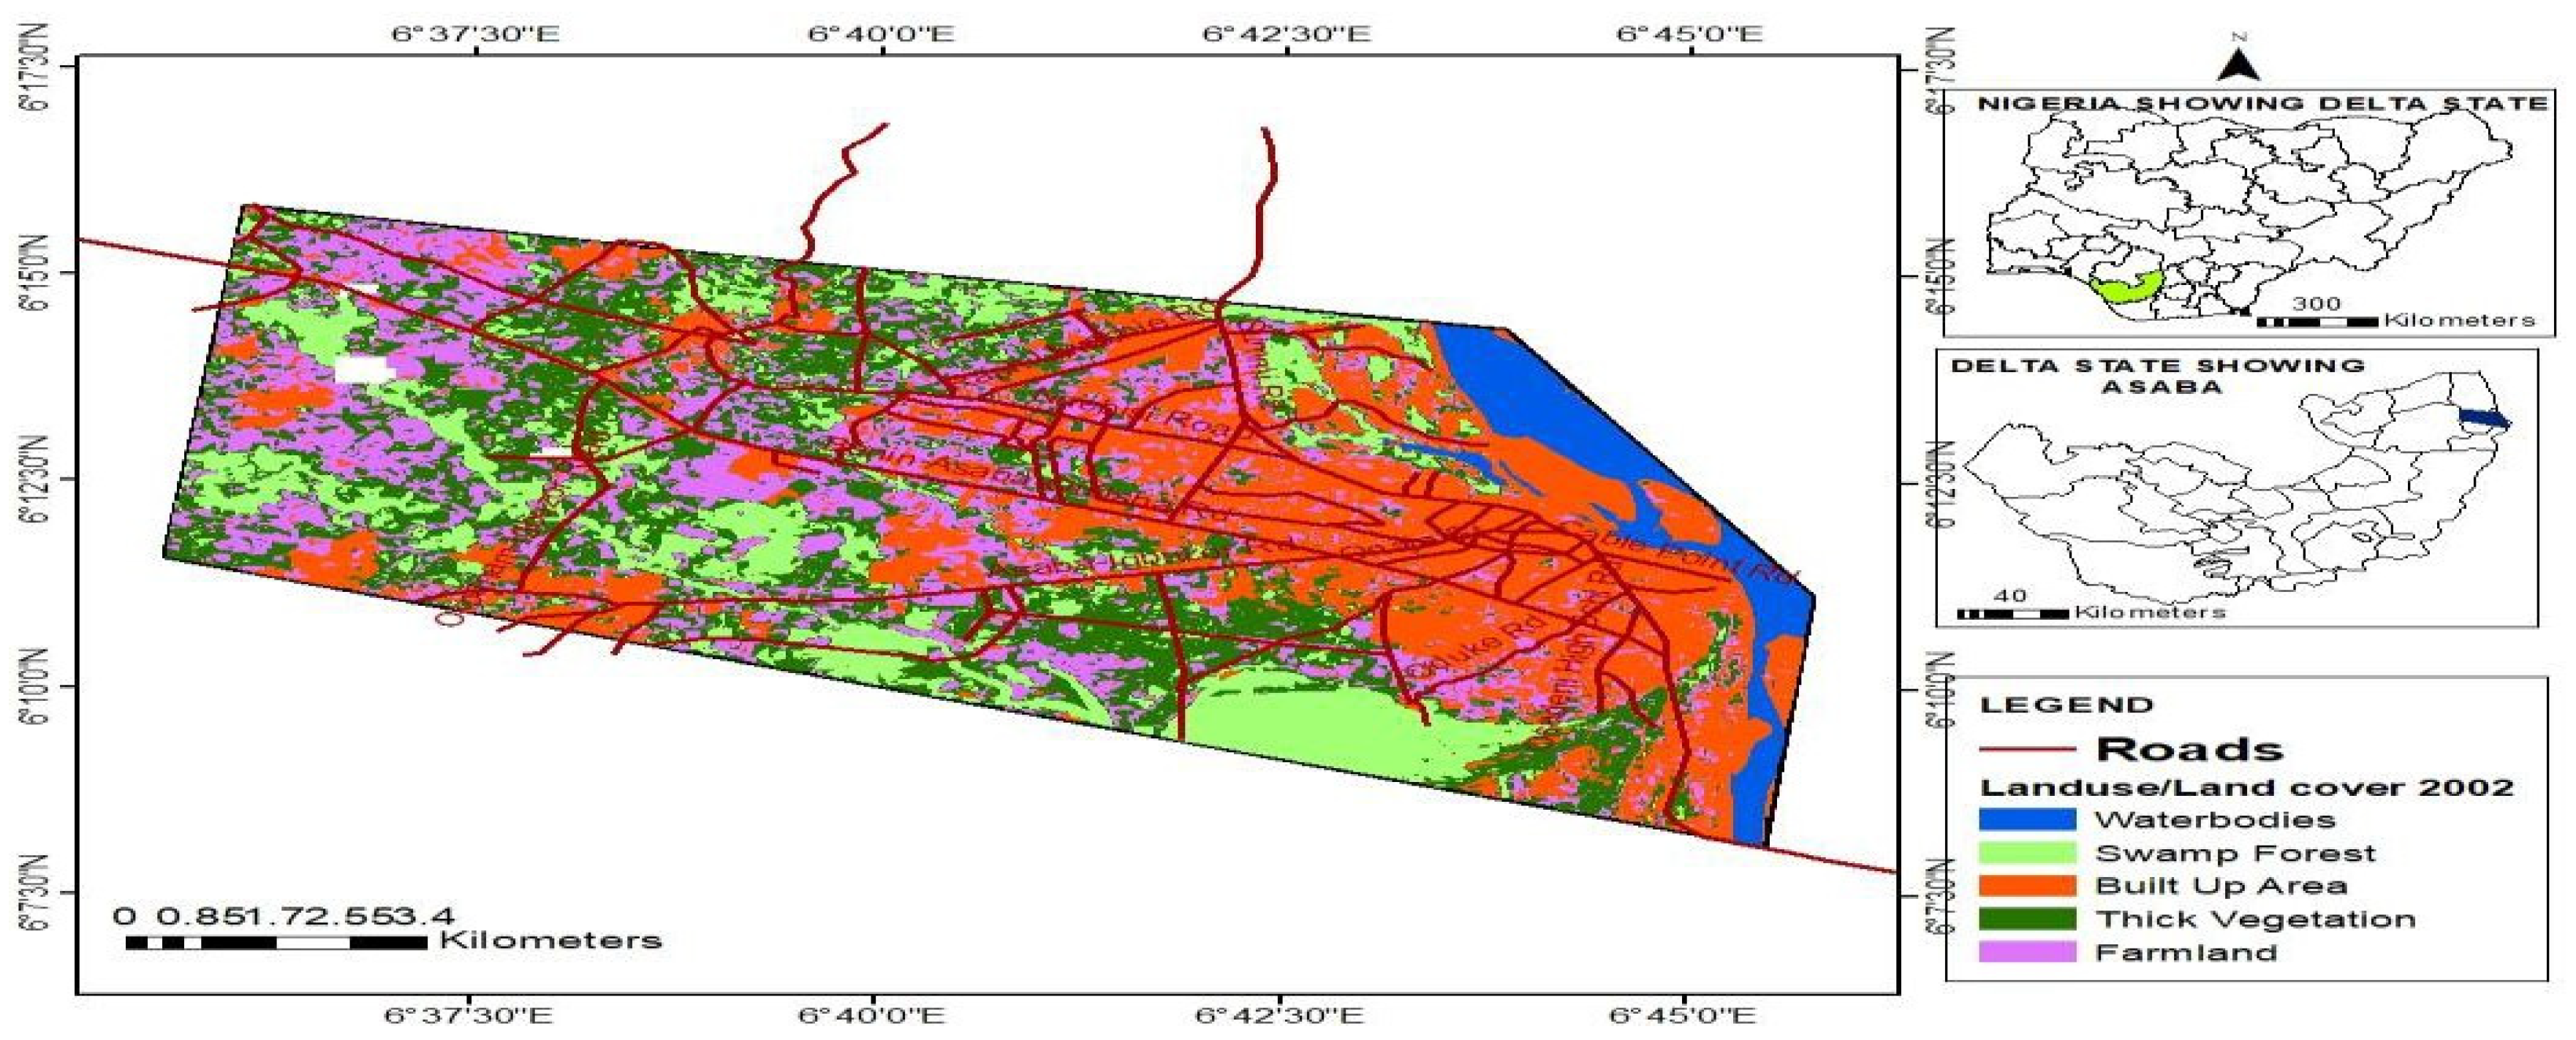
Figure 4.
Asaba Urban Land Use 2022.
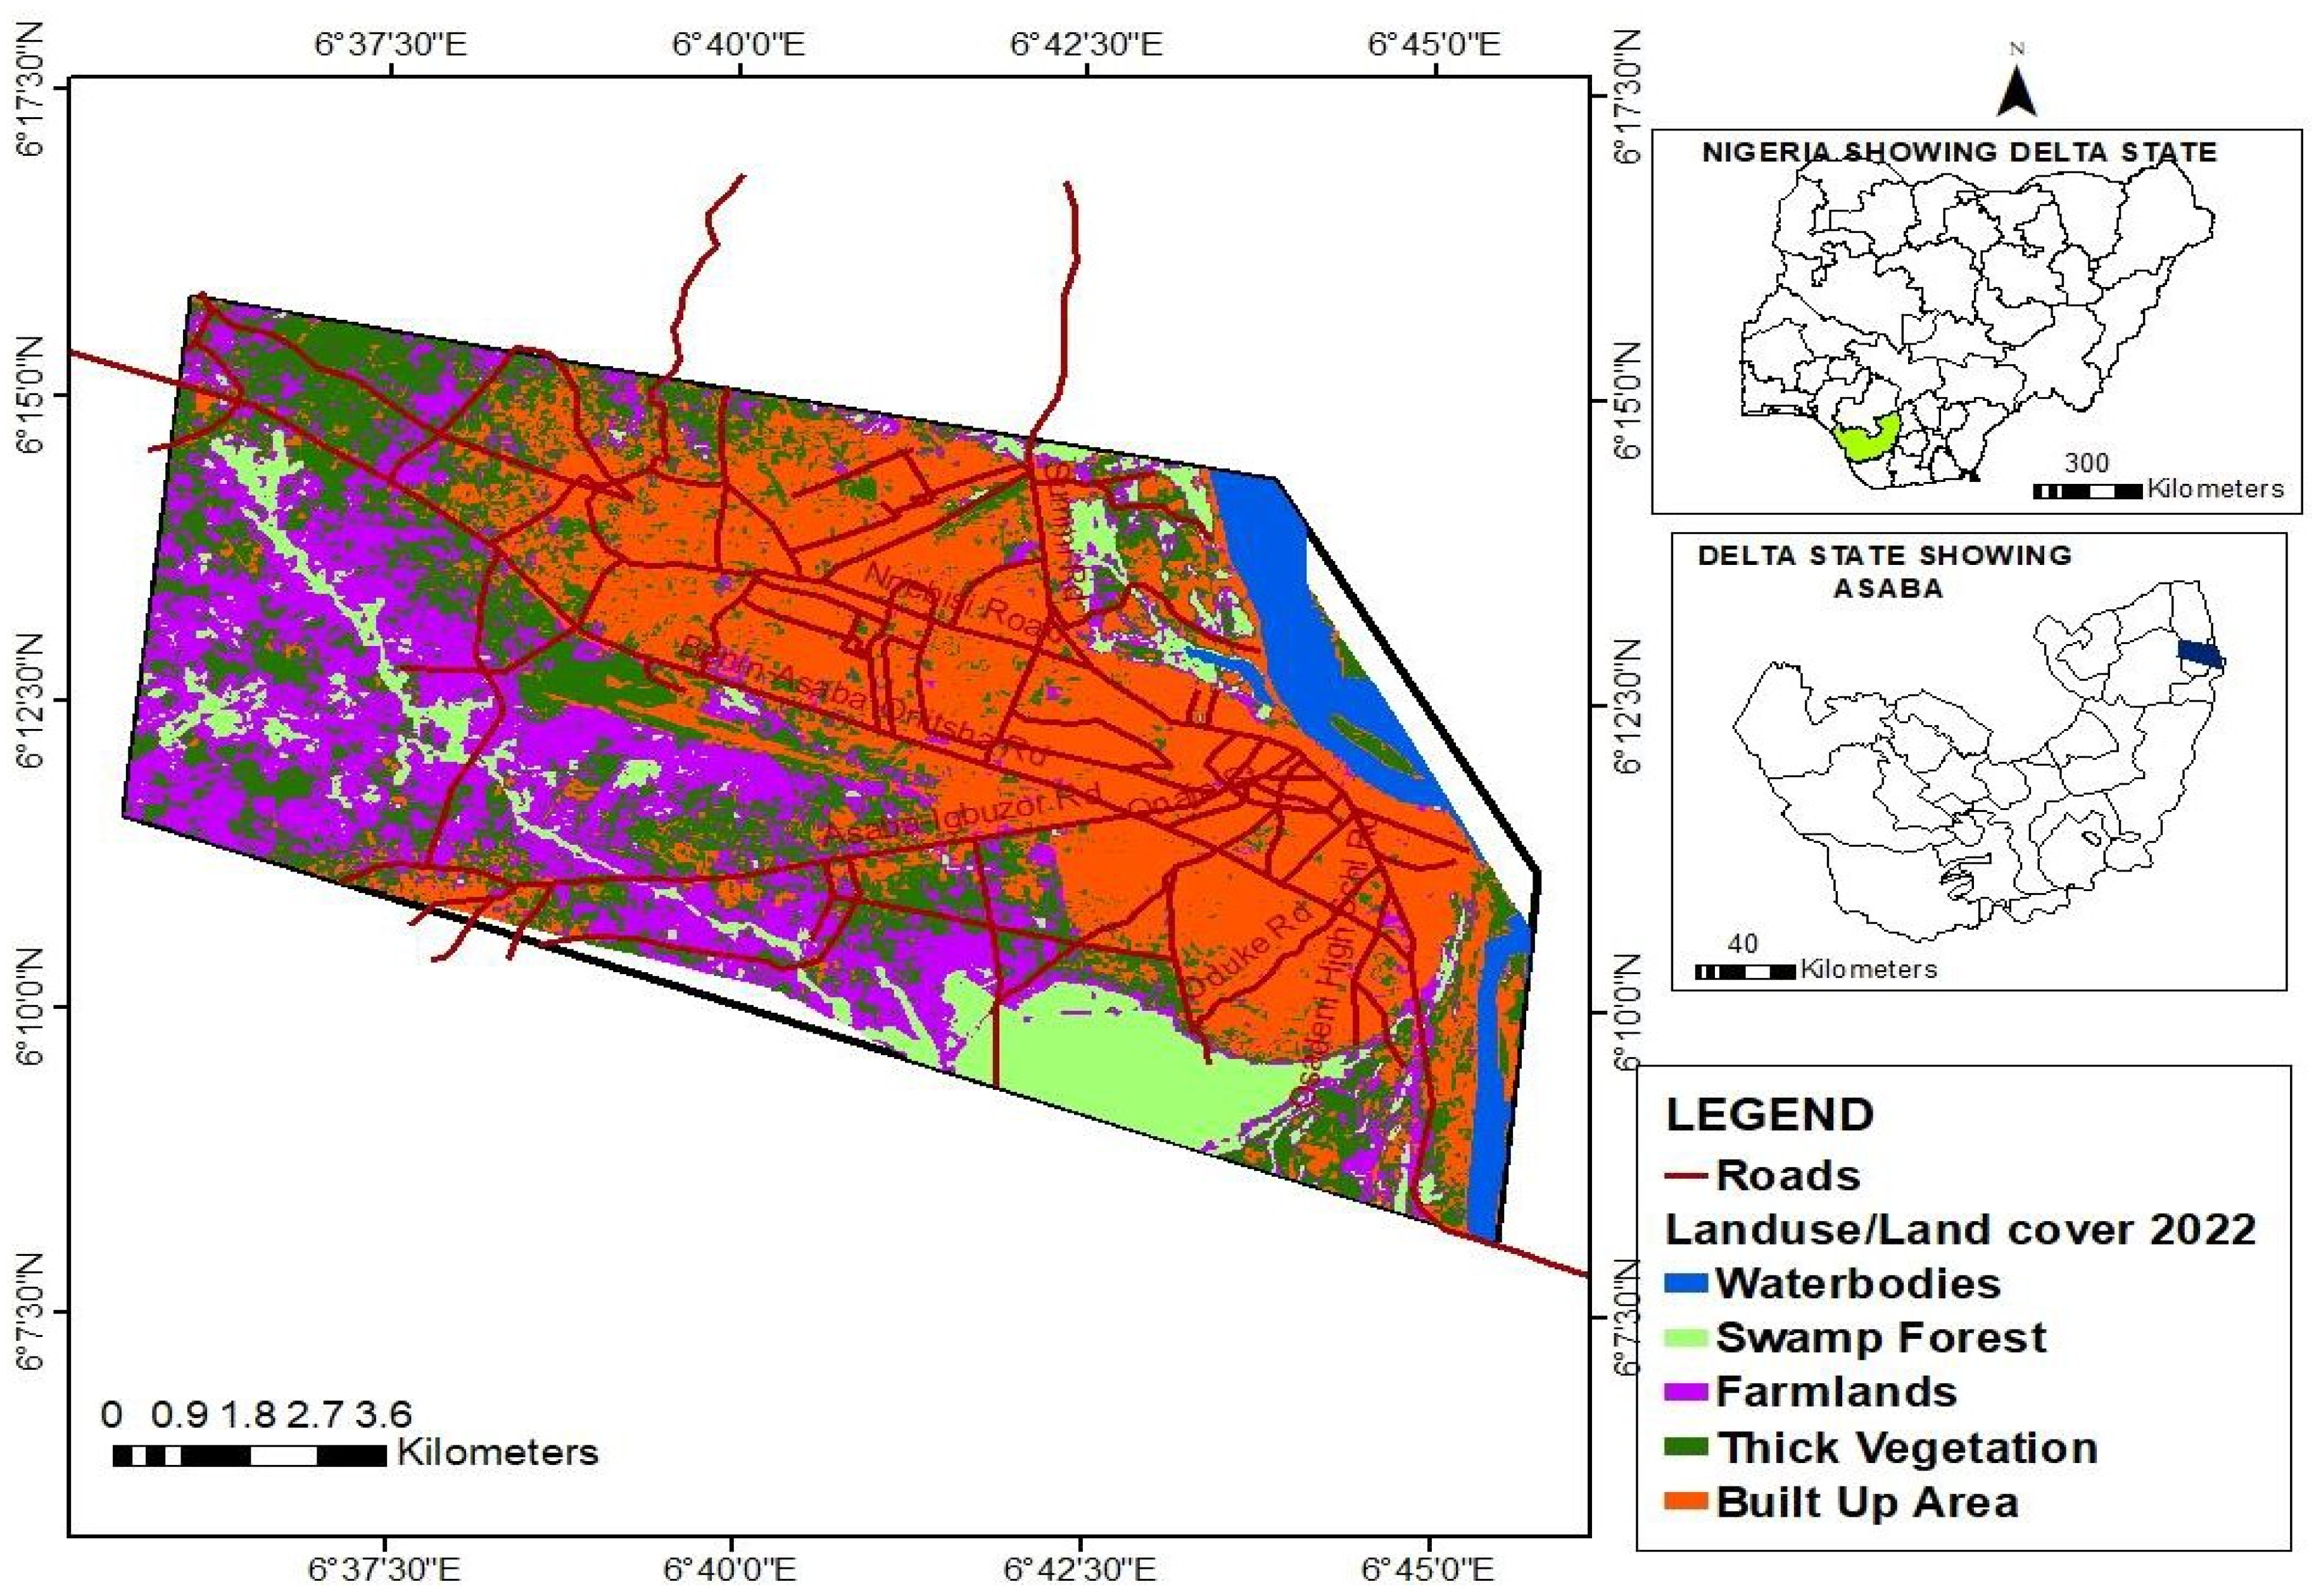
Figure 5.
Composite analysis of urban built-up area changes.
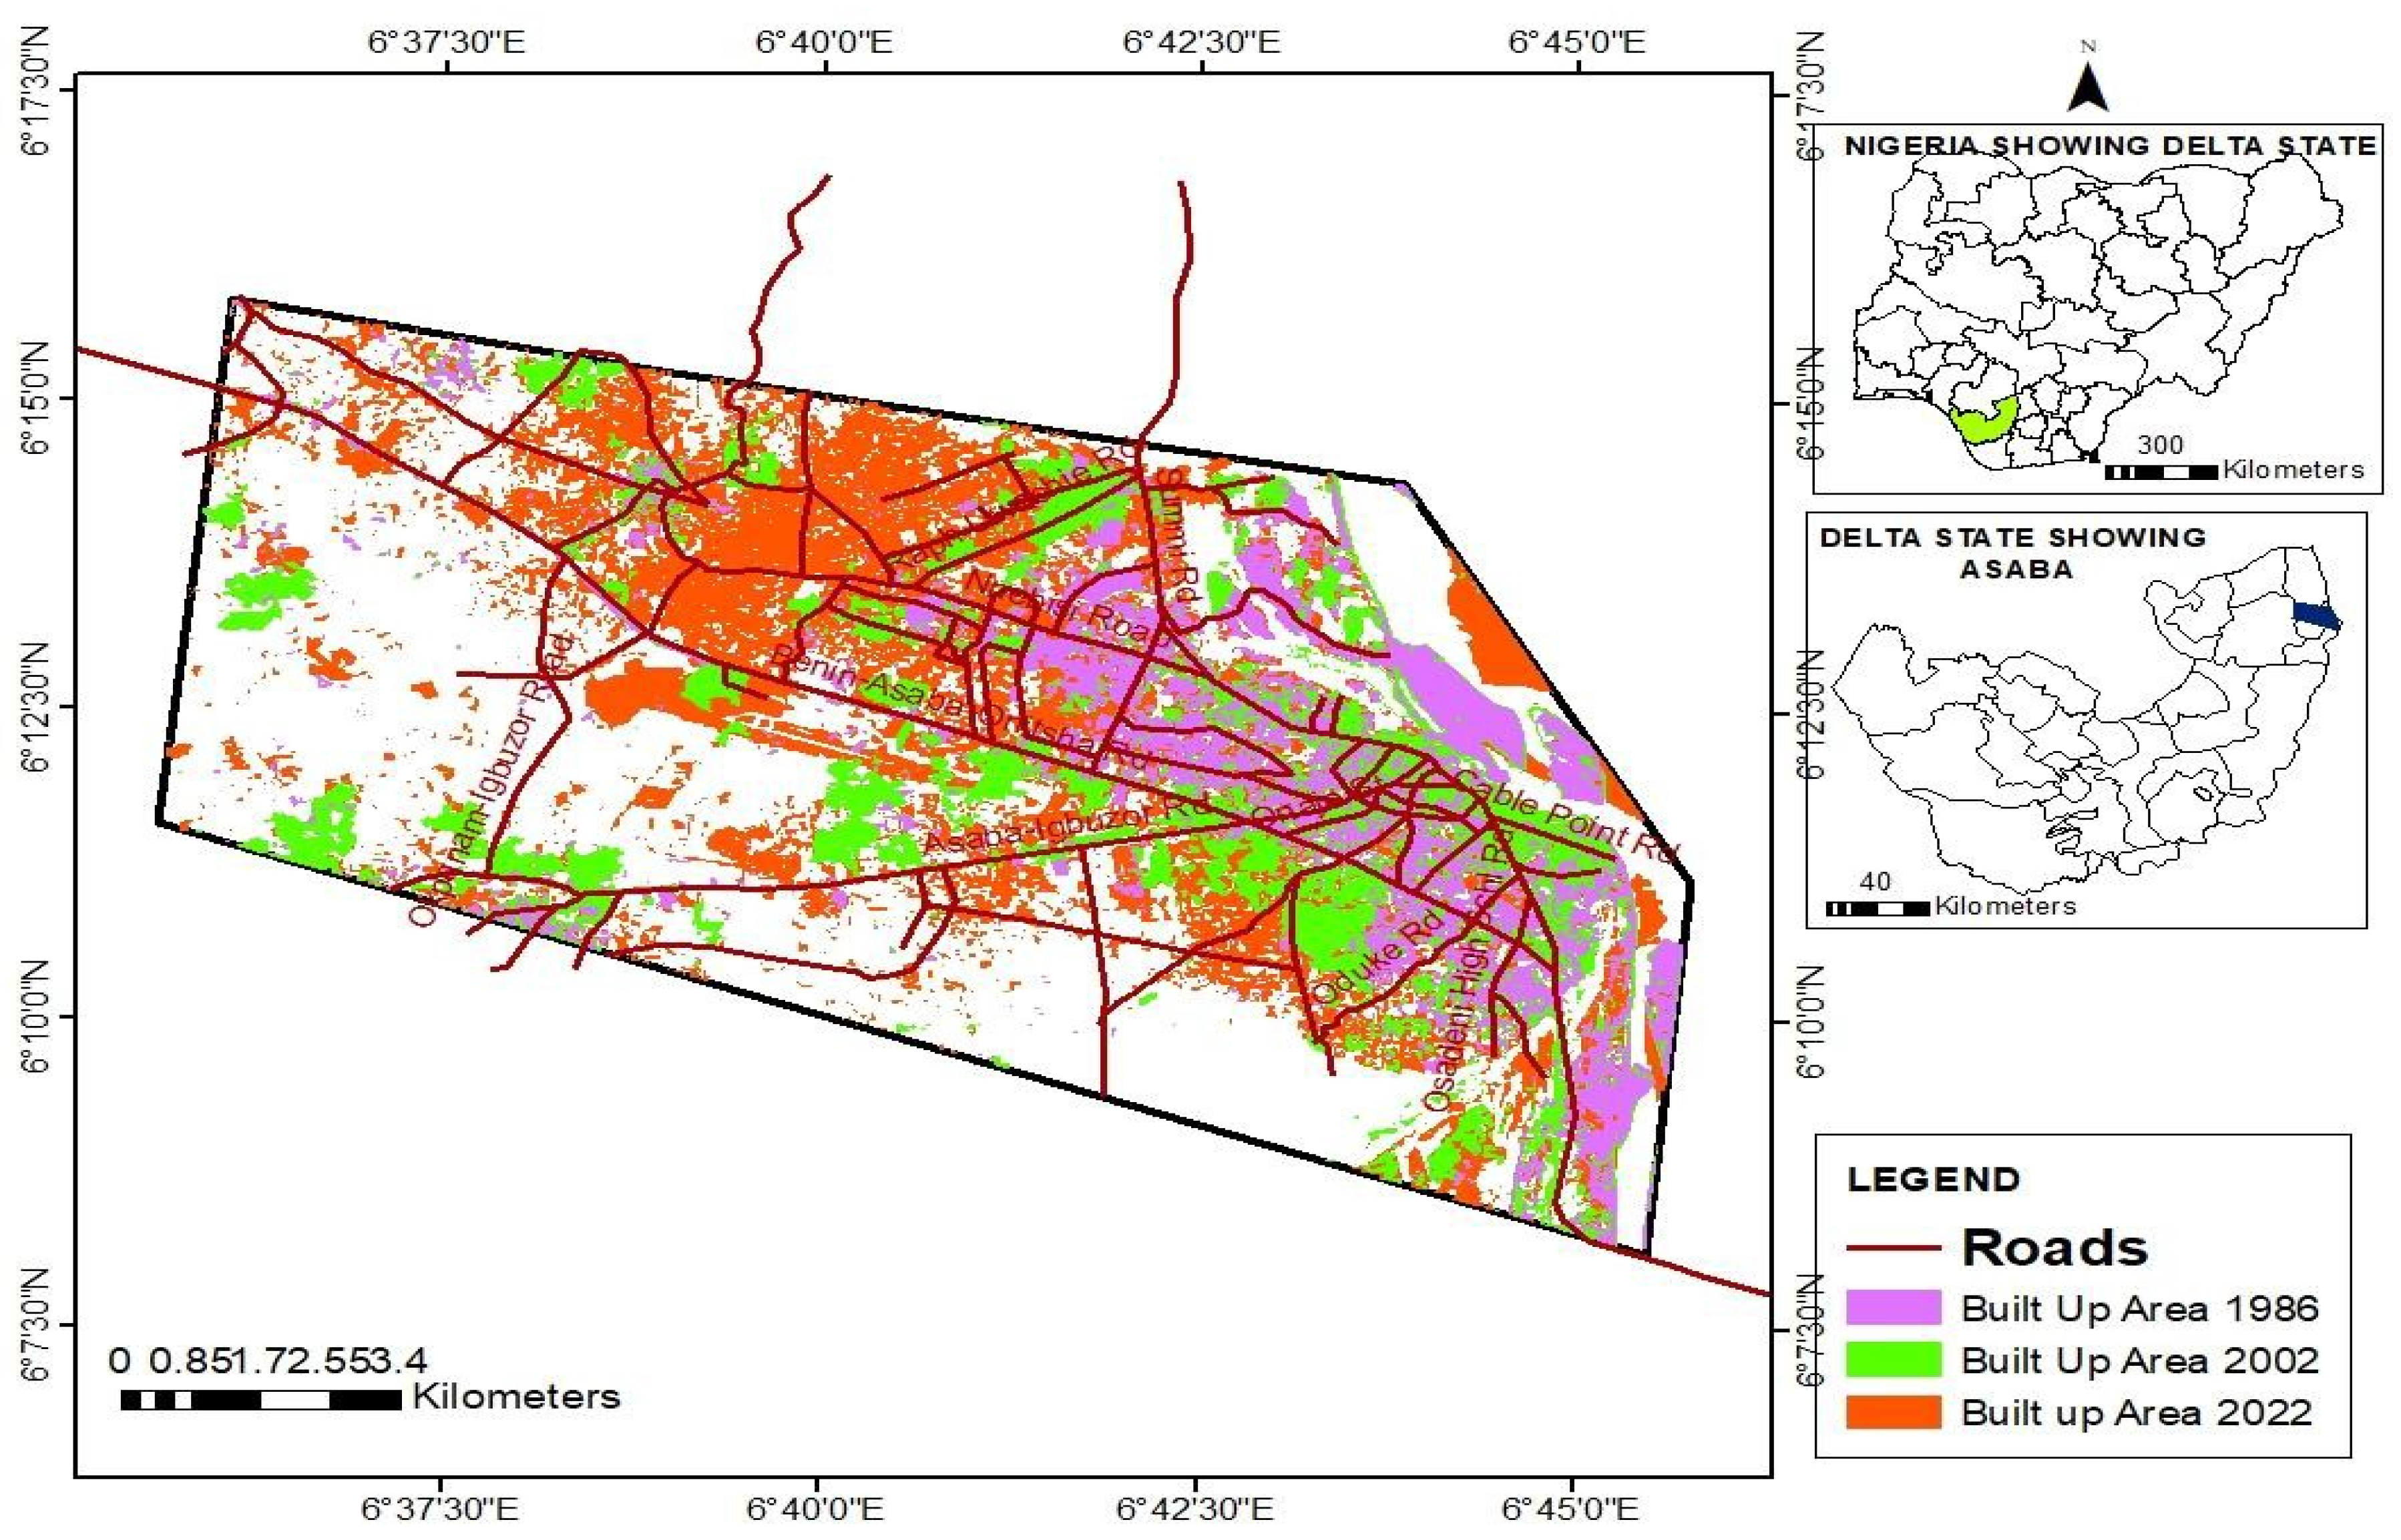
Figure 6.
Asaba Land Surface Temperature in 1986.
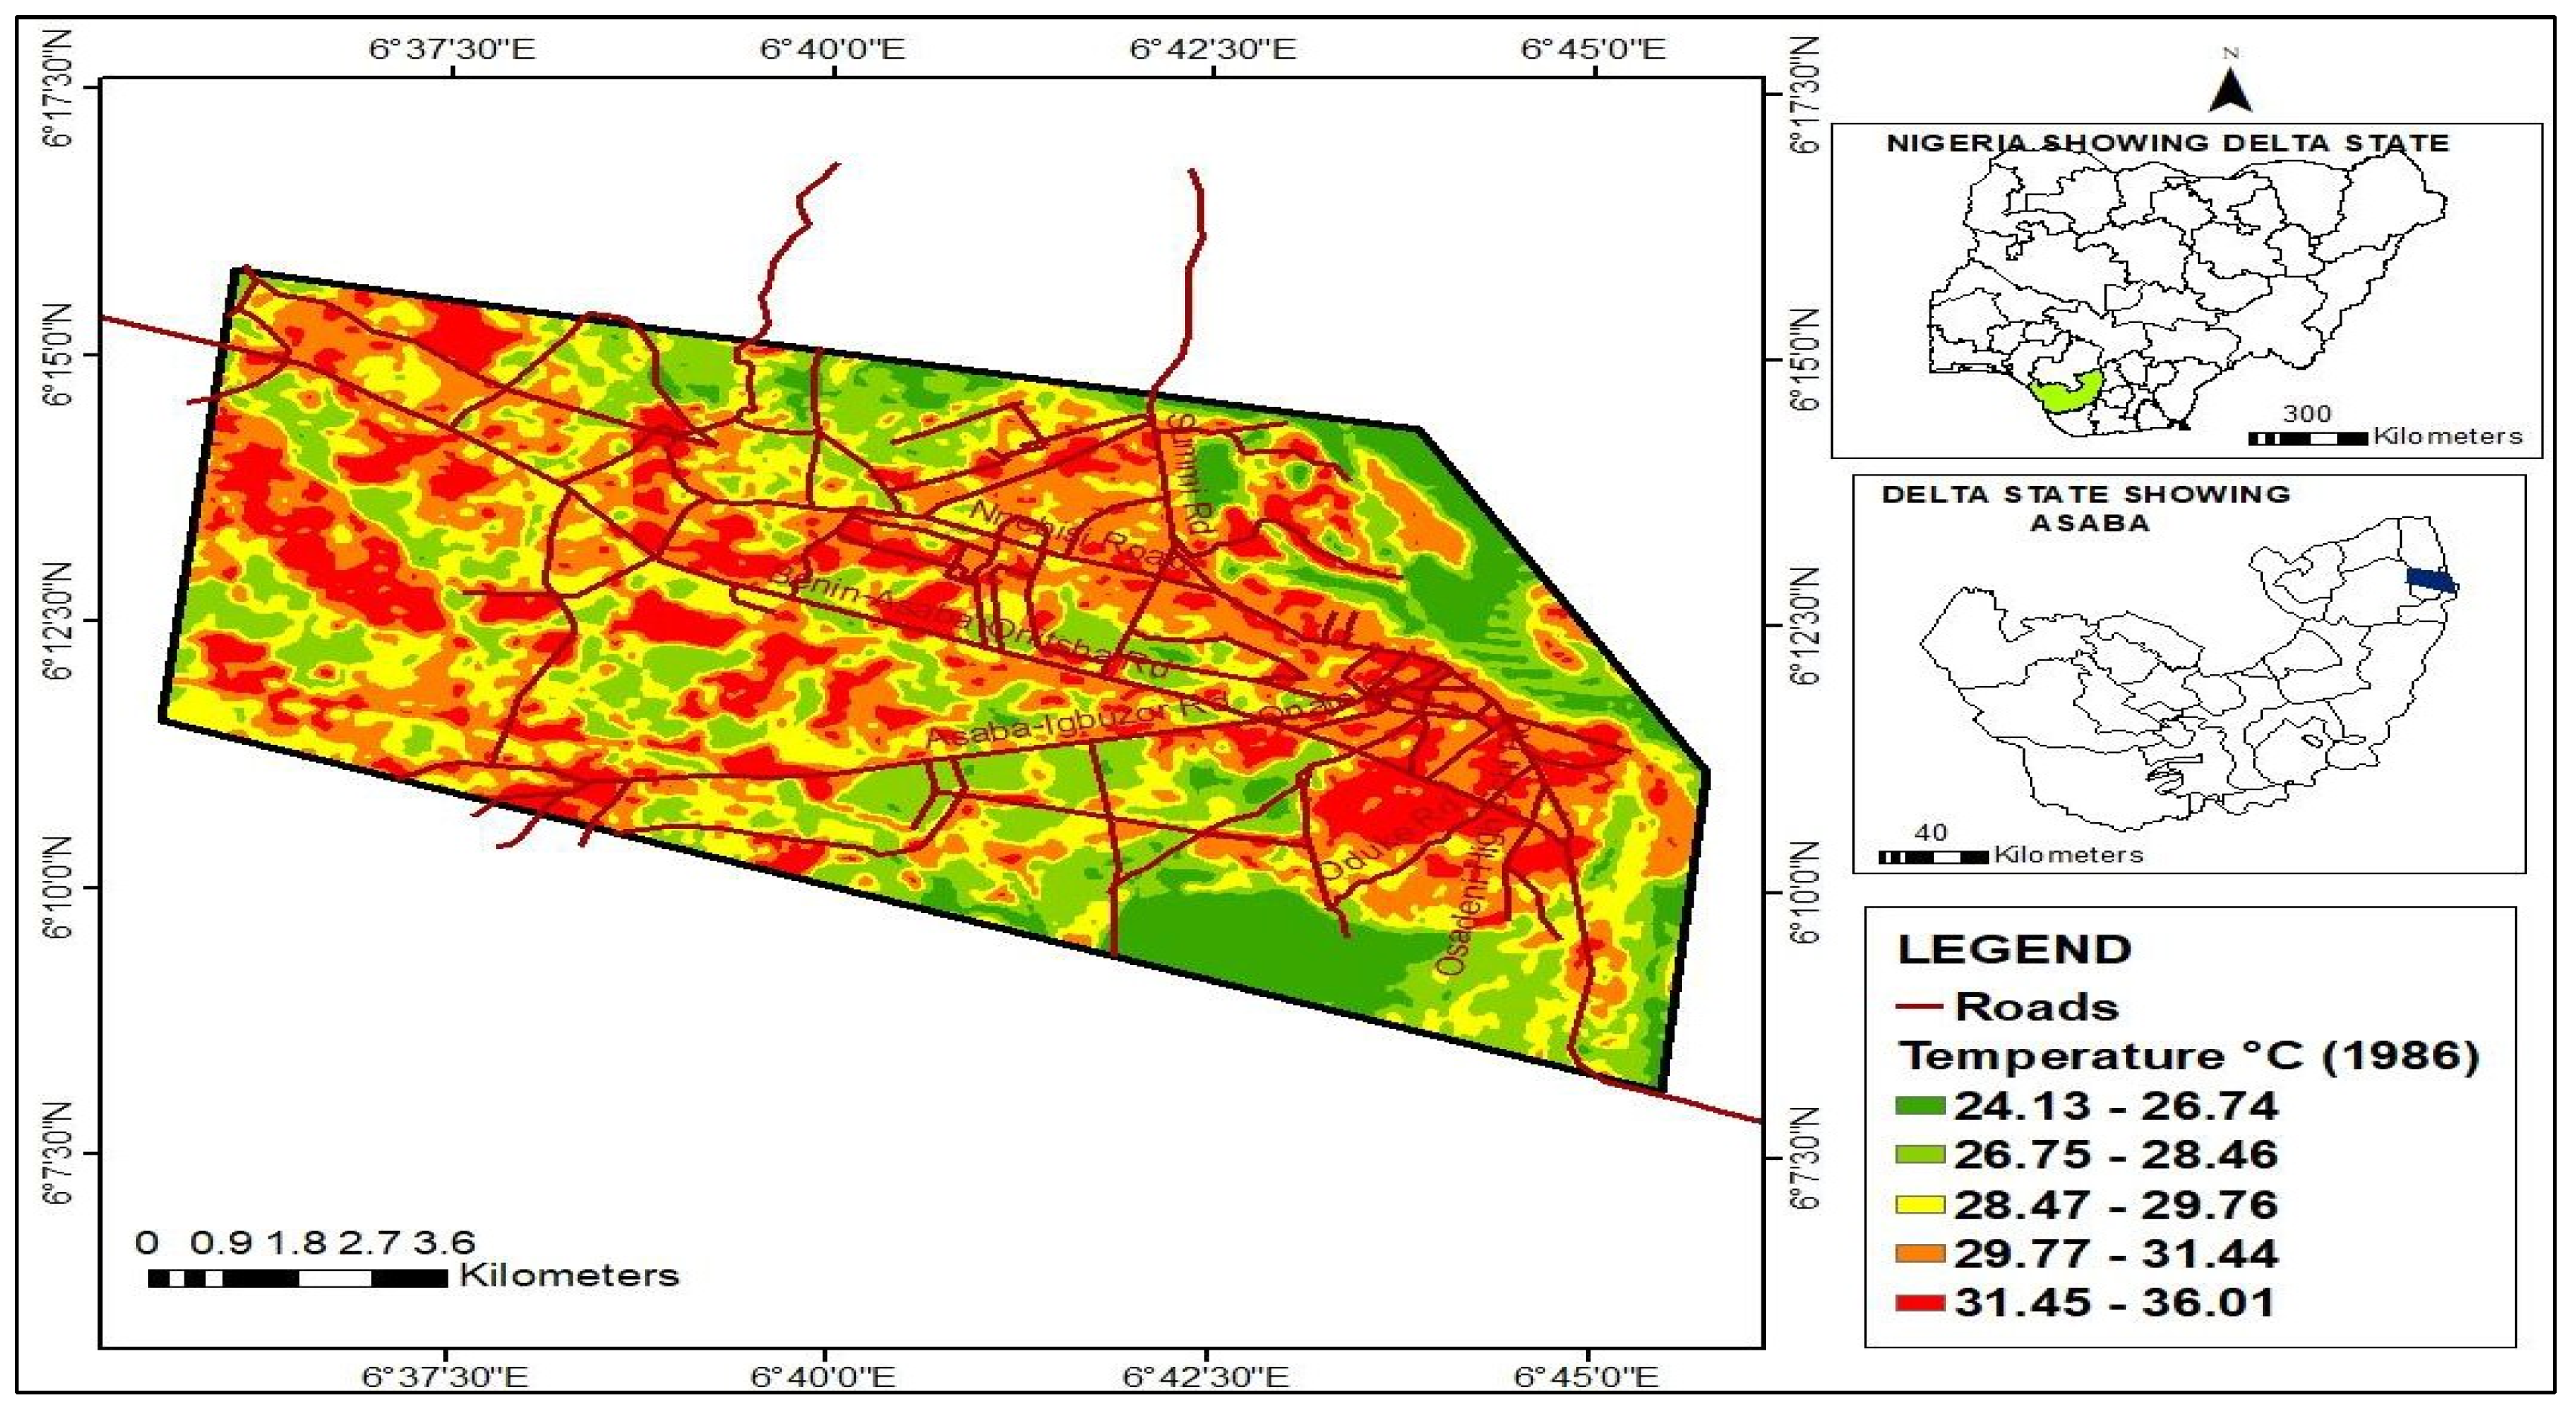
Figure 7.
Land Surface Temperature in 2002.
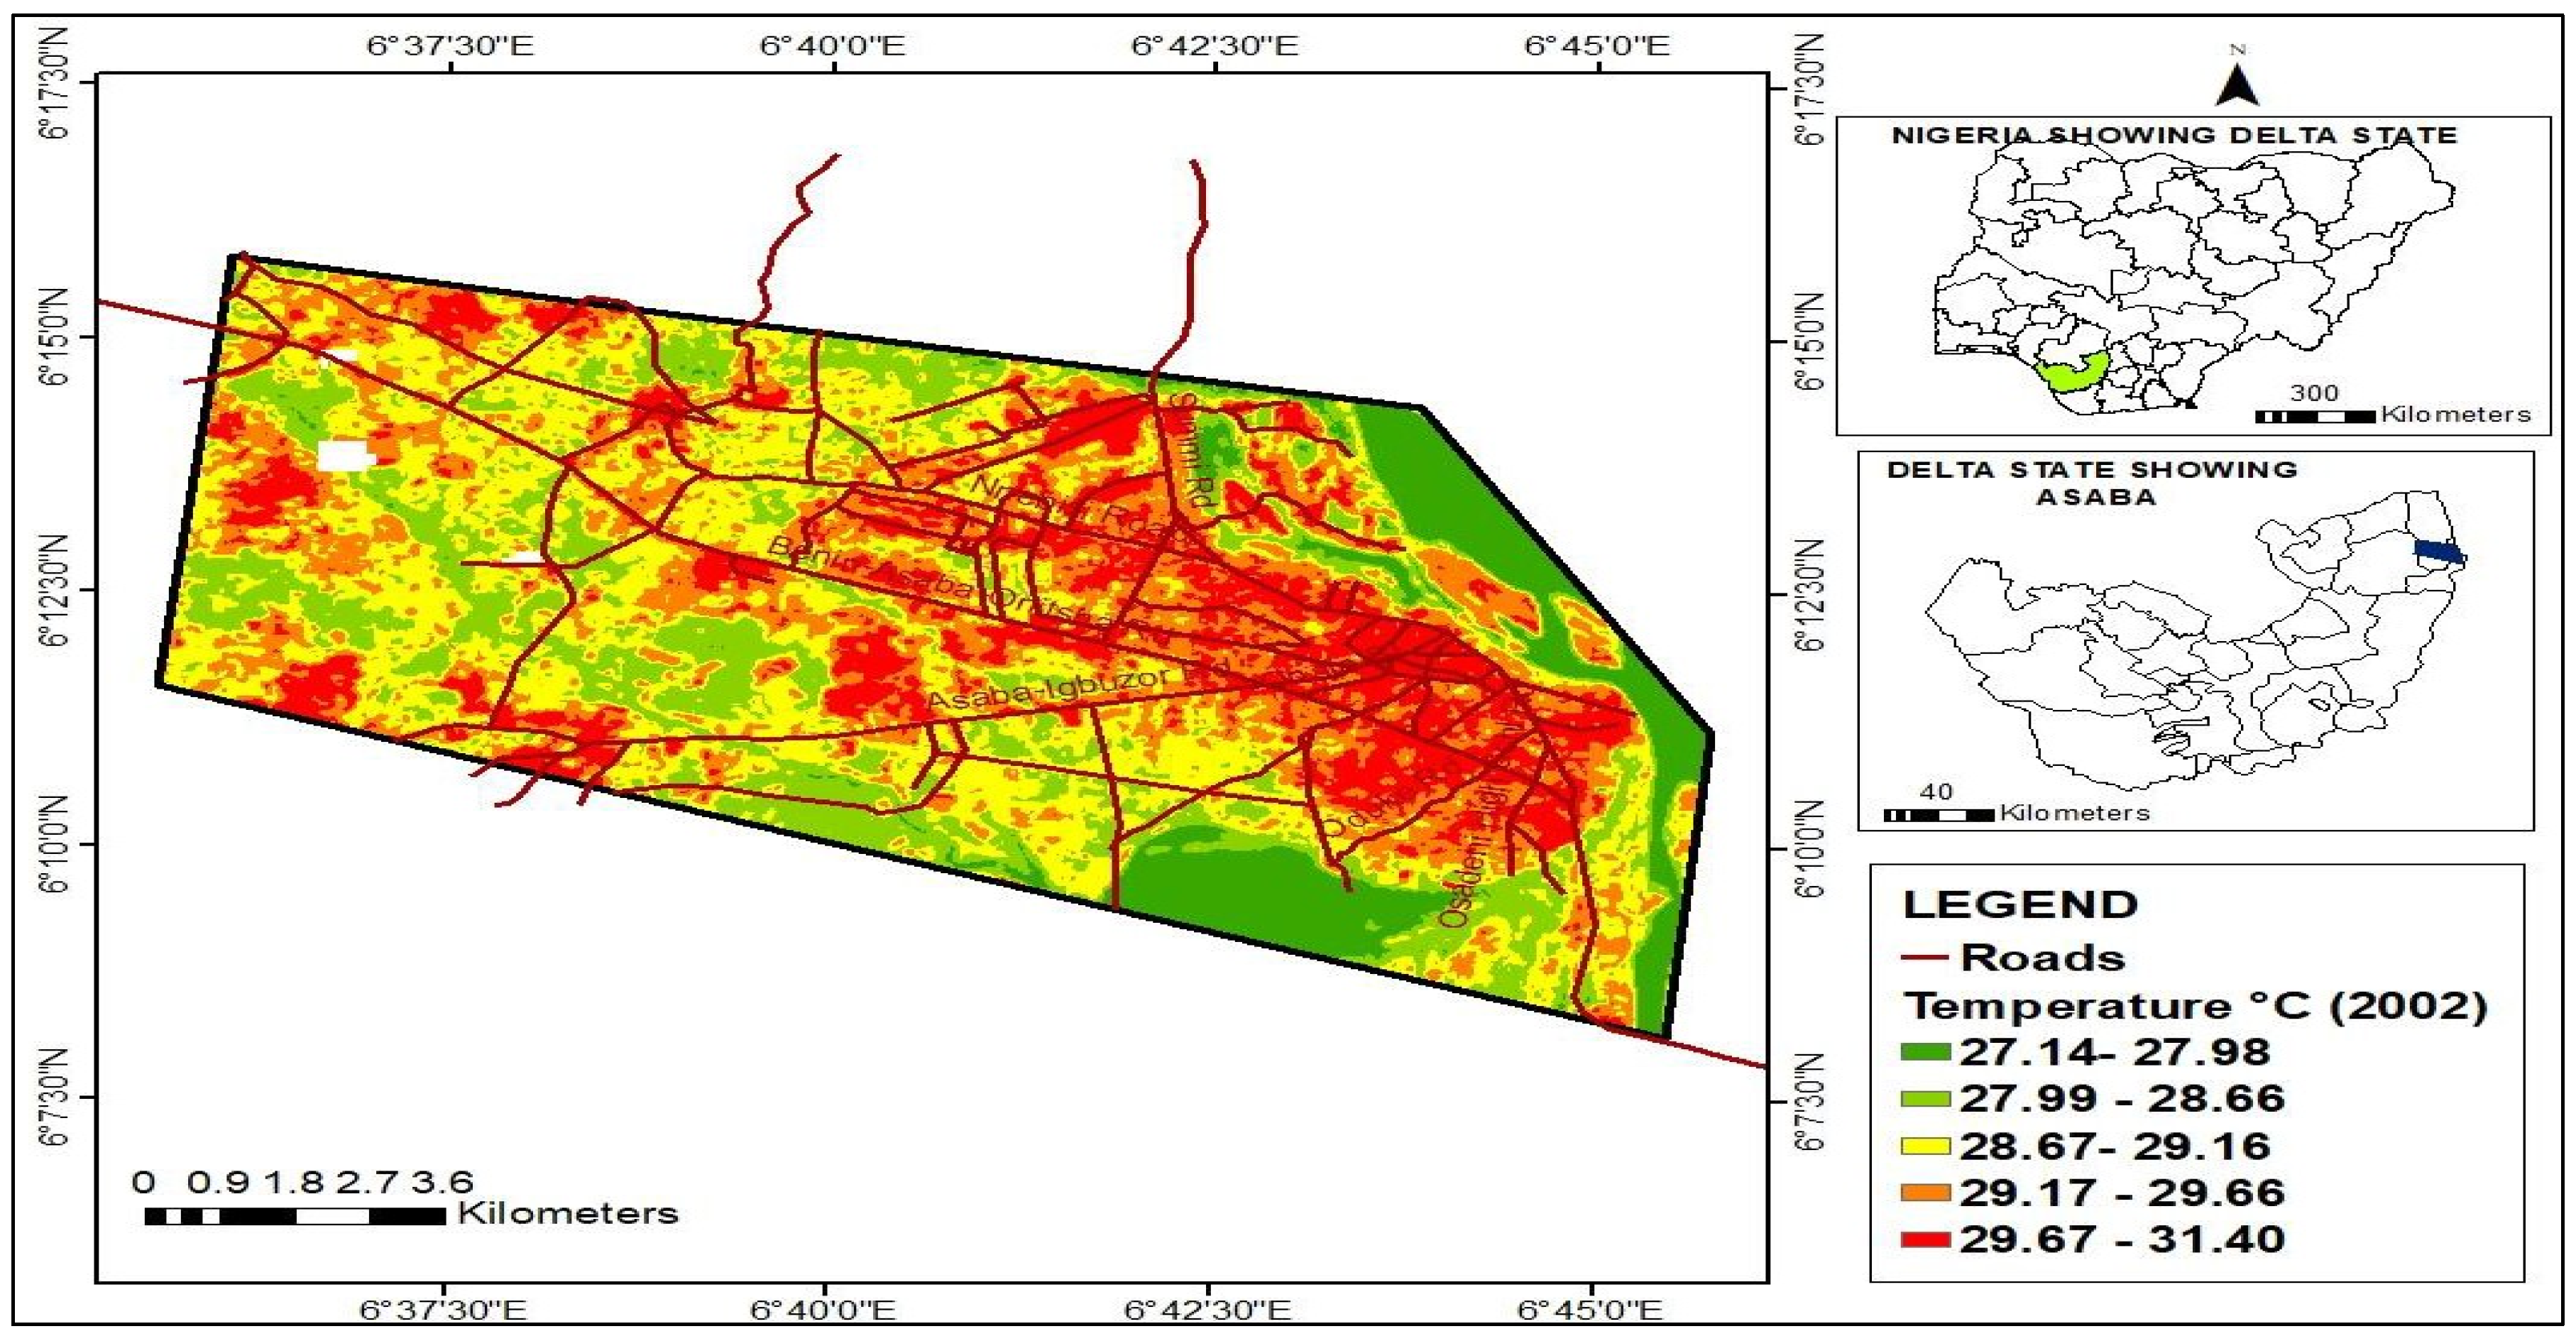
Figure 8.
Land Surface Temperature in 2022.
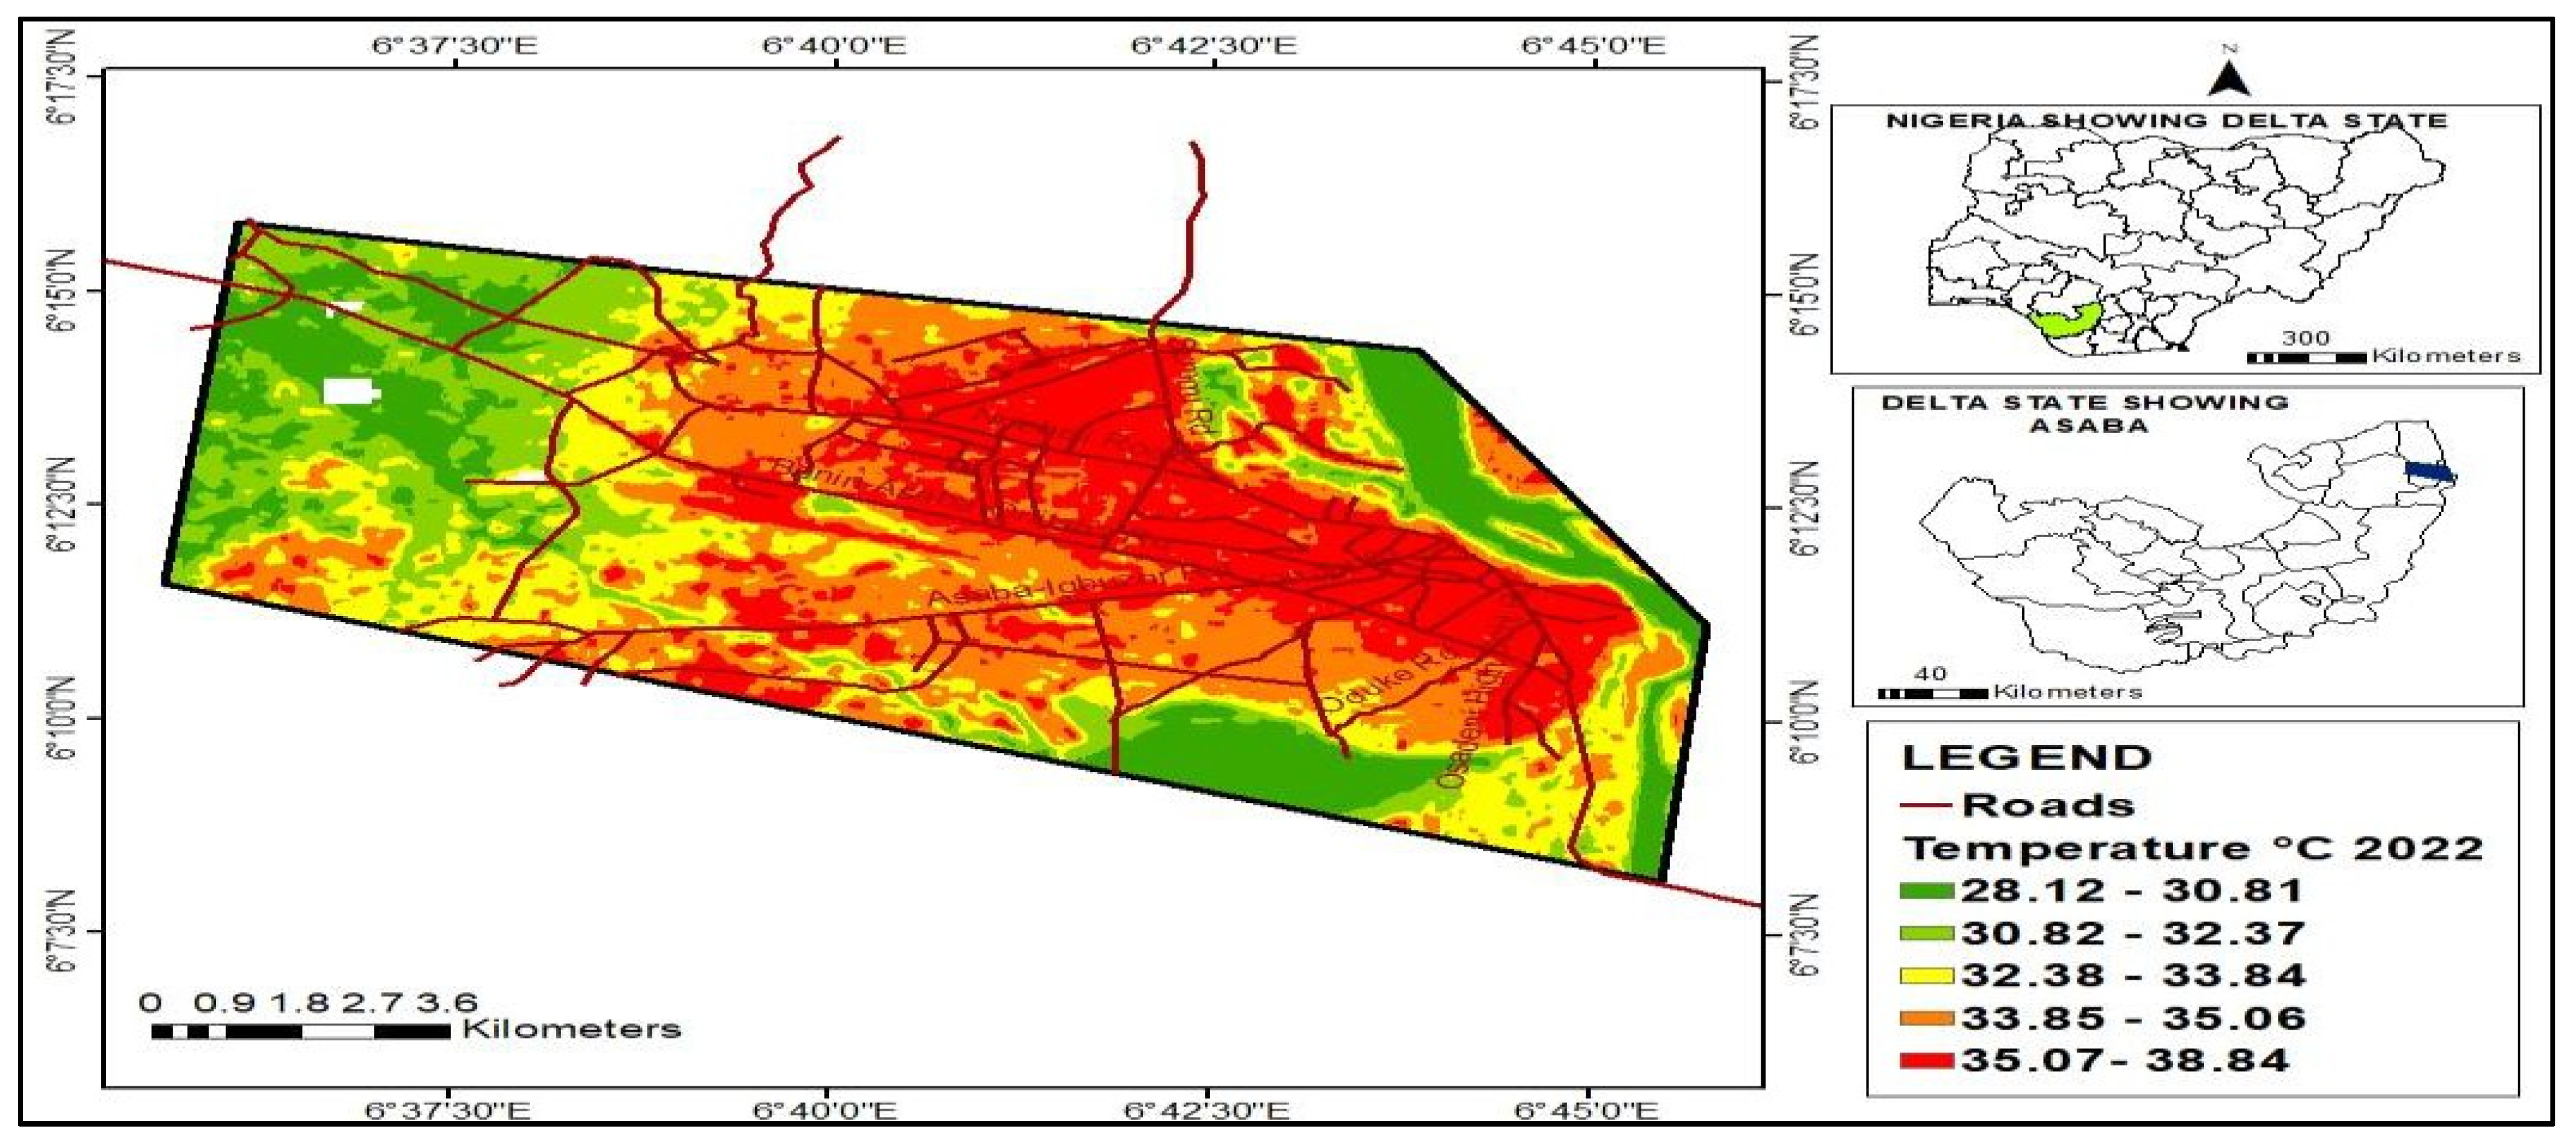
Figure 9.
Land use/Land cover in 1986.
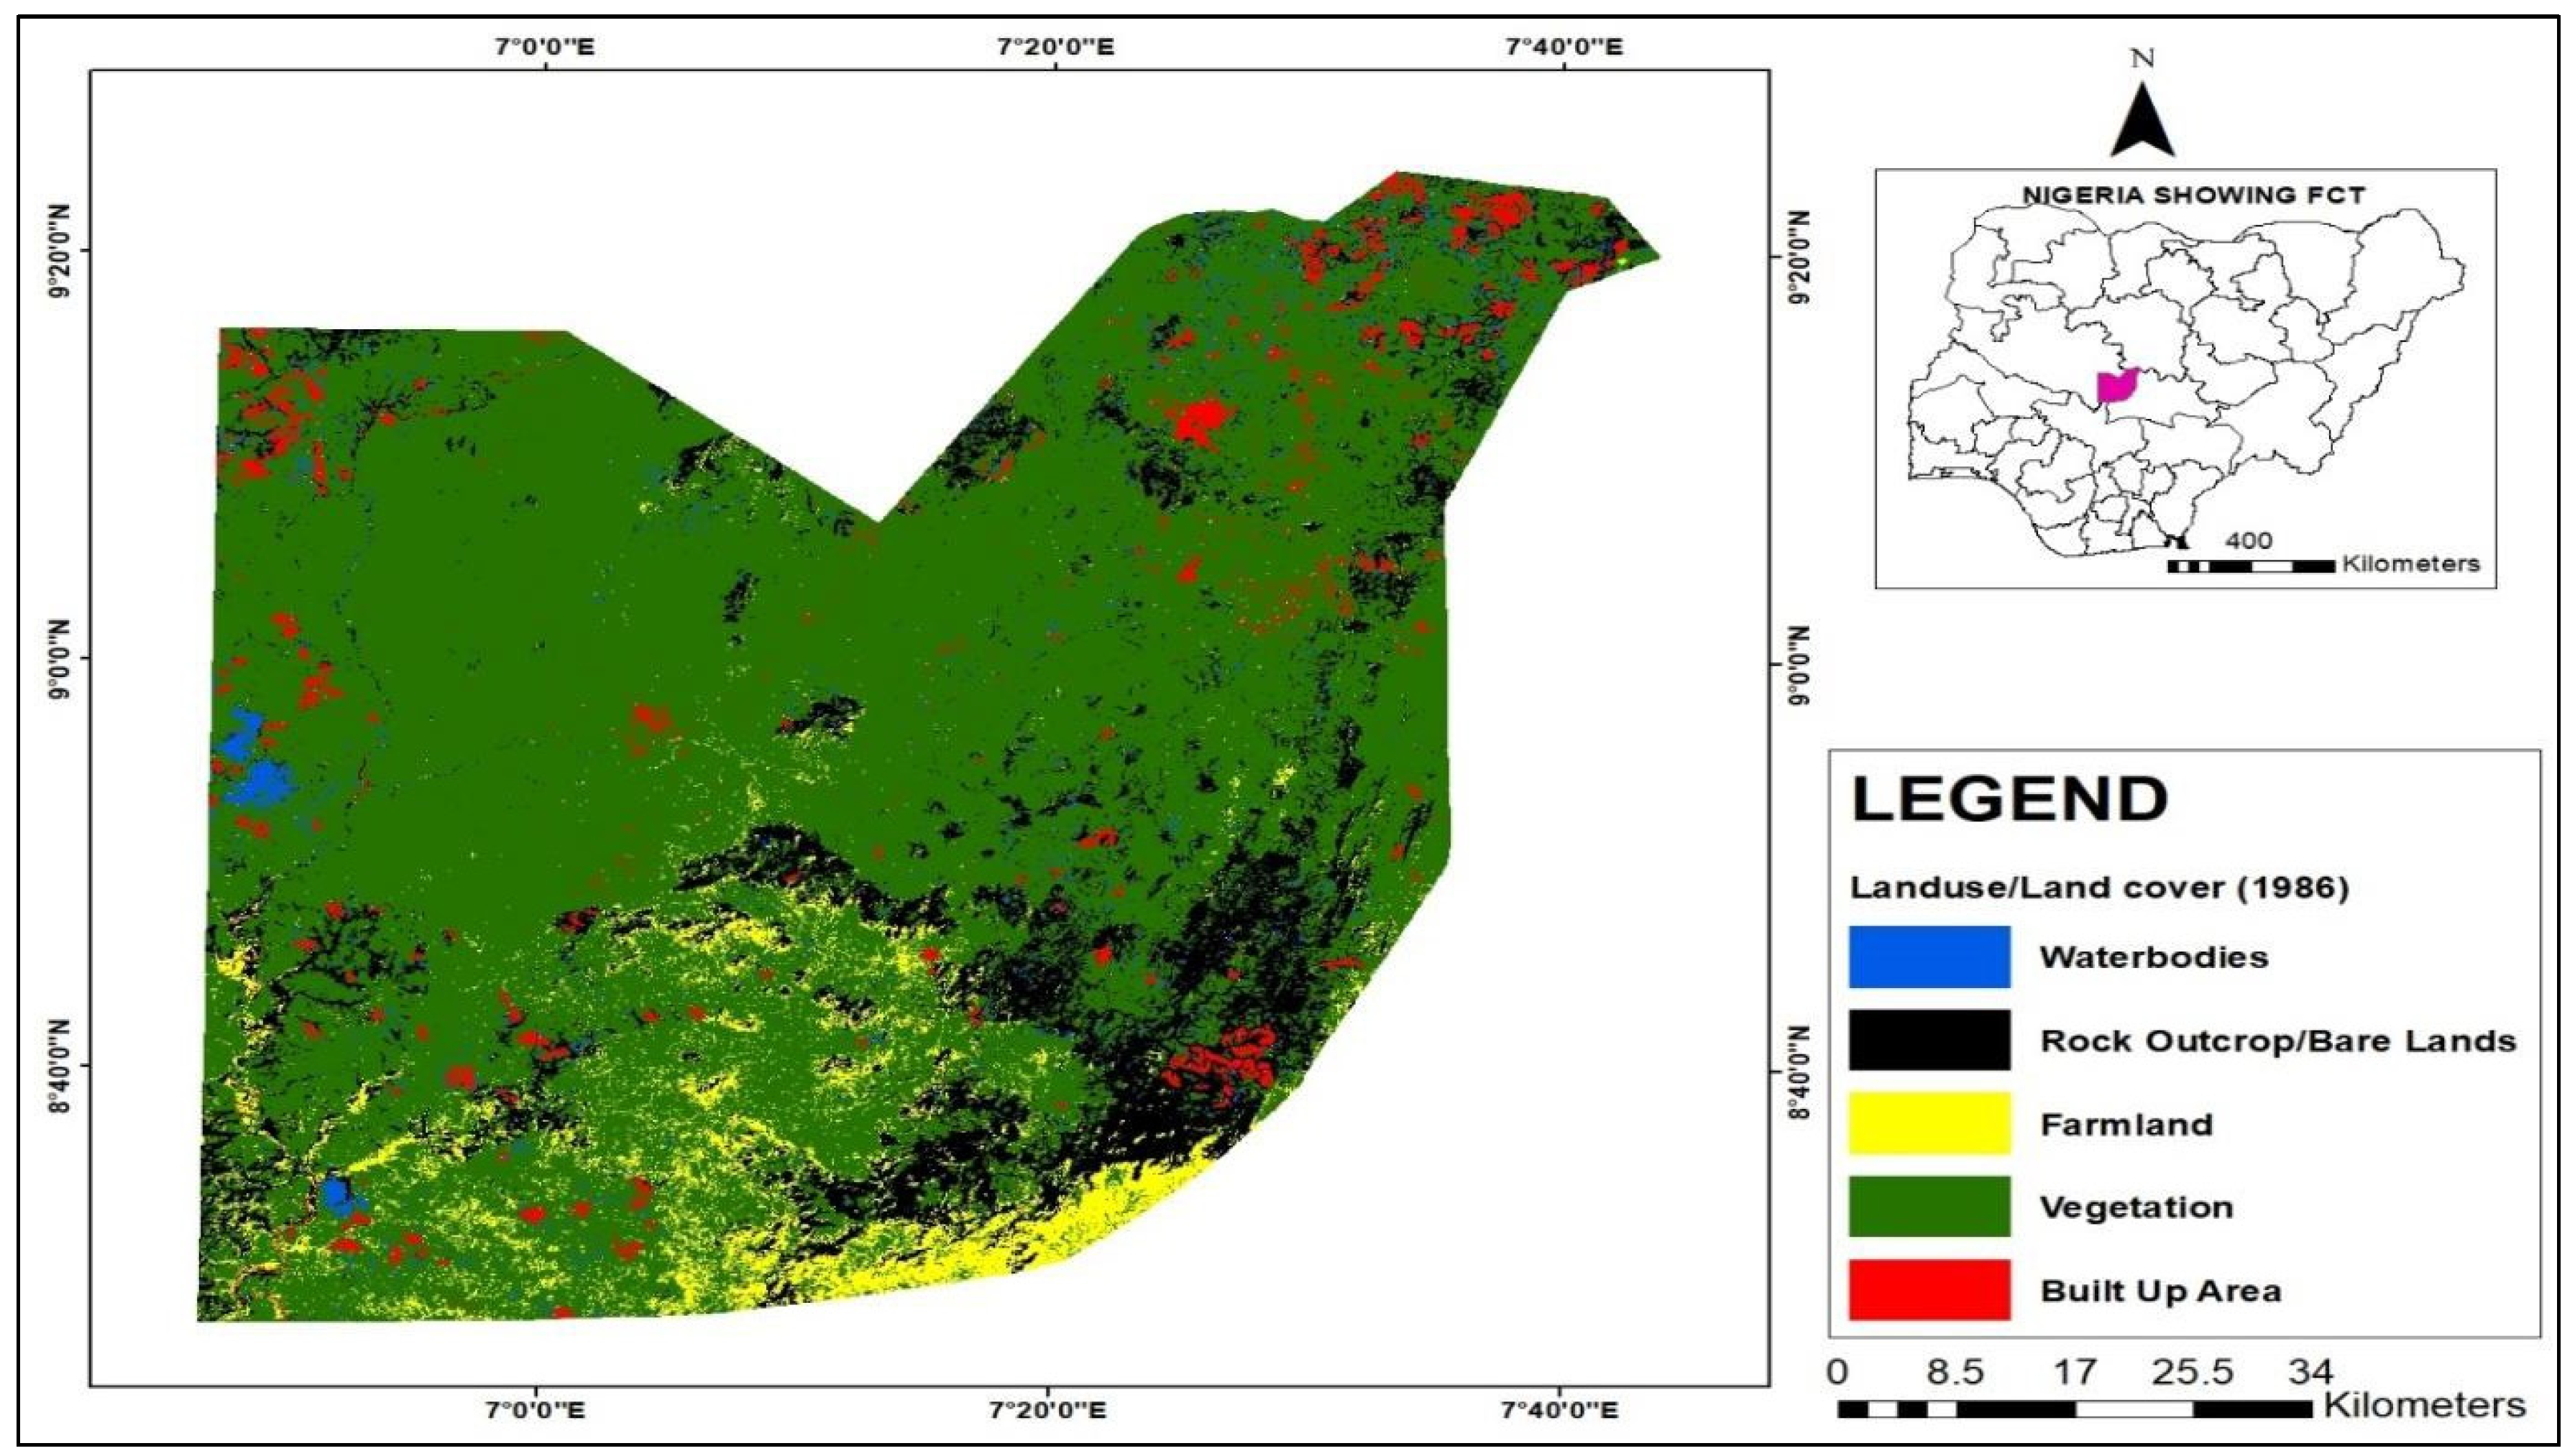
Figure 10.
Abuja Land use/Land cover in 2002.
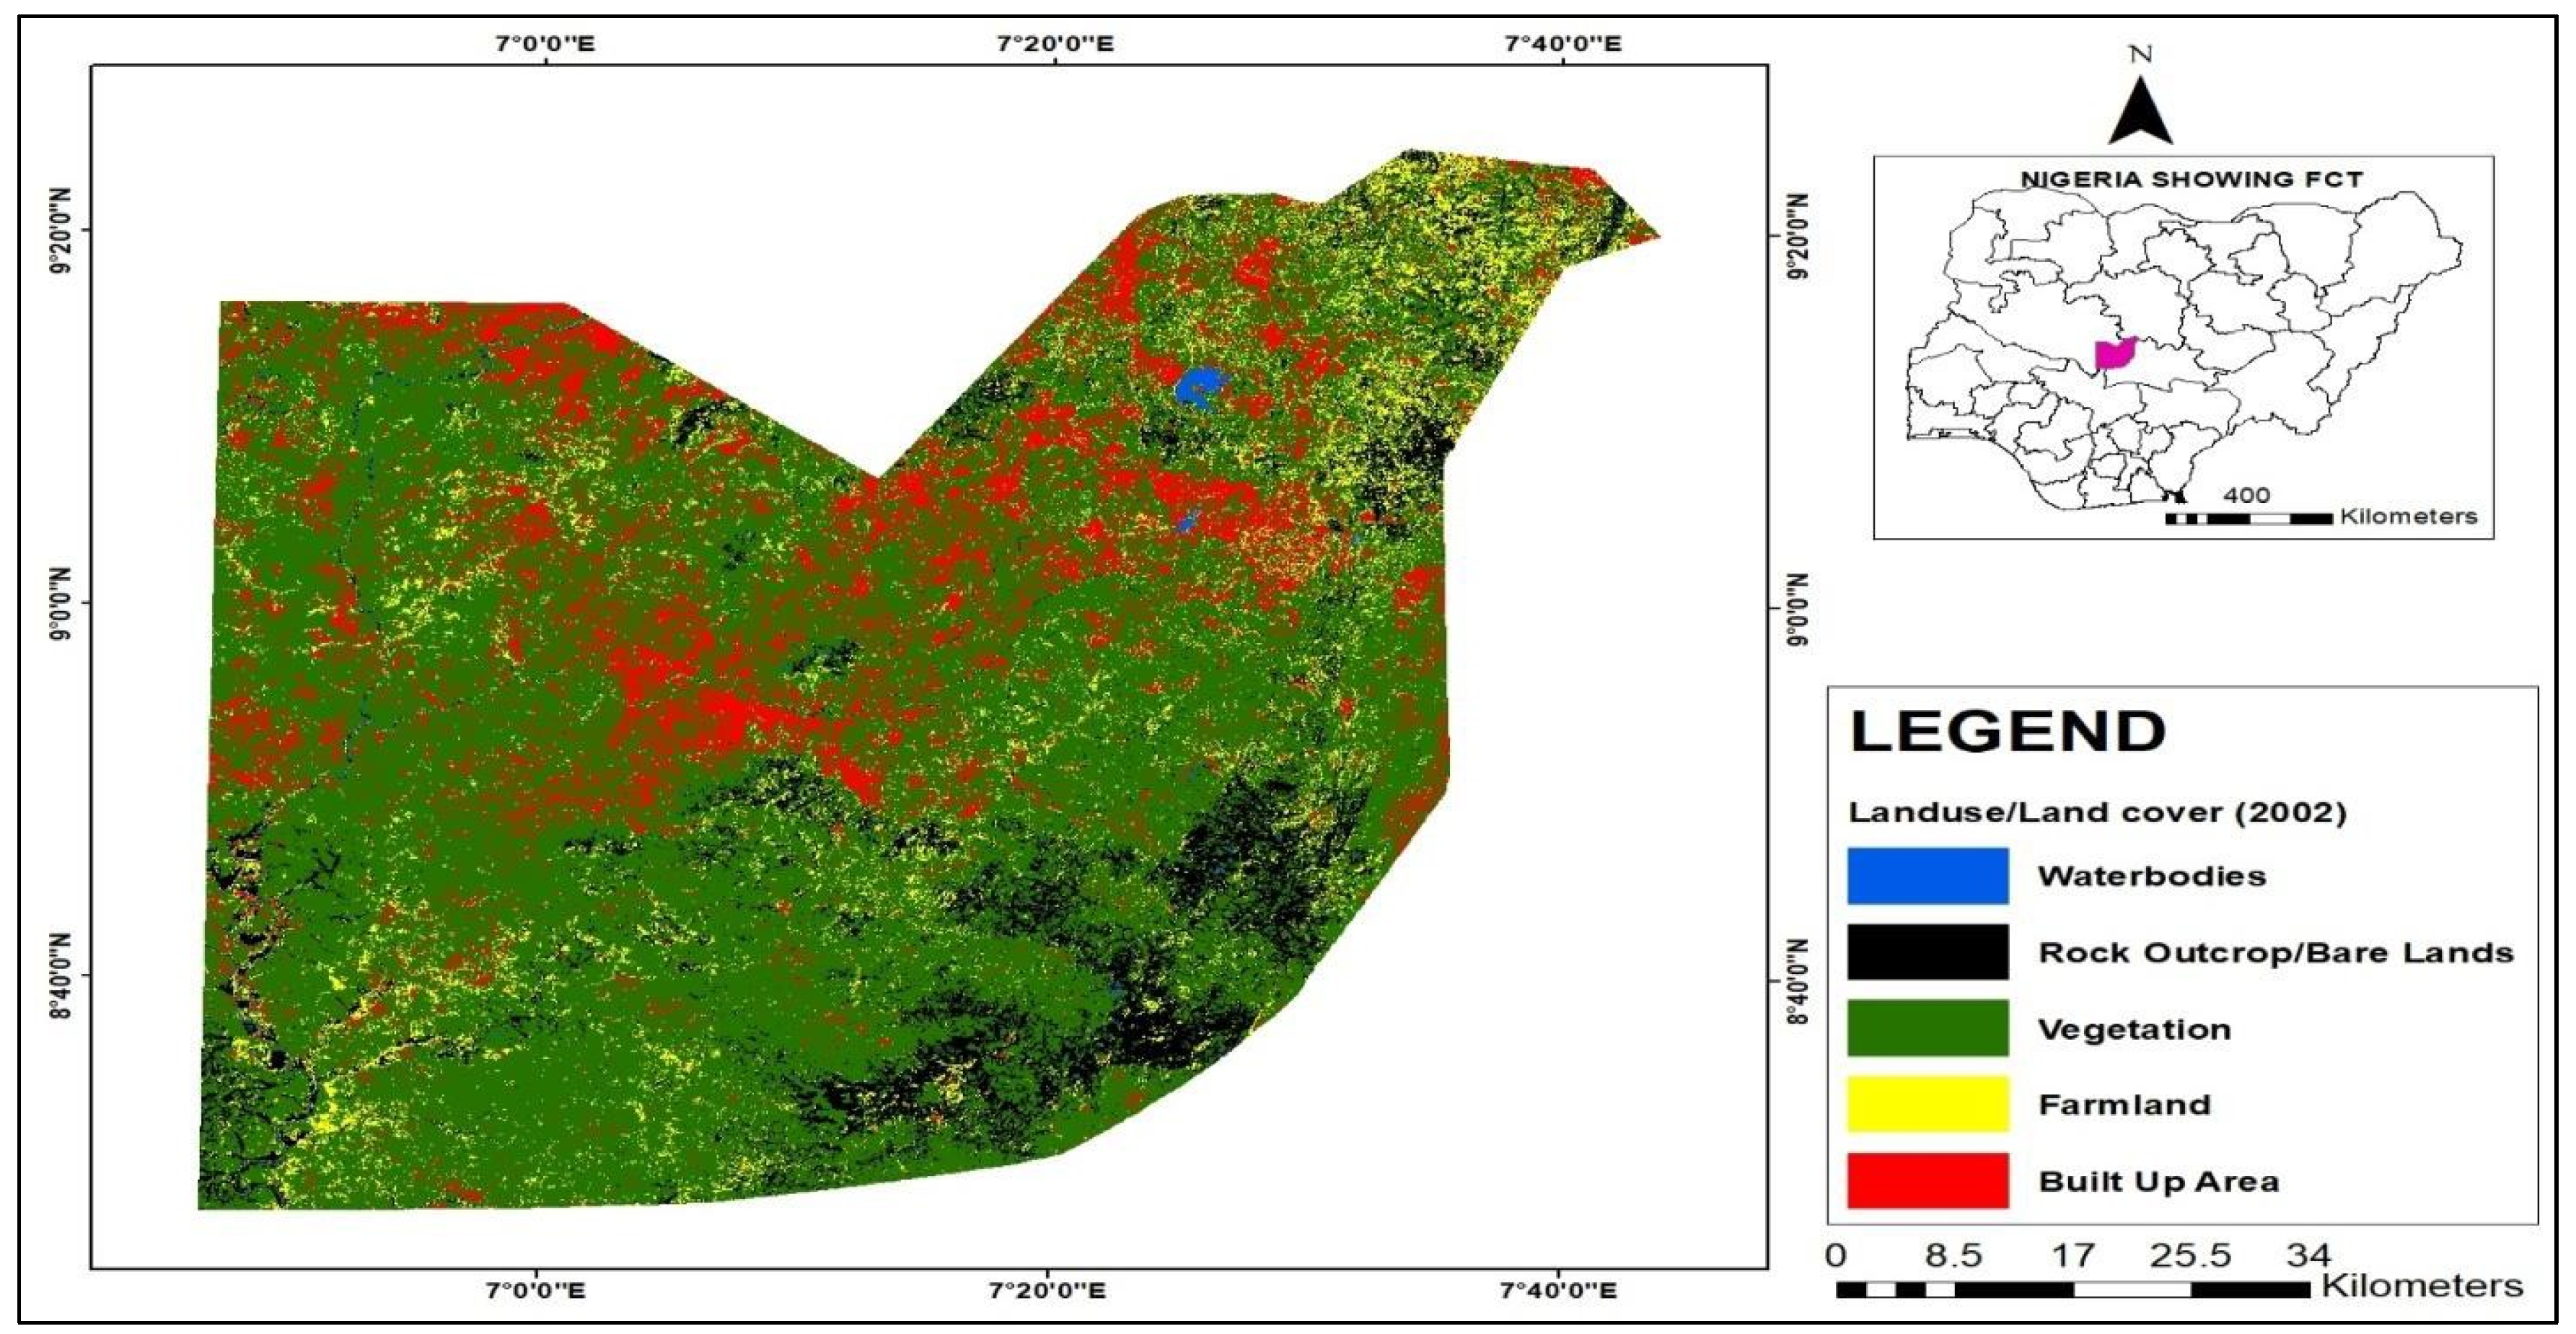
Figure 12.
Abuja Land Surface Temperature °C in 1986.
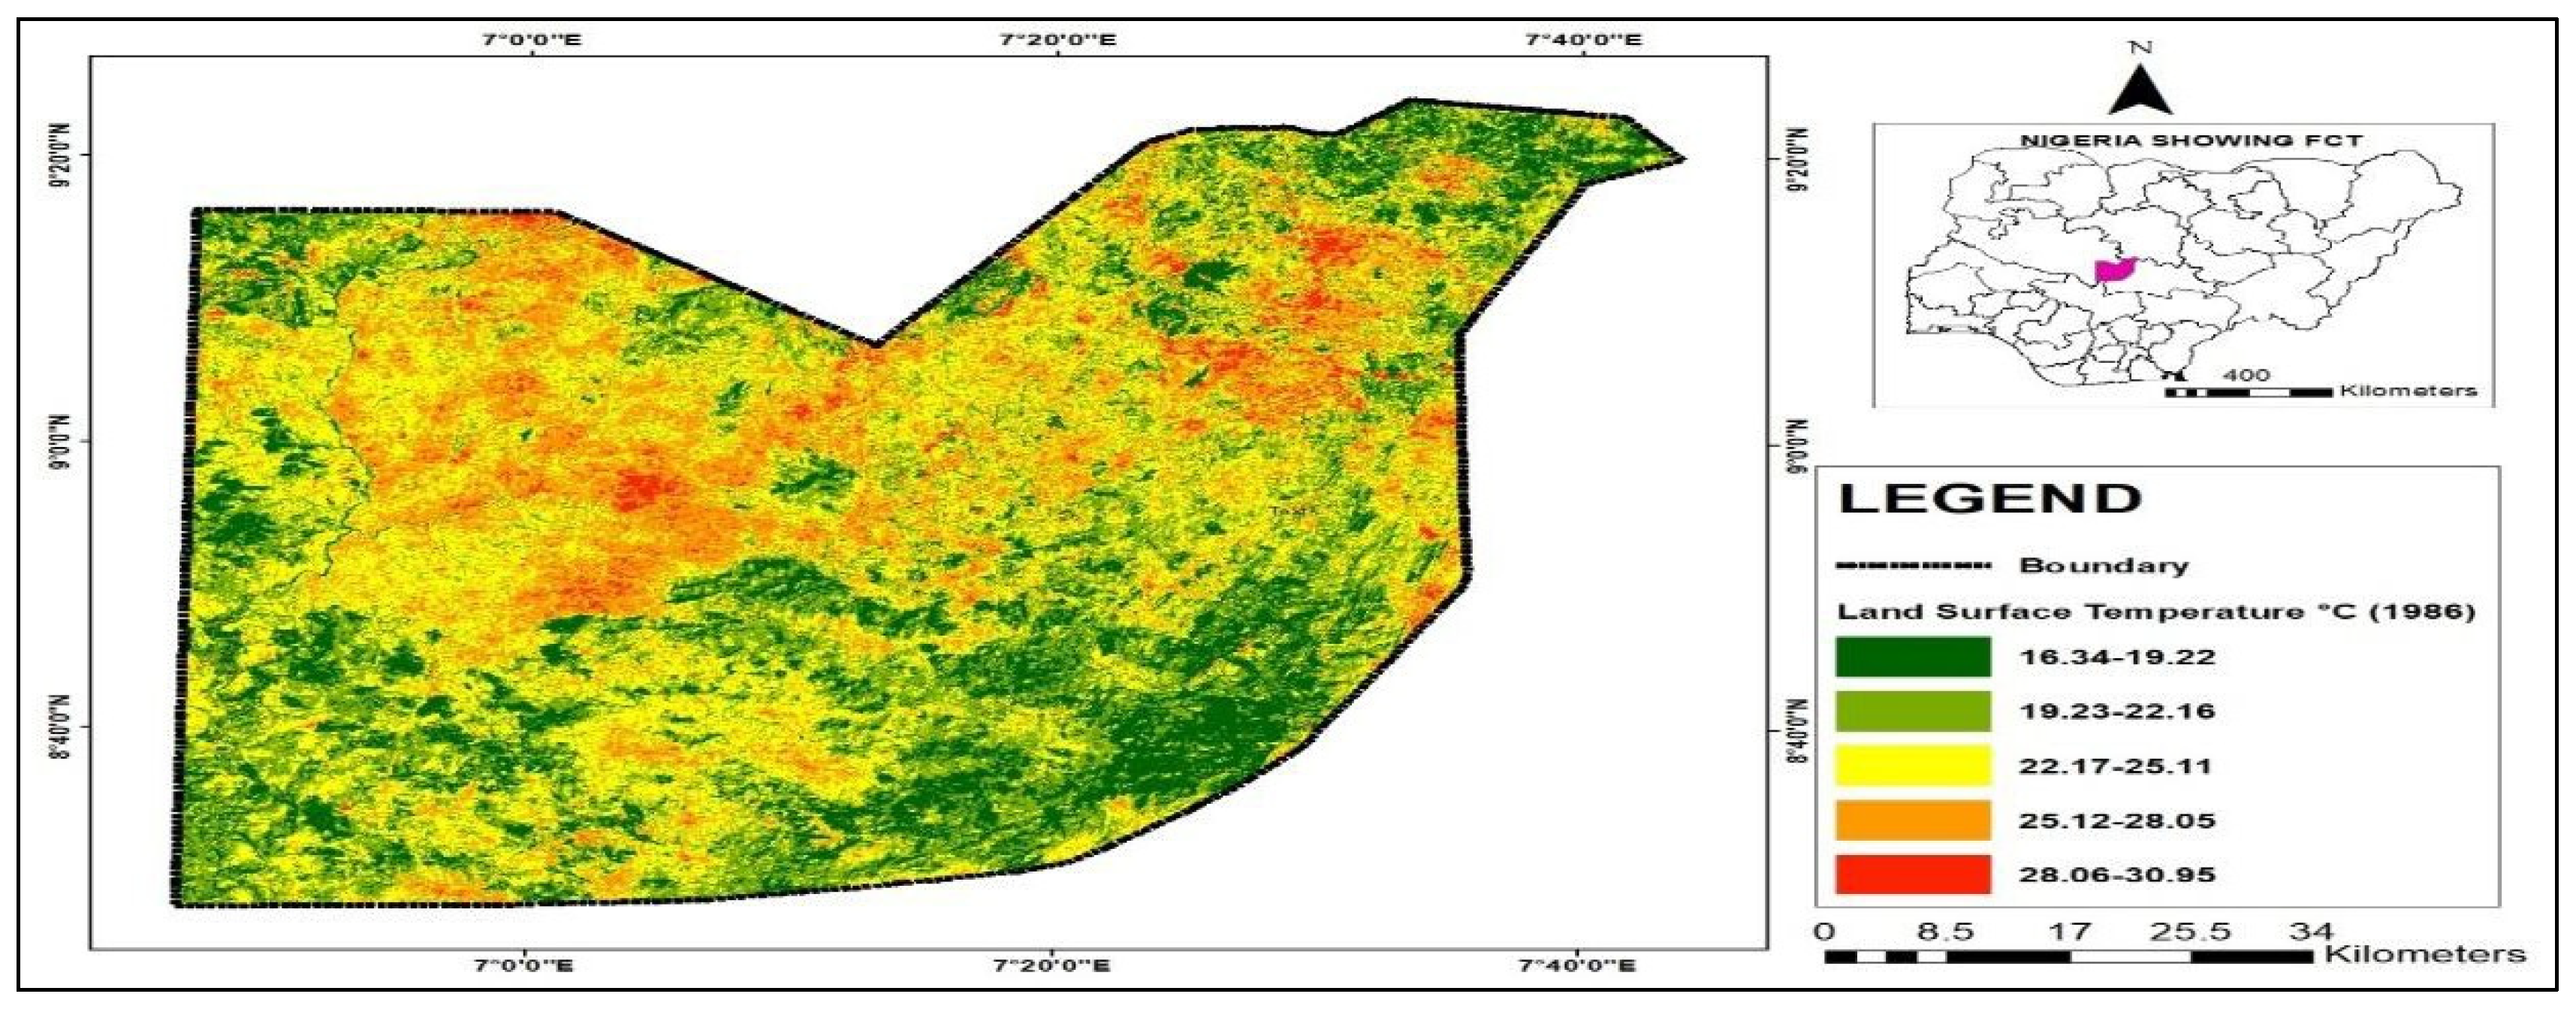
Figure 13.
Abuja Land Surface Temperature °C in 2002.
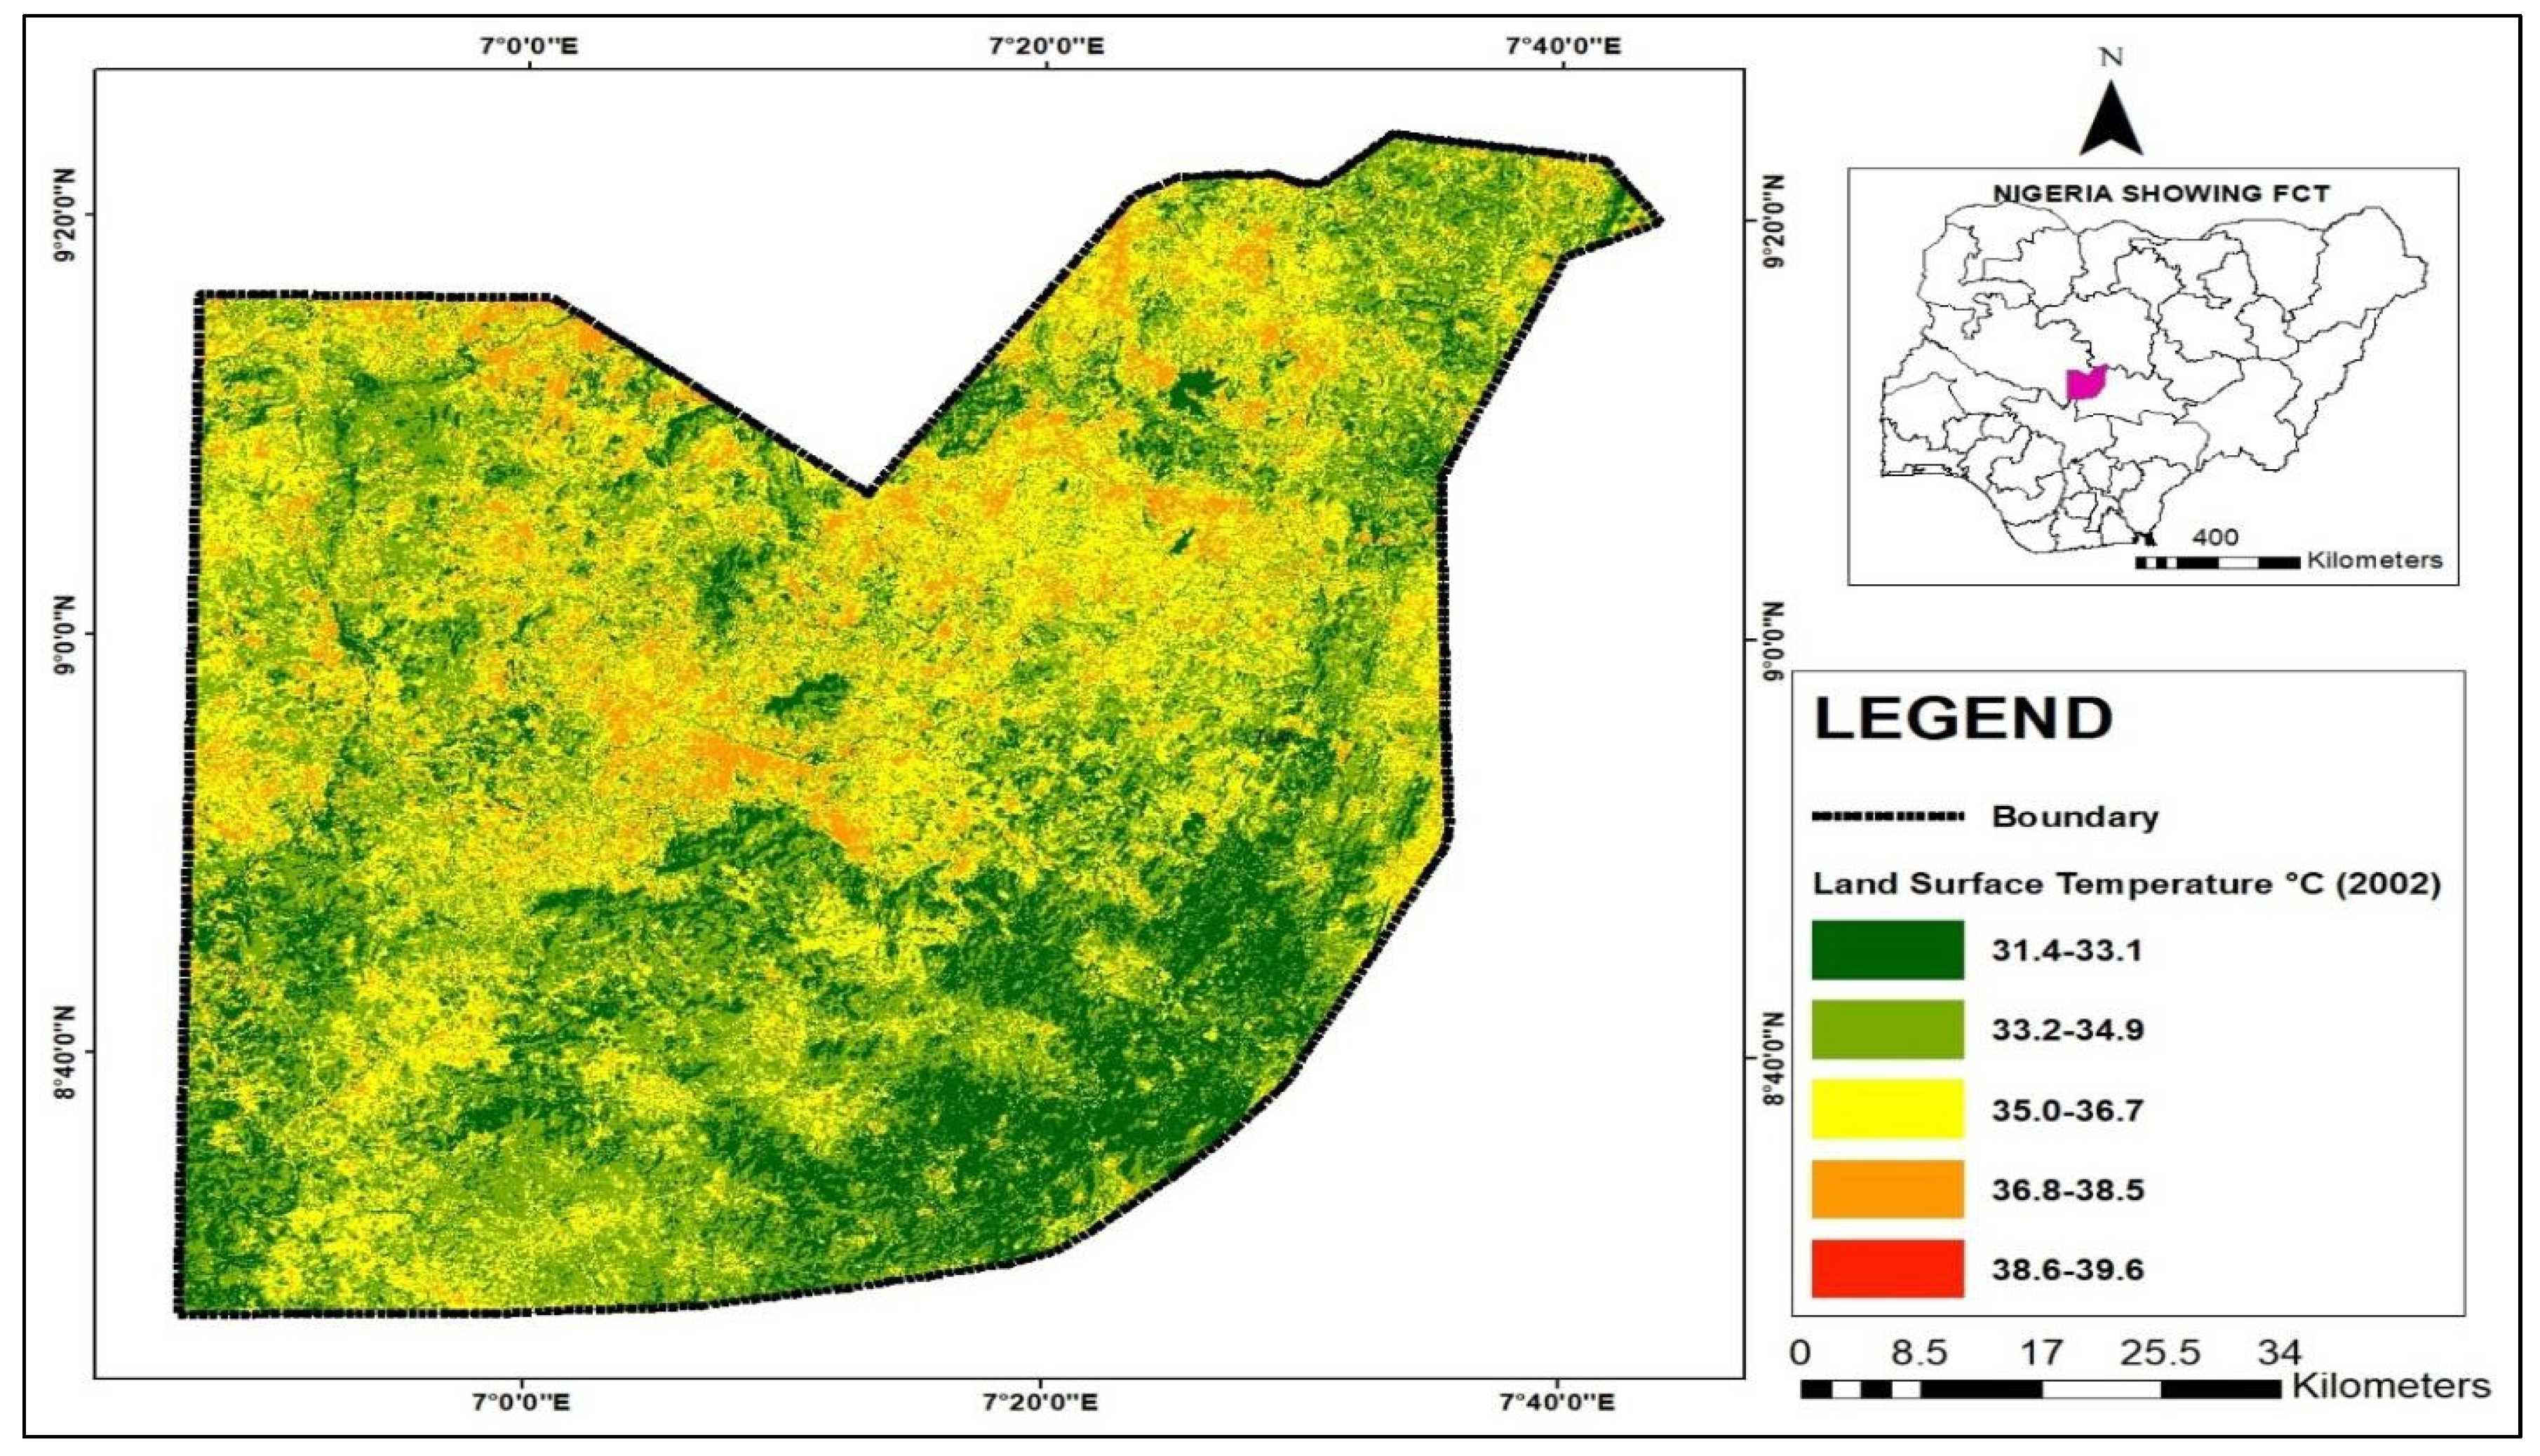
Figure 14.
Abuja Land Surface Temperature °C in 2022.
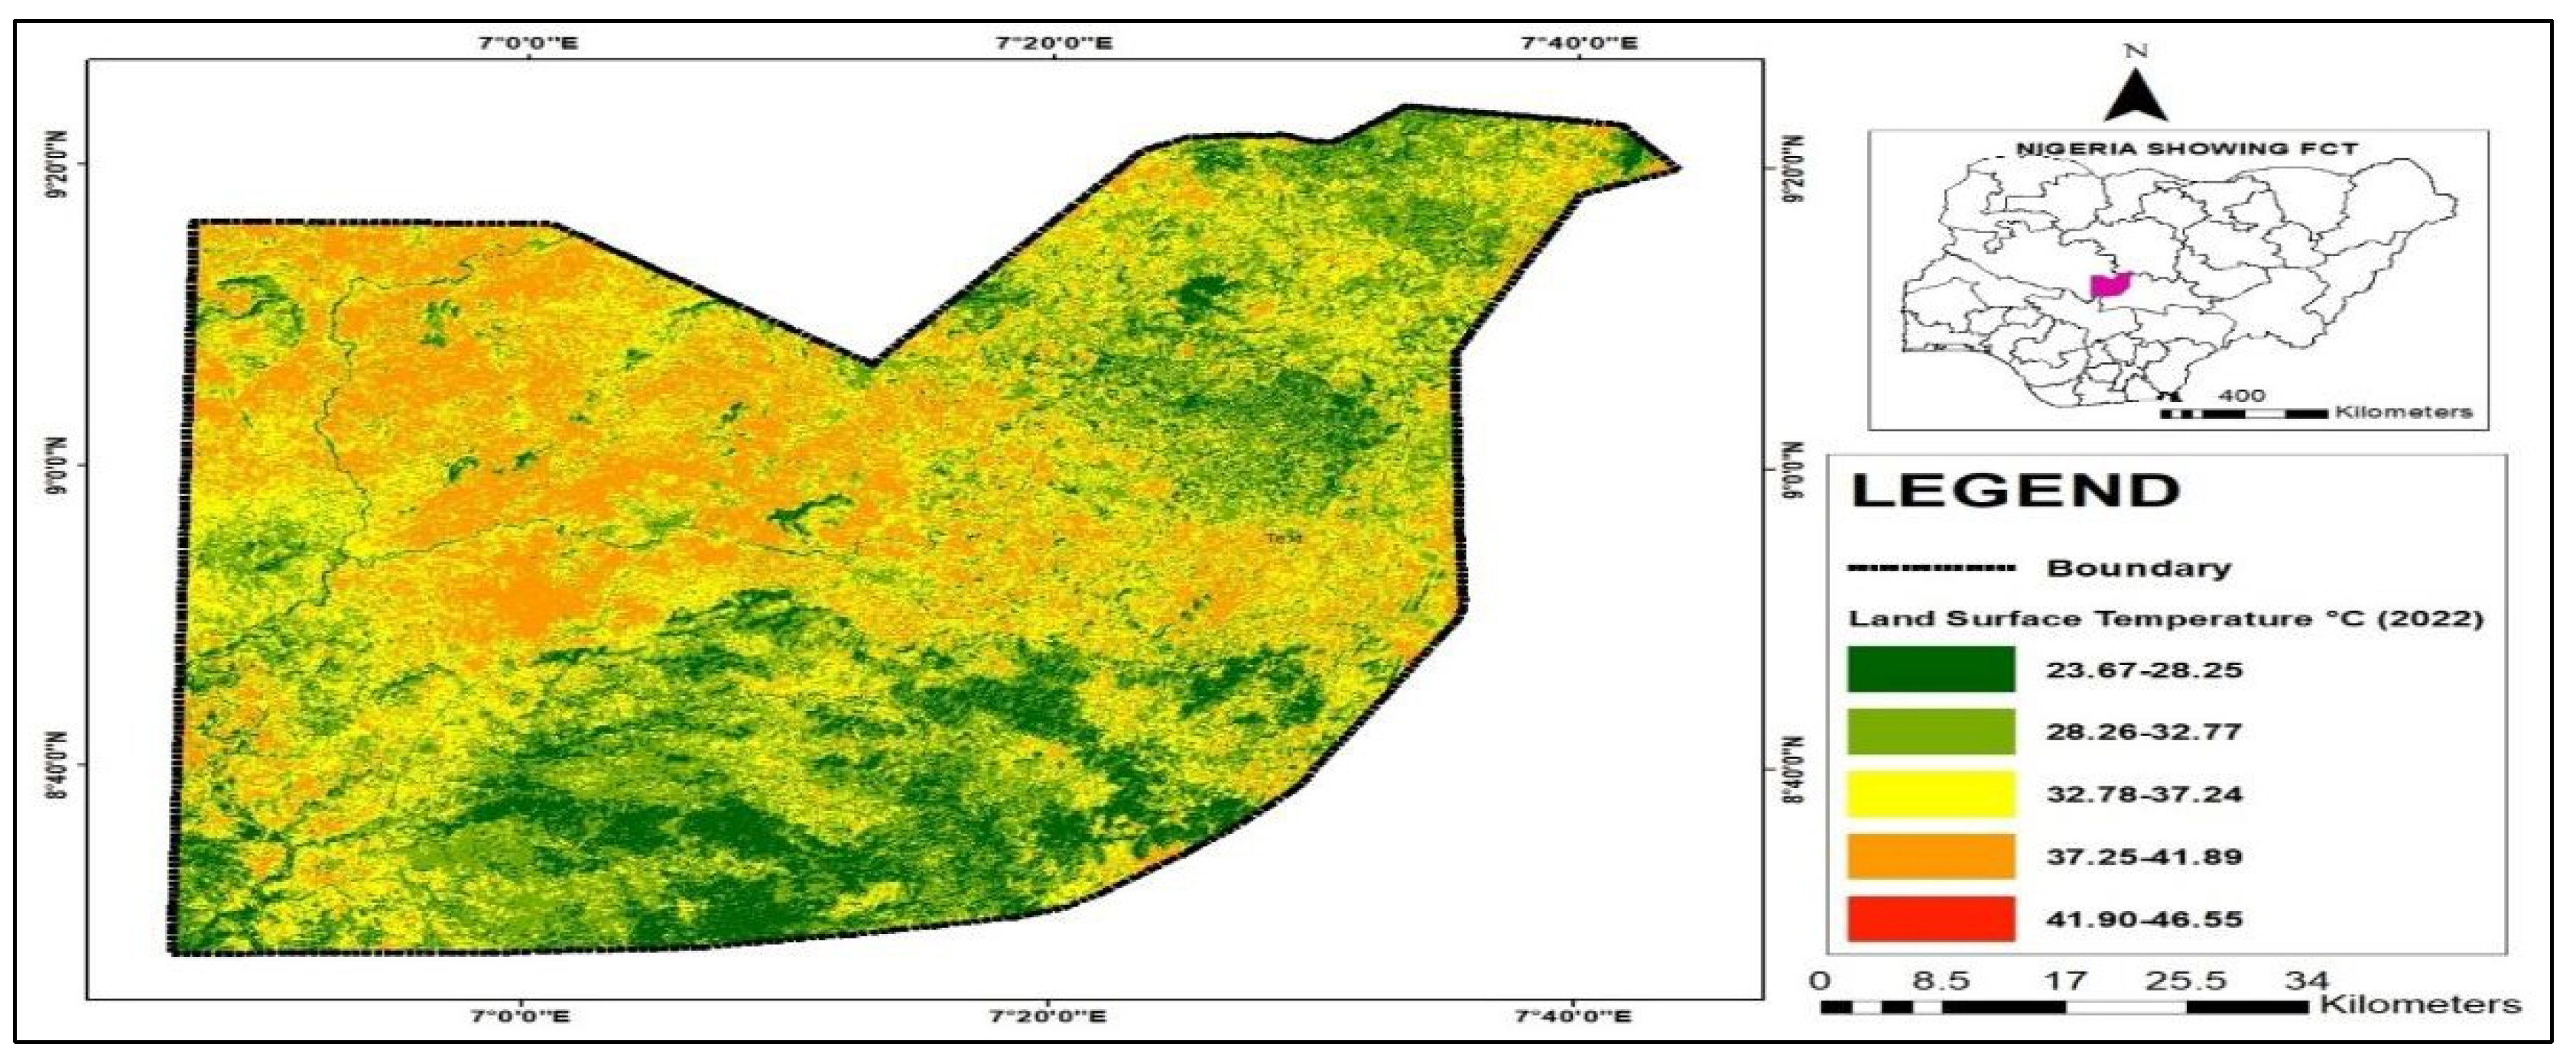
Figure 15.
NDVI Map of Asaba, 2002.
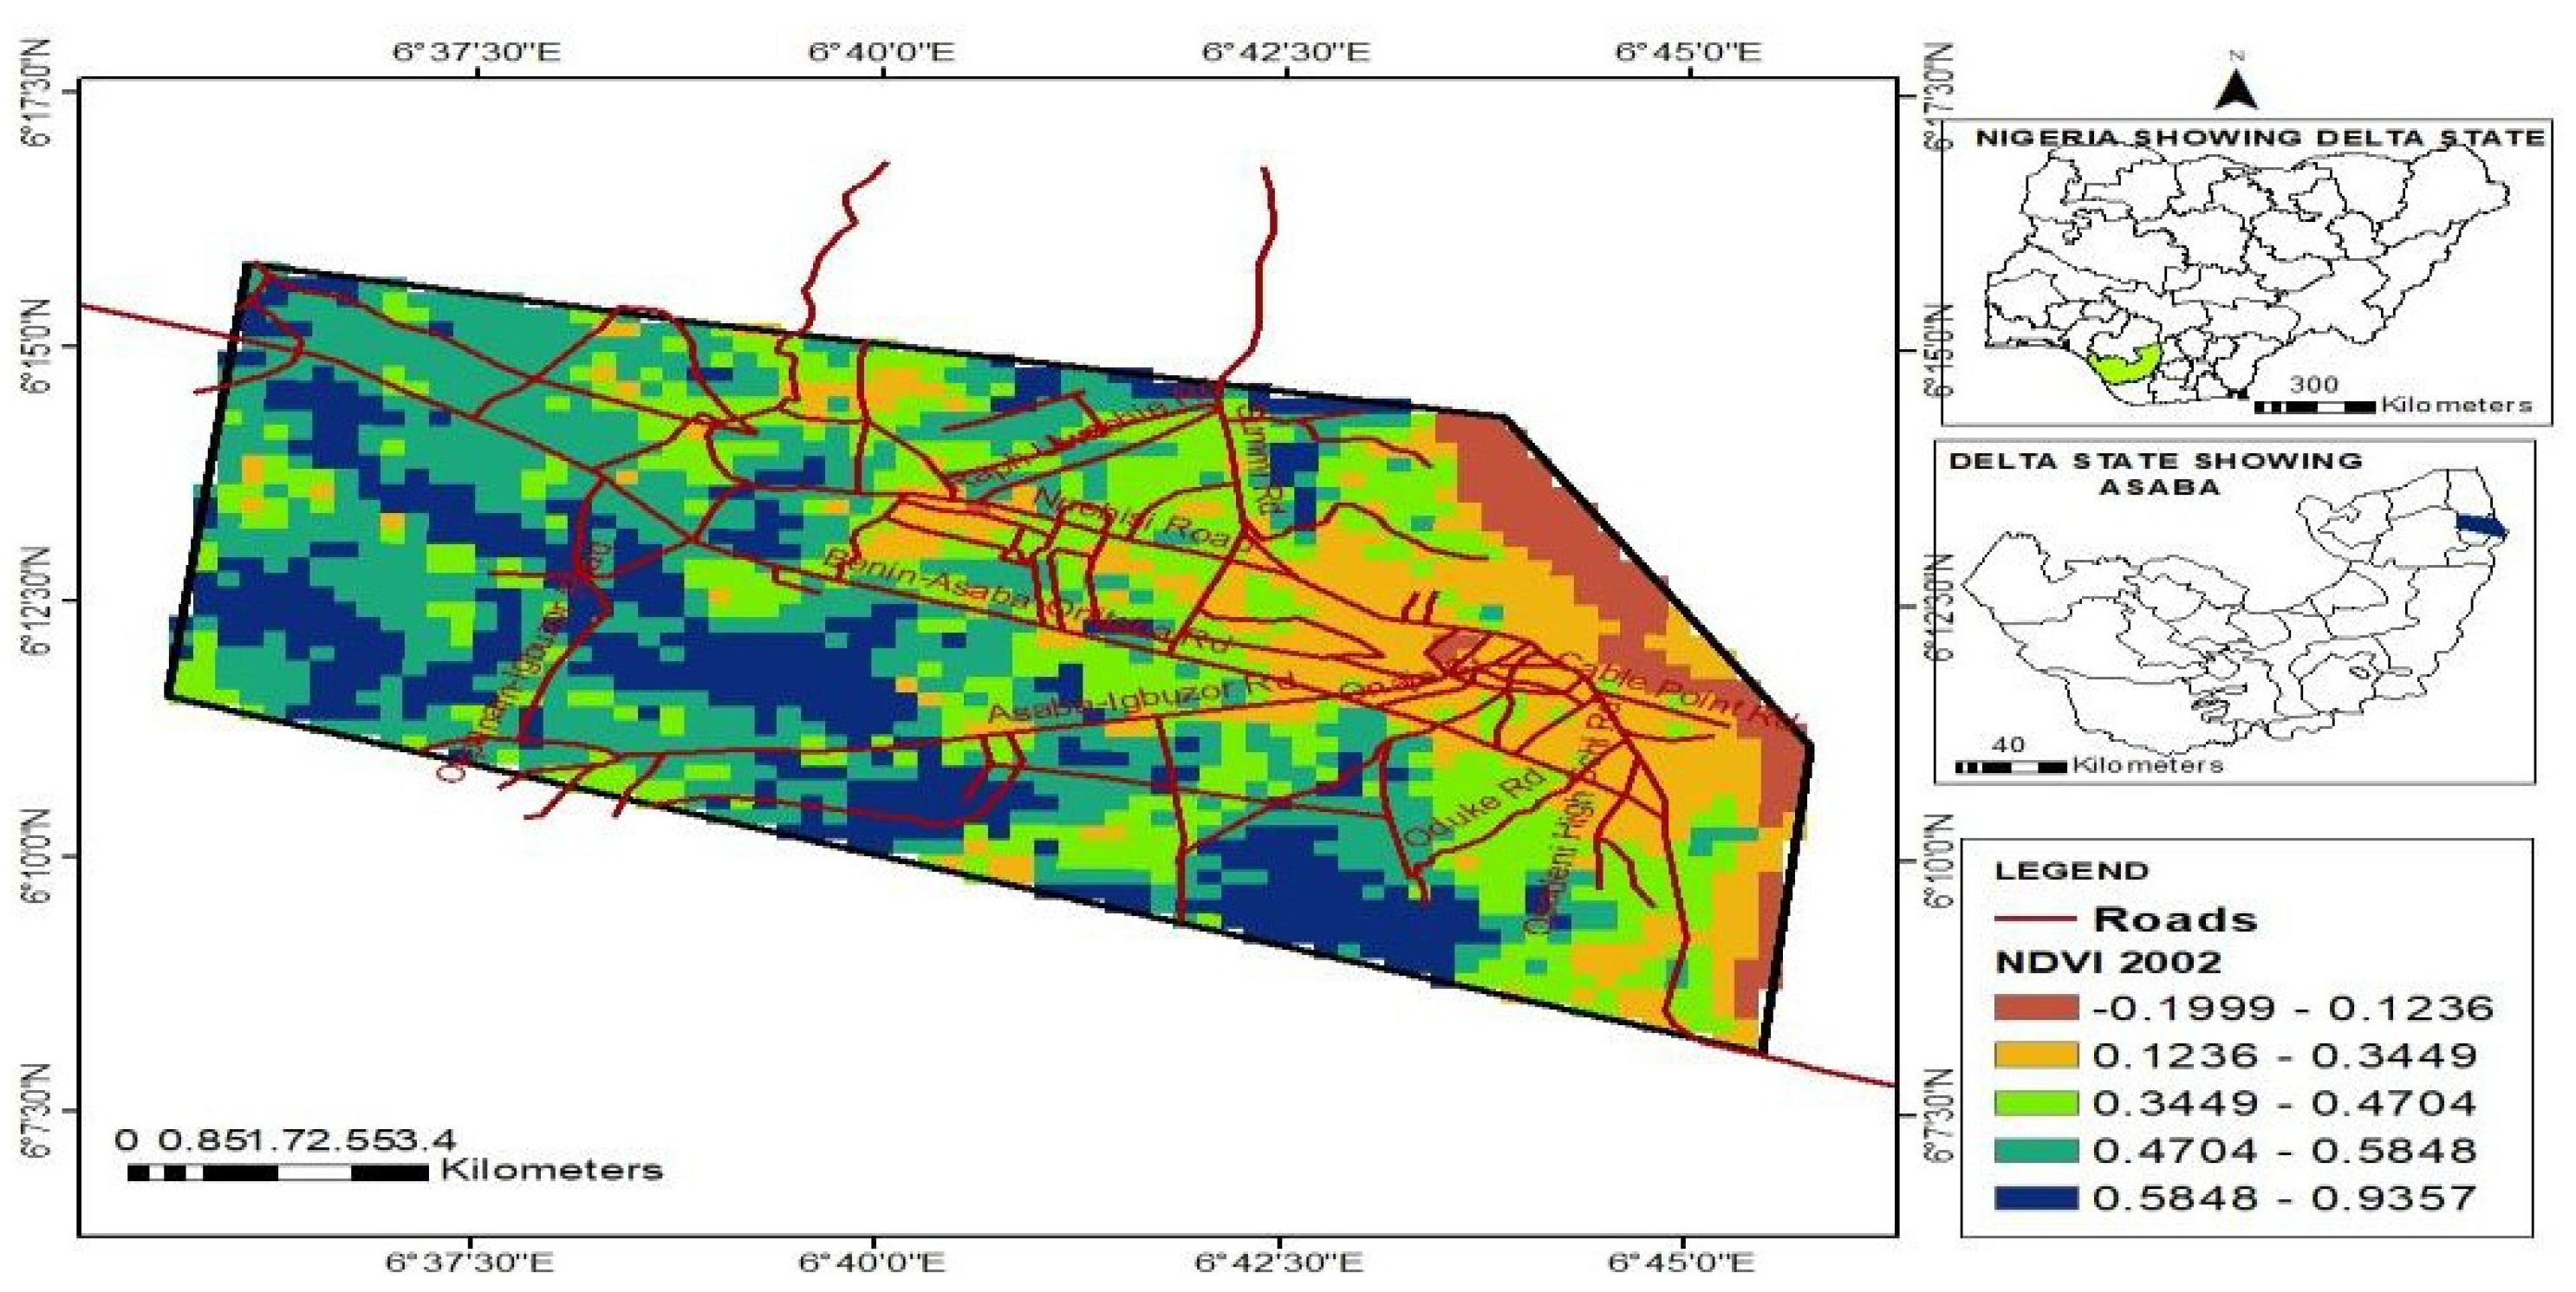
Figure 16.
NDVI Map of Asaba, 2022.
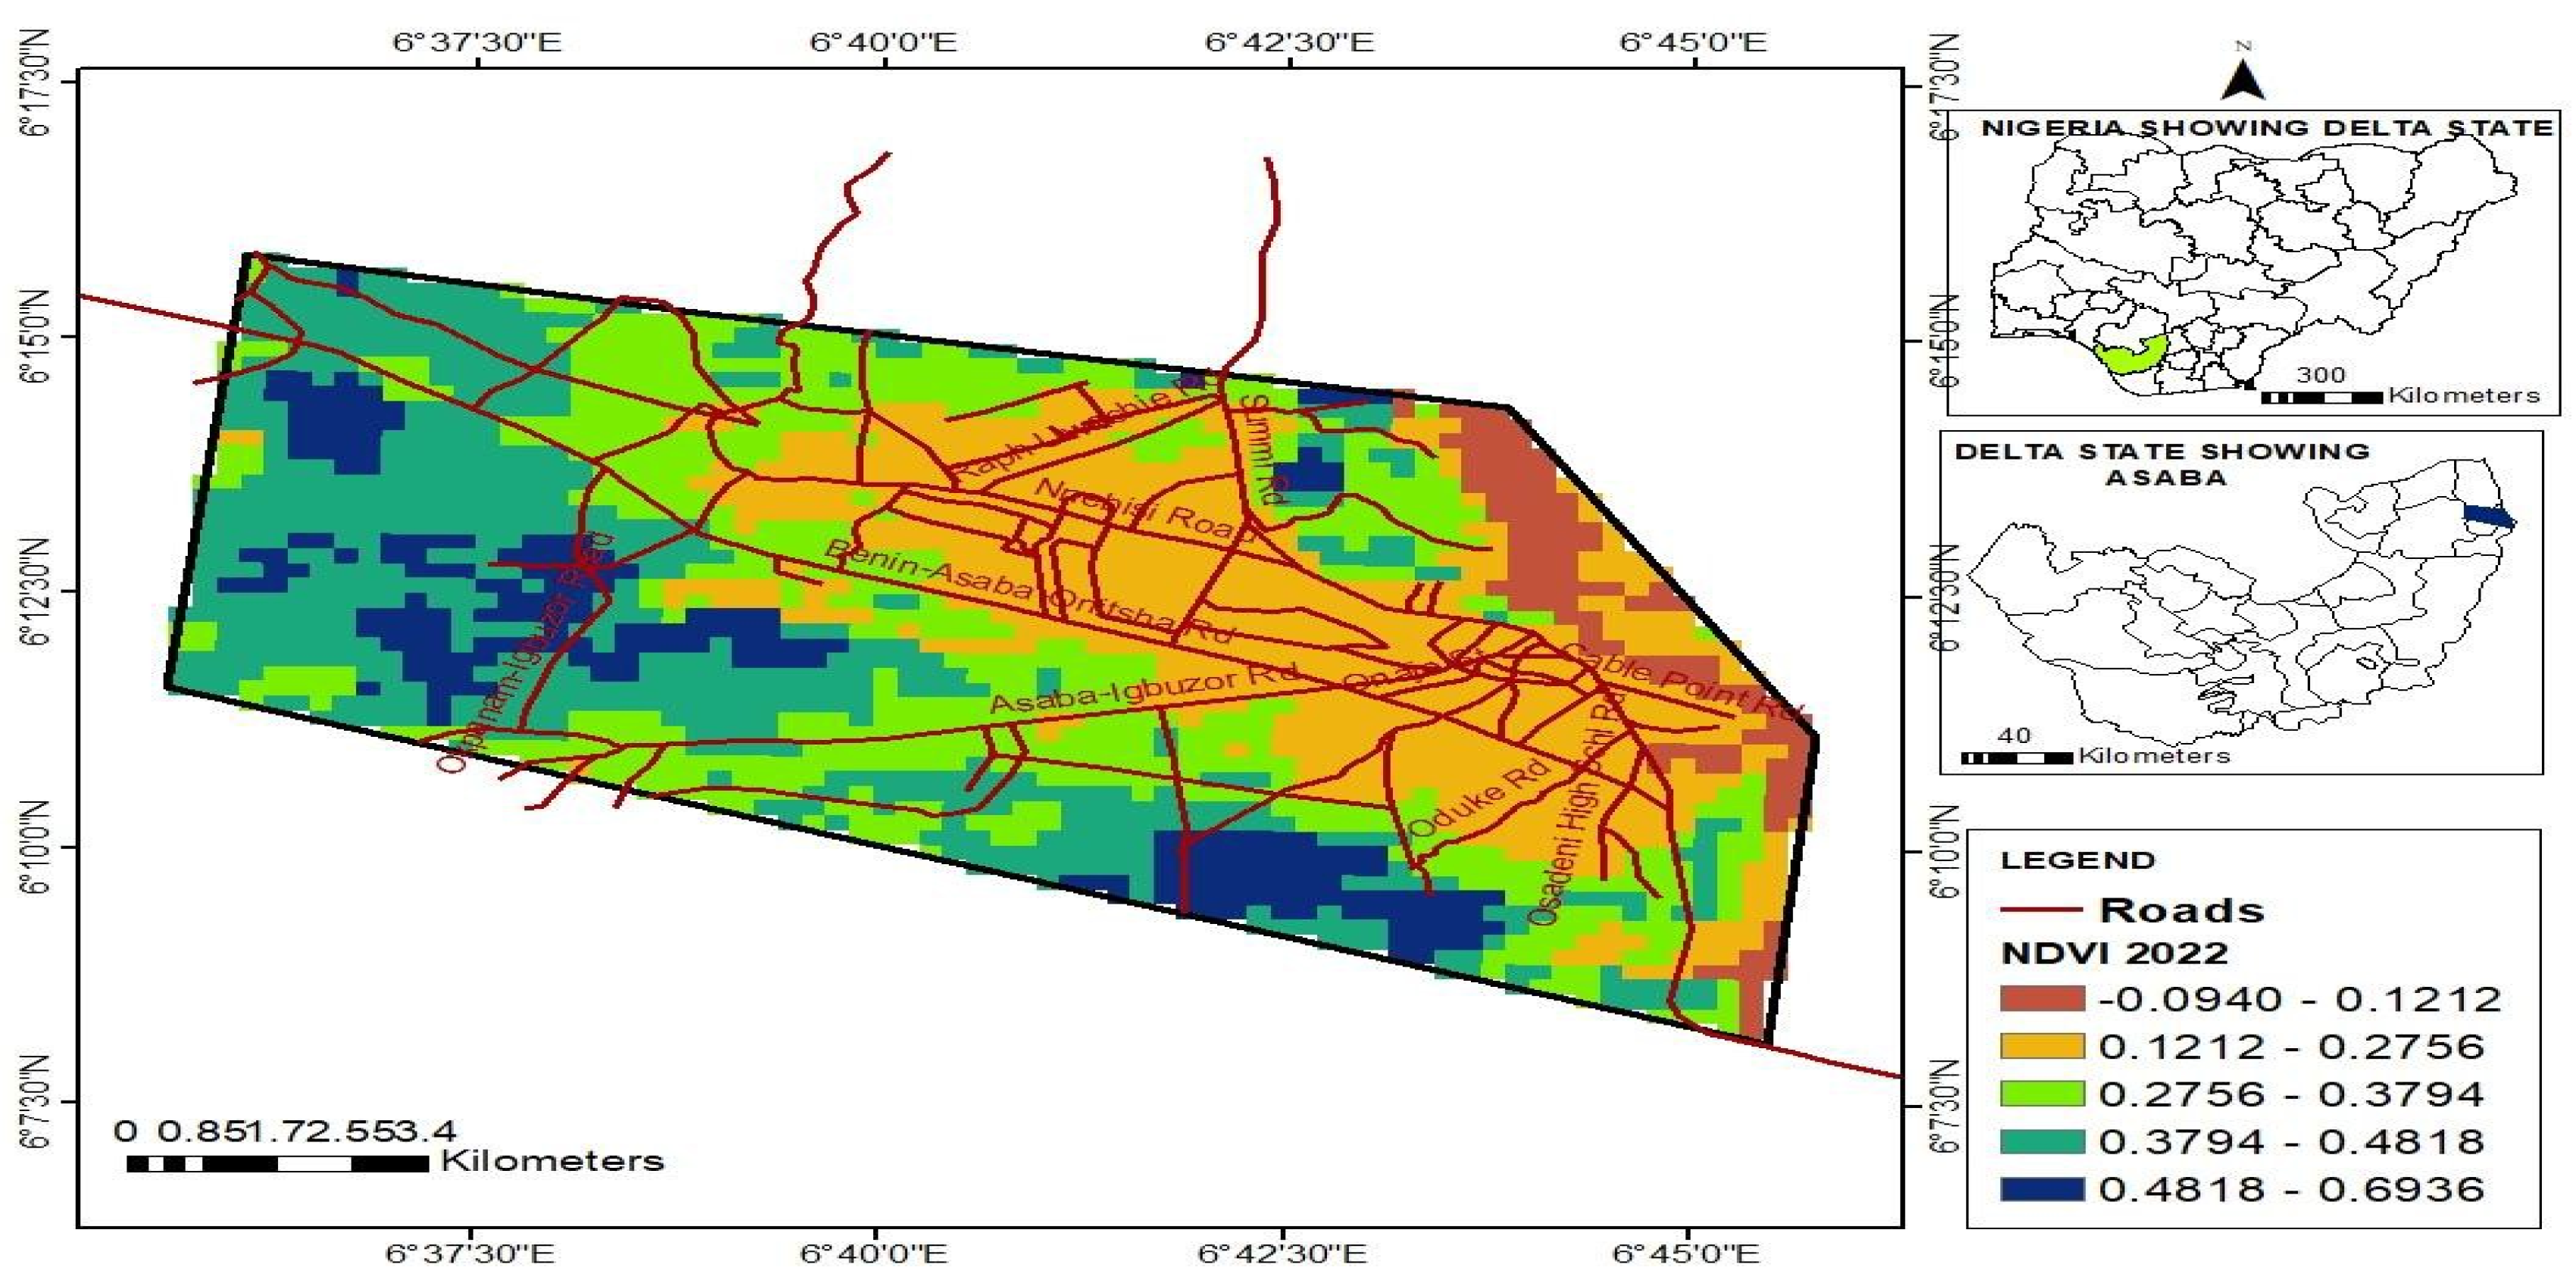
Figure 17.
NDVI Map of Abuja, 2002.
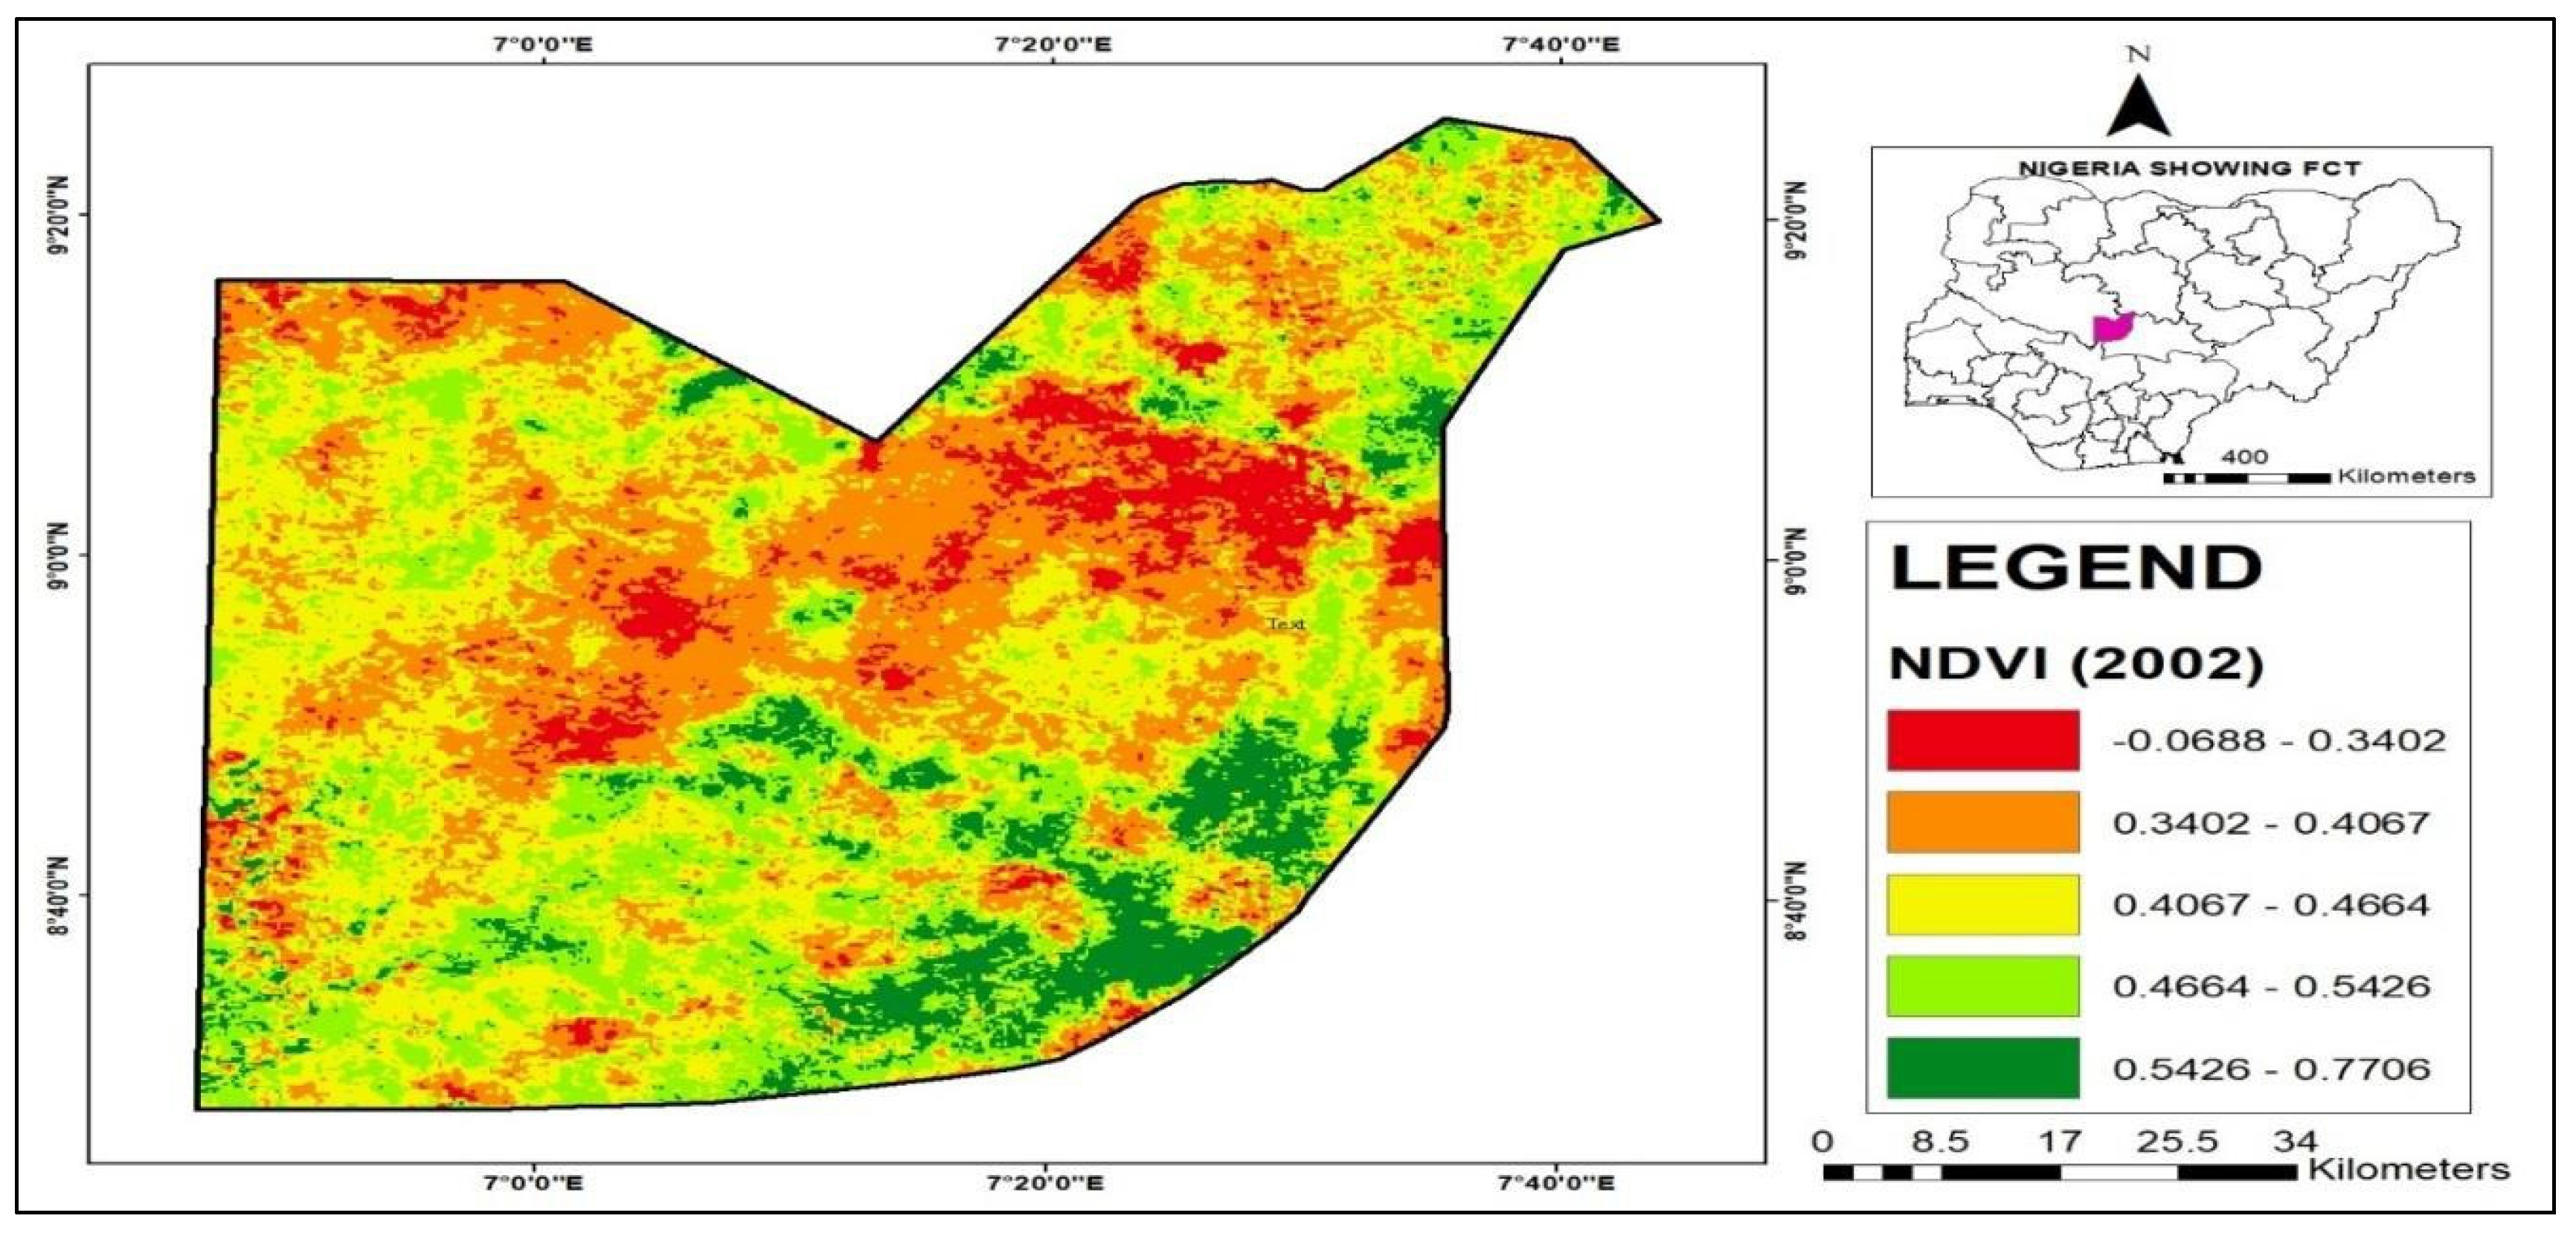
Table 2.
Landuse/Landcover Classification Scheme.
| S/N | Landuse Types | Description |
| 1 | Vegetation cover | Thick forest, Derived forest, mixed forest lands, palms, shrubs, herbs, agricultural area, crop fields, fallow lands and vegetable lands |
| 2 | Built Up Area | Residential, commercial and services, industrial, transportation, roads |
| 3 | Waterbodies | Rivers, permanent open water, lakes, ponds, reservoirs, etc |
Disclaimer/Publisher’s Note: The statements, opinions and data contained in all publications are solely those of the individual author(s) and contributor(s) and not of MDPI and/or the editor(s). MDPI and/or the editor(s) disclaim responsibility for any injury to people or property resulting from any ideas, methods, instructions or products referred to in the content. |
© 2025 by the authors. Licensee MDPI, Basel, Switzerland. This article is an open access article distributed under the terms and conditions of the Creative Commons Attribution (CC BY) license (http://creativecommons.org/licenses/by/4.0/).
Copyright: This open access article is published under a Creative Commons CC BY 4.0 license, which permit the free download, distribution, and reuse, provided that the author and preprint are cited in any reuse.


