1. Introduction
Diabetes mellitus (DM) is a chronic metabolic condition characterized by abnormal carbohydrate, lipid and protein metabolism resulting from abnormalities in insulin secretion, insulin action, or both. It is becoming increasingly a serious public health problem around the globe with it prevalence rapidly increasing.[
1] Diabetes mellitus is a currently of the leading and growing health problem affecting more than 537 million people of age between 20-79 years globally, with the number projected to increase to 643 million in 2030 and 783 million in 2045 if intervention measures are not taken[
2]. The number of people with the disease increases to 451 million if the age is cutoff is considered as between 18-99 years. Nearly, about 79% of DM live in low- and middle-income countries. If these trends continue, by 2045, 693 million people will live with the diseases most of which will be in regions where economies are moving from low income to middle income levels.
The most important demographic change to diabetes prevalence across the world appears to be the increase in the proportion of people >65 years of age [
3]. Diabetes is clinically important when symptoms such as polyuria, polydipsia, and unexplained weight loss are present, and this is verified by abnormal glucose measurements [
4]. Diabetes mellitus long-term consequences include retinopathy, which can result in vision loss, nephropathy, peripheral neuropathy. The complication will end up in causing blindness, renal failure, foot ulcers and amputations. Diabetic complications not only pose significant health risks for individuals living with diabetes but also create a substantial economic burden on healthcare systems and the quality of life. The costs associated with managing these complications, ranging from direct medical expenses to indirect costs such as lost productivity, underscore the importance of effective DM management and prevention strategies. Addressing these issues is crucial for improving patient outcomes and reducing the overall impact of diabetes on society[
4,
5].
Current DM management relies on synthetic drugs like metformin and glibenclamide, which improve insulin sensitivity or secretion but are also associated with adverse effects such as hypoglycemia, weight gain, and gastrointestinal disturbances. These limitations have spurred interest in natural, herbal or plant-derived ant-diabetic agents, which often exhibit multimodal mechanisms of action and fewer side effects. The World Health Organization estimates that approximately 80% of the global population relies on traditional plant-based medicines for primary healthcare.[
6,
7]
Traditional medicine is a collection of knowledge, skills, and practices based on indigenous theories, beliefs, and experiences, used to maintain health and to prevent, diagnose, improve, or treat illnesses. Traditional medicines that have been adopted and modified by cultures outside of their indigenous origin are commonly referred to as alternative or complementary medicine.
Herbal preparations include finished medicines with active substances derived from plants or other botanical resources. Many common medicinal plants are grown in tropical and subtropical regions, including Ethiopia. Among these is Mangifera indica, which is found distributed almost everywhere. Mangifera indica can grow to be 35-40 m (115-130 ft) tall. Different parts of this plant are claimed to exhibit a variety of pharmacodynamic effects, such as laxative, diuretic, diaphoretic, astringent, stomachic, antiscorbutic, and anthelmintic properties.[
8] . In addition, the tender leaves and bark of this plant have been reported to be useful in management in DM [
9,
10].
2. Materials and Methods
2.1. Chemicals and Reagents
All chemicals and solvents were of analytical grade, sourced from globally recognized suppliers such as Sigma-Aldrich (USA), Merck (Germany) and Fisher Scientific (USA).
2.2. Extraction Chemicals and Solvents
Methanol (70 % v/v, ≥99.8 %), Distilled water (prepared in-house using Millipore filtration).
2.3. Histopathology and Toxicity Study Reagents
Neutral buffered formalin, Hematoxylin & Eosin (H&E) stains, Phosphate-buffered saline (PBS, pH 7.4), Trichloroacetic acid (TCA), Thio barbituric acid (TBA)
2.4. Methanol Leaf Extraction
Primary on-site processing included peeling, sorting, chopping, washing, removing broken parts, and eliminating dust and other foreign material. The plant samples were identified by comparison with herbarium specimens housed in the Department of Botany at Addis Ababa University. A botanist at the Addis Ababa University Herbarium Center confirmed the scientific name Mangifera indica and authenticated its voucher sample (GT001).
The leaves of
Mangifera indica were thoroughly washed to remove impurities and then shade-dried at room temperature (25-30°C) for ten days. Subsequently, they were ground into a fine powder using an electric grinder and passed through a 60-mesh sieve (0.25 mm openings)[
11].
Based on preliminary adjustments to maximize the recovery of both polar and nonpolar phytochemicals, 100 g of the powdered leaves were macerated in 1200 ml of 70% methanol (a 1:12 ratio, w/v) for 48 hours at room temperature with periodic stirring. The mixture was then shaken for two hours at 150 rpm using an orbital shaker, filtered through Whatman filter paper, and concentrated using a rotary evaporator at 40°C and 60 rpm under reduced pressure[
12].. The extraction yield was calculated to be 35.00 ± 0.20% (w/w).
Methanol (70%) was selected as the solvent due to its high efficacy in extracting bioactive substances such as flavonoids, alkaloids, and phenolic acids, which have demonstrated anti-diabetic effects[
13]. The resulting extract was stored in sealed amber vials at -20°C to prevent degradation prior to its use in ant diabetic testing on experimental animals.
2.5. Animal
Streptozotocin-induced diabetic model in Swiss Albino mice
Male Swiss Albino mice, approximately ten weeks old and weighing 25–42 grams, were housed in groups of six under controlled conditions (temperature: 24 ± 1°C, humidity: 55 ± 5%, and a 12-hour light-dark cycle). For one week, the mice were acclimatized with free access to a standard diet and water. To ensure a uniform baseline, the mice were fasted for 4 hours prior to STZ administration, with water remaining available ad libitum.
The mice were then weighed and randomly divided into control and experimental groups. Streptozotocin (STZ) was dissolved in a freshly prepared 0.1 M sodium citrate buffer (pH 4.5) at a concentration of 20 mg/mL. The buffer was prepared by combining sodium citrate dihydrate (2.941 g/100 mL) and citric acid (1.921 g/100 mL). Thirty milliliters of the sodium citrate solution and 25 mL of the citric acid solution were then mixed to achieve the final pH of 4.5. To prevent degradation, the STZ solution was prepared under low-light conditions and kept on ice.
Over five consecutive days, the experimental group received intraperitoneal injections of the STZ solution at a dose of 40 mg/kg (injection volume: 1.0 mL/100 g body weight). The control group received an equivalent volume of the citrate buffer vehicle.[
14].
To prevent acute hypoglycemia, the mice were provided with standard chow and a 10% sucrose solution immediately after the injections. They were observed every two hours for 12 hours for signs of reduced activity. On the third day, the sucrose solution was replaced with ordinary water.
On day 10 following STZ administration, blood glucose levels were measured using a OneTouch glucometer after a 6-hour fast. Mice with blood glucose levels of 200 mg/dL or higher were included in the study.[
14].
2.6. Treatment and Control Groups
Experimental Grouping
Experimental grouping and treatment protocol for the diabetic mouse model. Mice were randomly allocated into six groups (n=6) to assess the effects of an aqueous mango leaf extract. Group 1 (Normal Control) and Group 2 (Diabetes Control) received the vehicle. Groups 3, 4, and 5 received the extract at low (200 mg/kg), medium (400 mg/kg), and high (600 mg/kg) doses, respectively. Group 6 (Standard Drug Control) received glibenclamide (6 mg/kg) as a positive control. All treatments were administered orally. (b.w. = body weight).(Table )
Table 1.
The grouping and 28 days administration protocol for the extract were as follows.
Table 1.
The grouping and 28 days administration protocol for the extract were as follows.
| GROUP |
TITLE |
No of mice |
TREATMENT |
| 1 |
Diabetes control |
6 |
Feed + Water |
| 2 |
Normal control |
6 |
Feed + Water |
| 3 |
Diabetic low dose 200mg/kg b.w. |
6 |
Feed + extract |
| 4 |
Diabetic medium dose 400mg/kg b.w. |
6 |
Feed + Extract |
| 5 |
Diabetic High dose 600mg/kg b.w. |
6 |
Feed +Extract |
| 6 |
Diabetic Glibenclamide 6mg/kg b.w. |
6 |
Feed standard drug |
2.7. Euthanasia and Sample Collection
All animals were humanely euthanized through CO₂ inhalation at the end of the experiment. The method employed a controlled gradual fill rate (30–70% of chamber volume per minute) in line with AVMA guidelines [
15] and international standards to minimize stress and unconsciousness prior to potential nociception (> 40% CO₂). A rapid anesthetic was chosen due to its low cost and minimal impact on the study outcomes. The chamber temperature and gas distribution were monitored continuously to ensure even distribution. Death was determined when there was no respiratory or cardiac activity[
16]
Skilled professionals conducted a heart puncture immediately after euthanasia to obtain large, uncontaminated blood samples and minimize stress-induced biochemical changes. To avoid autolysis and maintain the morphological integrity necessary for histological examination, essential tissues such as the liver, kidneys, heart and pancreas were swiftly extracted [
17]..
2.8. Body Weight Measurements
Using a calibrated analytical balance, body weight measurements were taken weekly for five weeks (W0–W4) for six experimental groups (n = 6 Swiss albino mice per group)[
18]. To decrease stress during handling, the mice were weighed at the same time every week to minimize circadian fluctuation. Every procedure followed the rules established by the Animal Ethics Committee.[
19]
2.9. Blood Glucose Monitoring
To minimize circadian variability, tail vein sampling was used to measure fasting blood glucose levels every week (W0–W4) between 010:00 and 11:00 using an FDA-approved OneTouch glucometer . The mice were given unlimited access to water and fasted for six hours before the measurement. We took measurements from all the six experimental groups (n=6/group)[
20] .
2.10. Hematological Analysis
The DxH 800 Hematology Analyzer (Beckman Coulter, USA), which is calibrated daily using controls supplied by the manufacturer, was used to analyze the entire blood within two hours after it was taken using a 23G needle through cardiac puncture and transferred into EDTA-coated tubes[
21,
22]. Erythrocyte (RBC, hemoglobin [HGB], platelets (PLT) and leukocytes (WBC) were all measured as part of the complete blood counts[
23]. Evaluations were conducted on all the six experimental groups (n=6/group).
2.11. Blood Chemistry Analysis
After 6-hours of fasting the rats, blood samples were taken by heart puncture on day 28. They were then allowed to clot at room temperature for 30 minutes before being centrifuged at 5,000-× g for 5 minutes to separate the serum. Standardized automated assays (Cobas c501 analyzer, Roche Diagnostics) were used to test the following biochemical parameters: lipids, glucose, ALT/AST, ALP, and bilirubin[
24,
25].
Every test was calibrated daily using internal quality controls (normal/pathological ranges) and manufacturer-provided standards. All six experimental groups (n=6/group) had their liver function (ALT, AST, ALP), glucose metabolism, lipid profile (total cholesterol, HDL, LDL, triglycerides), and renal markers (creatinine, urea) assessed [
24].
2.12. Histopathological Examination
Following euthanasia, tissues from the pancreas, liver, and kidneys were taken, preserved for 48 hours in 10% neutral-buffered formalin, and then passed through a series of graded ethanol for paraffin embedding. Hematoxylin and eosin (H&E) staining was performed on 4 µm thick sections using standard techniques (eosin: 3 minutes; hematoxylin: 5 minutes). Bright-field microscopy (Nikon Eclipse E200, 40–400× magnification) was used for examination. Three criteria were used to evaluate the morphology of the pancreatic islets: (1) islet number per area; (2) β-cell density relative to islet area; and (3) lymphocytic infiltration, which is a sign of insulitis. Liver slices were examined for signs of cellular stress, such as pyknosis and hyperchromatic, inflammatory foci marked by periportal lymphocytes, and architectural distortion, including necrosis and stenosis[
26]
While cardiac sections were analyzed for myocyte disarray, vascular abnormalities, and foam cell infiltration, kidney tissues were analyzed primarily for glomerular integrity, tubular vacuolization, and perivascular inflammation. Two investigators who were anonymous to the experiments performed all histopathology evaluations. A digital camera was used to capture representative photomicrographs in carefully regulated illumination.[
27]
2.13. Organ Collection and Weight Analysis
After being quickly removed, the pancreas, liver, and kidneys were carefully rinsed in ice-cold phosphate-buffered saline (PBS, pH 7.4) to remove any remaining blood, and any excess moisture was gently wiped out on sterile filter paper[
28]. In order to minimize post-excision variability, absolute weights were recorded in milligrams (mg) and each organ was weighed right away using a precision analytical scale with a sensitivity of ±0.1 mg. In order to ensure uniformity, the same investigator performed all of the weighing under the same conditions (room temperature: 22±1°C; humidity: 50±5%) [
29]. Using N=6 biologically independent samples per group, organ weight data were presented as mean ± standard deviation (SD) with individual ranges.
2.14. Ethical Issues
All animals were handled, treated, euthanized, and discarded after sacrifice as per the ethical regulations and approval from the Addis Ababa University’s Ethical Review Board (IRB). All procedures adhered to the Institutional Ethical Guidelines of Addis Ababa University (Protocol #044/24/physio).
3. Results
3.1. Serum Glucose Level
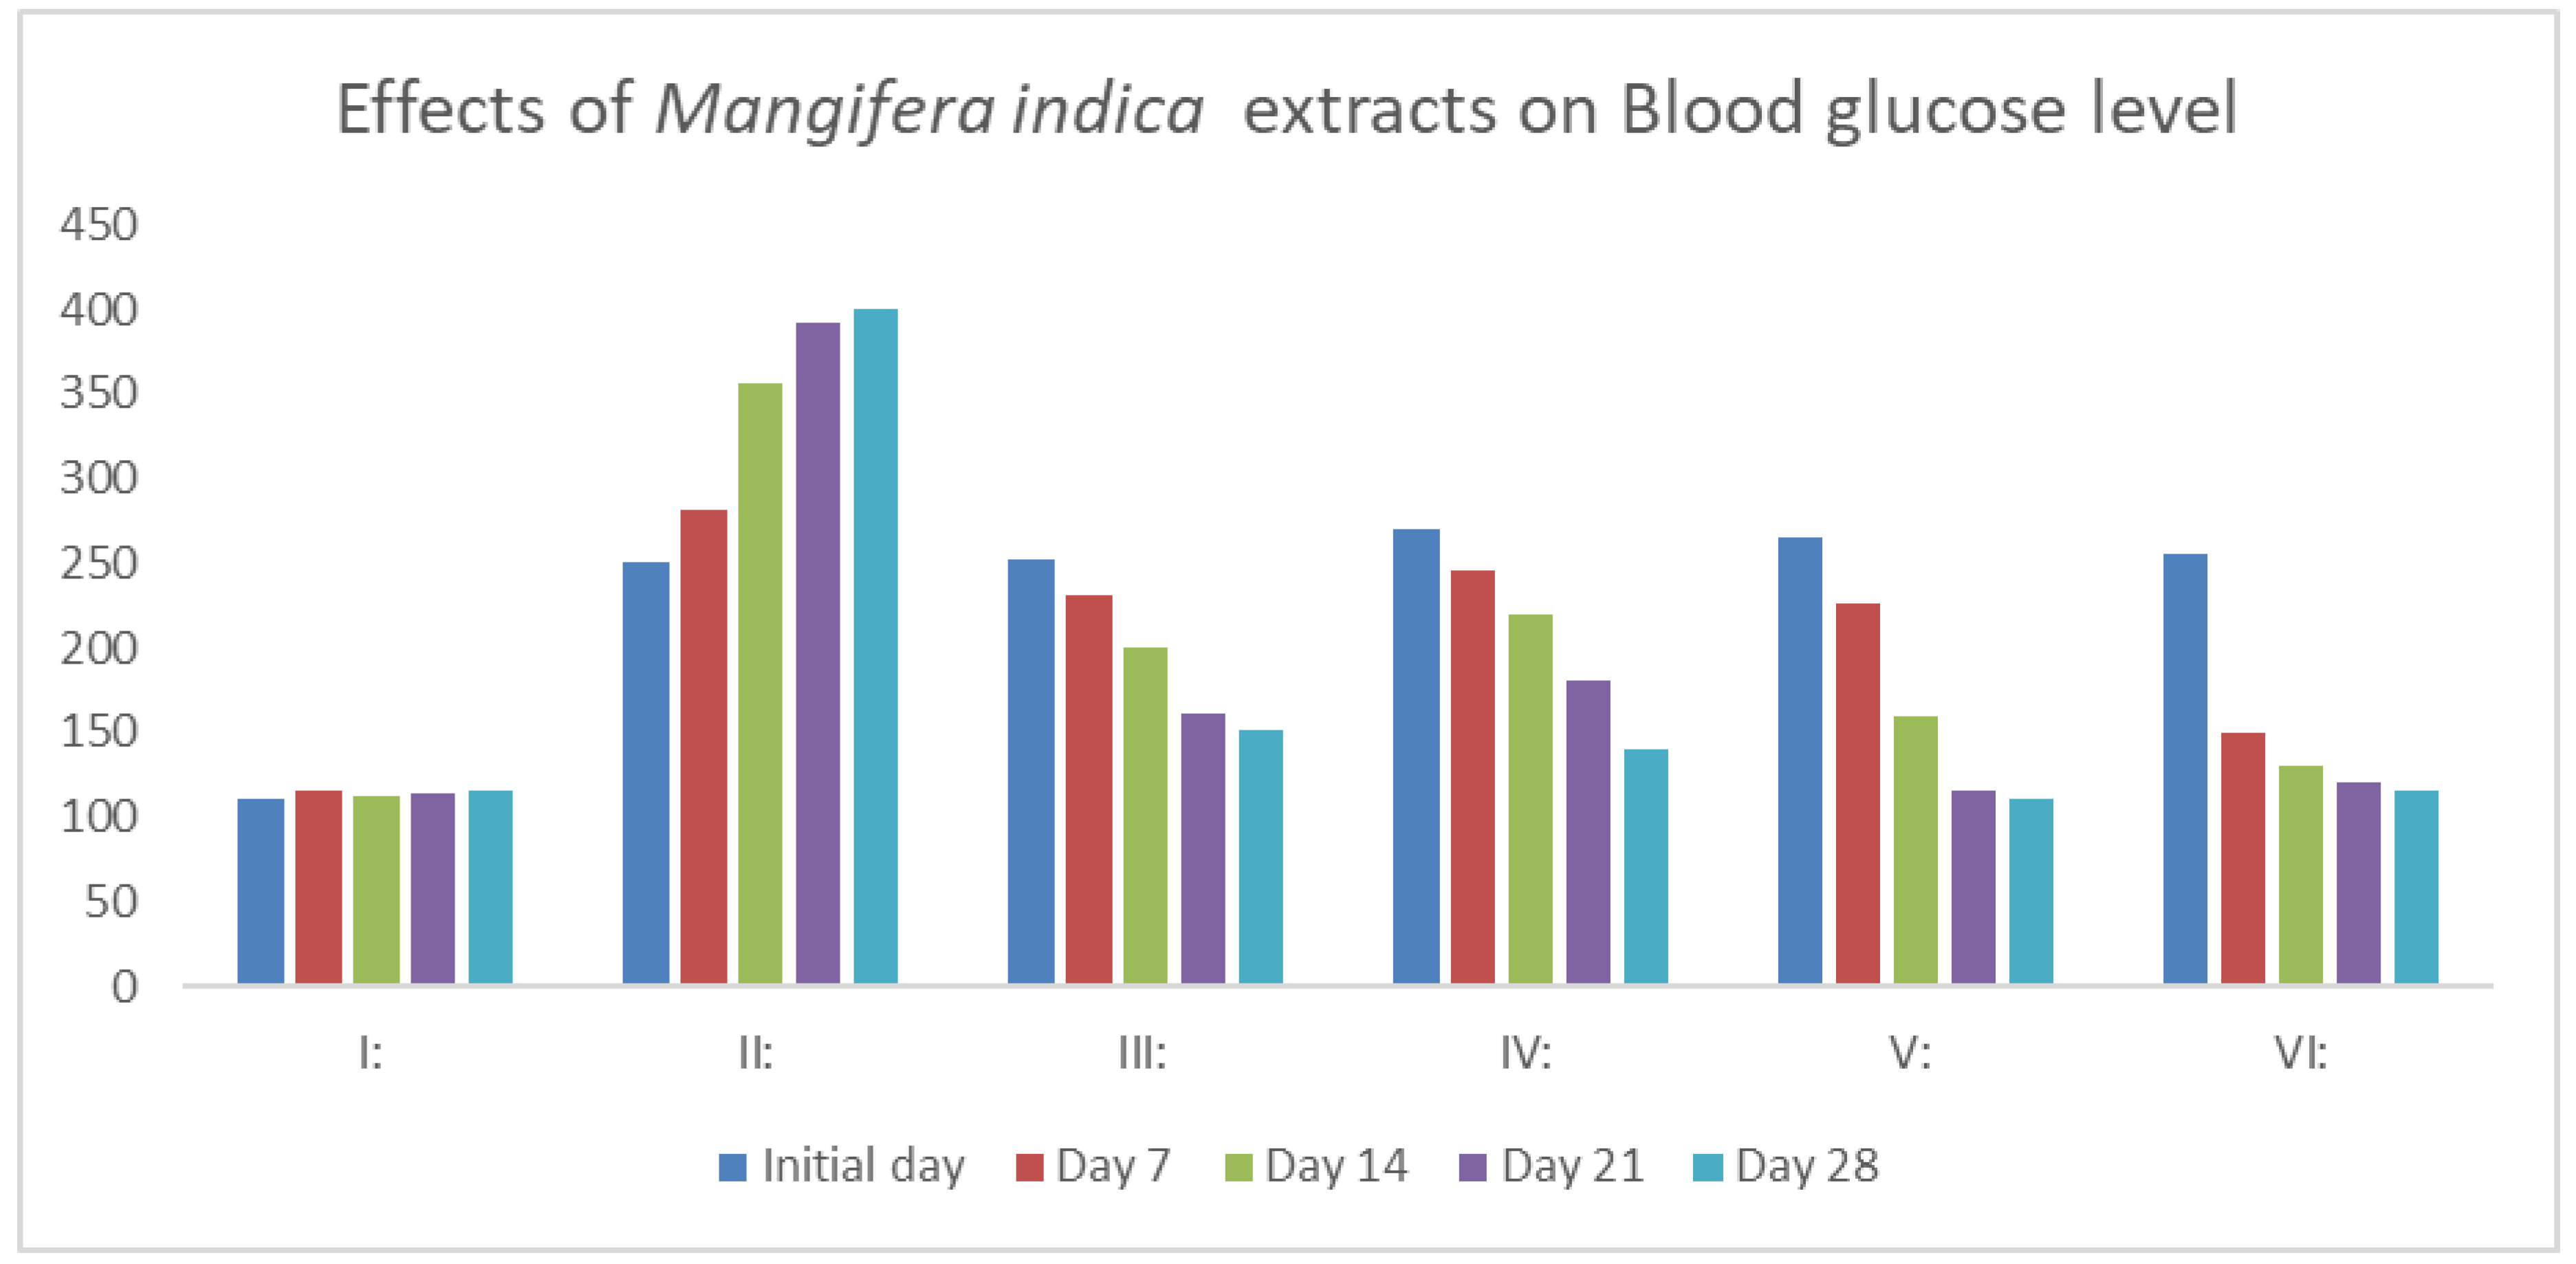
As indicated in
Figure 1, a single dose of 40 mg/kg of streptozotocin monohydrate considerably raises blood glucose levels (P<0.01). Following 28 days of daily oral dose of MIME (200, 400, and 600 mg/kg, p.b.w.), the diabetic mice showed a significant dose-dependent reduction in blood glucose levels (P<0.01). The groups treated with 200, 400, and 600 mg/kg of MIME had blood glucose levels of 151.21 ±2.24 mg/dL, 140.21 ±2.24 mg/dL, and 110.52 ±2.70 mg/dL at the end of the experiment (
Figure 1).
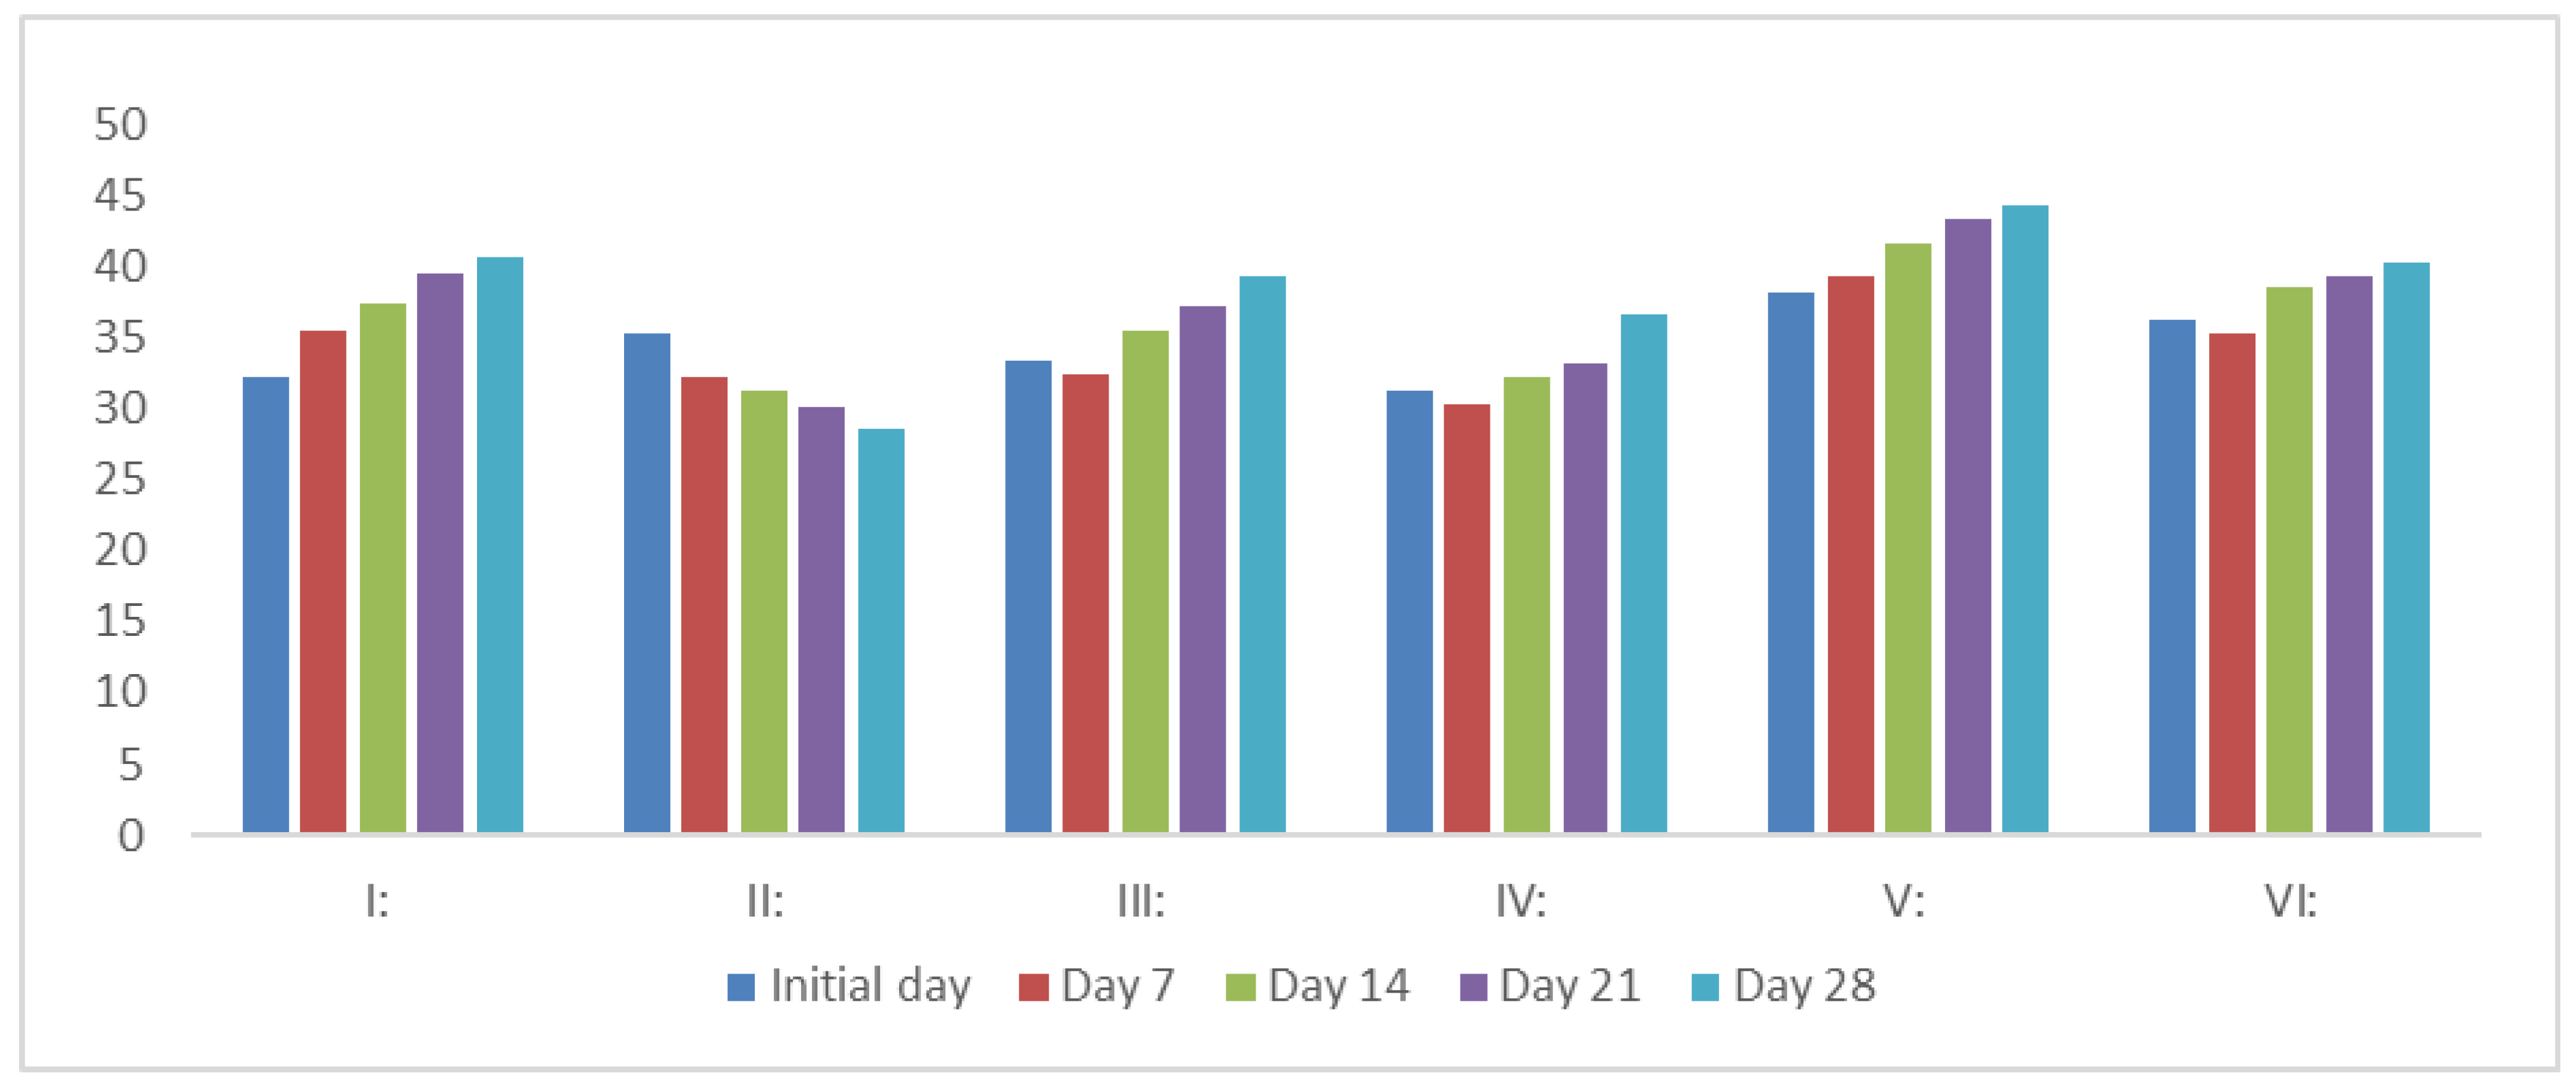
3.2. Effect on the Body Weight of Rats
MIME extracts (200, 400, and 600 mg/kg, p.o.) and glibenclamide (6 mg/kg) significantly increased the body weight of diabetic mice (P<0.05). A consistent decrease in body weight was noted in diabetic mice following STZ administration. Treatment of animals with increasing dose of MIME animals treated with varying doses of MIME of the extracts resulted in significant regaining of body weight (
Figure 2).
3.3. Hematology
The table shows how different doses of mango leaf extract (200, 400, and 600 mg/kg) affect blood parameters, hemoglobin (HGB), red blood cells (RBCs), white blood cells (WBCs), and platelets, in diabetic mice compared to normal and diabetic control groups. The diabetic control group exhibited significantly lower levels in all parameters (HGB: 6.5, RBCs: 3.31, WBCs: 4.00, Platelets: 865) (P<0.05). Mango leaf extract improved these levels in a dose-dependent manner, with the highest dose (600 mg/kg) restoring them nearly to normal levels, while the lower doses (200 and 400 mg/kg) showed partial recovery. (
Table 2).
3.4. Effect on Lipid Profile
Serum total cholesterol and triglycerides were significantly increased, and HDL cholesterol was significantly decreased in diabetic mice as compared to normal controls. After 28 days of treatment, the HDL cholesterol was significantly increased
(P<0.05), while glybenclamide and MIME (200, 400, and 600 mg/kg) considerably decreased (P<0.05) the levels of triglycerides and cholesterol (
Table 3).
3.5. Effect on Liver Functions
In the STZ-induced control DM group, there was a significant increase in ALT, AST, ALP, and bilirubin levels; there was a significant increase in serum bilirubin level, a significant decrease in serum protein level. Treatment of the mice with increasing doses of MIME (200, 400, and 600 mg/kg, p.m.) demonstrated a dose-dependent decrease (P<0.05) in liver enzyme (transaminase) levels. Following MIME treatment, diabetic mice's bilirubin levels also decreased. Treatment of mice with also MIME significantly increased the total protein level (P<0.01) (
Table 4)
3.6. Effect on Kidney Functions
When compared to normal mice, streptozotocin-induced diabetic mice had higher levels of kidney dysfunction, including creatinine and urea. Treatment of mice with increasing doses of MIME significantly decreased creatinine and urea levels from the diabetic values (
Table 5).
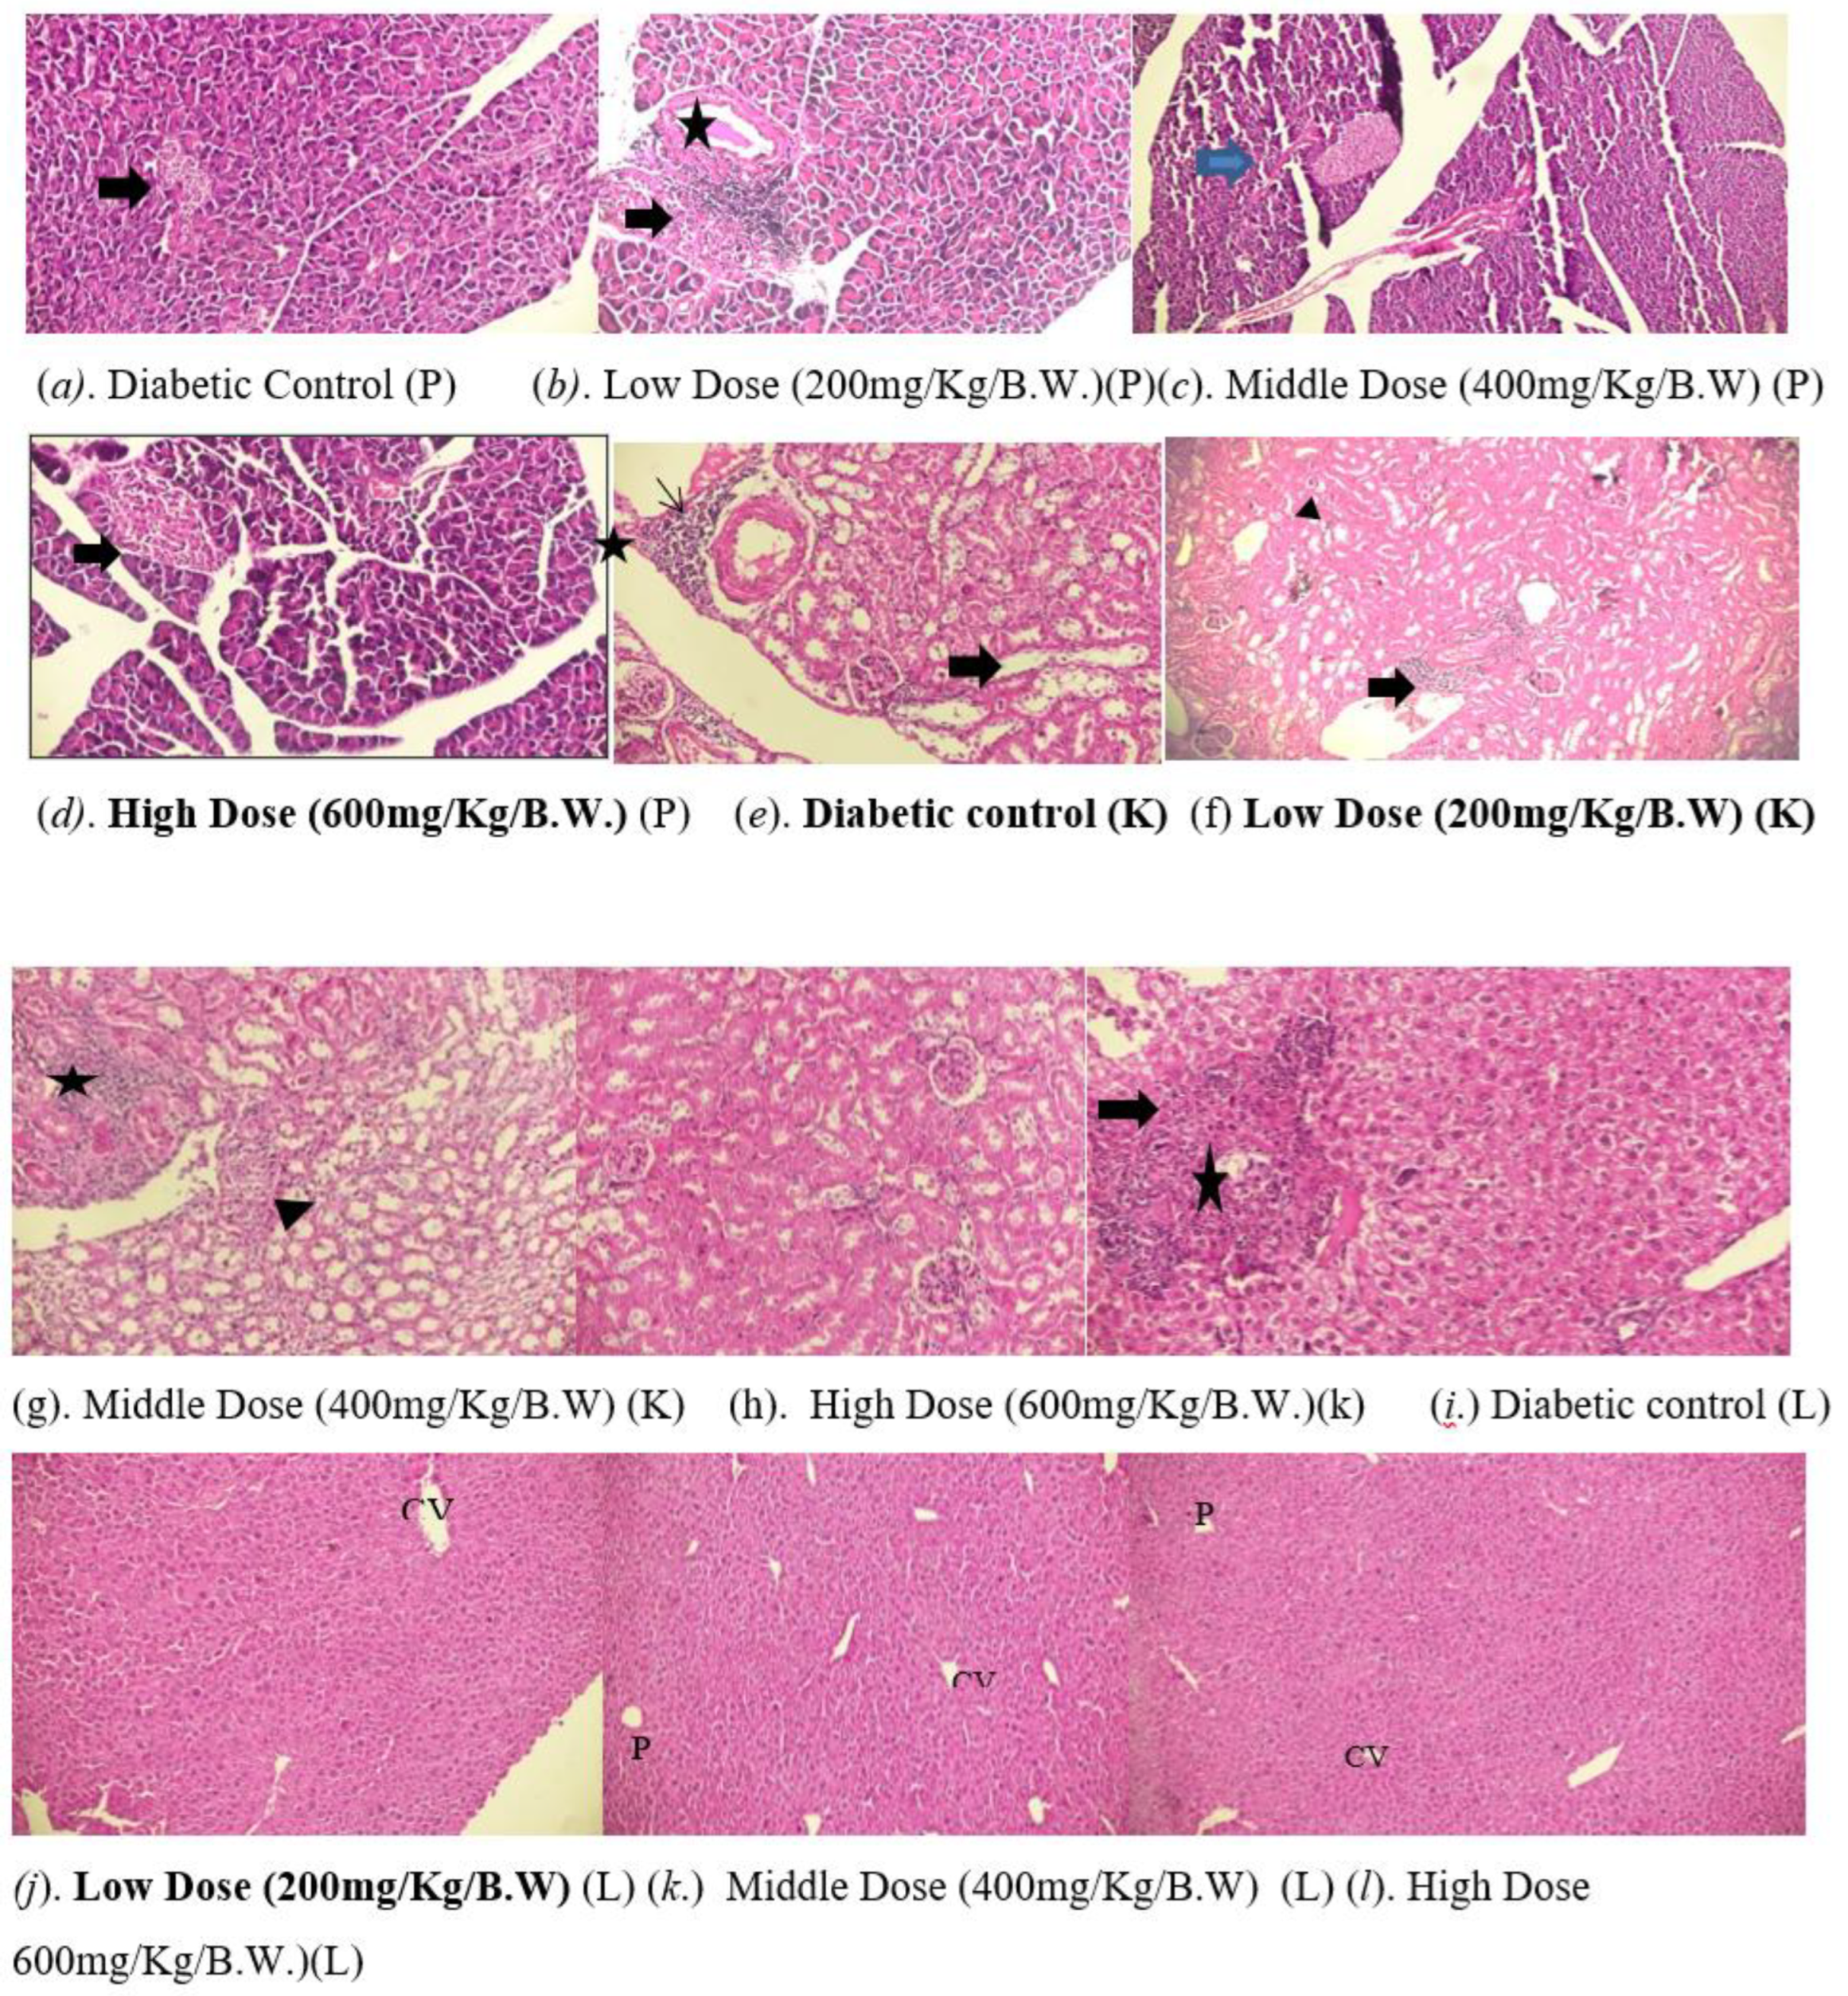
3.7. Histopathological Analysis
Pancreatic islets show shrinkage, necrosis, reduced β-cell mass, and lymphocytic inflammation (Figure a). It exhibits reduced volume and number of Langerhans islets, with moderate shrinkage, decreased β-cell mass and lymphocytic inflammation (Figure b). Histological analysis shows a mild decrease in islet volume and quantity, along with reduced β-cell mass and lymphocytic inflammation within the islets (arrowed in Figure c). A pancreatic section shows preserved Langerhans islets (arrowed), with a slight decrease in size but a significant number of functional β-cells (Figure d). The kidney exhibits perivascular inflammation, vascular hyalinization, and cytoplasmic vacuolization in tubular cells, indicating acute inflammation and chronic vascular injury. (Figure e) Show multiple foci of perivascular lymphocytic infiltrates, with intact glomeruli (thick arrow) and renal tubules, and cytoplasmic vacuolization (arrowhead) in tubular epithelial cells (Figure f). Kidney shows perivascular inflammatory infiltrates, normal glomeruli/tubules, and tubular epithelial vacuolization, indicating acute inflammation. (Figure g). Kidney tissue normal kidney findings of intact glomerular architecture, well-formed renal tubules, and foci of inflammatory cells, mainly lymphocytes (Figure h)
Liver sections exhibit significant lymphocytic infiltration in perivascular areas, with disrupted architecture, necrotic hepatocyte foci (thick arrows), lymphocyte aggregates (stars), and abundant cellular debris in the sinusoids (Figure i). Liver sections demonstrate preserved hepatic architecture, featuring well-organized central veins (CV). Mild lymphocytic infiltration is observed within the perivascular areas (Figure J). Liver sections demonstrate preserved hepatic architecture, featuring well-organized central veins (CV) and portal triads (P). Mild lymphocytic infiltration is (Figure k). H&E liver sections show preserved hepatic architecture (well-organized CV, P) and mild perivascular lymphocytic infiltration. (Figure l)
4. Discussion
Accumulating evidence from-ethno medicine shows that many of the herbal medicines can stimulate insulin release or reduce glycemic excursion in diabetic individuals. Studies have been conducted on many herbal extracts around the globe, presenting evidence for improved insulin secretion, enhancing insulin sensitivity with great impact on glucose metabolism, enhancing pancreatic beta cell protection, and anti-inflammatory effects.[
30]
It has also been reported that about 800 species of ethnobotanical herbs possess antidiabetic properties, including Brassica juncea, Combretum micranthum, Elephantopus scaber, Gymnema sylvestre, Liriope spicata, Parinari excelsa, Ricinus communis, Sarcopoterium spinosum, Smallanthus sonchifolius, Swertia punicea, Vernonia anthelmintica, Annona muricata, Trigonella foenum-graecum, Momordica charantia, Cinnamomum verum, and Artemisia absinthium [
31]. Further studies on these plants have shown that they contain active compounds like flavonoids, alkaloids, and polysaccharides that can help reduce glycemic excursion in diabetes, improve cellular sensitivity to insulin, and support antioxidant and other metabolic functions while maintaining safety and efficacy for use[
31].
Mangifera indica (MI), also known as mango, has been an important herb in the Ayurvedic and indigenous medical systems for over 4000 years. It belongs to the genus
Mangifera, which consists of about 30 species of tropical fruiting trees in the flowering plant family Anacardiaceae. According to Ayurveda, varied medicinal properties are attributed to different parts of mango trees.[
32]
The present study aimed to investigate its antidiabetic or blood glucose-lowering effect. In this study conducted on mice, it was shown that the methanol extracts of
Mangifera indica (MIME) exhibit significant blood glucose and lipid-lowering effects in STZ-induced diabetic mice.[
33] This result corroborates its traditional use in Ethiopian ethnomedicine and the claimed antidiabetic effect by traditional herbalists. In mice, MI clearly showed a significant restoration of HDL and a reduction of the bad lipid, LDL. It also showed significant inflammatory and antioxidant activity by reversing diabetes induced hepatic and renal inflammation. This is in support of the study on
Mangifera species showing hypoglycemic and antioxidant properties[
34], but uniquely establishes a dose-dependent efficacy and organ-specific protection in a standardized STZ-induced diabetic model[
35].
The finding in blood glucose level with MIME treatment in DM mice aligns with studies on other flavonoid-rich botanicals that modulate AMPK and hepatic gluconeogenesis[
36]. However, the MIME effect in partially restoring pancreatic β-cell density sharply contrasts with reports on synthetic drugs such as glibenclamide, which often lack such regenerative effects. This suggests MIME has multimodal effects, both insulin sensitizing and β-cell protective mechanisms.
The partial restoration of islet morphology in MIME-treated mice parallels findings with Ocimum sanctum and
Gymnema sylvestre extracts[
37]. However, MIME particularly reduced the severity of insulitis in STZ-treated mice. [
38]
This immunomodulatory potential distinguishes it from pure antioxidants like quercetin, which show weaker anti-inflammatory effects in STZ models[
39]. Liver preservation in high-dose groups mirrors berberine’s lipid-regulating effects [
40]]. However, MIME's additional effects in attenuating hepatomegaly suggest broader anti-inflammatory benefits.
MIME reduction of tubular vacuolization and glomerular damage (Figures f ,g and h) aligns with the nephroprotective effects of
Momordica charantia [
41]. Yet concurrent normalization of cardiac weight and lipid profiles is rare among plant extracts. While metformin improves lipid metabolism.
Compared to clinical trials on established antidiabetic herbs (e.g., Cinnamomum cassia [
42], the study is limited to murine models. Future work should compare MIME bioactive compounds (e.g., spinosin) to isolated flavonoids like rutin for target specificity; evaluate long-term safety, as hepatorenal protection in mice may not fully translate to humans. Test combinational therapies with synthetics (e.g., low-dose MIME + metformin) to optimize efficacy [
43].
Comparative studies with isolated compounds like rutin or quercetin could elucidate structure-activity relationships and synergistic interactions [
44]. While MIME demonstrated hepatorenal protection in mice, long-term toxicity studies are essential to assess its safety for human use. Chronic toxicity evaluations in higher mammalian models, including histopathological and biochemical monitoring, would bridge the translational gap [
45].
Investigating MIME in combination with synthetic drugs (e.g., metformin or glibenclamide) could optimize glycemic control while minimizing adverse effects. Such approaches may leverage β-cell regenerative properties alongside with conventional insulin sensitizers [
46].
Clinical trials are needed to validate MIME efficacy in human populations, particularly in regions where Mangifera indica species are traditionally used. Ethnopharmacological surveys could identify optimal dosing regimens and patient-specific responses[
47]. Future studies are needed to isolate and characterize specific bioactive compounds in
Mangifera indica to determine their individual contributions to antidiabetic and lipid-lowering effects.
Further mechanistic studies should explore MIME effects on oxidative stress pathways (e.g., Nrf2 activation) and immunomodulation (e.g., TNF-α suppression) to clarify its multimodal action. Proteomic or transcriptomic analyses of the NMIME could reveal novel targets.
5. Conclusion
In conclusion, the methanol extract of Mangifera indica reduces the concentration of glucose, cholesterol, and triglyceride in experimentally induced diabetic mice. Mangifera indica leaf has hypoglycemic and hypolipidemic effects on STZ-induced diabetic mice. The plant has no short-term toxic effect on the liver and kidney, as the kidney and liver function markers are not affected over the period of the study.
Author Contributions
Conceptualization, Getahun Tsegaye and Abebaye Aragaw; methodology, Tesfaye Tolessa software, Tsegay Beyene.; validation, Getahun Tsegaye, Worku Gemechu and Abebaye Aragaw; formal analysis, Getahun Tsegaye.; investigation, Wossene Habtu Samuel Woldekidan Moti Sori Rejeb Beza Tasew.; resources, Abiy Abebe.; data curation, Rekik Ashebir; writing—original draft preparation, Getahun Tsegaye; writing—review and editing, Getahun Tsegaye Mekoya Mengistu.; visualization, menberework chanyalew; supervision, menberework chanyalew Tesfaye Tollossa.; project administration, worku Gemechu.; funding acquisition, Rekik Ashebir . All authors have read and agreed to the published version of the manuscript.
Funding
This research received no external funding.
Data Availability Statement
The data will be available when requested by the journal.
Acknowledgments
We would like to express our sincere gratitude to the following individuals and organizations for their invaluable contributions to this research:We thank Addis Ababa University Physiology department for helping me to start this PHD education and administrative facility. We are grateful to Dr.Abebaye Aragaw Leminie and Mr. Worku Gemechu Lemmi for their guidance and support throughout the research process. Special thanks to Armauer Hanssen research institute and Addis Ababa University for their collaboration and insights that greatly enhanced the quality of this work.
Conflicts of Interest
The authors declare no conflicts of interest.
Abbreviations
| ALP |
Alkaline phosphatase |
| ALT |
Alanine Aminotransferase |
| AST |
Aspartate Transaminase |
| DM |
Diabetes Mellitus |
| HDL |
High Density lipoprotein |
| HGB |
Hemoglobin |
| IRB |
institutional review board |
| LDL |
low-density lipoprotein |
| MIME |
Mangifera indica methanol Extract |
| PLT |
Platelets |
| RBC |
Red blood cells |
| STZ |
streptozotocin |
| WBC |
White Blood cells |
References
- Ohiagu, F.; Chikezie, P.; Chikezie, C. Pathophysiology of diabetes mellitus complications: Metabolic events and control. Biomedical Research and Therapy, 2021, 8, 4243–4257. [Google Scholar] [CrossRef]
- Owens, D.R.; et al. IDF diabetes Atlas: A worldwide review of studies utilizing retinal photography to screen for diabetic retinopathy from 2017 to 2024 inclusive. Diabetes Research and Clinical Practice, 2025, 226, 112346. [Google Scholar] [CrossRef]
- Wild, S.; et al. Global prevalence of diabetes: estimates for the year 2000 and projections for 2030. Diabetes care, 2004, 27, 1047–1053. [Google Scholar] [CrossRef] [PubMed]
- Jain, A.; Singhai, A. Nephroprotective activity of Momordica dioica Roxb. in cisplatin-induced nephrotoxicity. Natural Product Research, 2010, 24, 846–854. [Google Scholar] [CrossRef] [PubMed]
- Stenman, S.; et al. Relationship between sulfonylurea dose and metabolic effect. Diabetes, 1990, 39, 108A. [Google Scholar]
- von Schoen-Angerer, T. , et al., Traditional, complementary and integrative healthcare: global stakeholder perspective on WHO's current and future strategy. BMJ Glob Health, 2023. 8(12).
- Hoenders, R.; et al. A review of the WHO strategy on traditional, complementary, and integrative medicine from the perspective of academic consortia for integrative medicine and health. Front Med (Lausanne), 2024, 11, 1395698. [Google Scholar] [CrossRef]
- Kalita, P. An overview on Mangifera indica: Importance and its various pharmacological action. PharmaTutor, 2014, 2, 72–76. [Google Scholar]
- Jain, C.; et al. Anti-diabetic potential of flavonoids and other crude extracts of stem bark of Mangifera indica Linn: a comparative study. J Sci Innov Res, 2014, 3, 21–27. [Google Scholar] [CrossRef]
- Irondi, E.A.; Oboh, G.; Akindahunsi, A.A. Antidiabetic effects of Mangifera indica Kernel Flour-supplemented diet in streptozotocin-induced type 2 diabetes in rats. Food Sci Nutr, 2016, 4, 828–839. [Google Scholar] [CrossRef]
- Loan, N.T.T.; et al. Purification Process of Mangiferin from Mangifera indica L. Leaves and Evaluation of Its Bioactivities. Processes, 2021. 9(5).
- Kaur, J.; et al. Comprehensive Analysis and Characterization of Mangifera indica L. Leaf Powder. Food Science & Nutrition, 2025. 13(6).
- Bitwell, C.; et al. A review of modern and conventional extraction techniques and their applications for extracting phytochemicals from plants. Scientific African, 2023, 19, e01585. [Google Scholar] [CrossRef]
- Brosius, F. , Low-Dose Streptozotocin Induction Protocol (mouse) v1. 2019.
- Carbon Dioxide for Euthanasia_ Concerns Regarding Pain and Distre.pdf>.
- Parasuraman, S.; Raveendran, R.; Kesavan, R. Blood sample collection in small laboratory animals. J Pharmacol Pharmacother, 2010, 1, 87–93. [Google Scholar] [PubMed]
- Xie, F.; et al. Good Preclinical Bioanalytical Chemistry Requires Proper Sampling from Laboratory Animals: Automation of Blood and Microdialysis Sampling Improves the Productivity of LC/MSMS. Analytical Sciences, 2003, 19, 479–485. [Google Scholar] [CrossRef] [PubMed]
- McLaren, G.; et al. Body weight change as a measure of stress: a practical test. Animal Welfare, 2004, 13, 337–341. [Google Scholar] [CrossRef]
- Schuppli, C.A. Decisions about the use of animals in research: Ethical reflection by Animal Ethics Committee members. Anthrozoös, 2011, 24, 409–425. [Google Scholar] [CrossRef]
- Klonoff, D.C.; et al. Importance of FDA-Integrated Continuous Glucose Monitors to Ensure Accuracy of Continuous Glucose Monitoring. J Diabetes Sci Technol, 2025, 19, 1392–1399. [Google Scholar] [CrossRef]
- Litvinova, E.A.; et al. Modification of Fecal Bacteria Counts and Blood Immune Cells in the Offspring of BALB/c and C57BL/6 Mice Obtained through Interstrain Mouse Embryo Transfer. J Am Assoc Lab Anim Sci, 2020, 59, 401–410. [Google Scholar] [CrossRef]
- Rathkolb, B.; et al. Blood Collection from Mice and Hematological Analyses on Mouse Blood. Curr Protoc Mouse Biol, 2013, 3, 101–19. [Google Scholar] [CrossRef]
- Wolford, S.T.; et al. Reference range data base for serum chemistry and hematology values in laboratory animals. J Toxicol Environ Health, 1986, 18, 161–88. [Google Scholar] [CrossRef]
- Aguila, M.B.; et al. Lipid metabolism in rats fed diets containing different types of lipids. Arq Bras Cardiol, 2002, 78, 25–38. [Google Scholar] [CrossRef] [PubMed]
- Wiedmeyer, C.E.; Ruben, D.; Franklin, C. Complete blood count, clinical chemistry, and serology profile by using a single tube of whole blood from mice. J Am Assoc Lab Anim Sci, 2007, 46, 59–64. [Google Scholar]
- Ahmed, E. , Histological technique quick review. 2022.
- Slaoui, M. and L. Fiette, Histopathology procedures: from tissue sampling to histopathological evaluation, in Drug Safety Evaluation: Methods and Protocols. 2010, Springer. p. 69-82.
- Etuk, E. Animals models for studying diabetes mellitus. Agric Biol JN Am, 2010, 1, 130–134. [Google Scholar]
- Zafar, M. and S.N.-u.-H. Naqvi, Effects of STZ-induced diabetes on the relative weights of kidney, liver and pancreas in albino rats: a comparative study. International Journal of Morphology, 2010. 28(1).
- Yuan, H.; et al. The traditional medicine and modern medicine from natural products. Molecules, 2016, 21, 559. [Google Scholar] [CrossRef] [PubMed]
- Arumugam, G.; Manjula, P.; Paari, N. A review: Anti diabetic medicinal plants used for diabetes mellitus. Journal of Acute Disease, 2013, 2, 196–200. [Google Scholar] [CrossRef]
- Parvez, G.M. Pharmacological activities of mango (Mangifera indica): A review. Journal of Pharmacognosy and phytochemistry, 2016, 5, 1. [Google Scholar]
- Gondi, M.; et al. Anti-diabetic effect of dietary mango (Mangifera indica L.) peel in streptozotocin-induced diabetic rats. Journal of the Science of Food and Agriculture, 2015, 95, 991–999. [Google Scholar] [CrossRef]
- S Mohamed, E.; et al. Evaluation of Hypoglycemic and Hypolipidemic potentials of Aqueous Extracts of Guava and Mango leaves in Streptozotocin Diabetic Rats. مجلة الاقتصاد المنزلي, 2025. 41(4): p. 1-24.
- Fernández-Ochoa, Á.; et al. Evaluation of metabolic changes in liver and serum of streptozotocin-induced diabetic rats after Mango diet supplementation. Journal of Functional Foods, 2020, 64, 103695. [Google Scholar] [CrossRef]
- Moon, D.O. Plant-derived flavonoids as AMPK activators: unveiling their potential in type 2 diabetes management through mechanistic insights, docking studies, and pharmacokinetics. Applied Sciences, 2024, 14, 8607. [Google Scholar] [CrossRef]
- Sathyanarayan, S.; Pillai, K.S. Evaluation of antioxidant and Antidiabetic properties of goa 111, a mixture of Gymnema sylvestre, Ocimum sanctum and Azadirachta indica extract (1: 1: 1): An in vitro approach. Journal of Pharmacognosy and Phytochemistry, 2019, 8, 1889–1895. [Google Scholar]
- Rajesh, M. , Screening of Hypoglycemic Effects of Various Extracts of Costus Speciosus and Aqueous Extract of Mangifera Indica in Normal and Diabetic Rats. 2006, Rajiv Gandhi University of Health Sciences (India).
- Xu, D.; et al. Antioxidant activities of quercetin and its complexes for medicinal application. Molecules, 2019, 24, 1123. [Google Scholar] [CrossRef] [PubMed]
- Liu, X.; et al. Therapeutic effects of berberine on liver fibrosis are associated with lipid metabolism and intestinal flora. Frontiers in Pharmacology, 2022, 13, 814871. [Google Scholar] [CrossRef] [PubMed]
- Mada, S.; et al. Hepatoprotective effect of Momordica charantia extract against CCl4 induced liver damage in rats. British Journal of Pharmaceutical Research, 2014, 4, 368. [Google Scholar] [CrossRef]
- Yan, Y.-M.; et al. Anti-diabetic nephropathy compounds from Cinnamomum cassia. Journal of ethnopharmacology, 2015, 165, 141–147. [Google Scholar] [CrossRef]
- Sapin, A.B.; et al. Evaluation of the Antioxidant and Anti-diabetic Bioactivities of Natural Phenolics from Mango (Mangifera indica Linn) Branches. Philippine Journal of Science, 2021. 150(3).
- Varshney, R.; et al. A comparative analysis of various flavonoids in the regulation of obesity and diabetes: An in vitro and in vivo study. Journal of Functional Foods, 2019, 59, 194–205. [Google Scholar] [CrossRef]
- Emejulu, A.; et al. Renal and hepato-protective effects of Irvingia gabonensis juice on sodium fluoride-induced toxicity in Wistar rats. J Clin Toxicol, 2016, 6, 2161–0495. [Google Scholar] [CrossRef]
- Núñez-Sellés, A.J.; et al. The paradox of natural products as pharmaceuticals: Experimental evidences of a mango stem bark extract. Pharmacological Research, 2007, 55, 351–358. [Google Scholar] [CrossRef] [PubMed]
- KHUMYAT, M. and D. Pekthong, Inhibitory and inductive effects of Bacopa monnieri standardized extract and its constituents on human liver cytochrome P450. 2021, Naresuan University.
|
Disclaimer/Publisher’s Note: The statements, opinions and data contained in all publications are solely those of the individual author(s) and contributor(s) and not of MDPI and/or the editor(s). MDPI and/or the editor(s) disclaim responsibility for any injury to people or property resulting from any ideas, methods, instructions or products referred to in the content. |
© 2025 by the authors. Licensee MDPI, Basel, Switzerland. This article is an open access article distributed under the terms and conditions of the Creative Commons Attribution (CC BY) license (http://creativecommons.org/licenses/by/4.0/).