
Submitted:
29 November 2025
Posted:
02 December 2025
You are already at the latest version
Abstract
The snowpack is the interface between the atmosphere and the earth’s surface when snow is present. The snowpack energy balance is dictated in part by the nature of the snow surface. The roughness of the snow surface can be quite dynamic. At the Sierra Nevada ski resort in Spain, we measured several snow surface forms: natural, with the presence of dust, with the presence of sun cups, and groomed snow (tracked and between tracks). The snow surface was assessed in 2-D from snow roughness boards and in 3-D from iPad surface scanning to measure across resolutions. Both data collection methods provided similar roughness estimates via the random roughness (RR) and variogram analysis (scale break, SB and fractal dimension, D) for each distinct surface. The geometry-based aerodynamic roughness length (z0) was computed for the iPad-scanned surfaces yielding an order of magnitude variability in z0. This produced substantial differences in modelled sublimation.
Keywords:
snow surface
; random roughness
; variograms
; scale break
; fractal dimension
; aerodynamic roughness length
; z0
; sublimation
1. Introduction
The snowpack surface is the interface between the atmosphere and the earth when the ground is snow-covered [1,2,3]. As such, this interface dictates the energy balance of the snowpack [4,5], in particular the latent heat flux and the sensible heat flux [6,7]. Although the snow surface is often considered static for modeling [8], the nature of a snowpack surface can vary substantially over the winter [9,10,11]. This includes the aerodynamic roughness length, or , which is a metric to quantify the roughness of the snowpack surface. Snow surface roughness often increases during melt [10,12,13], such as with the development of sun cups [14] (Figure 1), that can be enhanced by the presence of dust (Figure 1) [9,15]. At ski areas, grooming does the opposite and provides a smoother snow surface (Figure 1) [16]. We asked the following questions: 1) how does the snow surface roughness vary at a ski area? and 2) what are the implications of the spatial variation on snowpack sublimation modeling?
2. Study Site
In Spain, most areas with continuous seasonal snow cover lie above treeline [17,18]. Snow dominates the Spanish alpine environment (Figure 2a) [19], especially in the Sierra Nevada (Figure 2b) [20]. Snow is an important resource in the Spanish Sierra Nevada [21] for ski tourism [22], water resources [23], and for sustaining endemic fauna and flora [24,25], which make this area a biodiversity hotspot [26]. However, assessing the amount of snowfall is difficult [27]. Sublimation and melt-evaporation [28] reduces the water storage and further increases uncertainty [29]. To evaluate the uncertainty of sublimation, we collected data near the city of Granada (Figure 2a), in the northwestern Sierra Nevada (Figure 2b). Specifically, data were collected to the west of the top of the Telecabina Al-Andalus (Andalucian Gondola) (Figure 2c). This area, know as Borreguiles, is at an elevation 2,700 metres. Data were collected on 19 April 2024.
3. Methods
3.1. Surface Mapping
We measured both the grooomed snow surface, or piste [30], and the ungroomed (or natural) snow surface, also known as off-piste [31] at two spatial resolutions ( 0.2 mm and 1 cm) to estimate snow roughness (Figure 1). For the groomed surface, measurements included both the compacted tracks left by the grooming machine and the flatter sections between these tracks (Figure 1). The ungroomed snow surface included natural snow with small undulations, sun cups, and dust at the surface (Figure 1 and and Table 1). Roughness boards were used as a two-dimensional representation of fine details in the snowpack (Figure 3) while iPad surface scanning was used for a more coarse three-dimensional surface geometry of the snow surface and Table 2. The latter was used for sublimation modeling.
3.1.1. Roughness Boards
A 60-cm wide snow board inserted into the snow so that the surface was fully contrasted by the board (Figure 3a). A photograph was taken of the board using a Samsung Galaxy A53 (SM-A536U1, 16MP 4624x3468 pixels, ISO50, 24 mm) [32]. Each image was clipped horizontally to the black-red edge of the board (Figure 3b). The green band was converted to a matrix of digital numbers (DNs). A DN threshold of 100 was used to identify the snow surface, i.e., board (low DN) versus snow (high DN) (Figure 3c). Once the snow surface was converted into ASCII data, it was detrended to remove any slope bias from the angle of the surface and/or camera (Figure 3d). The full method is detailed in Fassnacht et al. [33]. The raw images are in JPEG format [34].
The roughness boards were inserted parallel (Figure 3a) and perpendicular to the grooming tracks (Table 1). The surface from the roughness board perpendicular to the grooming tracks represented between groomed tracks. Some areas of the natural snow had some small undulations, while others showed sun cups (Figure 1).
3.1.2. iPad Surface Scans
The snow surface was scanned with an iPad Pro [35] using the 3-D Scanner App [36] (Figure 4). While the specific scanning mechanism is proprietary, it appears to be structure-from-motion with lidar from distance. An 0.8 m x 1.6 m rectangular area was clipped for the dust-covered natural, sun-cupped natural (left in Figure 4), within the groomer tracks, and between the groomer tracks (right in Figure 4). Each area was detrended in X and Y [33], and the point cloud was interpolated to a 1-cm resolution using kriging with the Golden SURFER program [37]. The procedure is detailed in Neville et al. [12]. The raw, unclipped scan is an ASCII file with coordinates (X, Y, Z) and colour (R, G, B) [34].
3.2. Roughness Evaluation
We used a variety of metrics to assess snow surface roughness [33]. These included 1) the Random Roughness (RR), which is the standard deviation of the detrended surface, 2) the Scale Break (SB) and fractal Dimension (D) from variogram analysis, and 3) the geometric-based aerodynamic roughness length (). Variograms were computed at logarithmic distances for the various snow boards and surfaces. The scale break was estimated from the change in slope and D was computed from the slope of the best fit function up to SB [38]. The geometric value was computed using the Lettau [39] method with the watershed-identification code of Neville et al. [12].
3.3. Sublimation Estimation
One-minute meteorological data was collected for four hours (10:19 to 14:32) at the field site [40]. These data were used with the calculated geometric-based values to compute the bulk-transfer sublimation [41]. Concurrently, evapo-sublimation pans [42] were deployed in the groomed and ungroomed areas to provide field measurements of sublimation-evaporation and melt [28]. These field data are not presented in this current analysis; the focus is evaluating the impact of snow surface geometry on sublimation modeling.
4. Results
The groomed snow was much smoother than the ungroomed snow, especially when sun cups were present (Figure 4 and Figure 5). Grooming provided relatively homogeneous grooves (Figure 5a) and the area between the tracks was essentially flat (Figure 5b). The natural surface had some undulations (Figure 5c) that were enhanced where sun cups formed (Figure 5d).
The four surfaces interpolated from the iPad scans (Figure A1) exhibited distinct spatial variability. Despite these visual differences, the roughness of the iPad scanned surfaces (Figure A1) broadly matched those from the roughness boards (Figure 5). Variograms illustrated the same roughness structure between the same features (Figure 6), although the order of magnitude of the roughness differed between methods (Figure A2).
The scale breaks (SB), or change in slope in the variograms (Figure 6), were in a similar range for the two measurement types (boards versus scans), though they did not match exactly. The fractal dimensions (D) were more similar among the surfaces (Figure 7). Similarly, RR values were almost the same between the roughness boards (Figure 7a) and the iPad scans (Figure 7b).
RR values are largest for the sun cups, and thus most organized, i.e., D was smallest for the longer scales (light green in Figure 7). For the shorter scales (dark green), D was similar with the grooming surface (up to 16 mm which was the period of the groomer teeth; (Figure 3 and Figure 5a), and for the natural and sun cups board and iPad surface. For the latter two, D of about 1.5, for a distance of 7 mm, represented the rounded snow grains. The board parallel to grooming was almost flat and the surface was more random (D was larger).
The default modeling value was 0.24 mm. The geometric-based for groomed surface was almost the same (0.35 mm) (Figure 8). The other values matched the pattern in RR, with low RR values (groomed flat) yielding low values and larger roughness surfaces, i.e., sun cups, being larger ( of 9.5 mm). The variations in influenced the sublimation estimates modelled (Figure 9), illustrating an order magnitude of variation.
5. Discussion
A ski area can have a variety of snow surfaces (Figure 5 and Figure A1) that have a different roughness (Figure 6 and Figure 7). This will impact wind movement across the surface that yields varying aerodynamic roughness lengths (Figure 8). Different values produces a variety of sublimation estimates (Figure 9). Sublimation is an important process for the water balance in mountainous regions [43]. Sublimation and melt-evaporation [28] on ski slopes will influence snow making due to consumptive use [44,45,46]. These processes need to be implemented into models [47], especially due to reduced reliability of snow under climate change [48].
There is consistency in the roughness features across scales, i.e., between the roughness boards and the iPad scanning (Figure 6 and Figure 7). Sun cups had the largest roughness (largest magnitude in the variograms and largest RR) and were most organized (lowest D), while the groomed surface between the tracks was smoothest and most random [33]. The tracked surfaces were similar (Figure 7 and Figure A2). While we did not measure the dust on snow surface with the roughness boards, its roughness was also similar to the natural snow without the sun cups. We measured the natural snow (without sun cups) at two locations in both the north-south and west-east directions. These four variograms were essentially on top of one another, illustrating consistency among the same surface form.
The iPad scanning appears to not be able to resolve the flat snow surface (Figure 6b), especially compared to the roughness board (Figure A2). The iPad flat surface between the tracks (Figure A1b) was essentially random (D = 2.99; Figure 6b and Figure 7b). For the roughness board, there was some order (D = 1.56) at the shorter scale (up to 7 mm) (Figure 5b and Figure 7a), but this was not picked up by the iPad scanning. For the longer scale, there was the same slight order (D = 1.92 and 2.92 for the board and iPad, respectively). The interpolated iPad surface appears to have much roughness (polygons in Figure A1a), but these are all plus or minus zero and less than 5 mm.
The actual process to create the point cloud from the iPad scanning [35,36] is proprietary and more information is needed to determine the accuracy of scanning smooth snow surfaces. It is recommended that this scanning be compared to data collected from terrestrial lidar (e.g., [13]). Here, we used the 3D Scanner App [36]; other software could also be evaluated. However, for the surfaces with more roughness (natural, dust and sun cups), the iPad surfaces ( 1 cm resolutions) seemed to match the roughness boards ( 0.2 mm resolution).
The iPad scanning also produces point cloud of RGB colour returns (Figure 4). These data could be used to estimate albedo in the visible portion of the spectrum [49]. At our study area, this is relevant due to the presence of dust (Figure 1) which lowers albedo, increases snow melt [50], and changes snow roughness [9,15].
6. Conclusions
The snowpack at a ski resort can have a variety of surfaces. At the Sierra Nevada ski area, investigated here, we saw two natural surfaces with the presence of dust and sun cups, and two groomed surfaces with rills from the tracks and a flatter surface between. The sun cup surface had the most roughness, followed by the natural and dust covered surfaces. Both saw similar roughness values with the finer resolution 2-D roughness board and the coarser resolution 3-D iPad scanning. The tracked 3-D surface was similar to the board, while the flat surface was less similar among the methods. This was likely due to the iPad scanning not resolving features in the flat surface.
The differences in roughness among the surfaces was seen in the geometric-based values that varied by more than an order of magnitude. These were used to model sublimation, yielding large differences. These differences in surface roughness need to be considered when modelling the snowpack across ski resorts, and any snow covered area where the surface varies.
Author Contributions
Conceptualization, S.R.F. and J.H.; methodology, S.R.F., J.H. and J.E.S.; software, S.R.F.; validation, S.R.F., J.H. and J.E.S.; formal analysis, S.R.F., J.H. and J.E.S.; investigation, S.R.F, J.H.; resources, S.R.F. and J.H.; data curation, S.R.F. and J.H.; writing—original draft preparation, S.R.F.; writing—review and editing, S.R.F., J.H. and J.E.S.; visualization, S.R.F.; project administration, J.H. and S.R.F.; funding acquisition, S.R.F. and J.H. All authors have read and agreed to the published version of the manuscript.
Funding
This work was supported by Project SUBLIMA, (UGR OTRI-6429) University of Granada-CETURSA Sierra Nevada S.A. SRF was supported by the Fulbright Global Scholar program during this research.
Institutional Review Board Statement
Not applicable.
Informed Consent Statement
Not applicable.
Data Availability Statement
The surface data are available at [34]. The meteorological data are in process of being published.
Acknowledgments
We thank the Sierra Nevada Ski Area for their support.
Conflicts of Interest
The authors declare no conflicts of interest. The funders had no role in the design of the study; in the collection, analyses, or interpretation of data; in the writing of the manuscript; or in the decision to publish the results.
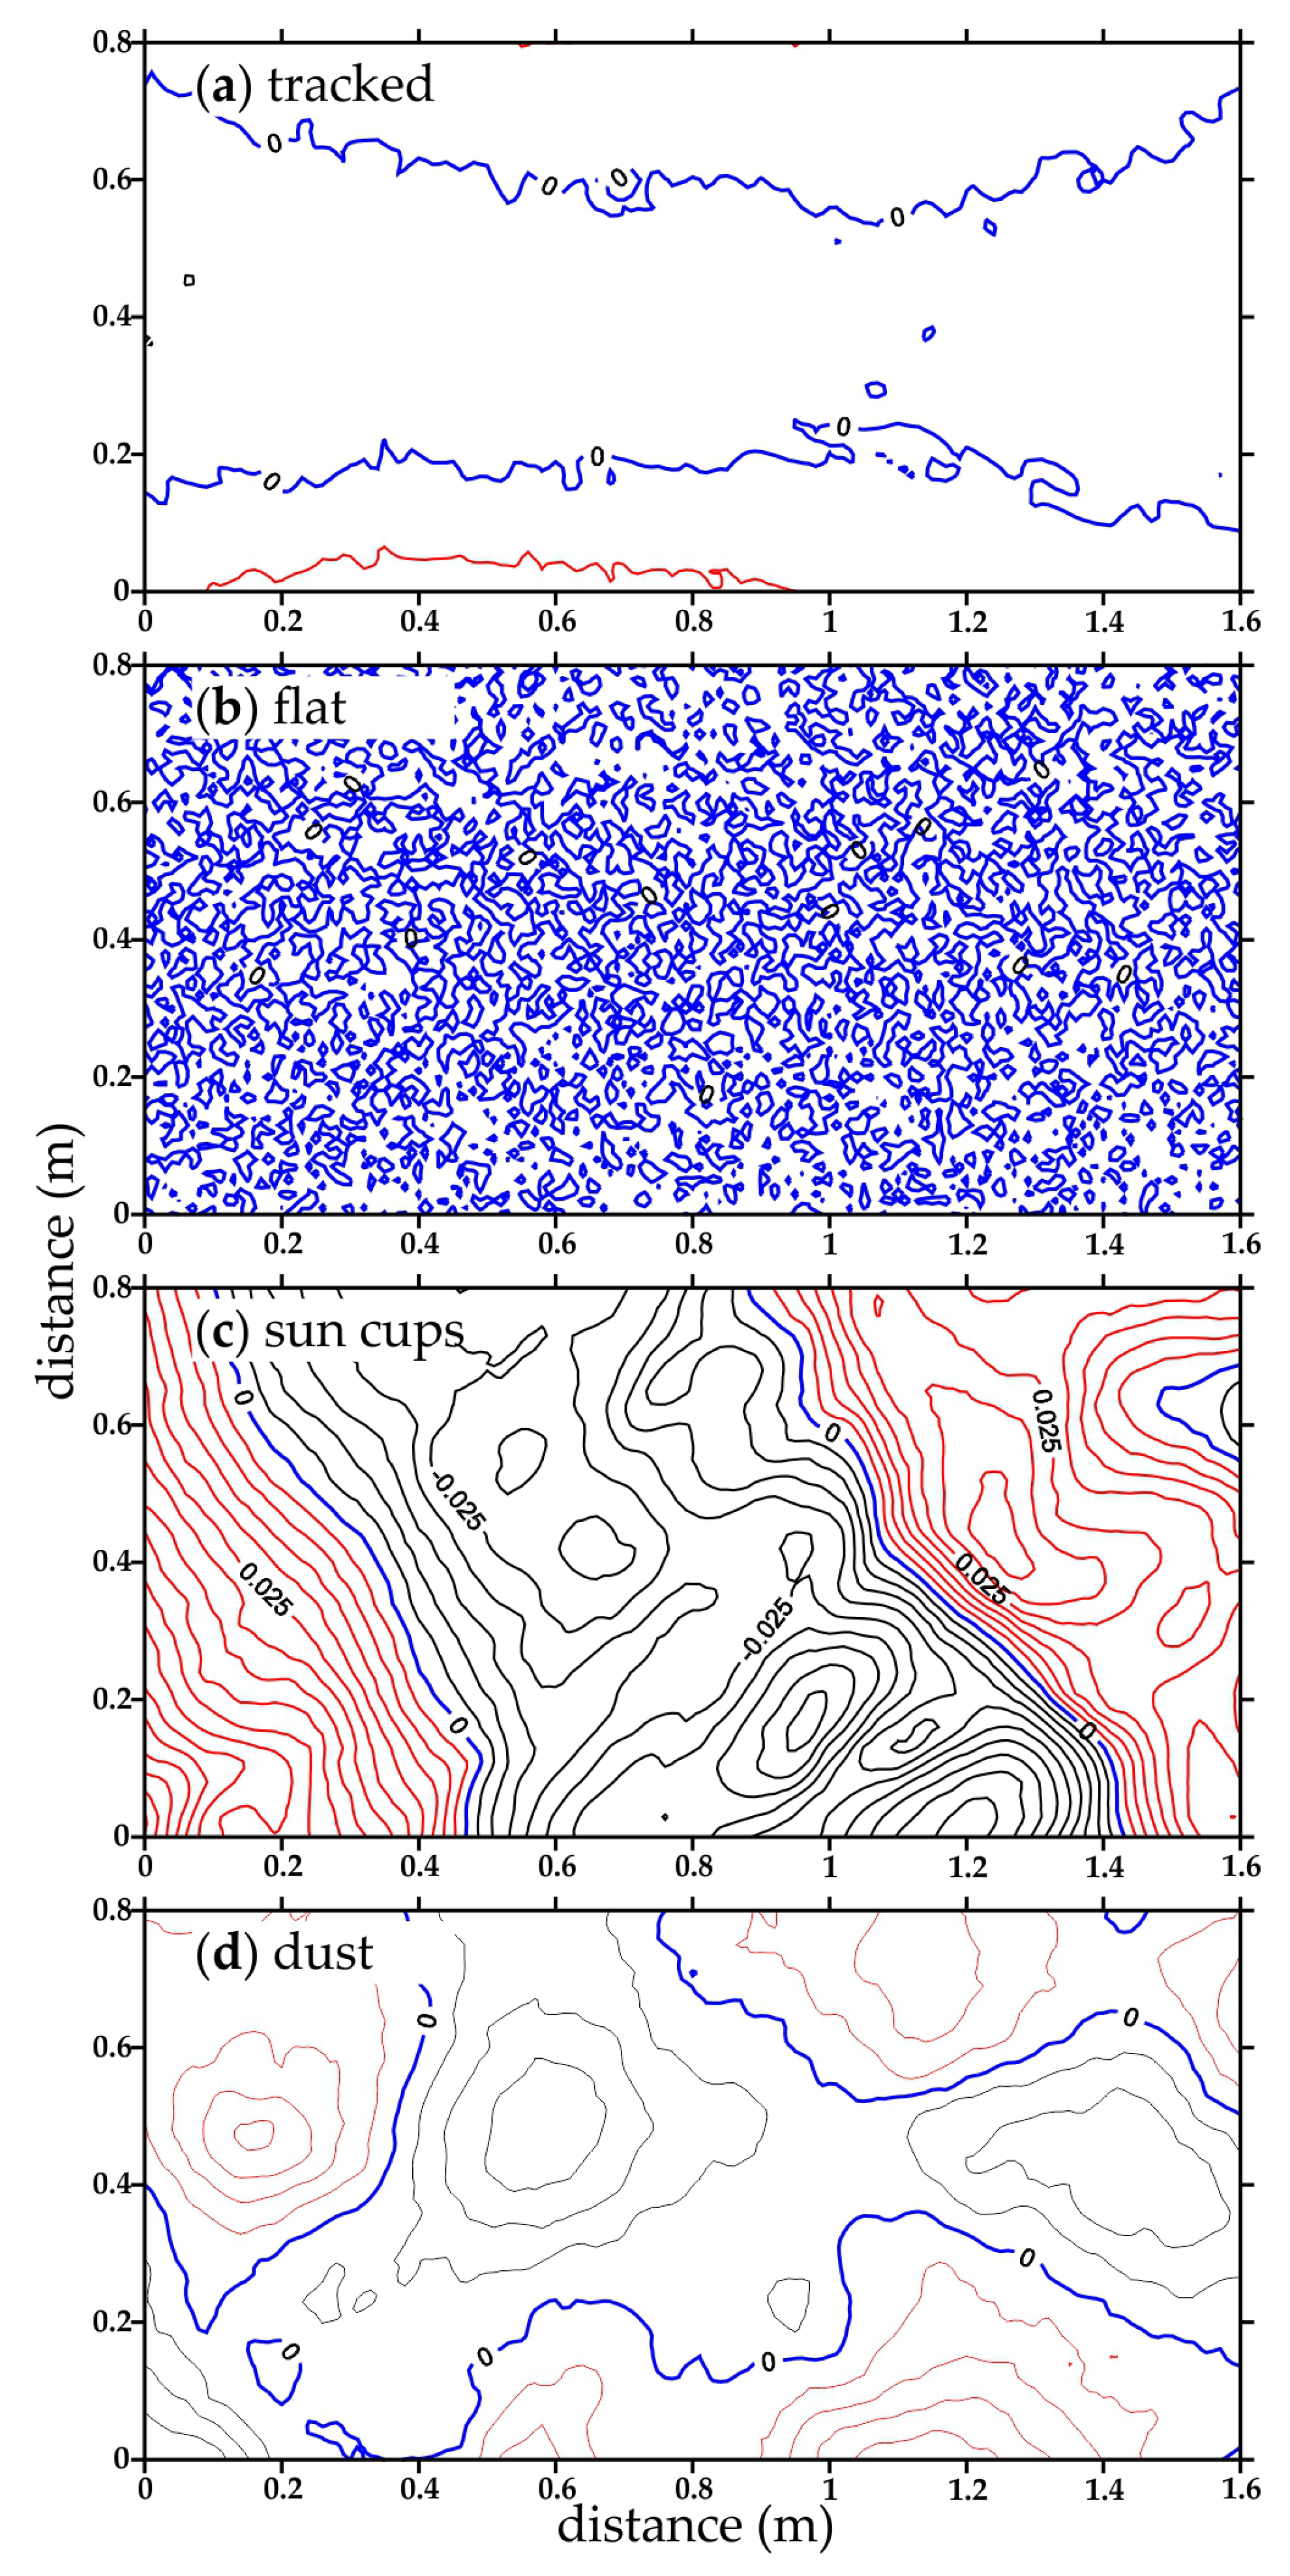
Appendix A. Interpolated iPad Scan Surfaces
The appendix is presents the clipped iPad scanned surfaces (Figure 4) were interpolated to an area of 0.8 x 1.6 m (Figure A1).
The iPad-derived tracked surface (Figure A1a) did not show the consistent rills as the roughness board interface (Figure 3 and Figure 5a).
Figure A1.
The four 1-cm resolution interpolated snow surfaces from the iPad scanning illustrated with contour intervals of 0.005 meters (5 mm) and labelled at 0.025 m intervals for a) tracked surface, (b) flat surface between tracks, (c) sun cups, and (d) dust on snow. The data were detrended prior to interpolating. The zero line is presented in blue, with negative contours in black and positive in red.
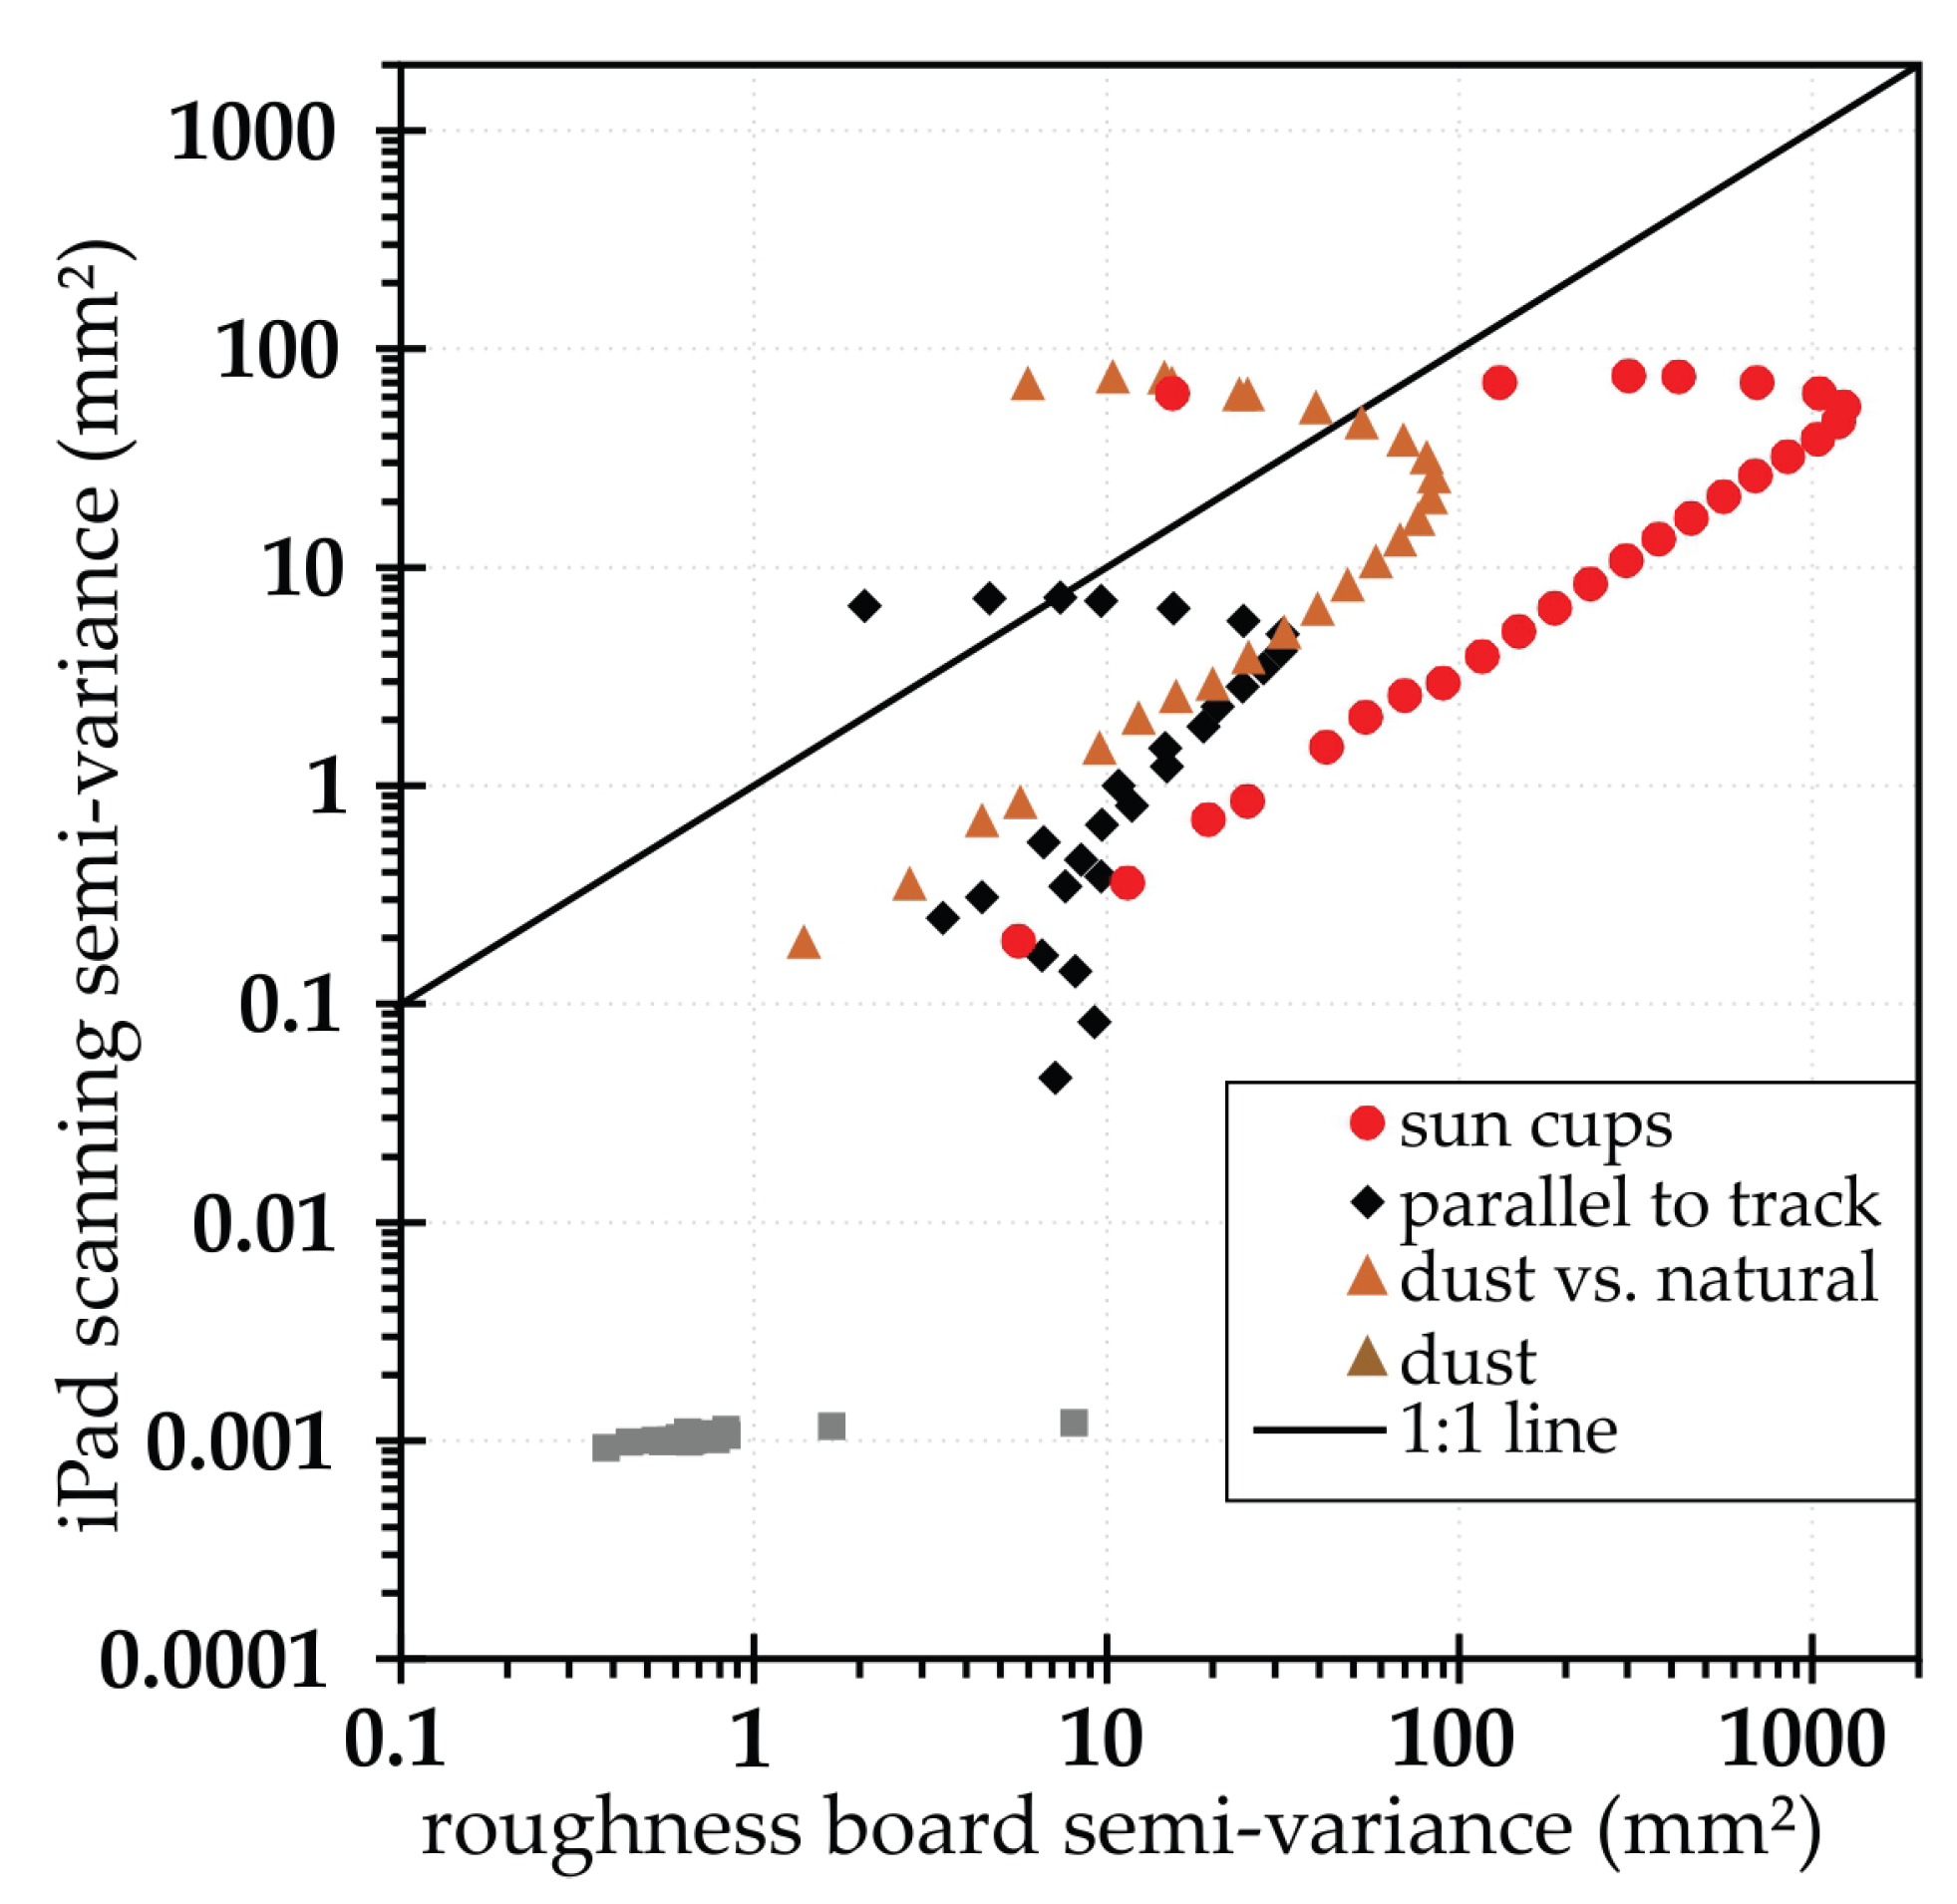
Appendix B. Variograms over Scales and Dimensions
This Appendix presents a comparison of the semi-variance for the four overlapping iPad scanning surfaces versus the roughness boards curves (Figure A2).
Figure A2.
Comparison of the semi-variance for the iPad scanning surfaces versus the roughness board curves.
Figure A2.
Comparison of the semi-variance for the iPad scanning surfaces versus the roughness board curves.
References
- Sverdrup, H.U. Scientific Results of the Norwegian-Swedish Spitsbergen Expedition in 1934. Part VI-VII. Geografiska Annaler 1936, 18, 34–73. [Google Scholar]
- Oke, T.R. 1987. Boundary Layer Climates (2nd ed.). Routledge, 464pp.
- Andreas, E.L. A theory for the scalar roughness and the scalar transfer coefficients over snow and sea ice. Boundary-Layer Meteorology 1987, 38(1), 159-184.
- Anderson, E.A. Development and testing of snow pack energy balance equations. em Water Resources Research 1968, 4(1), 19–37. [Google Scholar]
- Marks, D.; Dozier, J. Climate and energy exchange at the snow surface in the alpine region of the Sierra Nevada: 2. Snow cover energy balance. Water Resources Research 1992, 28(11), 3043–3054. [Google Scholar]
- Van den Broeke, M. R.; Smeets, P. C. J. P.; van de Wal, R. S. W. The seasonal cycle and interannual variability of surface energy balance and melt in the ablation zone of the west Greenland ice sheet. The Cryosphere 2011, 5(2), 377–390. [Google Scholar] [CrossRef]
- Wang, W.; Zender, C. S.; As, D. V.; Fausto, R. S.; Laffin, M. K. Greenland surface melt dominated by solar and sensible heating. Geophysical Research Letters 2021, 48(7), 1–16. [Google Scholar] [CrossRef]
- UCAR. Community Land Model (CLM). Available online: https://www.cesm.ucar.edu/models/clm (accessed on 21 October 2025).
- Fassnacht, S.R.; et al. Changes in the surface roughness of snow from millimetre to metre scales. Ecological Complexity 2009, 6(3), 221–229. [Google Scholar] [CrossRef]
- Van Tiggelen, M.; Smeets, P. C.; Reijmer, C. H.; Van den Broeke, M. R. A vertical propeller eddy-covariance method and its application to long-term monitoring of surface turbulent fluxes on the Greenland ice sheet. Boundary-Layer Meteorology 2020, 176(3), 441–463. [Google Scholar] [CrossRef]
- Sanow, J.E.; Fassnacht, S.R.; Suzuki, K. How does a dynamic surface roughness affect snowpack modeling? Polar Science 2024, 41, 101110. [Google Scholar] [CrossRef]
- Neville, R.A.; et al. A New Formulation and Code to Compute Aerodynamic Roughness Length for Gridded Geometry – Tested on Lidar-derived Snow Surfaces. Remote Sensing 2025, 17(12), 1984. [Google Scholar] [CrossRef]
- Sanow, J.E.; Fassnacht, S.R. Let Us Change the Aerodynamic Roughness Length as a Function of Snow Depth. Climate 2025, 13(11), 226. [Google Scholar] [CrossRef]
- Mitchell, K. A.; Tiedje, T. Growth and fluctuations of suncups on alpine snowpacks. Journal of Geophysical Research 2010, 115, F04039. [Google Scholar] [CrossRef]
- Fassnacht, S.R.; Toro Velasco, M.; Meiman, P.J.; Whitt, Z.C. A Local Aeolian Influence in the Surface Roughness of Melting Snow, Byers Peninsula, Antarctica. Hydrological Processes 2010, 24(14), 2007–2013. [Google Scholar] [CrossRef]
- Morin, S.; et al. Simulated hydrological effects of grooming and snowmaking in a ski resort on the local water balance. Hydrology and Earth System Sciences 2023, 27, 4257–4277. [Google Scholar] [CrossRef]
- Camarero, J. J.; Gazol, A.; Tamudo, E.; Moiseev, P. A.; Colangelo, M.; Valeriano, C. Local and regional climatic constraints of shrub and tree growth near the treeline. Dendrochronologia 2024, 88, 126256. [Google Scholar]
- Flynn, H.; Camarero, J. J.; Sanmiguel-Vallelado, A.; Rojas Heredia, F.; Domínguez Aguilar, P.; Revuelto, J.; López-Moreno, J. I. A shift in circadian stem increment patterns in a Pyrenean alpine treeline precedes spring growth after snow melting. Biogeosciences 2025, 22(4), 1135–1147. [Google Scholar]
- Grabherr, G.; Nagy, L.; Thompson, D. B. A. An outline of Europe’s alpine areas. In Alpine biodiversity in Europe 2003 (pp. 3–12). Berlin, Heidelberg: Springer Berlin Heidelberg.
- Polo, M.J.; Herrero, J.; Millares, A.; Pimentel, R.; Moñino, A.; Pérez-Palazón, M. J.; … ; Losada, M. A. (2022). Snow Dynamics, Hydrology, and Erosion. In Zamora, R.; Oliva, M., eds. The Landscape of the Sierra Nevada 2022. Springer, Cham.
- Gómez-Ortiz, A.; Oliva, M.; Salvà-Catarineu, M.; Salvador-Franch, F. The environmental protection of landscapes in the high semiarid Mediterranean mountain of Sierra Nevada National Park (Spain): Historical evolution and future perspectives. Applied Geography 2013, 42, 227–239. [Google Scholar] [CrossRef]
- Campos Rodrigues, L.; Freire-González, J.; González Puig, A.; Puig-Ventosa, I. Climate Change Adaptation of Alpine Ski Tourism in Spain. Climate 2018, 6, 29. [Google Scholar] [CrossRef]
- Pardo-Igúzquiza, E.; Martos-Rosillo, S.; Jódar, J.; Dowd, P.A. The Spatio-Temporal Dynamics of Water Resources (Rainfall and Snow) in the Sierra Nevada Mountain Range (Southern Spain). Resources 2024, 13, 42. [Google Scholar] [CrossRef]
- Molero, J.; Pérez-Raya, F. La Flora de Sierra Nevada. Avance sobre el catálogo florístico nevadense 1987, Universidad de Granada: Granada, Spain.
- Lorite, J.; Molina-Morales, M.; Cañadas, E. M., Ballesteros, M.; Peñas, J. Evaluating a vegetation-recovery plan in Mediterranean alpine ski slopes: A chronosequence-based study in Sierra Nevada (SE Spain). Landscape and Urban Planning 2010, 97(2), 92-97.
- Blanca, G.; López Onieva, M.R.; Lorite, J.; Martínez Lirola, M.J.; Molero, J.; et al. Flora amenazada y endémica de Sierra Nevada. Universidad de Granada 2001, Consejería de Medio Ambiente, Junta de Andalucía.
- Collados-Lara, A.; Pardo-Igúzquiza, E.; Pulido-Velazquez, D.; Jiménez-Sánchez, J. Precipitation fields in an alpine Mediterranean catchment: Inversion of precipitation gradient with elevation or undercatch of snowfall? International Journal Of Climatology 2018, 38(9), 3565–3578. [Google Scholar]
- Herrero, J.; Polo, M.J. Evaposublimation from the snow in the Mediterranean mountains of Sierra Nevada (Spain). The Cryosphere 2016, 10, 2981–2998. [Google Scholar] [CrossRef]
- Collados-Lara, A. J.; Pardo-Igúzquiza, E.; Pulido-Velazquez, D. Assessing the impact of climate change–and its uncertainty–on snow cover areas by using cellular automata models and stochastic weather generators. Science of the Total Environment 2021, 788, 147776. [Google Scholar]
- Rixen, C.; Haeberli, W.; Stoeckli, V. Ground temperatures under ski pistes with artificial and natural snow. Arctic, Antarctic, and Alpine Research, 2004; 36, 4, 419–427. [Google Scholar] [CrossRef]
- Yoshizawa, N.; Cognard, J.; Berard-Chenu, L.; Bourdeau, P. Off-Piste Skiing Demand Patterns and Climate Change Adaptation Pathways in La Grave, France. Mountain Research and Development 2025, 45(2), R9–R18. [Google Scholar]
- Samsung. Galaxy A53. Available online:.
- Fassnacht, S.R.; et al. Metrics for assessing snow surface roughness from digital imagery. Water Resources Research 2009, 45, W00D31. [Google Scholar] [CrossRef]
- Fassnacht, S.R.; Herrero, J. Sierra Nevada Spain Snow Surface Data at the Ski Area 2024. Pangaea 2025. [Google Scholar]
- Apple. iPad Pro. Available online: https://www.apple.com/ipad-pro/ (accessed on day month year).
- labs.claan.com. 3D Scanner App. Available online: https://3dscannerapp.com/.
- Golden Software. Available online: https://www.goldensoftware.com/products/surfer/.
- Deems, J.S.; et al. Fractal distribution of snow depth from LiDAR data. Journal of Hydrometeorology 2006, 7(2), 285–297. [Google Scholar] [CrossRef]
- Lettau, H. Note on Aerodynamic Roughness-Parameter Estimation on the Basis of Roughness-Element Description. Journal of Applied Meteorology 1969, 8, 828–832. [Google Scholar]
- Herrero, J. Sierra Nevada Ski Area Sublimation Experiment 1-minute Meteorological Data. Pangaea 2025. [Google Scholar]
- Reba, M.L.; Pomeroy, J.; Marks, D.; Link, T.E. Estimating surface sublimation losses from snowpacks in a mountain catchment using eddy covariance and turbulent transfer calculations. Hydrol. Process. 2012, 26, 3699–3711. [Google Scholar]
- Beaty, C. B. Sublimation or melting: observations from the White Mountains, California and Nevada, USA. Journal of Glaciology 1975, 14(71), 275–286. [Google Scholar]
- Strasser, U.; Bernhardt, M.; Weber, M.; Liston, G. E.; Mauser, W. Is snow sublimation important in the alpine water balance? The Cryosphere 2008, 2(1), 53–66. [Google Scholar]
- Smart, A. W.; Fleming, W. M. Consumptive Water Use in Artificial Snowmaking Santa Fe Ski Area. New Mexico (No. 45-46), 1985, New Mexico State Engineer Office; Albuquerque NM.
- Eisel, L. M.; Mills, K. D.; Leaf, C. F. ESTIMATED CONSUMPTIVE LOSS FROM MAN-MADE SNOW. Journal of the American Water Resources Association 1988, 24(4), 815–820. [Google Scholar]
- Eisel, L. M.; Bradley, K. M.; Leaf, C. F. ESTIMATED RUNOFF FROM MAN-MADE SNOW. Journal of the American Water Resources Association 1990, 26(3), 519–526. [Google Scholar]
- Herrero, J. et al. An energy balance snowmelt model in a Mediterranean site. Journal of Hydrology, 2010; 371, 1-4, 98–107. [Google Scholar] [CrossRef]
- Spandre, P.; François, H.; Verfaillie, D.; Pons, M.; Vernay, M.; Lafaysse, M.; George, E.; Morin, S. Winter tourism under climate change in the Pyrenees and the French Alps: relevance of snowmaking as a technical adaptation. The Cryosphere, 2019; 13, 4, 1325–1347. [Google Scholar]
- Gaillard, M.; Vionnet, V.; Lafaysse, M.; Dumont, M.; Ginous, P. Improving large-scale snow albedo modeling using a climatology of light-absorbing particle deposition. The Cryosphere 2025, 19(2), 769–792. [Google Scholar] [CrossRef]
- Miller, G.; Jennifer, D. Miller, G.; Jennifer, D. Big Takeover. Tracks 11 on Bad Brains 1982, ROIR: New York, NY.
Figure 1.
Photograph of the study area illustrating sun cups, groomed (tracked and between tracks or untracked), and dust at the surface (taken by Steven Fassnacht).
Figure 1.
Photograph of the study area illustrating sun cups, groomed (tracked and between tracks or untracked), and dust at the surface (taken by Steven Fassnacht).
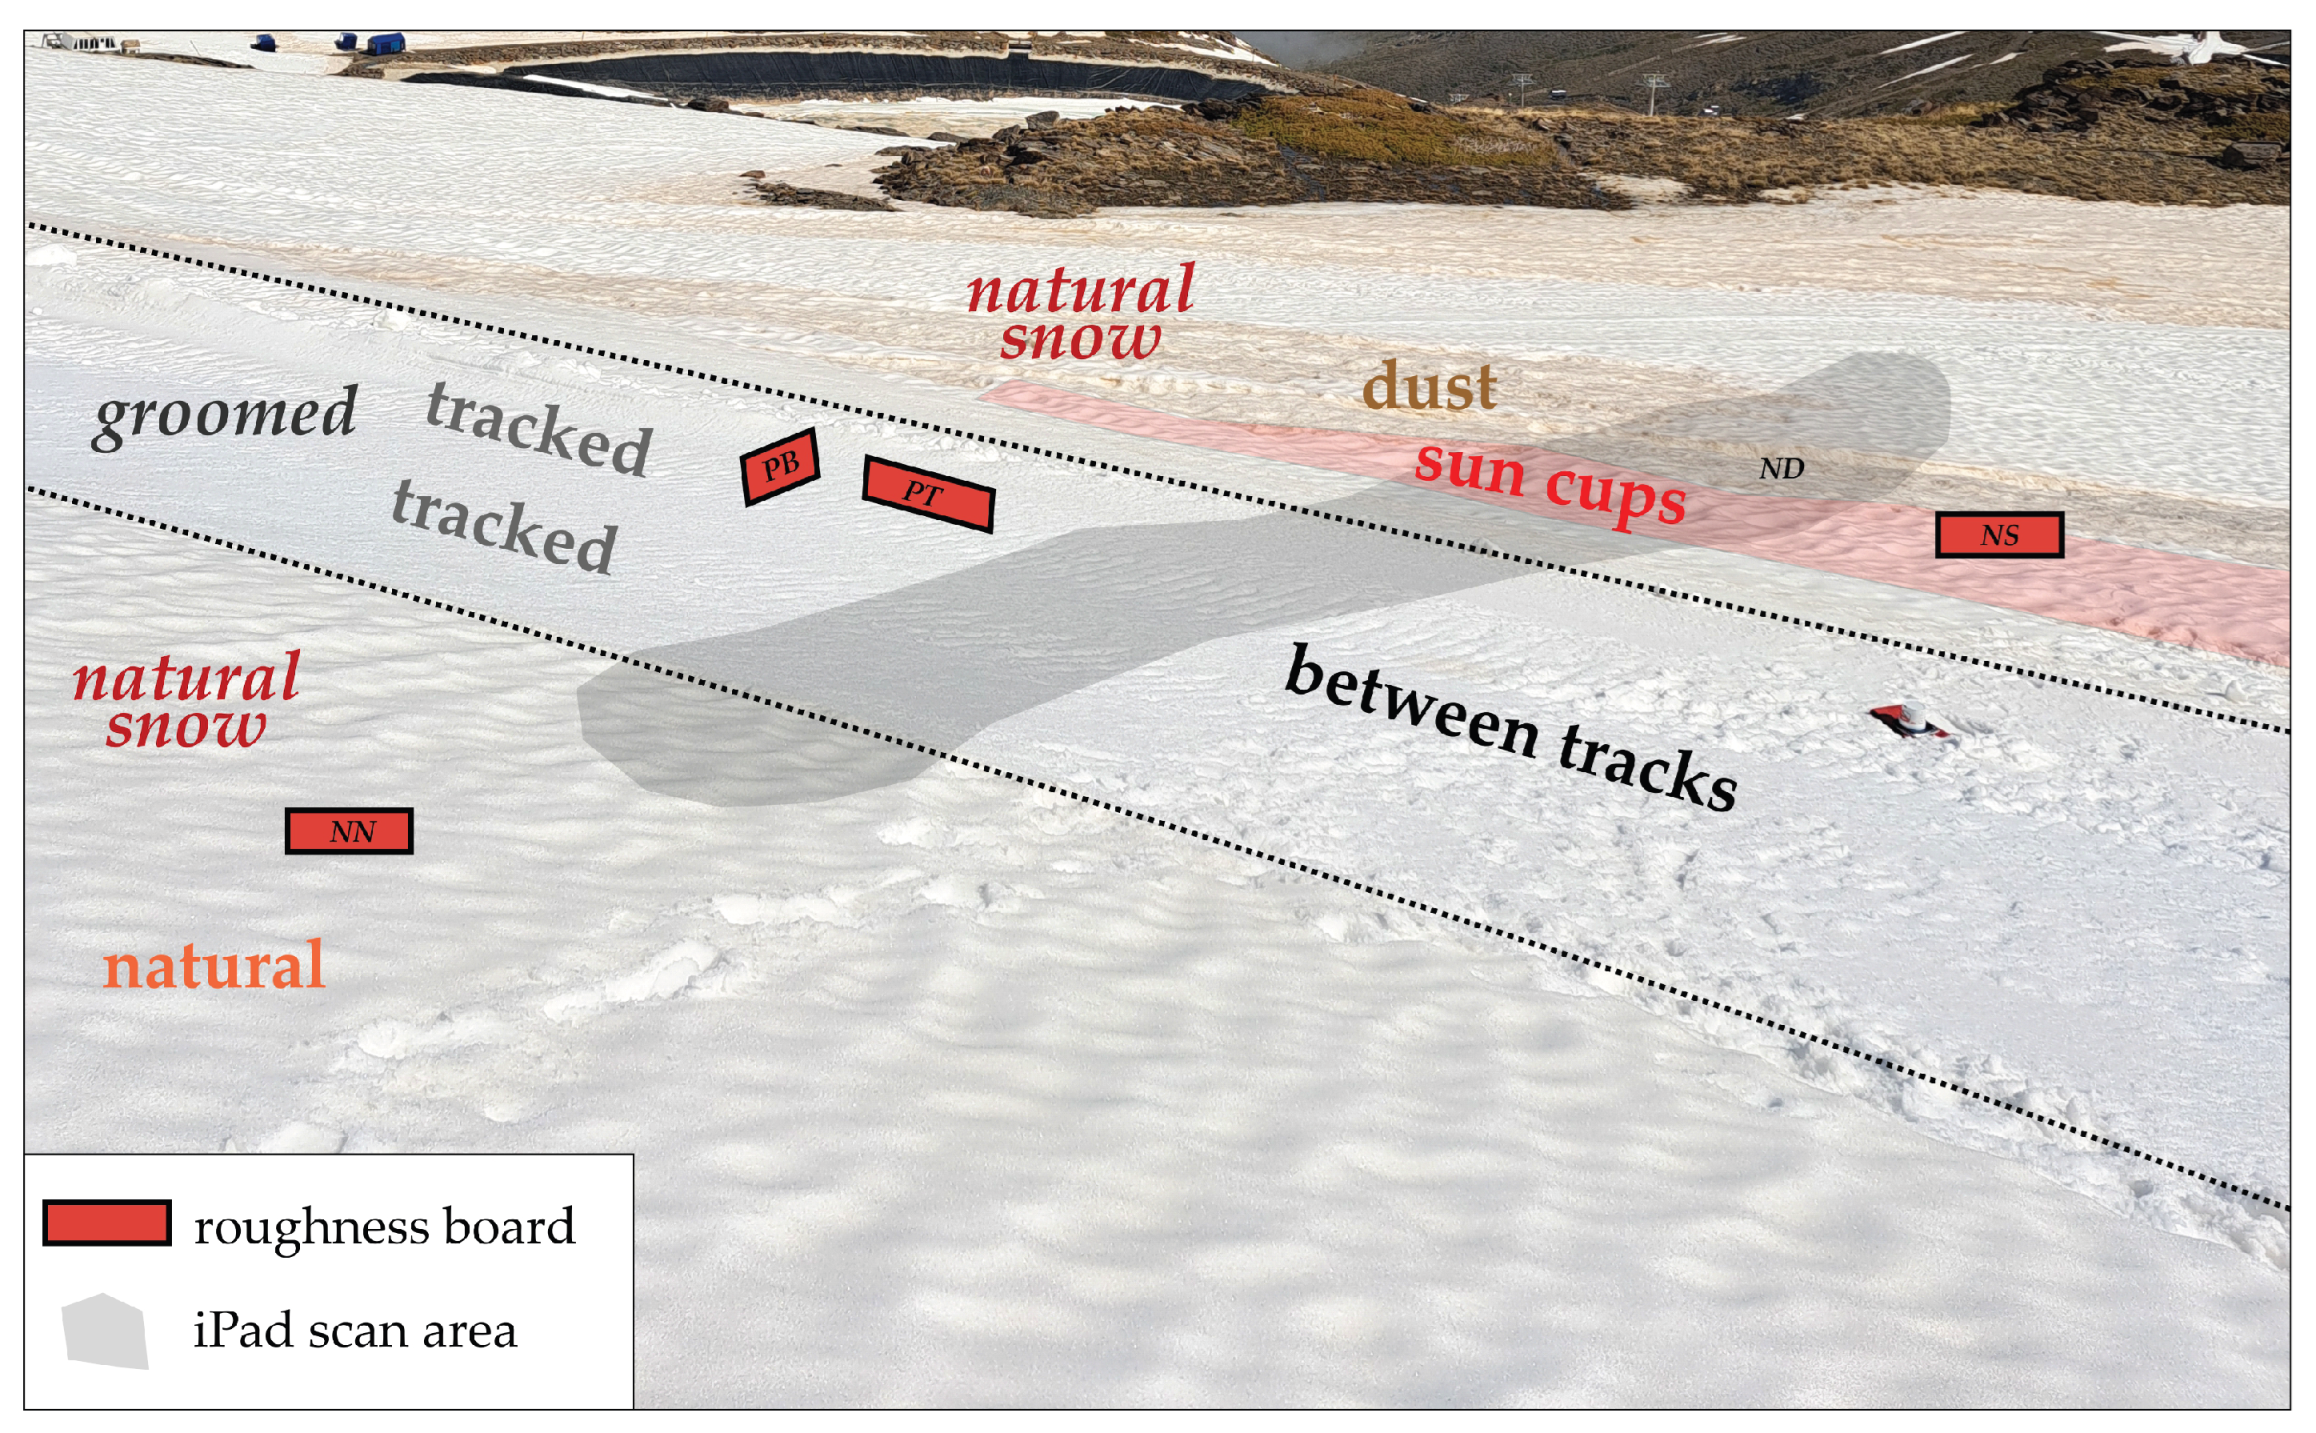
Figure 2.
Location map (a) Spain, (b) Sierra Nevada Ski Resort, and (c) field site. Maps from Google Maps.
Figure 2.
Location map (a) Spain, (b) Sierra Nevada Ski Resort, and (c) field site. Maps from Google Maps.
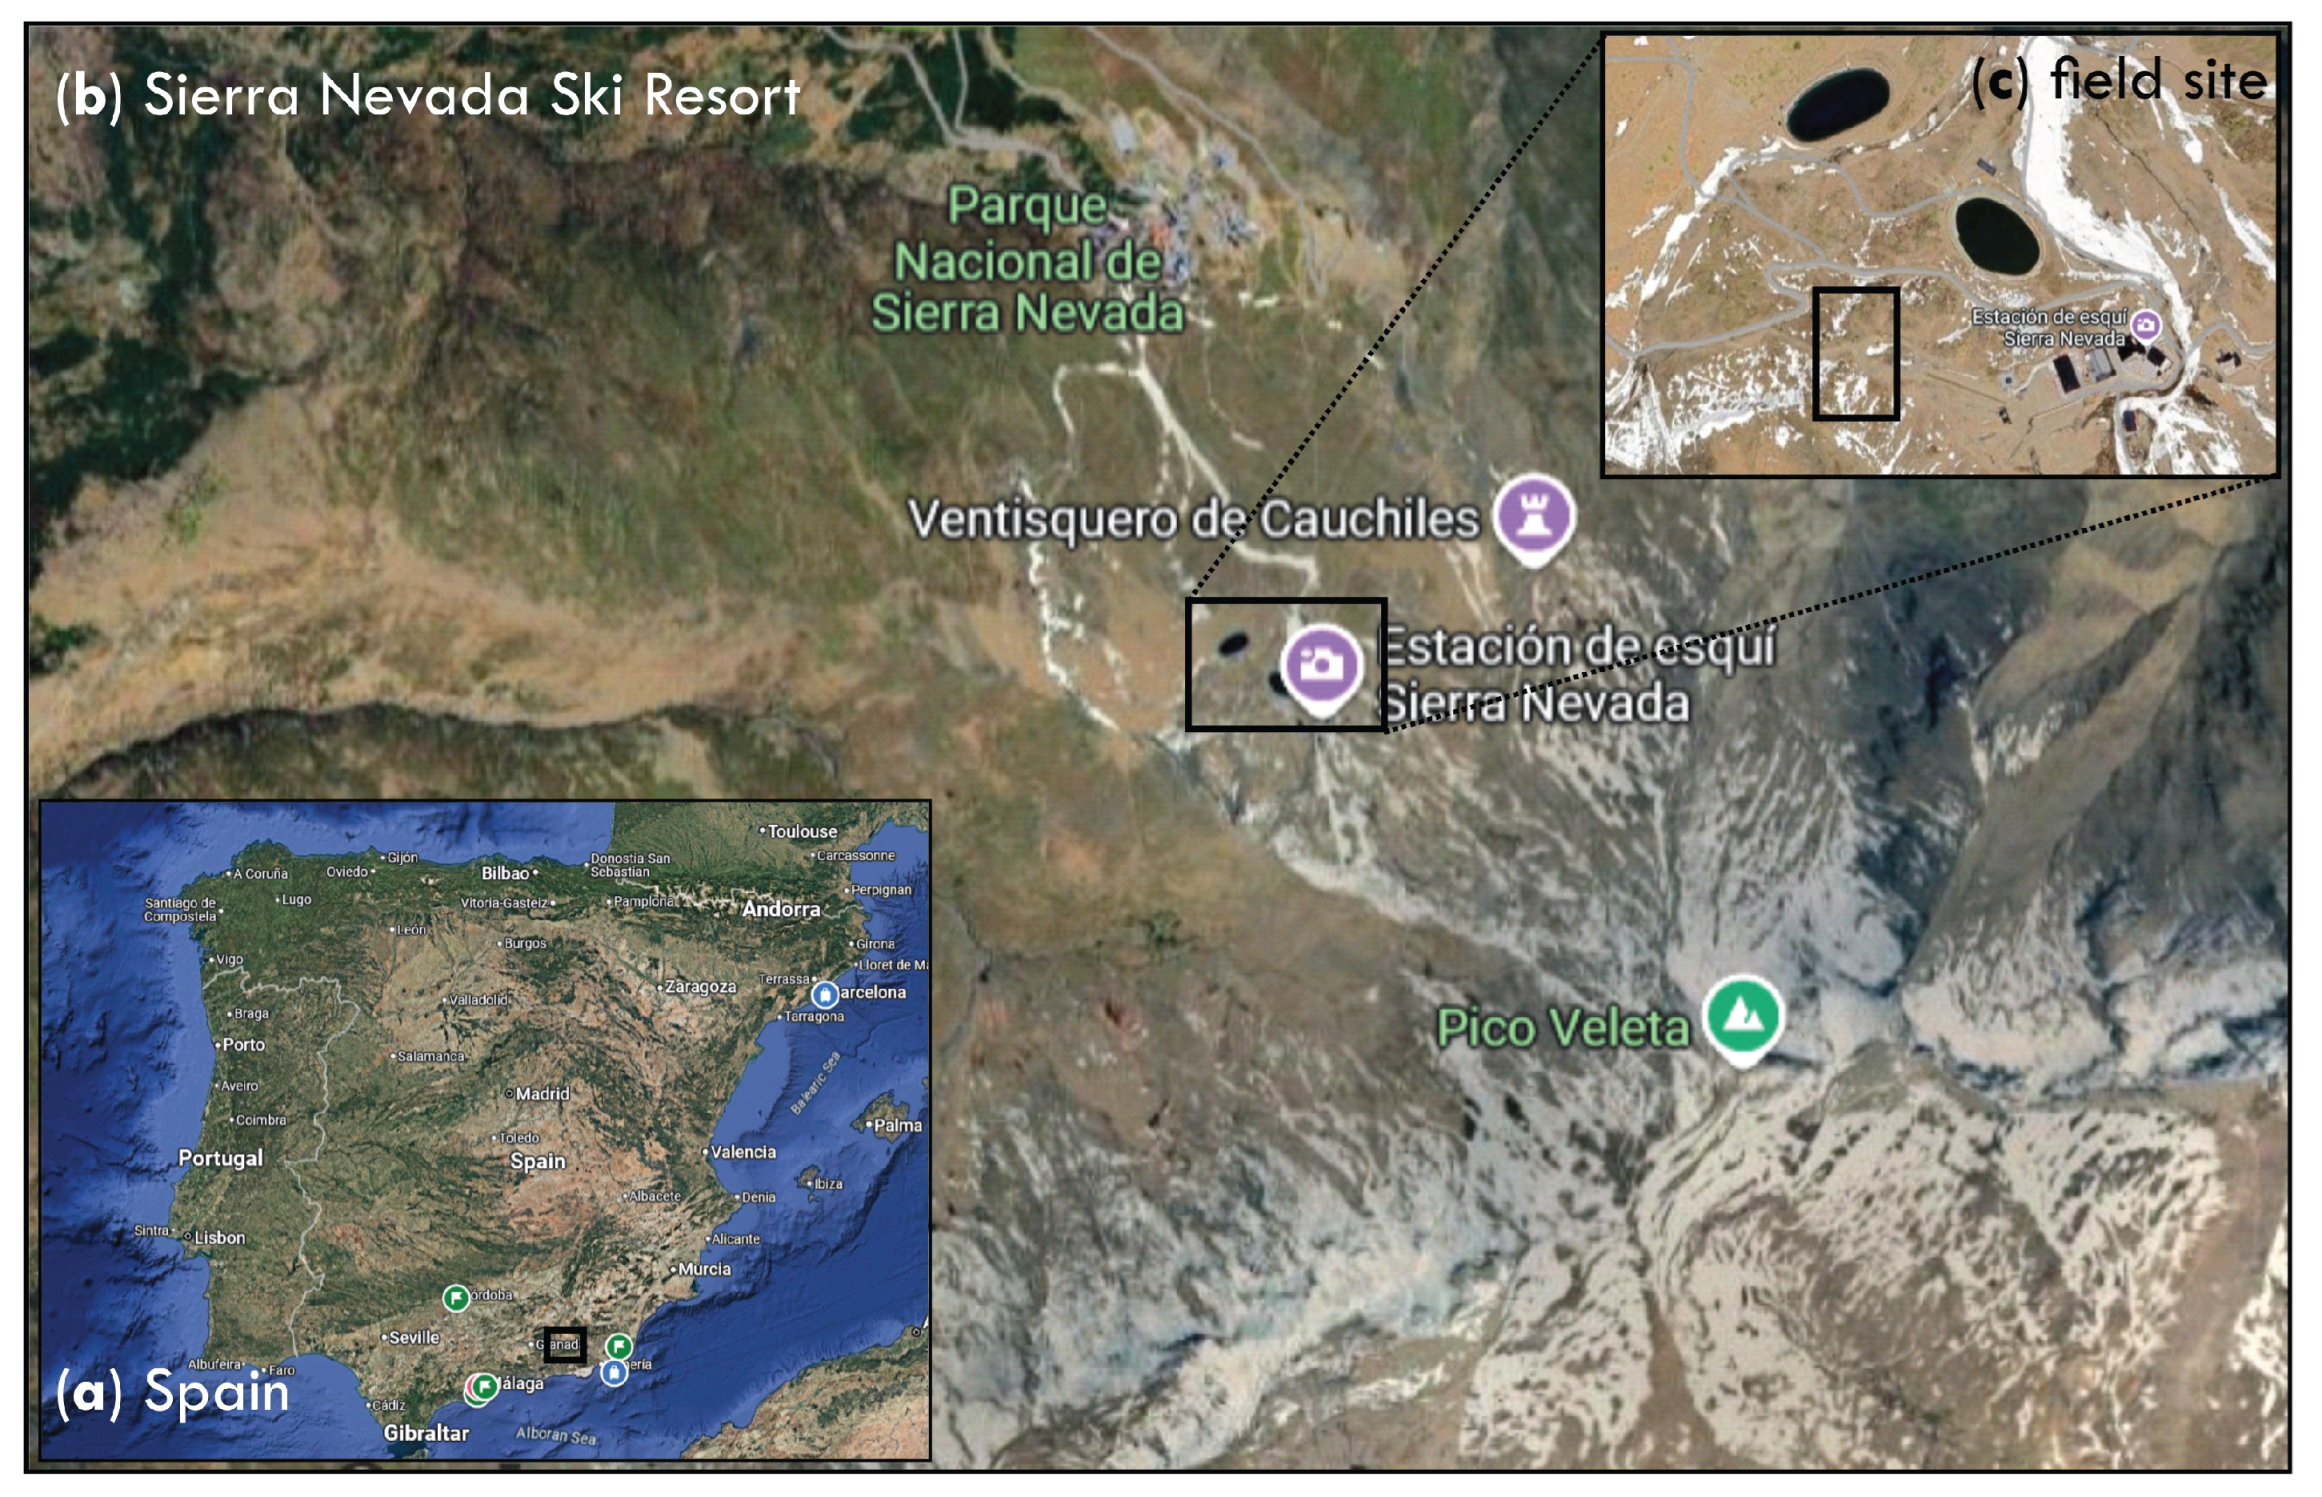
Figure 3.
(a) Groomed snow board photo, (b) clipped green band image, (c) digital number (DN) distribution (board DN < 100), and (d) detrended snow surface.
Figure 3.
(a) Groomed snow board photo, (b) clipped green band image, (c) digital number (DN) distribution (board DN < 100), and (d) detrended snow surface.
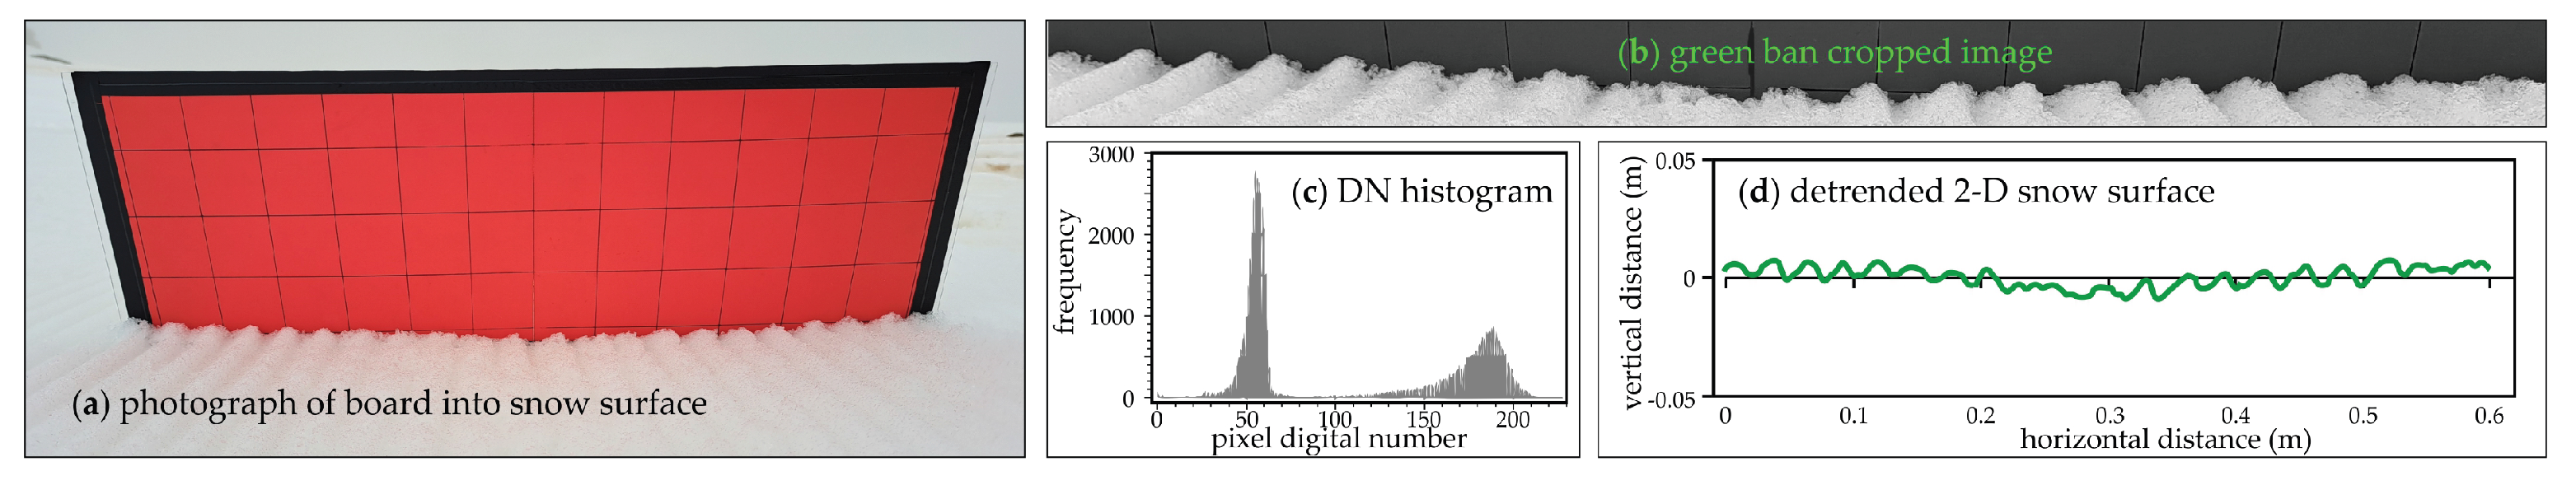
Figure 4.
iPad snow surface scan RGB photograph illustrating natural snow (left) with dust on surface and sun cups, and machine groomed areas (right) as tracked and between tracks.
Figure 4.
iPad snow surface scan RGB photograph illustrating natural snow (left) with dust on surface and sun cups, and machine groomed areas (right) as tracked and between tracks.
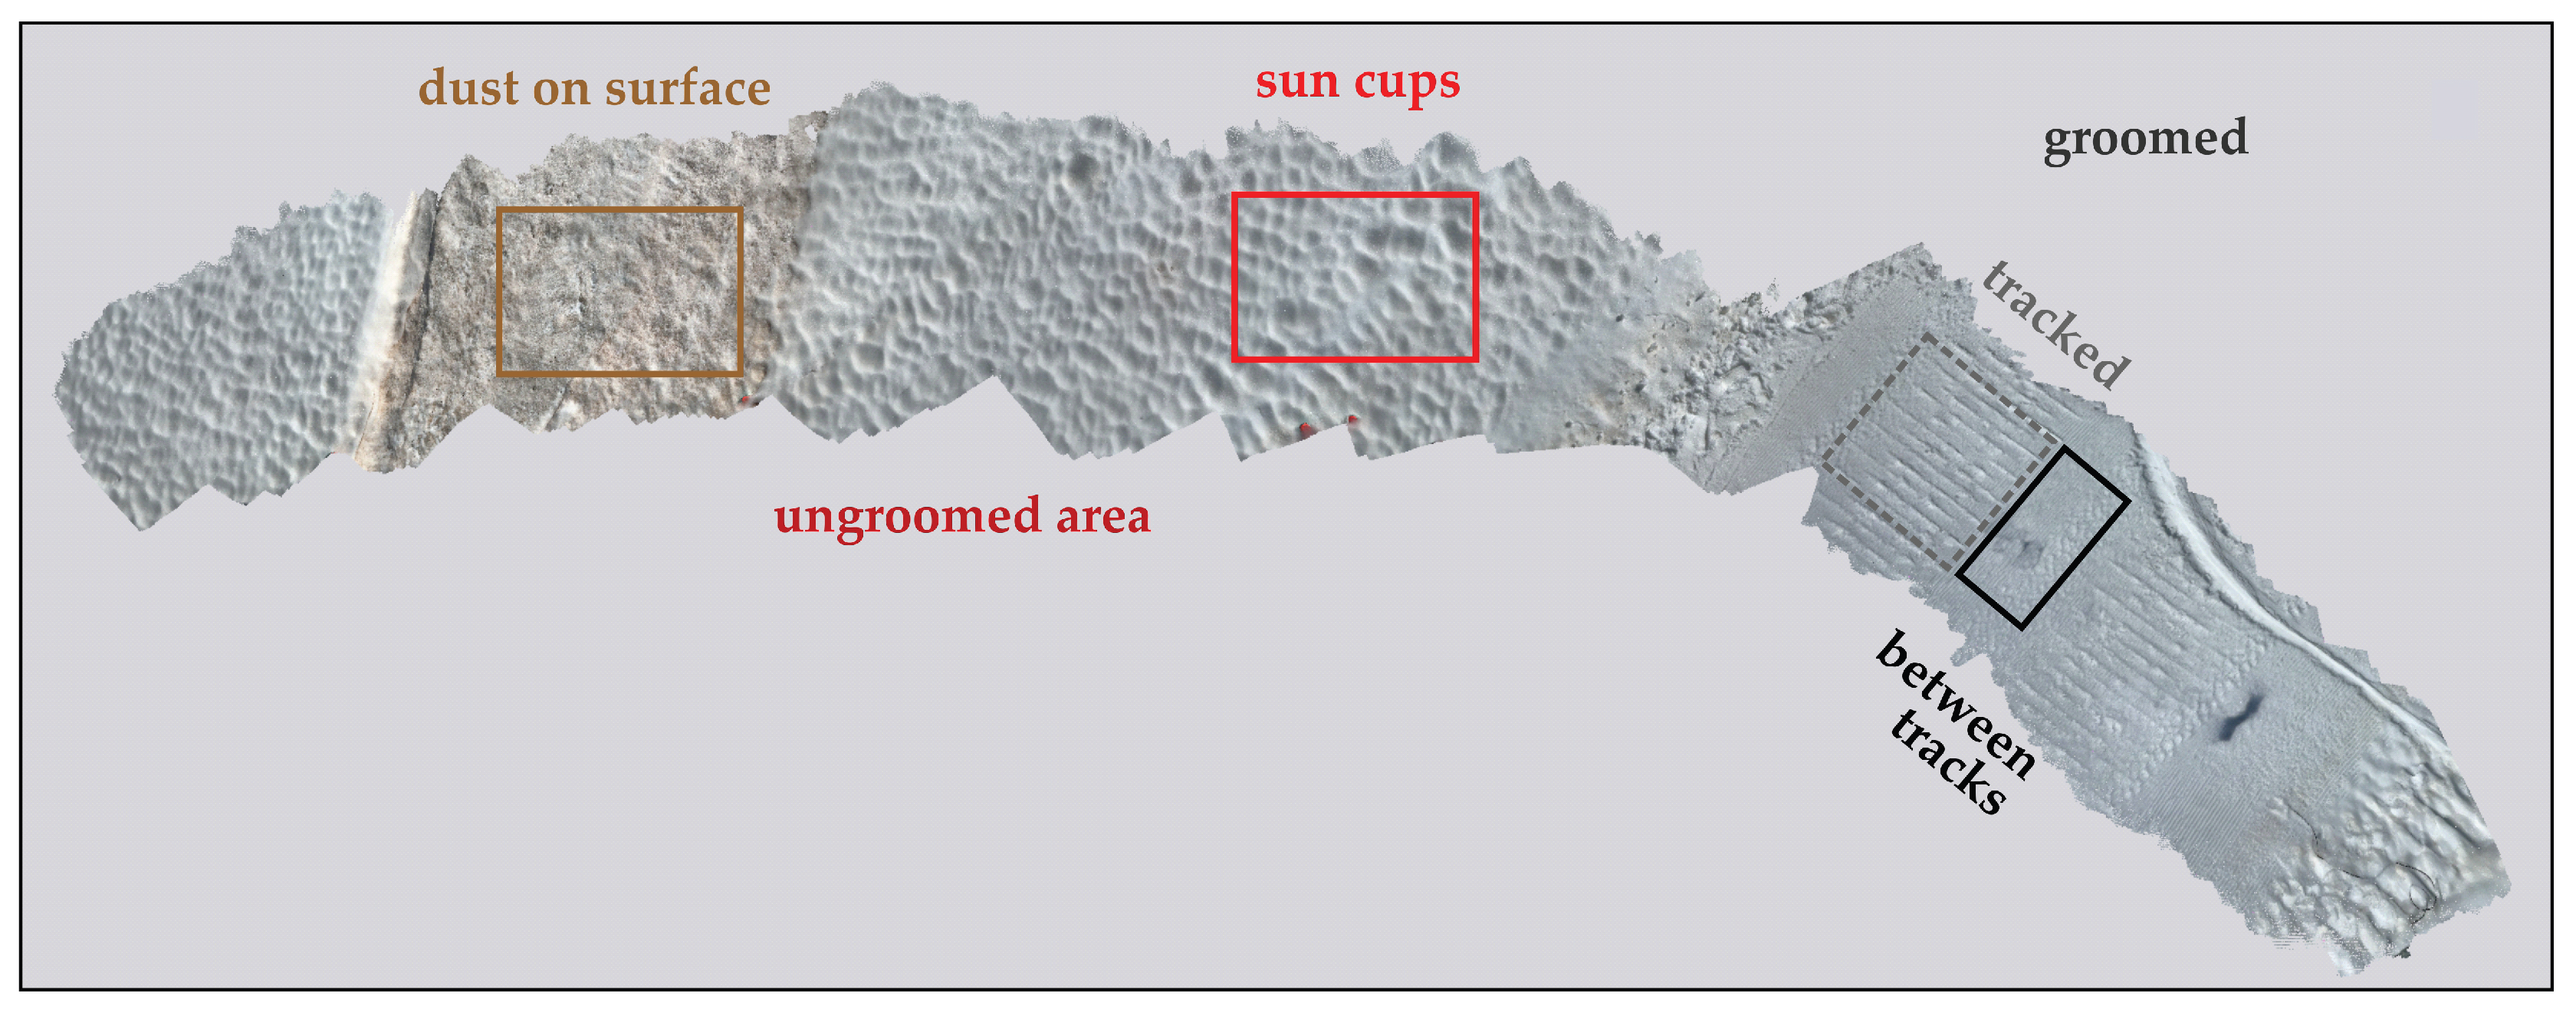
Figure 5.
Snow board geometry for the groomed surface (parallel vs. perpendicular to grooming), natural snow, and in the presence of sun cups.
Figure 5.
Snow board geometry for the groomed surface (parallel vs. perpendicular to grooming), natural snow, and in the presence of sun cups.
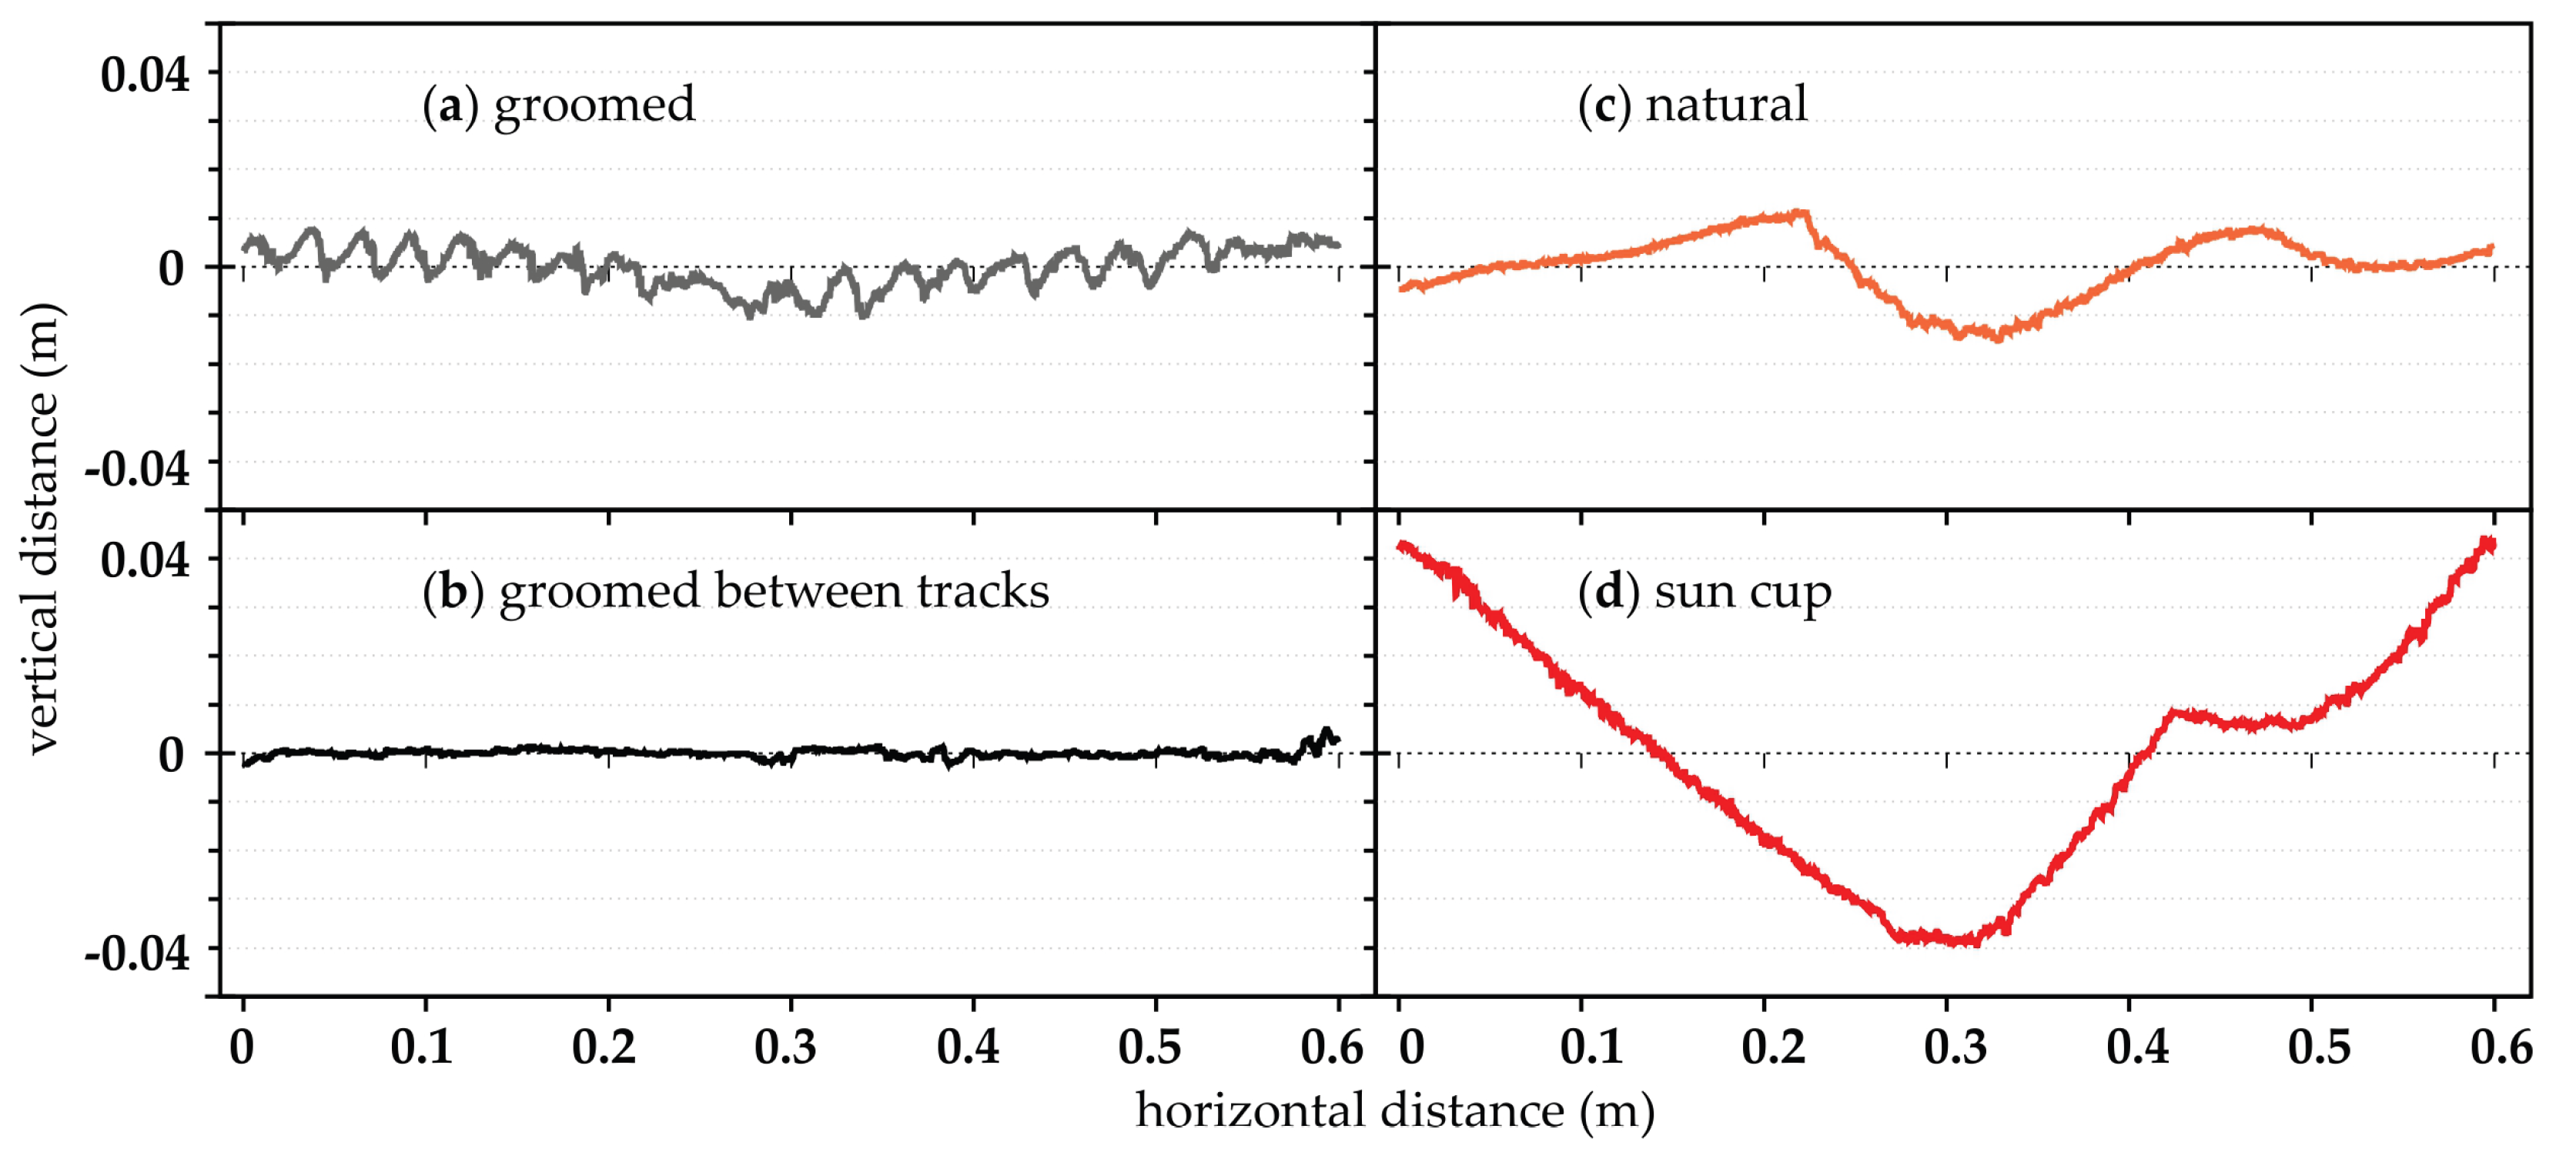
Figure 6.
Variograms for the roughness boards (2-D data) and the iPad scans (3-D data).
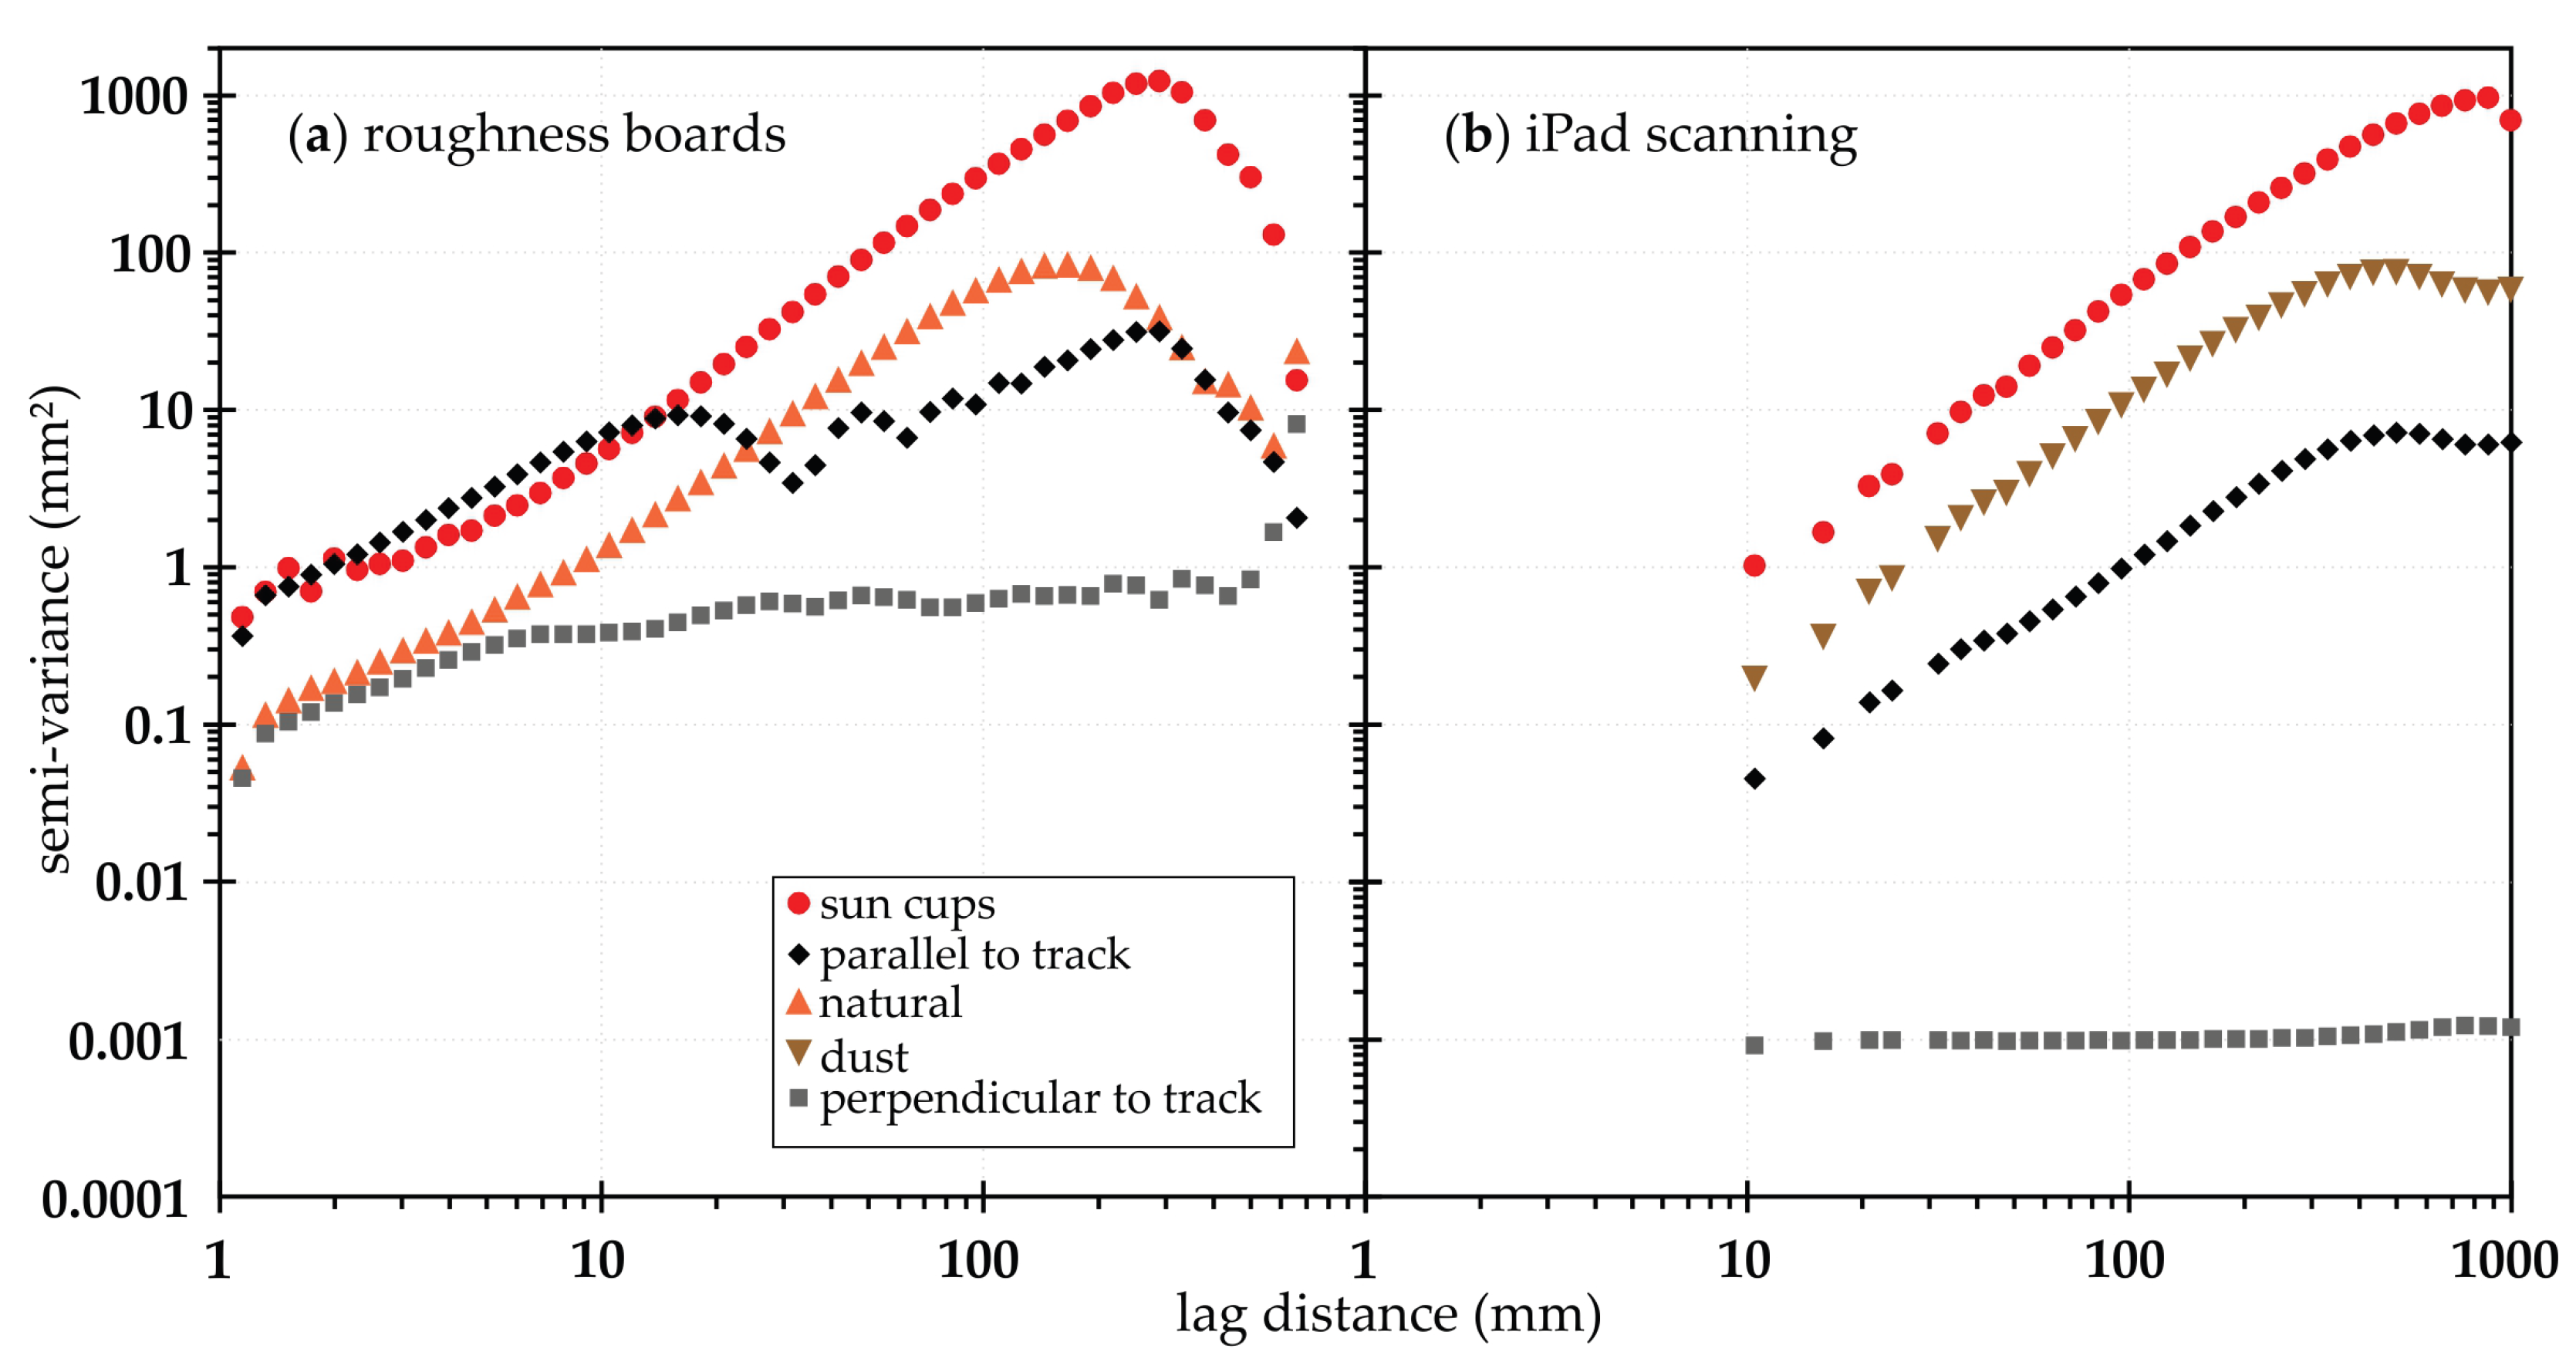
Figure 7.
Scale Break (SB) and Fractal Dimension (D) values derived from variogram analysis (Figure 6), plus the Random Roughness (RR).
Figure 7.
Scale Break (SB) and Fractal Dimension (D) values derived from variogram analysis (Figure 6), plus the Random Roughness (RR).
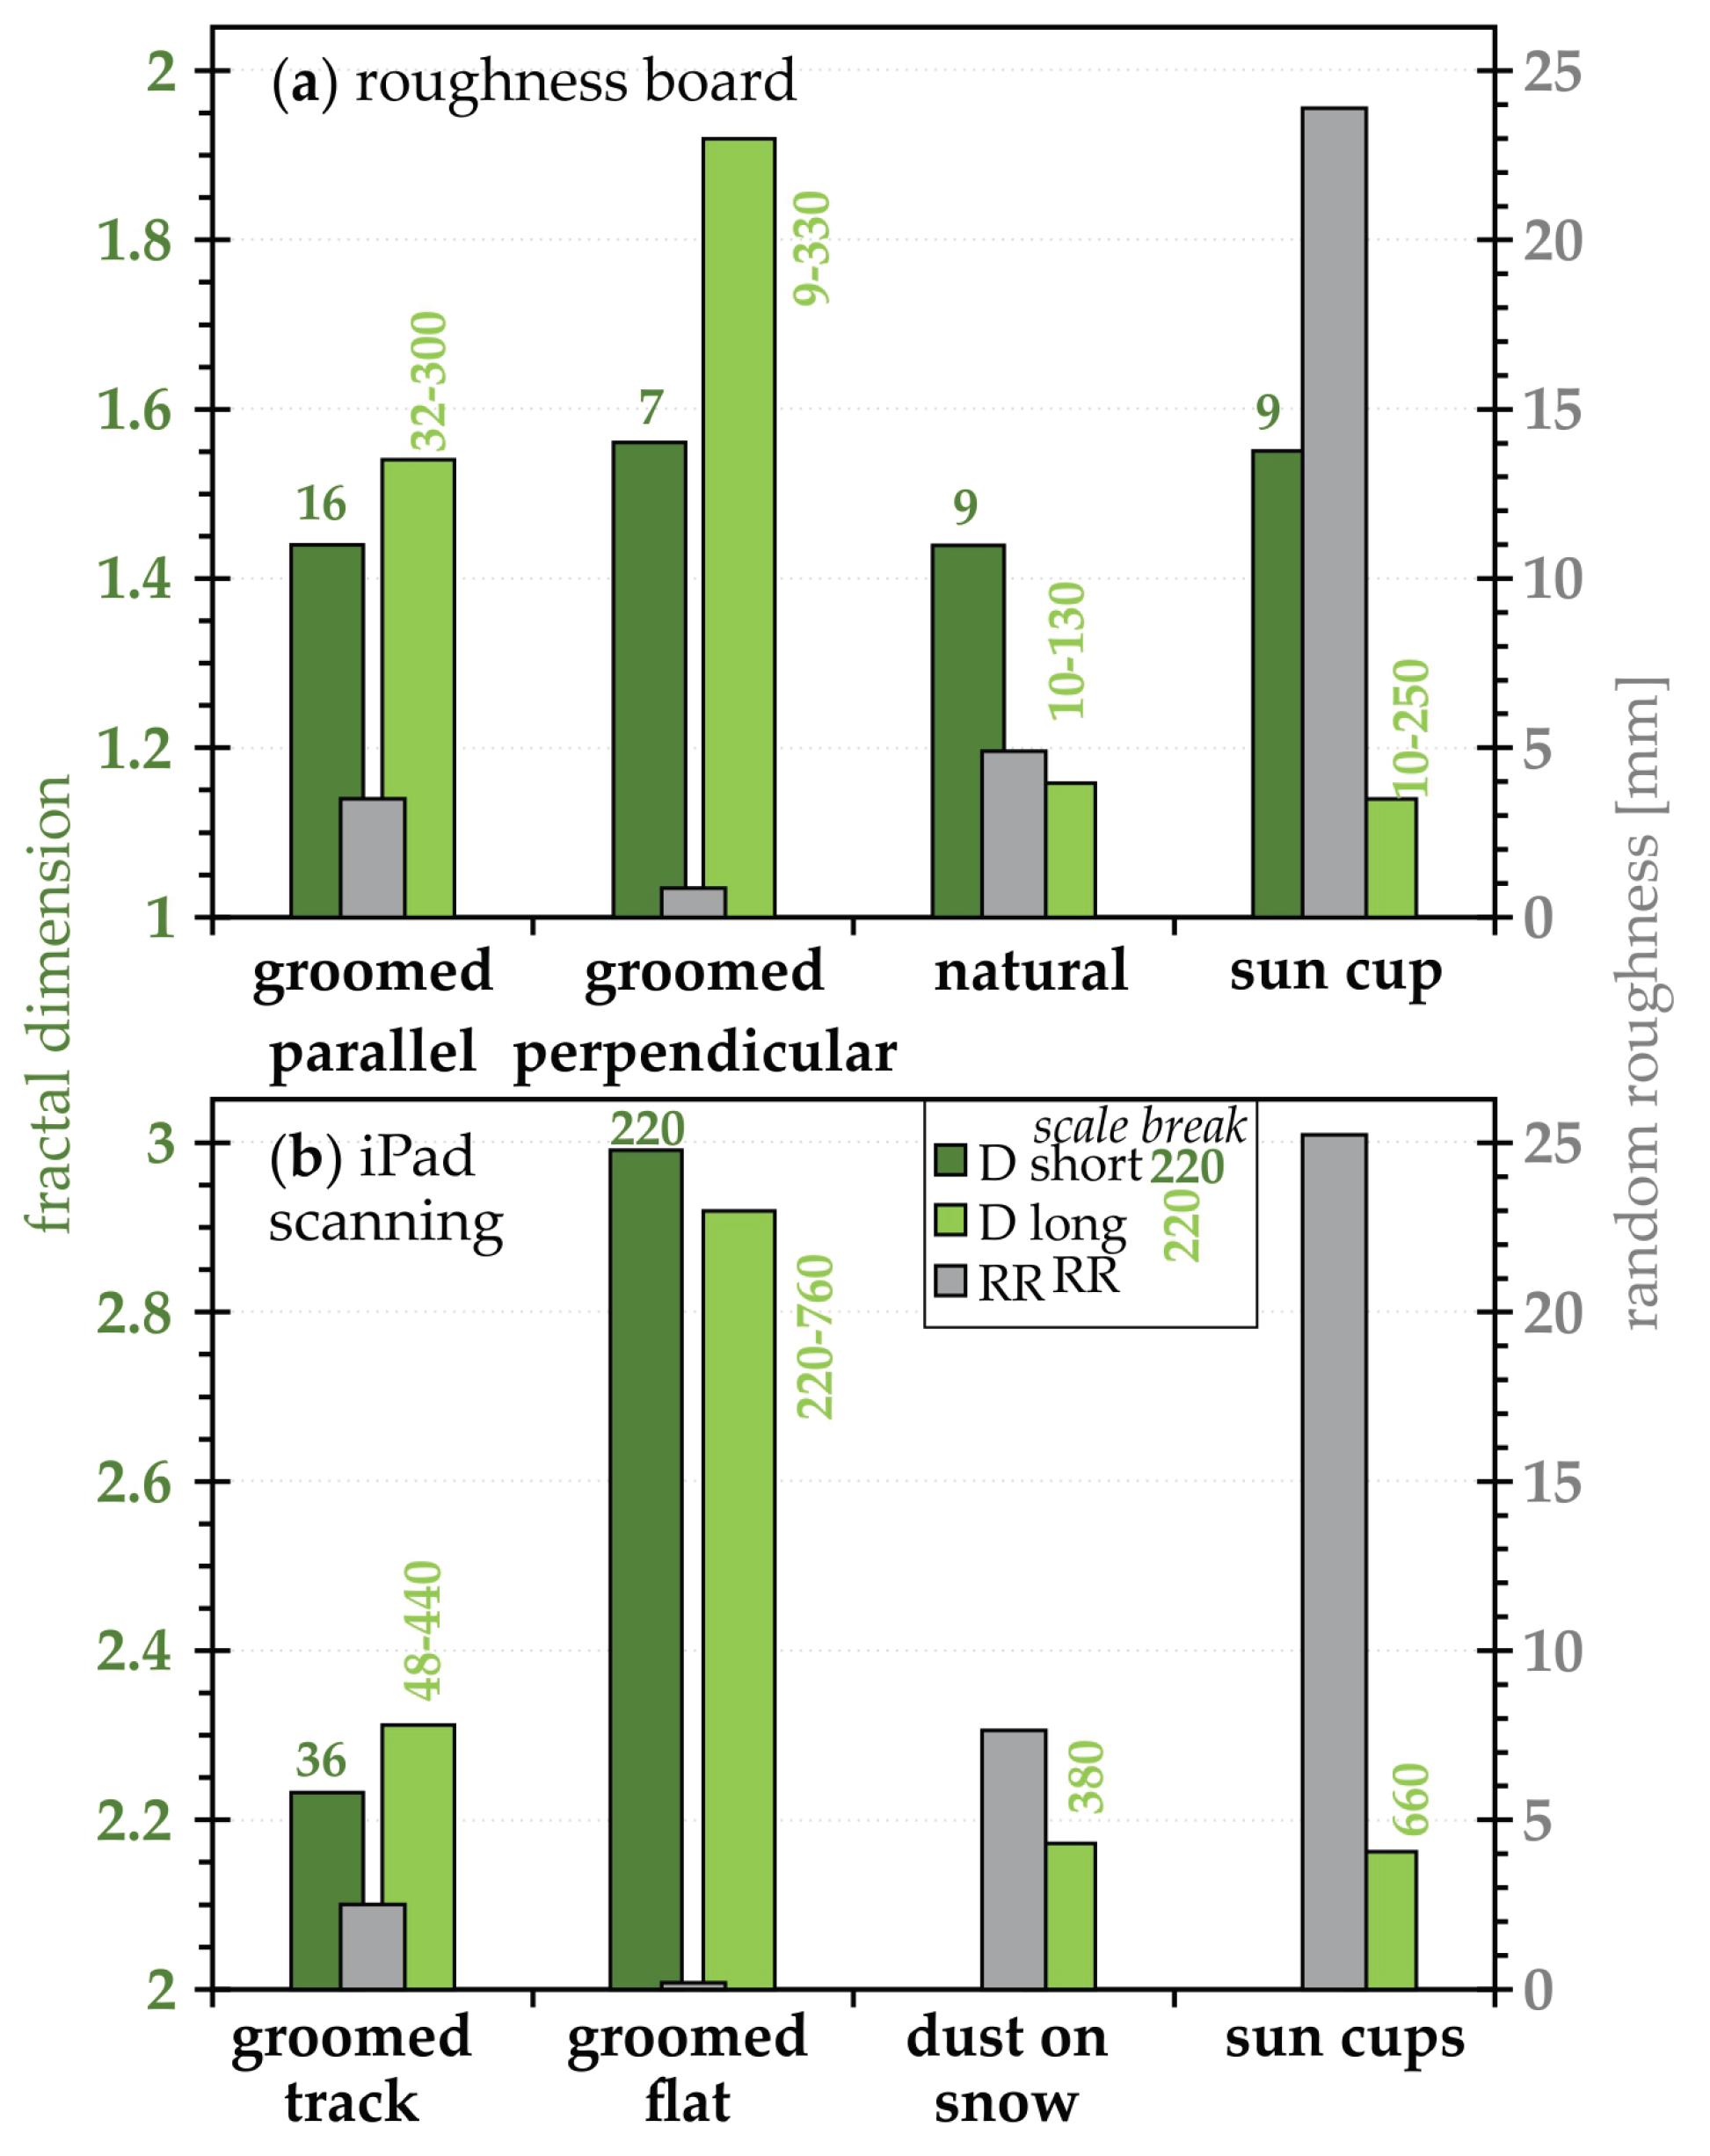
Figure 8.
Geometric-based estimates using the approach of Neville et al. [12].
Figure 8.
Geometric-based estimates using the approach of Neville et al. [12].
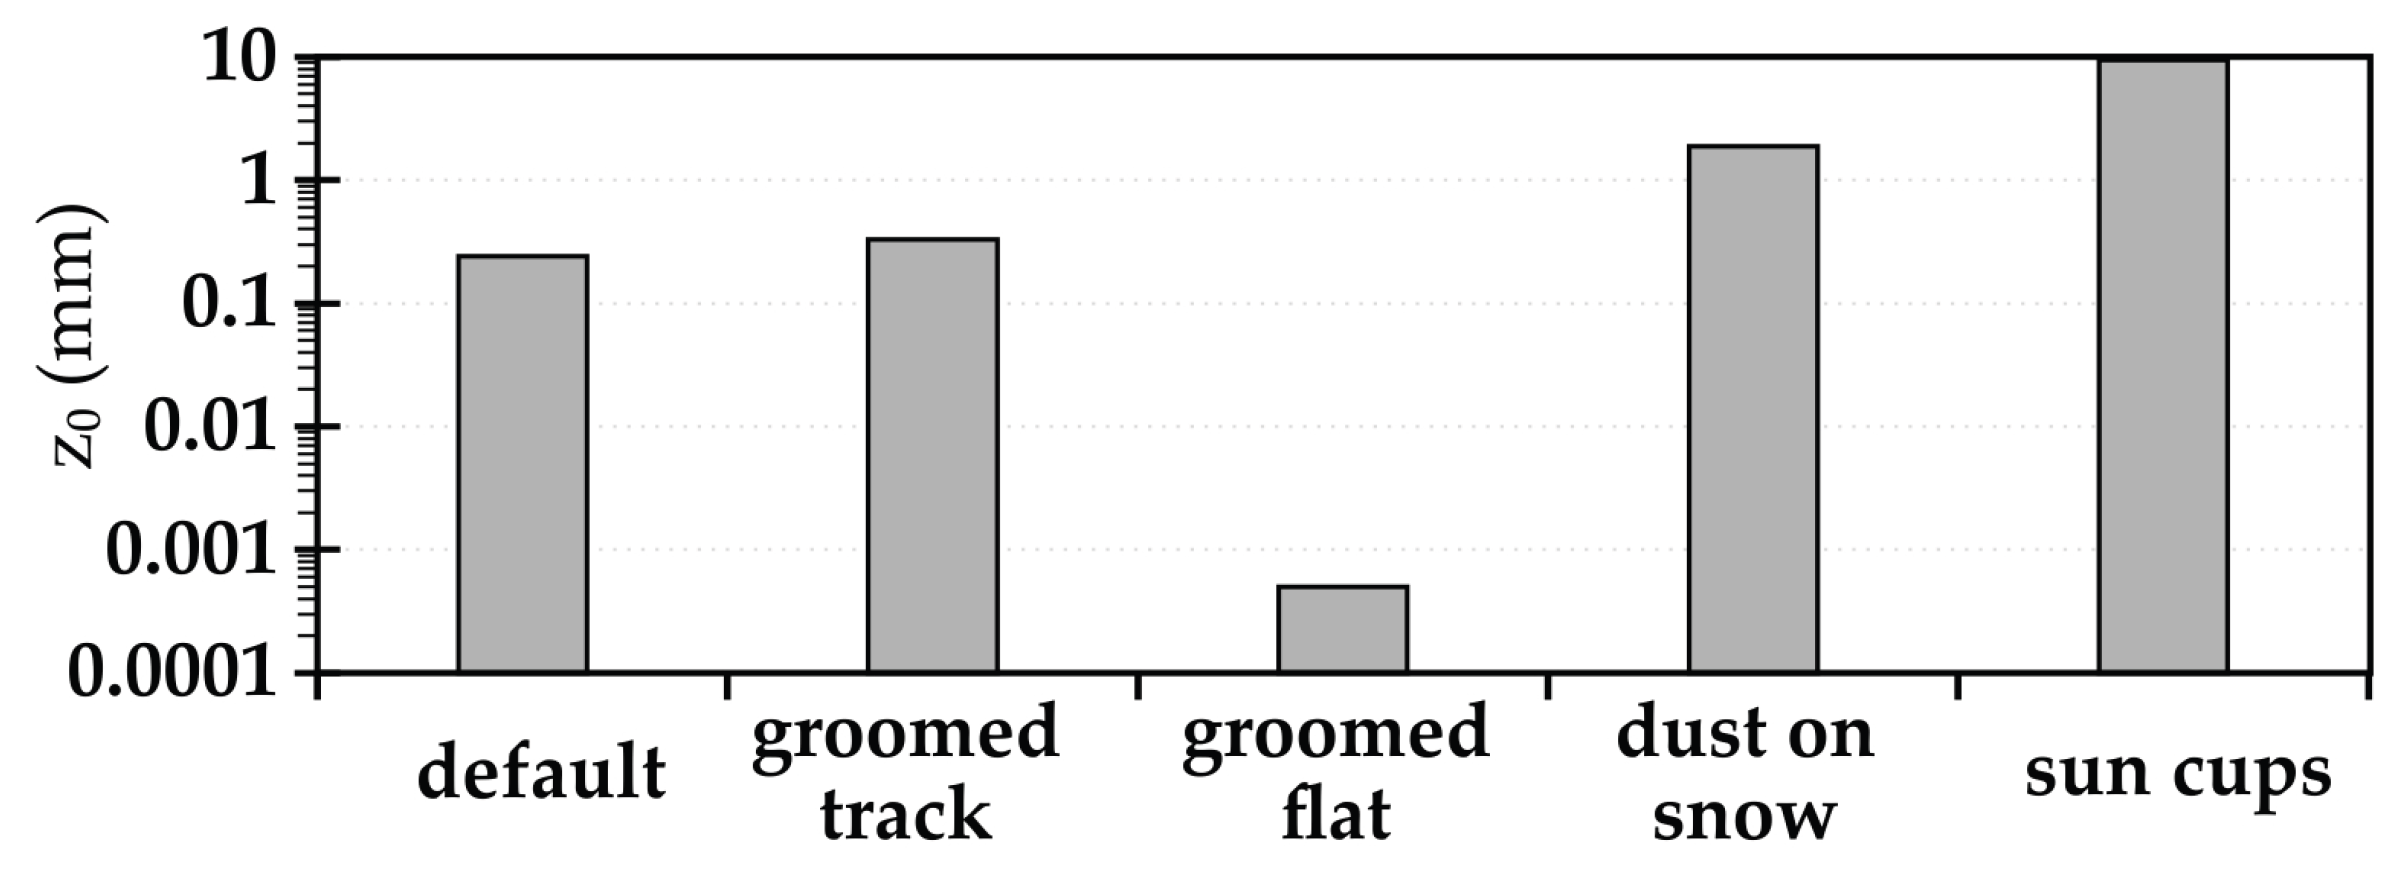
Figure 9.
Modeled cumulative snowpack sublimation from the bulk transfer approach with using the estimates from Figure 8.
Figure 9.
Modeled cumulative snowpack sublimation from the bulk transfer approach with using the estimates from Figure 8.
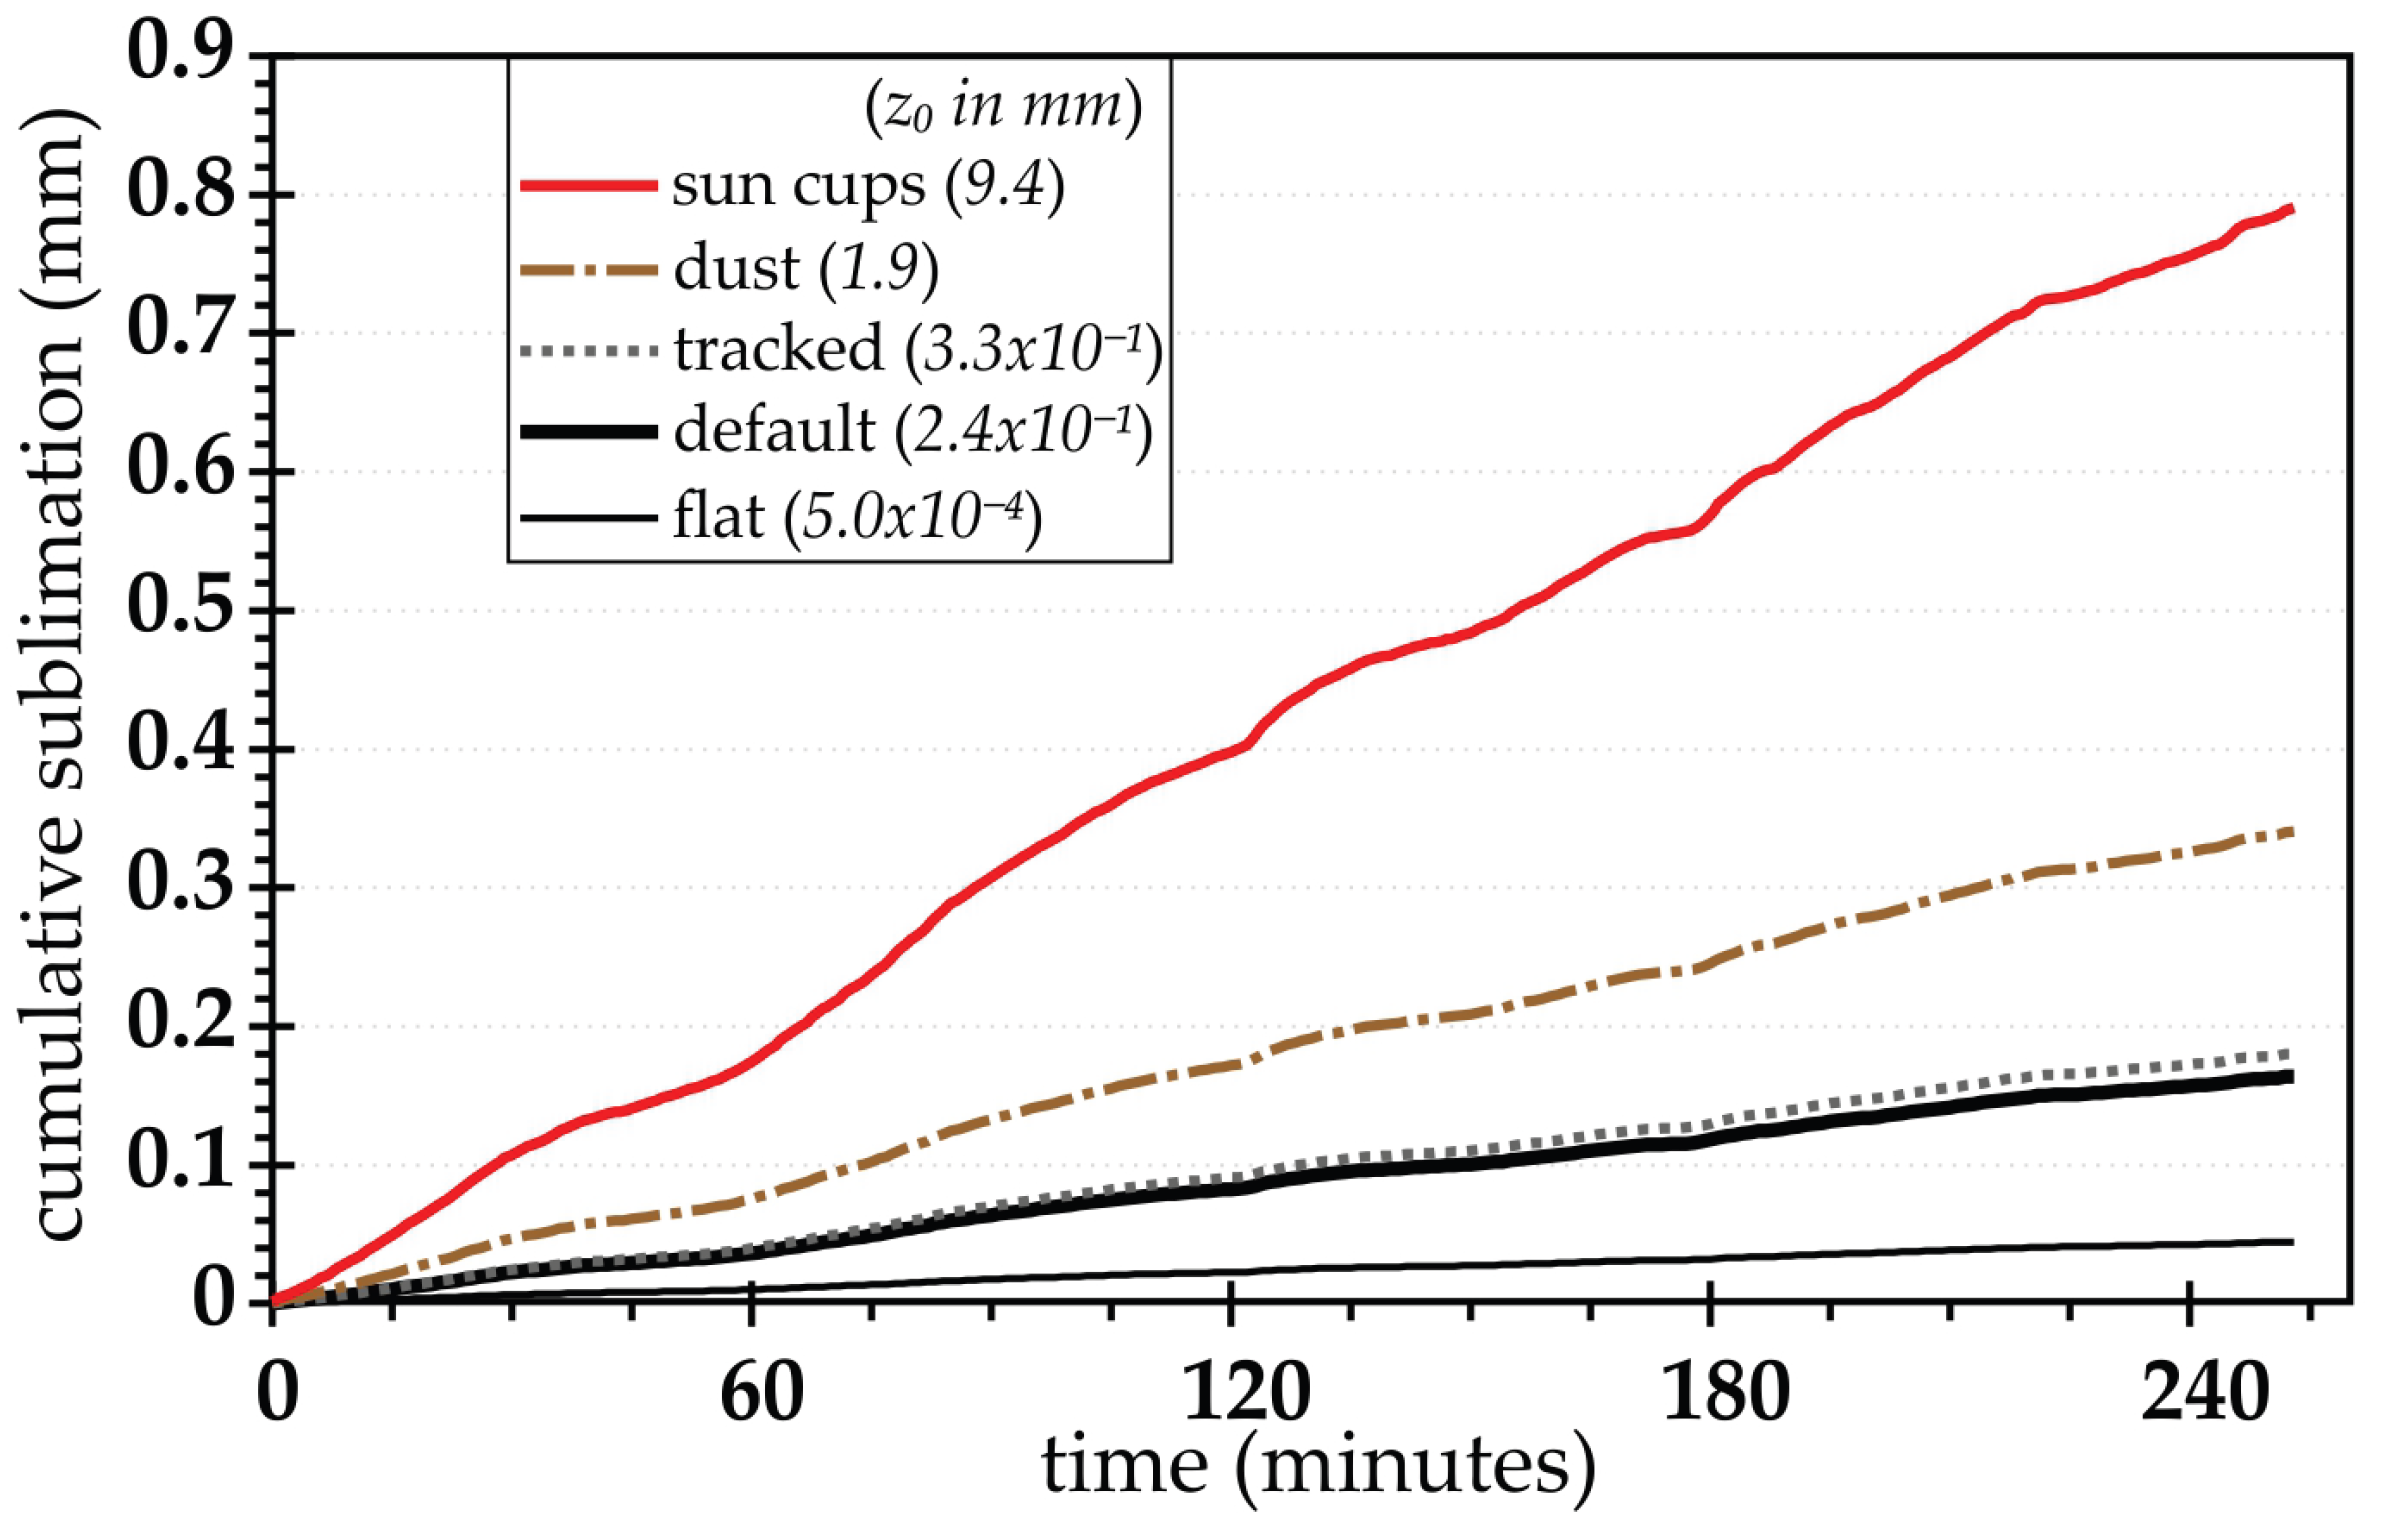

Table 1.
Characteristics of the snow surfaces evaluated. The surface code presents groomed (P for piste) and natural (N). With P, the second letter T represents the tracked surface and B is between tracks. With N, N is the natureal surface, S is for sun cups and D is for dust-on-snow. These surfaces are labeled in (Figure 1).
| Surface Form | Code | Roughness Board | iPad Scanning |
|---|---|---|---|
| groomed | PT | parallel to track | on groomer track |
| PB | perpendicular to track | between groomer tracks | |
| natural | NN | natural | N/A |
| NS | sun cups | sun cups | |
| ND | N/A | dust on snow |
Table 2.
Characteristics of the roughness boards and iPad scanning data.
| Surface Characteristics | Roughness Board | iPad Scanning |
|---|---|---|
| dimensions | 2-D | 3-D |
| extent | 0.6 m | 0.8 m x 1.6 m |
| resolution | 0.2 mm | 1 cm |
Disclaimer/Publisher’s Note: The statements, opinions and data contained in all publications are solely those of the individual author(s) and contributor(s) and not of MDPI and/or the editor(s). MDPI and/or the editor(s) disclaim responsibility for any injury to people or property resulting from any ideas, methods, instructions or products referred to in the content. |
© 2025 by the authors. Licensee MDPI, Basel, Switzerland. This article is an open access article distributed under the terms and conditions of the Creative Commons Attribution (CC BY) license (https://creativecommons.org/licenses/by/4.0/).
Copyright: This open access article is published under a Creative Commons CC BY 4.0 license, which permit the free download, distribution, and reuse, provided that the author and preprint are cited in any reuse.


