Submitted:
28 November 2025
Posted:
02 December 2025
You are already at the latest version
Abstract
Solar energy continues to grow rapidly worldwide. Yet in the context of a ‘just transition’, recent research has found stark disparities in adoption across communities and socio-demographic groups. In Canada, where all levels of government have shown support for solar adoption, there is a clear lack of equity-centered research. For example, we can find no research that assesses the kinds of people that have invested in or developed solar PV. To begin and address this gap, we present results from a pilot study set in the Halifax Regional Municipality (HRM), Nova Scotia – a municipality that has developed a novel financing support program called Solar City. This exploratory work focuses on analyzing levels of participation, equity, and barriers experienced among homeowners who have adopted residential rooftop solar – via both Solar City and other non-local programs. After utilizing aerial imagery to locate a sample of solar installations in the HRM (n=1,315), we shared surveys that asked residents for their sociodemographic information as well as barriers faced in the adoption of solar. We then compared the sociodemographic infor-mation to municipal-level characteristics provided by Statistics Canada. We center our analyses around variables such as age, education, gender, and income. Our paper closes with a discussion and conclusion which we hope will inform future research and practice around equitable pathways towards a just solar energy transition – in Halifax and beyond.
Keywords:
solar energy
; equity
; renewable energy
; just transition
; Nova Scotia
; Canada
1. Introduction
The rapid shift towards renewable energy has become a crucial objective in a world that is realizing the consequences of human-induced climate change. Many countries have initiated their transition to renewables as a key strategy for improving public health, lowering the cost of energy, growing a green energy economy, reducing greenhouse gas emissions, and meeting other climate goals such as those outlined in the Paris Agreement [1]. In Canada, federal, provincial, and municipal governments have begun to implement policies that support a renewable energy transition, many of which are in line with a federal goal of achieving net-zero emissions by 2050 [2] The small maritime province of Nova Scotia – historically heavily dependent on fossil-fuels – has been a key player in this transition, having reduced greenhouse gas emissions by 35% since 2005 [3]. Nova Scotia also has an ambitious policy goal of achieving 80% renewable energy in its electricity system by 2050 [4].
As the largest municipality by both land area and population in Nova Scotia, the Halifax Regional Municipality (HRM) is also playing an important role and has long been a Canadian leader in environment and climate initiatives. This includes being the second local government in Canada to declare a climate emergency. In 2020, Halifax also developed a comprehensive local climate plan, HalifACT (Halifax Acting on Climate Together), which they claim is “one of the most ambitious climate action movements in Canada” [5].
One way that the HRM and other governments in Canada have been supporting their climate goals is through support for solar energy development. In addition to the climate-related benefits [6] solar energy can offer a range of local socioeconomic benefits including job creation and energy cost savings. In Canada, numerous programs have been put forward to help residents develop solar. This includes the federal government’s Greener Homes Grant, which provides low-interest loans [7,8] Nova Scotia’s Solar Homes Program, which offers financial incentives [9] and Ontario’s successful, yet controversial, feed-in tariff program [10,11]. Despite the range of provincial support programs and policies, municipal supports for solar energy in Canada are however relatively rare. A recent study looking at municipal programs [12] highlighted that across Canada, there were only six: Toronto’s Home Energy Loan Program (ON), Switch Charlottetown (PEI), Switch Stratford (PEI), Solar Colchester (NS), Switch Wolfville (NS), and the HRM’s Solar City.
In the context of assessing levels of participation, our research evaluates how participating in municipal financing programs may impact equity in residential solar adoption. In particular, we are interested in the HRM’s Solar City program, which began operations in 2013 to first provide low-interest loans for solar hot water adoption. The program operates as a user-pay, financially self-sustaining model designed to cover its own delivery costs, without impacting the municipality’s general tax base. Since inception, the program has significantly expanded, with over $20 million in financing.
The limited amount of published research looking at municipal financing programs– and municipal-scale solar energy in general – has focused on success in terms of total installations, cost-savings, and greenhouse gas mitigation. For example, one study focused on Canadian solar incentive programs found that programs are specifically designed to have annual energy savings or income that outweigh loan repayments [13]. This can also be seen in above-mentioned research that found Halifax’s Solar City program led to 747 installations, reduced GHG emissions by 5,800 tonnes, and helped to grow a local solar energy industry by 2018 [12]. We can find no research in Canada that goes beyond these themes to study questions of participation, inclusivity, and equity (i.e. PIE) at the local level. This is in stark contrast to research from countries such as the US and the UK, where recent studies have found emerging, but clear inequities in the adoption of residential solar [6,14]. Such research set within local geographies or communities of place [15] has found that the adoption of solar energy can be highly unequal, with solar energy adoption overlapping with existing socio-spatial inequalities such as poverty and racial discrimination [16]. Research from the US found that households earning more than $200,000/year were more than four times more likely to adopt solar compared with those earning less than $50,000/year [17]. Additionally, because of the need for infrastructural (e.g. distribution system) upgrades, increased solar energy generation can lead to higher electricity costs for those left out [18]. These findings emphasize the need for a just [solar energy] transition, which aims to ensure the fair distribution of the benefits and burdens of renewable energy development are equitably distributed across society [6,19].
Despite the growing interest in residential solar, adoption is not equally accessible to all. Numerous studies have shown that socioeconomic barriers such as household finances, housing conditions and gaps in knowledge can limit participation [6,17]. Understanding the types of barriers to adoption is therefore central to assessing equity in the solar energy transition. In this study, identifying and analyzing barriers reported by participants is a major component of analysis, allowing us to explore how different sociodemographic traits may shape the experience and challenges of adopting rooftop solar.
Given the lack of equity-centered solar energy research in the Canadian context, the pilot study presented here shares an analysis of participation via the adoption of residential rooftop solar energy in Halifax, Nova Scotia. In addition to uncovering overall participation trends, we also examine the role of HRM’s Solar City Program in promoting equity. Shaped by the context of this work, including a brief literature review provided below, we developed one very simple research question that helped to guide this study:
- To what extent has recent residential solar energy adoption within the HRM been equitable or inequitable?
To answer this question, we identified 1350 homes with rooftop solar using aerial imagery and surveyed their residents on sociodemographic traits (age, gender, education; full survey in appendix). We then compared responses with HRMs census profile from statistics Canada and analyzed which demographics are experiencing barriers in their process of adoption or the continued ownership of rooftop solar. Note that without collated statistics on the sociodemographic profile of solar adopters in the HRM, we are unable to ensure that our sampling procedure would have resulted in a fully representative ‘solar population’.
This study is part of a larger project (entitled ‘[Em]powering Communities: An analysis of Participation, Inclusivity, Equity, and Support for Solar Energy in Halifax) that is examining solar equity and participation across the HRM, including further quantitative analyses and in-depth interviews with residents and organizations. Other topics of focus will be the role of: i) energy poverty; ii) inadequate housing characteristics; and iii) neighbours and social capital.
The remainder of this paper is structured as follows. The brief Literature Review provides an overview of residential rooftop solar as a concept and the global trends in terms of demographics and inequities that have been explored in recent studies. We then outline the Methodology that was used to collect and analyze our survey data. Next, we share our Findings from statistical frequencies and bivariate analysis. Finally, in the Discussion and Conclusion, we discuss these findings as they relate to the literature and provide policy recommendations that should be utilized by the HRM and other municipalities aiming to enhance levels of equity in residential solar energy adoption.
2. Literature Review
Decades of established research has shown that solar energy development has substantial and wide-ranging environmental, economic, and social benefits for communities and individuals [20]. These benefits are only becoming more obvious with the decreased costs of rooftop solar equipment, alongside the clear and present danger associated with greenhouse gases and a warming planet. Yet, and mirroring more general trends in the study of clean/renewable energy transitions [21,22,23] conventional approaches to analyzing solar energy development have primarily focused on techno-economic feasibility and outcomes rather than social considerations [16] such as participation, inclusivity, and equity. Thankfully this is changing, and as solar installations continue to grow, social scientific researchers are increasingly turning their focus to questions of energy justice, equity, and more broadly speaking, the understanding that energy transitions shaped not only by sociotechnical factors, but also deeply by sociopolitical considerations [24].
The longstanding focus on providing energy that is cheap, clean, and reliable must be complimented with considerations of equity and justice to ensure that energy transitions are both socially inclusive and supported. Trends in the literature have shown that socioeconomic barriers, such low-income and education, may inhibit participation in solar uptake. Much of this research comes from the US, including recent analysis that revealed disparities in rooftop solar adoption across different sociodemographic groups, with rural communities, renter-occupied, low-income, and communities of colour participating at much lower rates [14,25]. Also in the US, Barbose et al. (2022) found that solar owners tend to live in predominantly white neighbourhoods, are more educated, are older and are more securely employed [26]. One US study conducted in the state of Georgia argues that solar adoption is not simply a matter of technology dispersion but is entangled with social identity and place-based characteristics – and supporting the need for aligning policies with values and demographic contexts in which solar adoption occurs. [14]. A study that assessed two communities in the United Kingdom found that patriarchal gender roles were observed as being reinforced within the solar energy transition as men were the primary decision-makers in household solar adoption [6]. Interview-based research from India found that despite the availability of incentive programs, unaffordability of solar energy is often cited as a main barrier to adoption, requiring large upfront costs among other eligibility requirements [20]. Notably, we can find no studies from Canada that assess equity in solar energy in the ways that the above studies do. The most relevant studies in Canada within this realm of research look at the development of a more just energy policy in Saskatchewan [27], the effect of renewable energy development on educational outcomes [28], and multiple studies surrounding Indigenous ownership and participation [29,30,31,32,33]. However, the present study is the first known to examine individual or household characteristics of solar adopters in Canada – what we see as an essential first step in the study of equity or a just transition.
Another clear gap in the literature concerns the relationship between different solar incentive programs and equity-based outcomes. Most of the research cited above situates such programs in the background of their work and/or fails to differentiate the roles that competing programs (i.e. at municipal vs. regional/national levels) may have in terms of citizen participation and equity [34]. Additionally, most existing research excludes the extent to which concerns and suggestions from the public are considered in solar energy policy [27,35]. In the broader context of advancing a just solar energy transition, the HRM presents a compelling case of assessing patterns of participation at the local scale in which other municipalities may learn from.
3. Materials and Methods
The research presented here used a mail-out, quantitative survey shared with HRM residents with rooftop solar, with the overall goal to assess participation, inclusivity, and (in)equity in the municipality. To do so, we first aimed to determine general demographic patterns of solar adopters (by program; i.e. Solar City) and then compare these trends to the general population.
The initial phase of this research sought to identify homes with rooftop solar in the HRM. For this, from May to June 2024, we used geocoding [36] – utilizing publicly available aerial imagery to locate and mark the addresses of 1350 homes with rooftop solar in the HRM. This process began in April 2024 with HRM staff providing us with access to documents containing all community and street names within the municipality. Due to the large number of communities (n=201) and streets (n=6395) within HRM, we utilized a random sampling technique where we only fully sampled communities containing 20 or less streets. For communities with 20 or more streets (e.g., Halifax and Dartmouth), we calculated the number of streets we needed to randomly sample to have a representative population (assuming a 95% confidence interval and margin of error of 5%). For example, in Halifax we sampled 291/1193 streets while in Hubbards, we sampled 28/30 streets. Even with this ‘under-sampling’, the larger communities of Dartmouth and Halifax contained the most homes with rooftop solar – representing 24.5% and 18.7% of our sample, respectively. This was followed by Middle Sackville (6%) and Upper Tantallon (4.7%). Community-level data were not weighted to reflect the relative sizes of different communities within HRM. As a result, some communities may be overrepresented or underrepresented in the dataset which should be considered when interpreting these results.
While not rigorous enough to form part of our formal analysis, we were interested to see a spatial visualization of solar energy clustering in the HRM, based on the geocoding process described above. We found an uneven geographic representation of solar, particularly in the clustering of rooftop solar within certain communities (see Figure 1). A study conducted in 2014 by Graziano and Gillingham [37] explored this phenomenon known as solar clustering and found that the residential adoption of solar panels tends to center within a geographic area – occurring due to factors including the increased visibility of solar panels, word of mouth, social influence and the ability to learn about the benefits of solar from neighbours.
Of the 1350 surveys sent out, delivery was unsuccessful for 35, leaving us with 1315 valid addresses (Figure 1). Potential participants had the option to complete the survey by returning by mail, online, or over the phone.
Variables we included in the survey were mostly based on those found within the 2021 Canada census (see Table 1 and the full survey, Appendix A). In addition to these 17 variables, we also asked participants if they identified as a part of the 2SLGBTQIA+ community – a variable we had not seen assessed in the research literature to date. In this research, our analysis excludes those four variables not provided through census data such as household energy costs.
At the time of analysis, a total of 156 surveys were returned and completed, resulting in an 11.8% response rate. All responses were stored within (for online responses) or inputted into (for mail and phone responses) Opinio software and later extracted into SPSS software for analysis. Quantitative statistical analysis then took place, including frequency analyses that revealed the rates of each variable, then followed by bivariate analysis, which compared the rates of barriers to certain demographic variables. For this study, barriers were recognized as any experience that posed an obstacle to the adoption of solar technology or the continued ownership and use of an existing solar system. Though not presented in the work here, we organized the barriers into categories (e.g. finances, complexity in the application process, government policies, shortage of labour, morphological factors, process delays, technical literacy and uncertainty through qualitative coding analysis in NVIVO). Upcoming companion papers are likely to feature the relative importance of these categories of barriers. Here, we also conducted a series of independent sample t-tests and one one-way ANOVA. Independent sample t-tests were used to compare mean differences in barriers between groups (e.g. male vs female) and the one-way ANOVA was applied to variables with more than two categories (e.g., household size). While most results were not statistically significant, this work is still valuable as it highlights areas where inequities may exist and helps to guide future research with larger or more targeted sampling.
4. Results
Although the survey examined a total of 18 characteristics, this analysis reports on 12, as some traits, such as household energy costs are not included in census data, preventing us from conducting meaningful comparative analyses (see Table 1 for more information). By comparing the outcomes of survey respondents (N=156) to that of Halifax’s general population, we observe clear inequities and inconsistencies among differing sociodemographic characteristics.
4.1. Gender Binary
There is a notable gender binary imbalance among respondents. Our survey asked for all members of a decision-making position in the household to each fill a survey. Many participants stated that their counterparts (typically wives) had no knowledge of their rooftop solar or that they were not interested in participating which resulted in men participating more than women, with 62% identifying as male and only 35.7% identifying as female. This contrasts Halifax’s population of 47.8% being male and 51.3% being female, suggesting that men may be participating or making decisions about solar more than women are. Men also identified as having a higher rate of barriers than women, with 59% of men experiencing barriers in contrast to 46% of women (Table 2). While men were overrepresented in the survey, they also appeared to face slightly more difficulties in adopting solar.
4.2.2. SLGBTQIA+ Representation
While the 2021 census does not include statistics on sexual orientation at the municipal level, seven of 156 respondents (4.5%) identified as being a part of the 2SLGBTQIA+ community. Though this information lacks at the municipal level, it is broadly consistent with national data. 4.4% of the Canadian population aged 15-years and older have reported as being a part of the 2SLGBTQIA+ community, with Nova Scotia having the highest concentration of gender diverse and non-binary people in the country [38]. 83% of 2SLGBTQIA+ respondents reported experiencing barriers compared to 53% of non-identifying respondents. Although a small sample size prevents robust statistical analysis, this finding suggests that this demographic faced disproportionately higher rates of barriers in the adoption process.
4.3. Disability
6.4% of survey respondents identified as having a disability in our study which is significantly lower than the municipal rate of 35%. This suggests that individuals with disabilities may be underrepresented among solar adopters, however, we suggest further research into this demographic considering the small sample size. We also found that disabled participants experienced a higher rate of barriers (62%) in their process of adopting solar than participants who are able-bodied (54%).

Table 2.
Gender Binary and Barriers Experienced by Respondents.
| Gender Binary and Barriers (%) | |||
|---|---|---|---|
| Gender (Binary) | No Barriers | Barriers | Total |
| Male | 41.00 | 59.00 | 100.00 |
| Female | 53.80 | 46.20 | 100.00 |
| Total | 45.57 | 54.43 | 100.00 |
Independent sample t-test p = 0.072.
Table 3.
Gender Binary and Barriers Experienced by Respondents.
| Disability and Barriers (%) | |||
|---|---|---|---|
| Disabled | No Barriers | Barriers | Total |
| No | 46 | 54 | 100.00 |
| Yes | 37 | 62 | 100.00 |
Independent sample t-test p = 0.680.
4.5. Indigenous Identity
3.2% of survey respondents identified as Indigenous, which is slightly less than the municipality’s Indigenous population of 3.8%. While the rate of participation was slightly comparable, Indigenous participants experienced significantly more barriers in adoption compared to non-Indigenous participants.
Table 4.
Indigenous Participants and Rates of Barriers Experienced.
| Indigenous Identity and Barriers (%) | |||
|---|---|---|---|
| Indigenous | No Barriers | Barriers | Total |
| No | 46 | 54 | 100.00 |
| Yes | 33 | 66 | 100.00 |
Independent sample t-test p =0.506.
4.6. Age
Respondent age distribution was on average older, with 25.2% being 65 years and over in contrast to 17.3% in HRM’s general population. This finding may be attributed to the fact that we did not survey anyone under the age of 18 and the youngest respondent was in the 25 to 29-year-old age range, skewing the age of our population to be older. We found that those above the age of 65 experienced a much lower rate of barriers compared to the younger demographic.
Table 5.
Participants Aged 65+ and Barriers Experiences.
| Aged 65+ and Barriers (%) | |||
|---|---|---|---|
| 65+ | No Barriers | Barriers | Total |
| No | 60 | 40 | 100.00 |
| Yes | 87 | 13 | 100.00 |
Independent sample t-test p = 0.680.
4.7. Personal and Household Income
We found our sample size to be more financially affluent overall compared to the general population. The personal income levels of respondents were reported to be higher with 31% of participants having annual personal incomes over $100,000, compared to only 9.6% in the general population. This gap is also noticeable in terms of household income, where 23.3% of respondents reported household incomes above $200,000, far surpassing the general population’s 7.9%. In terms of barriers, Table 7 shows an even split between households with an income below $100,000. However, households with a $100,000 annual income or greater, experienced a slightly higher rate of barriers (56%).
Table 6.
Household Income Below $100,000 and Barriers Experienced by Respondents.
| Household Income Below 100k and Barriers (%) | |||
|---|---|---|---|
| Below 100k No |
No Barrier 43.43 |
Barrier 56.56 |
Total 100.00 |
| Yes | 50.00 | 50.00 | 100.00 |
| Total | 45.45 | 54.54 | 100.00 |
Independent sample t-test p = 0.463.
Table 7.
Household Size and Barriers Experienced by Respondents.
| Household Size and Barriers (%) | |||
|---|---|---|---|
| Household Size | No Barriers | Barriers | Total |
| 1 Person | 60.00 | 40.00 | 100.00 |
| 2 Persons | 54.54 | 45.45 | 100.00 |
| 3 Persons | 40.00 | 60.00 | 100.00 |
| 4 Persons | 37.50 | 62.50 | 100.00 |
| 5+ Persons | 28.57 | 71.42 | 100.00 |
| Total | 46.00 | 54.00 | 100.00 |
ANOVA Significance = 0.213.
4.8. Household Size
Our sample size had a lower rate of single-person household sizes (10% vs 30%% in the census) and exhibited a higher rate of three-person, four-person and 5-or-more-person households. As shown in Table 8, a bivariate frequency tells us that with barrier rates incrementally increase as household sizes do, with one-person households experiencing the least number of barriers (40%) and households with 5-or-more-persons experiencing the most (71.4%). It is worth noting that one-person households were substantially underrepresented in the sample relative to five-person households, potentially limiting the extent to which the findings reflect the barriers experienced by single-person households.
4.9. Marital Status
Married or common-law respondents made up 83.5% if the survey sample, compared to 56% in the general population. These respondents also reported more barriers than their unmarried counterparts, however, as with the gender overrepresentation, this may reflect broader participation, rather than unequal access to solar. The higher share of married or common-law participants indicates that they are more likely to adopt solar, potentially due to shared financial resources and joint decision-making, which can make long-term investments like solar more feasible.
4.10. Visible Minority Status
The majority of the HRM’s residents do not identify as visible minorities and along with the majority of the survey’s respondents. There was a clear under-representation of visible minorities in our sample, compared to the general population, with our sample comprising of 6.6% and 16.8% for the general population.
4.11. Core Housing Need
Solar Respondents in Core Housing Need were only slightly underrepresented in this study with 10% of respondents falling under this category in comparison to 12% of HRM’s population. Participants in Core Housing Need reported higher barriers (71.1%) compared to those who were not (53%).
4.12. Education levels
Respondents were overall more educated with 43% of respondents holding a bachelor’s degree, compared to 22% of Halifax’s general population. An overrepresentation in our sample was observed with both master’s and doctoral possessing 18% and 8.9% higher rates than the general population.
4.13. Solar City Participants
We asked participants if they received assistance from the municipal solar financing program, Solar City. We observe a near-even split between Solar City program participants (49%) and non-participants (51%). Both participants and non-participants reported a similar distribution of barriers; 54.1% for participants and 53.3% for non-participants. This suggests that although the Solar City program may help with financing, it may not necessarily address the other challenges homeowners face that may be associated with technical or social constraints.
Table 9.
Solar City Participants and Non-Participants.
| Solar City Participant | Frequency | Rate |
|---|---|---|
| No | 75 | 51.1 |
| Yes | 72 | 48.9 |
| Total | 147 | 100 |
Independent sample t-test p = .459 .
4.14. Practical Significance
Although our pilot study’s use of descriptive statistics, t-tests and one-way ANOVA did not yield many statistically significant results, the patterns observed across the different sociodemographic groups still shows meaningful trends. Several bivariate frequencies produced p-values approaching significance such as Gender and Barriers (P=0.072) and Core Housing Need and Barriers (P=0.091) which suggests that effect sizes may exist but could not be detected given our small sample size. Across groups such as disabled respondents, Indigenous participants and larger households, there were consistent trends in which these marginalized or vulnerable demographics reported higher rates of barriers. These patterns align with broader scholarship on equity and solar transitions and as such, these findings should be interpreted as early signals of uneven access to rooftop solar within the HRM.
5. Discussion
The urgency of addressing climate change and reducing greenhouse gas emissions from fossil fueled energy production emphasizes the need for alternative, renewable energy sources such as residential rooftop solar. In this initial, pilot study conducted under the wider [Em]powering Communities project, we explored the overall trends in participation via the adoption of residential rooftop solar energy in Halifax, Nova Scotia, Canada. In the context of a need for a Just Energy Transition for Halifax, this work has aimed to determine how the process of adopting residential solar energy has been equitable or inequitable with particular attention to how sociodemographic factors shape participation, access, and barriers. Our findings on participation, inclusivity, and equity (i.e., PIE) in the adoption of rooftop solar are derived from comparative frequency and bivariate analyses, including t-tests of means. In our case study of the HRM, these analyses offer implications for existing research, literature, policy, planning, and development.
This section of the paper discusses how sociodemographic traits of survey participants relate to the barriers they experienced in adopting solar. Overall, our respondents tended to be male, white (largely of European descent), Canadian citizens, living in multi-person households, employed, highly educated, financially affluent, heterosexual, and married. These traits are consistent with the demographics of solar adopters reported in studies across the US and Europe.
This Discussion also addresses our research question by providing an overview of the participation and inclusion of the sociodemographic traits we assessed in this study. We organize this section into several subsections. Firstly, we examine patterns of significant underrepresentation among specific groups, including women (5.1), 2SLGBTQIA+ respondents (5.2), people with disabilities (5.3), and Indigenous peoples (5.4). Next, we discuss socioeconomic factors in respondents including financial affluence (5.5), household size (5.6), visible minority status (5.7) and core housing need (5.8). We draw together our findings with a set of recommendations (5.9) and outline the limitations of this study and opportunities for future research (5.10).
5.1. Female Underrepresentation
One notable disparity found in our study was the over-representation of male-identifying participants. This over-representation may point to gender roles being perpetuated in the solar energy transition. Traditional, patriarchal gender roles in Western and European society tend to view men as primary decision-makers within households, therefore making them likely to have control over decision-making of adopting solar. One study that was conducted in the United Kingdom suggests that solar adoption may be strongly mandated by gender roles as men tend to participate in making decisions about rooftop solar more than women are [6]. We found a similar outcome in our study, where even though there is an equal distribution of men and women within the HRM, women may not be learning, making decisions and/or participating at a representational rate. Despite efforts to be inclusive of female participation in this research, some male respondents stated that their wives or other adult women in their household did not want to participate, or that they had an inadequate amount of knowledge of their solar system to contribute to our study.
Female underrepresentation in Halifax’s solar energy transition can potentially have negative implications on the process of a Just Energy Transition if the benefits of solar are not being equally distributed across society. Less female participation in residential solar energy adoption can lead to biased policies that favour male perspectives as decision-making processes may be informed primarily by male experiences, priorities, and access to resources, thereby overlooking barriers and needs that may be more prevalent among women.
5.2 .2SLGBTQIA+ Representation
Despite our small sample of 2SLGBTQIA+ participants, the higher rate of barriers reported for this group points to potential inequities and raises questions about whether systemic barriers may be contributing to inequities in solar participation. For example, this demographic is less likely to make higher incomes or obtain professional development at similar rates of their cis-heterosexual counterparts [39]. Since financial security and stable employment are strongly associated with solar adoption [26], this disparity may help explain the underrepresentation in solar adoption as well as the higher rate of barriers. The inclusion of this variable is a novel contribution to Canadian solar equity literature and highlights the need for further research into the participation and inclusion of 2SLGBTQIA+ access to solar energy.
5.3. Disability
In our study, people with disabilities participated at much lower rates than their able-bodied counterparts. This underrepresentation may stem from multiple factors. In Canada, individuals with disabilities are less likely to experience financial security [40] a prerequisite often necessary for solar adoption [26]. Beyond financial barriers, the design of renewable energy technologies such as residential solar may not adequately account for the needs of people with disabilities. For example, user experience design typically does not account for those with visual impairments or mobility challenges which further limits participation [41].
5.4. Indigenous Identity
The 3.2% of respondents who identified as Indigenous closely aligns with the proportion of Indigenous residents in HRM (3.8%). However, Indigenous respondents reported experiencing barriers at a higher rate (66%) than non-Indigenous respondents (54%), pointing to potential inequities. This aligns with the broader literature documenting how systemic barriers including socioeconomic inequities and regulatory frameworks have historically constrained Indigenous participation in renewable energy transitions [29,42]. While we caution our interpretation with such a small sample size, this finding suggests that Indigenous participation in solar adoption may be occurring at a representational rate as Indigenous engagement in Canada’s renewable energy transition has been increasing in recent years - especially as a pathway towards reconciliation [33,42]. Equity ownership in renewable energy projects has grown over time as a mechanism for advancing Indigenous self-determination and ensuring that these communities share the benefits of a renewable energy transition [42]. A systematic review of Canadian literature of Indigenous involvement of renewable energy found that the motivations and desires to participate can often revolve around breaking free of colonial dependencies, increasing energy autonomy, and reaping the efficiency and sustainable benefits of renewable energy [33] highlighting the importance of Indigenous participation in the renewable energy transition.
5.5. Financial Affluence and Barriers to Solar Adoption
Consistent with our findings, recent studies in the U.S have shown that residential solar adopters tend to have higher than average incomes and more secure employment [26]. Solar adoption is closely tied to household income due to substantial upfront and maintenance costs. Although installation prices have declined, high initial investment continues to be a major barrier, particularly for low- and moderate-income households [17]. This likely explains the higher average wealth observed among our respondents, consistent with other studies showing that solar adopters tend to be more affluent [16]. Many high-income households also received subsidies from Solar City or other regional financing programs and therefore may be disproportionately advantaged in having the means to adopt and access to financial resources. Even with financial incentive programs, as shown in a study from India, financial barriers persist as the most frequently cited obstacle to widespread adoption [20].
While financial constraints are often a major barrier to adoption, our analysis revealed an unexpected pattern – that higher income did not necessarily reduce the frequency of barriers experienced. Comparing participants with annual household incomes above and below $100,000, barrier rates were nearly identical (see Table 3). Although a two-sided t-test found no significant relationship between income and barriers, this financing has practical importance, aligning with Mathew & Pandian (2024), who note that many adoption challenges extend beyond finances. Thus, financial resources alone, such as grants, loans, or higher incomes may not fully mitigate the obstacles to solar adoption.
5.6. Household Size
Those who participated in our study had higher rates of three, four, and five-person household sizes. Single-person household sizes were significantly underrepresented in our sample, which may be related to the fact that we had a high proportion of married and common-law participants. We expected larger households to be more represented, as they may have greater financial resources and roof space to support installations. De Groot et al (2016), found that larger households are more likely to adopt rooftop solar, given that their share of income spent on electricity is expected to be more compared to smaller households, providing a larger return on one’s investment in adopting solar [43].
When comparing household sizes to the rate of barriers experienced, we found that barrier rates increase incrementally as household sizes do. This might suggest that while these demographics are more represented in solar adoption, larger household sizes have more complex logistical constraints when installing solar.
5.7. Visible Minorities
The rate of respondents who identified as visible minorities (6.6%) was much lower compared to Halifax’s general population (16.8%). One reason for this lack of participation could be tied to structural and financial barriers that disproportionately impact racialized communities. Sunter et al (2019) found that solar adoption in the US was significantly lower in communities of colour, even when accounting for income and homeownership rates, suggesting that racial disparities in adoption extend beyond financial barriers [44].
5.8. Core Housing Need
While only 10% of our respondents experienced Core Housing Need, 71.1% of these respondents’ experienced barriers to adoption. Given that variable tends to amplify broader systemic inequities such as intensifying poverty destabilizing families and limiting access to other determinants of well-being [45] it was anticipated that these households would face greater barriers to rooftop solar adoption. Our findings did not reveal a significant relationship between the income levels of participants living in Core Housing Need and the rate at which they reported barriers. Among those with low-to-moderate incomes, participants in Core Housing Need reported barriers at similar rates to others in the same income category, suggesting that this variable did not independently influence barriers. This suggests that, in our sample, core housing need may not be directly shaping perceptions of barriers to solar adoption. However, it may also reflect limitations in data collection or how barriers were reported, or the possibility that other factors such as tenure status may have had a stronger influence on barriers than Core Housing Need alone.
5.9. Government Policies and Municipal Solar Financing Programs
Regulatory frameworks at federal, provincial, and municipal governance levels play an impactful role in shaping the uptake of rooftop solar across HRM that influence markets and consumer rights. For instance, Nova Scotians must obtain approval from the provincial energy regulator to install systems larger than 27kW [46]. In recent years, government programs such as the provincial SolarHomes initiative have further supported residential adoption through grants, rebates and loans. At the municipal level, HRM’s Solar City program has increased total solar installations in recent years. Since 2022, the program has committed $20.1 million to financing for solar energy systems and as of 2023, the program holds a total of 859 participant agreements, a stark increase of only 200 agreements in 2018 [47].
One of the objectives of this study is to examine the potential role that solar support programs, particularly the HRMs Solar City program may be playing in promoting equity within the adoption process of residential solar adoption. We found similar barrier rates among Solar City participants and non-participants, suggesting that many challenges to solar adoption extend beyond financial constraints. Several respondents also received support from a combination of programs, indicating that financial assistance might not fully address issues in adoption. While our results show that the overall rate of barriers do not necessarily decrease with financial support, these programs still appear to contribute positively to the broader productivity of a solar energy transition, as evidenced by substantial growth in applications over the last six years. Similar to this research, one study conducted in Pakistan found that solar financing programs do increase solar uptake overall but also highlight the interconnectedness of different types of barriers to solar adoption [48]. To ensure that solar adoption is both productive and equitable, policymakers and government assistance programs could explore complementary strategies aimed at alleviating non-financial barriers in the adoption process.
5.10. Recommendations
Halifax, Nova Scotia, Canada has achieved commendable progress in advancing its solar energy transition, contributing to municipal and national climate goals. Yet, ensuring that this transition is equitable, requires deliberate policy design that addresses systemic inequities and expands access to rooftop solar for underrepresented populations. Drawing on our analyses and current literature, we offer the following recommendations to strengthen equity in the adoption process.
First, targeted engagement strategies can help close the gap in participation rates among populations that remain underrepresented in solar adoption. In particular, our study found these demographics to include women, members of the 2SLGBTQIA+ community, those with disabilities, single-person households visible minorities and low-income households. Engagement should not only focus on raising awareness of the financial assistance programs that exist, but also communicate the broader, social, economic, and environmental benefits of solar energy. Deliberate, local outreach efforts in Halifax could increase adoption rates and better inform solar policies to address the needs of marginalized groups.
Second, while financial programs have supported Halifax’s solar transition, our findings suggest that inequities in adoption extend beyond affordability. Policies must move beyond a focus of alleviating financial barriers to directly address disparities in participation rates across demographic groups. Program design should consider social, geographic, and demographic contexts. For example, rural communities may need distinct supports from urban communities, and some groups may prioritize other renewable technologies. As Moñanes et al (2023) highlight, limited access to renewable energy among marginalized groups is not merely an energy-system issue, but a deeply systemic problem. Even within a program designed to assist a more diverse population of local residents, research from Si & Stephens [35] found procedural inequities and structural bias in how a solar financing program in Massachusetts (USA) is designed. Solar policies and programs must therefore be situated within a broader framework that addresses structural barriers. In the USA, such policies and programs may be considered forms of affirmative action.
Finally, reducing administrative complexity is necessary for lowering barriers in adoption, including for those purchasing systems outright, without financial support. Standardizing the application process and creating greater procedural consistency across municipal and provincial jurisdictions would enhance efficiency and transparency. We recommend the development towards a publicly accessible framework that clearly outlines the regulatory, legal and procedural requirements for rooftop solar adoption. Jurisdictions outside of Canada have already demonstrated this such as Germany’s Energiewende policies that reduce bureaucratic hurdles by standardizing solar permitting at the federal level [49]. Such a tool would not only simplify navigation for prospective adopters but also improve confidence in the process by minimizing uncertainty and delays.
5.11. Limitations and Calls for Future Research
Like all research, the pilot study presented here has several limitations, some of which may provide opportunities for future research. First, due to time and resource constraints, our sample is relatively small. We fully sampled from communities with fewer than 20 streets, meaning that we likely missed a portion of households in larger communities such as Halifax and Dartmouth. Even though it is unlikely, it is entirely possible for our results to be inaccurately representing the population given the potential for sampling errors. Still, due to our random sampling procedure, we do not expect the omitted households to differ significantly to their demographic profiles. Another shortcoming was that some groups of people may be underrepresented in our sample due to individuals choosing not to participate in this study. This underrepresentation can be referred to as the self-selection bias, a common bias found in studies that involve surveys and occurs when people voluntarily choose to participate [50].
There are several areas where we call for future research in assessing levels of participation and equity of solar adoption at regional levels. Due to time constraints, this study excluded certain variables and methods, including large-scale solar adopters such as community solar gardens. We also omitted renters and non-homeowners, a notable limitation given their exclusion from rooftop solar access. Future quantitative and qualitative research comparing adopters and non-adopters across these groups could reveal additional inequities within regional solar energy transitions.
Future research on assessing participation and equity in solar energy adoption should also prioritize a more nuanced understanding of intersectionality and how it may shape inequities. This could include interview work with respondents to capture deeper perspectives and contextual understanding. For example, understanding how gender roles may affect decision-making dynamics within households could help explain the higher representation of men participating in solar adoption. This is important since our study did not assess how different aspects of a respondents’ social, political, and economic identity may combine with one another in a way that creates unique barriers to solar adoption. Additionally, future research could investigate the overrepresentation of men in solar adoption to better understand how gender roles, decision-making dynamics, and access to financial or technical resources influence participation.
Finally, future research should be conducted at larger geographic levels such as the provincial level to assess how solar adoption has been equitable and may vary through place. Studies could compare the levels of equity in solar adoption between multiple municipalities and how provincial governance systems affect solar adoption at municipal or more regional levels.
6. Conclusions
This study analyzed participation, inclusion, and equity of residential solar energy adoption by owners within the Halifax Regional Municipality. Quantitative data analysis found a higher participation rate of men, people who were financially affluent, securely employed, highly educated, married and white in our respondents. By comparing our participants to HRM’s census data, we found an underrepresentation of participants with demographic traits typically associated with socioeconomic marginalization. This underrepresentation of certain communities and traits in residential solar adoption shows that there are inequities present in the development of solar uptake - that participation is both unequal and possesses barriers to adoption. These of inequities found in the participants of this research also aligns with those of recent studies that have been conducted in North America, Europe and Asia. We argue that this reflects the prevalence of broader, systemic inequities that influence residential solar uptake patterns.
We call on future research that investigates solar equity to include non-solar owners to participate in such work. This would further the understanding of barriers that inhibit access to rooftop solar for residents at both local and regional levels. We also encourage future studies to undertake a more nuanced understanding of incorporating intersectionality into similar research. Assessing how different aspects of participants’ social, political, economic and lived experiences combine to create different types of access to solar adoption, would capture a deeper understanding of how inequities may be forming in the process of adopting solar.
Author Contributions
Conceptualization, C.W.; methodology, C.W. and M.S.; formal analysis, M.S.; investigation, C.W.; resources, C.W.; data curation, M.S. and C.W.; writing—original draft preparation, M.S.; writing—review and editing, C.W. and M.S.; visualization, M.S.; supervision, C.W.; project administration, C.W. and M.S.; funding acquisition, C.W. All authors have read and agreed to the published version of the manuscript.
Funding
This research was funded by both the Halifax Climate Investment, Innovation, and Impact Fund, as well as a Social Sciences and Humanities (SSHRC) Explore Grant.
Data Availability Statement
The data associated with this study is unable to be shared due to privacy and ethical considerations.
Acknowledgments
We would like to give thanks to the participants of this study whose insights and experiences were invaluable to the development of this project. This work was supported with funding from the Social Sciences and Humanities Research Council and the Halifax Climate Investment, Innovation and Impact Fund. Thank you for the generous contributions that made this research possible.
Conflicts of Interest
The authors declare no conflicts of interest. The funders of this study had no role in the design of the study; in the collection, analyses, or interpretation of data; in the writing of the manuscript; or in the decision to publish the results.
Appendix A - Survey
Part 1 - Personal Information:
- I confirm that I am over 18 years old and have received the information letter in the mail. I have read and understand the contents of the letter and agree to its terms.
Yes
No
- 2.
- Name:
- 3.
- Home Address (required for verification):
__________________________________________________________
- 4.
- Email Address:
- 5.
- Phone number:
- 6.
- Are you a homeowner?
Yes
No
- 7.
- Have you adopted solar energy via the Solar City program?
Yes
No
- 8.
- If you answered no to the above, did you adopt solar energy via another program? If so, which one (if any)?
- 9.
- How did you learn about the Solar City program?
Search engine (such as Google or Bing)
Social Media
Referral
Street advertisement
Word of mouth
Solar energy provider
Halifax Regional Municipality website
Halifax Regional Municipality employee
Other
Part 2 - Sociodemographic information: Please check the box for the most accurate answer below.
- 10.
- Homeownership status:
Homeowner
non-homeowner
- 11.
- Occupation: What is the most accurate title of your occupation?
- 12.
- Personal income level:
Between $0 to $20K
Between $20K to $40K
Between $40K to $60K
Between $60K to $80K
Between $80K to 100K
Between $100k to $120K
Between $120K to $140K
Between $140K to $160K
Between $160K to $180K
Between $180K to $200K
Between $200K to $220K
Above $220K (Please specify if comfortable): ______________________________
- 13.
- Household income level:
Between $0 to $20K
Between $20K to $40K
Between $40K to $60K
Between $60K to $80K
Between $80K to 100K
Between $100k to $120K
Between $120K to $140K
Between $140K to $160K
Between $160K to $180K
Between $180K to $200K
Between $200K to $220K
Between $220K to $240K
☐ Above 240K (Please specify): _____________________________________________
- 14.
- Housing Affordability: Do you spend more than 30% of before-tax household income on housing (i.e. rent, or mortgage)? For example, if your before-tax household income was $6000, 30% would be $1800.
Yes
No
- 15.
- Housing Adequacy: Does your household need major repairs? Major repairs include plumbing, electrical wiring, ceiling and wall repairs.
Yes
No
- 16.
- Energy costs: Does your household spend more than 10% of your before-tax income on household energy costs? (heating, electricity, natural gas). For example, if yourbefore-tax household income was $6000, 10% would be $600.
- 17.
- Age range:
18 to 24 years
25 to 34 years
35 to 44 years
45 to 54 years
55 to 64 years
65 to 74 years
75 to 84 years
85 to 94 years
- 18.
- Household Size:
1 person
2 persons
3 persons
4 persons
5 or more persons
- 19.
- Relationship Status:
Single
Married
Common Law
- 20.
- Education Level
Elementary level
Highschool diploma
Some college
College certificate
College diploma
Some university
Bachelor’s degree
Master’s degree
Doctorate
- 21.
- Do you identify as a visible minority?
Yes
No
- 22.
- Ethnic and/or cultural origin This list is based on the 20 most prevalent ethnic identities in Halifax from the 2021 Canadian Census
Canadian
Caucasian (white)
Scottish
English
Irish
French
German
Dutch
British Isles
European, n.o.s
Acadian
Chinese
Italian
Mi’kmaq, n.o.s.
Indian
Nova Scotian
African Nova Scotian
Welsh
Black
South Asian
Other, please specify:
- 23.
- Birthplace
Canada
Outside of Canada
- 24.
- Do you identify as Indigenous?
Yes, Inuit
Yes, Metis
Yes, First Nations
No, I do not identify as Indigenous
- 25.
- Residency Status:
Canadian Citizen
Permanent Resident of Canada
Part-year Resident
Non-resident of Canada
Other
- 26.
- Do you identify as a person with a disability?
Yes
No
- 27.
- Gender Identity:
Female
Male
Non-binary
Other
- 28.
- The 2SLGBTQIA+ acronym stands for: Two Spirited, Lesbian, Gay, Bisexual, Transgender, Queer or Questioning, Intersex, Asexual and Androgynous.
Do you identify as a member of the 2SLGBTQIA+ community?
Yes
No.
If yes, please specify which aspect(s) of the community you identify with.
- 29.
- Did you have any experiences that created any problems or barriers toward your desire to adopt solar energy? Please respond in a maximum of 5 sentences in the space below:
Thank you for your participation in this survey, your answers will help us to determine how equitable Halifax’s solar energy transition has been and how to create pathways for a just solar energy transition. For the second part of this research, our lab will interview selected survey respondents. The purpose of these interviews is to gain further understanding of the experiences, barriers and stories of the participants of this survey. We will use interview responses to help curate recommendations for the Solar City program and Halifax’s solar energy transition. These recommendations aim to increase access to solar energy for residents of Halifax.
Please indicate whether or not you would be interested in participating in a follow-up interview after your survey has been received by us:
Yes
No
Thank you again for your participation in this study
Kind Regards,
Chad Walker Myah Shantz
Assistant Professor Master of Planning Candidate
References
- United Nations Framework Convention Climate Change. The Paris Agreement. United Nations Framework Convention on Climate Change. 2018. https://unfccc.int/sites/default/files/resource/parisagreement_publication.
- Government of Canada. Net-zero emissions by 2050. Environment and Natural Resources. Climate change. 2024. Net-zero emissions by 2050 - Canada.
- Canada Energy Regulator. Provincial and Territorial Energy Profiles – Nova Scotia. 2024.
- Government of Nova Scotia. Nova Scotia’s 2030 Clean Power Plan. Nova Scotia Department of Natural Resources and Renewables. 2022. https://beta.novascotia.ca/sites/default/files/documents/1-3582/nova-scotia-clean-power-plan-presentation-en.pdf.
- Halifax Regional Municipality. HalifACT Acting on Climate Together. June 2020. https://cdn.halifax.ca/sites/default/files/documents/about-the-city/energy-environment/HRM_HaliFACT_vNew%20Logo_.pdf.
- Sovacool, B.K.; Barnacle, M.L.; Smith, A.; Brisbois, M.C. Towards improved solar energy justice: Exploring the complex inequities of household adoption of photovoltaic panels. Energy Policy 2022, 164. [Google Scholar] [CrossRef]
- Government of Canada. Canada Greener Homes Grant. 2024. https://natural-resources.canada.ca/energy-efficiency/homes/canada-greener-homes-initiative/canada-greener-homes-grant/canada-greener-homes-grant/23441.
- Jeffery, T. Retrofitting for a sustainable future: transforming existing homes into sustainable assets. [Master’s thesis, Laurentian University]. 2024. Laurentian University Scholar’s Portal. https://laurentian.scholaris.ca/items/1bd050c2-6d3b-4bdc-bb7a-ebc9f9324b95.
- Efficiency Nova Scotia. SolarHomes. 2025. https://www.efficiencyns.ca/programs-rebates/solarhomes.
- Mabee, W.E.; Mannion, J.; Carpenter, T. Comparing the feed-in tariff incentives for renewable electricity in Ontario and Germany. Energy Policy 2012, 40, 480–489. [Google Scholar] [CrossRef]
- Stokes, L.C. The politics of renewable energy policies: The case of feed-in tariffs in Ontario, Canada. Energy Policy 2013, 56, 490–500. [Google Scholar] [CrossRef]
- Edalatnia, S.; Das, R. A review of LIC and PACE programs in Canada. Volta Research Inc. 2023. https://voltaresearch.org/files/review-of-lic-pace-programs.pdf.
- Berton, H.; Rosenbloom, D.; Temby, O.; Meadowcroft, J. USING LOCAL IMPROVEMENT CHARGES TO FINANCE SOLAR PHOTOVOLTAIC SYSTEMS IN CANADA. Energy Stud. Rev. 2017, 22. [Google Scholar] [CrossRef]
- Tidwell, J.H.; Tidwell, A. Decarbonizing via disparities: Problematizing the relationship between social identity and solar energy transitions in the United States. Energy Res. Soc. Sci. 2021, 77. [Google Scholar] [CrossRef]
- Walker, C.; Poelzer, G.; Leonhardt, R.; Noble, B.; Hoicka, C. COPs and ‘robbers?’ Better understanding community energy and toward a Communities of Place then Interest approach. Energy Res. Soc. Sci. 2022, 92. [Google Scholar] [CrossRef]
- Kraaijvanger, C.; Verma, T.; Doornm, N.; Goncalvesm, J. Does the sun shine for all? Revealing sociospatial inequalities in the transition to solar energy in The Hague, The Netherlands. Elsevier. 2023. 104: 10.3245.
- O’sHaughnessy, E. Toward a more productive discourse on rooftop solar and energy justice. Joule 2021, 5, 2535–2539. [Google Scholar] [CrossRef]
- Hoesch, W.; Bessette, L.; Bednar, J. Locally charged: Energy justice outcomes of a low-income community solar project in Michigan. Energy Research & Social Science 2024, 113, 103569. [Google Scholar] [CrossRef]
- United Nations. Just Transition. 2023. https://www.un.org/development/desa/dpad/wp-content/uploads/sites/45/CDP-excerpt-2023-1.pdf.
- Mathew, T.C.; Pandian, S.N. Unveiling the shadows: a qualitative exploration of barriers to rooftop solar photovoltaic adoption in residential sectors. Clean Energy 2024, 8, 218–228. [Google Scholar] [CrossRef]
- Devine-Wright, P.; Wiersma, B. Understanding community acceptance of a potential offshore wind energy project in different locations: An island-based analysis of ‘place-technology fit’. Energy Policy 2020, 137. [Google Scholar] [CrossRef]
- Dunlop, T. Mind the gap: A social sciences review of energy efficiency. Energy Res. Soc. Sci. 2019, 56, 101216. [Google Scholar] [CrossRef]
- Walker, C.; Rowlands, I.H.; Devine-Wright, P.; Soutar, I.; Wilson, C.; Gupta, R.; Devine-Wright, H.; Bishwokarma, J.; Ford, R. The “four Ds” and support for Local Smart Grids: analysis from national surveys in the UK and Canada. Oxf. Open Energy 2024, 3. [Google Scholar] [CrossRef]
- Montañés, C.C.; O’sHaughnessy, E.; Bednar, D.; Nock, D.; Carley, S.; Kammen, D.M.; Konisky, D.M. Enabling and centering equity and justice in clean energy transition research. Joule 2023, 7, 437–441. [Google Scholar] [CrossRef]
- Holt, E.G.; Sunter, D.A. National disparities in residential energy tax credits in the United States. Energy 2024, 300. [Google Scholar] [CrossRef]
- Barbose, G.; Forrester, S.; O’Shaughnessy, E.; Darghouth, N. Residential Solar-Adopter Income and Demographic Trends: 2022 Update. Energy Markets & Policy 2022, Berkeley Lab.
- Dolter, B.D.; Boucher, M. Solar energy justice: A case-study analysis of Saskatchewan, Canada. Applied Energy 2018, 225, 221–232, 10. [Google Scholar] [CrossRef]
- Ahmed, F. Towards an equitable transition: Renewable energy effect on educational outcomes in Canadian communities. Renew. Energy 2025, 256. [Google Scholar] [CrossRef]
- Miller, A.; Parkins, J. (2023). Contending with equity ownership in Indigenous renewable energy projects in Alberta, Canada. Journal of Rural and Community Development 2023, 18 (2).
- Paquet, A.; Cloutier, G.; Blais, M. Renewable Energy as a Catalyst for Equity? Integrating Inuit Interests With Nunavik Energy Planning. Urban Plan. 2021, 6, 338–350. [Google Scholar] [CrossRef]
- Mercer, N.; Hudson, A.; Martin, D.; Parker, P. “That’s Our Traditional Way as Indigenous Peoples”: Towards a Conceptual Framework for Understanding Community Support of Sustainable Energies in NunatuKavut, Labrador. Sustainability 2020, 12, 6050. [Google Scholar] [CrossRef]
- Walker, C.J.; Doucette, M.B.; Rotz, S.; Lewis, D.; Neufeld, H.T.; Castleden, H. Non-Indigenous partner perspectives on Indigenous peoples' involvement in renewable energy: exploring reconciliation as relationships of accountability or status quo innocence? Qual. Res. Organ. Manag. Int. J. 2021, 16, 636–657. [Google Scholar] [CrossRef]
- Stefanelli, R.D.; Walker, C.; Kornelsen, D.; Lewis, D.; Martin, D.H.; Masuda, J.; Richmond, C.A.M.; Root, E.; Neufeld, H.T.; Castleden, H. Renewable energy and energy autonomy: how Indigenous peoples in Canada are shaping an energy future. Environ. Rev. 2019, 27, 95–105. [Google Scholar] [CrossRef]
- Min, Y.; Lee, H.W. Quantifying clean energy justice: Impact of Solarize programs on rooftop solar disparities in the Pacific Northwest. Sustain. Cities Soc. 2024, 104. [Google Scholar] [CrossRef]
- Si, Y.; Stephens, J.C. Energy Justice Through Solar: Constructing and Engaging Low-Income Households. Front. Sustain. Cities 2021, 3. [Google Scholar] [CrossRef]
- Zandbergen, P.A. Geocoding Quality and Implications for Spatial Analysis. Geogr. Compass 2009, 3, 647–680. [Google Scholar] [CrossRef]
- Graziano, M.; Gillingham, K. Spatial patterns of solar photovoltaic system adoption: The influence of neighbors and the built environment. J. Econ. Geogr. 2014, 15, 815–839. [Google Scholar] [CrossRef]
- Government of Nova Scotia. Socioeconomic Profile of 2SLGBTQ+ Canadians, 2019/2021. Finance and Treasury Board. 2024. https://novascotia.ca/finance/statistics/news.asp?id=19630.
- Government of Canada. Federal action for 2SLGBTQIA+ Communities. 2025. https://www.canada.ca/en/women-gender-equality/free-to-be-me/federal-action-2slgbtqi-communities/facts-stats.html.
- Government of Canada. Canada’s Disability Inclusion Action plan, 2022. 2025 https://www.canada.ca/en/employment-social-development/programs/disability-inclusion-action-plan/action-plan-2022.html.
- Venkatesan, S. Empowering Inclusivity: Green Energy Technology for People with Disabilities. Int. J. Sci. Res. (IJSR) 2024, 13, 1620–1624. [Google Scholar] [CrossRef]
- Hoicka, C.E.; Savic, K.; Campney, A. Reconciliation through renewable energy? A survey of Indigenous communities, involvement, and peoples in Canada. Energy Res. Soc. Sci. 2021, 74. [Google Scholar] [CrossRef]
- De Groote, O; Peppermans, G.; Verboven, F. Heterogeneity in the adoption of photovoltaic systems in Flanders. Elsevier 2016 Volume 59.
- Sunter, D.A.; Castellanos, S.; Kammen, D.M. Disparities in rooftop photovoltaics deployment in the United States by race and ethnicity. Nat. Sustain. 2019, 2, 71–76. [Google Scholar] [CrossRef]
- Raphael, D.; Bryant, T.; Mikkonen, J.; Raphael, A. Social Determinants of Health: The Canadian Facts. Oshawa: Ontario Tech University Faculty of Health Sciences and Toronto: York University School of Health Policy and Management. 2020.
- Halifax Regional Municipality. About Solar City. 2023 https://www.halifax.ca/home-property/solar-projects/about-solar-city.
- Halifax Regional Municipality. (February 2024). Halifax Solar City Program Update – 2023. Halifax Solar City Program Update - 2023, Environment and Sustainability Standing Committee March 7, 2024 | Halifax.ca. 20 February.
- Sher, A.; Qiu, Y. Pakistan's solar mission: Do solar finance and subsidy remove the barriers to solar installations? Renew. Energy 2022, 190, 993–1005. [Google Scholar] [CrossRef]
- Global Legal Group. Renewable Energy Laws and Regulations Germany 2025. 2024. https://iclg.com/practice-areas/renewable-energy-laws-and-regulations/germany.
- Elston, D.M. Participation bias, self-selection bias, and response bias. J. Am. Acad. Dermatol. 2021. [Google Scholar] [CrossRef]
Figure 1.
Sample of homes in the HRM that were sent a survey (n=1350).
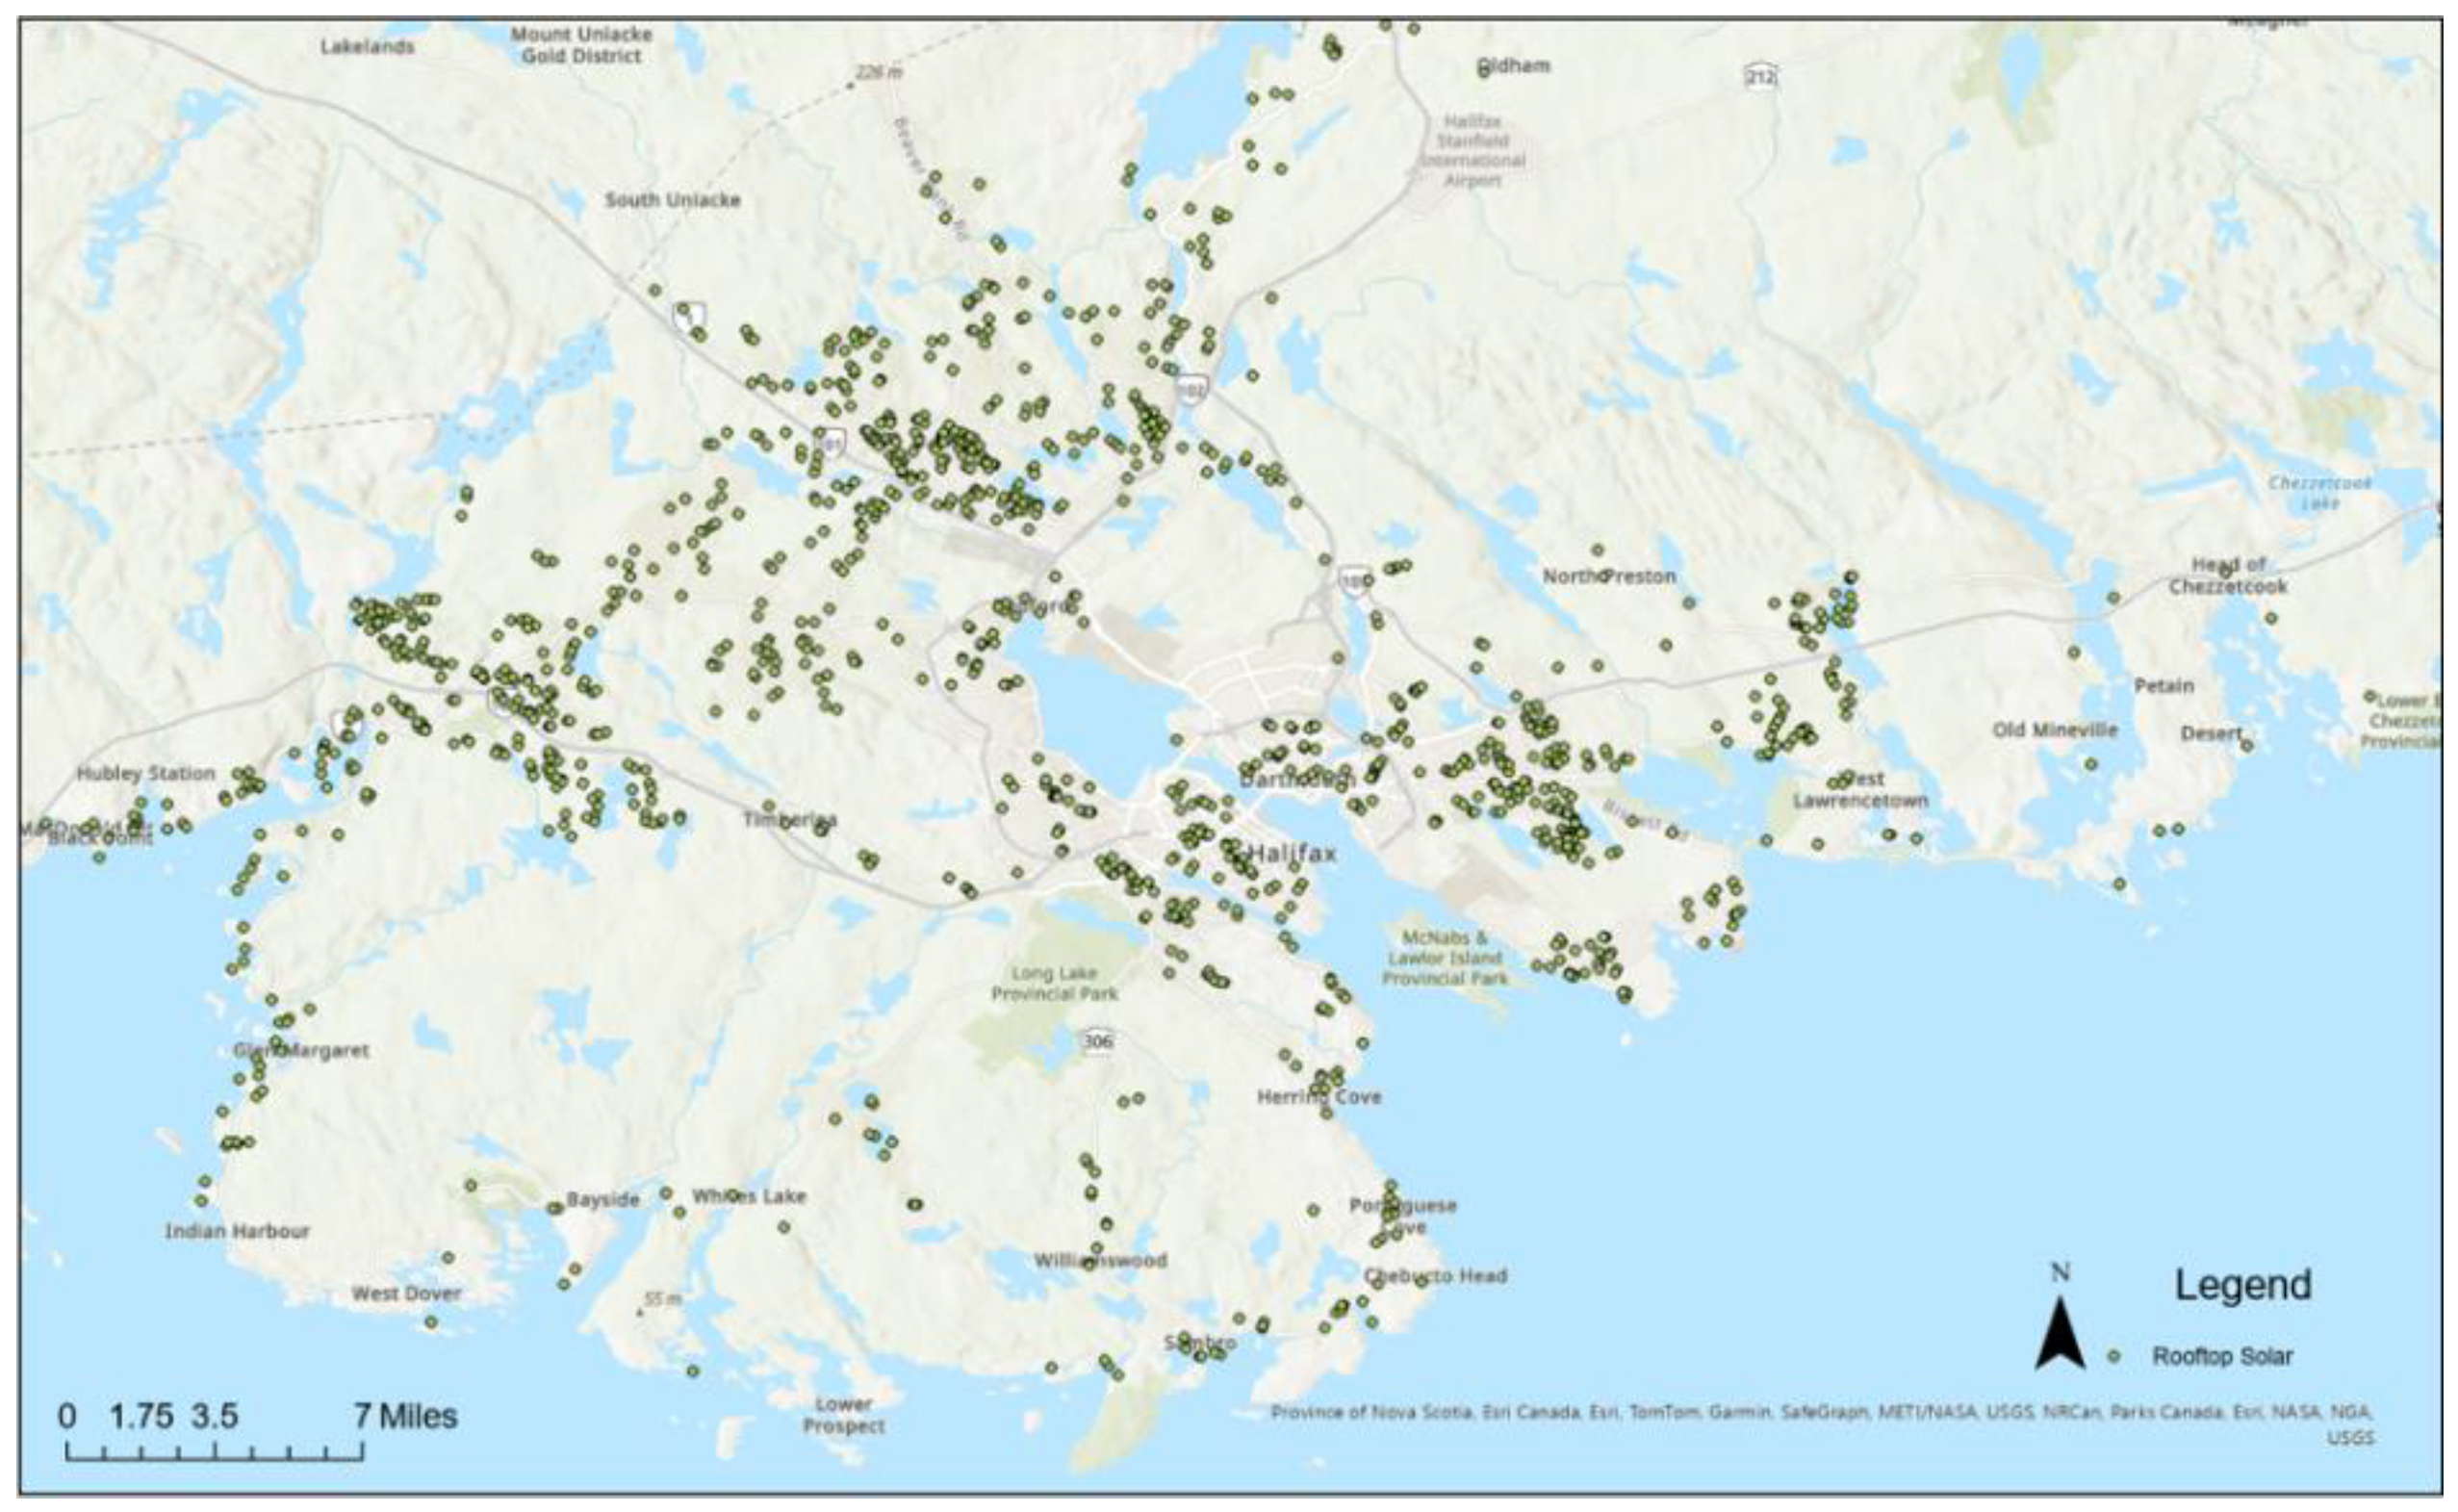
Table 1.
Survey Variables.
| Homeownership Rates (excluded from present analyses) | Relationship Status |
| Age Characteristics | Education Levels |
| Occupation | Visible Minority Status |
| Personal Income Levels | Ethnic and Cultural Origin |
| Household Income Levels | Birthplace |
| Housing Affordability (excluded from present analyses) | Indigenous Identity |
| Housing Adequacy (excluded from present analyses) | Residency Status |
| Household Energy Costs (excluded from present analyses) | Disability |
| Household Size | Gender Identity |
Table 8.
Core Housing Need and Barriers Experienced by Respondents.
| Core Housing Need and Barriers Crosstab (%) | ||
|---|---|---|
| Core Housing Need | No Barriers | Barriers |
| No | 47.36 | 52.63 |
| Yes | 28.50 | 71.14 |
| Total | 25.57 | 54.42 |
Independent sample t-test p = 0.091.
Disclaimer/Publisher’s Note: The statements, opinions and data contained in all publications are solely those of the individual author(s) and contributor(s) and not of MDPI and/or the editor(s). MDPI and/or the editor(s) disclaim responsibility for any injury to people or property resulting from any ideas, methods, instructions or products referred to in the content. |
© 2025 by the authors. Licensee MDPI, Basel, Switzerland. This article is an open access article distributed under the terms and conditions of the Creative Commons Attribution (CC BY) license (http://creativecommons.org/licenses/by/4.0/).
Copyright: This open access article is published under a Creative Commons CC BY 4.0 license, which permit the free download, distribution, and reuse, provided that the author and preprint are cited in any reuse.


