
Submitted:
28 November 2025
Posted:
02 December 2025
You are already at the latest version
Abstract
Background/Objectives: Type II endoleak (T2EL) remains the most frequent complication after endovascular aortic aneurysm repair (EVAR), with uncertain clinical relevance and management. While most resolve spontaneously, persistent T2ELs can lead to sac enlargement and rupture risk. This study proposes a deep learning framework for preoperative prediction of T2EL occurrence and severity using volumetric computed tomography angiography (CTA) data.Methods: A retrospective analysis of 287 patients undergoing standard EVAR (2010–2024) was performed. Preoperative CTA scans were processed for volumetric normalization and fed into a 3D convolutional neural network (CNN) trained to classify patients into three categories: no T2EL, benign T2EL, or malignant T2EL. The model was trained on 224 cases, validated on 33, and tested on an independent cohort of 30 patients. Performance metrics included accuracy, precision, recall, F1-score, and area under the receiver operating characteristic curve (AUC).Results: The CNN achieved an overall accuracy of 76.7% (95% CI: 0.63–0.90), macro-averaged F1-score of 0.77, and AUC of 0.93. Class-specific AUCs were 0.93 for no T2EL, 0.91 for benign, and 0.96 for malignant cases, confirming high discriminative capacity across outcomes. Most misclassifications occurred between adjacent categories.Conclusion: This study introduces the first end-to-end 3D CNN capable of predicting both presence and severity of T2EL directly from preoperative CTA, without manual segmentation or handcrafted features. These findings suggest that preoperative imaging encodes latent structural information predictive of endoleak-driven sac reperfusion, potentially enabling personalized pre-emptive embolization strategies and tailored surveillance after EVAR.
Keywords:
type II endoleak
; abdominal aortic aneurysm
; endovascular aortic repair
; tomography
; deep learning
; neural networks
; artificial intelligence
1. Introduction
Endovascular aortic aneurysm repair (EVAR) has emerged as the primary treatment option for abdominal aortic aneurysm (AAA) with a permissive anatomy.[1] Despite the early benefits, Endoleaks remain the most common complications after EVAR and the risk of related reinterventions remains significant.[2] Type I and III endoleaks are due to direct sac perfusion: Type I arises from inadequate sealing between the endograft and the healthy vessel wall, whereas Type III results from structural defects or component separations within the endograft.[3,4] These hight pressure leaks are known to be related to a significant rupture risk and have a strong indication for surgical correction.[1,5] In contrast, the management and clinical relevance of type II endoleak (T2EL), which is caused by retrograde sac feeding by branch vessels, remains controversial (Figure 1). Many T2ELs resolve spontaneously, but a subset of patients develop persistent T2EL and recent European Society for Vascular Surgery (ESVS) guidelines consider reintervention only in the presence of ≥ 10 mm aneurysm sac growth compared with baseline or with the smallest diameter during follow-up using the same imaging modality and measurement method.[1] Pre-emptive embolization of the side branches has been proposed to decrease the risk of T2EL and, consequently, possible aneurysm growth with sealing loss.[6,7] However, these techniques increase procedure time, cost, and risk of complications. Even if current literature suggests a positive effect of pre-emptive embolization of side branches on T2EL and related reintervention rate, the clinical benefit of this procedure has not been clearly confirmed[6,7,8]. The current guidelines suggest considering the pre-emptive feeding vessel embolization only in very selected cases.[1] Over the past decade, the extraction of quantitative radiomic features (RF) from medical images has gained extensive attention for its ability to provide detailed quantitative signatures of disease states, enabling the diagnosis and prediction of treatment outcomes[9,10,11]. In the field of artificial intelligence (AI), deep learning algorithms can be used to analyse entire volumes of computed tomography (CT) images, providing decision support tools aiding patient management[12]. To date, no comprehensive Deep Learning analysis has been performed for the prediction of T2EL causing sac enlargement based on preoperative CT scans. Such models may be helpful to predict which patients could benefit from pre-emptive treatment to prevent T2EL-related sac growth.
2. Materials and Methods
2.1. Study Design and Population
This retrospective study included patients who underwent EVAR at a single tertiary-level vascular referral center. Data about all the patients treated from 2010 to 2024 were extracted from a prospectively maintained database and screened for inclusion criteria.
The study was approved by the local Ethics Committee (2025-00343 CE 4781).
This research was in accordance with the World Medical Association Declaration of Helsinki and the data underlying this article will be shared on reasonable request to the corresponding author.
Written informed consent was obtained for all individuals treated after 2020, for the others consent was obtained through a no objection letter.
2.2. Inclusion and Exclusion Criteria
The final cohort consisted of 287 patients who fulfilled the following inclusion criteria (Figure 2):
- Age >18 years.
- Treatment with standard EVAR performed according to the manufacturer’s instructions for use for AAA.
- Non-ruptured AAA.
- Minimum follow-up of 1 year.
- Availability of a 1–3-month postoperative computed tomography angiography (CTA).
- Availability of a preoperative CTA.
- For patients with T2EL at least one additional CTA at least 6 months after the detection.
- Adequate CTA image quality (slice thickness ≤2.5 mm), including coverage from the celiac trunk to the external iliac vessels.
The minimum clinical and radiological (CTA or duplex ultrasound) follow-up requested was 12 months. Complete documentation of any development of T2EL and their clinical evolution was also required.
Patients with preoperative CT images of inadequate quality or with significant artefacts, incomplete follow-up or less than 12 months, and incomplete clinical data or lack of outcome documentation were excluded from the study.
2.3. Data Collection
The dataset included patients’ baseline (age, gender, comorbidities) and contained details from the pre-operative and post-EVAR CT scans at 1-3 months and during follow-up. All the CT scans were acquired at the Imaging Institute of Southern Switzerland (IIMSI), Ente Ospedaliero Cantonale (EOC), Switzerland, using four 128-slice Siemens CT scanners (Somatom Definition Edge, Siemens Healthineers; Erlangen, Germany), one 256-slice Philips CT scanner (Philips Brilliance iCT 256 Slice, Philips Healthineers, Best, Nederland) and one 256-slice Siemens CT scanner (Somatom Definition Flash, Siemens Healthineers; Erlangen, Germany).
The acquisition protocol included an arterial phase performed in dual energy followed by a venous phase acquisition limited to the extent of the stent graft, with a reconstructed slice thicknesses between 0.5 and 2-5 mm per slice.[13] All the CTs were evaluated by two dedicated vascular radiologists with more than 20 years of experience. All CT angiographies with findings outside the normal range or considered uncertain were reviewed in a multidisciplinary board meeting involving radiologists, vascular surgeons, and angiologists.[14]
All images in the dataset have been anonymized and converted to a standardised format for processing using deep learning. The images were pre-processed to standardise size and voxel spacing and normalised (mean = 0.196, standard deviation = 0.246), thus ensuring consistency of the data input to the neural network.
2.4. CT Angiography Protocol
CT scans was performed using the following acquisition protocol:
- Helical scan from lung apices to small truncus.
- kV = 100; pitch = 1.50; acquisition (mm) = 64 x 0.60.
- Bolus tracking 2 cm below the tracheal bifurcation, with ROI in the ascending arch.
- Bolus tracking scan delay plus 7 seconds.
- No ECG synchronization and no patient apnea during the scan.
- Contrast medium injection: 15 ml NaCl at 5.0 ml/s followed by 100 ml Accupaque 350 at 5.0 ml/s and followed by 50 ml NaCl at 5.0 ml/s.
2.5. Endoleak Evaluation
For the study anonymized CTA scans were independently evaluated by two experienced vascular operators (vascular surgeon and vascular radiologist) with more than 40 cases/year experience. The evaluation was carried on with a dedicated analysis software (SyngoVia; Siemens Healthineers, Forchheim, Germany).
The maximum sac diameter, the presence of a T2EL and the type and number of vessels involved in the endoleak were recorded from each CTA examination.
A 5% interobserver discrepancy in measurement was acceptable, with larger variations resolved by a third investigator. Both primary investigators evaluated 10 CTAs twice, with a one-month interval. The intraobserver difference remained within 2% for diameters. The presence or not of T2EL and the involvement of feeding vessels was assessed at a glance, and the accordance was 100%.
The aneurysm sac growth (D3) was calculated through the formula D3 = D2-D1, where D1 represents the maximum aneurysm sac diameter at the 1-3 months post-operative CTA and D2 represents the maximum sac diameter at the last available CTA scan.
T2ELs were classified as ‘benign’ if they were not associated with aneurysm sac expansion ≥5 mm, did not require T2EL-related reintervention, and were not linked to any complications. Conversely, T2ELs were classified as ‘malignant’ if they were associated with sac expansion >5 mm and/or required reintervention due to related complications [15,16].
All re-interventions were performed for aneurysm growth more than 5mm in a year or absolute growth more than 1cm as well as for every case of symptomatic or ruptured AAA due to T2EL.[1]
2.6. Patient Stratification
Based on these criteria, patients were stratified into three classes: Class A includes patients without development of T2EL during follow-up, Class B includes patients with “benign” T2EL, and Class C groups patients with “malignant” type II endoleaks.
The dataset was divided into three sets:
- A training set consisting of 185 cases, 150 Class A, 20 class B and 15 class C.
- A validation set consisting of 52 cases, 44 class A, 4 class B and 4 class C.
- A test set consisting of 30 cases, 10 class A, 10 class B and 10 class C.
2.7. Data Augmentation
To increase the robustness of the model and prevent overfitting, a data augmentation strategy was implemented on the entire CT scan volume and applied dynamically during the training phase on the Training Set. The augmentation techniques were implemented using the torchvision-transforms library and include random variations in brightness and contrast to simulate variability in CT acquisitions, random image rotations in a range of ±10 degrees to simulate variability in patient positioning, and random horizontal and vertical flipping with a probability of p = 0.5 for each direction. These transformations were applied stochastically during each training epoch, generating a virtually larger and more diverse dataset without introducing significant anatomical distortions.
2.8. Model Architecture
The present deep learning model was based only on the pre-operative CTA. The deep learning architecture (Figure 3) based on 3D convolutional neural networks (3D CNNs) was developed for the volumetric analysis of preoperative CT angiography images.
The input data consists of pre-processed 3D CT volumes of pre-operative CT angiograms with standardized dimensions of 256×512×512 voxels, normalized in intensity using z-score normalization. Each volume represents the anatomical region of interest containing the abdominal aorta and related vascular structures. The model output is a probabilistic prediction on three mutually exclusive classes: Class A, Class B, and Class C. The model returns a probability vector for each class, with the predicted class determined by the maximum probability using softmax classification.
The complete architecture of the model is based on a deep 3D CNN network with residual connections (ResNet). The channel expansion follows a 32→64→128→256→512 pattern. The network consists of an initial convolutional block and four main residual blocks for feature extraction:
- Initial Block (1→32 channels): a single 3D convolutional layer (3x3x3 kernel, padding=1) followed by batch normalisation and GELU activation. The spatial output dimensions remain 256×512×512.
- Residual Block 1 (32→64 channels): introduces the first dimensional reduction. It consists of two convolutional layers (32→32 and 32→64) and a 1x1x1 shortcut connection (32→64). Downsampling is achieved via an anisotropic stride (1, 2, 2) in both the main convolution and the shortcut. Includes batch normalisation, GELU and 3D dropout (p=0.3). Output dimensions: 256×256×256.
- Residual Block 2 (64→128 channels): follows a similar residual structure (conv 64→64 and 64→128; shortcut 64→128) using a stride (2, 2, 2) for downsampling. Includes batch normalisation, GELU, and 3D dropout (p=0.3). Output dimensions: 128×128×128.
- Residual Block 3 (128→256 channels): expands channels to 256 (conv 128→128 and 128→256; shortcut 128→256) with stride (2, 2, 2). Dropout is increased to p=0.4. Output dimensions: 64×64×64.
- Residual Block 4 (256→512 channels): final block (conv 256→256 and 256→512; shortcut 256→512) with stride (2, 2, 2) and dropout (p=0.4). Output dimensions: 32×32×32.
- Pooling: the final feature maps (512 channels) are processed by an Adaptive Average Pooling 3D layer that reduces the output to a single 512-dimensional vector.
- The extracted features are then processed through a fully connected classifier (MLP) consisting of three dense layers (512→256→128→3) with GELU activation functions and dropout regularisation (p=0.4 for the first layer, p=0.3 for the second). The output layer uses softmax activation for multi-class probabilistic prediction.
Batch normalisation is applied after each 3D convolutional layer (including in shortcuts) to stabilise training and accelerate convergence. GELU (Gaussian Error Linear Unit) activation functions are used throughout the network, providing smoother gradients.[17] Dropout regularisation increases progressively in the deeper convolutional layers (from 0.3 to 0.4) to prevent overfitting.[18] The model was trained using the categorical cross-entropy loss function, the Adam optimiser with adaptive learning rate, and early stopping based on performance on the Validation Set to prevent overfitting.[19]
2.9. Hardware and Software Configuration
The network training was conducted on a system equipped with Ubuntu 24.04 Operating System, an Intel Core i9 14900 k processor, 64 GB of DDR5 RAM and an NVIDIA RTX 4090 GPUs with a total of 24 GB of VRAM. The model was implemented utilizing Python 3.12.3, PyTorch 2.3.0, NVIDIA drivers 570.124.06, NVIDIA CUDA Toolkit 12.8.
2.10. Statistical Analysis and Model Evaluation
The primary purpose of the analysis was to evaluate the ability of the 3D CNN model to correctly classify patients into three predefined categories: Class A (no T2EL), Class B (benign T2EL), and Class C (malignant T2EL).
The model’s performance was evaluated exclusively on the independent test set (n=30), which was not used during the training or validation phases.
Key performance metrics for multi-class classification included:
- Overall accuracy: the proportion of correct predictions out of the total.
- Precision, Recall and F1-Score: these metrics were calculated both for each individual class and as a weighted average (macro-averaged) to provide a balanced assessment of performance across classes, especially in the presence of imbalance in the training dataset.
- Area Under the Receiver Operating Characteristic Curve (ROC): the AUC was calculated for each class (one-vs-rest) to measure the model’s discriminatory power.
- Confusion Matrix: a confusion matrix was generated to analyse classification errors (e.g. false positives and false negatives) between different classes in detail.
The distribution of continuous variables was examined using the Shapiro-Wilk test. For normally distributed variables, mean and standard deviation (SD) were reported, and subgroup comparisons conducted using Student’s t-test. Skewed variables were presented as median [with interquartile ranges (IQR)], and Wilcoxon Rank-Sum test employed to assess differences. For categorical variables, counts and percentages were provided, and subgroup differences evaluated using chi-square test.
For all key metrics, 95% confidence intervals (95CI) were calculated to quantify the uncertainty of the estimate. Statistical significance was set at P < 0.05.
Analyses were conducted using Python (version 3.10.0), STATA 19 (StataCorp College Station, Texas, USA) and Matplotlib (version 3.7.3).
3. Results
3.1. Baseline
The enrolled patients were mostly men (n=253/287) with a median age of 78 [72–82].
According to the study protocol all the patients had a CTA at 1-3 months after the procedure and at which time 62 T2EL were diagnosed. Among them 7 (11.3%) were present at the final intraoperative angiography.
The median follow-up of the entire cohort was 55.5 months [28.03-90.05] and during this time a total of 83 (29.6%) T2EL in single patients were recorded: 39 (46.9%) were classified as “malignant” and 44 (53.1%) as “benign”.
The median time from EVAR to endoleak was 35 [28-113] days with no difference between malignant and benign ones (p=.38).
3.2. Overall Model Performance
The deep learning model developed was evaluated on an independent test set consisting of 30 patients (10 for each class) kept separate du[28–113ring all training and validation phases.
The overall results (Table 1) show that the model achieved an accuracy of 76.67%, corresponding to the correct classification of 23 out of 30 patients.
The macro-averaged metrics, which provide a balanced assessment across all classes, reported an F1 Score of 0.766, a Precision of 0.782, and a Recall of 0.767. The macro-averaged AUC ROC was equal to 0.933 [95CI 0.8715-0.9801], demonstrating the model’s excellent overall discriminatory capacity.
3.3. Performance per class
Analysis of class-specific metrics revealed variations in prediction performance (Table 2).
Class A (No T2EL): This class showed the highest recall, equal to 0.900, indicating that 9 out of 10 patients (True Positives, TP) were correctly identified.
- Class A (No Endoleak): The Precision was 0.692 and the F1 Score was 0.783. Only one patient in this class was a False Negative (FN), while there were 4 False Positives (FP). The ROC AUC was 0.930.
- Class B (Benign T2EL): The classification of T2ELs showed an Accuracy of 0.778, a Recall of 0.700 and an F1 Score of 0.737. The model correctly identified 7 out of 10 patients. Class B was the only one with 3 false negatives and 2 false positives. The ROC AUC was 0.910.
- Class C (Malignant T2EL): The prediction of malignant T2ELs, often considered ‘malignant’ in the follow-up context, achieved the highest accuracy among all classes at 0.875. The recall was 0.700 and the F1 score 0.778. Seven out of ten patients were correctly identified, with only one false positive and three false negatives. This class also had the best ROC AUC at 0.960.
To visualise the discriminatory capacity of the model, the ROC curves for each class are shown in Figure 4.
3.4. Confusion Matrix Analysis
The Confusion Matrix analysis (Table 3) provides a detailed view of the model’s misclassification patterns
Out of the 10 patients belonging to Class A (No T2EL):
- 9 were correctly identified (TP), 90%.
- 1 was misclassified as Class B, 10%.
Of the 10 patients in Class B (Benign T2EL):
- 7 were correctly identified (TP), 70%.
- 2 were misclassified as Class A, 20%.
- 1 was misclassified as Class C, 10%.
Finally, for the 10 patients in Class C (Malignant T2EL):
- 7 were correctly identified (TP), 70%.
- 2 were classified as Class A, 20%.
- 1 was classified as Class B, 10%.
4. Discussion
The present study presents a novel deep learning framework for the preoperative prediction of “malignant” T2EL after standard endovascular aneurysm repair (EVAR), based solely on volumetric CT angiography data.
The management of T2EL remains a controversial question since most of them resolve spontaneously[15] but a subset is associated with sac enlargement and related complications as aneurysm rupture or proximal and distal seal loss.[16,20] Different meta-analysis on the treatment success of T2ELs, report that, despite high technical success rates, these interventions often fail to prevent subsequent aneurysm growth[7,21,22] and robust evidence supporting the clinical benefit of T2EL treatment is lacking.[23] Several authors have proposed risk-factor models to stratify patients at higher risk of T2ELs;[24,25,26] however, these methods are complex, time-consuming, non-standardized, not automated, and they carry a considerable degree of observer dependence, limiting their practicality in routine clinical practice. Furthermore, the current guidelines suggest considering the pre-emptive embolization of the lumbar arteries or the inferior mesenteric artery to prevent T2EL only in very selected cases, failing to identify a validated way to identify them.[1] In this scenario a simple, fast and reproducible way to identify which patients could really benefit of a pre-emptive embolization would be extremely useful in clinical practice.
Several studies[27,28,29] confirmed that CNN models and deep learning architectures allow not only the detection but also the automatic segmentation of aneurysms and endoleaks in post-EVAR images, with performance comparable or superior to expert radiologists in multi-site tests, even on non-contrast scans. This suggests that volumetric quantification and expansion risk are becoming less dependent on manual segmentation and increasingly automatable, as demonstrated by Hahn et al.[28] and Talebi et al.[29] with models achieving AUCs of up to 0.99.
To the best of authors’ knowledge, this is the first end-to-end 3D convolutional neural network (CNN) designed to identify patients with malignant T2EL-directly from raw preoperative CT volumes without the need for handcrafted features or manual segmentation.
The proposed architecture demonstrated encouraging performance, with an overall accuracy of 76.7% and a ROC AUC of 0.933 on an independent test set. The model achieved particularly high discriminative capability in identifying patients without endoleak (AUC 0.930) and those developing malignant forms (AUC 0.960), confirming its potential utility to targeting the patient who could benefit for a pre-emptive treatment to prevent the T2EL after EVAR. The relatively balanced performance across the three classes supports the model’s ability to capture complex spatial and textural information related to collateral perfusion patterns and aortic wall morphology, which are difficult to quantify using conventional radiologic descriptors.
Previous studies applied radiomics and classical machine learning to predict T2EL, obtaining better results compared to our cohort in terms of sensitivity and specificity.[12,27] However, Charalambous et al.[12] proposed a radiomics based approach to identify persistent T2EL dealing with post-operative CTA where the complication is already present. Different papers seem to suggest that the benefit of interventions carried on correcting already present T2EL is limited,[21,23] reducing the clinical benefit of the suggested approach. Additionally, no distinction was made between endoleaks with and without sac enlargement, which remains the only parameter currently correlated with clinical outcomes and the need for reintervention. Furthermore radiomic methods, although powerful, require a manual pipeline for feature extraction, which is subject to inter-observer variability.[30] End-to-end deep learning-based models, on the other hand, learn feature hierarchies directly from voxel-based data, drastically reducing pre-processing and enhancing reproducibility.[11] Podgorsak et al.[31] found that automated CNNs can achieve effective segmentations, surpassing traditional radiomic pipelines in efficiency and scalability. Jinquing Mo et al.[27] employed a ML-based predictive model integrating preoperative clinical data and radiomic features to enable the stratification of patients’ risk to develop T2EL after EVAR, but they do not differentiate between T2EL causing aneurysm growth or not (“malignant” vs “benign”), limiting the guidance for perioperative preventive measures, since the treatment of all high-risk patients for persistent T2EL may lead to overtreatment.[23]
In addition, previous studies on the association between radiomics, classical machine learning, and T2EL with AAA growth have relied on manually segmented regions of interest and predefined feature extraction pipelines.[12,27] Such approaches are inherently limited by observer-dependent variability and potential information loss. In contrast, our 3D CNN overcomes these limitations by performing hierarchical feature learning directly from voxel-level data.
Recent multitask and attention-based models[32] allow for better leak localisation, with increasing explainability, showing the vascular and morphological areas of greatest relevance for automated risk prediction. Smorenburg et al.[33] proposes a real-time framework based on intraoperative digital subtraction angiography, which demonstrates F1 scores and accuracy comparable to the human procedural team in 220 patients, indicating increasing reliability of automated decision support. In our study, we considered as baseline the first post-operative CTA, instead of the intraoperative final angiography. This approach was chosen because many small TIIELs undergo early spontaneous resolution, and because, in the immediate post-procedural phase, angiography may not reliably distinguish a true type II endoleak from graft porosity.
The model architecture was intentionally designed with progressive channel expansion and multi-layer dropout to balance computational efficiency and overfitting prevention. The adoption of GELU activation functions contributed to smoother gradient propagation and improved convergence stability compared with traditional ReLU-based configurations. The achieved performance metrics suggest that further gains may be obtained through ensemble learning or hybrid architectures integrating attention mechanisms to refine spatial localization of collateral vessels. Moreover, transfer learning strategies leveraging larger CT datasets could improve generalizability across scanners and acquisition protocols.
Despite these promising results, several limitations must be acknowledged. The matrix data show that most misclassifications occurred between adjacent classes or towards Class A, suggesting a tendency for the model to misclassify endoleaks as ‘No T2EL (4 false negatives in total, 2 from Class B and 2 from Class C) or, conversely, to classify ‘No T2EL patients as benign T2EL (1 false positive). Even if from a clinical point of view the only relevant mistake is the misclassification of malignant TIIEL, these results suggest the need for further learning of the model.
First, the retrospective single-center design may limit external validity, and the test cohort size was modest, particularly looking at the malignant T2EL subgroup. Multi-institutional validation with heterogeneous imaging datasets is required to assess model robustness and domain generalization. Second, although data augmentation and normalization were applied, the possible differences in acquisition parameters across the study period might have introduced image variability. Third, the model did not incorporate clinical variables or post-procedural data that could potentially improve predictive accuracy when combined with imaging-derived features in a multimodal architecture.
From a translational perspective, this study demonstrates that preoperative CT imaging contains sufficient latent information to predict aneurysm continued sac reperfusion due to T2EL after EVAR. Such models could support decision-making regarding pre-emptive embolization or intensified follow-up protocols, provided that prospective validation confirms their reliability and clinical benefit. Future research should focus on model explainability, integration with radiomic biomarkers, and the development of interpretable attention maps highlighting the vascular territories contributing most to prediction.
The present work establishes the feasibility of using deep 3D convolutional architectures for automated risk prediction of TIIEL after EVAR, outperforming traditional radiomic approaches and providing a foundation for AI-driven stratification tools in endovascular therapy.
5. Conclusions
This study introduces a fully automated deep learning framework capable of predicting the occurrence and clinical severity of TIIEL after EVAR using only preoperative CTA data. The proposed 3D convolutional neural network achieved high accuracy and good class discrimination without requiring manual segmentation or handcrafted features. These results demonstrate that preoperative imaging encodes latent structural and hemodynamic information that can be effectively leveraged through volumetric deep learning to anticipate post-procedural outcomes. Future work will aim to externally validate the model across multicenter datasets, to develop an algorithm aimed to support precision planning and individualized surveillance strategies in EVAR.
Author Contributions
Conceptualization, G.P., F.A., F.M., and A.R.; methodology, F.A. and F.M; software, F.M, M.A.R. and A.L.; validation, G.P., A.R., and L.G; formal analysis, F.A., E.W., J.G. and L.E.; investigation, G.P., F.A., F.M. and E.W. resources, M.A.R. and A.L.; data curation, F.A.; E.W., J.G.; and L.E. writing—original draft preparation, F.A. and F.M.; writing review and editing, G.P., A.R., L.E., A.L., L.G. and M.A.R.; visualization, L.G. and J.G.; supervision, G.P. and A.R.. All authors have read and agreed to the published version of the manuscript.
Funding
This research received no external funding.
Institutional Review Board Statement
The study was approved by the local Ethics Committee (2025-00343 CE 4781). Helsinki Declaration and its later amendments were respected and the data underlying this article will be shared on reasonable request to the corresponding author. All data used in this work are anonymized and accessible only to the authors of this article.
Informed Consent Statement
All surviving patients treated before 2021 were sent a non-opposition consent form, since 2021, all participants have provided signed informed consent for clinical research and data analysis.
Data Availability Statement
The data presented in this study are available on reasonable request from the corresponding author.
Acknowledgments
The authors would like to thank prof. dr. med Stefania Rizzo and Ermidio Rezzonico for technical assistance; dr. Maria Carla Andreozzi and dr. Elena Garbero for study coordination.
Conflicts of Interest
The authors declare no conflicts of interest.
Abbreviations
The following abbreviations are used in this manuscript:
| 95CI | 95% Confidence Interval |
| AAA | Abdominal Aortic Aneurysm |
| AI | Artificial Intelligence |
| AUC | Area Under the Curve |
| CT | Computed Tomography |
| CTA | Computed Tomography Angiography |
| 3D CNN | 3D Convolutional Neural Network |
| ESVS | European Society for Vascular Surgery |
| EVAR | EndoVascular Aneurysm Repair |
| EOC | Ente Ospedaliero Cantonale |
| GELU | Gaussian Error Linear Unit |
| IIMSI | Imaging Institute of Southern Switzerland |
| IQR | Interquartile Range |
| ROC | Receiver Operating Characteristic Curve |
| SD | Standard Deviation |
| T2EL | Type II Endoleak |
References
- Wanhainen, A.; Van Herzeele, I.; Bastos Goncalves, F.; Bellmunt Montoya, S.; Berard, X.; Boyle, J.R.; D’Oria, M.; Prendes, C.F.; Karkos, C.D.; Kazimierczak, A.; et al. Editor’s Choice -- European Society for Vascular Surgery (ESVS) 2024 Clinical Practice Guidelines on the Management of Abdominal Aorto-Iliac Artery Aneurysms. Eur. J. Vasc. Endovasc. Surg. Off. J. Eur. Soc. Vasc. Surg. 2024, 67, 192–331. [Google Scholar] [CrossRef]
- Powell, J.T.; Sweeting, M.J.; Ulug, P.; Blankensteijn, J.D.; Lederle, F.A.; Becquemin, J.-P.; Greenhalgh, R.M. EVAR-1, DREAM, OVER and ACE Trialists Meta-Analysis of Individual-Patient Data from EVAR-1, DREAM, OVER and ACE Trials Comparing Outcomes of Endovascular or Open Repair for Abdominal Aortic Aneurysm over 5 Years. Br. J. Surg. 2017, 104, 166–178. [Google Scholar] [CrossRef] [PubMed]
- White, G.H.; Yu, W.; May, J.; Chaufour, X.; Stephen, M.S. Endoleak as a Complication of Endoluminal Grafting of Abdominal Aortic Aneurysms: Classification, Incidence, Diagnosis, and Management. J. Endovasc. Surg. Off. J. Int. Soc. Endovasc. Surg. 1997, 4, 152–168. [Google Scholar] [CrossRef]
- Gennai, S.; Andreoli, F.; Leone, N.; Bartolotti, L.A.M.; Maleti, G.; Silingardi, R. Incidence, Long Term Clinical Outcomes, and Risk Factor Analysis of Type III Endoleaks Following Endovascular Repair of Abdominal Aortic Aneurysm. Eur. J. Vasc. Endovasc. Surg. Off. J. Eur. Soc. Vasc. Surg. 2023, 66, 38–48. [Google Scholar] [CrossRef] [PubMed]
- Chaikof, E.L.; Dalman, R.L.; Eskandari, M.K.; Jackson, B.M.; Lee, W.A.; Mansour, M.A.; Mastracci, T.M.; Mell, M.; Murad, M.H.; Nguyen, L.L.; et al. The Society for Vascular Surgery Practice Guidelines on the Care of Patients with an Abdominal Aortic Aneurysm. J. Vasc. Surg. 2018, 67, 2–77.e2. [Google Scholar] [CrossRef]
- Yu, H.Y.H.; Lindström, D.; Wanhainen, A.; Tegler, G.; Hassan, B.; Mani, K. Systematic Review and Meta-Analysis of Prophylactic Aortic Side Branch Embolization to Prevent Type II Endoleaks. J. Vasc. Surg. 2020, 72, 1783–1792.e1. [Google Scholar] [CrossRef]
- Yu, H.Y.H.; Lindström, D.; Wanhainen, A.; Tegler, G.; Asciutto, G.; Mani, K. An Updated Systematic Review and Meta-Analysis of Pre-Emptive Aortic Side Branch Embolization to Prevent Type II Endoleaks after Endovascular Aneurysm Repair. J. Vasc. Surg. 2023, 77, 1815–1821. [Google Scholar] [CrossRef]
- Ichihashi, S.; Takahara, M.; Fujimura, N.; Banno, H.; Onitsuka, S.; Shingaki, M.; Yamaoka, T.; Sumi, M.; Iida, O.; Iwakoshi, S.; et al. Editor’s Choice - Multicentre Randomised Controlled Trial to Evaluate the Efficacy of Pre-Emptive Inferior Mesenteric Artery Embolisation during Endovascular Aortic Aneurysm Repair on Aneurysm Sac Change. Eur. J. Vasc. Endovasc. Surg. Off. J. Eur. Soc. Vasc. Surg. 2025, 70, 219–226. [Google Scholar] [CrossRef]
- van Griethuysen, J.J.M.; Fedorov, A.; Parmar, C.; Hosny, A.; Aucoin, N.; Narayan, V.; Beets-Tan, R.G.H.; Fillion-Robin, J.-C.; Pieper, S.; Aerts, H.J.W.L. Computational Radiomics System to Decode the Radiographic Phenotype. Cancer Res. 2017, 77, e104–e107. [Google Scholar] [CrossRef]
- van Timmeren, J.E.; Cester, D.; Tanadini-Lang, S.; Alkadhi, H.; Baessler, B. Radiomics in Medical Imaging-”how-to” Guide and Critical Reflection. Insights Imaging 2020, 11, 91. [Google Scholar] [CrossRef]
- Fedorov, A.; Beichel, R.; Kalpathy-Cramer, J.; Finet, J.; Fillion-Robin, J.-C.; Pujol, S.; Bauer, C.; Jennings, D.; Fennessy, F.; Sonka, M.; et al. 3D Slicer as an Image Computing Platform for the Quantitative Imaging Network. Magn. Reson. Imaging 2012, 30, 1323–1341. [Google Scholar] [CrossRef] [PubMed]
- Charalambous, S.; Klontzas, M.E.; Kontopodis, N.; Ioannou, C.V.; Perisinakis, K.; Maris, T.G.; Damilakis, J.; Karantanas, A.; Tsetis, D. Radiomics and Machine Learning to Predict Aggressive Type 2 Endoleaks after Endovascular Aneurysm Repair: A Proof of Concept. Acta Radiol. Stockh. Swed. 1987 2022, 63, 1293–1299. [Google Scholar] [CrossRef] [PubMed]
- Javor, D.; Wressnegger, A.; Unterhumer, S.; Kollndorfer, K.; Nolz, R.; Beitzke, D.; Loewe, C. Endoleak Detection Using Single-Acquisition Split-Bolus Dual-Energy Computer Tomography (DECT). Eur. Radiol. 2017, 27, 1622–1630. [Google Scholar] [CrossRef] [PubMed]
- Prouse, G.; Robaldo, A.; van den Berg, J.C.; Ettorre, L.; Mongelli, F.; Giovannacci, L. Impact of Multidisciplinary Team Meetings on Decision Making in Vascular Surgery: A Prospective Observational Study. Eur. J. Vasc. Endovasc. Surg. Off. J. Eur. Soc. Vasc. Surg. 2023, 66, 130–135. [Google Scholar] [CrossRef]
- Kumar, L.; Cowled, P.; Boult, M.; Howell, S.; Fitridge, R. Type II Endoleak after Endovascular Aneurysm Repair: Natural History and Treatment Outcomes. Ann. Vasc. Surg. 2017, 44, 94–102. [Google Scholar] [CrossRef]
- El Batti, S.; Cochennec, F.; Roudot-Thoraval, F.; Becquemin, J.-P. Type II Endoleaks after Endovascular Repair of Abdominal Aortic Aneurysm Are Not Always a Benign Condition. J. Vasc. Surg. 2013, 57, 1291–1297. [Google Scholar] [CrossRef]
- Hendrycks, D.; Gimpel, K. Gaussian Error Linear Units (GELUs) 2023.
- Srivastava, N.; Hinton, G.; Krizhevsky, A.; Sutskever, I.; Salakhutdinov, R. Dropout: A Simple Way to Prevent Neural Networks from Overfitting. J. Mach. Learn. Res. 2014, 15, 1929–1958. [Google Scholar]
- Ioffe, S.; Szegedy, C. Batch Normalization: Accelerating Deep Network Training by Reducing Internal Covariate Shift 2015.
- Lo, R.C.; Buck, D.B.; Herrmann, J.; Hamdan, A.D.; Wyers, M.; Patel, V.I.; Fillinger, M.; Schermerhorn, M.L. Risk Factors and Consequences of Persistent Type II Endoleaks. J. Vasc. Surg. 2016, 63, 895–901. [Google Scholar] [CrossRef]
- Akmal, M.M.; Pabittei, D.R.; Prapassaro, T.; Suhartono, R.; Moll, F.L.; Van Herwaarden, J.A. A Systematic Review of the Current Status of Interventions for Type II Endoleak after EVAR for Abdominal Aortic Aneurysms. Int. J. Surg. 2021, 95, 106138. [Google Scholar] [CrossRef]
- Ultee, K.H.J.; Büttner, S.; Huurman, R.; Bastos Gonçalves, F.; Hoeks, S.E.; Bramer, W.M.; Schermerhorn, M.L.; Verhagen, H.J.M. Editor’s Choice – Systematic Review and Meta-Analysis of the Outcome of Treatment for Type II Endoleak Following Endovascular Aneurysm Repair. Eur. J. Vasc. Endovasc. Surg. 2018, 56, 794–807. [Google Scholar] [CrossRef] [PubMed]
- Mulay, S.; Geraedts, A.C.M.; Koelemay, M.J.W.; Balm, R.; Mulay, S.; Balm, R.; Elshof, J.W.; Elsman, B.H.P.; Hamming, J.F.; Koelemay, M.J.W.; et al. Type 2 Endoleak With or Without Intervention and Survival After Endovascular Aneurysm Repair. Eur. J. Vasc. Endovasc. Surg. 2021, 61, 779–786. [Google Scholar] [CrossRef] [PubMed]
- Mascoli, C.; Faggioli, G.; Gallitto, E.; Pini, R.; Fenelli, C.; Cercenelli, L.; Marcelli, E.; Gargiulo, M. Tailored Sac Embolization During EVAR for Preventing Persistent Type II Endoleak. Ann. Vasc. Surg. 2021, 76, 293–301. [Google Scholar] [CrossRef] [PubMed]
- Marchiori, A.; von Ristow, A.; Guimaraes, M.; Schönholz, C.; Uflacker, R. Predictive Factors for the Development of Type II Endoleaks. J. Endovasc. Ther. Off. J. Int. Soc. Endovasc. Spec. 2011, 18, 299–305. [Google Scholar] [CrossRef]
- Otsu, M.; Ishizaka, T.; Watanabe, M.; Hori, T.; Kohno, H.; Ishida, K.; Nakaya, M.; Matsumiya, G. Analysis of Anatomical Risk Factors for Persistent Type II Endoleaks Following Endovascular Abdominal Aortic Aneurysm Repair Using CT Angiography. Surg. Today 2016, 46, 48–55. [Google Scholar] [CrossRef]
- Mo, J.; Liu, Q.; Wang, K.; Huang, L.; Yao, C. Prediction of Persistent Type II Endoleak after Endovascular Aortic Repair Using Machine Learning Based on Preoperative Clinical Data and Radiomic. Vasc. Investig. Ther. 2025, 8, 31. [Google Scholar] [CrossRef]
- Hahn, S.; Perry, M.; Morris, C.S.; Wshah, S.; Bertges, D.J. Machine Deep Learning Accurately Detects Endoleak after Endovascular Abdominal Aortic Aneurysm Repair. JVS-Vasc. Sci. 2020, 1, 5–12. [Google Scholar] [CrossRef]
- Talebi, S.; Madani, M.H.; Madani, A.; Chien, A.; Shen, J.; Mastrodicasa, D.; Fleischmann, D.; Chan, F.P.; Mofrad, M.R.K. Machine Learning for Endoleak Detection after Endovascular Aortic Repair. Sci. Rep. 2020, 10, 18343. [Google Scholar] [CrossRef]
- Rinaldi, L.; De Angelis, S.P.; Raimondi, S.; Rizzo, S.; Fanciullo, C.; Rampinelli, C.; Mariani, M.; Lascialfari, A.; Cremonesi, M.; Orecchia, R.; et al. Reproducibility of Radiomic Features in CT Images of NSCLC Patients: An Integrative Analysis on the Impact of Acquisition and Reconstruction Parameters. Eur. Radiol. Exp. 2022, 6, 2. [Google Scholar] [CrossRef]
- Podgorsak, A.R.; Rava, R.A.; Shiraz Bhurwani, M.M.; Chandra, A.R.; Davies, J.M.; Siddiqui, A.H.; Ionita, C.N. Automatic Radiomic Feature Extraction Using Deep Learning for Angiographic Parametric Imaging of Intracranial Aneurysms. J. Neurointerventional Surg. 2020, 12, 417–421. [Google Scholar] [CrossRef]
- Garrido-Oliver, J.; Tenezaca-Sari, X.; Faner Capo, X.; Ribeiro, T.; Dux-Santoy, L.; Ferrer-Cornet, M.; Bragulat-Arevalo, M.; Catala-Santarrufina, A.; Morales-Galan, A.; Lopez-Gutierrez, P.; et al. Deep Learning for Segmentation and Endoleak Detection in Contrast-Enhanced Computed Tomography in Endovascular Aortic Repair Patients. Eur. Heart J. 2025, 46, ehaf784.3004. [Google Scholar] [CrossRef]
- Smorenburg, S.P.M.; Hoksbergen, A.W.J.; Yeung, K.K.; Wolterink, J.M. Multitask Deep Learning for Automated Detection of Endoleak at Digital Subtraction Angiography during Endovascular Aneurysm Repair. Radiol. Artif. Intell. 2025, 7, e240392. [Google Scholar] [CrossRef]
Figure 1.
Schematic representation of the Type II Endoleak mechanism. Reproduced with the courtesy of Medtrinic plc. All rights reserved.
Figure 1.
Schematic representation of the Type II Endoleak mechanism. Reproduced with the courtesy of Medtrinic plc. All rights reserved.
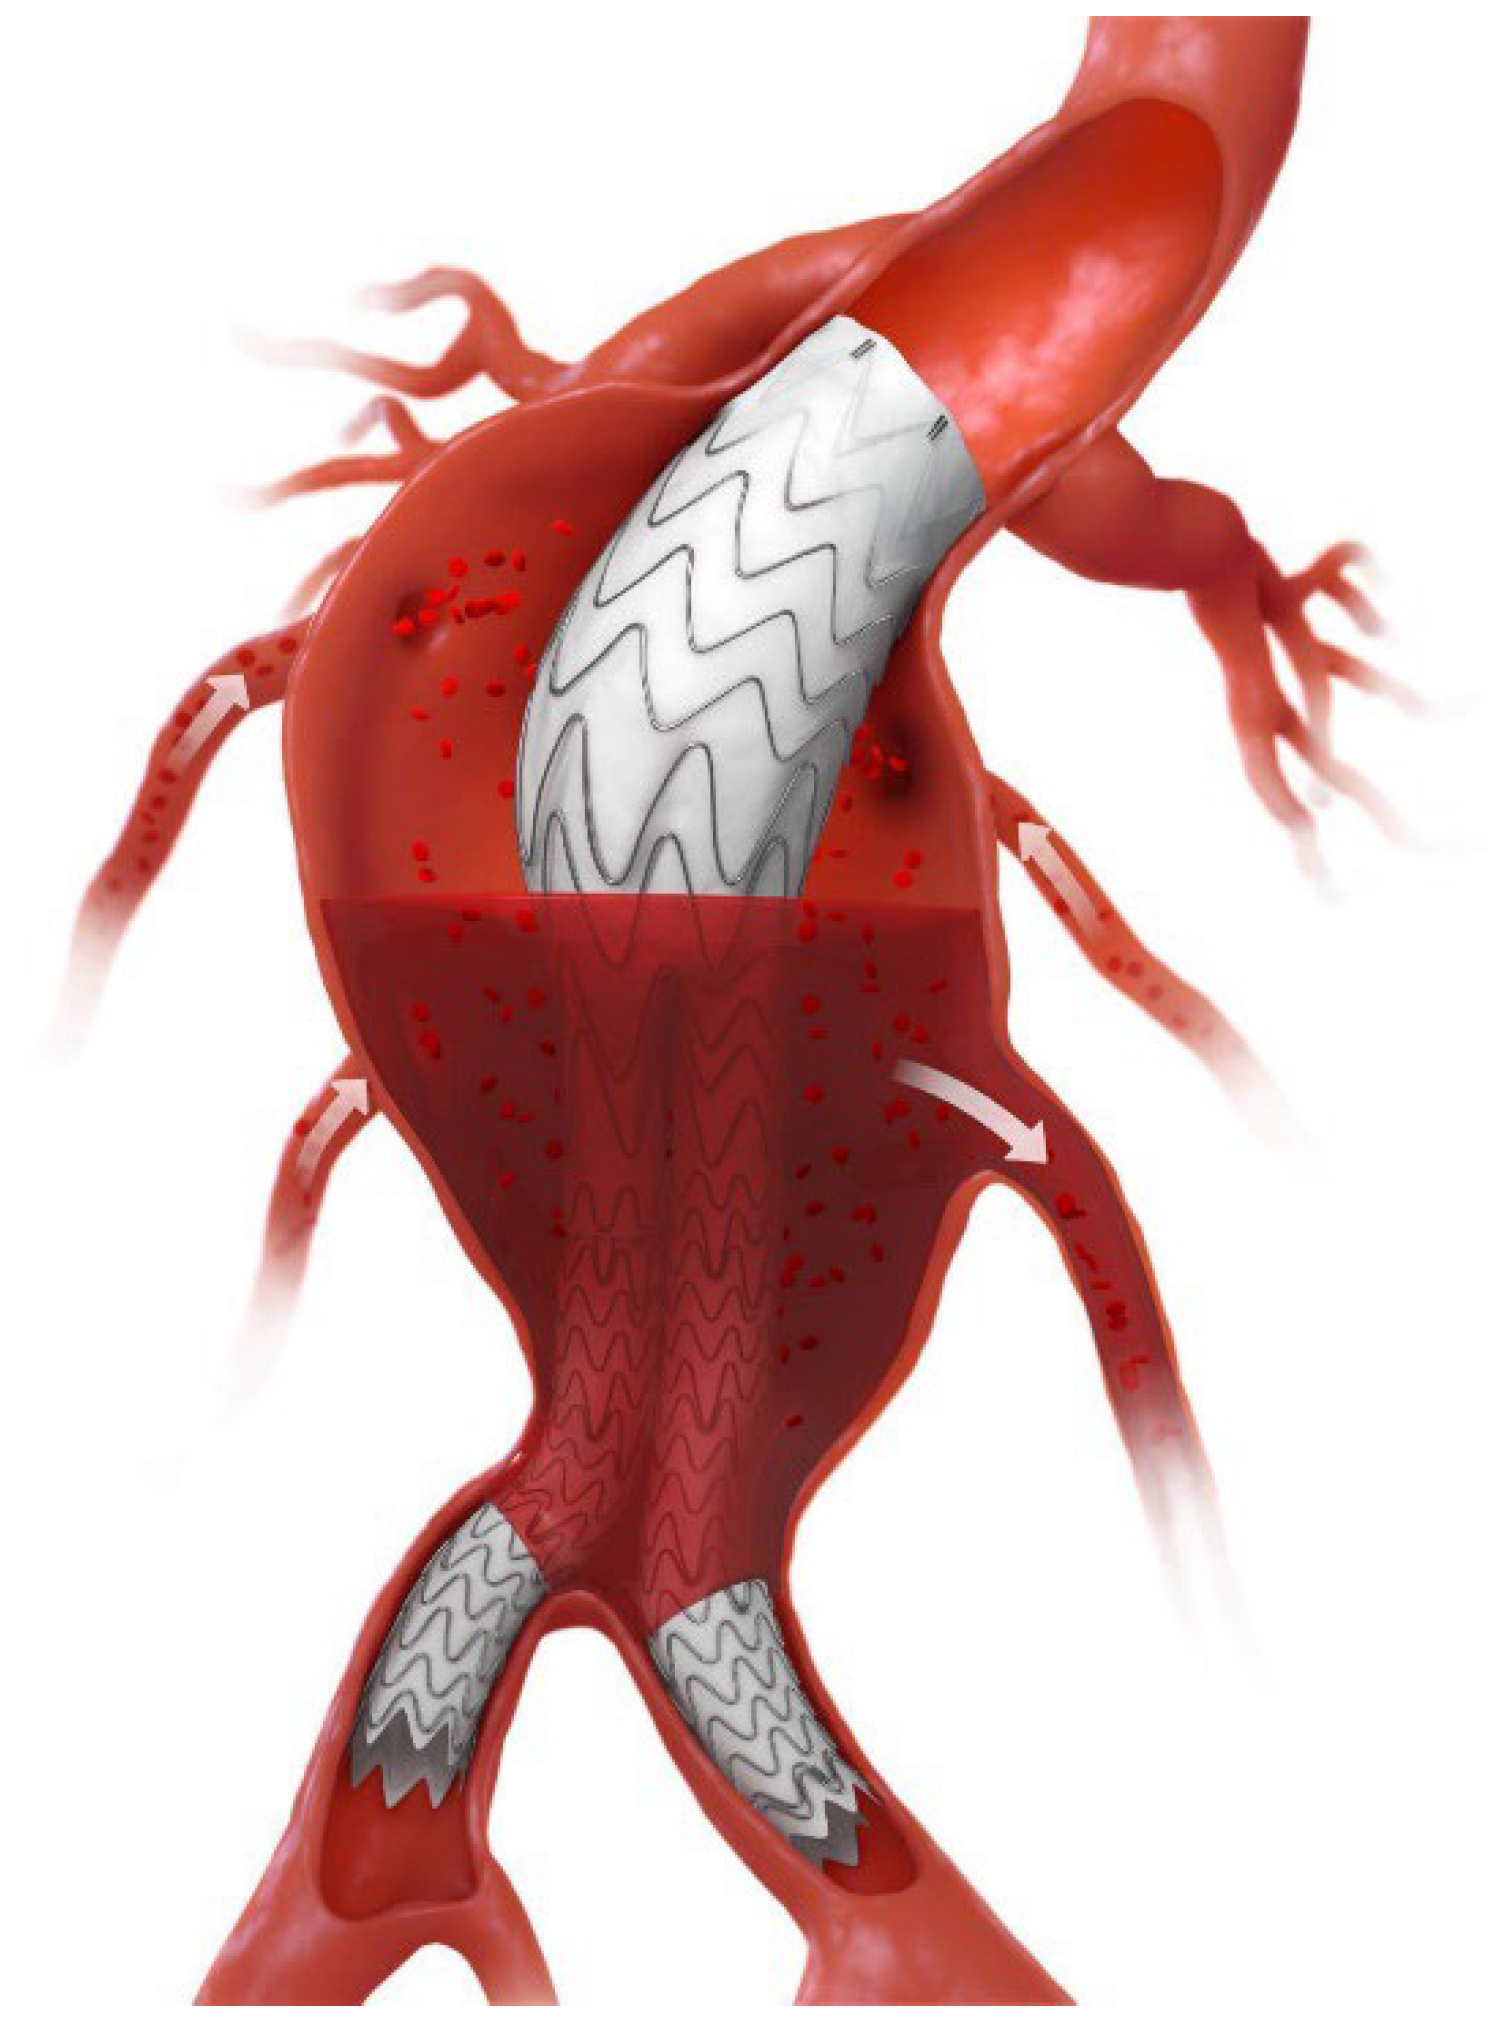
Figure 2.
CONSORT-like chart depicting the final included cohort alongside the excluded patients and corresponding reasons for exclusion. Abbreviations: AAA, Abdominal Aneurysm Repair; CTA, Computed Tomography Angiography; EVAR, Endovascular Aneurysm Repair; T2EL, Type II Endoleak.
Figure 2.
CONSORT-like chart depicting the final included cohort alongside the excluded patients and corresponding reasons for exclusion. Abbreviations: AAA, Abdominal Aneurysm Repair; CTA, Computed Tomography Angiography; EVAR, Endovascular Aneurysm Repair; T2EL, Type II Endoleak.
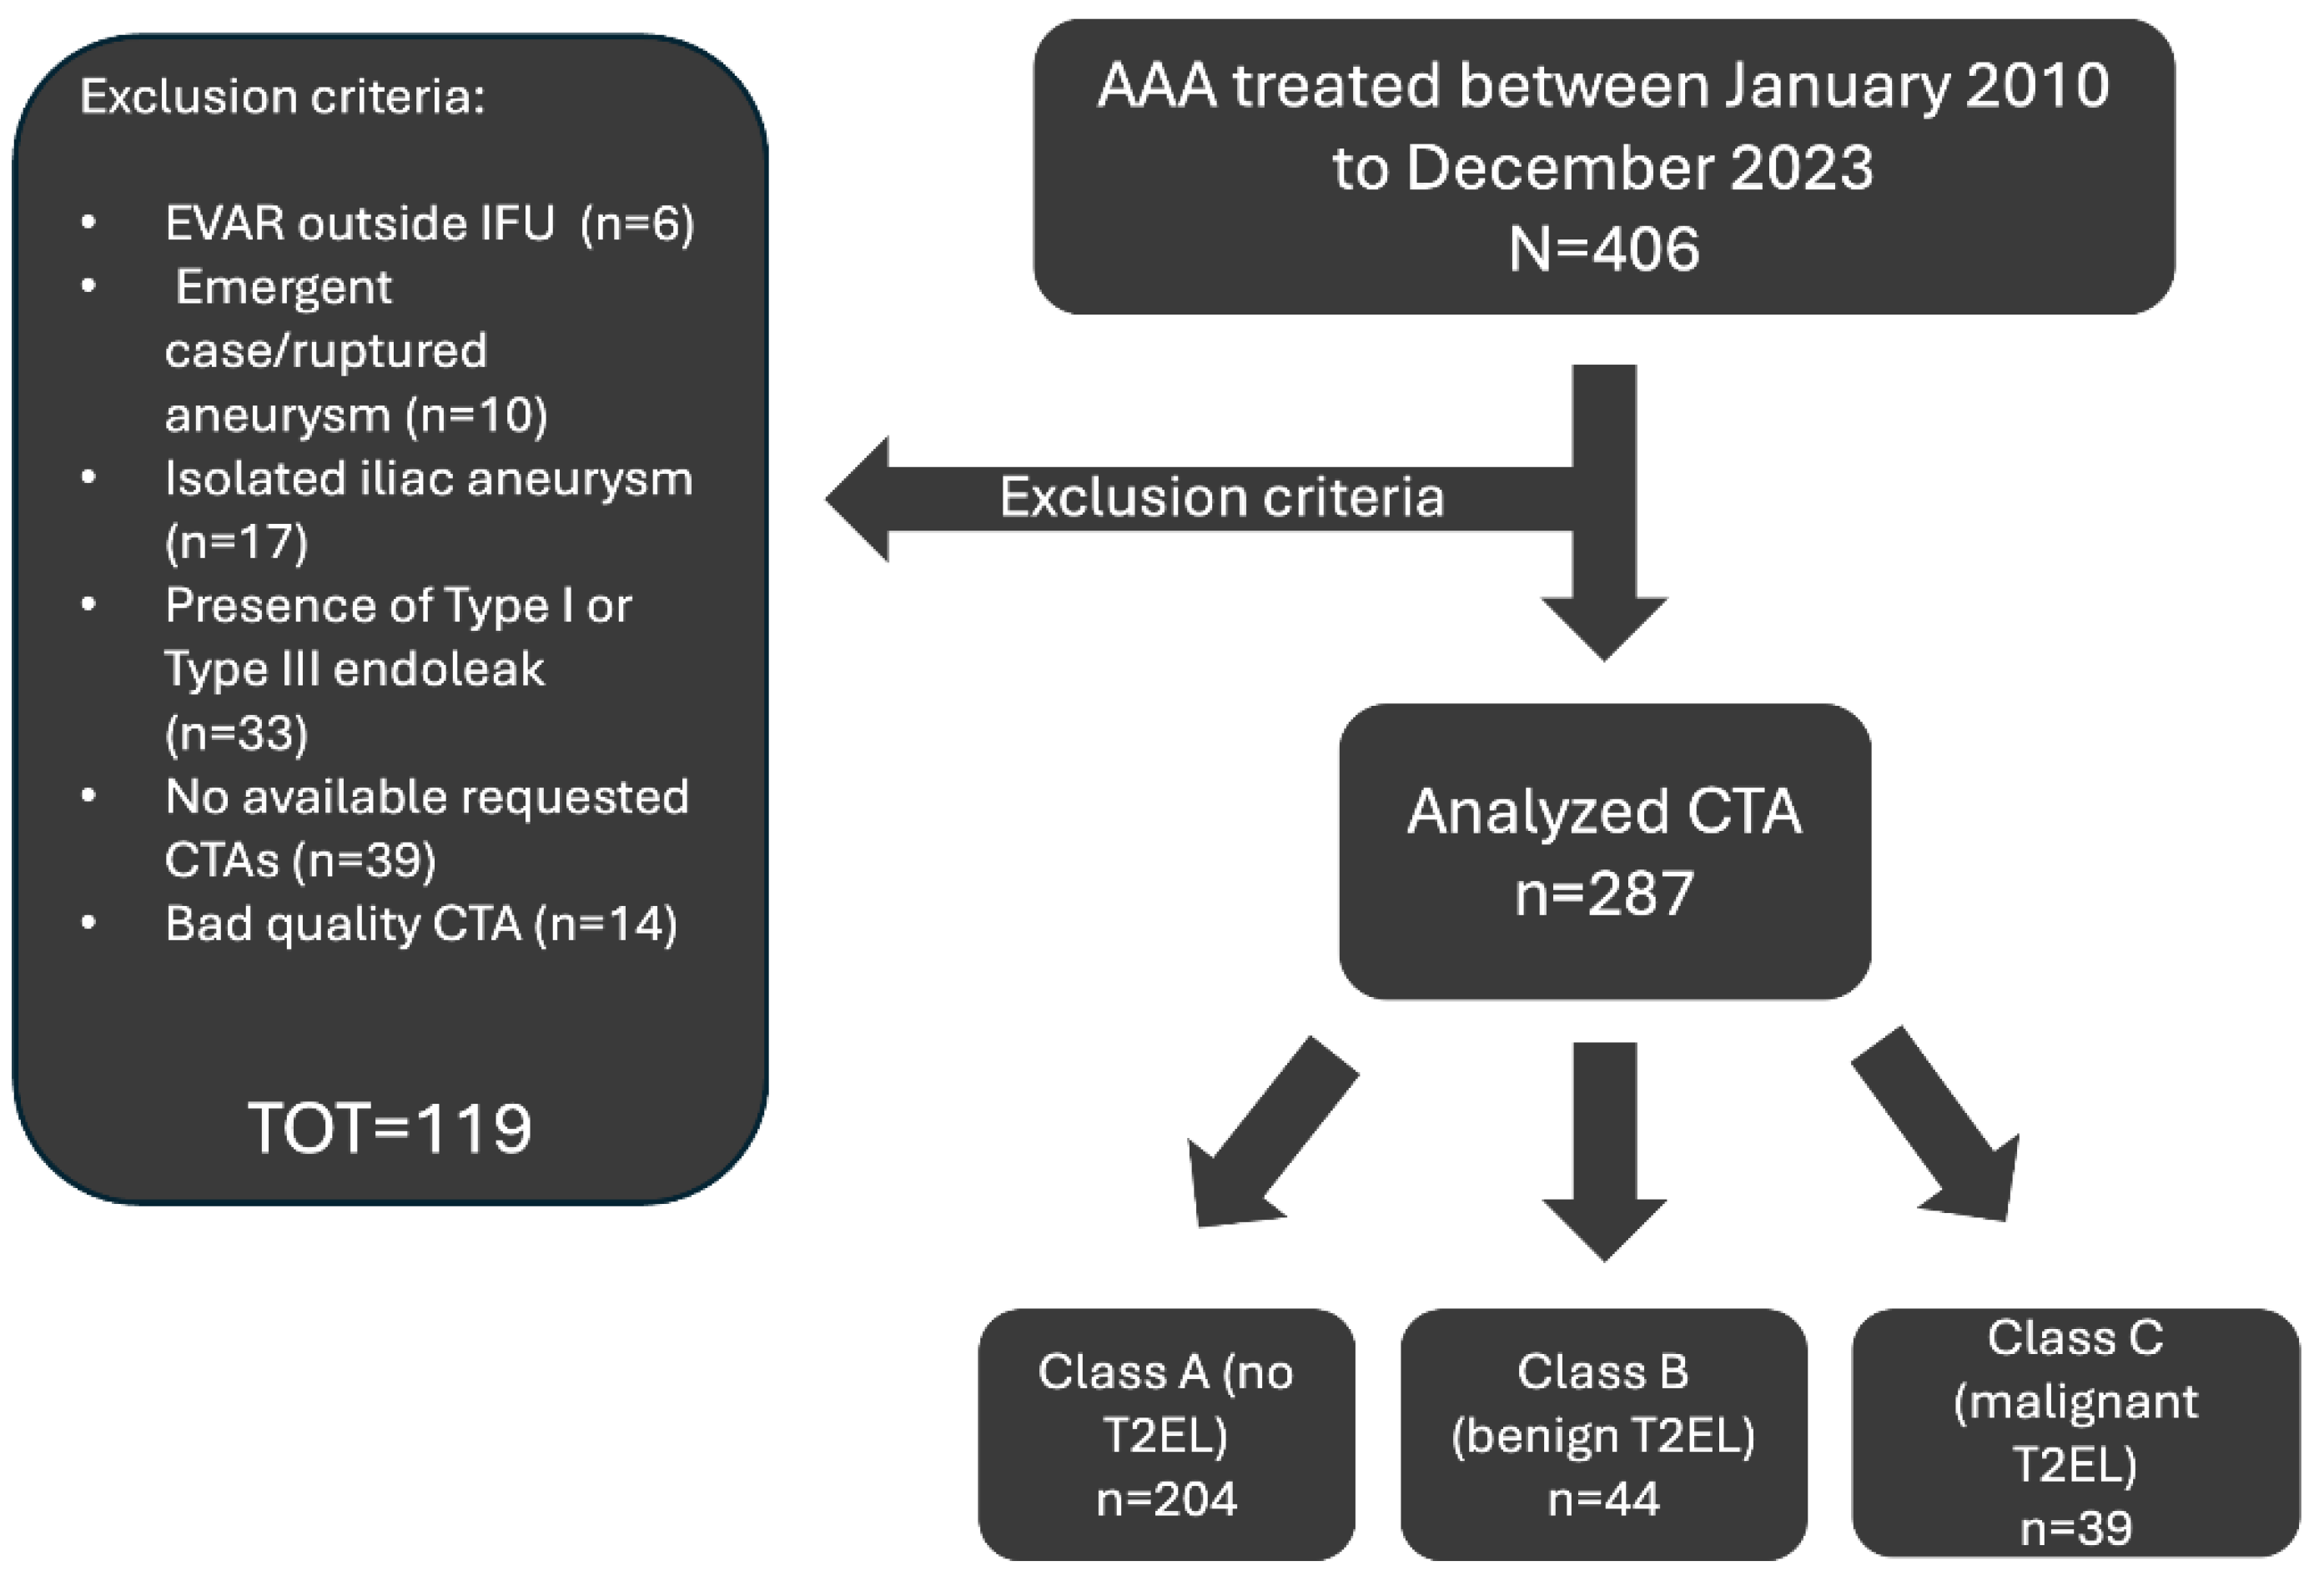
Figure 3.
The flowchart shows the complete architecture of the Convolutional Neural Network for the classification of endoleaks from CT volumes. The architecture is a residual convolutional 3D network (ResNet) that begins with an initial convolutional block and continues with four sequential residual blocks. These blocks progressively expand the channels (1→32→64→128→256→512) and reduce the spatial dimensions of the volumetric input through stride convolutions. The extracted features are then passed to a fully connected three-layer classifier (MLP) that produces the final logits for the three classes. GELU activation functions and dropout regularisation are used to prevent overfitting. Abbreviations: GELU, Gaussian Error Linear Unit.
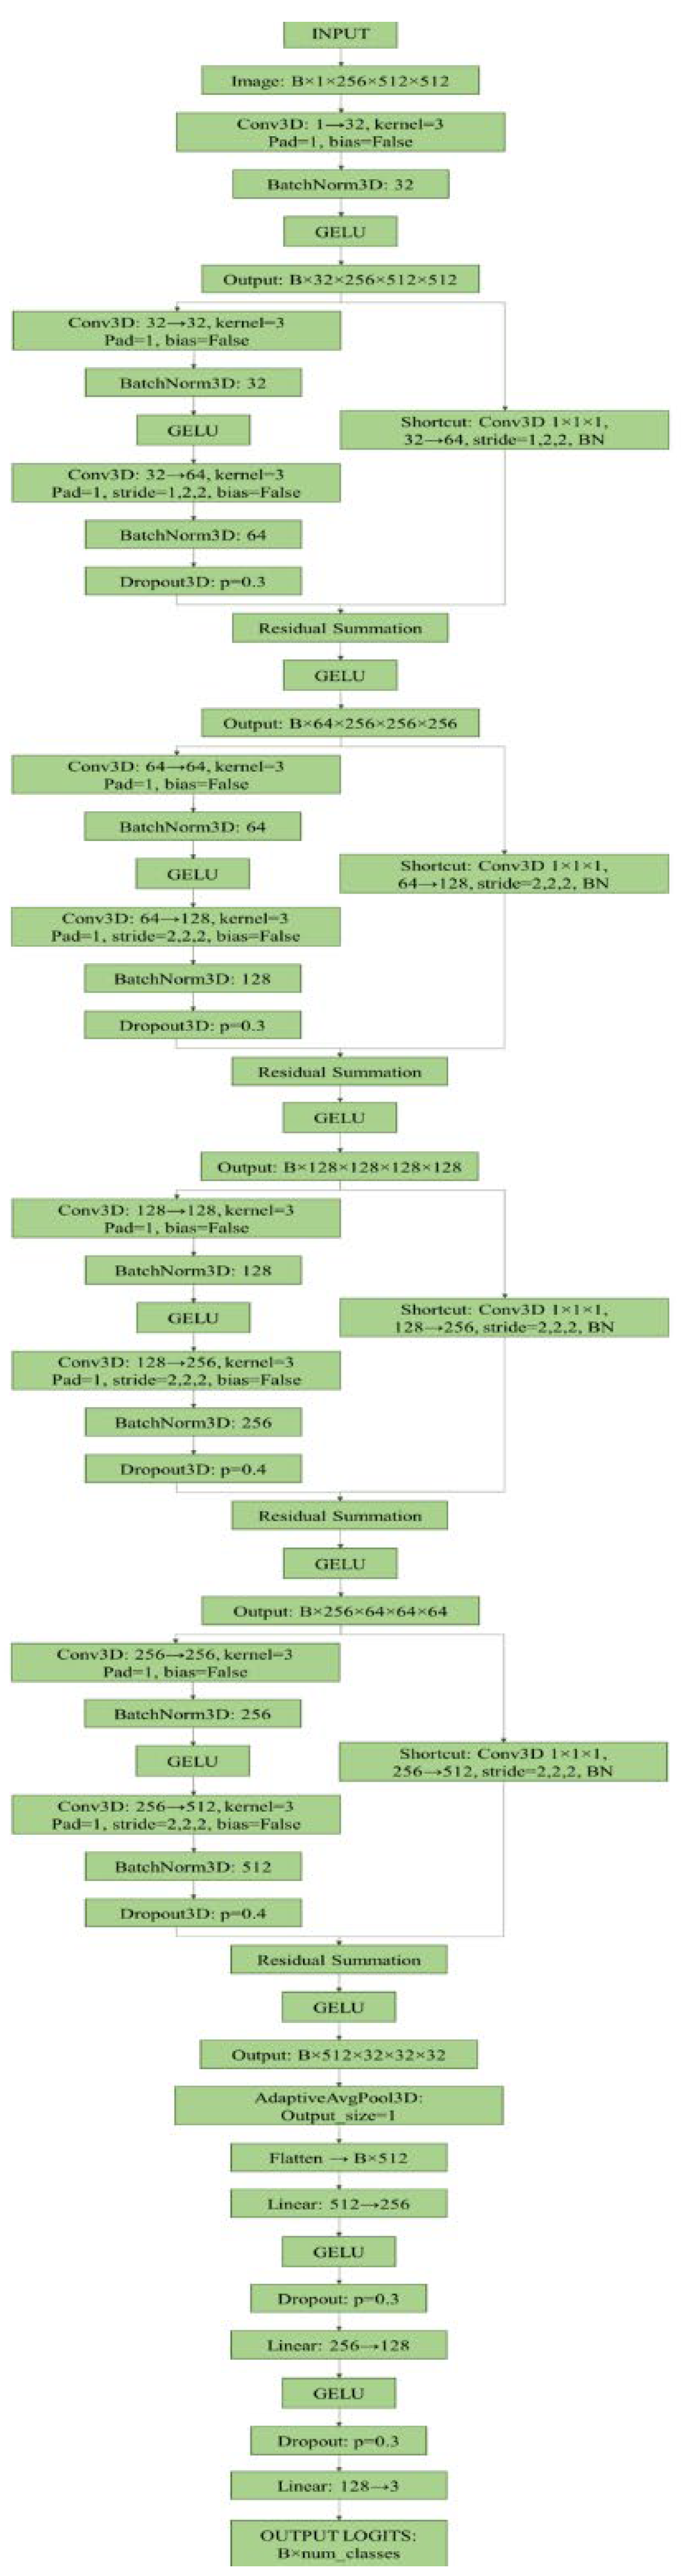
Figure 4.
ROC curves and AUC for each class. The three graphs illustrate the discriminatory capacity of the model on the independent test set: (a) Class A (No Endoleak), (b) Class B (Type I Endoleak), and (c) Class C (T2EL). The coloured area around each ROC curve represents the 95CI. The dotted diagonal line indicates the performance of a random classifier (AUC = 0.5). Abbreviations: 95CI, 95% Confidence Interval AUC, Area Under the Curve; ROC, Receiver Operating Characteristic; T2EL, Type II Endoleak.
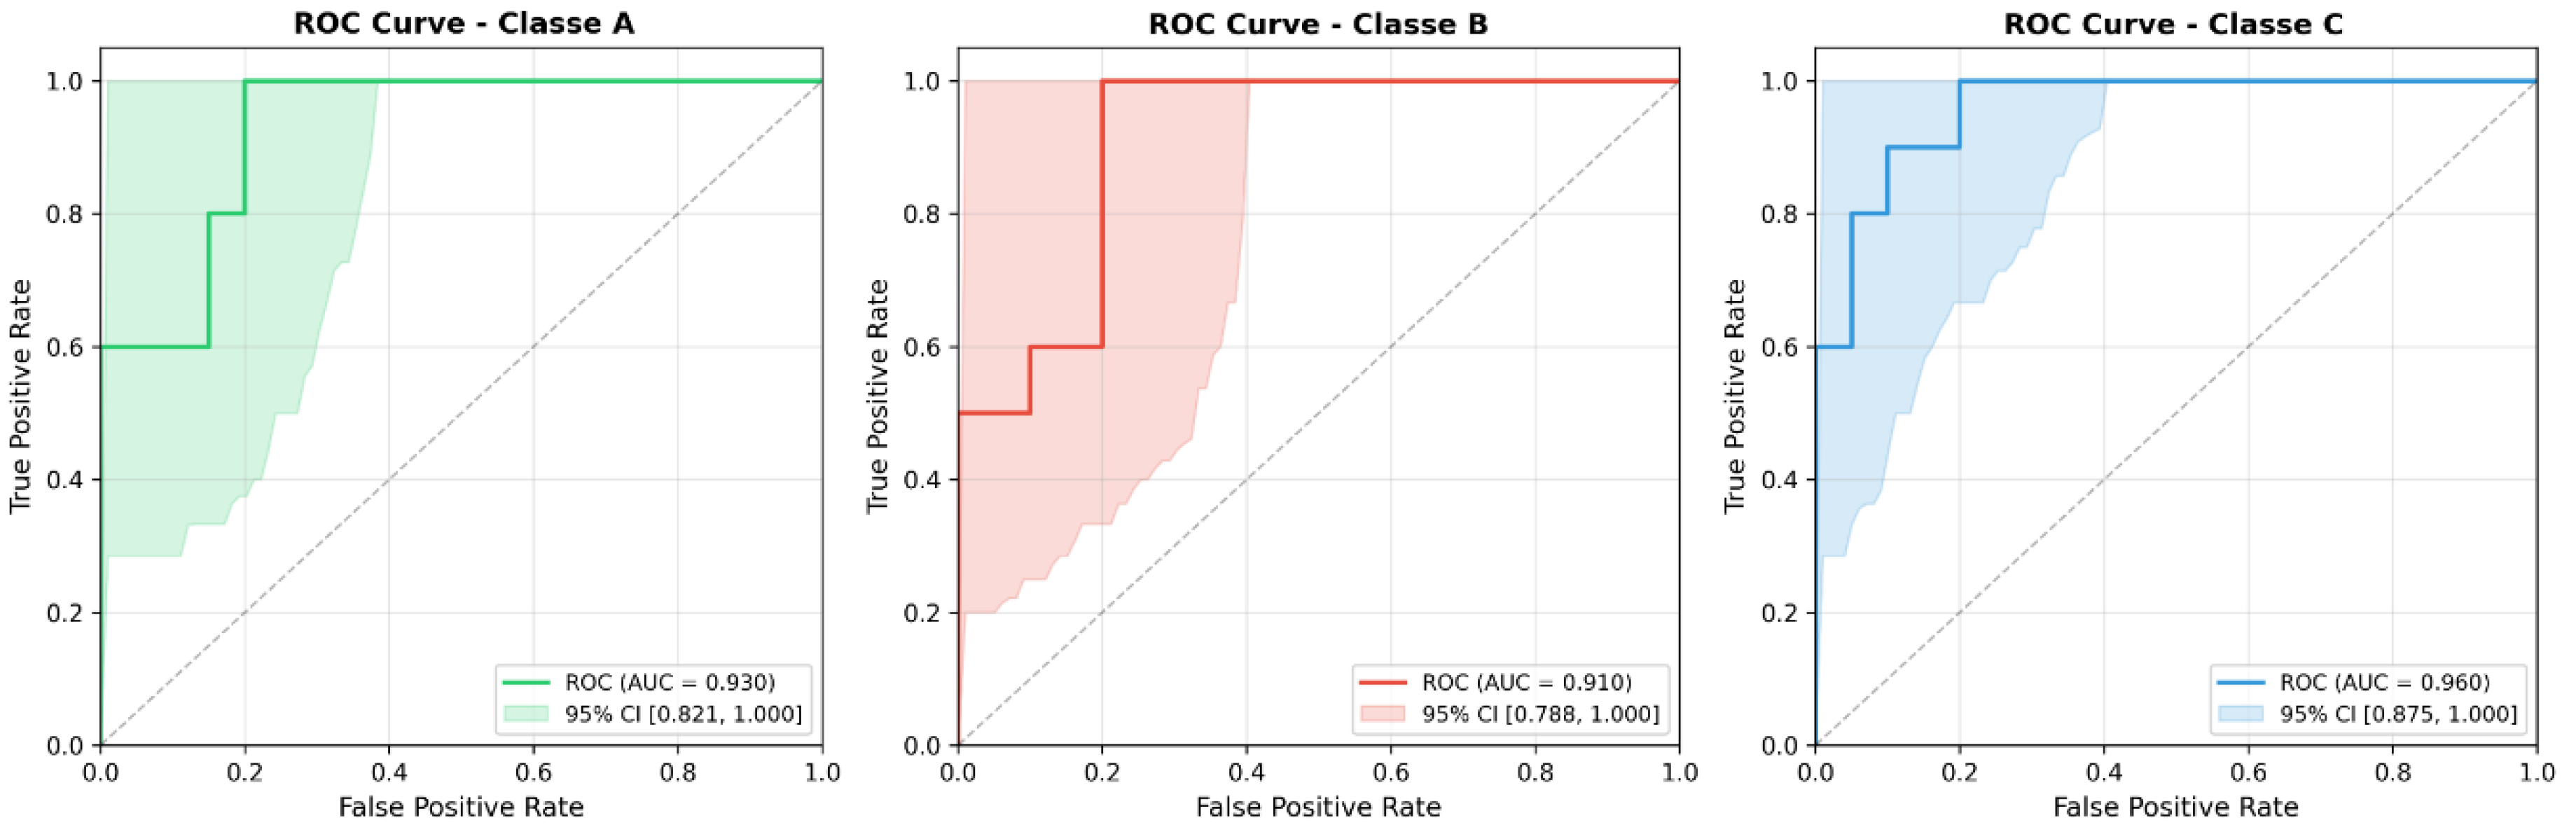

Table 1.
Overall performance of the model on the independent test set. The metrics reported are macro-averaged across the three classes and reflect the overall effectiveness of the model in the test set.
Table 1.
Overall performance of the model on the independent test set. The metrics reported are macro-averaged across the three classes and reflect the overall effectiveness of the model in the test set.
| Metric | Result | 95CI |
| Accuracy | 0.766 | 0.633-0.900 |
| F1-Score | 0.765 | 0.594-0.904 |
| Precision | 0.781 | 0.631-0.926 |
| Recall | 0.766 | 0.611-0.915 |
| AUC ROC | 0.933 | 0.871-0.980 |
95CI, 95% Confidence Interval; AUC, Area Under the Curve; ROC, Receiver Operating Characteristic Curve.
Table 2.
Classification Metrics Matrix (by Class). The table shows the performance metrics (Precision, Recall/Sensitivity, F1-Score, AUC ROC) of the predictive model, divided into three target classes: No T2EL, Benign T2EL and Malignant T2EL.
Table 2.
Classification Metrics Matrix (by Class). The table shows the performance metrics (Precision, Recall/Sensitivity, F1-Score, AUC ROC) of the predictive model, divided into three target classes: No T2EL, Benign T2EL and Malignant T2EL.
| Class Name |
Precision (95% CI) |
Recall (95% CI) |
F1-score (95% CI) |
AUC ROC (95% CI) |
| No T2EL | 0.692 (0.428-0.937) |
0.900 (0.699-1.000) |
0.7826 (0.545-0.947) |
0.930 (0.821-1.000) |
| Benign T2EL | 0.7778 (0.500-1.000) |
0.700 (0.400-1.000) |
0.7368 (0.470-0.933) |
0.910 (0.788-1.000) |
| Malignant T2EL | 0.8750 (0.600-1.000) |
0.700 (0.375-1.000) |
0.777 (0.500-0.960) |
0.960 (0.875-1.000) |
95CI, 95% Confidence Interval; AUC, Area Under the Curve; ROC, Receiver Operating Characteristic Curve; T2EL, Type II Endoleak.
Disclaimer/Publisher’s Note: The statements, opinions and data contained in all publications are solely those of the individual author(s) and contributor(s) and not of MDPI and/or the editor(s). MDPI and/or the editor(s) disclaim responsibility for any injury to people or property resulting from any ideas, methods, instructions or products referred to in the content. |
© 2025 by the authors. Licensee MDPI, Basel, Switzerland. This article is an open access article distributed under the terms and conditions of the Creative Commons Attribution (CC BY) license (http://creativecommons.org/licenses/by/4.0/).
Copyright: This open access article is published under a Creative Commons CC BY 4.0 license, which permit the free download, distribution, and reuse, provided that the author and preprint are cited in any reuse.


