
Submitted:
24 July 2025
Posted:
25 July 2025
You are already at the latest version
Abstract
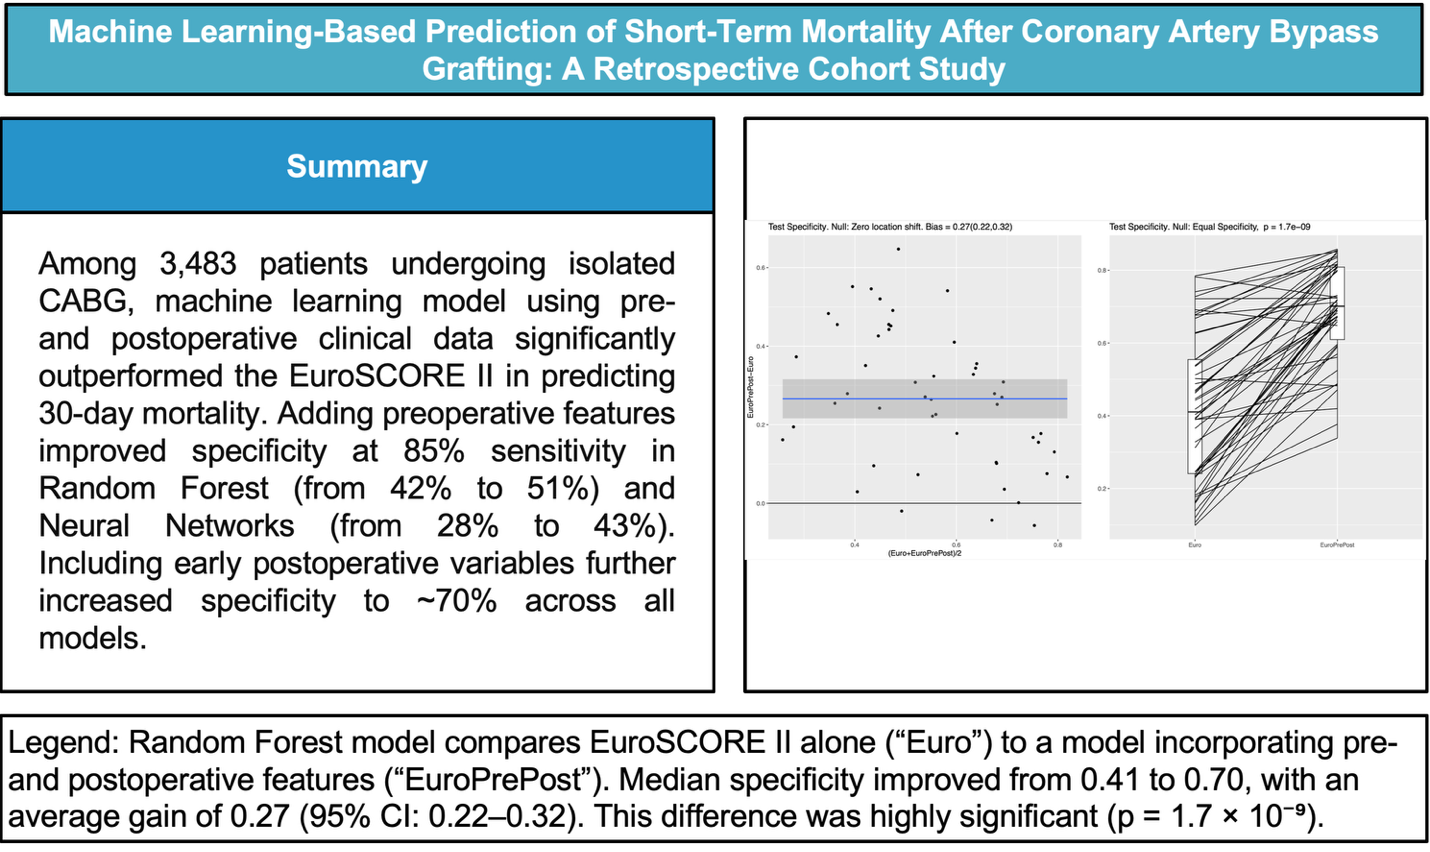
Objectives: This study aimed to develop and validate a machine learning (ML) algorithm to predict 30-day mortality following isolated coronary artery bypass grafting (CABG), and to compare its performance against the widely used EuroSCORE II risk prediction model. Methods: In this retrospective study, we included consecutive adult patients who underwent isolated coronary artery bypass grafting (CABG) between January 2009 and December 2022. Three predictive models were compared: (1) EuroSCORE II variables alone (baseline), (2) EuroSCORE II combined with additional preoperative variables (Model I), and (3) EuroSCORE II plus preoperative and postoperative variables available within five days after surgery (Model II). LR, RF, and NN were employed and validated. Predictive accuracy was assessed using the area under the receiver operating charac-teristic curve (AUC) and specificity at 85% sensitivity. Results: Among the 3,483 patients included, the mean age was 68.4 years (SD 10.3), with an overall 30-day mortality rate of 2.5%. The mean EuroSCORE II was 2.85 (SD 4.8). Integrating additional preoperative variables significantly improved specificity at 85% sensitivity for both random forest (from 42% to 51%; p< 0.001) and neural networks (from 28% to 43%; p< 0.001) but not for LR. Incorporating preoperative along with postoperative data (Model II) further improved specificity to approximately 70% across all ML methods (p< 0.001). The most influential postoperative predictors included kidney failure, pulmonary complications, and myo-cardial infarction. Conclusions: ML models incorporating preoperative and postoperative variables significantly outperform the traditional EuroSCORE II in predicting short-term mortality following isolated CABG.
Keywords:
CABG
; EuroSCORE II
; machine learning
; mortality prediction
; postoperative variables
; risk stratification
1. Introduction
Preoperative risk assessment is essential in cardiac surgery, guiding clinical decisions, resource allocation, and preparation for complications. Over the past decades, various risk scoring systems have been introduced to support clinical decision-making, notably the EuroSCORE II, widely used across Europe [1]. Although broadly validated, a significant limitation of EuroSCORE II is its tendency to overestimate risk in certain high-risk patient subgroups, potentially leading to suboptimal therapeutic decisions and resource allocation [2]. Moreover, it has inherent limitations in capturing complex interactions between variables, such as the nuanced interplay between advanced age and impaired renal function, potentially leading to inaccuracies in predicting postoperative outcomes. [2,3] Machine learning (ML) offers a powerful alternative to traditional risk models by capturing complex, nonlinear relationships to improve predictive accuracy [4,5]. Despite progress in other fields, ML remains underutilized in cardiac surgery due to the need for large, high-quality datasets to develop reliable predictive models [6]. Larger datasets and improved computational resources have facilitated more complex and powerful predictive modeling in cardiology, showing substantial promise for clinical implementation [7,8,9,10,11] Nonetheless, studies integrating comprehensive postoperative data remain scarce, despite their critical role in accurately predicting postoperative outcomes [12]. This represents a significant knowledge gap, particularly as EuroSCORE II approaches a decade since its implementation, necessitating reevaluation and possible enhancement using contemporary analytical methods. In response to these challenges, the current study employs advanced ML techniques to develop and validate a comprehensive predictive model for short-term mortality in a large cohort of patients undergoing isolated coronary artery bypass grafting (CABG). We hypothesize that ML algorithms can predict 30-day mortality following isolated CABG at least as accurate than the established EuroSCORE II. The primary objective was to benchmark our ML algorithm in comparison to well established EuroSCORE II.
2. Materials and Methods
This retrospective study included adult patients (≥18 years) who underwent isolated CABG at the Department of Cardiac Surgery, University Hospital Basel, Switzerland, from January 2009 to December 2022. This study was approved by the Ethics Committee of Northwestern and Central Switzerland (EKNZ; project ID: 2020-02698), which waived the requirement for individual informed consent due to the retrospective nature of the analysis. Data were anonymized and securely stored in compliance with data protection regulations and hospital policies.
The primary objective was to assess the predictive performance of ML models in estimating 30-day mortality following isolated CABG. Patients were excluded from the study if they explicitly refused data usage or lacked essential preoperative or postoperative clinical data. Patient data were retrospectively extracted from comprehensive electronic medical records (Dendrite Clinical Systems, ISMED, Meona). A standardized data collection form was employed to ensure data consistency, including patient demographics, preoperative risk factors, and postoperative outcomes. Data quality control checks were regularly conducted by clinical and research personnel to ensure accuracy and consistency. Missing data were managed through imputation, utilizing the median for continuous variables and the most frequent category for categorical variables within the training set. Continuous variables were standardized (mean=0, SD=1), while categorical variables were numerically encoded for analytical purposes.
2.1. Machine Learning
To evaluate and improve the prediction of 30-day mortality following isolated CABG, we developed and compared three distinct predictive models, each characterized by specific variable sets:
1. This model included standard variables included in EuroSCORE II risk assessment (see Supplementary Table A1).
2. Model I (EuroSCORE II + Additional Preoperative Variables): This extended model incorporated all baseline EuroSCORE II variables with additional preoperative clinical parameters (see Supplementary Table A2).
3. Model II (EuroSCORE II + Additional Preoperative and Postoperative Variables): This comprehensive model incorporated all variables from Model I, supplemented by detailed postoperative parameters and early postoperative complications recorded within the first five days following surgery (see Supplementary Table A3).
Three distinct ML approaches were developed and compared for mortality prediction:
- Logistic Regression (LR): A baseline statistical model using penalized maximum likelihood estimation.
- Random Forest (RF): An ensemble decision-tree method implemented with default hyperparameters without further tuning.
- Neural Networks (NN): A multi-layer perceptron architecture designed to identify complex nonlinear relationships.
A team of cardiac surgeons from the Department of Cardiac Surgery at the University Hospital Basel selected the additional preoperative and postoperative variables for inclusion in the ML models based on clinical judgment and their potential prognostic value in predicting 30-day mortality. To enable fair comparison across models, we use two performance measures: the area under the ROC curve (AUC) and the specificity at 85% sensitivity, both evaluated on a test set. The AUC serves as an integrative metric, capturing performance across all sensitivity-specificity thresholds, while the latter is better aligned with clinical priorities, namely, minimizing false positives (“false alarms”) while ensuring that only a small proportion of critical cases (i.e., patients who died within 30 days) are missed. To mitigate class imbalance, we applied random undersampling of the majority class (survivors) in each training set. Model evaluation was conducted over 100 random 80/20 train-test splits with stratified outcome sampling. Feature preprocessing included median imputation for continuous variables and mode imputation for categorical variables. Differences in model performance were assessed using paired Wilcoxon signed-rank tests.
RF classifier was trained on 50 randomly chosen subsets, each with 68 patients per class (approximately 80% of the minority class size), ensuring balanced outcome representation. Remaining patients formed the test sets. Predictive performance was assessed using (i) AUC and (ii) specificity (1−false alarm rate) at the fixed sensitivity of 85% on the test splits. Paired Wilcoxon signed-rank tests evaluated model specificity differences with significance defined as p<0.05. Variable importance was evaluated using the Gini importance measure in RF models to determine the most predictive variables. All analyses were performed using R (version 4.1.2) and additional R-packages including “random Forest” (version 4.7-1.1), “sampling” (version 2.10) and “AUC” (version 0.3.2). The random Forest package was used “off the shelf”, i.e., with the default parameter values. No further model selection was performed.
For comparison, a classical linear LR model with lasso (L1) regularization was trained on the same randomly selected subsets, using the R package gimlet (version 4.1-8). Unlike RF, LR models do not natively handle categorical variables; therefore, all factor variables were encoded using contrast coding. The regularization strength (sparsity penalty) was adaptively selected through an internal cross-validation loop within each training split.
Finally, a NN model in the form of a multi-layer perceptron with two hidden layers and ReLU activation functions was trained using the R package keras3 (version 1.3.0). As with the LR model, categorical variables were encoded using contrast coding. Tunable hyperparameters, including weight regularization constants, were optimized via an internal cross-validation loop within each training split.
3. Results
The mean age of the cohort was 68.4 ± 10.3 years, with a predominance of male patients (83%), the mean EuroSCORE II was 2.85 ± 4.8. The observed 30-day mortality for the entire cohort was 2.5% (n=87).
3.1. Baseline Model: EuroSCORE II Variables
A detailed comparison of clinical characteristics included in EuroSCORE II in Table 1. Non-survivors were significantly older, had lower preoperative ejection fraction and glomerular filtration rate, and showed higher prevalence of preoperative risk factors including arteriopathy, reduced mobility, preoperative hemodynamic instability, diabetes, recent myocardial infarction, and higher operative urgency (all p < 0.001). The mean preoperative EuroSCORE II was markedly higher in the non-survivor group (13.8 ± 16.3 vs. 2.8 ± 4.7, p < 0.001).
3.2. Model I: EuroSCORE II Plus Preoperative Сharacteristics
A comparison of additional preoperative variables included are presented in Table 2. Non-survivors exhibited higher rates of kidney disease (22% vs. 5.2%), unstable angina (39.1% vs. 22.1%), and cardiogenic shock (25.3% vs. 1.8%) (all p<0.001). They also had higher preoperative creatinine levels (128.9 vs. 90.8 mg/dl; p<0.001) and were more likely to require ventilator support before surgery (18.4% vs. 1.1%; p<0.001).
3.3. Model II: EuroSCORE II Plus Pre- and Postoperative Characteristics
Finally, a comparison of additional postoperative variables included in the Model II presented in Table 3. Compared to survivors, non-survivors had significantly higher posoperative peak creatinine levels (232.6 vs. 108.7 mg/dl; p<0.001), and elevated cardiac biomarkers, including CK (3538 vs. 1062 mg/dl; p<0.001), CK-MB (142.6 vs. 36.4 mg/dl; p<0.001), and Troponin-T (4796 vs. 819 mg/dl; p<0.001). Major complications such as postoperative myocardial infarction (21.8% vs. 1.9%, <0.001), stroke (16.1% vs. 1.9%, <0.001), kidney failure (46% vs. 5.7%, <0.001), and pulmonary complications (47.1% vs. 10.4%, <0.001) were also significantly more frequent among non-survivors
3.4. Machine Learning: Model I vs. Baseline Model
For each ML method separately, differences in the predictive performance for these three feature subsets were analysed using the AUC metric and the specificity at a sensitivity of 85% on the test splits. The latter calibration reflects a clinically meaningful threshold, prioritizing the minimization of false “alarms” (where alarm in this context refers to falsely assigning a survivor to the death group).
For both the RF and the NN classifier, the specificity on the test set, measuring the ability to correctly identify survivors, was significantly higher for the Model I as compared to the EuroSCORE variables alone in the Baseline Model (p values of roughly 10-4), see Figure 1 for the RF and Figure 2 for the NN. In the left panel of both Figures, the blue line shows the mean difference in specificity, averaged over all randomly chosen training-test splits, which is approximately 0.08 (95%CI: 0.05-0.11) for the RF and 0.1 (95%CI 0.05-0.14) for the NN, indicating that the additional preoperative features in Model I indeed lead to a significantly increased specificity. For the linear LR model, no clear difference between the two feature subsets was detectable (see Figure 3), which suggests that the inherent nonlinearity of both the RF and the NN is essential for exploiting the full potential of the additional preoperative variables. The model comparison using the AUC metric shows essentially the same trends for all experiments, as shown in Figure A1, Figure A2 and Figure A3 in the supplementary materials.
3.5. Machine Learning: Model II vs Baseline Model
After including additional postoperative features, all ML classifiers demonstrated much better specificity compared to the Baseline Model. The mean difference for the RF is 0.27 (95%CI: 0.22-0.32), which is similar to the obtained differences for the NN 0.26 (95%CI: 0.22-0.31) and the LR 0.26 (95%CI: 0.19-0.32). This result indicates that in this experiment all ML methods (i.e., LR, RF, and NN) behave very similar and that they all have clearly higher specificity for the full set of pre-and postoperative features considered, as shown in Figure 4. Similar improvements in test specificity with the inclusion of postoperative features were observed for the NN and LR models, as shown in Figure A4 and Figure A5 in the supplementary materials.
4. Discussion
In our study, we demonstrated that incorporating postoperative cardiovascular variables into machine learning models significantly improves the prediction of early adverse events. Accurate preoperative risk assessment remains essential in cardiac surgery to guide clinical decision-making and optimize patient outcomes. Traditional models like EuroSCORE II, while widely utilized, have limitations in predictive accuracy, particularly due to their reliance on linear assumptions and a predefined set of variables [1,13,14]. Moreover, although EuroSCORE II demonstrates good discriminative ability, it has been shown to significantly overestimate mortality risk, particularly among younger patients [15].
In both nonlinear ML methods investigated the RF and the NN, the integration of preoperative variables with the baseline EuroSCORE II variables (Model I) resulted in a notable improvement of specificity for predicting 30-day mortality. In the RF model, specificity improved from 42% to 51% while maintaining a fixed sensitivity of 85%, while comparable improvements were observed for the NN. In contrast, no significant performance gain was seen with the linear LR model, suggesting that it lacks the capacity to capture the complex relationships embedded in the expanded feature set. Between the two nonlinear classifiers (i.e.,the RF and the NN), we could not identify any noticeable performance differences in our experimental setting. However, the RF turned out to be simpler to implement, required no parameter tuning, and offered transparent feature importance for easy interpretation.
Further augmentation with implementation of postoperative variables (Model II) augmented the specificity of prediction the mortality to 70%, underscoring the substantial value postoperative data in mortality prediction. This approach allows for dynamic risk reassessment, reflecting how complications or physiological responses during and immediately after surgery influence short-term mortality risk. By integrating postoperative data, such as renal function, biomarkers, and early complications, Model II enables clinicians to update prognostic assessments in real-time, offering a more nuanced understanding of each patient’s risk profile. The substantial improvement in specificity achieved by our ML models may translate into a clinically meaningful reduction in false positive classifications. By more accurately identifying lower-risk patients, the ML model could help avoid unnecessary interventions, reduce patient burden, and improve resource allocation, all while maintaining high sensitivity. Additionally, variable importance analysis within the RF model identified postoperative kidney failure as the strongest predictor of 30-day mortality, followed by pulmonary complications and postoperative myocardial infarction, underscoring the prognostic relevance of early postoperative events in short-term outcome prediction. To facilitate clinical translation, the developed ML models could be implemented as an online risk calculator or integrated into electronic health records, providing clinicians with real-time, data-driven mortality risk estimates to support preoperative decision-making and patient counseling.
Our findings align with and expand upon previous studies on ML in cardiac surgery risk prediction, further strengthening the evidence for its integration. Recent research supports our findings that ML models offer superior predictive performance compared to traditional LR-based scores. Benedetto et al. demonstrated in a meta-analysis that ML algorithms consistently showed better discrimination in predicting postoperative mortality after cardiac surgery [16]. Similarly, Weiss et al. showed that institution-specific ML models trained on multimodal electronic health records significantly outperformed standard STS risk scores in individual mortality prediction across various cardiac procedures [17]. By incorporating both preoperative and postoperative variables, our model enables a more comprehensive and dynamic risk assessment, an approach particularly relevant in light of the ongoing development of EuroSCORE 3, which is expected to integrate ML [16]. Overall, multiple previous studies reported superior performance of various ML models over EuroSCORE II in predicting postoperative mortality after cardiac surgery. [18,19,20,21] A recent systematic review and meta-analysis demonstrated that machine learning models significantly outperform traditional logistic regression in predicting operative mortality after cardiac surgery, although the clinical impact of this improvement remains uncertain. [22]
The inclusion of over 3,000 consecutive patients over a 13-year period provides substantial statistical power and real-world relevance. Furthermore, the stepwise integration of preoperative and postoperative variables offers valuable insights into their respective contributions to the predictive performance of machine learning models. However, the study has several limitations. The retrospective design of the study may introduce inherent biases related to data collection and patient selection. Secondly, while our models demonstrated improved specificity, the generalizability of these findings to other institutions or patient populations remains to be established. Prospective multicenter studies are needed to validate and refine these ML models, explore real-time data integration for dynamic risk prediction, and assess practical implementation, including system integration, staff training, and cost-effectiveness.
5. Conclusions
Incorporating both preoperative and postoperative variables into ML models significantly enhances the specificity of 30-day mortality predictions following CABG compared to the EuroSCORE II. These findings underscore the potential of ML to augment traditional risk assessment tools in cardiac surgery, highlighting the need for further research to validate and implement these models in diverse clinical settings.
Supplementary Materials
The following supporting information can be downloaded at the website of this paper posted on Preprints.org
Author Contributions
All authors made substantial contributions to the conception of the viewpoint and interpretation of data. Conceptualization and funding acquisition, D.B.; Methodology V.R.; Writing—original draft preparation, I.S., D.D., and B.K.; Supervision, B.G. and. O.R.; Writing—review and editing, G.R., R.K., and B.M. All authors have read and agreed to the published version of the manuscript. All authors provided critical feedback and helped shape the research, analysis and manuscript.
Funding
This work was supported by the Ilse and Immanuel Straub Foundation, with DB serving as the primary grant holder.
Institutional Review Board Statement
This study was approved by the Ethics Committee of Northwestern and Central Switzerland (EKNZ; project ID: 2020-02698), which waived the requirement for individual informed consent due to the retrospective nature of the analysis.
Informed Consent Statement
Not applicable.
Data Availability Statement
The original contributions presented in this study are included in the article/supplementary material. Further inquiries can be directed to the corresponding author(s).
Conflicts of Interest
The authors declare no conflicts of interest.
Abbreviations
The following abbreviations are used in this manuscript:
| AF | Atrial Fibrillation |
| AP | Angina Pectoris |
| BSA | Body Surface Area |
| CABG | Coronary Artery Bypass Grafting |
| CAD | Coronary Artery Disease |
| CCS | Canadian Cardiovascular Society |
| CK-MB | Creatine Kinase–Myocardial Band |
| COPD | Chronic Obstructive Pulmonary Disease |
| CVI | Cerebrovascular Incident |
| DVT | Deep Vein Thrombosis |
| ECC | Extracorporeal Circulation |
| EF | Ejection Fraction |
| GFR | Glomerular Filtration Rate |
| ICD | Implantable Cardioverter-Defibrillator |
| LR | Logistic Regression |
| MI | Myocardial Infarction |
| ML | Machine Learning |
| MOF | Multi-Organ Failure |
| MPAP | Mean Pulmonary Arterial Pressure |
| NB | Naive Bayes |
| NN | Neural Networks |
| NP | Negative Predictive Value |
| NYHA | New York Heart Association |
| PAD | Peripheral Arterial Disease |
| PCI | Percutaneous Coronary Intervention |
| PPV | Positive Predictive Value |
| RF | Random Forest |
| SIRS | Systemic Inflammatory Response Syndrome |
| STS | Society of Thoracic Surgeons |
| UTI | Urinary Tract Infection |
References
- Mastroiacovo G, Bonomi A, Ludergnani M, et al. Is EuroSCORE II still a reliable predictor for cardiac surgery mortality in 2022? A retrospective study. Eur J Cardiothorac Surg. 2022;64. [CrossRef]
- Guida P, Mastro F, Scrascia G, et al. Performance of the European System for Cardiac Operative Risk Evaluation II: A meta-analysis of 22 studies involving 145,592 cardiac surgery procedures. J Thorac Cardiovasc Surg. 2014;148:3049–3057.e1. [CrossRef]
- Shahian DM, Lippmann RP. Commentary: Machine learning and cardiac surgery risk prediction. J Thorac Cardiovasc Surg. 2022;163:2090–2092. [CrossRef]
- Modine T, Overtchouk P. Machine learning is no magic. JACC Cardiovasc Interv. 2019;12:1339–1341. [CrossRef]
- Benedetto U, Dimagli A, Sinha S, et al. Machine learning improves mortality risk prediction after cardiac surgery: Systematic review and meta-analysis. J Thorac Cardiovasc Surg. 2022;163:2075–2087.e9. [CrossRef]
- Mortazavi BJ, Bucholz EM, Desai NR, et al. Comparison of machine learning methods with National Cardiovascular Data Registry models for prediction of risk of bleeding after percutaneous coronary intervention. JAMA Netw Open. 2019;2:e196835. [CrossRef]
- Kilic A, Goyal A, Miller JK, et al. Performance of a machine learning algorithm in predicting outcomes of aortic valve replacement. Ann Thorac Surg. 2021;111:503–510. [CrossRef]
- Parkes MD, Aliabadi AZ, Cadeiras M, et al. An integrated molecular diagnostic report for heart transplant biopsies using an ensemble of diagnostic algorithms. J Heart Lung Transplant. 2019;38:636–646. [CrossRef]
- Pimor A, Galli E, Vitel E, et al. Predictors of post-operative cardiovascular events, focused on atrial fibrillation, after valve surgery for primary mitral regurgitation. Eur Heart J Cardiovasc Imaging. 2018 Mar 28. [CrossRef]
- Tseng P-Y, Chen Y-T, Wang C-H, et al. Prediction of the development of acute kidney injury following cardiac surgery by machine learning. Crit Care. 2020;24:478. [CrossRef]
- Boeddinghaus J, Doudesis D, Lopez-Ayala P, et al. Machine learning for myocardial infarction compared with guideline-recommended diagnostic pathways. Circulation. 2024;149:1090–1101. [CrossRef]
- Castela Forte J, Yeshmagambetova G, van der Grinten ML, et al. Comparison of machine learning models including preoperative, intraoperative, and postoperative data and mortality after cardiac surgery. JAMA Netw Open. 2022;5:e2237970. [CrossRef]
- Vilca Mejia OA, Borgomoni GB, Zubelli JP, et al. Validation and quality measurements for STS, EuroSCORE II and a regional risk model in Brazilian patients. PLoS One. 2020;15:e0238737. [CrossRef]
- Fang SY, Chen JW, Chou HW, et al. Validation of the European system for cardiac operative risk evaluation II in a large Taiwan cardiac surgical centre. J Formos Med Assoc. 2023;122:1265–1273. [CrossRef]
- Silverborn M, Nielsen S, Karlsson M. The performance of EuroSCORE II in CABG patients in relation to sex, age, and surgical risk: A nationwide study in 14,118 patients. J Cardiothorac Surg. 2023;18:1. [CrossRef]
- Benedetto U, Dimagli A, Sinha S, et al. Machine learning improves mortality risk prediction after cardiac surgery: Systematic review and meta-analysis. J Thorac Cardiovasc Surg. 2022;163:2075–2087.e9. [CrossRef]
- Weiss AJ, Yadaw AS, Meretzky DL, et al. Machine learning using institution-specific multi-modal electronic health records improves mortality risk prediction for cardiac surgery patients. JTCVS Open. 2023;14:214–251. [CrossRef]
- Allyn J, Allou N, Augustin P, et al. A comparison of a machine learning model with EuroSCORE II in predicting mortality after elective cardiac surgery: a decision curve analysis. PLoS One. 2017;12:e0169772. [CrossRef]
- Sinha S, Dong T, Dimagli A, et al. Comparison of machine learning techniques in prediction of mortality following cardiac surgery: analysis of over 220,000 patients from a large national database. Eur J Cardiothorac Surg. 2023;63:ezad183. [CrossRef]
- Xu K, Shan L, Bai Y, et al. The clinical applications of ensemble machine learning based on the bagging strategy for in-hospital mortality of coronary artery bypass grafting surgery. Heliyon. 2024;10:e38435. [CrossRef]
- Molina RS, Molina-Rodríguez MA, Rincon FM, Maldonado JD. Cardiac operative risk in Latin America: a comparison of machine learning models vs EuroSCORE-II. Ann Thorac Surg. 2022;113:92–99. [CrossRef]
- Benedetto U, Dimagli A, Sinha S, et al. Machine learning improves mortality risk prediction after cardiac surgery: Systematic review and meta-analysis. J Thorac Cardiovasc Surg. 2022;163:2075–2087.e9. [CrossRef]
Figure 1.
RF: Improvement in Test Specificity with Additional Preoperative Features (Model I vs. Baseline EuroSCORE II Model). Legend: The figure illustrates the improvement in test specificity at 85% sensitivity when additional preoperative variables are added to the EuroSCORE II baseline model (p < 0.001). The left panel shows the paired differences in specificity for each of the 100 random train-test splits (EuroPre − Euro), with the blue line representing the mean difference (0.08) and its 95% confidence interval (0.05–0.11). The right panel displays paired boxplots comparing specificity values for the baseline model (“Euro”) versus the extended model (“EuroPre”), with each line connecting results from the same data split.
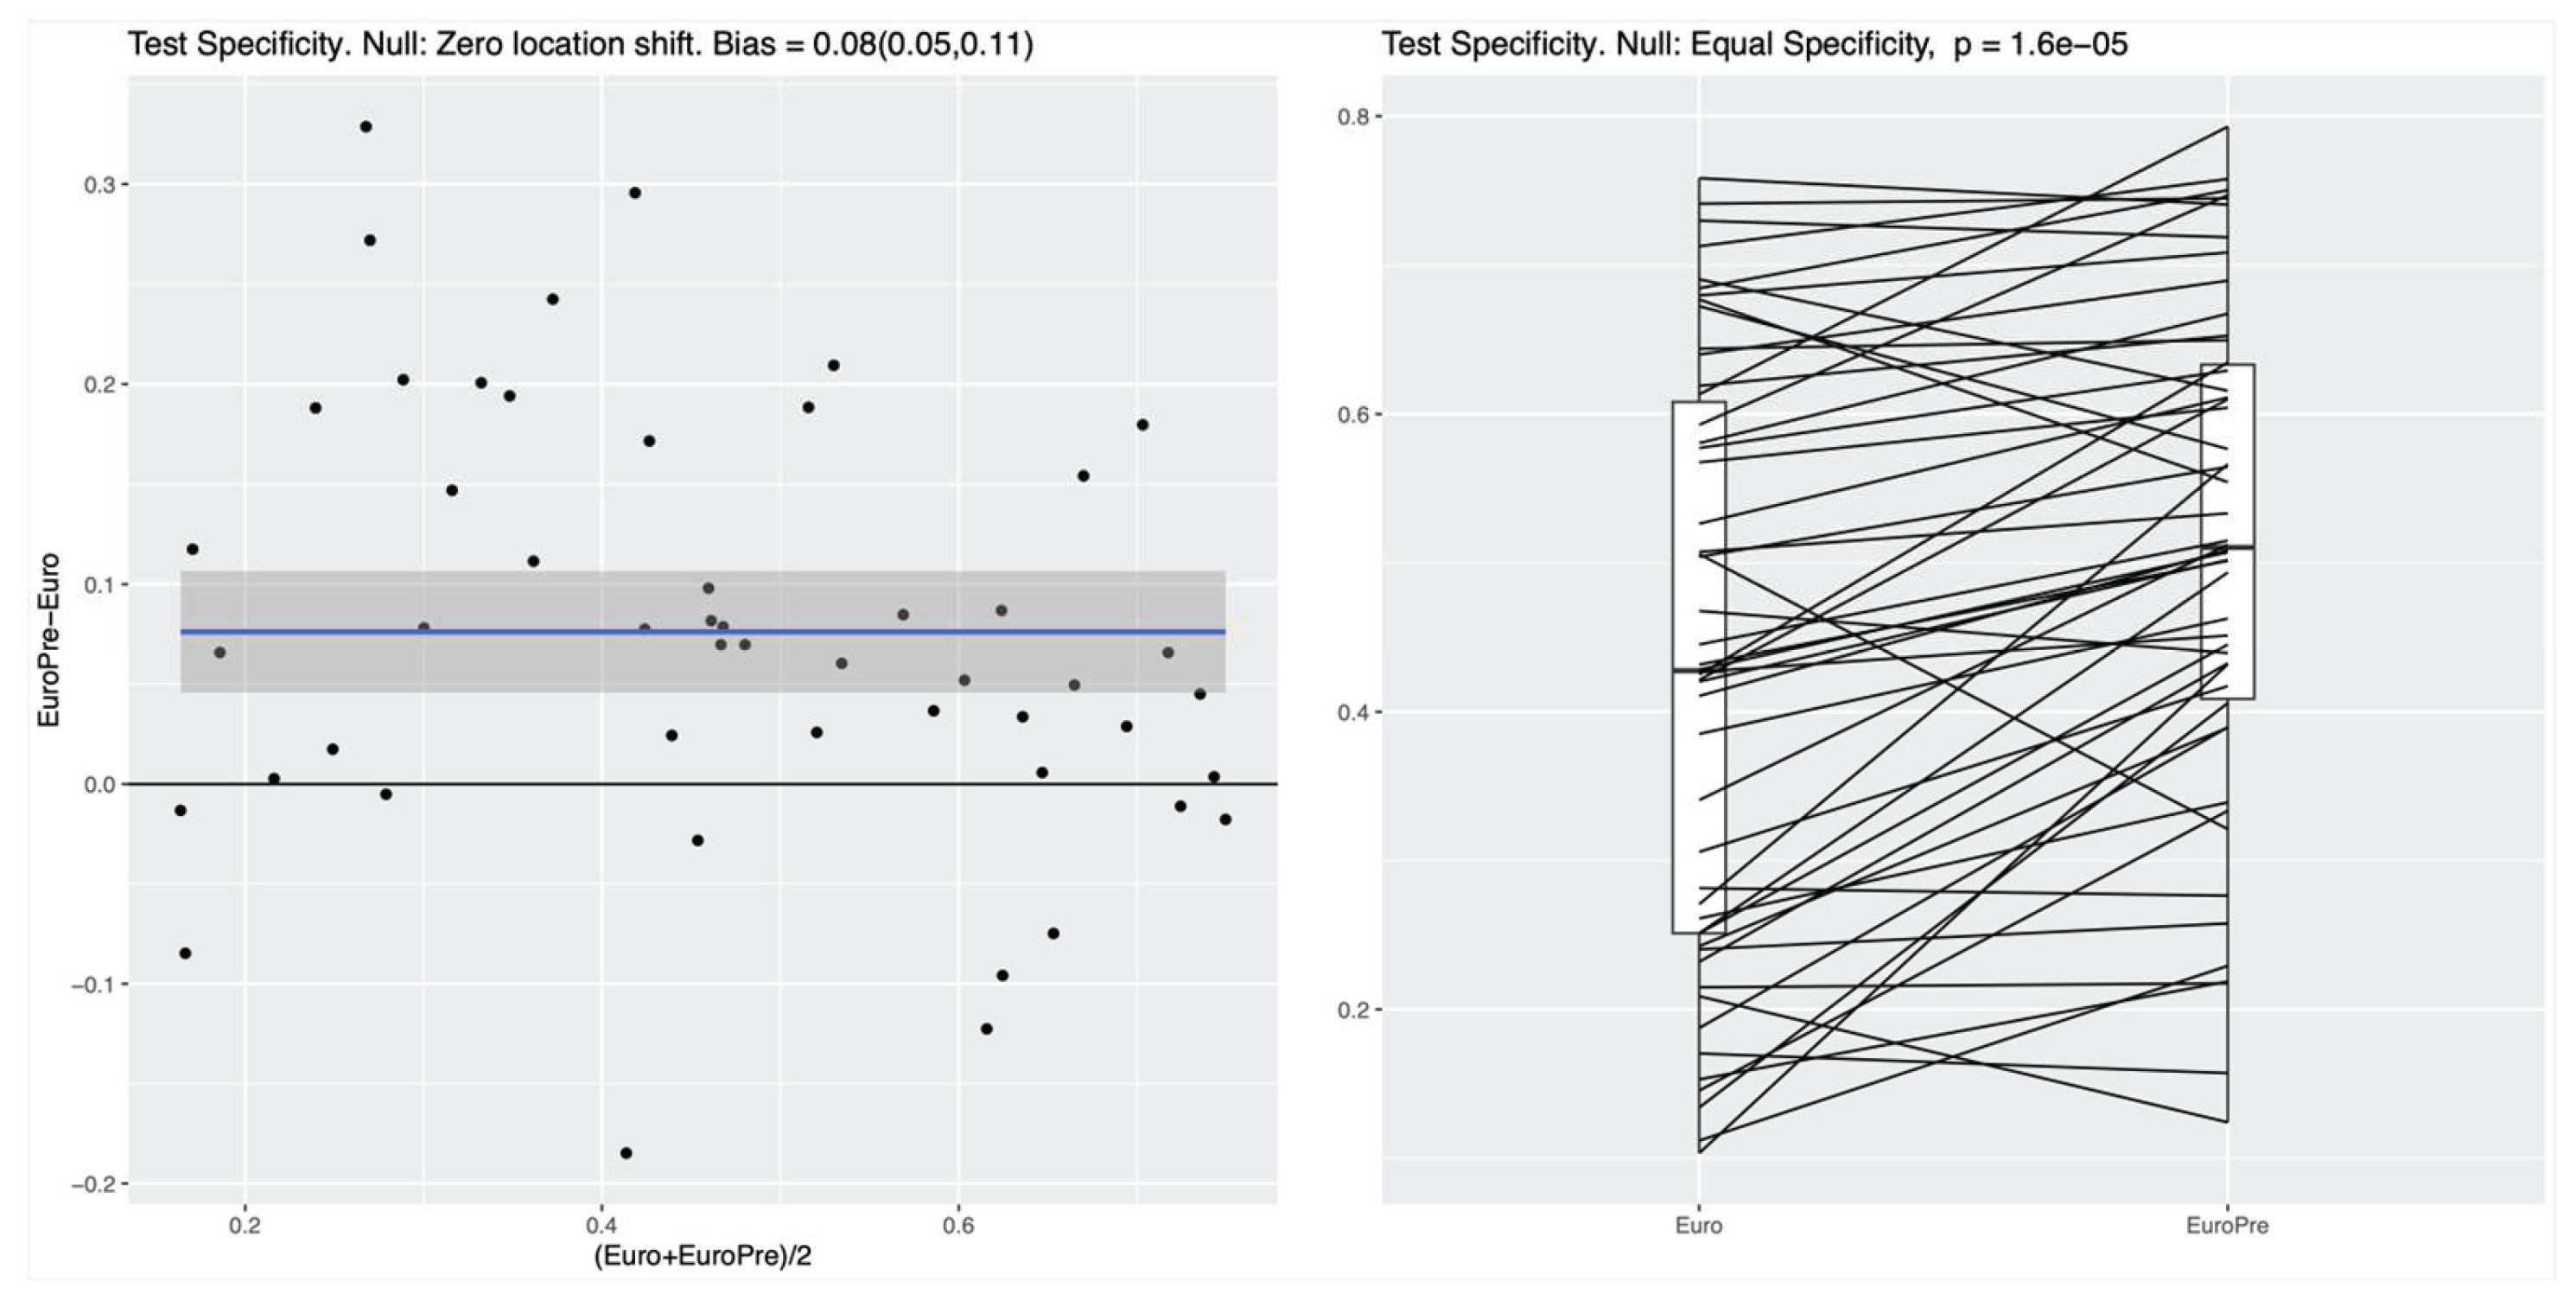
Figure 2.
NN: Improvement in Test Specificity with Additional Preoperative Features (Model I vs. Baseline EuroSCORE II Model). Legend: This figure shows the enhancement in test specificity at 85% sensitivity achieved by incorporating additional preoperative variables into the EuroSCORE II baseline model when using a NN classifier. In the majority of random splits, the classifiers trained on the features included in Model I demonstrated superior performance over those trained only on the EuroSCORE features. Specifically, for the RF, the median specificity increased from 42% (Baseline Model) to 51% for Model I, reflecting a consistent and clinically meaningful improvement in accurately identifying survivors. This improvement was statistically significant (p < 0.001). Similarly for the NN, the median specificity increased from 28% to 43% (p < 0.001).
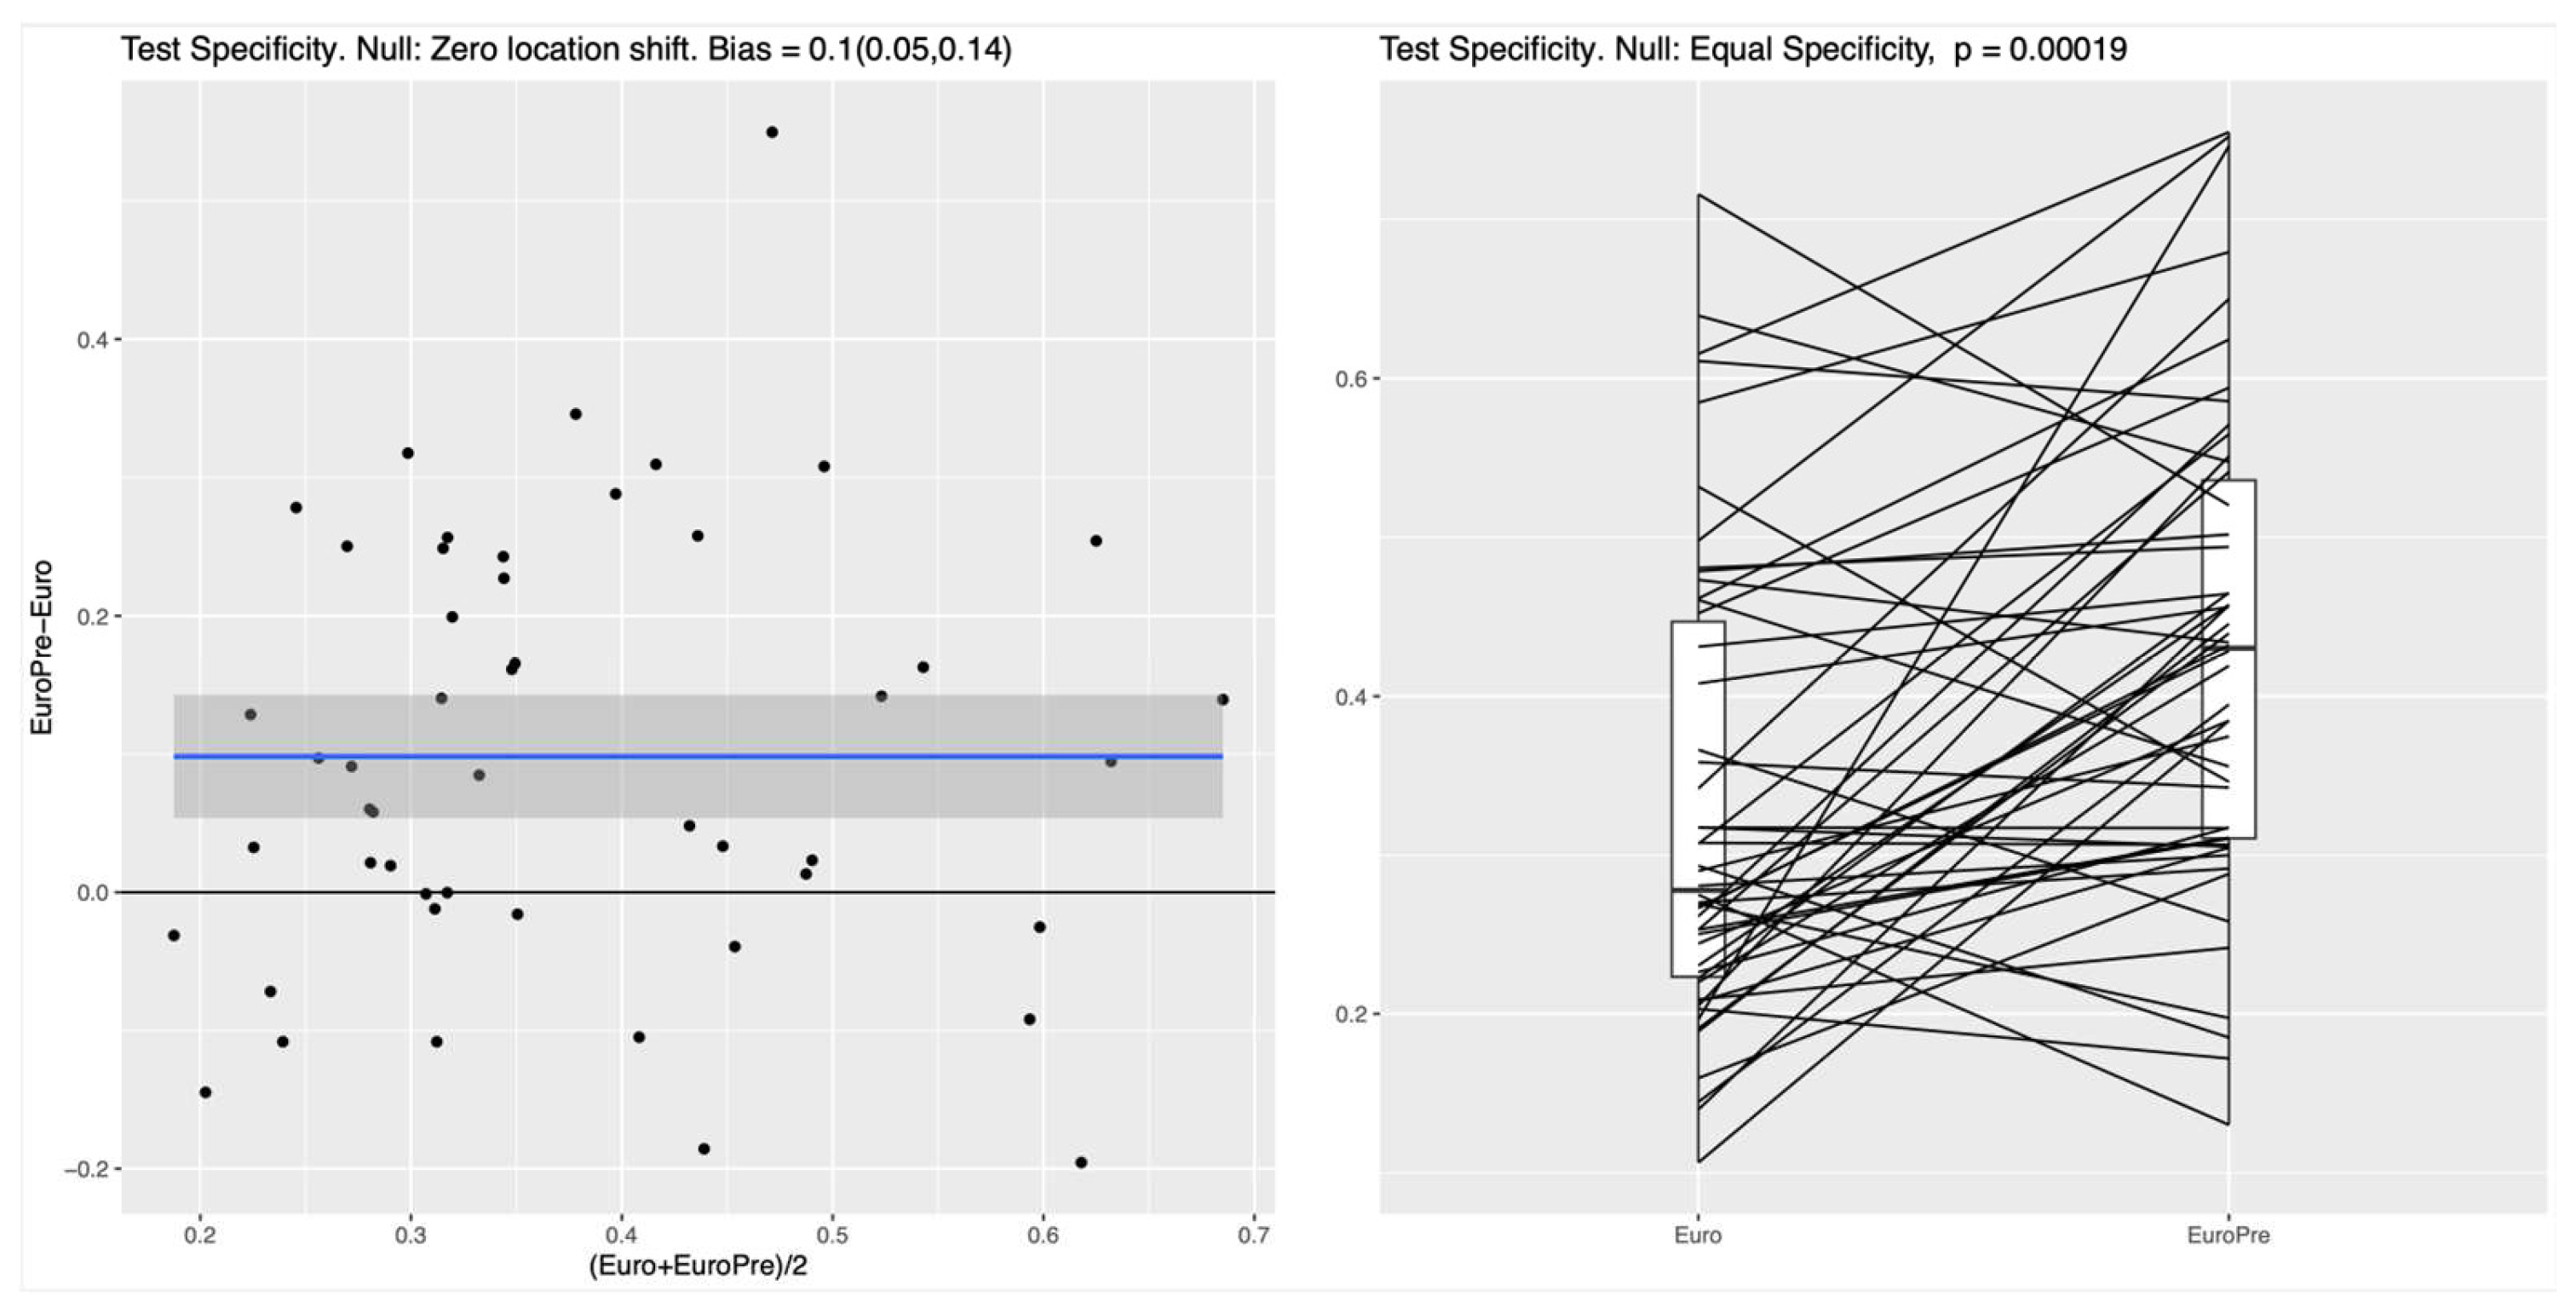
Figure 3.
LR: No Improvement in Test Specificity with Additional Preoperative Features (LR, Model I vs. Baseline EuroSCORE II Model). Legend: This figure compares the test specificity of a LR model using only EuroSCORE II variables (“Euro”) with a model that includes additional preoperative features (“EuroPre”). Contrary to the nonlinear RF and NN classifiers, for the linear LR model, no specificity differences are observable. For the RF, variable importance was analyzed using the Gini index, revealing that among the additional preoperative features that are not included in the EuroSCORE variables, the most predictive feature in the extended set in Model I was cardiogenic shock, followed by “previousmi”/ “previousmitime”, history of previous ventilation and “crea”.
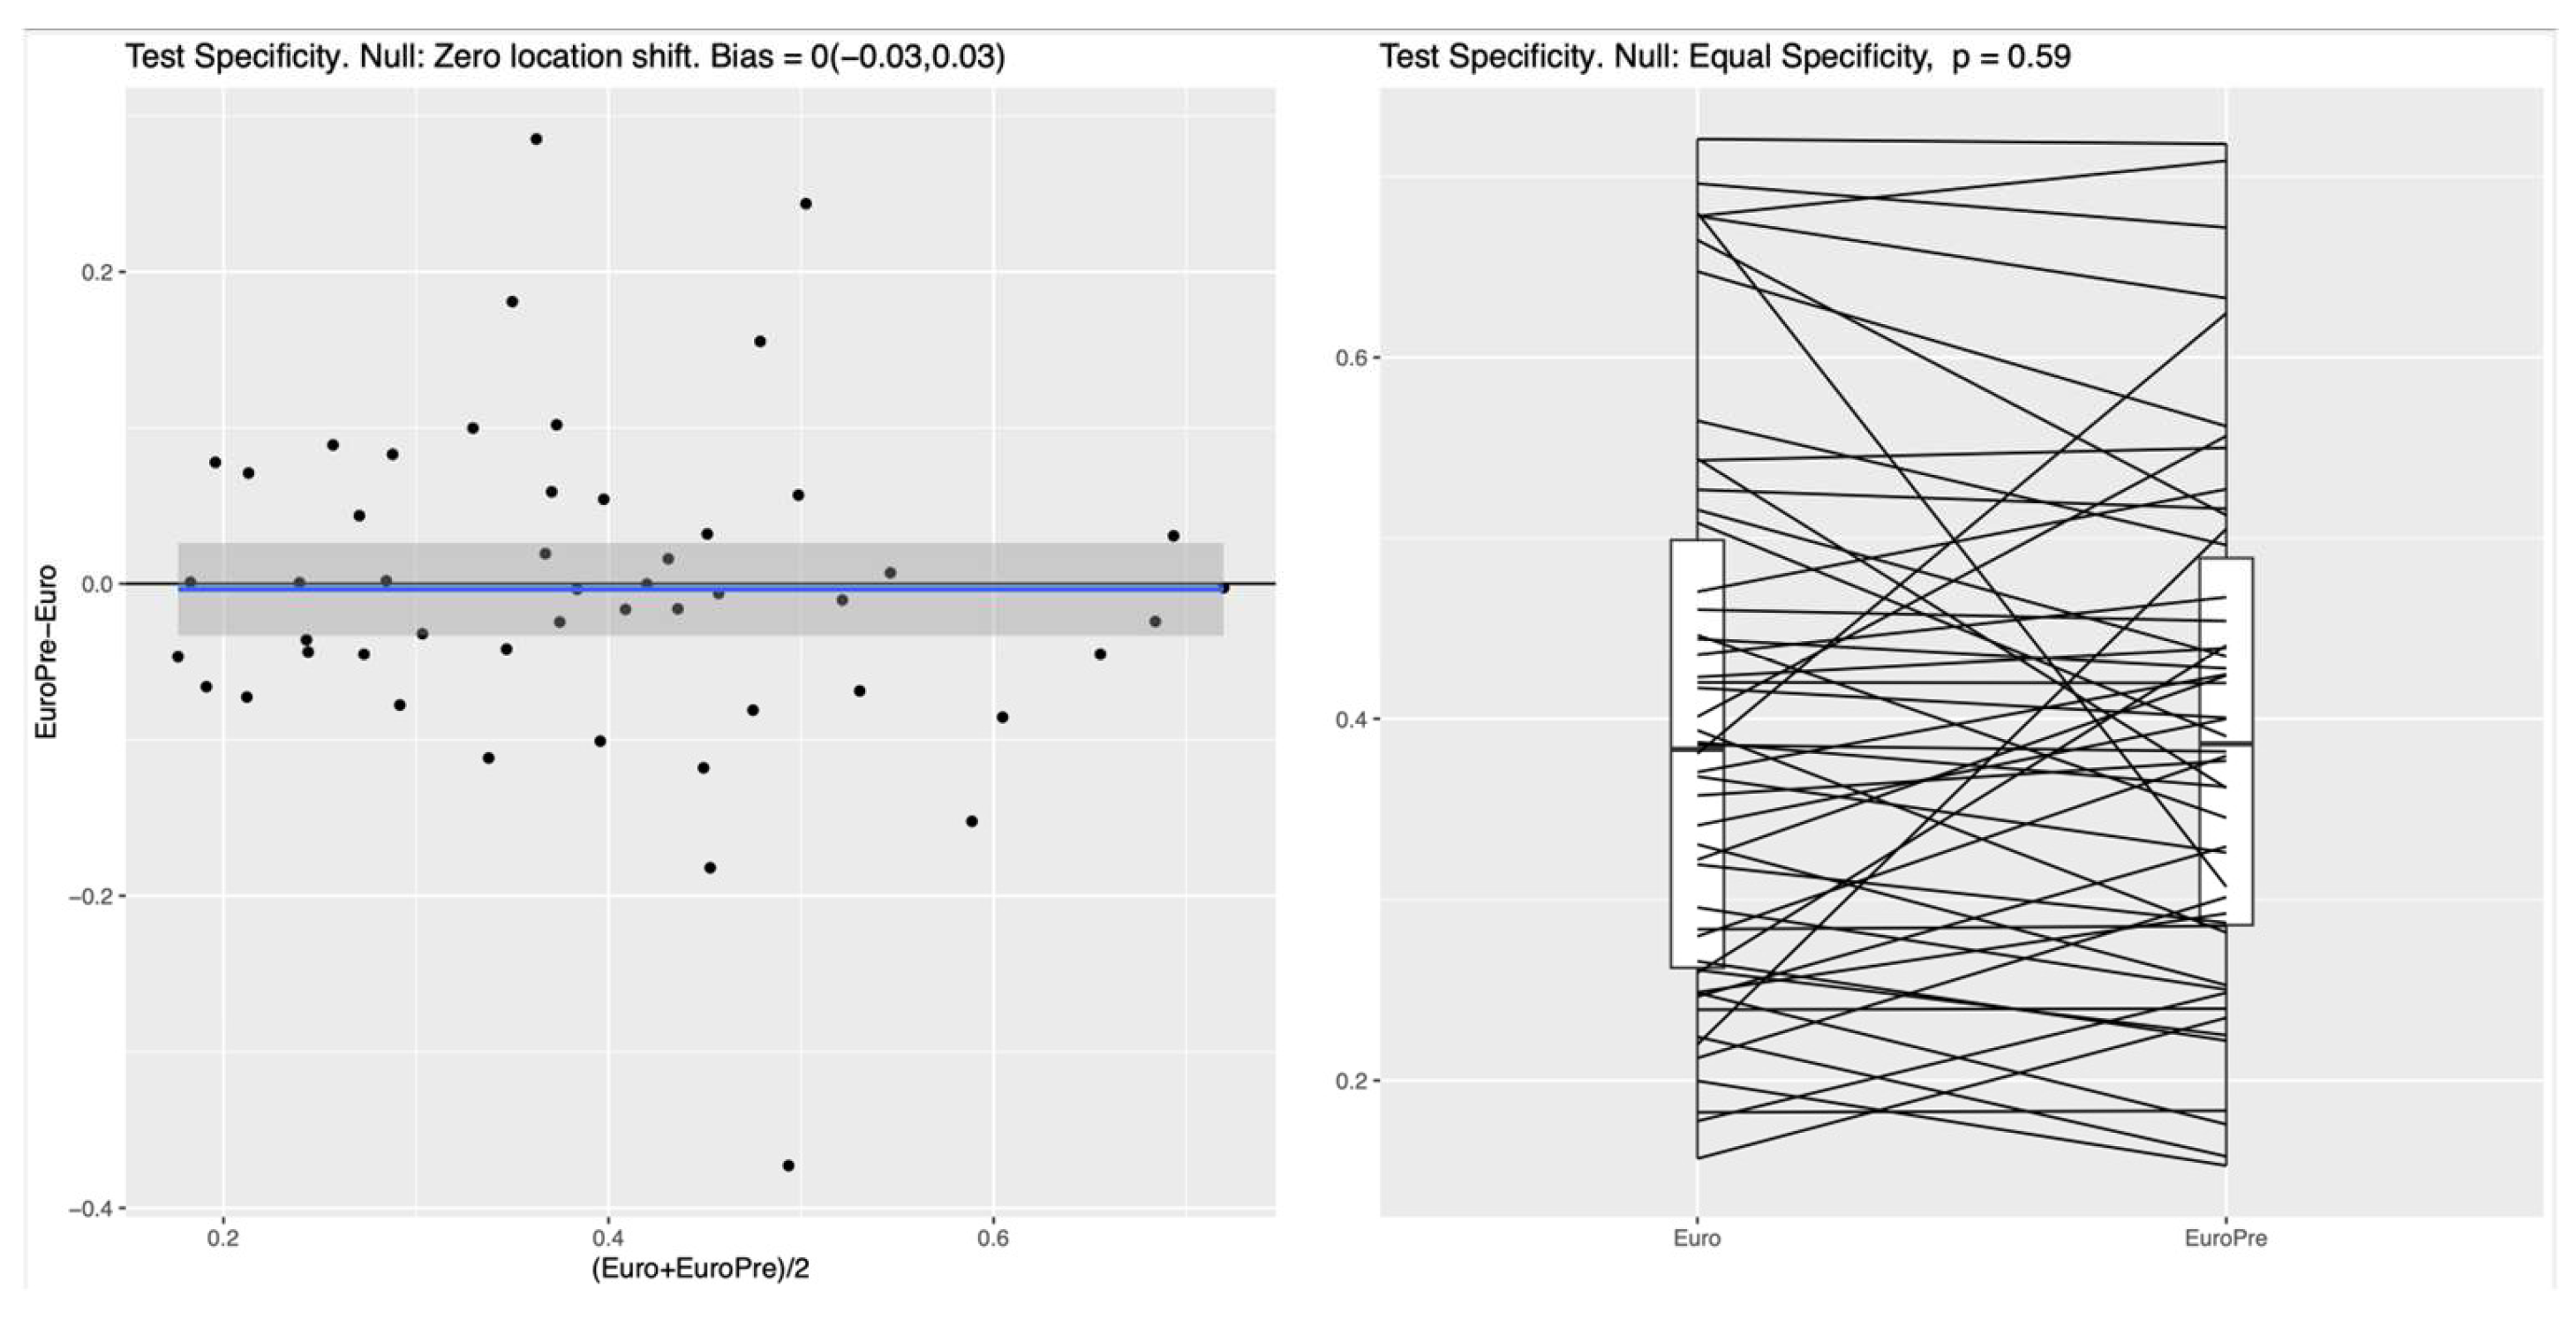
Figure 4.
RF: Improvement in Test Specificity (RF, Model II vs. Baseline EuroSCORE II Model). Legend: This figure demonstrates the impact of incorporating both preoperative and postoperative variables (“EuroPrePost,” corresponding to Model II) compared to EuroSCORE II variables alone (“Euro”) on test specificity at 85% sensitivity using a RF classifier. Additional pre- and postoperative features (labelled “EuroPrePost” in the plot, corresponding to Model II in the text) vs EuroSCORE variables alone (labelled “Euro” in the plot corresponding to the Baseline Model). The left panel shows a clear average specificity difference between the two feature sets of 0.27 (95%CI: 0.22,0.32). The right panel indicates that in almost any random data split, the full feature set lead to a substantially increased performance: The median specificity at 85% sensitivity increased from 0.41 to 0.7 (p < 0.001).
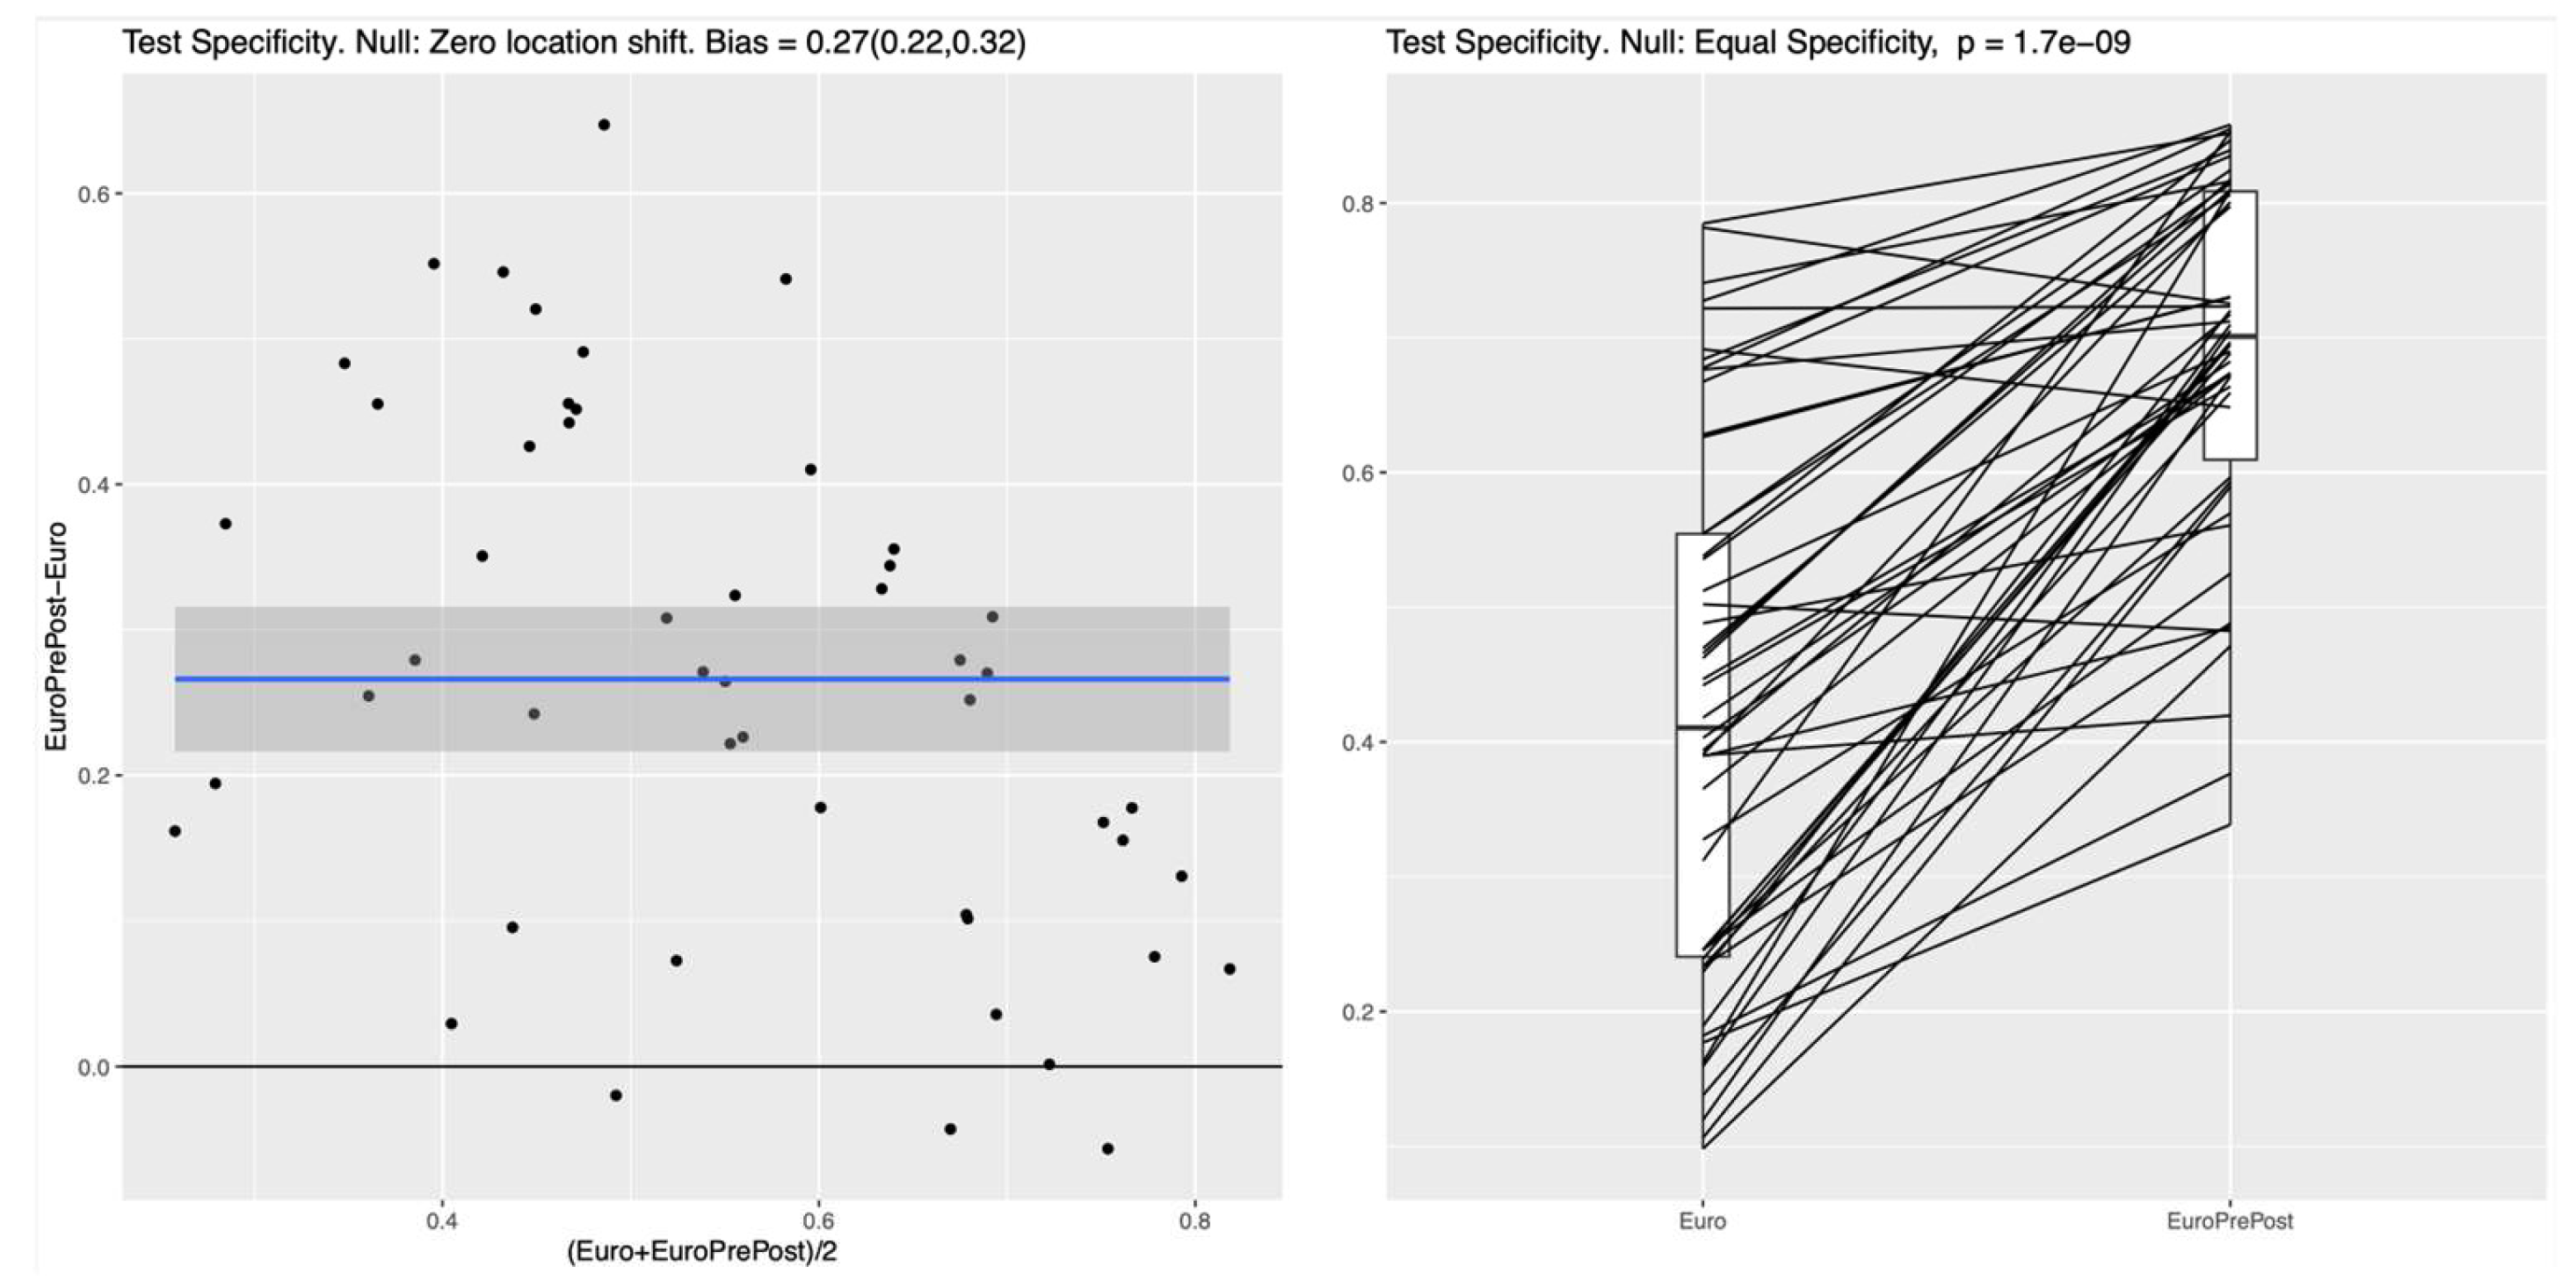

Table 1.
Euroscore II variables included in the model.
| Variable | Alive (n=3,396) | Dead (n=87) | p-value |
| Males | 2841 (83.7%) | 65 (74.7%) | 0.02 |
| Females | 555 (16.3%) | 22 (25.3%) | 0.02 |
| Age | 66.09 (9.84) | 71.44 (9.80) | <0.001 |
| GFR | 88.35 (33.63) | 69.16 (37.26) | <0.001 |
| EF preop | 52.78 (11.38) | 43.74 (15.20) | <0.001 |
| MPAP | 0.10 (0.43) | 0.28 (0.62) | <0.001 |
| COPD (Grade 3-4) | 130 (3.9%) | 6 (6.9%) | <0.001 |
| Arteriopathy | 712 (21.0%) | 39 (44.8%) | <0.001 |
| Mobility limitation | 110 (3.2%) | 13 (14.9%) | <0.001 |
| Previous operations | 78 (1.8%) | 2 (2.3%) | 0.98 |
| Preop instability | 238 (7.0%) | 31 (35.6%) | <0.001 |
| Diabetes | 1270 (37.3%) | 43 (49.4%) | <0.001 |
| CCS (Grade 3-4) | 1620 (47.7%) | 57 (65.5%) | <0.001 |
| Recent MI | 1479 (43.6%) | 57 (65.5%) | <0.001 |
| NYHA (Grade 3-4) | 662 (19.4%) | 41 (47.1%) | <0.001 |
| Urgency | 961 (28.2%) | 50 (57.4%) | <0.001 |
| EF | 52.7 (11.4) | 43.7 (15.2) | <0.001 |
| Euroscore | 2.84 (4.72) | 13.76 (16.28) | <0.001 |
The table presents the distribution of standard EuroSCORE II variables among survivors and non-survivors after isolated CABG. As neither of patients had endocarditis, thoracic surgery, and all patients had isolated CABG, these variables were excluded. Values are reported as mean (SD) for continuous variables and n (%) for categorical variables. Abbreviations: GFR – Glomerular Filtration Rate, EF – Ejection Fraction, MPAP – Mean Pulmonary Artery Pressure, BSA – Body Surface Area, COPD – Chronic Obstructive Pulmonary Disease, CCS – Canadian Cardiovascular Society (Angina Classification), MI – Myocardial Infarction, NYHA – New York Heart Association (Heart Failure Classification), CABG – Coronary Artery Bypass Grafting.
Table 2.
Preoperative variables included in the model.
| Variable | Alive (n=3,396) | Dead (n=87) | p-value |
| Height (cm) | 172.22 (8.37) | 168.37 (9.70) | <0.001 |
| Weight (kg) | 82.08 (15.05) | 79.57 (18.91) | 0.12 |
| BMI | 27.64 (5.19) | 27.91 (5.58) | 0.63 |
| Body Surface Area (m^2) | 1.95 (0.19) | 1.89 (0.24) | <0.001 |
| Dyslipidemia | 2,615 (77%) | 63 (72.4%) | <0.001 |
| Hypertension | 2,932 (86.3%) | 70 (80.5%) | <0.001 |
| Atrial fibrillation | 139 (4.1%) | 3 (3.45%) | <0.001 |
| TIA | 101 (3%) | 7 (8%) | <0.001 |
| Family history | 1,519 (44.7%) | 37 (42.5%) | <0.001 |
| Smoker | 847 (25%) | 22 (25.3%) | 0.12 |
| Anti-coagulation drugs | 3,018 (88.9%) | 78 (89.7%) | <0.001 |
| Cancer | 300 (8.8%) | 11 (12.6%) | <0.001 |
| PAD (none) | 2,916 (85.9%) | 57 (65.5%) | <0.001 |
| Kidney disease | 178 (5.2%) | 19 (22%) | <0.001 |
| Last pre-operative creatinine (mg/dl) | 90.8 (51.9) | 128.9 (129) | <0.001 |
| Carotid stenosis | 234 (6.9%) | 10 (11.5%) | <0.001 |
| Previous vascular surgery/amputation | 187 (5.5%) | 12 (13.8%) | <0.001 |
| Previous MI | 1,525 (45%) | 45 (51.7%) | <0.001 |
| Ventilated preop | 38 (1.1%) | 16 (18.4%) | <0.001 |
| Left- or right-heart catheterisation | 1,119 (33%) | 51 (58.2%) | <0.001 |
| Perioperative PCI | 87 (2.5%) | 3 (3.5%) | 0.14 |
| Triple vessel disease | 2187 (64.4%) | 49 (56.3%) | 0.38 |
| Instable Angina-pectoris | 751 (22.1%) | 34 (39.1%) | <0.001 |
| Cardiogenic shock | 61 (1.8%) | 22 (25.3%) | <0.001 |
| MI <6 hours before CABG | 186 (5.5%) | 21 (24.1%) | <0.001 |
The table summarizes clinical and laboratory parameters collected preoperatively but not included in the original EuroSCORE II. Values are reported as mean (SD) for continuous variables and n (%) for categorical variables. Abbreviations: COPD – Chronic Obstructive Pulmonary Disease; CCS – Canadian Cardiovascular Society; MI – Myocardial Infarction; NYHA – New York Heart Association; BSA – Body Surface Area; PAD – Peripheral Artery Disease; TIA – Transient Ischemic Attack; PCI – Percutaneous Coronary Intervention; CABG – Coronary Artery Bypass Grafting.
Table 3.
Postoperative variables included in the model.
| Variable | Alive (n=3,396) | Dead (n=87) | p-value |
| Max. creatinin-value (n) | 108.7 (75.22) | 232.6 (159.00) | <0.001 |
| Max. CK-value (U/l) | 1062 (1919.42) | 3538 (4646.85) | <0.001 |
| Max. CK-MB value (U/l) | 36.4 (67.93) | 142.6 (185.11) | <0.001 |
| Max. Troponin-T (ng/ml) | 819 (1969.10) | 4796 (6571.41) | <0.001 |
| Perioperative MI | 65 (1.91%) | 19 (21.8%) | <0.001 |
| Cardiac complications(none) | 2,509 (73.9%) | 21 (24.1%) | <0.001 |
| Stroke | 64 (1.9%) | 14 (16.1%) | <0.001 |
|
Neurological non-cerebro complications (none) |
2848 (83.9%) | 57 (65.5%) | <0.001 |
| Kidney failure | 193 (5.7%) | 40 (46%) | <0.001 |
| Pulmonary complication (none) | 3043 (89.61%) | 41 ( 47.1%) | <0.001 |
| Other complications (none) | 2905 (85.5%) | 17 (19.5%) | <0.001 |
The table lists perioperative clinical and laboratory variables available within the first five days following surgery. Values are reported as mean (SD) for continuous variables and n (%) for categorical variables. This table presents postoperative variables compared between survivors and non-survivors following isolated CABG. Continuous variables are expressed as mean (standard deviation), and categorical variables as number (percentage). Certainly, here is the list in plain text format: Abbreviations: CK – Creatine Kinase; CK-MB – Creatine Kinase Myocardial Band; MI – Myocardial Infarction; ng/ml – Nanograms per millilitre; U/l – Units per litre; CABG – Coronary Artery Bypass Grafting.
Disclaimer/Publisher’s Note: The statements, opinions and data contained in all publications are solely those of the individual author(s) and contributor(s) and not of MDPI and/or the editor(s). MDPI and/or the editor(s) disclaim responsibility for any injury to people or property resulting from any ideas, methods, instructions or products referred to in the content. |
© 2025 by the authors. Licensee MDPI, Basel, Switzerland. This article is an open access article distributed under the terms and conditions of the Creative Commons Attribution (CC BY) license (http://creativecommons.org/licenses/by/4.0/).
Copyright: This open access article is published under a Creative Commons CC BY 4.0 license, which permit the free download, distribution, and reuse, provided that the author and preprint are cited in any reuse.


