Introduction
HCTHEX is one of the most versatile types of thermal energy exchanges used in the chemical, nuclear, and pharmaceutical industries, and it is also a highly effective device for harnessing solar energy in both residential and commercial buildings [[1[
8]. Despite their robust popularity among compact heat exchangers, there have not been more than only a few studies focused primarily on the correlations of effectiveness (
of this kind of HEXs, either experimentally or numerically, which were implemented by the first author of this present work [
2,
5].This present work on the other hand, though, has been aiming to investigate the global behavior of HCTHEX by implementing over 2400 simulations covering ranges of thermal, hydraulic, and geometrical features of HCTHEX under laminar flow regimes on both the shell- and coil-side.
Research studies on helically coiled tube heat exchangers primarily focus on specific boundary conditions (B.Cs.), such as constant heat flux, fixed temperature boundaries, or power input through DC current. Some studies also investigate natural convection on the shell side. However, no comprehensive investigations have examined the thermal performance and heat transfer behavior on the shell side of these compact heat exchangers, especially concerning the fluid-to-fluid heat transfer mechanism.
Mirgolbabaei [
1,
2], Mirgolbabaei et al. [
3,
6], and Ghorbani et al. [
4,
5] conducted a series of numerical simulations and experiments to study the heat transfer in helically coiled tube heat exchangers. The experiments in Ghorbani et al. [
4,
5] were conducted for both laminar and turbulent regimes inside the coil. It was deduced that the ε-NTU relation of the mixed convection heat transfer condition – natural and forced convections, can be mirrored by that of a pure counter-flow heat exchanger.
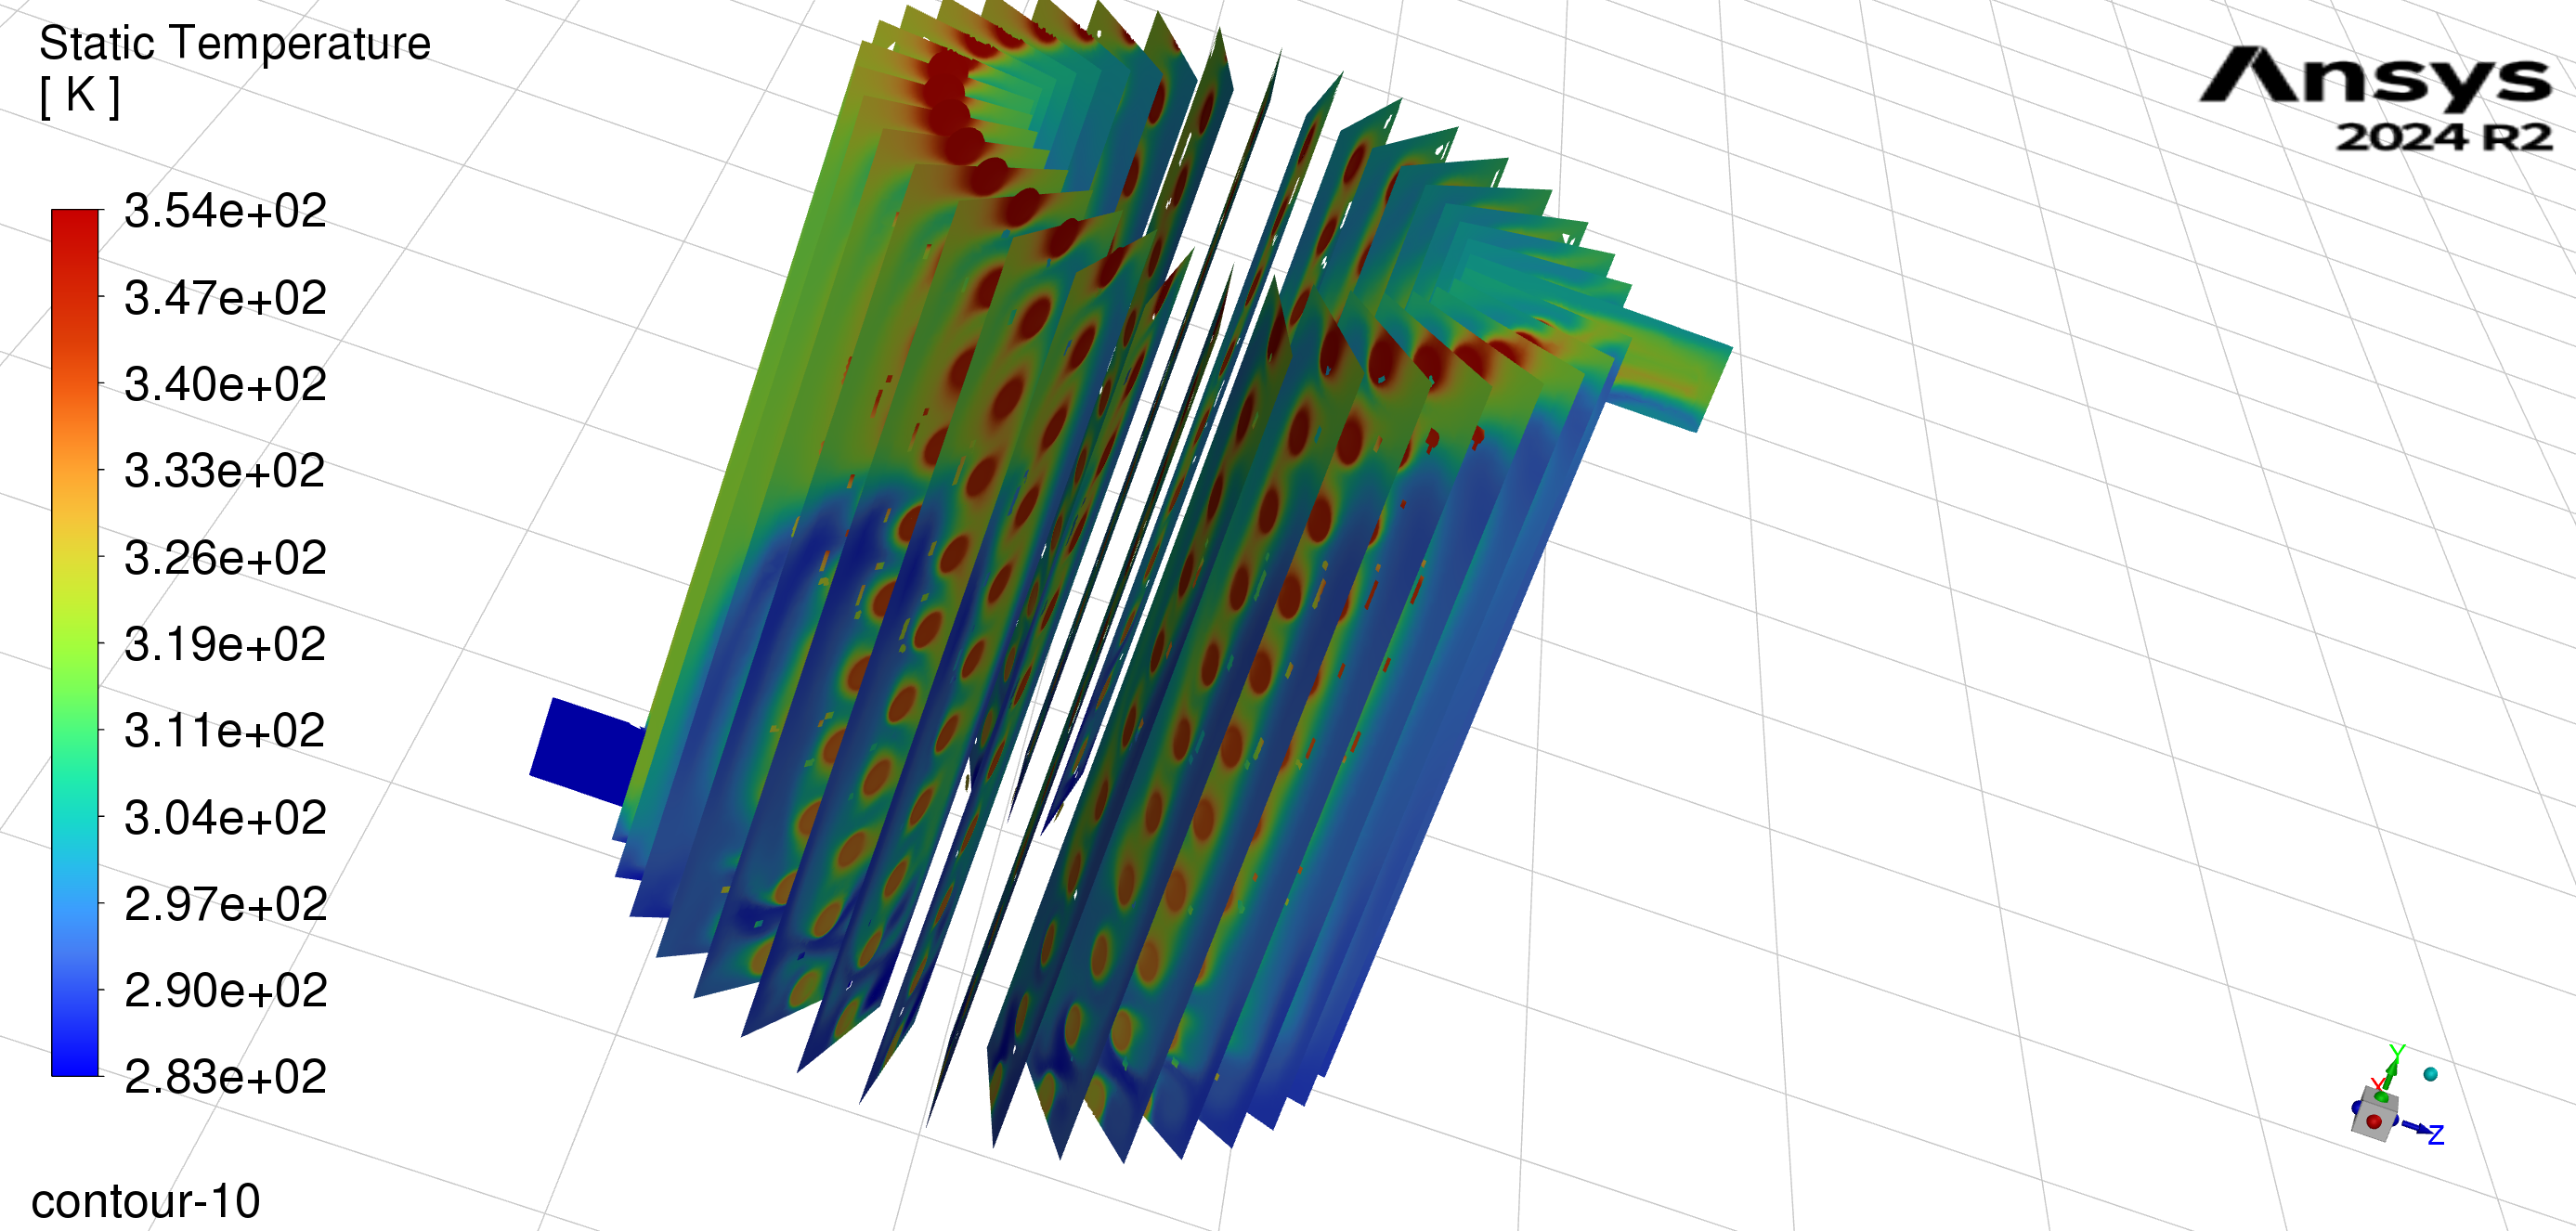
This study aims to provide insights into the thermal performance of widely used industrial heat exchangers. It investigates how various parameter changes affect the effectiveness of helically coiled tube-in-annular-cylindrical shell heat exchangers. To simulate real thermal boundary conditions, a three-dimensional steady-state fluid-to-fluid numerical simulation is conducted. The model includes convection heat transfer within the tube, conduction through the tube wall, and convection on the outer surface of the coiled tube.
Computational Model
This research differs from most studies by using a real fluid-to-fluid simulation of a vertically oriented HEX in ANSYS-FLUENT 2023, licensed to the University of Minnesota. Both sides are modeled with water, with no phase change assumed.
Thermophysical properties:
While temperature-dependent properties could improve accuracy, the complex flow and uneven temperature gradients in the shell side hinder solution convergence. Therefore, the overall average temperature was estimated from prior studies, and water properties were assumed at that temperature.
Flow regimes:
For the shell's flow structure, the most representative length has been discussed in previous studies by the author [
1,
2,
3,
4,
5]. In this study, the shell-side flow regime was determined using the hydraulic diameter of the shadowed surface. Based on either choice, the
will be smaller than the critical
for internal flows through a circular pipe, for
.
The transitional regime of the fluid flow on the coil side is determined based on the study conducted by Schmidt [
9]:
The coil flow rate up to remains laminar. To consider shell-side thermal variability, Re and are simulated. Exit configurations include extending the last turn or bending at 90 degrees, but these may disrupt laminar flow. Our models keep coils turning until fluid exits on both sides, with no straight sections, to avoid turbulence.
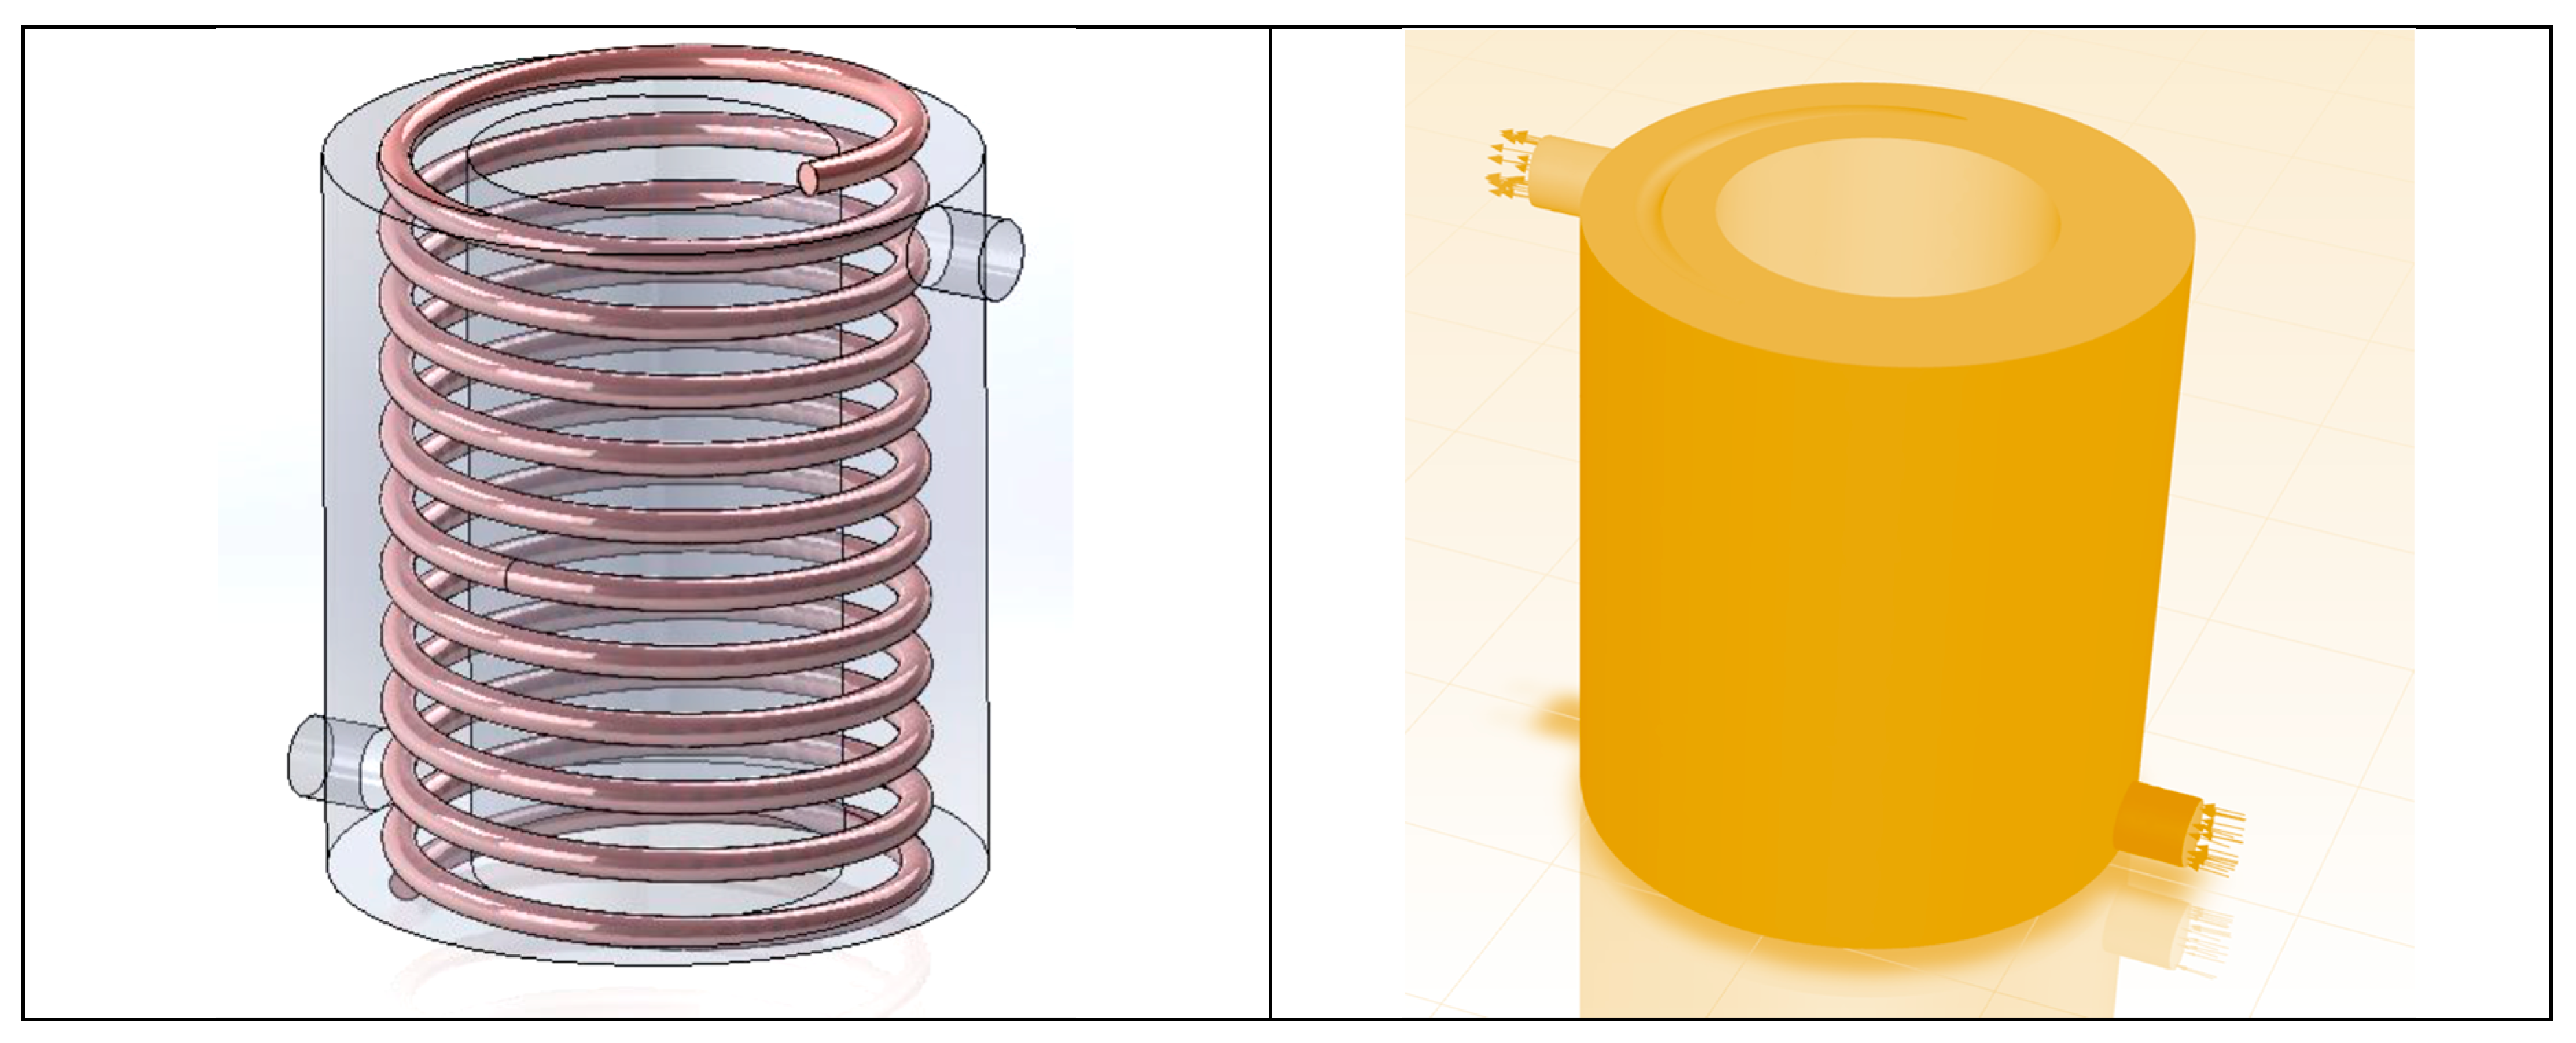
Dimensions of different geometries under study are provided in
Table 1. The schematic of the HEX is demonstrated in
Figure 1.
The simulation runs under steady-state conditions with a pressure-based 'coupled' algorithm. It uses second-order discretization for the continuity, momentum, and energy equations, with relation factors between models. The coil wall is coupled with its shadow; the coil tube was modeled in Ansys as a 1D wall, using constant copper properties. Artifacts at the coil base were modeled similarly. Protruding coil sections are modeled as adiabatic with zero thickness copper, and shell walls as adiabatic zero-thickness aluminum. The following equations are solved as the continuity, momentum, and energy equations, respectively, for the steady state condition:
The computational cells and the type of meshing schemes used in the study are laid out in detail in [
6].
Model Verification
This study validates the numerical model by comparing it to a well-known formula that describes thermal and hydraulic properties on the coil side. The Nusselt number on the coil side is not significantly affected by the pitch; instead, it is primarily influenced by the curvature ratio, as outlined below [
10]:
in our numerical models is calculated as follows:
where
and
are volume-based average temperature of the coil-side medium and overall inner coil surface temperature, respectively.
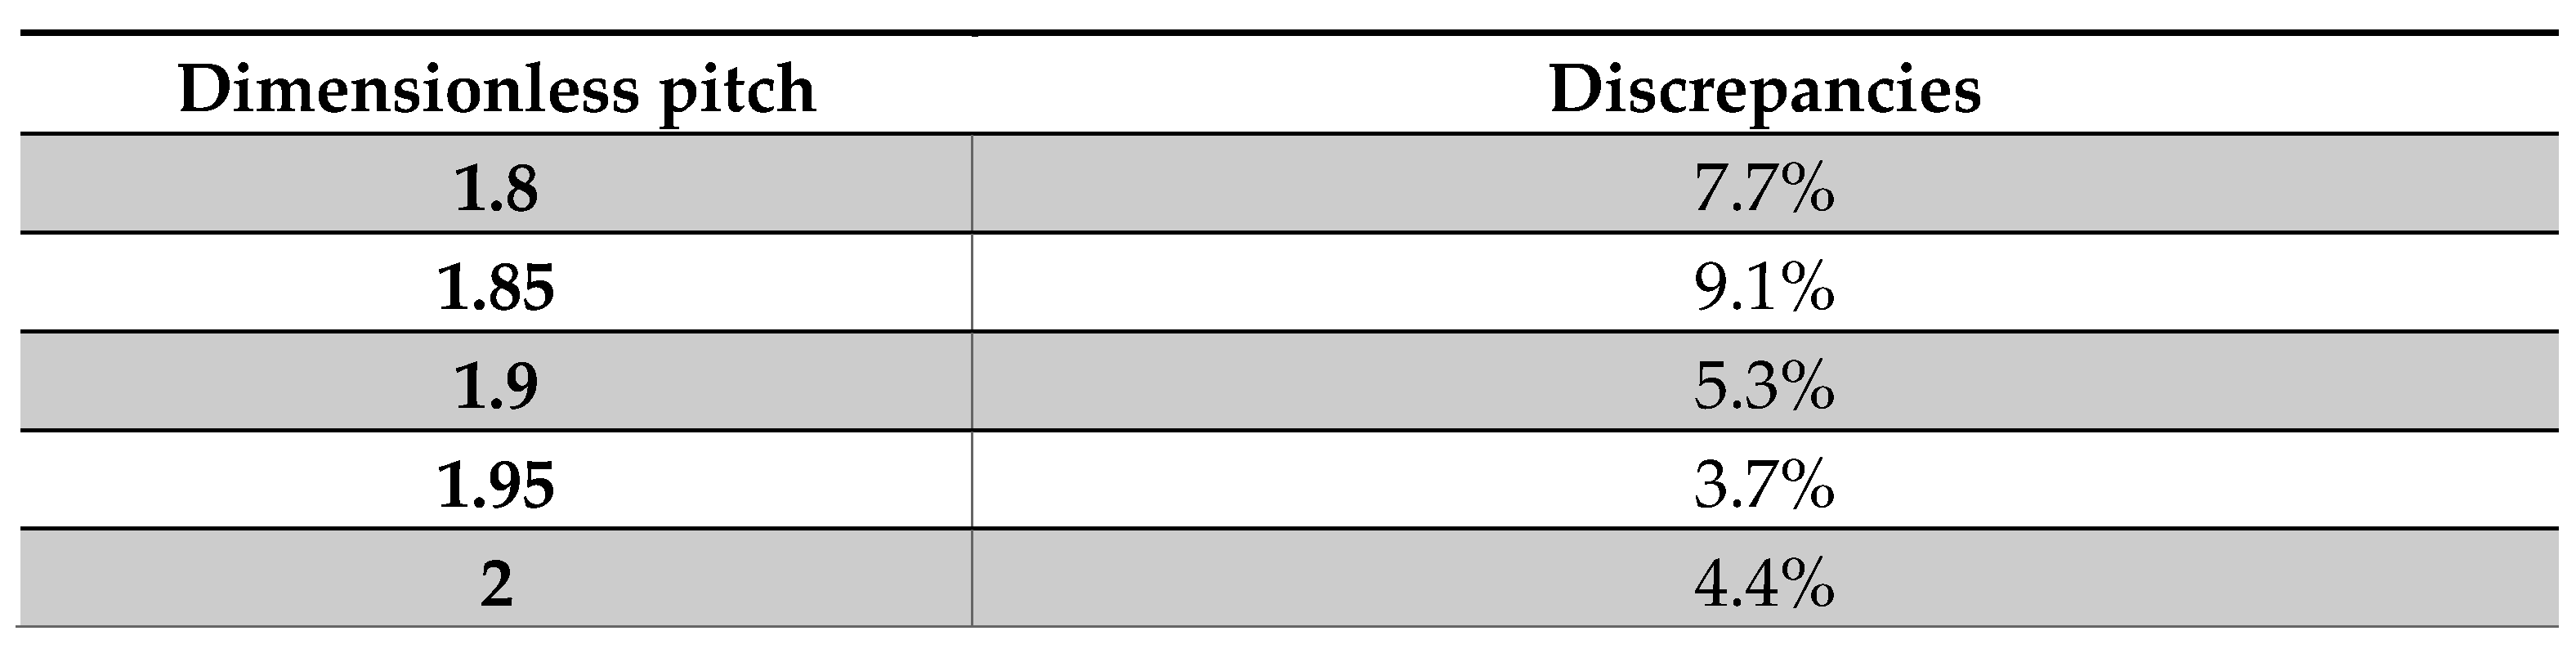
The resultant
values and the values from (5) are reported in
Table 2. The discrepancy between 9% and 0.8% is obtained from this comparison.
The total pressure drop can be approximated using various equations, although these formulas are only applicable within specific ranges of
. All the models in this study utilize the same parameters, so the pressure loss results are consistently compared to a single established formula from existing literature [
6,
11].Comparison between the numerically calculated pressure loss on the coil side and the values obtained from the formula in [
11] is shown in
Table 3.
Data Reduction
Heat exchanger effectiveness is defined as the ratio of the actual heat transfer rate for a heat exchanger to the thermodynamically limited maximum possible heat transfer rate if an infinite heat transfer surface area were available in a counter-flow heat exchanger:
in this equation is the maximum heat transfer rate that can be hypothetically achieved in a standard counter-flow heat exchanger of infinite length, corresponding to maximum temperature difference for one stream.
Effectiveness-NTU
The number of heat transfer units is described as:
The overall heat transfer coefficient is determined as follows:
where the are
can be either the area of the inner surface of the tube,
, or area of the outer surface of the coil – shell-side heat transfer area,
, or the area based on some diameter,
.
Results & Discussion
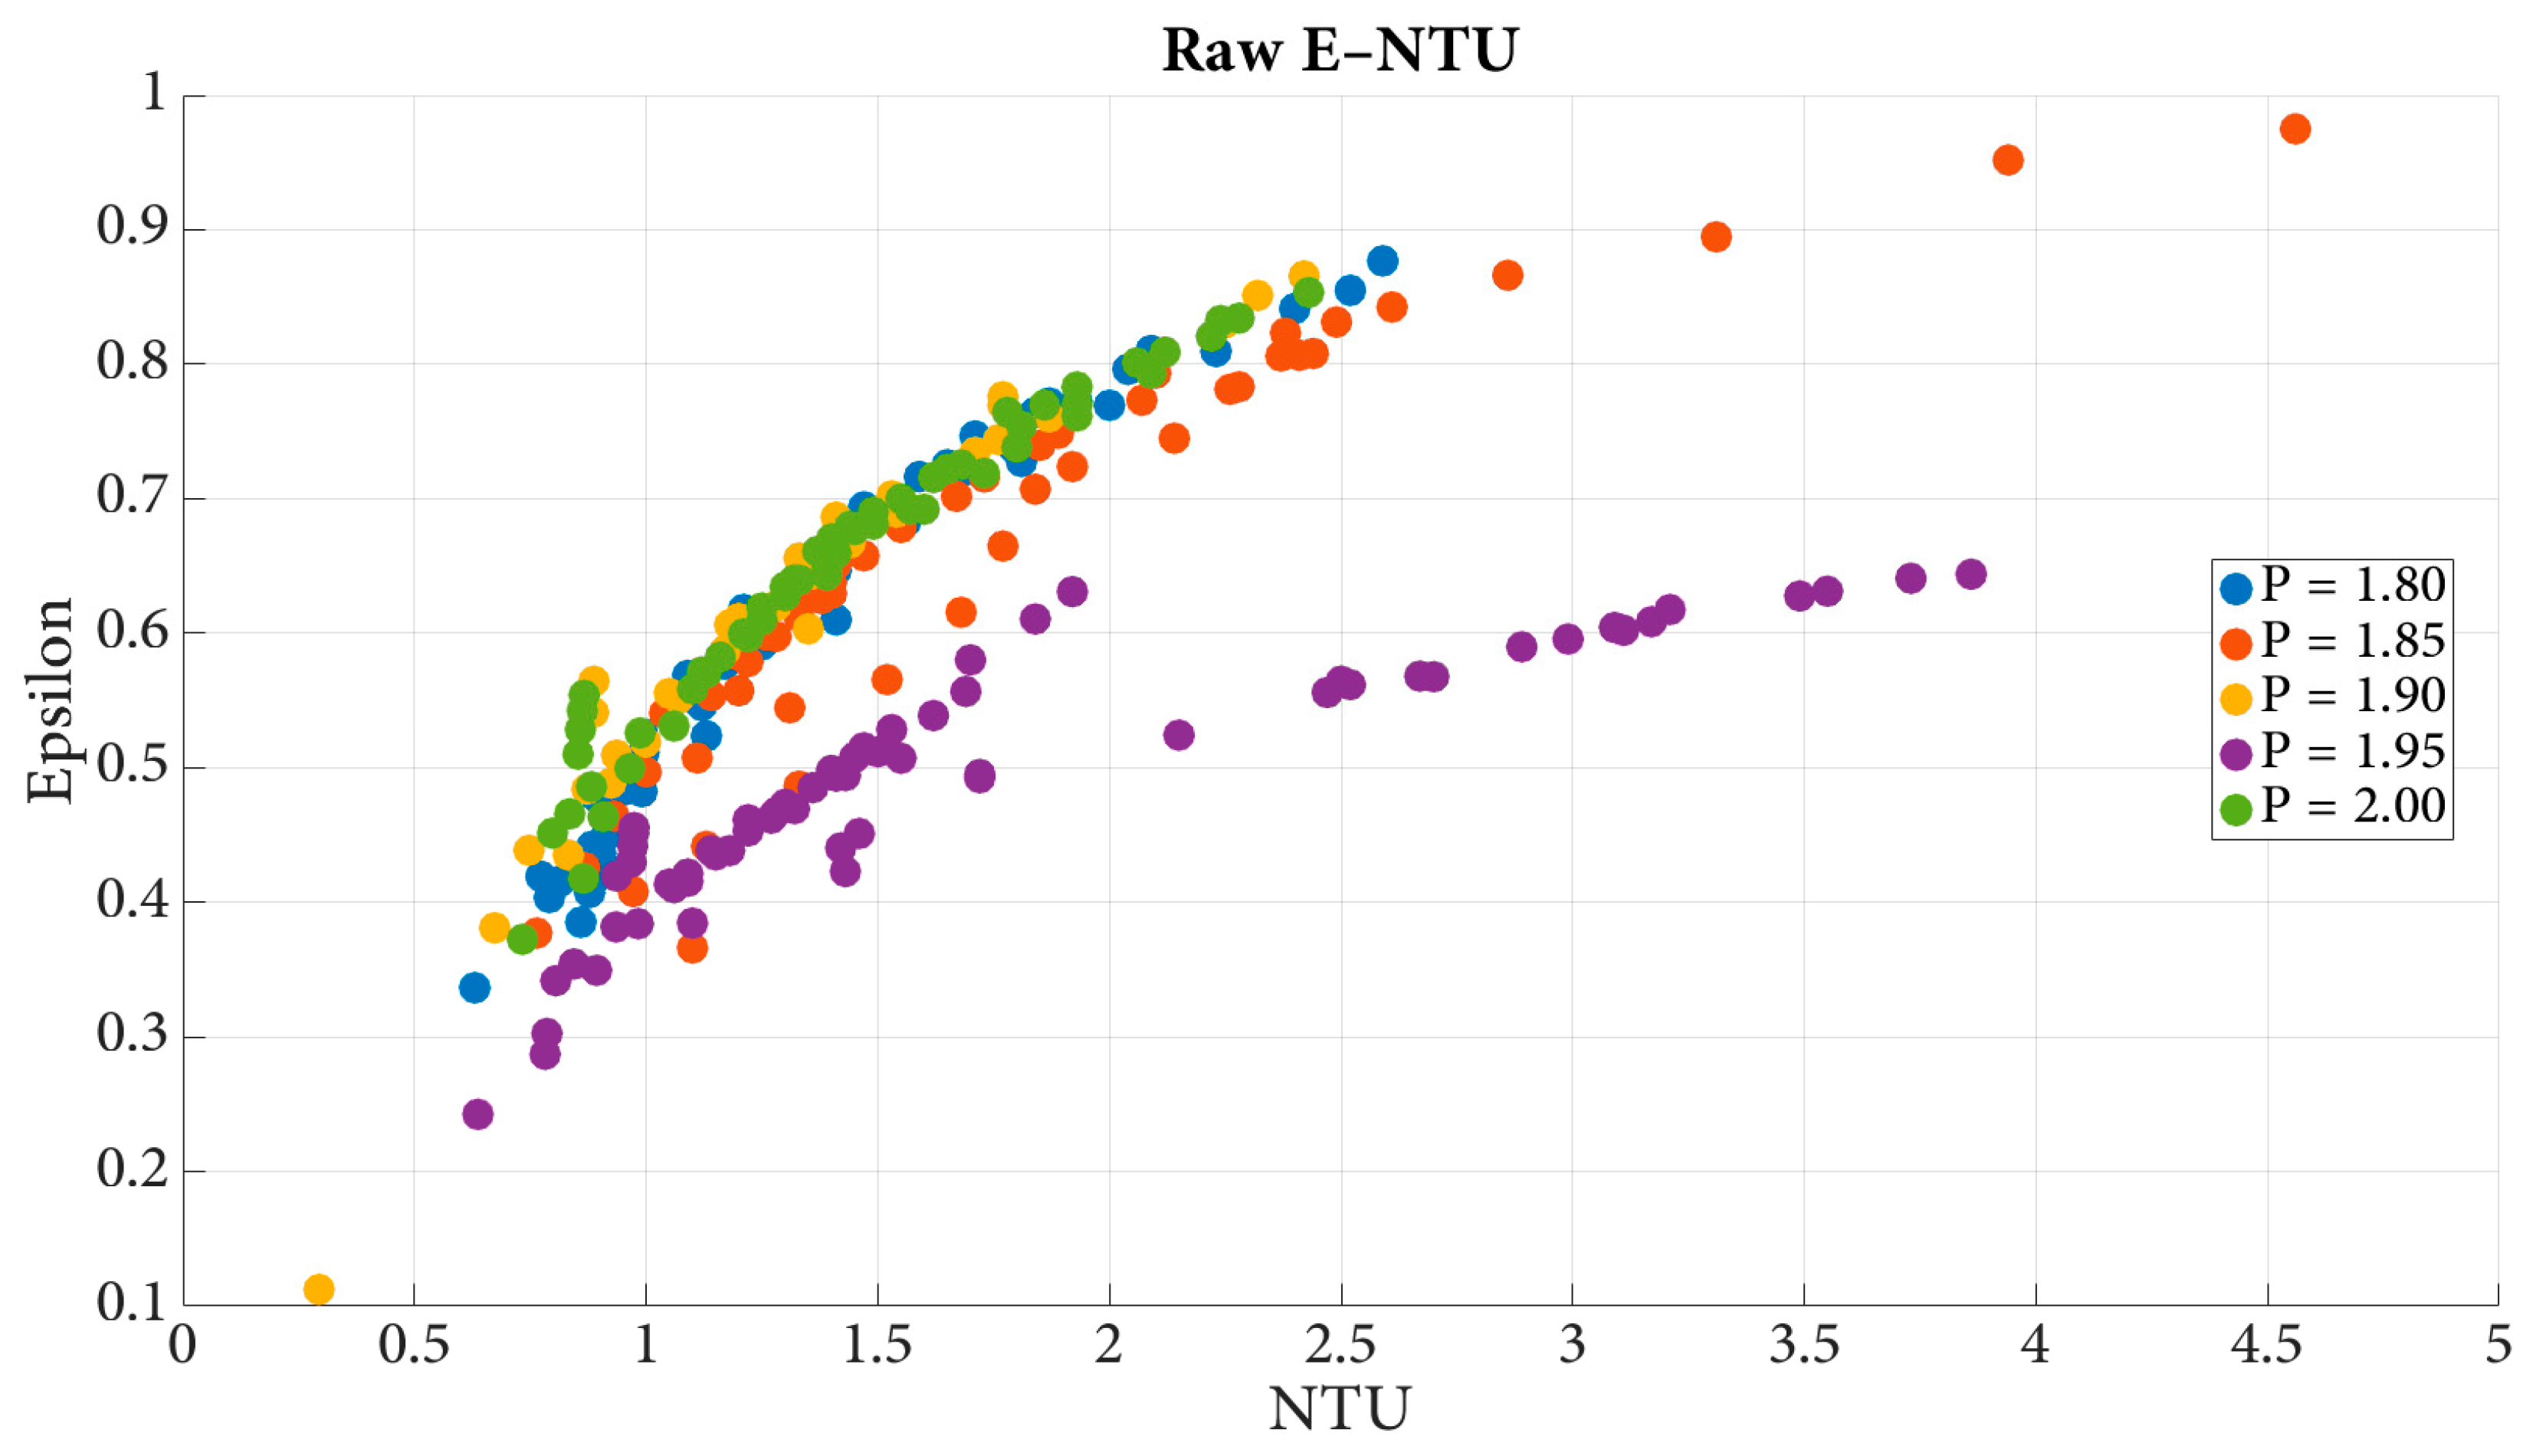
The ε–NTU distribution in
Figure 2 demonstrates the nonlinear dependence of heat exchanger effectiveness on the number of transfer units across all analyzed geometries. At small NTU values, effectiveness increases rapidly, reflecting the strong sensitivity of heat transfer to additional thermal contact area or conductance. As NTU grows, the slope diminishes, indicating that the exchanger approaches its asymptotic thermal limit where further increases in UA produce diminishing performance gains. The five pitch ratios form distinct but parallel bands, showing that geometric variations primarily shift the absolute level of effectiveness while leaving the underlying NTU dependence intact. This consistent rising–plateau structure observed across more than 2,400 simulations supports the use of NTU as the dominant scaling variable for predicting exchanger performance.
Although NTU remains the primary driver of heat exchanger effectiveness,
Figure 2 reveals a clear secondary influence from coil pitch. Larger pitches generally correspond to slightly higher effectiveness at a given NTU, suggesting that geometric spacing affects the overall heat transfer conductance (UA) or internal flow development. Nevertheless, all pitch cases follow a similar ε–NTU trajectory, indicating that the role of pitch is to modulate the magnitude rather than the functional shape of the ε–NTU response. This behavior implies that predictive models must capture both the universal NTU scaling and the modest geometric shifts introduced by pitch variations.
NTU effectively collapses the thermal performance behavior across varied operating conditions, while geometric variations introduce systematic vertical shifts. The smooth, continuous structure of the data confirms its suitability for regression and machine-learning-based modeling, motivating the flexible correlation approaches explored later in this work.
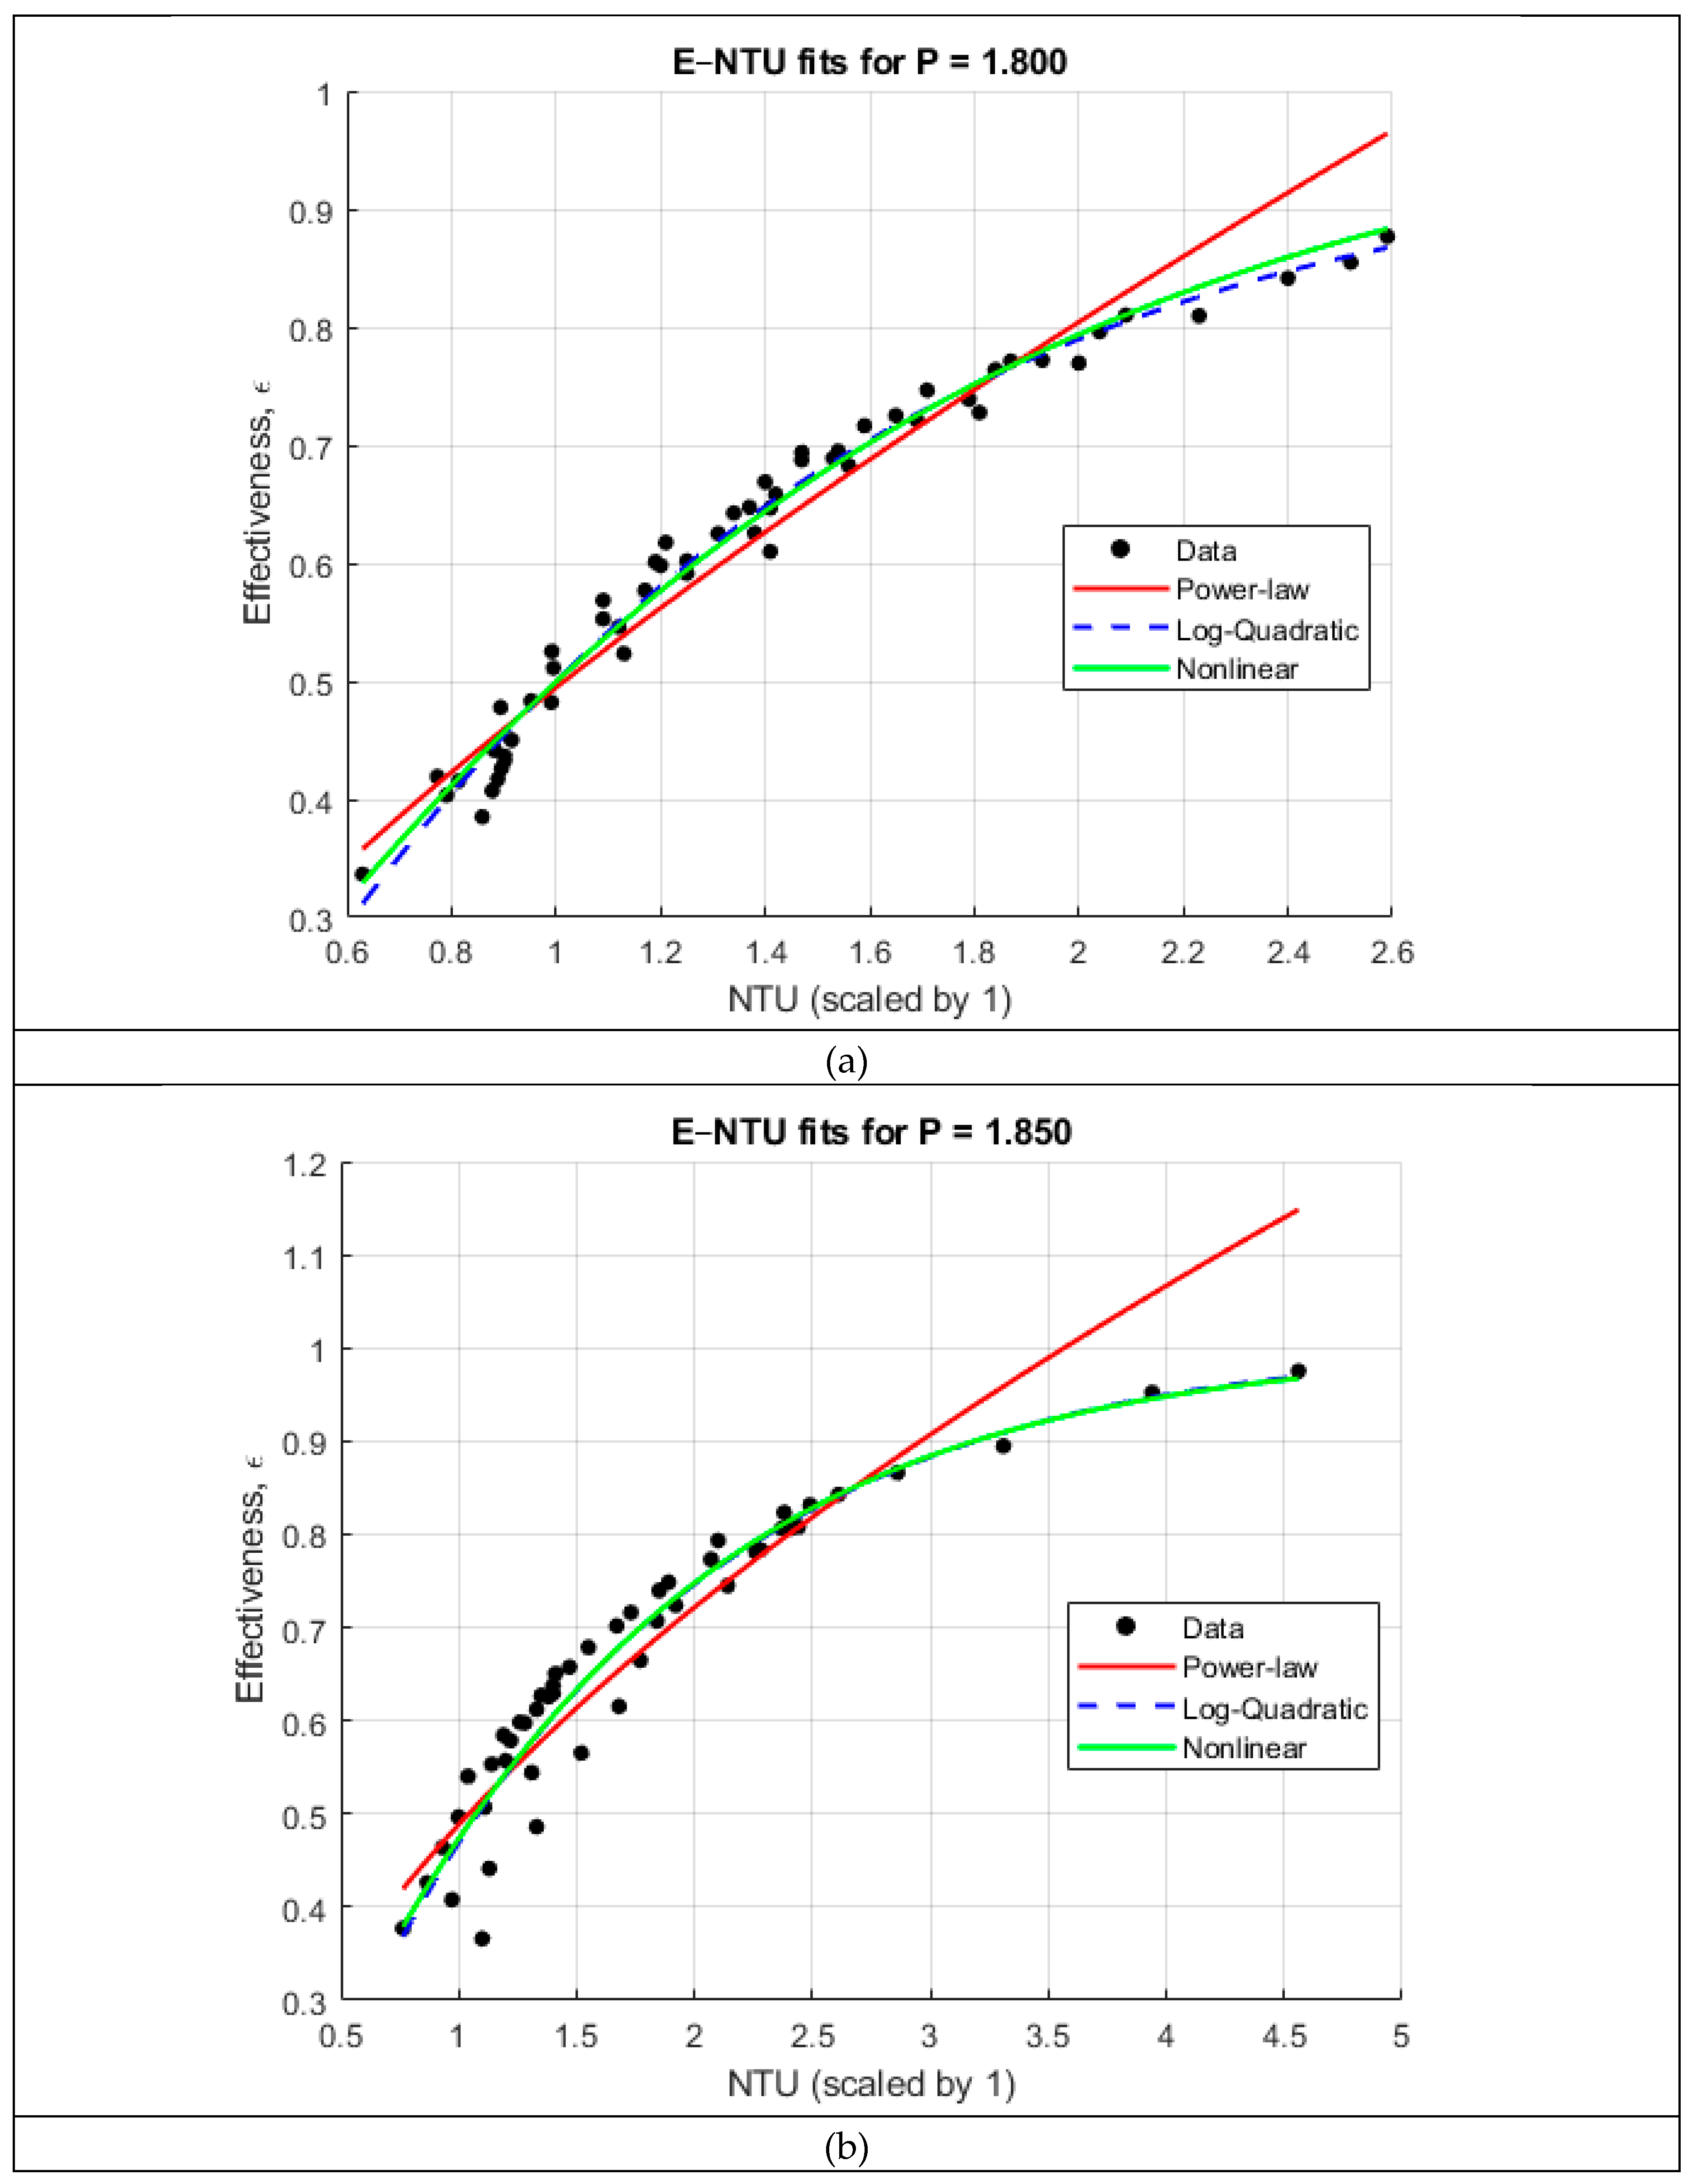
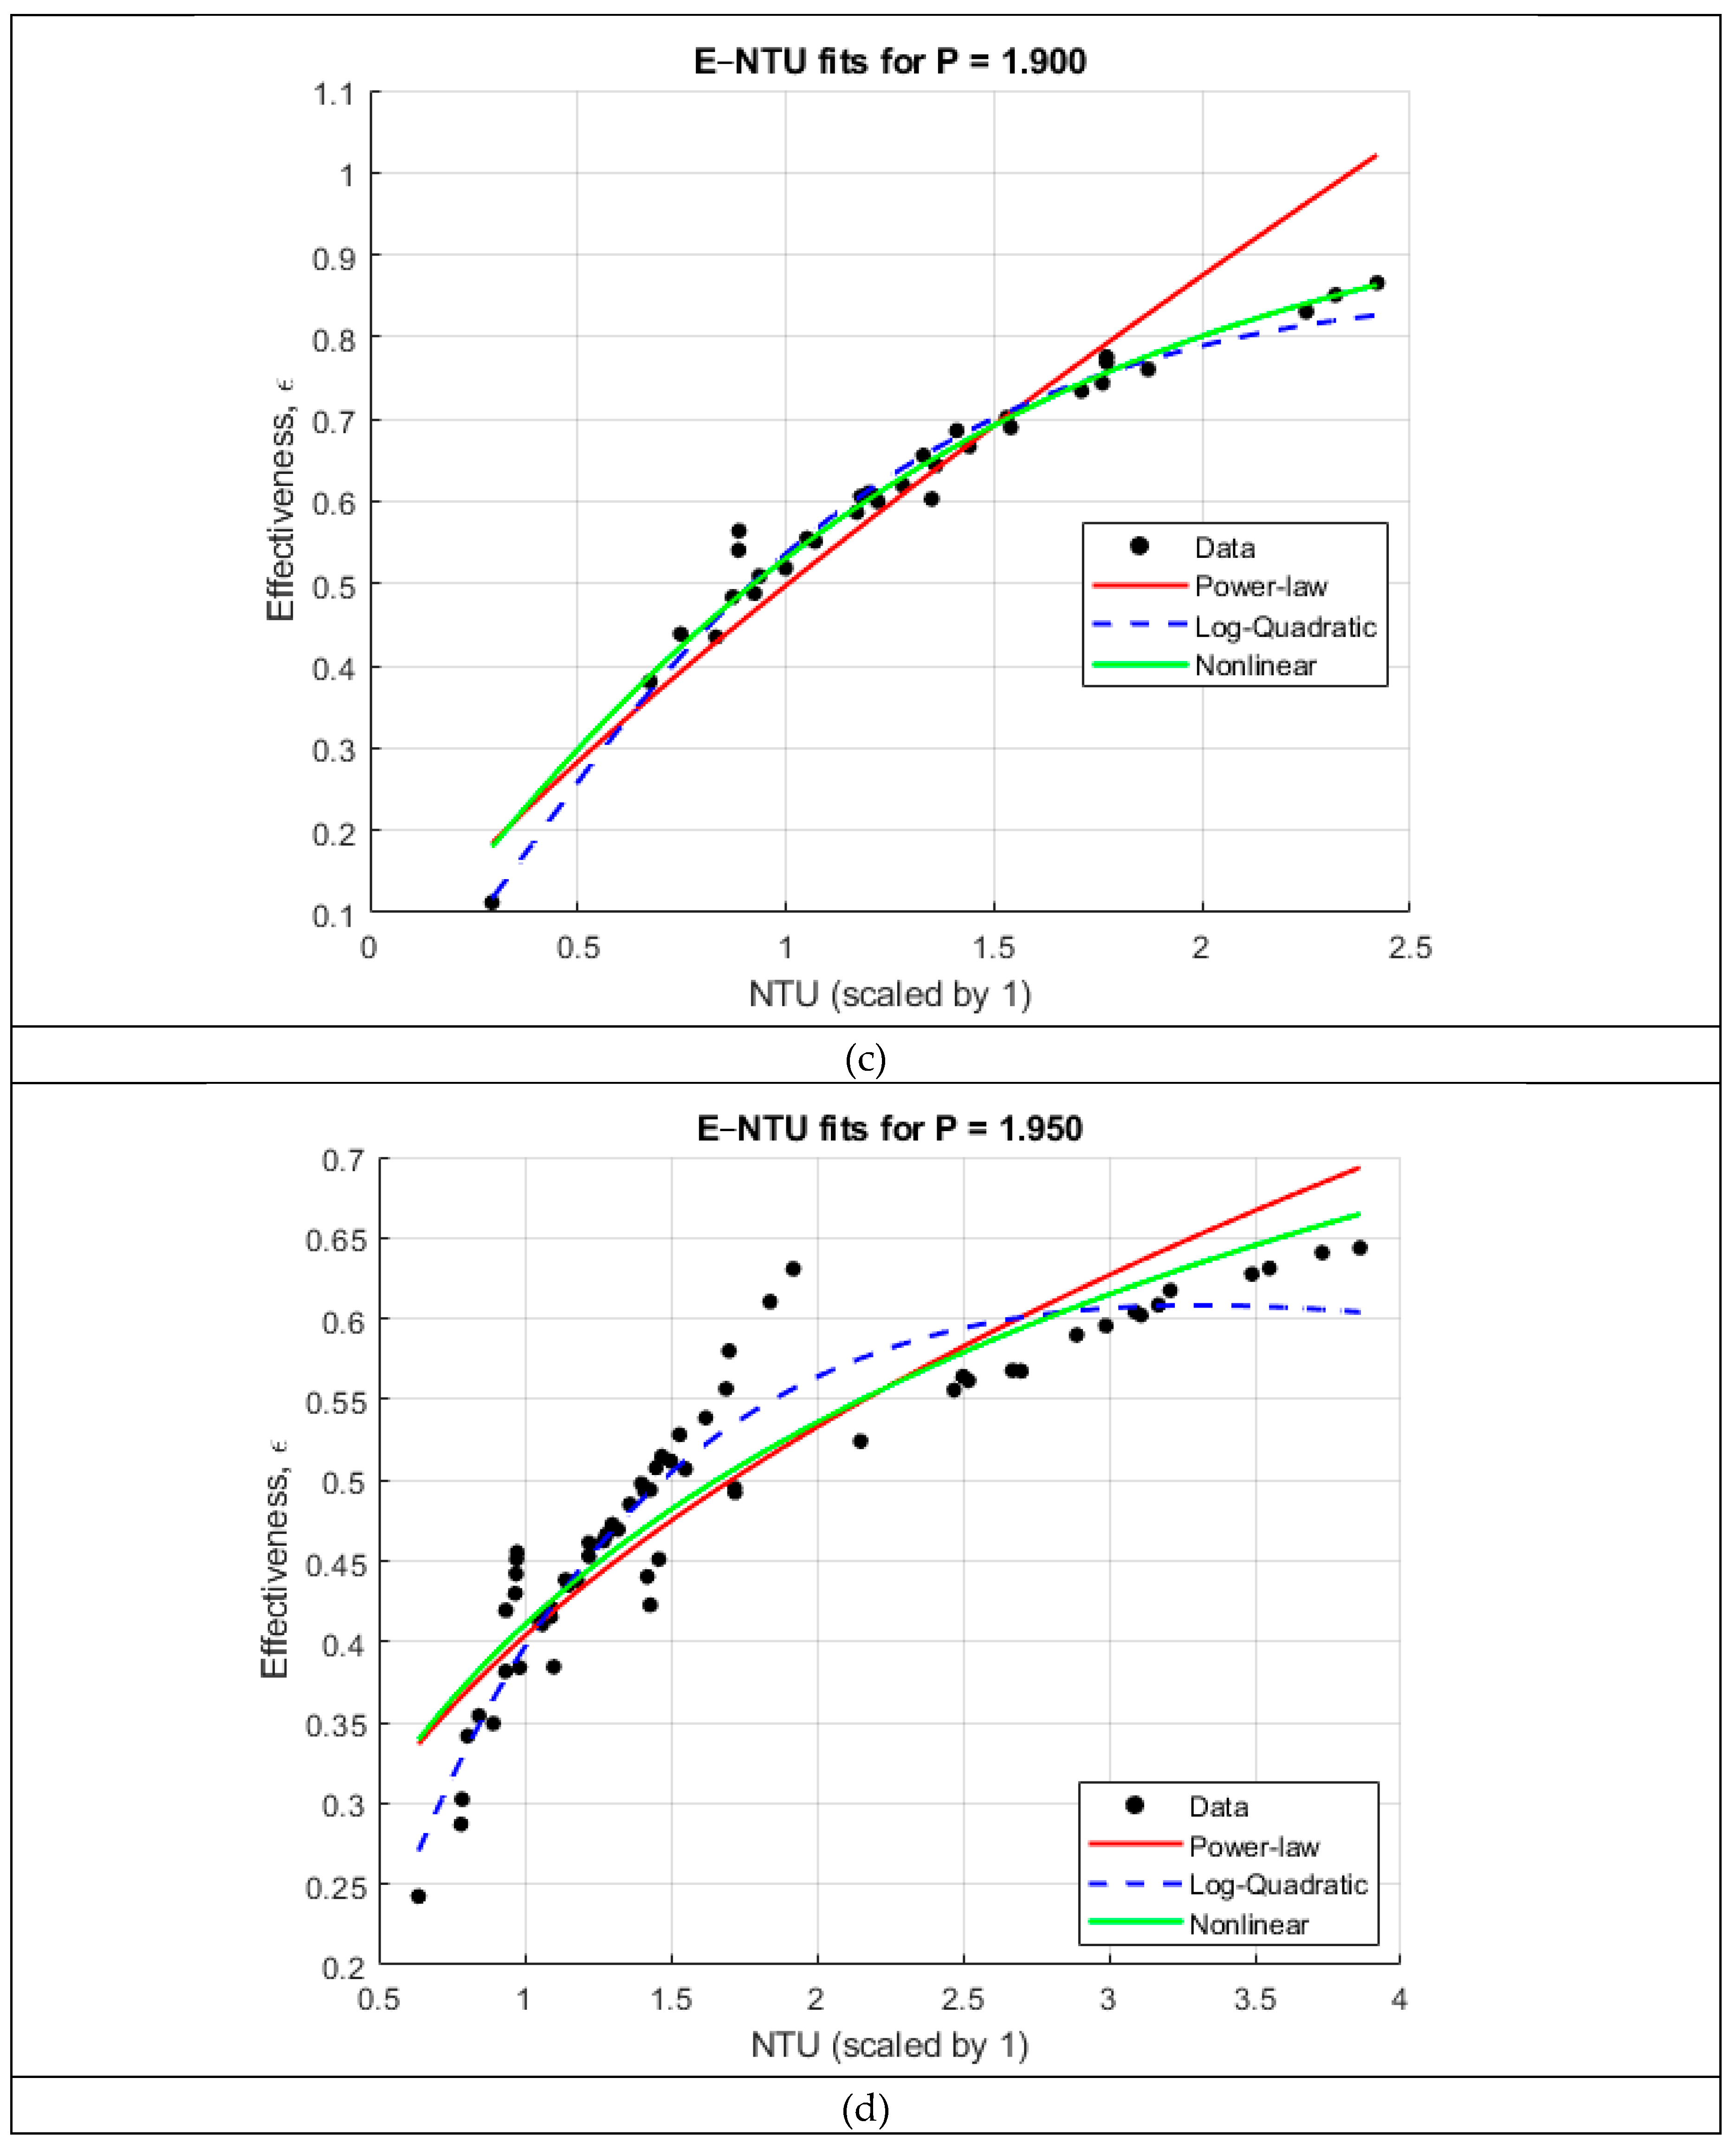
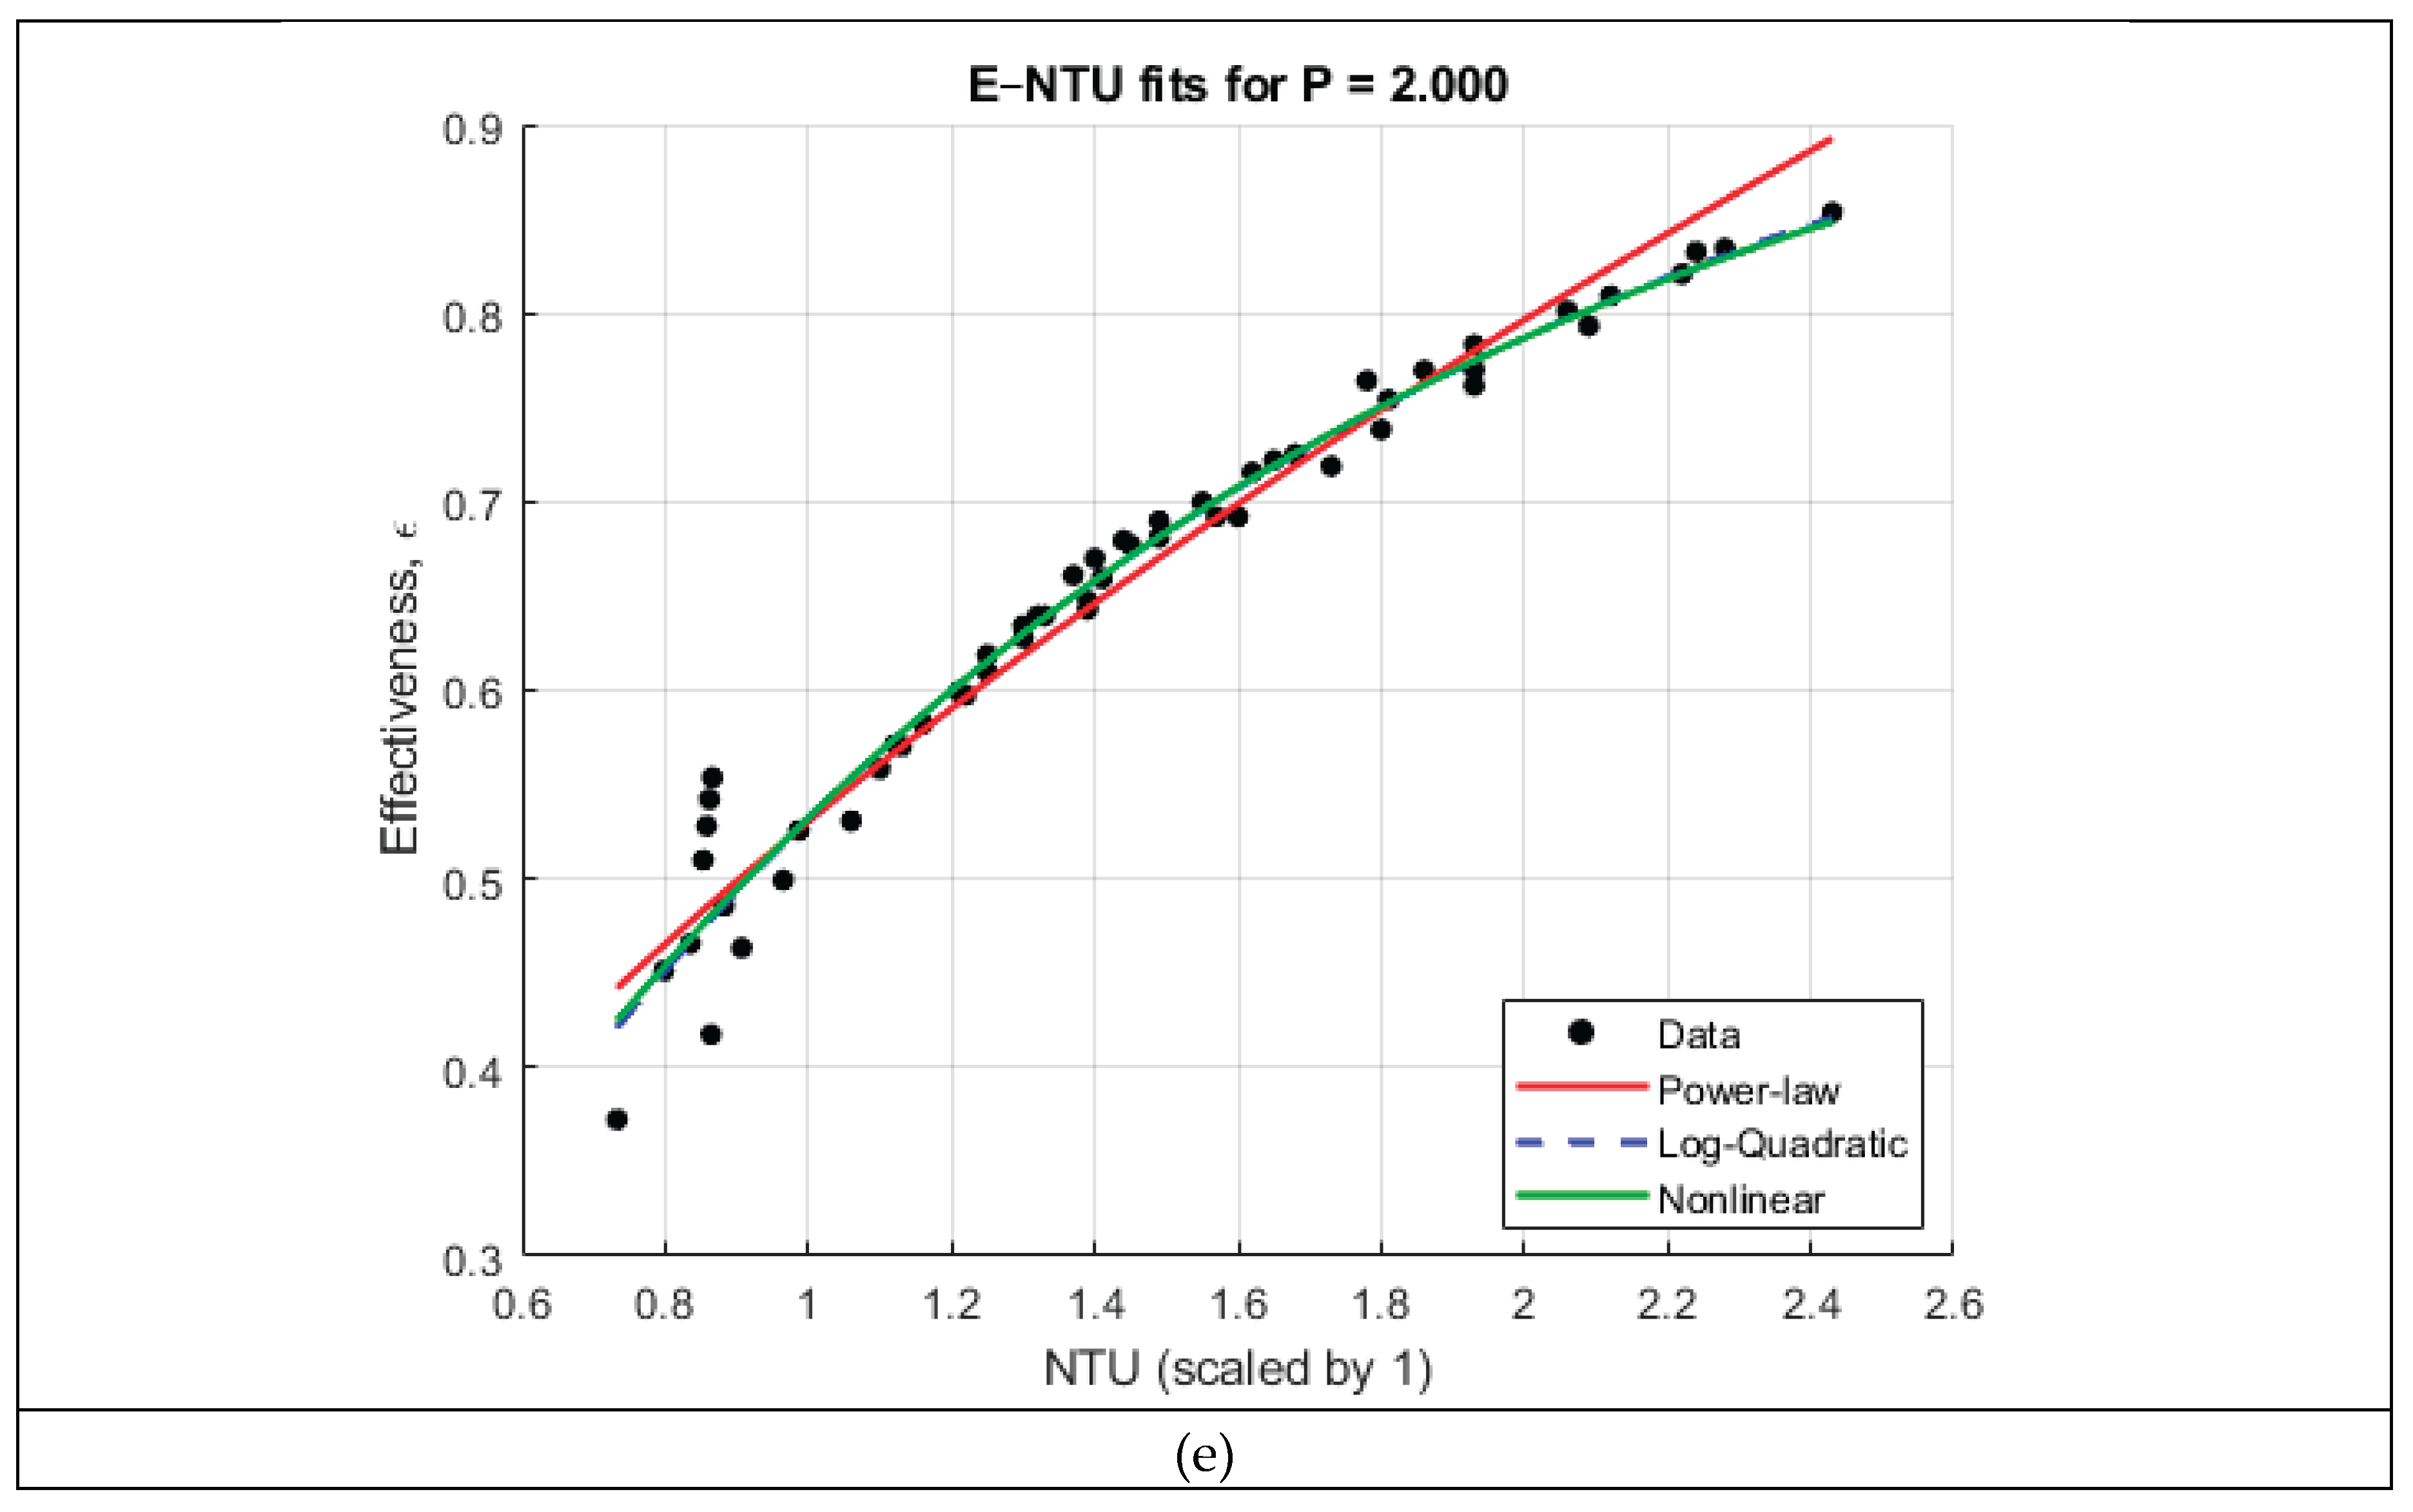
The pitch-specific and global correlation analyses-
Figure 3 and
Figure 4, respectively, reveal several important trends regarding the dependence of heat exchanger effectiveness on the number of transfer units (NTU) and the coil pitch ratio
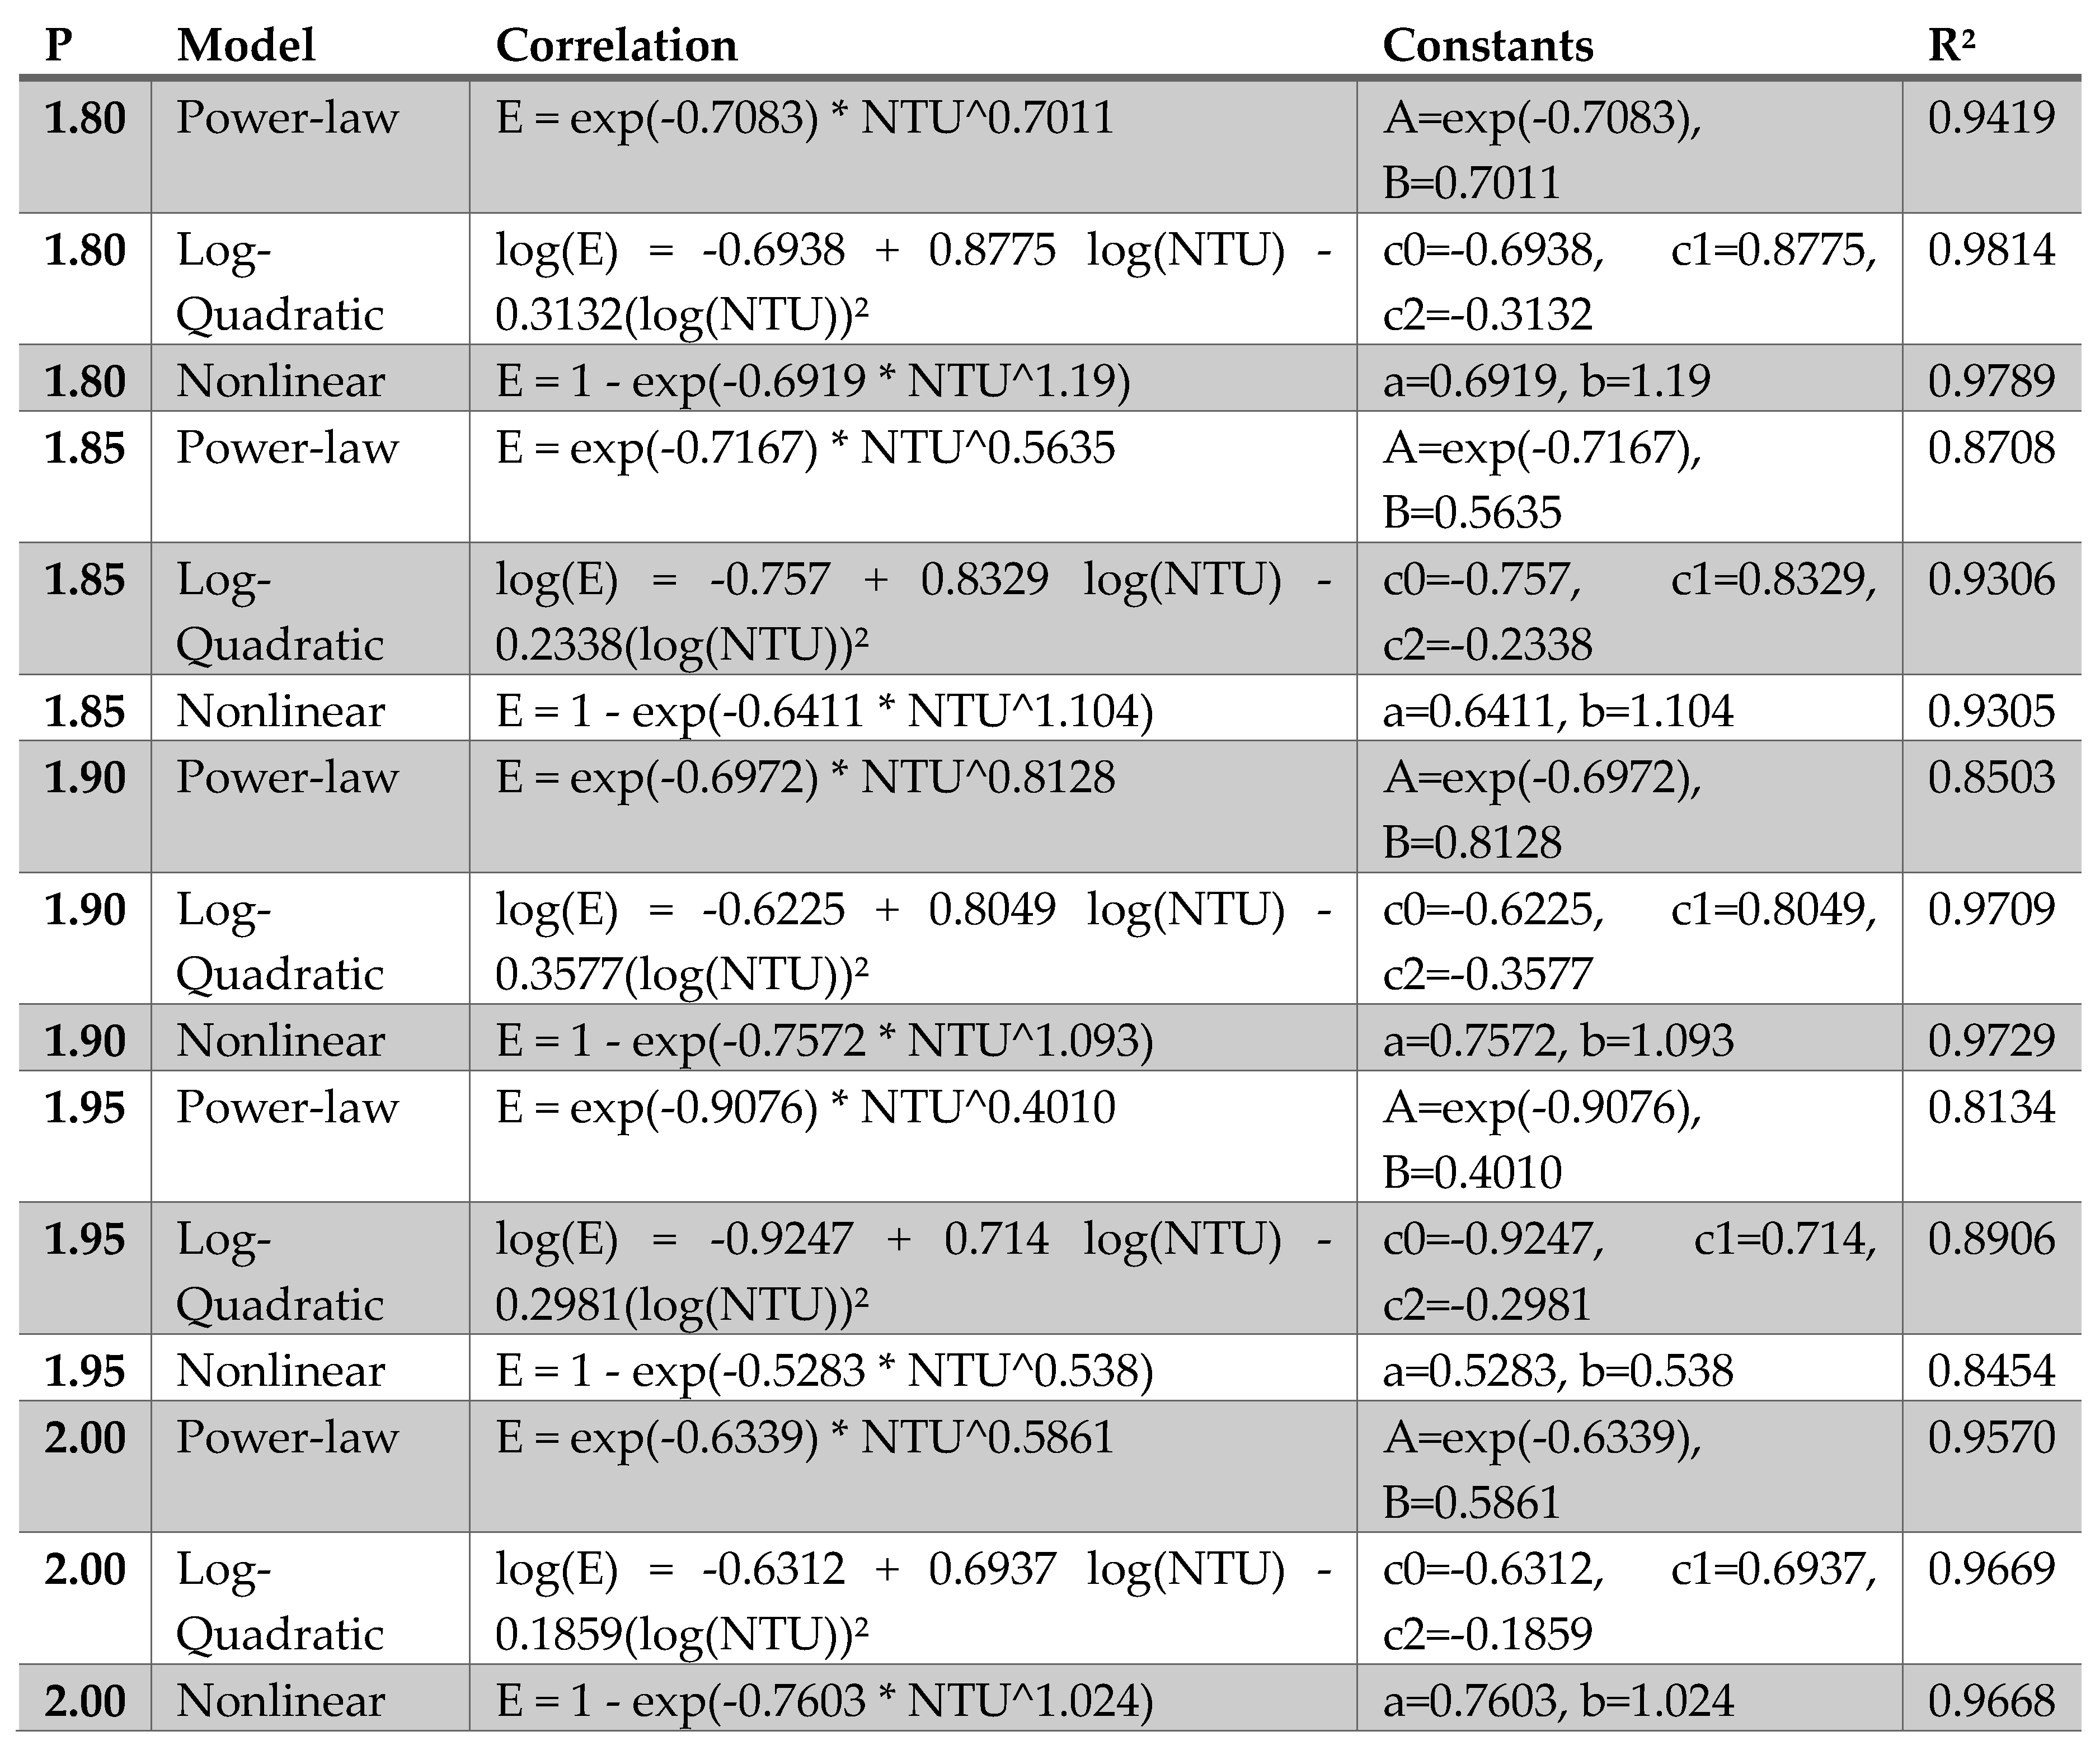
. When the ε–NTU relationship is examined separately for each pitch, all five datasets exhibit the characteristic nonlinear rise–plateau behavior predicted by classical heat exchanger theory. This motivates the use of flexible nonlinear functional forms to correlate effectiveness. Three candidate models were tested for each pitch: a power-law relation expressed in log–log space, a log-quadratic model, and an exponential ε–NTU form of the type
. As summarized in
Table 2, the log-quadratic and nonlinear exponential models consistently provided the highest coefficient of determination, yielding
values between 0.90 and 0.98 across all pitches. In contrast, the simple power-law form underpredicted the curvature of the ε–NTU trend for most cases and exhibited lower fidelity (
between ~0.81 and 0.95). These results confirm that effectiveness grows rapidly with NTU at low values but transitions smoothly into a diminishing-returns regime—behavior that is naturally captured by exponential and logarithmic formulations.
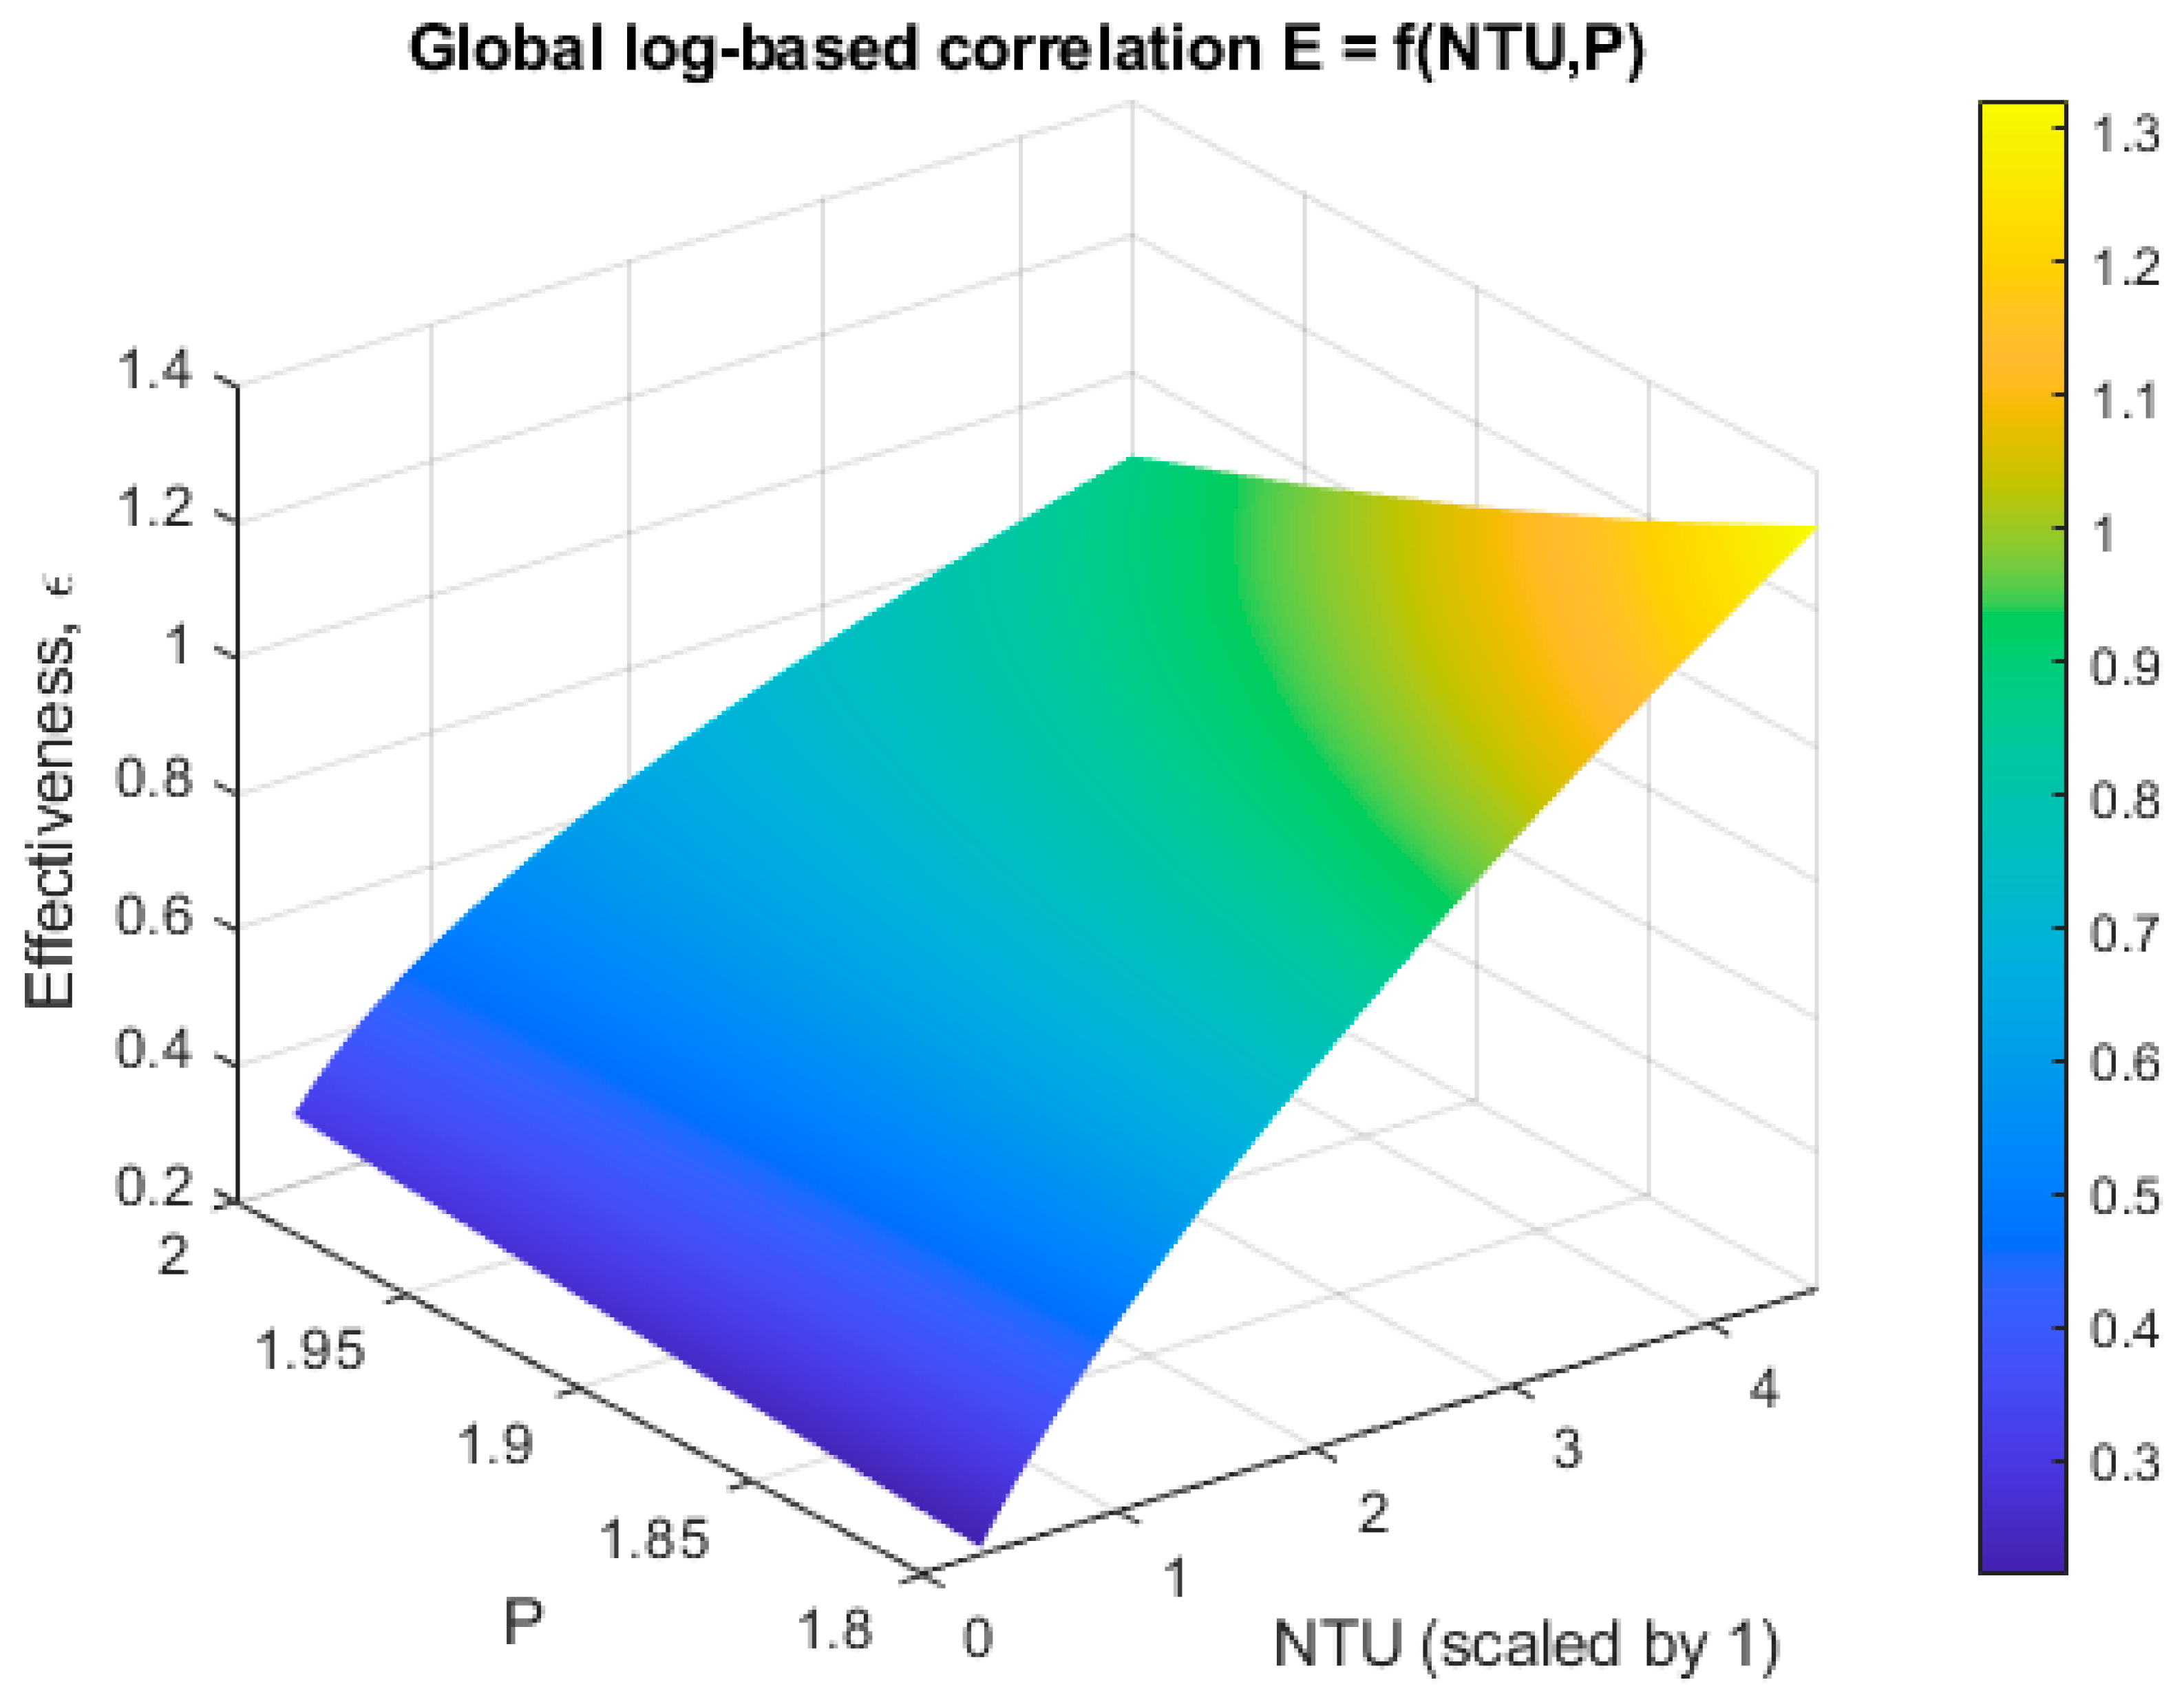
A global correlation incorporating both NTU and pitch, parameterized in the form
, was also developed
Figure 4 &
Table 3), as follows:
Table 3.
Global ε–NTU–P correlation coefficients for the log-based regression model.
Table 3.
Global ε–NTU–P correlation coefficients for the log-based regression model.
| Term |
Estimate (β) |
Std. Error |
t-Statistic |
p-Value |
| Intercept (β_0) |
−0.77347 |
0.35255 |
−2.1939 |
0.029154 |
| log(NTU) (β_1) |
3.1351 |
0.74153 |
4.2278 |
3.30×10⁻⁵ |
| P (β_2) |
0.024367 |
0.1853 |
0.1315 |
0.89549 |
| log(NTU)·P (β_3) |
−1.3723 |
0.38933 |
−3.5248 |
0.00050325 |
| Model Summary |
| Metric |
Value |
| Root Mean Squared Error (RMSE) |
0.162 |
| R² (log-space) |
0.633 |
| Adjusted R² |
0.629 |
| R² (converted to ε-space) |
0.5883 |
| F-statistic p-value |
1.33×10⁻⁵⁴ |
While the linear log-based model successfully reproduced the general monotonic dependence of ε on NTU and the upward shift associated with increasing pitch, its overall predictive capability ( in ε-space) is significantly weaker than that of the pitch-specific nonlinear fits. The relatively modest performance of the global linear model suggests that the ε–NTU–P relationship is inherently nonlinear in both variables and cannot be fully captured by a first-order log–linear regression.
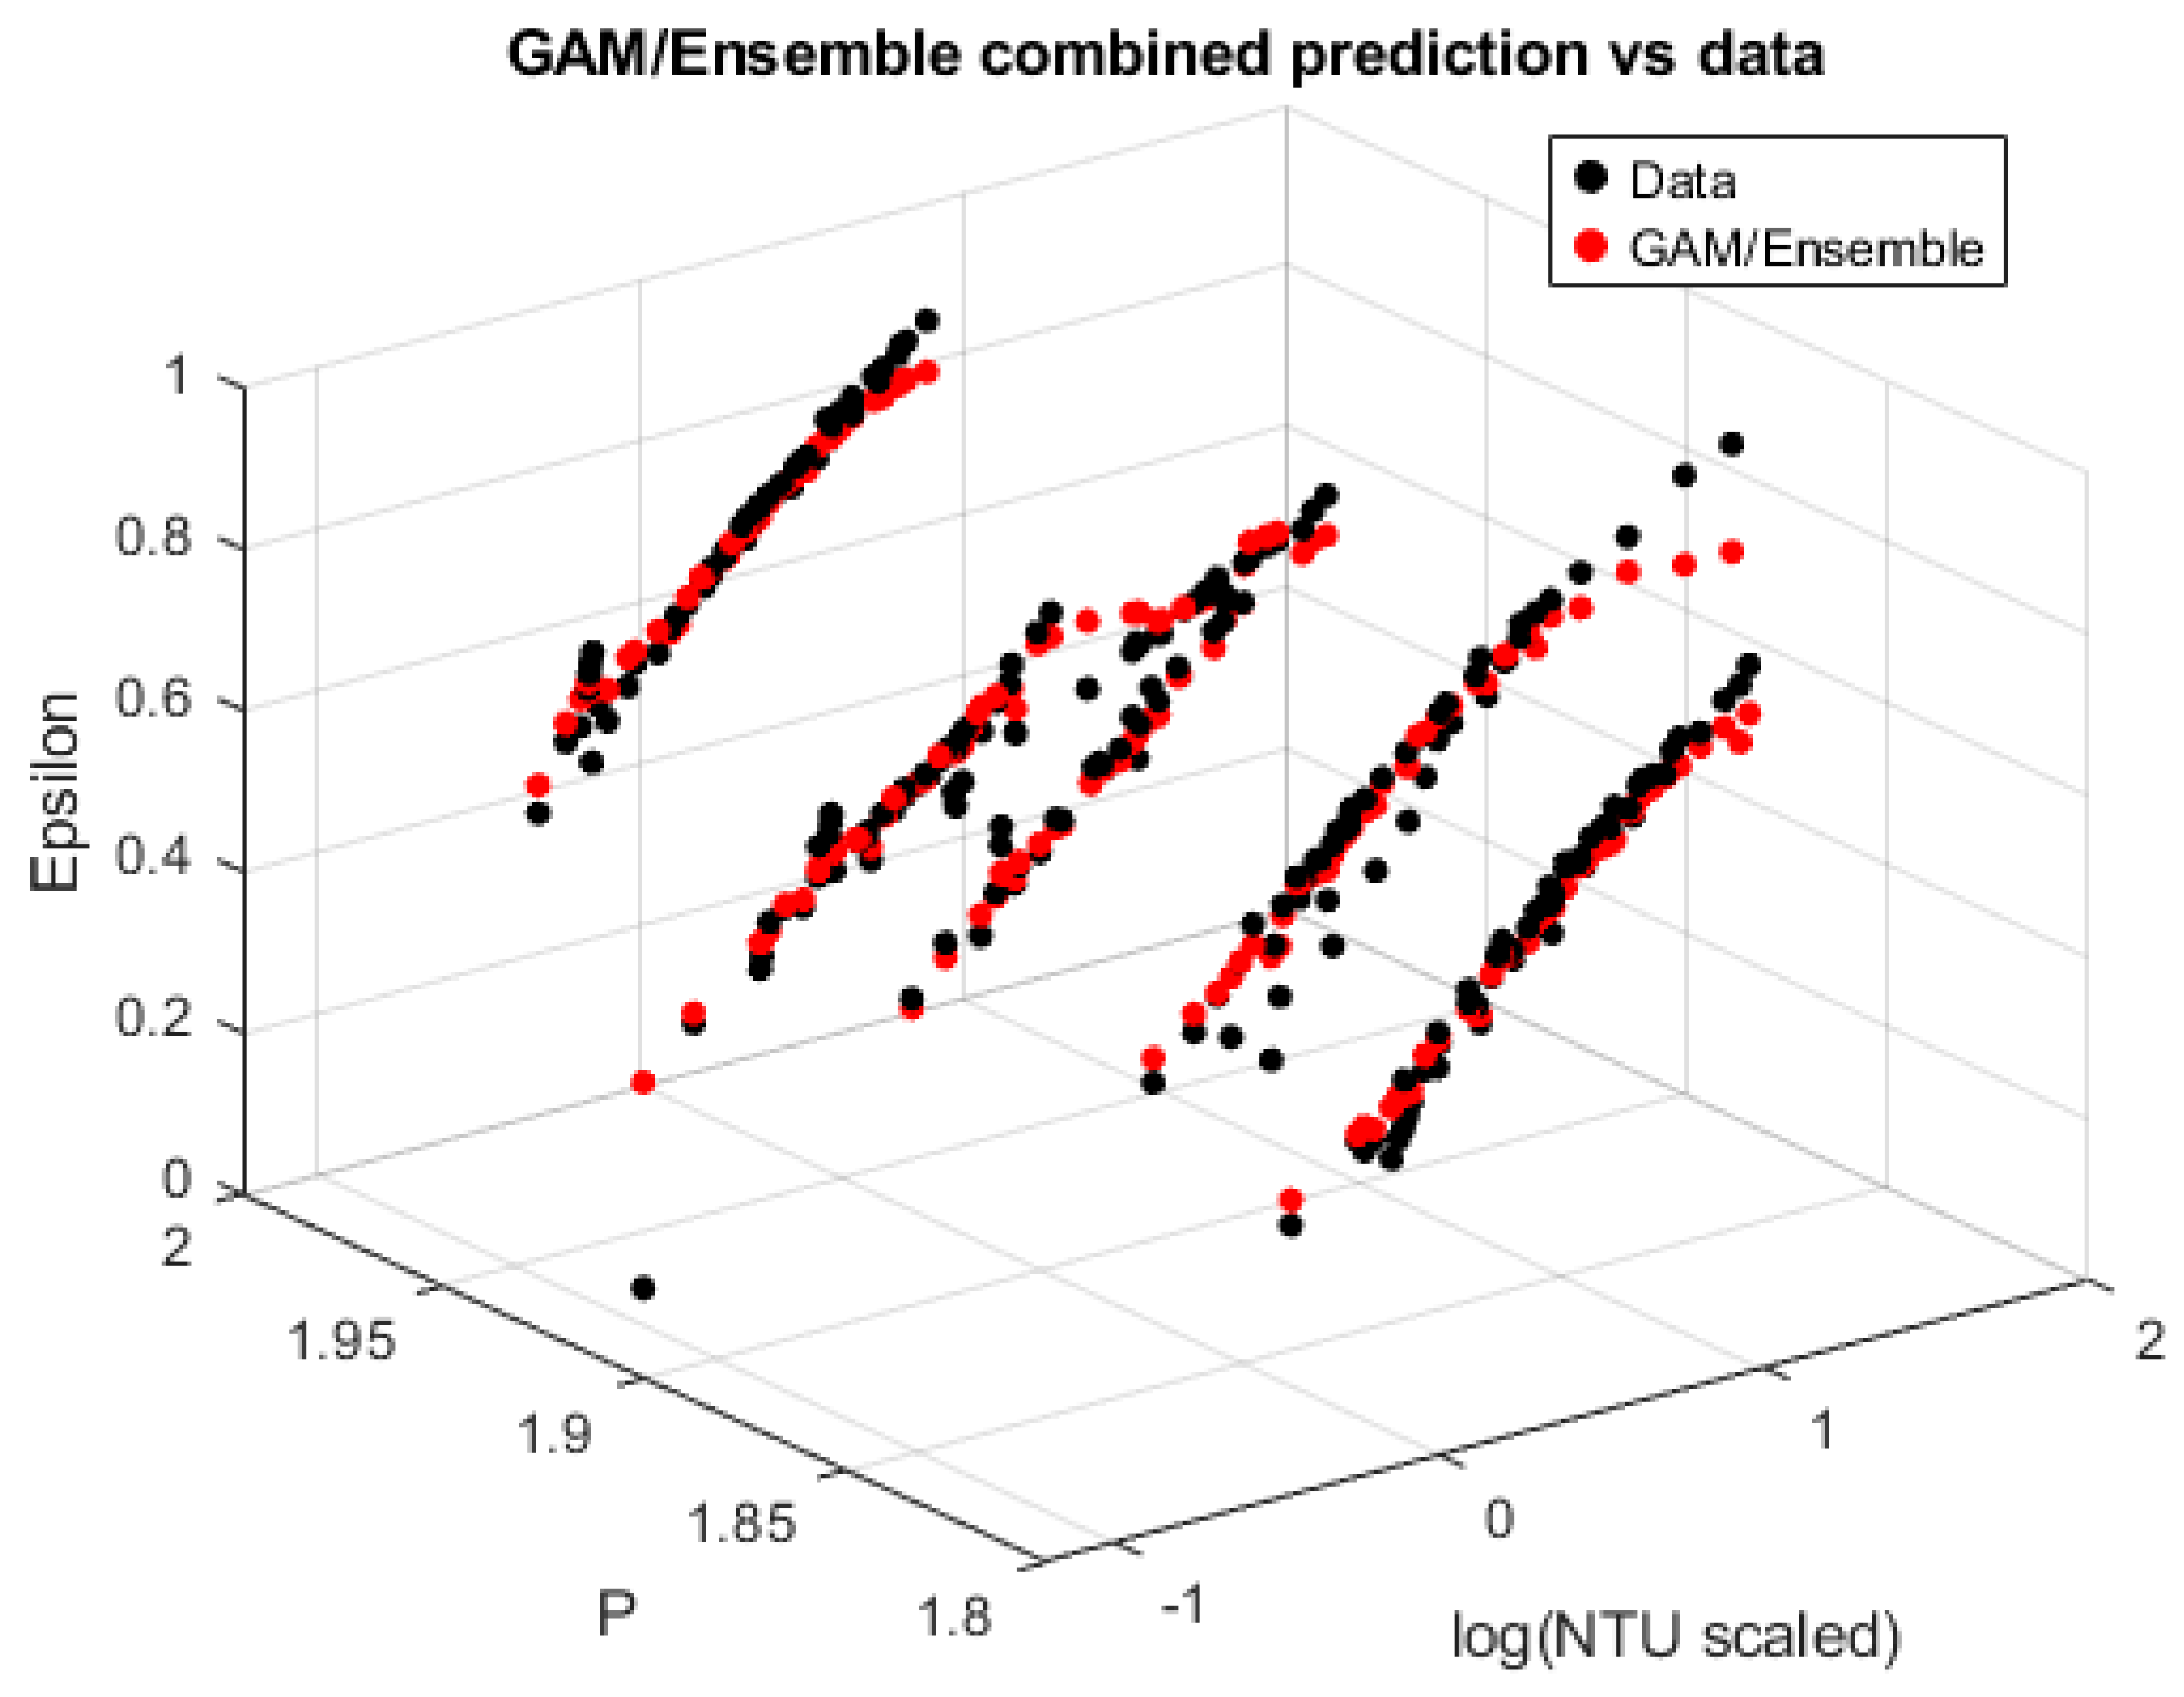
To address this limitation, machine-learning-based regressors—Generalized Additive Models (GAM) and bagged decision-tree ensembles—were applied using
as predictors. These models provided substantially improved accuracy, achieving
values of 0.91 (Ensemble) to 0.94 (GAM), with a combined GAM–Ensemble predictor producing the highest fidelity (
), as demonstrated in
Figure 5 with the analytical formulations in
Table 4. The machine-learning models effectively reproduced the nonlinear ε–NTU curvature and the subtle pitch-dependent variations without imposing a restrictive analytical structure. Their predictive smoothness and low residual errors confirm that the underlying functional relationship is moderately complex and exhibits mild interaction between NTU and pitch—features that the GAM and Ensemble frameworks are well suited to represent.
Taken together, these results indicate that (i) pitch-specific exponential/logarithmic correlations provide the most accurate closed-form predictive models, (ii) the ε–NTU–P surface is globally nonlinear and not easily captured by simple algebraic expressions, and (iii) modern regression techniques (GAM/Ensemble) offer high predictive accuracy for surrogate modeling or reduced-order simulations. The correlation coefficients, best-fit parameters, and performance metrics shown in Table X provide a compact summary of the model forms and their relative merits for engineering use.
References
- Mirgolbabaei, H. Numerical investigation of the irregular behavior of helically coiled tube heat exchanger concerning pitch changes. Therm. Sci. 2022, 26, 4685–4697. [Google Scholar] [CrossRef]
- Mirgolbabaei, H. Numerical investigation of vertical helically coiled tube heat exchangers thermal performance. Appl. Therm. Eng. 2018, 136, 252–259. [Google Scholar] [CrossRef]
- Mirgolbabaei, H.; Taherian, H.; Domairry, G.; Ghorbani, N. Numerical estimation of mixed convection heat transfer in vertical helically coiled tube heat exchangers. Int. J. Numer. Methods Fluids 2011, 66, 805–819. [Google Scholar] [CrossRef]
- Ghorbani, N.; Taherian, H.; Gorji, M.; Mirgolbabaei, H. Experimental study of mixed convection heat transfer in vertical helically coiled tube heat exchangers. Exp. Therm. Fluid Sci. 2010, 34, 900–905. [Google Scholar] [CrossRef]
- Ghorbani, N.; Taherian, H.; Gorji, M.; Mirgolbabaei, H. An experimental study of thermal performance of shell-and-coil heat exchangers. Int. Commun. Heat Mass Transf. 2010, 37, 775–781. [Google Scholar] [CrossRef]
- H. Mirgolbabaei, J. H. Mirgolbabaei, J. Gruenes, I. Walaman, M. S. H. Nahid, M. Smith, J. Swaja, R. Eischens, C. Phifer, D. Cornelisen and J. Suliin, "Numerical Exploration of Helically Coiled Tube Heat Exchangers’ Shell-Side Nature Through Morpho-hydrodynamic Variations & A Global Correlation," ChemEngineering, 13 November.
- Mirgolbabaei, H. NUMERICAL OPTIMIZATION OF HELICALLY COILED TUBE HEAT EXCHANGERS USING ARTIFICIAL NEURAL NETWORKS: PREDICTING OPTIMAL PITCH FOR ENHANCED HEAT TRANSFER EFFICIENCY. 10th Thermal and Fluids Engineering Conference (TFEC). LOCATION OF CONFERENCE, United StatesDATE OF CONFERENCE; pp. 1051–1054.
- N. Attarian and H. Mirgolbabaei, "Geometric Anomalies and Nanofluid Influence in Helically Coiled Tube Compact Heat Exchangers: Unraveling the Irregularities," in ASME 2024 Heat Transfer Summer Conference (SHTC2024), Bellevue, WA, 2024.
- E. F. Schmidt, "Wärmeübergang und Druckverlust in Rohrschlangen," Chemie Ingenieur Technik, vol. 39, no. 13, p. 781–789, 10 JUly 1967.
- E. F. Schmidt, "Wärmeübergang und Druckverlust in Rohrschlangen," Chemie Ingenieur Technik, vol. 39, no. 13, pp. 781-789, 1967.
- Ali, S. Pressure drop correlations for flow through regular helical coil tubes. Fluid Dyn. Res. 2001, 28, 295–310. [Google Scholar] [CrossRef]
|
Disclaimer/Publisher’s Note: The statements, opinions and data contained in all publications are solely those of the individual author(s) and contributor(s) and not of MDPI and/or the editor(s). MDPI and/or the editor(s) disclaim responsibility for any injury to people or property resulting from any ideas, methods, instructions or products referred to in the content. |
© 2025 by the author. Licensee MDPI, Basel, Switzerland. This article is an open access article distributed under the terms and conditions of the Creative Commons Attribution (CC BY) license (https://creativecommons.org/licenses/by/4.0/).