Submitted:
19 November 2025
Posted:
01 December 2025
You are already at the latest version
Abstract
Microglia are a key brain cell population pivotal for homeostasis, and in brain aging and neurodegeneration they exhibit both adaptive phagocytic and maladaptive proinflammatory responses. To understand this dynamics, I independently analyzed five human datasets, totaling 83,190 microglial nuclei and covering Alzheimer’s disease, Parkinson’s disease, amyotrophic lateral sclerosis, frontotemporal lobar degeneration, and aging, as well as one Macaca fascicularis hippocampal aging dataset with 39,589 nuclei. Homeostatic microglia subpopulations in humans exhibited marked heterogeneity in GRID2 and CCDC26 expression. The expansion of GPNMB/IQGAP2-expressing clusters of phagocytic microglia was found to be the most conservative and reproducible response of microglia across pan-neurodegenerative conditions and aging, and the gene PTPRG from this signature was reproducibly evelated in pseudobulk; notably, the entire GPNMB⁺ signature is highly restricted to perivascular macrophages in macaques. Microglia subpopulations expressing ribosomal genes at high levels, along with FTL/H1, C1QA/B/C, TPT1, PLEKHA7, etc., although sometimes considered pathogenic, tended to be youth/health-enriched, and their coexpression modules were strongly increased in young and healthy samples. I also observed ST18⁺ and NRG3⁺ subpopulations, which reproduced across all human datasets and in monkeys, although their nature is not yet completely understood: some marker genes arise from myelin phagocytosis (e.g., ST18), while others may reflect intrinsic microglial expression (e.g., PCDH9). Gene coexpression network analysis revealed SORL1, MAML3, ELMO1, MEF2A/C, ADAM28, ABCC4, and several other genes as key putative regulators of evolutionarily conserved homeostatic modules, while identifying TANC2, NHSL1, FMN1, ETV6, and particularly DPYD as potential central players in activation-related networks. Transcriptional factor analysis revealed FOXP1 as a positive regulator of activation-related genes (e.g., DPYD and LRRK2), highlighted the role of TCF4/12 in activation (via TMEM163 and LRRK2), showed MITF and POU3F1 as regulators of numerous genes within the GPNMB-IQGAP2 signature, and identified FOXP2, FOXN3, FLI1, and KLF12 as key homeostatic regulators, alongside the well-studied MEF2A/C. Although many of these results are highly preliminary, this may shed light on microglial physiology in health and disease.
Keywords:
microglia
; neurodegeneration
; aging
; neuroinflammation
; primate evolution
; singlenuclei RNA-sequencing
; cluster analysis
; gene coexpression network analysis (hdWGCNA)
; transcriptional factor analysis
Introduction
Brain aging, and particularly neurodegenerative diseases, is associated with a progressive increase in chronic neuroinflammation, which exacerbates functional decline and further accelerates aging processes. Moreover, brain aging itself is a key risk factor for some of the most devastating neurodegenerative conditions, including Alzheimer’s disease (AD), Parkinson’s disease (PD), amyotrophic lateral sclerosis (ALS), and frontotemporal lobar degeneration (FTLD), and shares many common mechanisms with all of them [1,2].
Microglia, the brain’s resident macrophages, are central mediators of this inflammatory response and can adopt maladaptive, senescence-like states that contribute to neuronal dysfunction. At the same time, microglia play essential neuroprotective roles, including the phagocytic clearance of pathological protein aggregates such as amyloid-β (Aβ) plaques. This dual nature underscores the importance of understanding how microglial states, functions, and regulatory programs are reshaped across aging and diverse neurodegenerative contexts – knowledge that is critical for the rational design of therapies targeting brain aging and neurodegeneration [3].
One of the first frameworks to capture microglial activation in neurodegeneration was the concept of Disease-Associated Microglia (DAM), introduced in 2018. This model describes a two-stage activation program triggered by pathological cues such as Aβ plaques. In the initial stage, microglia downregulate core homeostatic markers, including CX3CR1, P2RY12, and TMEM119, while upregulating early-response genes like TYROBP, APOE, B2M, and TREM2, although the initiating signals remain poorly defined. Transition to the second stage is critically dependent on TREM2 signaling, driving microglia toward a fully activated state characterized by robust expression of phagocytic and lysosomal genes (LPL, SPP1, CST7, CD9, CCL6, AXL, ITGAX, CSF1) and complete loss of homeostatic identity. The centrality of TREM2 in this pathway is underscored by human genetics: loss-of-function variants in TREM2 markedly increase the risk of Alzheimer’s disease, highlighting its non-redundant role in protective microglial responses [4].
Notably, however, this canonical DAM signature appears largely mouse-specific. In human Alzheimer’s disease, microglia adopt a distinct TREM2-dependent reactive state, marked not by loss of homeostatic identity but by retained or even elevated expression of markers like TMEM119, P2RY12, and CX3CR1, alongside an IRF8-driven transcriptional program involving genes such as CHI3L1, A2M, and SORL1 [5].
Moreover, emerging evidence suggests that microglial activation encompasses multiple, potentially coexisting programs beyond the binary homeostatic–DAM framework. For example, a subset of activated microglia expresses glycoprotein non-metastatic melanoma protein B (GPNMB), a transmembrane protein associated with adaptive, neuroprotective, and predominantly anti-inflammatory functions [6,7]. Recent work further reveals that GPNMB plays a direct role in amyloid-β clearance by physically bridging pathogenic aggregates to lysosomes through interaction with the V-ATPase subunit ATP6V1A [8]. Together, these findings indicate that the microglial response in neurodegeneration is not monolithic but rather comprises a spectrum of context-dependent states with divergent functional implications.
To decode this, single-nucleus RNA-seq technologies might be extremely useful.
One of the most comprehensive attempts to comprehend the diversity of microglia was performed by the Kellis and Tsai labs. They described 12 microglial states (referred to as MG0–MG12, except cluster 9, which consisted of brain-associated macrophages) with the following characteristics: MG0 – homeostatic, with marker genes P2RY12, CX3CR1, and TMEM119; decreased in AD; MG1 – neuronal surveillance, with elevated expression of neurotransmitter receptors; significantly decreased in AD; MG2 – inflammatory I, increased in AD, with markers CPEB4, TMEM163, and IL4R; MG3 – ribosome biogenesis, marked by ribosomal genes, HLA-A, CD74, C1QB, and APOE; MG4 – lipid-processing, associated with lipid and cholesterol metabolism and phagocytosis, marked by PPARG, APOE, ABCA1, and TREM2; the most significantly enriched state in AD; MG5 – phagocytic; MG6 – stress-related, marked by unfolded protein response genes such as HSP90AA1 and HSPH1; MG7 – glycolytic state; MG8 – inflammatory II, significantly enriched in AD, marked by LRRK2, SPON1, and FOXP1; MG10 – inflammatory III, marked by IL1B, CCL3, and RELB; MG11 – antiviral signature, regulated by IRF7; MG12 – cycling state, undergoing proliferation, marked by BRIP1 and EZH2, and clearly separated from other states on UMAP [9].
In the second paper by Prater et. al, snRNA-seq of PU.1-enriched nuclei was applied, and 10 clusters of microglia have been described. Clusters 1 and 2 were assigned as homeostatic, notably, WIPF3-enriched subcluster 1.5 was highly AD-specific. Cluster 4 was assigned as dystrophic, with the high expression of response to IFN-γ, respiratory chain complex, ferritin chains (FTL, FTH1), and ribosomal (RPL19) genes; cluster 7 was motile, marked by MYO1E, PTPRG, PPARG, and GAS7; cluster 8 was canonical inflammatory, with markers NFKB1, NFKBIA, RELB, and TRAF3; cluster 9 was senescent-like, with the high expression of TMEM2, HAMP, CEBP, and CDKN1A; cluster 10 was undergoing cell cycle and marked by BRIP1 and CENPP, which was enriched in control. Additionally, there were three clusters with the high activity of endolysosomal network (ELN): cluster 3 – phagocytic ELN, enriched in CD163, DPYD, MITF, and APOE; cluster 5 – stress-autophagy ELN with HSP90AA1, HIF1A, and BAG3 markers; and AD-enriched cluster 6 – inflammatory ELN, enriched in genes for interferon and innate immune response such as IRF3/5/7, IFIT2/3, TRIM22, CARD9, and NLRP3 [10].
Finally, in 2025, the Human Microglia Atlas (HuMicA) was published, integrating 19 single-cell and single-nucleus RNA-seq datasets across multiple conditions — including Alzheimer’s disease, autism spectrum disorder, epilepsy, multiple sclerosis, Lewy body diseases, COVID-19, and healthy controls — and comprising a total of 90,716 cells/nuclei. The authors describe nine distinct states: three homeostatic, four activated microglial subtypes, one disease-inflammatory macrophage-like population (DIMs), and one cluster of border-associated macrophages (MAC). Among the homeostatic states, Homeos1 (cluster 0) was the largest; the other two were Homeos2 (cluster 4, marked by GRID2) and Homeos3 (cluster 8, characterized by SERPINE1 expression). The activated subtypes included Inflam.DAM (cluster 1, positive for SPP1 and TMEM163, and several unfolded protein response genes such as HSPA5 and HSP90B1), Lipo.DAM (cluster 6, expressing GPNMB, PTPRG, MYO1E, IQGAP2, MITF, STARD13, and PPARG and enriched in lysosome and lipid metabolism pathways), and two ribosome-enriched clusters: Ribo.DAM1 (cluster 3, marked by PCDH9, SYT1, CADM2, KCNIP4, and RBFOX1) and Ribo.DAM2 (cluster 5, with high PLEKHA7, FTL, and FTH1). The non-microglial populations comprised disease-inflammatory macrophages (DIMs, cluster 2, expressing CD83, SLC2A3, HSPA1A, and DNAJB1) and border-associated macrophages (MAC, cluster 7, showing high CD163 and low P2RY12 expression) [11].
Thus, as can be seen, even in the most cutting-edge research fully devoted to microglial diversity, there is no full consensus, and different, though partially overlapping, results are obtained. To figure out what is really going on with microglia in aging and neurodegeneration, I independently analyzed five human datasets covering different conditions (AD, PD, ALS, FTLD, and aging) and one non-human primate aging dataset, and here report the most reproducible patterns observed in this study.
My analysis can be logically separated into two parts. In the first part, I focused on cell populations derived from cluster analysis: their marker genes and signatures, functional interpretation using GO/KEGG, and disease associations via quasi-binomial regression. In the second part, I analyzed gene expression at multiple levels: starting from pseudobulk comparisons, then exploring hdWGCNA-derived modules and their condition associations, followed by transcription factor analysis.
Methods
Datasets Overview
For my analysis, I used six datasets and analyzed them independently. Information about them is provided in Table 1.
Cluster Analysis
Cluster analysis was performed independently with the same pipeline for all datasets, with the central role of Scanpy [18].
First, datasets were downloaded and each sample was read as an adata object. Then, I performed QC by filtering using manual thresholds: (1) cells with < 500 counts, (2) cells with > 10,000 counts, (3) cells with > 6,000 genes, (4) genes present in < 5 cells, (5) cells with > 10% mitochondrial genes, (6) cells with > 1% hemoglobin genes, (7) cells identified as doublets by Scrublet’s default parameters [19].
After QC, each sample was normalized (to 10,000 UMI per cell) and log1p-transformed. Then, I applied CellTypist for automatic cell type identification and subsequent filtering of the cell types of interest: I used the "Adult_Human_PrefrontalCortex.pkl" model for human Datasets 1–5 (with subsequent filtering of cells identified as 'Macro F13A1 COLEC12', 'Micro P2RY12 APBB1IP', 'Micro P2RY12 CCL3', 'Micro P2RY12 GLDN', and 'Myeloid LSP1 LYZ') and the "Adult_CynomolgusMacaque_Hippocampus.pkl" model for Dataset 6, with subsequent filtering of 'Microglia_1', 'Microglia_2', and 'PVM' cell types [20,21].
After filtering, I selected 3,000 highly variable genes (HVGs) using Pearson residuals, performed PCA, used BBKNN for batch correction (on 40 PCs), performed Leiden clustering (with resolution 2.0 and random state = 42), and calculated UMAP (random state = 42) for visualization [22,23,24,25].
Once clusters were obtained, I characterized them using several tools: (1) by calculating top marker genes and generating dot plots, (2) by GO enrichment, and (3) by KEGG enrichment [26].
To test cluster association with disease, I used quasi-binomial logistic regression with multiple testing correction via FDR. Comparisons were: AD vs Control for Dataset 2 and Dataset 5, and PD vs Control for Dataset 1. For aging datasets, I separated samples into groups: for Dataset 4, donors younger than 57 were labeled as “Young” and those older than 70 were labeled “Old” (with no samples in between); for Dataset 6, animals were already pre-assigned to “Young” and “Old” groups, so I directly compared Old vs Young. For Dataset 3, I merged samples from prefrontal and motor cortices from the same donors and performed pairwise comparisons: ALS vs Control, FTLD vs Control, and ALS vs FTLD, followed by an additional Bonferroni correction [27].
For comparison with microglia, I additionally analyzed oligodendrocytes and OPCs from the same publication as Dataset 5 ('OPC PDGFRA PCDH15', 'Oligo MOG CDH7', 'Oligo MOG FRY', 'Oligo MOG GSN', and 'Oligo MOG OPALIN' were filtered, and marker genes for each cluster have been identified).
Gene Expression Analysis
To identify differentially expressed genes at the population level, I aggregated all microglia from the same donor into a single pseudobulk sample and performed differential expression analysis using PyDESeq2. The comparison scheme matched that used for cluster-level association testing (e.g., AD vs Control, Old vs Young) [28].
For gene co-expression module detection, I converted each AnnData object to Seurat format and applied hdWGCNA independently to Datasets 1–6 following the protocol outlined in Samuel Morabito’s GitHub tutorial. Networks were constructed using default parameters, with fraction = 0.001 to retain genes expressed at rare populations. Gene modules were inferred across all microglial cells in each dataset, without subsetting to specific clusters. Module visualization was performed in Python [29].
Each resulting human-derived module was functionally characterized by Gene Ontology (GO) enrichment analysis using the hdWGCNA Enrichment tutorial. Module-trait associations were assessed via differential module eigengene analysis for all modules, as described in the respective hdWGCNA tutorial, using the same condition comparisons as in cluster-level analyses (e.g., binary Young vs Old for Datasets 4 and 6; pairwise ALS vs Control, FTLD vs Control, ALS vs FTLD for Dataset 3, with Bonferroni correction for multiple testing).
Transcription factor (TF) regulatory network analysis was performed for Dataset 1 using the JASPAR2024 database and the “A” strategy from the hdWGCNA TF regulatory network tutorial. The resulting network was further processed in Python using the GetTFNetwork output to examine relationships between regulators and target genes of interest [30].
Results
Part 1: Cluster Analysis
Following independent clustering of each human dataset, I identified a total of 89 microglial clusters: 18 in Dataset 1, 19 in Dataset 2, 18 in Dataset 3, 17 in Dataset 4, and 17 in Dataset 5. Detailed annotations for all clusters are provided in the Supplementary Materials: Supplementary Table S1 lists the top 20 marker genes per cluster, Supplementary Table S2 reports the top 10 Gene Ontology (GO) terms, Supplementary Table S3 includes the top 10 KEGG pathways, and Supplementary Table S4 summarizes cluster associations with disease or age conditions.
Because clustering yielded dataset-specific partitions, I focus here on the most reproducible transcriptional patterns and clusters with biologically interpretable phenotypes, rather than providing a full catalog of all 89 clusters. For clarity and conciseness, I refer to individual clusters using a short notation – for example, D2C13 denotes cluster 13 from Dataset 2.
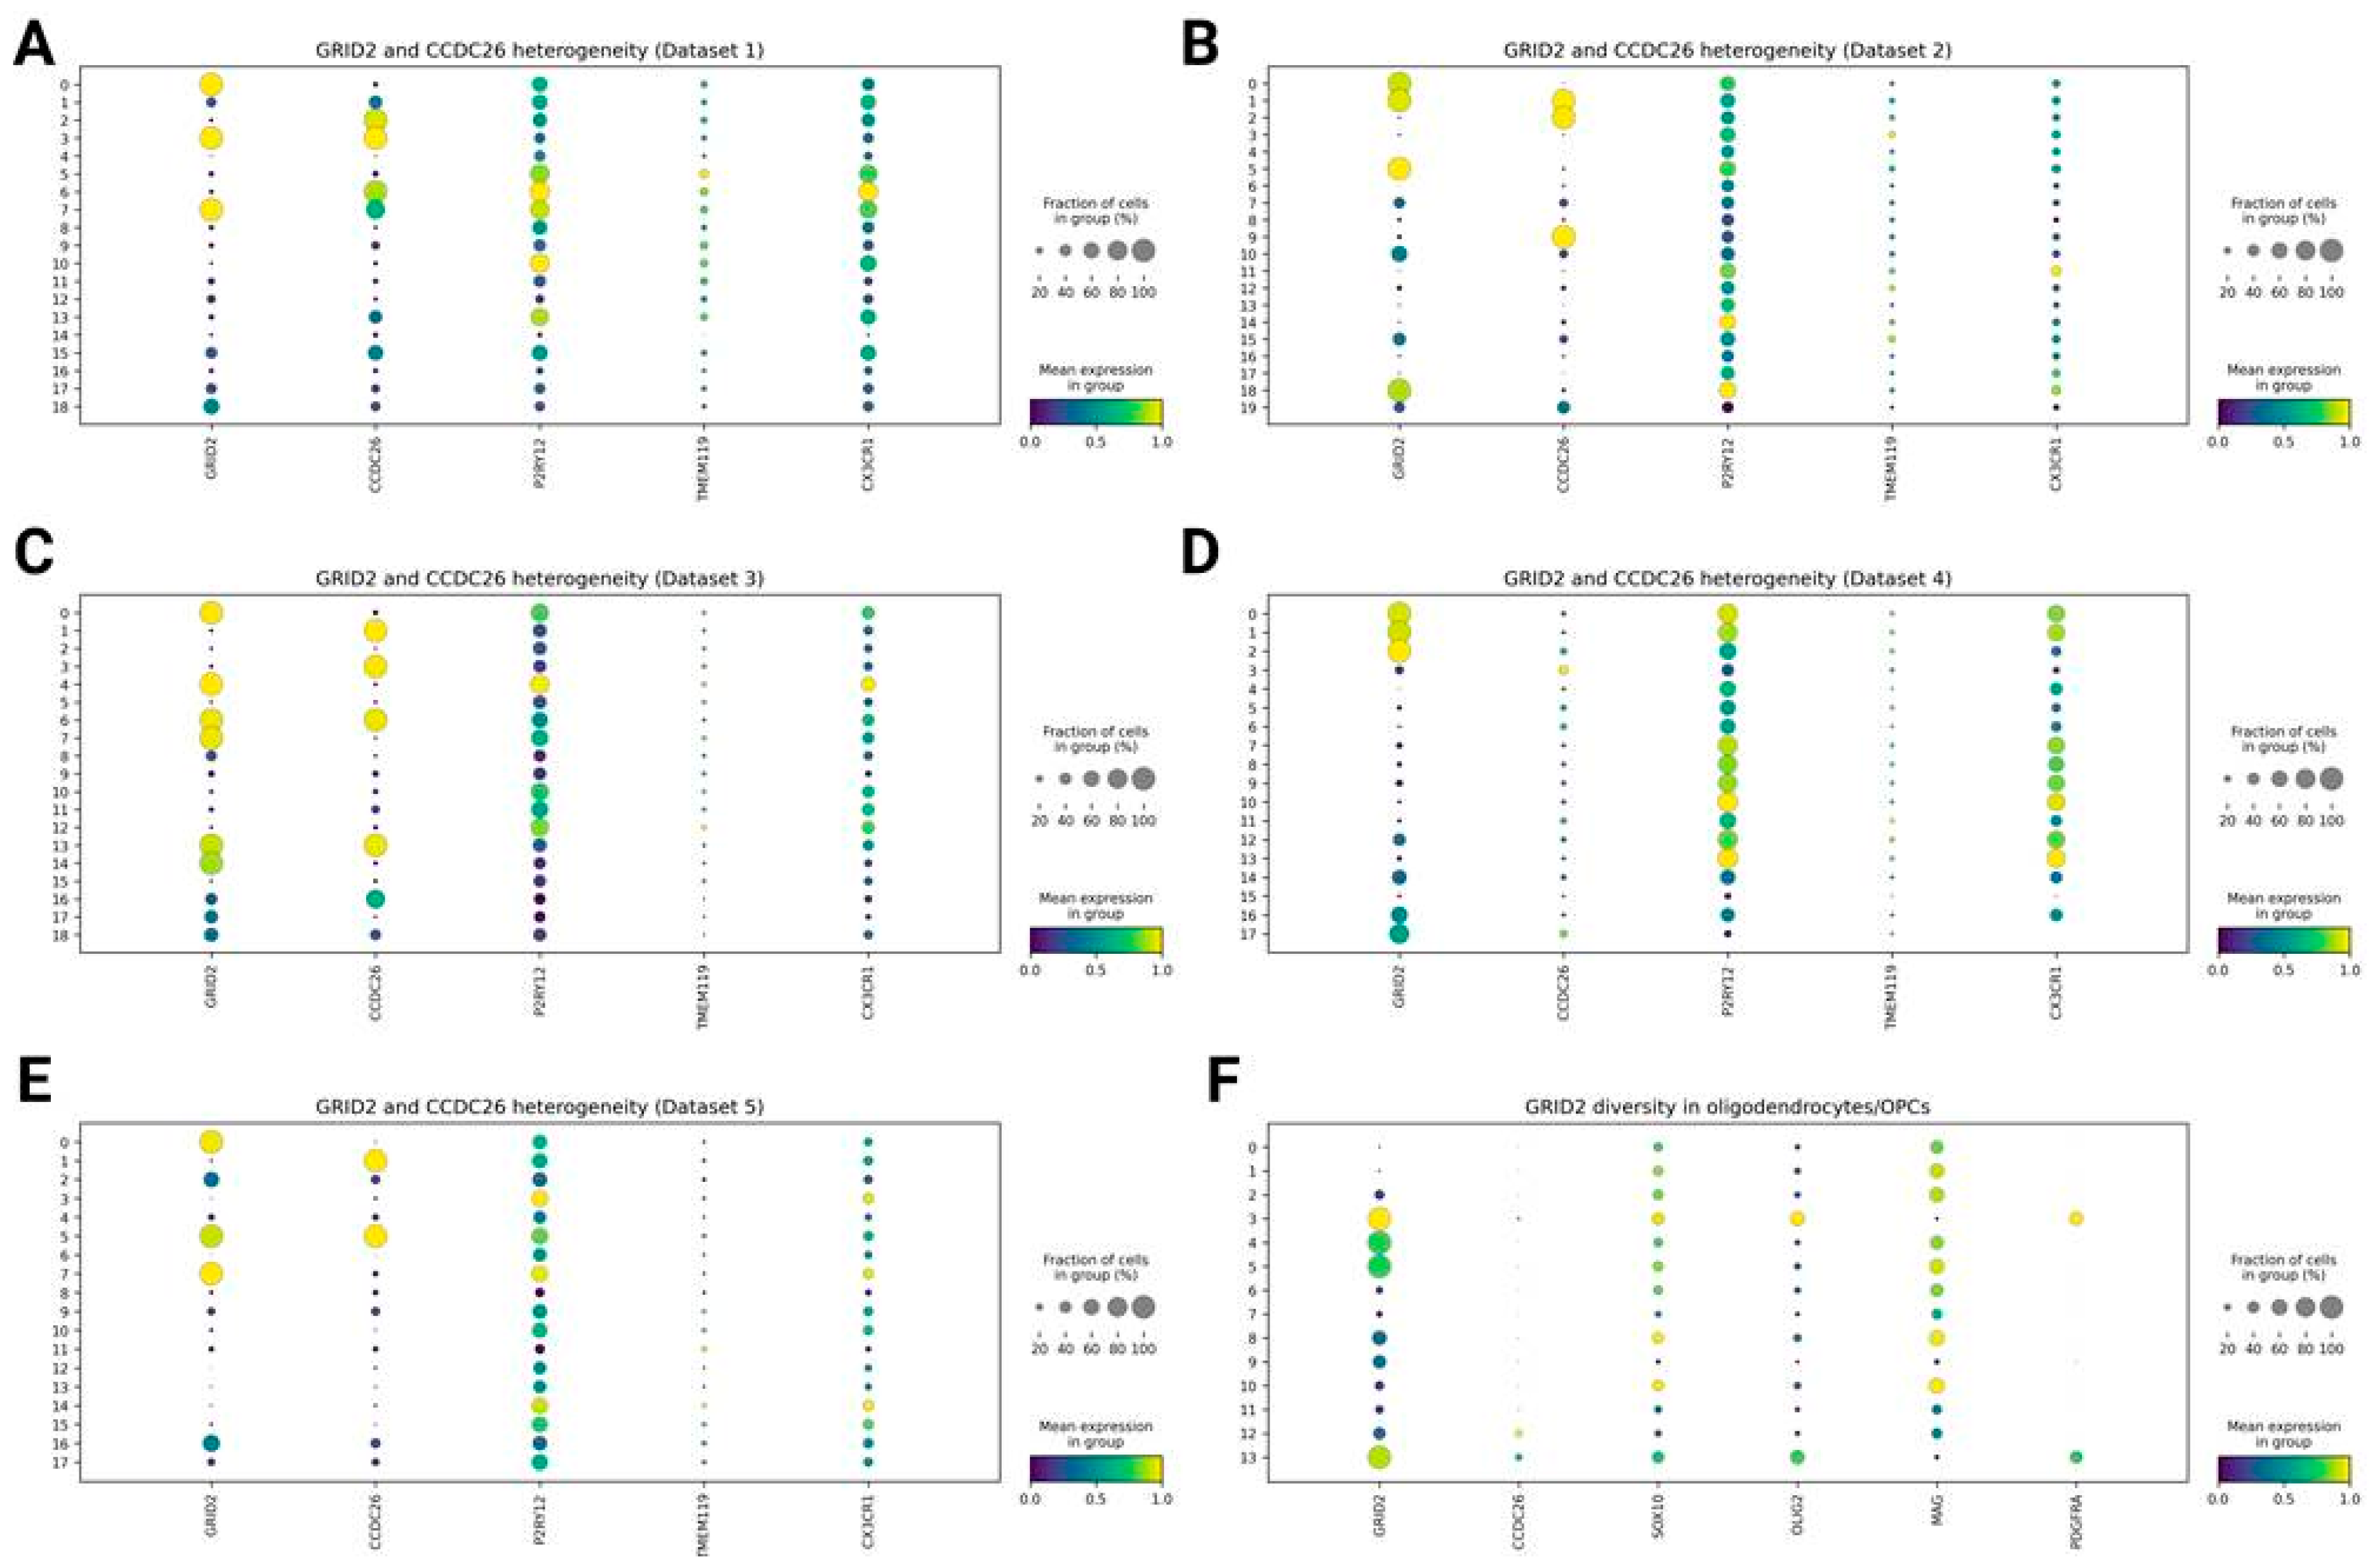
Diversity in GRID2 and CCDC26 Expression Between Clusters
Just before delving into details about particular subpopulations, I noticed an interesting detail: putatively homeostatic populations — those lacking clear activation-related signatures — vary dramatically in expression of two genes, GRID2 and CCDC26, with average logFC ~3.5–4.5 compared to other clusters. All combinations were present: GRID2⁺CCDC26⁻, GRID2⁻CCDC26⁺, GRID2⁺CCDC26⁺, and GRID2⁻CCDC26⁻. This diversity reproduced across all datasets (except Dataset 4, where all clusters showed low CCDC26 expression).
Moreover, when I analyzed oligodendrocytes/OPCs, they also exhibited diverse GRID2 expression (higher in OPCs than in oligodendrocytes), while all these cells showed low CCDC26 expression. This may suggest that GRID2 heterogeneity is a common feature across at least several glial cell types.
In the literature, GRID2 was noted as a marker for certain clusters in Prater et al., and more clearly described in the HuMicA article as a key marker of the Homeos2 cluster [10,11]. Its functional role in microglia remains obscure, as GRID2 is primarily studied in neurons [31,32]. A recent Alzheimer’s disease study identified two AD-associated microglial states, with AD2 characterized by increased GRID2 expression and association with tau pathology, not Aβ [33].
Regarding CCDC26, far less is known about its role in microglia, as it is mainly studied in cancer [34]. A recent bulk RNA-seq study reported higher CCDC26 expression in Parkinson’s disease compared to major depressive disorder [35].
Figure 1.
GRID2 and CCDC26 diversity between clusters of glial cells. A-E: microglia (A - Dataset 1, B - Dataset 2, C - Dataset 3, D - Dataset 4, E - Dataset 5), F: oligodendrocytes/OPCs (0-2, 4-8, 10 - oligodendrocytes, 3, 13 - OPCs, 9, 11, 12 - intermediate phenotype).
Figure 1.
GRID2 and CCDC26 diversity between clusters of glial cells. A-E: microglia (A - Dataset 1, B - Dataset 2, C - Dataset 3, D - Dataset 4, E - Dataset 5), F: oligodendrocytes/OPCs (0-2, 4-8, 10 - oligodendrocytes, 3, 13 - OPCs, 9, 11, 12 - intermediate phenotype).
GPNMB/IQGAP2+ Phagocytic Microglia
The GPNMB⁺ population was one of the most reproducible physiological states observed in my analysis. This signature included GPNMB, IQGAP2, MITF (perhaps the most important transcriptional regulator – see below), ZNF804A, PTPRG, PPARG, MYO1E, and CPM, while ATG7, KCNMA1, STARD13, DPYD, and APOE, although co-occurring as markers, seem to be broader regulators also present in other clusters.
Physiologically, this microglia is responsible for phagocytosis of protein aggregates (as suggested by enrichment in GO/KEGG terms such as lysosome, endocytosis, and phagocytosis) and lipid metabolism – an adaptive response in the context of neurodegeneration. Importantly, these clusters not only appeared in all datasets, but also showed the most uniform trend toward expansion in neurodegenerative conditions and aged samples.
In Dataset 1, I annotated cluster 11 as GPNMB⁺ microglia. It was highly PD-enriched (OR = 6.91, p-value = 0.00057). Cluster 14 also had a GPNMB⁺ signature, but it was control-enriched (OR = 0.63, p-value = 0.039); however, it was annotated as macrophages by CellTypist, so I currently have no explanation for this.
In Dataset 2, clusters 8 and 12 had GPNMB⁺ signatures. Both were AD-enriched (OR = 2.00 and 8.71, p-value = 0.295 and 5.13E−06, respectively), while in Dataset 5, it was cluster 11, also AD-enriched (OR = 2.54, p-value = 0.023).
In Dataset 3, this was cluster 9. It was enriched both in ALS vs Control (OR = 4.36, p-value = 0.0187) and in FTLD vs Control (OR = 6.59, p-value = 8.84E−08), while non-significantly enriched in FTLD compared to ALS (OR = 0.66, p-value = 1.00).
In Dataset 4, cluster 15 had the strongest GPNMB⁺ signature and was Old-enriched (OR = 4.85, p-value = 1.23E−06), while clusters 2 and 3, showing moderate GPNMB⁺ expression, were also Old-enriched (OR = 4.54 and 22.27, p-value = 0.033 and 3.00E−09, respectively).
This demonstrates that GPNMB⁺ microglia expansion is a universal hallmark across aging and, putatively, all neurodegenerative conditions.
This has been described before. For instance, Sun et al. showed that MG4 (closest to my GPNMB⁺ cluster) exhibits the strongest increase in AD compared to controls [9]. Relative to the Prater et al. classification, it most closely resembles the phagocytic ELN cluster (which did not change in AD) [10]. In terms of HuMicA, this corresponds to Lipo.DAM, which was significantly elevated in AD and multiple sclerosis, as well as in other conditions (though non-significantly) [11].
More details on this could be found on Figure 2.
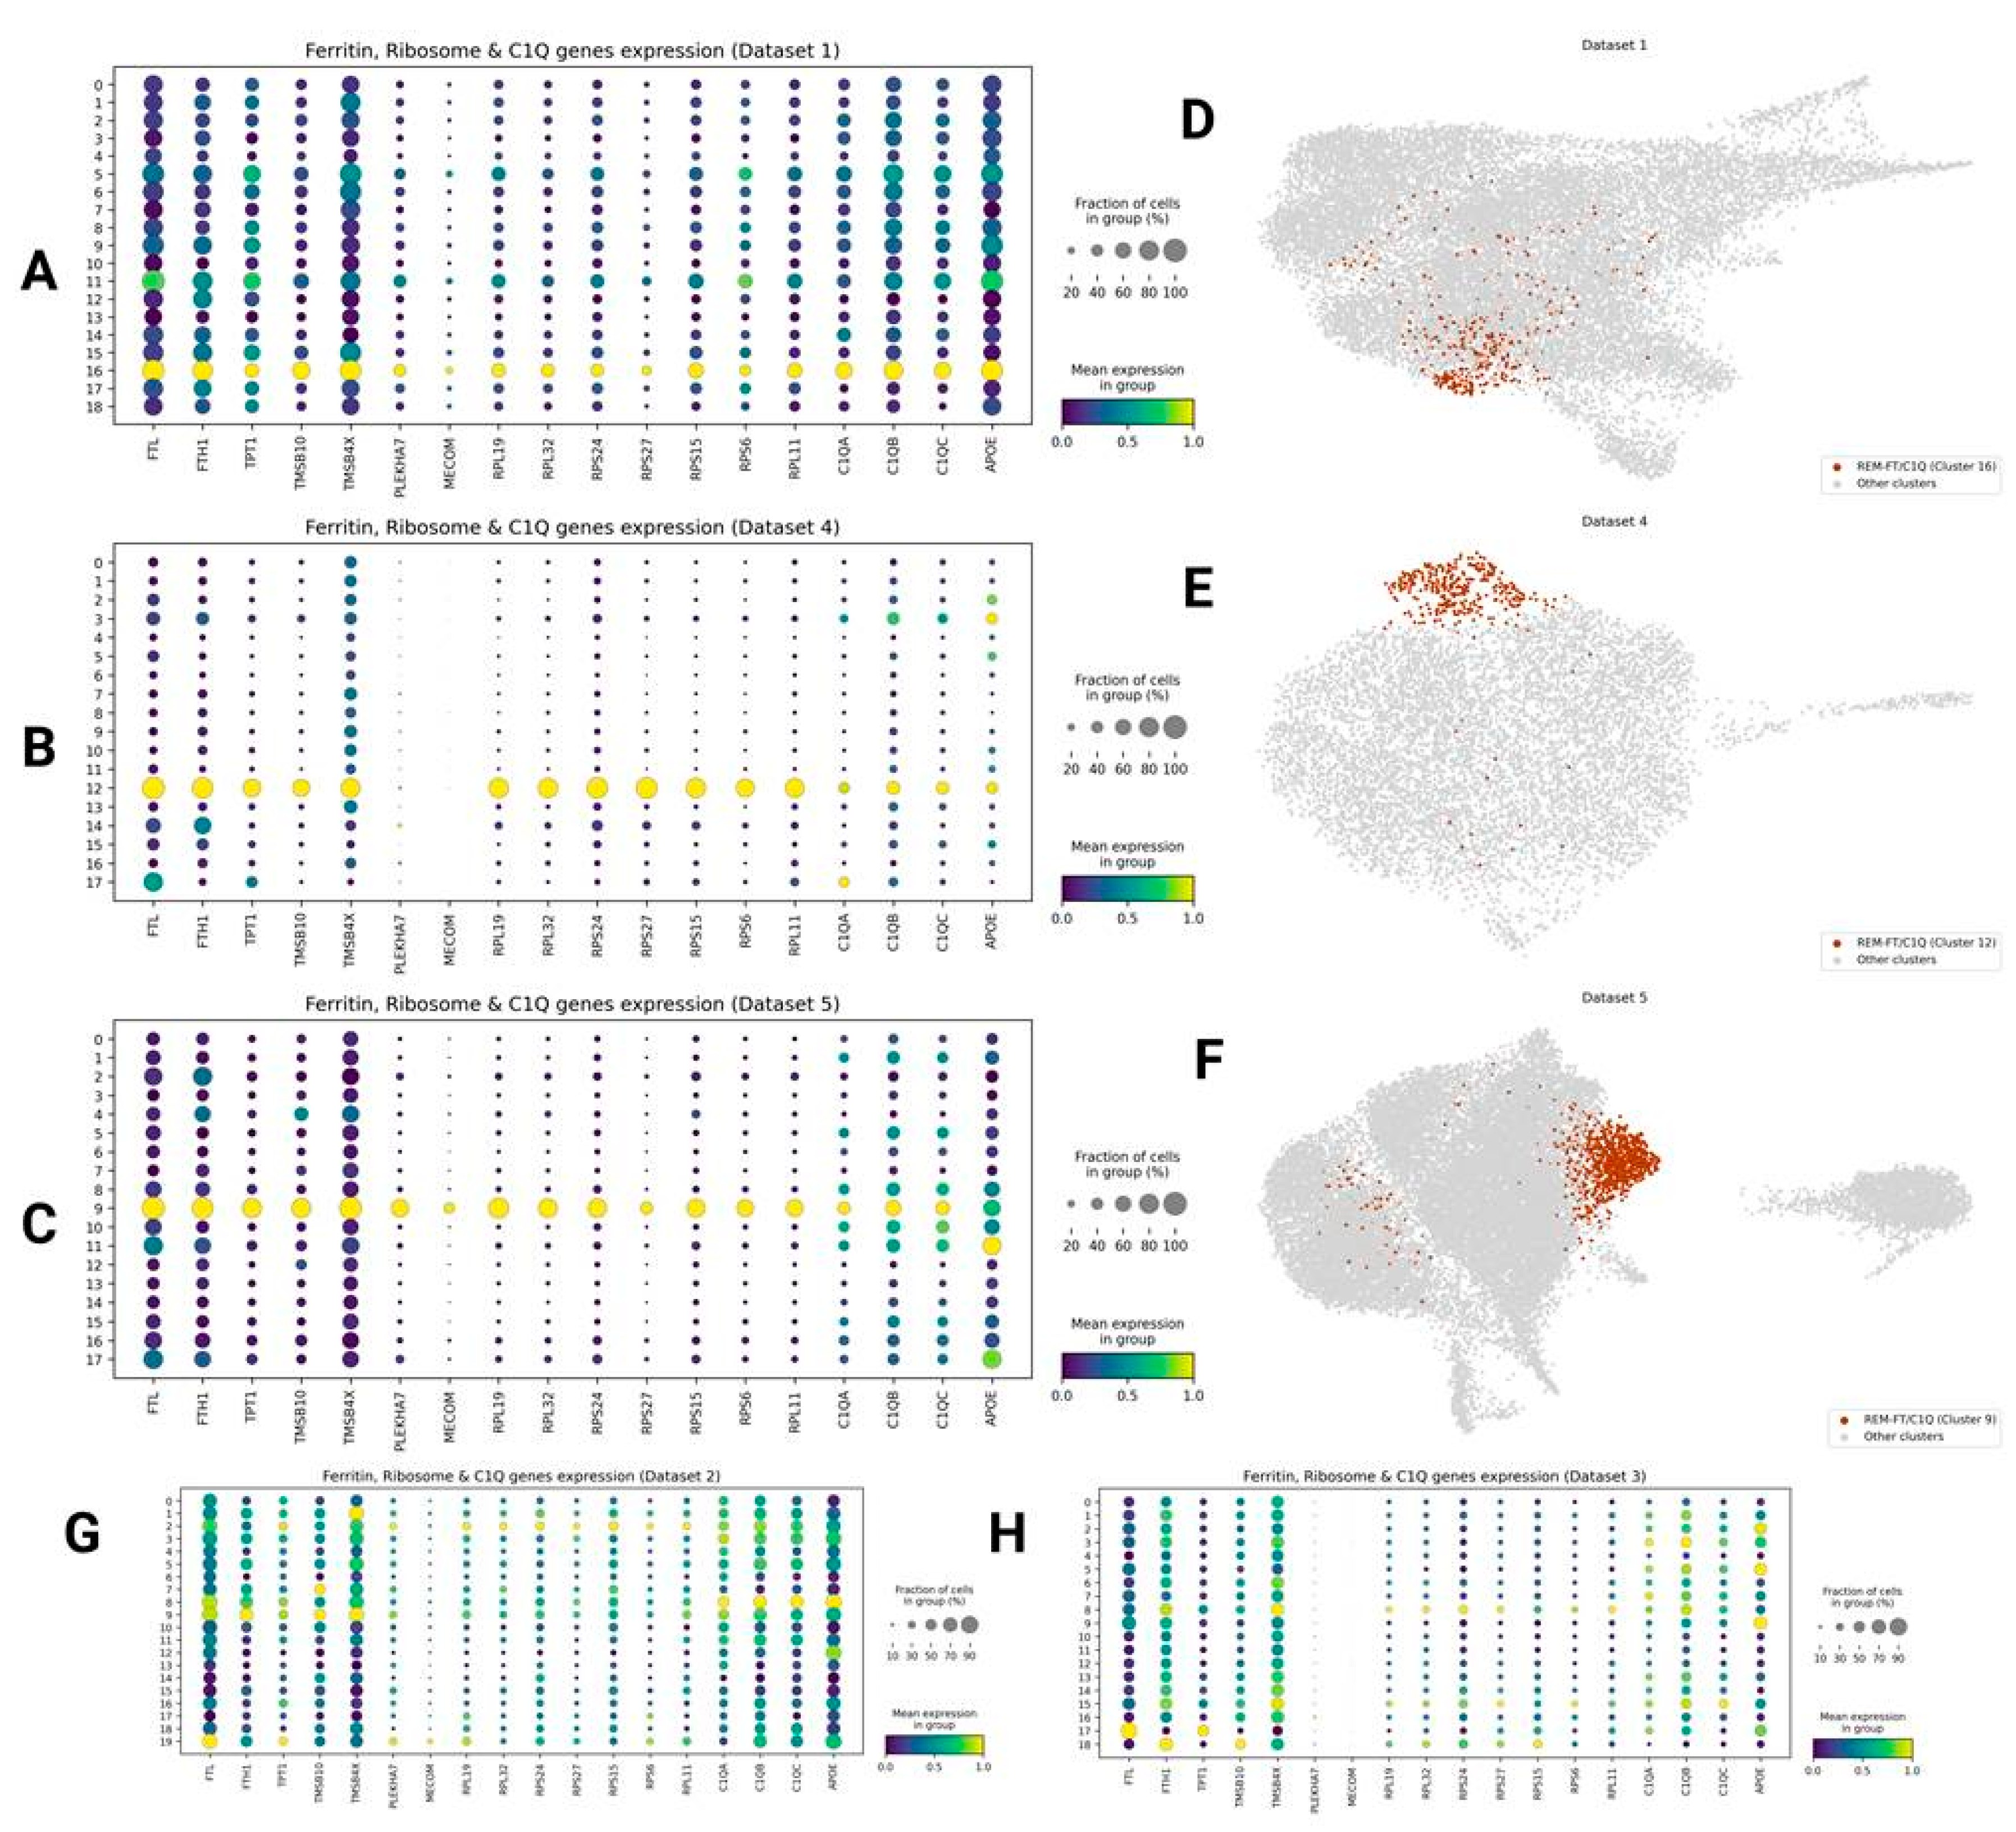
Ribosome-Enriched FTL/H1+ C1QA/B/C+ Microglia (REM-FT/C1Q)
Another very pronounced state seen in 3 datasets was ribosome-enriched FTL/H1⁺ C1QA/B/C⁺ microglia, or briefly REM-FT/C1Q: these were clusters D1C16, D4C12, and D5C9. It was absent as a uniform cluster with a clear signature in Dataset 2 and Dataset 3.
Its signature included: (1) ribosomal genes, expressed at higher levels compared to other clusters; (2) ferritin genes (FTL and FTH1); (3) C1QA/B/C genes, whose product is responsible for synaptic pruning; (4) several genes involved in cytoskeleton interaction, cell adhesion, and motility: TPT1 (stabilizes microtubules), TMSB10/TMSB4X (interact with actin), and PLEKHA7 (important in regulating tight junctions); (5) APOE.
On GO and KEGG, these clusters show enrichment in translation and other protein metabolism–related processes (e.g., ubiquitin-mediated proteolysis), endocytosis, as well as in some immune processes – such as Coronavirus disease, Shigellosis, and Yersinia infection – importantly, due to shared regulators (e.g., MAPK, PI3K-AKT, UBE2D genes, and so on). They do not reveal an inflammatory or metabolically impaired phenotype, and these clusters lack proinflammatory genes (e.g., interleukins) in their signatures.
Interestingly, all of them showed a tendency toward enrichment in control and youthful states, although non-significantly: D1C16 and D5C9 were control-enriched (OR = 0.69 and 0.86, p-value = 0.80 and 0.84, respectively), and D4C12 was Young-enriched (OR = 0.69, p-value = 0.72).
Comparing with existing data, Prater et al. annotated cluster 4 (also with markers FTH1, FTL, RPL19, PLEKHA7) as dystrophic, due to enrichment in “respiratory chain complex” and “intrinsic apoptotic signaling” terms, but it was control-enriched (NS) [10]. In HuMicA, a cluster with a very close signature was referred to as Ribo.DAM2 and did not show statistically significant differences when comparing healthy and disease states [11]. In Sun et al., an MG3 cluster (enriched in ribosomal genes, FTL/FTH1⁺, APOE⁺, C1QA/B/C⁺) was annotated in a way highly similar to mine, and it did not increase in AD in terms of cluster size [9].
Taking all this into account, I hypothesize that this state might not be pathological, but rather healthy and youthful, reflecting active protein biosynthesis, iron metabolism, cellular motility, interaction with other cells, and active synaptic pruning (although the latter may become detrimental in neurodegeneration). To test this, additional research is needed.
Figure 3.
REM-FT/C1Q. A-C: Ribosomal microglia signature in Datasets 1 (A), 4 (B), and 5 (C). D-F: REM-FT/C1Q on UMAPs in Datasets 1 (D), 4 (E), and 5 (F). G-H: Datasets 2 (G) and 3 (H) do not have clusters with this clear signature.
Figure 3.
REM-FT/C1Q. A-C: Ribosomal microglia signature in Datasets 1 (A), 4 (B), and 5 (C). D-F: REM-FT/C1Q on UMAPs in Datasets 1 (D), 4 (E), and 5 (F). G-H: Datasets 2 (G) and 3 (H) do not have clusters with this clear signature.
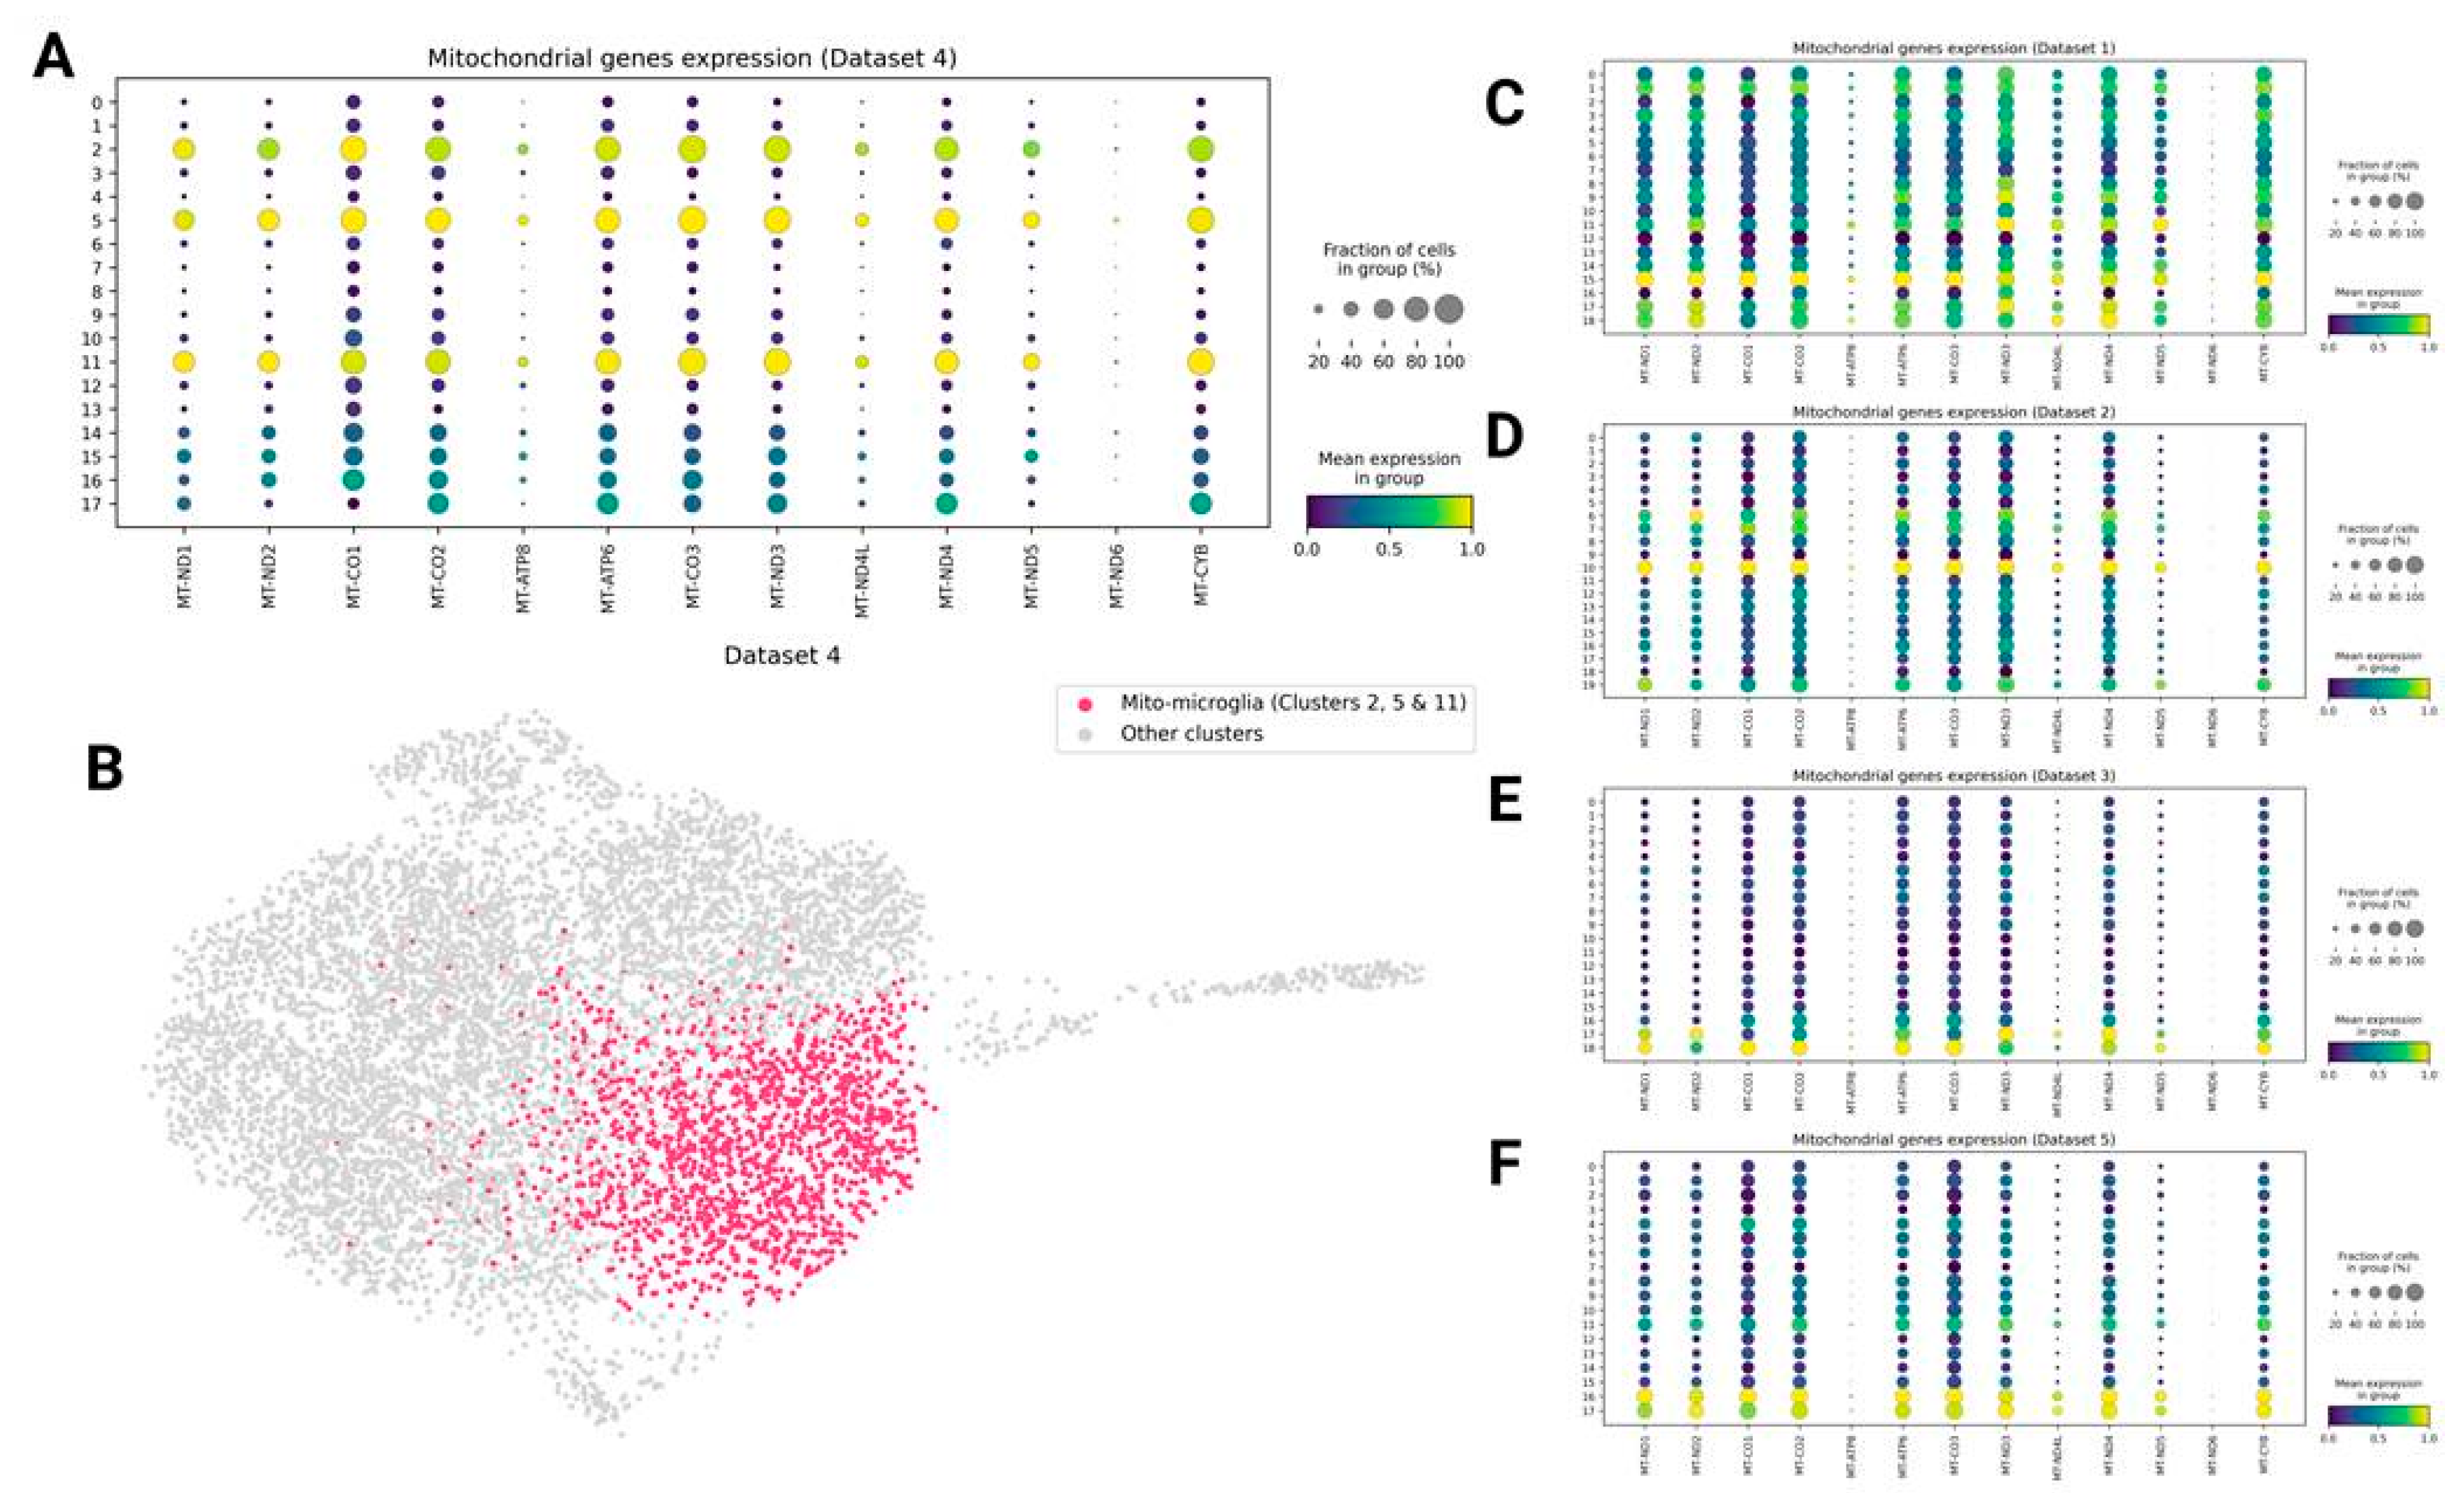
Mitochondrial Genes Expressing Microglia (Mito-Microglia)
Some clusters are characterized by increased expression of mitochondrial genes. The clearest example is Dataset 4, where clusters 2, 5, and 11 all showed significantly increased mitochondrial gene expression compared to all other clusters. I refer to this state as Mito-microglia, which may reflect metabolically impaired states that could increase in neurodegeneration and aging. Indeed, clusters 2, 5, and 11 are all Old-enriched (OR = 4.54, 3.80, and 2.47; p-value = 0.033, 0.00027, and 0.191, respectively).
On the other hand, clusters with elevated mitochondrial gene expression do not show consistent dynamics across datasets. For instance, D1C15 and D5C17 are control-enriched (OR = 0.20 and 0.48; p-value = 0.00037 and 0.023, respectively), while D2C10 shows no enrichment (OR = 1.00). I refrain from discussing D3C17, D3C18, and D5C16 here due to overlap with other phenotypes (e.g., HSP-expressing and NRG3⁺ clusters, see below).
In summary, I currently cannot conclude that microglial populations with increased mitochondrial gene expression consistently expand in aging or neurodegeneration.
The interpretation is complicated: on one hand, an increased percentage of mitochondrial genes can reflect technical artifacts (e.g., low cell quality), and thus I filtered out cells with >10% mitochondrial genes. On the other hand, enrichment in terms like ETC was noted in translational states, such as cluster 4 in Prater et al. and Ribo.DAM2 in HuMicA, or in Ribo.DAM1 in HuMicA (which is closely related to my NRG3⁺ state, see below) [10,11]. This suggests that a biological increase in mitochondrial gene expression may reflect not only damage, but also heightened metabolic activity. However, additional studies are needed to clarify this.
Figure 4.
Mito-microglia. A: Mitochondrial genes as markers for D4C2, D4C5, and D4C11. B: Mito-microglia on the UMAP. C-F: expression of mitochondrial genes in other datasets (C - 1, D - 2, E - 3, F - 5).
Figure 4.
Mito-microglia. A: Mitochondrial genes as markers for D4C2, D4C5, and D4C11. B: Mito-microglia on the UMAP. C-F: expression of mitochondrial genes in other datasets (C - 1, D - 2, E - 3, F - 5).
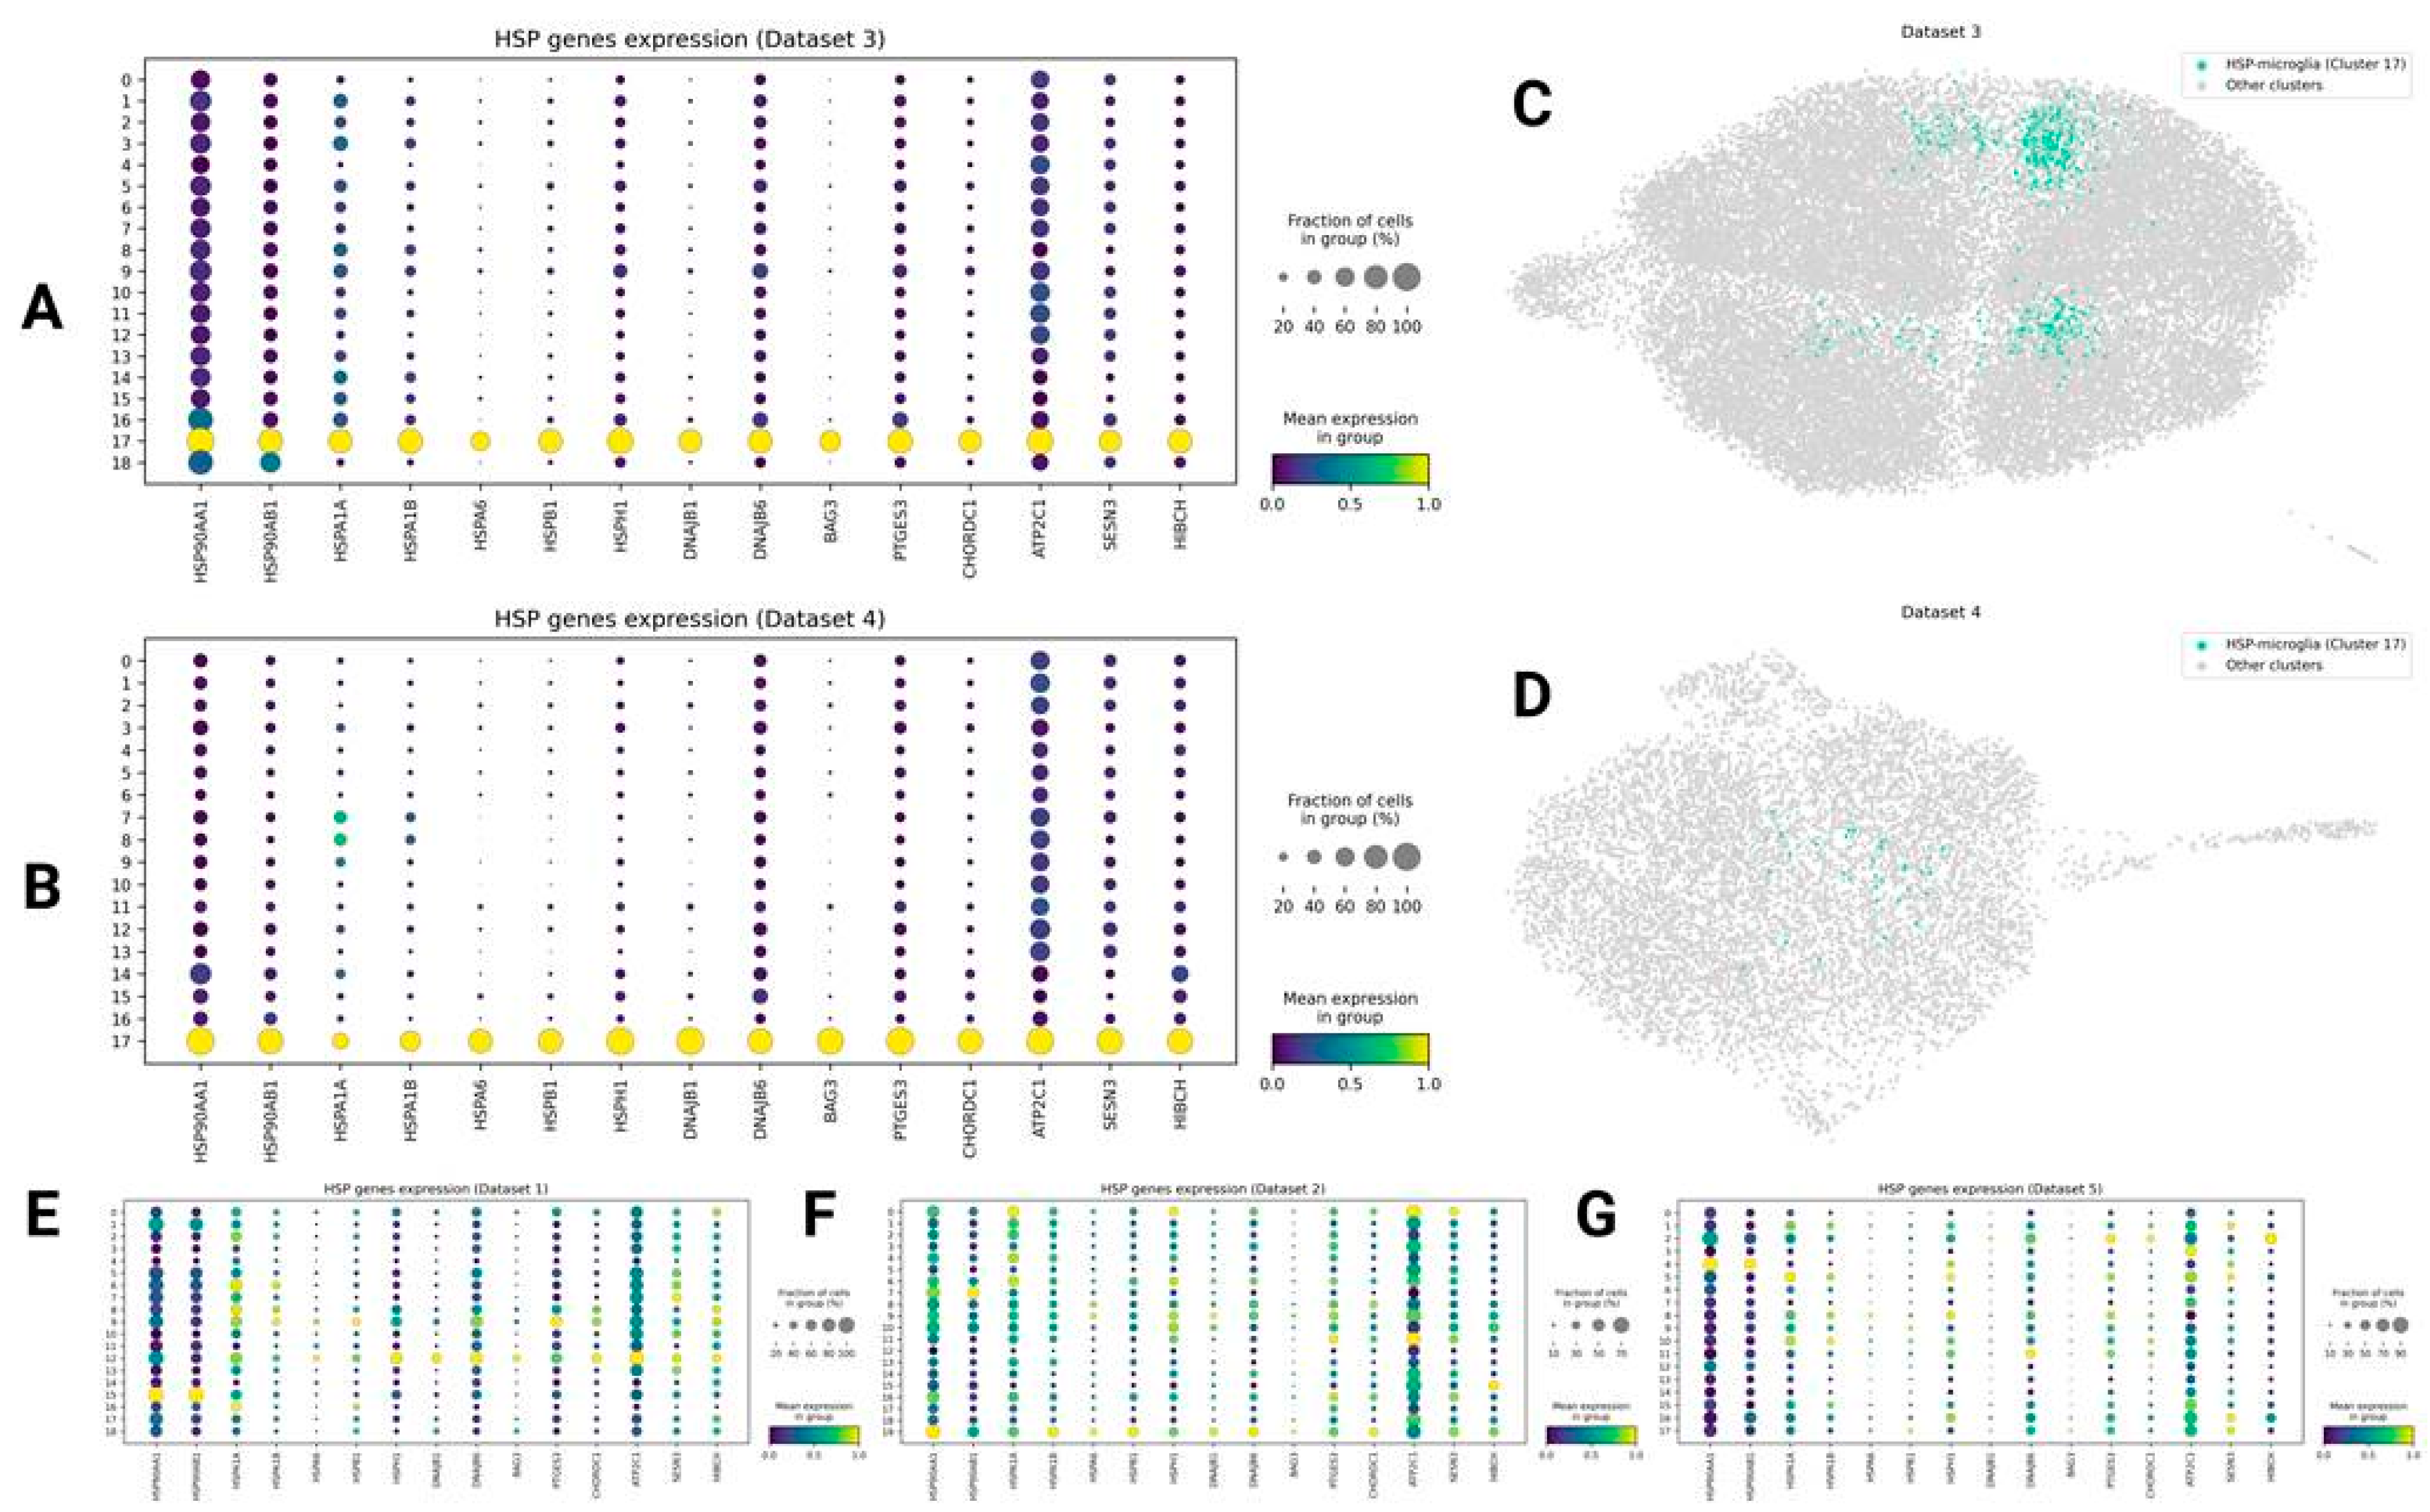
HSP Genes Expressing Microglia (HSP-Microglia)
In Datasets 3 and 4, I identified clusters D3C17 and D4C17, characterized by increased expression of HSP markers (such as HSP90AA1/AB1, HSPA1A/1B, HSPA6, HSPB1/H1, DNAJB1/6, BAG3, etc.), which may reflect a proteotoxic condition and intense unfolded protein response – consistent with GO/KEGG enrichment. Such clusters were not observed in Datasets 1, 2, and 5.
I refrained from testing D4C17 for relevance to aging, as it was minor and present in only one sample. For D3C17, it was non-significantly higher in controls compared to ALS and FTLD (OR = 0.08 and 0.95, p-value = 0.31 and 1.00, respectively), but significantly enriched in FTLD compared to ALS (OR = 0.08, p-value = 0.0033), and nearly equal between control and FTLD. We might speculate this reflects aging (ALS samples are younger than both FTLD and controls), but in fact, there is no clear inference about the differential presence of this cluster in my analysis.
This state has been previously described. It closely resembles MG6 (stress signature: HSP90AA1, HSPH1) from Sun et al., whose proportion did not change in AD, though gene expression increased in late stages [9]. Compared to Prater et al., it aligns with the stress-autophagy ELN cluster, positioned on the differentiation trajectory between homeostatic and senescent-like states, and unchanged in AD in terms of abundance [10]. It also resembles Inflam.DAM in HuMicA (which also co-expressed SPP1 and TMEM163), which did not show significant changes across conditions [11].
Figure 5.
HSP-microglia. A-B: marker genes of HSP-microglia (A - Dataset 3, B - Dataset 4). C-D: HSP-microglia on the UMAP (C - Dataset 3, D - Dataset 4). E-G: no populations with the same markers have been seen on other datasets (E - 1, F - 2, G - 5).
Figure 5.
HSP-microglia. A-B: marker genes of HSP-microglia (A - Dataset 3, B - Dataset 4). C-D: HSP-microglia on the UMAP (C - Dataset 3, D - Dataset 4). E-G: no populations with the same markers have been seen on other datasets (E - 1, F - 2, G - 5).
Dividing Microglia
In Dataset 3, I observed cluster 16, which was localized separately on the UMAP and had marker genes DIAPH3, BRIP1, EZH2, CENPP, etc., and was enriched for terms such as “cell cycle.” I defined it as dividing microglia. Interestingly, while absent in other datasets as a population, D2C16 and D5C15 are marked by CENPP with extremely high selectivity (logFC = 5.04 and 4.27, respectively), but lack expression of all other genes from this signature.
D3C16 was ALS-enriched compared to control (OR = 5.77, p-value = 0.187) and non-significantly FTLD vs control enriched (OR = 2.63, p-value = 0.083).
Interestingly, recent articles provide controversial data on this. For instance, in Sun et al., MG12 (annotated as cell cycle or cycling microglia) did not reveal a significant change in AD compared to controls [9], while cluster 10 (cell cycle microglia) was enriched in the healthy group in the study by Prater et al [10].
Thus, it remains difficult to state how the percentage of dividing microglia changes in neurodegeneration: it is a rare population seen in only 1 out of 5 datasets in my analysis, and it is also not mentioned in HuMicA [11].
More information is shown in Figure 6.
NRG3+ and ST18+ Microglia
Probably the most intriguing – and controversial – subpopulations, these two groups are remarkably reproducible across all datasets I analyzed. They share several marker genes, form clearly distinct clusters on UMAP, and are often positioned in close proximity to each other.
I annotated clusters D1C18, D2C10, D2C19, D4C16, and D5C16 as “NRG3⁺ microglia.” This phenotype was defined by markers such as NRG3, CSMD1, NRXN1, RORA, KCNIP4, and RBFOX1. GO and KEGG enrichment analyses suggested a potential role in synaptic transmission, particularly at glutamatergic synapses, driven by enrichment of genes like GRIK1/2/3/4, which encode ionotropic glutamate receptors.
Clusters D1C17, D2C15, D4C14, and D5C2 were annotated as “ST18⁺ microglia,” characterized by markers including ST18, IL1RAPL1, FRMD5, CTNNA3, MAGI2, RNF220, and SLC24A2. Enrichment analyses pointed toward involvement in axonogenesis, as well as endocytosis and autophagy-related processes.
These phenotypes share notable features: they consistently appear as distinct from all other microglial clusters on UMAP, are spatially adjacent, and overlap in a subset of markers, including NRXN3, PCDH9, CADM2, ERBB4 (a known receptor for NRG3), and DLG2. In Dataset 3, they merged into a single cluster (D3C18), further supporting their biological relatedness.
Notably, statistical testing revealed no significant association of these clusters with either healthy/young or diseased/aged states, except in Dataset 3, where D3C18 was decreased in FTLD compared to both controls and ALS, suggesting they may represent stable, baseline microglial populations whose proportions remain unchanged during aging and neurodegeneration.
But in general, ST18+ microglia tends to be increased in old and diseased samples: D1C17 is PD-enriched (OR = 1.06, p-value = 0.89), both D2C15 and D5C2 are AD-enriched (OR = 1.30 and 1.52, p-value = 0.89 and 0.26, respectively), D4C14 is Old-enriched (OR = 1.63, p-value = 0.34). At the same time, NRG3+ microglia associates with young and control states: D1C18, D4C16, and D5C16 have odds ratio = 0.95, 0.86, and 0.84 and p-value = 0.90, 0.82, and 0.52, respectively, while D2C10 and D2C19 are AD-enriched, but both with OR > 0.92 and p-value close to 1.
However, these populations are often overlooked in existing analyses. In particular, the ST18⁺ group has been dismissed as oligodendrocyte-microglia doublets and excluded (as in HuMicA), because ST18 is widely regarded as a highly specific oligodendrocyte marker. To address this, I jointly analyzed oligodendrocytes and OPCs (from the same study as Dataset 5) together with Dataset 5 microglia in a unified dotplot. The NRG3⁺ and ST18⁺ signatures closely resemble those of OPCs and oligodendrocytes, respectively, and thus my analysis does not refute the doublet hypothesis for ST18⁺ microglia. However, NRG3⁺ microglia show substantially lower expression of canonical oligodendrocyte lineage markers, such as SOX10 and OLIG2, compared to mature oligodendrocytes, and PDGFRA compared to OPCs (with the exception of oligodendrocyte/OPC cluster 9, which also exhibits low expression of these markers).
On the other hand, emerging evidence challenges the notion that these states are purely technical artifacts—particularly for NRG3⁺ microglia. Given the complexity of this interpretation, I defer further discussion to the Discussion section. Everything described in this section is shown on Figure 7.
SPP1, TMEM163, and Other Activation-Related Genes
There are also some genes related to microglial activation whose distribution I analyzed separately, as they did not form clear and reproducible transcriptional or marker signatures. These include SPP1, a key signaling molecule, as well as TMEM163, TREM2, TYROBP, LRRK2 (a validated therapeutic target in PD), DPYD, and FOXP1 (the latter three inspired by hdWGCNA networks, see below).
In brief, their distribution across clusters suggests that, for instance, SPP1 may act as an independent marker, occasionally co-occurring with others. The same could be said about TMEM163. They were observed together in D4C3, which also expressed APOE and LRRK2, displayed strong pro-inflammatory properties, and was highly Old-enriched (OR = 22.27, p-value = 3.00E−09). However, in other datasets, SPP1, TMEM163, and HSP genes showed no consistent association—arguing against a stable Inflam.DAM signature as described in HuMicA, which appears unlikely to reproduce robustly across multiple datasets [11].
This may indicate that SPP1⁺ and TMEM163⁺ phenotypes are driven by independent programs—potentially activated and detrimental. A similar interpretation may apply to TREM2 and TYROBP.
On the other hand, DPYD, FOXP1, and LRRK2 tend to co-occur, suggesting they may be part of the same activation program (further explored in the gene networks section below).
Distribution of these DAM-related genes, and results of enrichment tests discussed in this section are shown on Figure 8.
Results from the Monkey Aging Dataset
In macaques, I identified a total of 20 clusters: cluster 17 corresponded to perivascular macrophages, while the others were microglial.
Briefly, most clusters showed different marker genes compared to human datasets. Notably, genes PDL5 and ENSMFAG00000032040 exhibited high diversity across clusters—including putatively homeostatic ones, possibly playing a role analogous to GRID2 and CCDC26 heterogeneity in human microglia.
When comparing Young and Old monkeys, clusters 0 and 2 were enriched in the Old group (OR = 7.28 and 8.33; p-value = 0.013 and 2.19E−07, respectively). D6C2 shares top markers with cluster 1, which selectively expresses SPP1 and is non-significantly Old-enriched. These markers highlight the immune nature of both clusters and include HLA-DRB5, HLA-DRA, SLC11A1, and several ARHGAP family genes. Other D6C2 markers are shared with clusters 17 (perivascular macrophages) 0, 10, 11, and 12 (latter three being non-significantly Old-enriched) and include ENSMFAG00000035592 and CARMIL1.
Clusters 7, 13, and 14 were Young-enriched (OR = 0.33, 0.17, and 0.42; p-value = 0.031, 0.00011, and 0.036, respectively). D6C7 and D6C13 share the marker CAMKMT, while D6C14 expresses PDE4D, also found in cluster 6 (non-significantly Young-enriched).
Even more interesting was the reproduction of the NRG3⁺ and especially ST18⁺ signatures in macaques. ST18⁺ microglia (cluster 18) was present in all samples, with the same signature as in humans, and was non-significantly Young-enriched (OR = 0.58, p-value = 0.68). The NRG3⁺ signature (clusters 19 and 20) was less distinct and observed in only three samples, so I refrained from testing its association with aging—however, this further supports the biological reality of this state.
The most intriguing observation was that many genes from the GPNMB⁺ signature, particularly GPNMB and IQGAP2, were highly restricted to cluster 17, corresponding to perivascular macrophages, with near-zero expression in microglia themselves and no expansion during aging. Intriguingly, in Dataset 1, I had already observed two GPNMB⁺-related clusters: D1C11 (true microglia) and D1C14 (macrophages). D1C11 showed higher expression of GPNMB and most other signature genes, while D1C14 had higher IQGAP2 and STARD13. Similarly, in HuMicA, IQGAP2 and STARD13 were more expressed in macrophages (cluster 7), while other GPNMB-related genes were enriched in Lipo.DAM. But in macaques, GPNMB, MITF, CPM, PPARG, ATG7, and DPYD are almost exclusively confined to macrophages. Although this could reflect dataset-specific or species-level differences and requires further validation, it may highlight an important divergence between humans and non-human primates in the cellular distribution of what might be one of the most critical programs responding to protein aggregate stress.
More details from the monkey aging dataset analysis are shown in Figure 9.
Part 2: Gene Expression Analysis
Pseudobulk Results
To test which genes change their expression concordantly, in each dataset I merged cells from the same donor and analyzed them using PyDeSeq2. I highlight the most interesting observation.
Unexpectedly, there were quite a few significantly changed genes in most datasets: in Datasets 1, 2, 4, 5, and 6, there were 13, 1, 1535, 4, and 10 DEGs, respectively, and in Dataset 3 there were 353, 1554, and 3941 DEGs in ALS vs control, FTLD vs control, and ALS vs FTLD, respectively.
The most interesting finding was that PTPRG shows the most reproducible and strong increase across multiple conditions: it was the only DEG in Dataset 2 (logFC = 3.04, p-value = 7.59E−07), the top-1 DEG in Dataset 5 (logFC = 1.73, p-value = 4.52E−07), ranked 4th–9th by p-value among DEGs in Dataset 1 (logFC = 1.61, p-value = 0.038), and was also upregulated in FTLD compared to both ALS and control in Dataset 3, as well as in Old vs Young in Dataset 4.
Since PTPRG is part of the GPNMB⁺ signature, this observation reinforces the cluster-level findings and further highlights PTPRG as a particularly important gene—its expression increases dramatically, especially in AD datasets (possibly due to plaque burden?). Moreover, MYO1E was also among the top upregulated genes (e.g., in Dataset 5).
Notably, Dataset 6 was the only one where no PTPRG expression increase was observed (logFC = 0.087, p-value ~ 1). This may be due to the proposed restriction of the entire GPNMB⁺ signature to perivascular macrophages in macaques, without expansion during aging.
hdWGCNA Results
After applying hdWGCNA to five human datasets, I obtained a total of 91 modules: 20, 31, 25, 11, and 4 in Datasets 1, 2, 3, 4, and 5, respectively. As in the previous section, I will report only the most interesting and reproducible patterns. Full details are provided in the Supplementary Materials: Supplementary Table S5 lists top-25 hub genes per module; Supplementary Table S6 and includes respectively shortened (top-3 per module) GO annotations; Supplementary Table S7 reports all statistical tests for module–condition associations. These also include information about macaque-derived-modules (except ST8).
Translational Modules
The most striking result, further supporting my observation that REM-FT/C1Q tends to be associated with youth and health, was that 4 out of 5 modules enriched in ribosomal genes (as well as FTL/H1, C1QA/B/C, TPT1, TMSB4X/10, PLEKHA7, MECOM, OOEP, APOE) were statistically significantly enriched in control or young groups, while the fifth showed near-zero enrichment.
In detail: (1) in Dataset 1, the magenta module was control-enriched (logFC = −1.876, p-value = 5.80E−06); (2) in Dataset 2, both paleturquoise and salmon modules were control-enriched (logFC = −0.913 and −0.451, p-value = 6.65E−25 and 8.36E−06, respectively); (3) in Dataset 4, the black module was young-enriched (logFC = −1.71, p-value = 1.20E−13). The only exception was the darkred module in Dataset 3, which showed near-zero enrichment coefficients and p-values ~1 across all three comparisons. In Dataset 5, no ribosomal gene modules were identified.
Even more intriguing is the royalblue module in Dataset 2, with the top-4 hub genes being FTH1, TMSB4X, TMSB10, and RPS15, and additionally including AIF1, FOS, and several immune-related genes (HLA-DRA, HLA-DPB1), enriched in NF-κB–related terms. Yet this module is still control-enriched (logFC = −4.203, p-value = 1.27E−17). In Dataset 2, paleturquoise, royalblue, and salmon rank 1st, 2nd, and 3rd by p-value, all being control-enriched.
This is fully concordant with my earlier interpretation: active translational machinery, combined with this specific transcriptional program, might not reflect disease or impairment, but rather a healthy, youthful, and metabolically active microglial state.
Further details are shown in Figure 10.
Other Cluster-Specific and Activation-Related Modules
Some modules recapitulated results from the cluster analysis; however, as they did not yield new insights, I will list them briefly.
For instance, the cyan module in Dataset 1 recapitulates the GPNMB⁺ signature, with its top-2 hubs being GPNMB and IQGAP2, while other hubs include CPM, EYA2, MITF, and ATG7. It is highly increased in PD (logFC = 3.320, p-value = 6.53E−26).
GPNMB and LPL are also key regulators of the lightgreen module in Dataset 3, whose activity declines in the order: ALS > FTLD > Control. At the same time, other genes from this signature, namely MITF, MYO1E, TPRG1, CPM, ATG7, PPARG, and IQGAP2, along with, intriguingly, SPP1 and DPYD-AS1, together form the royalblue module, which is higher in FTLD compared to both control and ALS (logFC = 1.500 and −1.323, p-value = 7.38E−102 and 2.44E−145, respectively), and shows no significant difference between them.
The turquoise module in Dataset 3 includes DIAPH3 (top-1 hub), POLQ, BRIP1, CENPF, and EZH2, is strongly linked to mitosis, highly specific to D3C16, and, consistent with cluster analysis, elevated in both ALS and FTLD compared to control. However, as discussed earlier, this may reflect dataset-specific features rather than a general rule.
Some modules recapitulate NRG3⁺ and ST18⁺ signatures. For example, the brown module in Dataset 3 (KCNIP4, CADM2, NRXN1/3, PCDH9, CTNAP2, CSMD1, NEGR1/3, RBFOX1, NRG3, ROBO2, GRIA2) resembles the NRG3⁺ signature and, notably, is dramatically decreased in the order FTLD > Control > ALS, approaching logFC = −9.968 and p-value = 0.00 when comparing FTLD to ALS, complicating interpretation. The blue module in Dataset 5 includes PPP2R2B, NRXN3, CADM2, CTNND2, PCDH9, and other marker genes shared between ST18⁺ and NRG3⁺ phenotypes, and does not vary significantly between AD and controls.
Some modules were particularly interesting. For instance, the magenta module in Dataset 3 (FTLD > Control, logFC = 1.991, p-value = 1.35E−270; FTLD > ALS and ALS > Control) included DPYD and FOXP1 as its top-2 hubs, with LRRK2 in 8th place. LRRK2 is a validated therapeutic target, known to drive microglia toward an inflammatory state, and Neuron23 and QUIAGEN are currently conducting Phase 2 clinical trials of its small-molecule inhibitor NEU-411 for Parkinson’s disease [36]. Interestingly, FOXP1 and LRRK2 co-occur as markers of the inflammatory II (MG8) microglial subtype in Sun et al. Additionally, FOXP1 and DPYD co-appear in the pink module in Dataset 4 (highly increased in Old, logFC = 4.156, p-value = 1.57E−179). Notably, both the Dataset 3 magenta and Dataset 4 pink modules are enriched in "Sphingosine Metabolic Process" (GO:0006670) as their top GO term. Based on this, cluster analysis (above), and TF analysis (below), I incline to believe that DPYD, FOXP1, and LRRK2 together orchestrate one biological programme—one that is highly disease- and therapy-relevant—and thus deserves further investigation.
The structure of all modules described here is shown in Figure 11.
Other Highly Reproducible Genes
I identified additional genes that were highly reproducible across hdWGCNA modules in multiple datasets. Here, I report only those present in networks from 4 or 5 datasets (Table 2). These genes represent strong candidates as key regulators of microglial metabolism, though their functional roles require further investigation.
In brief, 5 genes (namely SORL1, MAML3, ARHGAP15, ETV6, and FNML2) were hub genes in all five datasets. An additional 23 genes (excluding C1QB, RPLP1, and PRS15, discussed above) appeared in 4 out of 5 datasets. Notably, none of these are canonical marker genes, which may suggest they are expressed at lower levels but are broadly present across clusters. Information on all these genes is provided below.
Not only were repeatedly occurring genes found, but they often co-occurred within the same modules, which may shed light on both the biology of these genes and their functional roles in microglia. I will separately describe the most important modules containing numerous genes from my list.
The brown module in Dataset 4 is probably the clearest example of a purely homeostatic and healthy module, highly enriched in Young vs Old samples: P2RY12 and CX3CR1, canonical homeostatic microglia markers, are its top-1 and top-5 hub genes, respectively. Among the genes from my list, it contains ANKRD44 (top-2 hub), MAML3, SORL1, ARHGAP22, AOAH, MEF2A (and its ortholog MEF2C), as well as, though not in my list, two potentially important regulators, DIAPH2 and FOXP2.
Very similar is the green module in Dataset 1, also control-enriched, containing ANKRD44, MEF2A/C, ITPR2, ADAM28, ATP8B4, ABCC4, DOCK8, SRGAP2, MAML3, DIAPH2, FRMD4A, and TCF12.
Regarding SRGAP genes, particularly interesting was the Young-enriched red module in Dataset 4, involved in Ras and Rho signal transduction, where SRGAP2B, SRGAP2, and its homolog SRGAP2C were top-1, top-8, and top-5 hub genes, respectively. Intriguingly, SRGAP2C is also a key regulator of the orange module in Dataset 2, enriched in “Regulation of Axon Regeneration” and non-significantly enriched in Control.
Another putatively homeostatic module is the control-enriched yellow module in Dataset 5, with key regulators including ELMO1 (top-1 hub), ADAM28, DOCK8, ANKRD44, MAML3, ITPR2, SRGAP2, SORL1, BMP2K, ATP8B4, ABCC4, ARHGAP15, FRMD4A, AOAH (all from my list), as well as FOXP2.
Regarding activation-related modules, one of the most striking is the black module in Dataset 3, significantly increased in FTLD vs ALS and ALS vs Control, and enriched in terms related to T cell proliferation and IL-17 production, reflecting strong immune activation. Interestingly, ANKRD44, previously listed as a hub in homeostatic modules, is its top-1 hub gene, while SORL1, MAML3, ADAM28, ELMO1, DOCK8, ABCC4, and FOXP2 are also among its hubs.
Another activation-related module is turquoise in Dataset 5, which is highly AD-enriched. It includes DPYD as its top-5 marker; other genes from Table 2 include TCF12, FMNL2, SND1, and ETV6.
Of particular interest is the white module in Dataset 2, which shows near-zero enrichment in AD but is enriched in “Sterol catabolism” terms, with APOE as the top-1 hub. It also includes FMNL2 and ELMO1 among its other hubs.
Interpretation of some modules remains challenging. For instance, the blue module in Dataset 2 is non-significantly AD-enriched and enriched in fundamental processes such as signal transduction via GTPases. It includes ADAM28, ATP8B4, ABCC4, ETV6, MAML3, TANC2, and ARHGAP15 from my list.
The cyan module in Dataset 3 is more active in ALS vs both FTLD and Control, though differences are non-significant, and is enriched in MAPK cascade and actin nucleation. Its hub genes include FRMD4A (top-2), ITPR2, ATP8B4, ARHGAP22, MEF2A, and AOAH.
Notably, TANC2 was a hub gene in two aforementioned proinflammatory modules: magenta in Dataset 3 and pink in Dataset 4, together with DPYD and FOXP1. NHSL1 is involved in the pink module in Dataset 4.
The structure of all modules discussed here is shown in Figure 12.
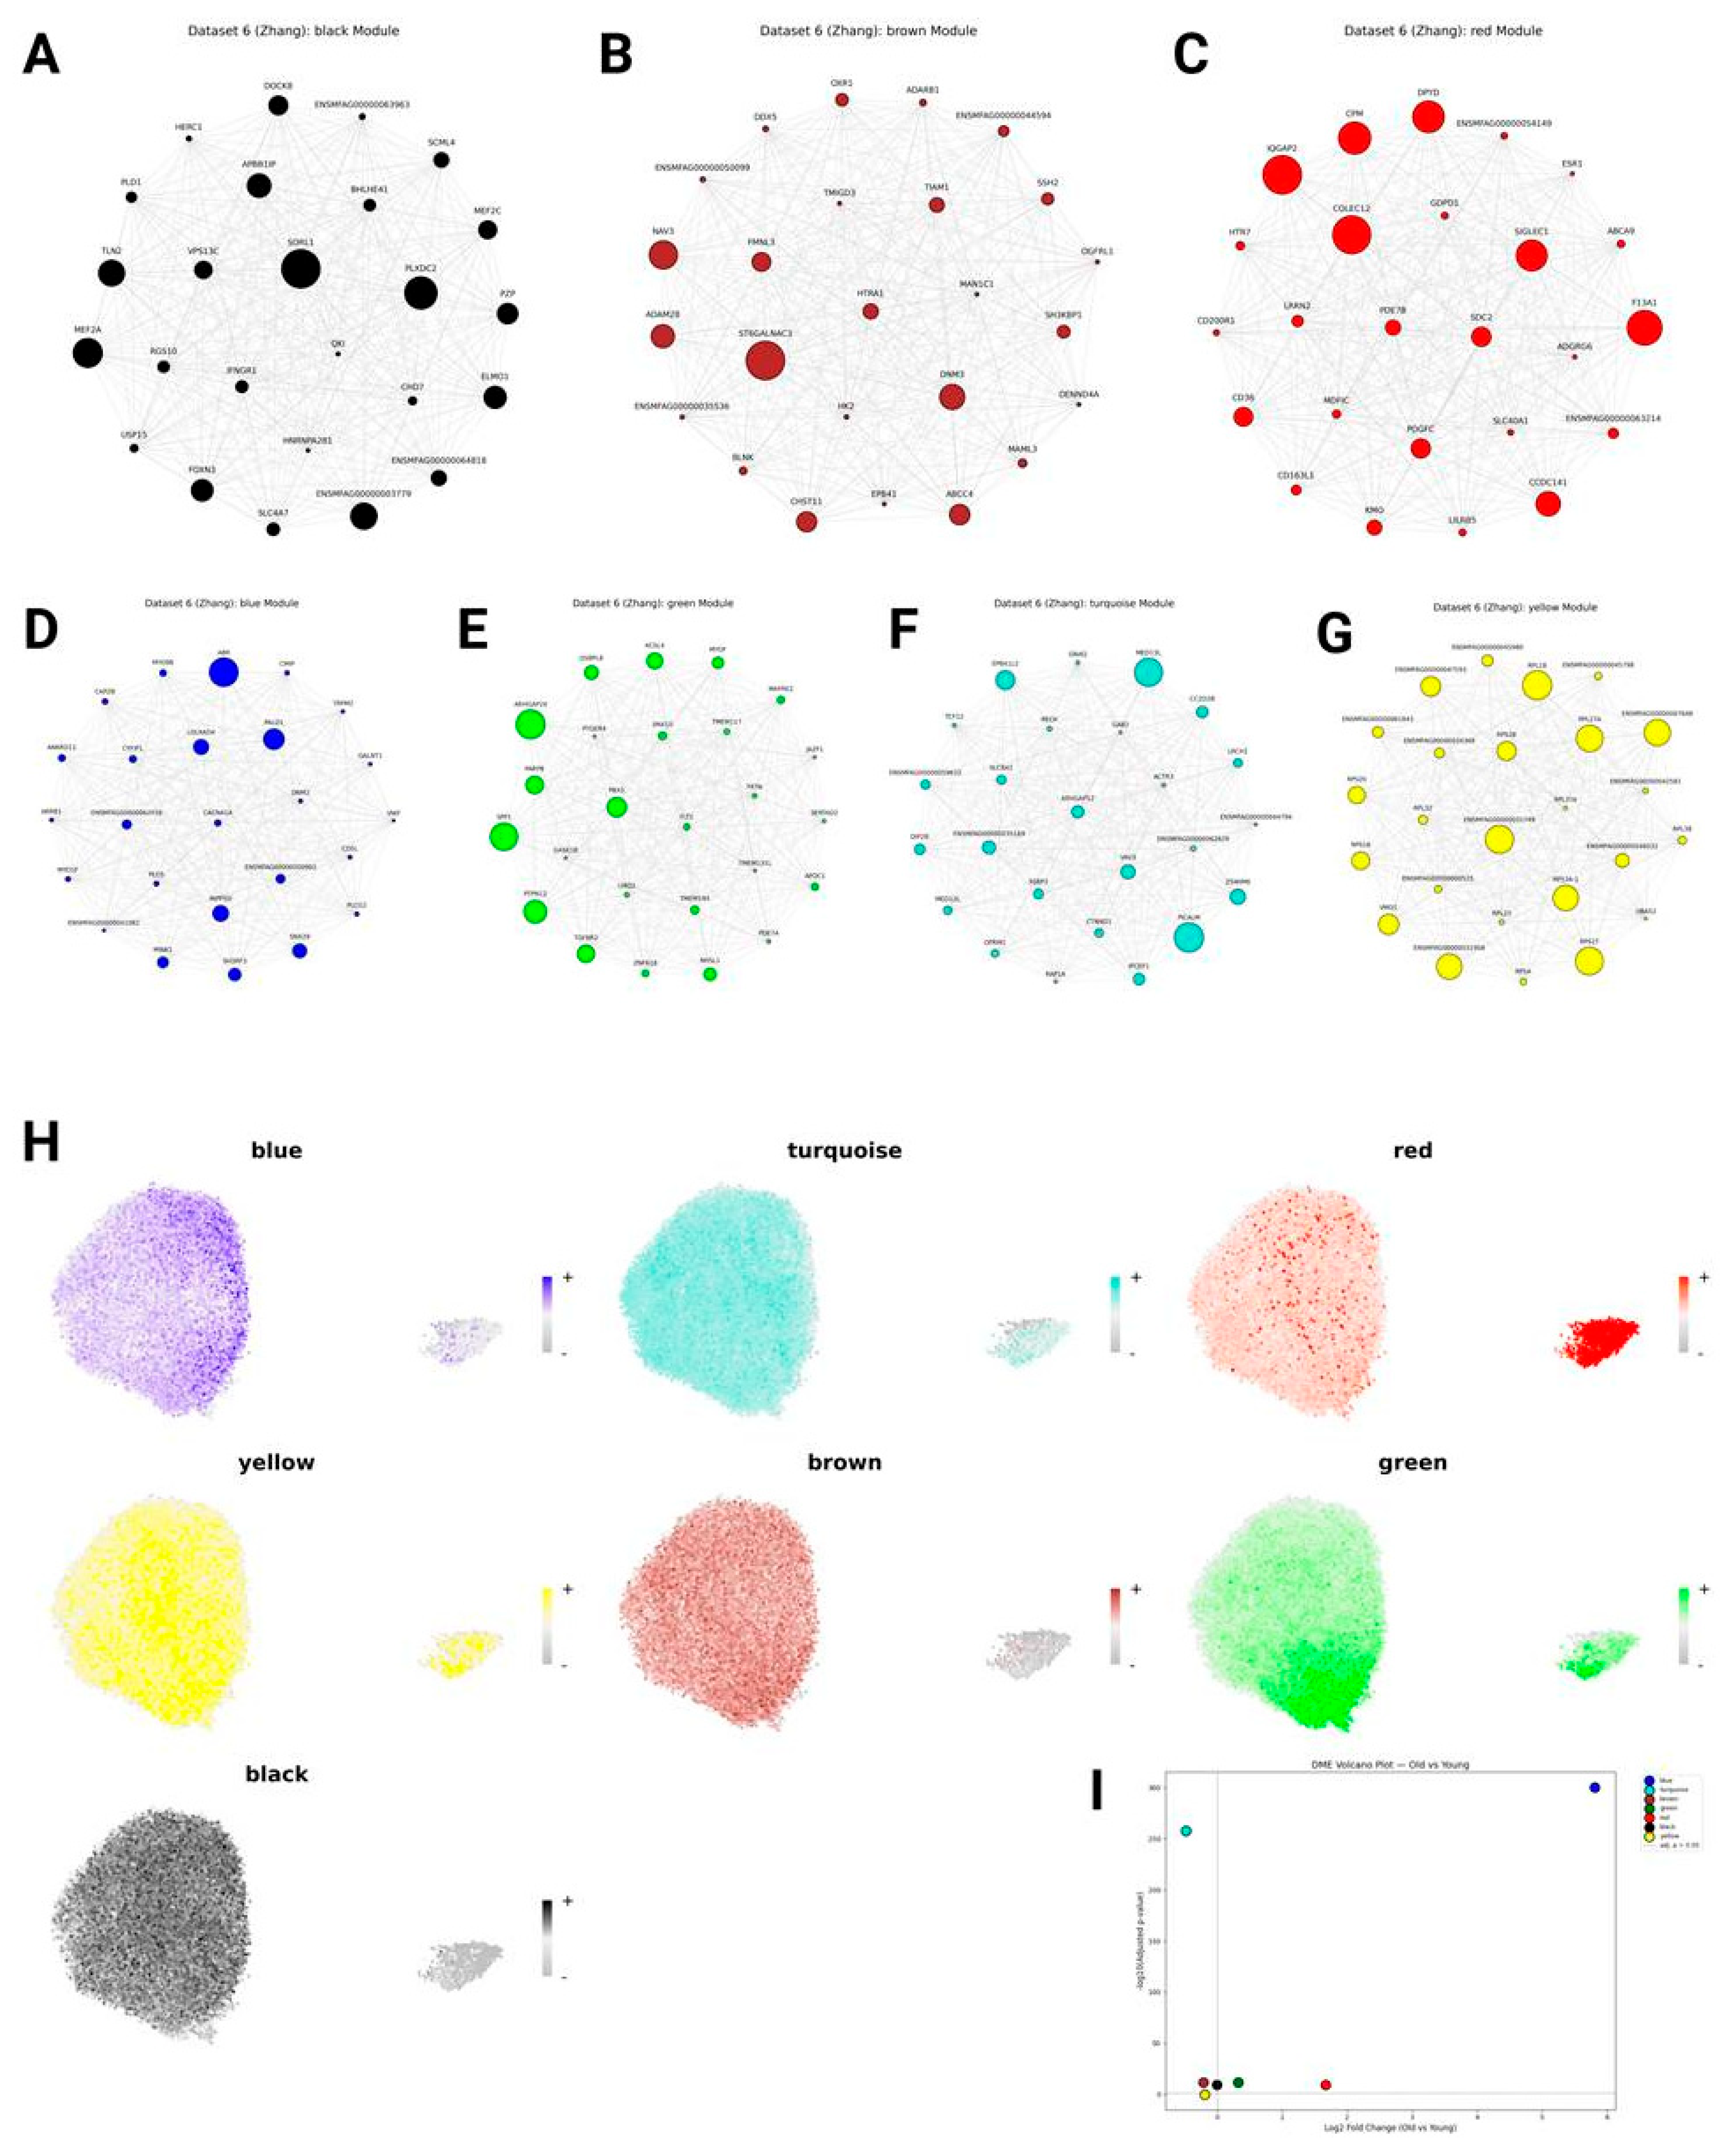
Monkey Modules
I analyzed Dataset 6 for gene coexpression modules and obtained seven.
The most interesting were black and brown modules. First, they were highly restricted to microglial cells and almost absent in macrophages. But the most interesting is that they contain potentially the most evolutionarily conserved (and also microglia-specific, at least in the myeloid lineage) genes: in the black module, these are SORL1 (top-1 hub), MEF2A/C, ELMO1, FOXN3, and DOCK8; the brown module includes ADAM28, ABCC4, and MAML3 — all discussed in the previous section (as well as NAV3, which was the top-4 hub for the Young-enriched brown module in Dataset 4). Both modules are putatively homeostatic, with near-zero change in the black module with aging and significant decline (logFC = -0.21, p-value = 1.93E-12) in the brown module.
The red module is the GPNMB-IQGAP module, here restricted to macrophages, as observed in cluster analysis. Top hub genes are IQGAP2, COLEC12, F13A1, CPM, and DPYD, mixing genes from the original GPNMB+ signature and macrophage markers. GPNMB itself is 35th and putatively less important than in humans. Unlike the number of D6C17 cells, the red module is increased in aged monkeys (logFC = 1.66, p-value = 2.60E-10), concordant with human data.
Blue, green, and turquoise modules are highly relevant to aging. Blue and green increase in aging (logFC = 5.81 and 0.32, p-value = 0.00 and 2.62E-12, respectively), and both have immune properties (e.g., blue has MYO9B and MYO1F; green has SPP1 as its top-2 hub gene); notably, blue is microglia-specific, while green is present in both microglia and macrophages. The turquoise module decreases with aging (logFC = -0.48, p-value = 2.83E-258).
Finally, the yellow module is enriched in ribosomal genes. Here, it shows a non-significant trend toward being youth-specific (p-value = 1.00), so not supporting the human data, but also not conflicting with them.
Figure 13.
Gene coexpression modules in Macaca fascicularis. A-G: modules (A - black, B - brown, C - red, D - blue, E - green, F - turquoise, G - yellow). H: module distribution in UMAP. I: volcano plot showing module enrichment in aging.
Figure 13.
Gene coexpression modules in Macaca fascicularis. A-G: modules (A - black, B - brown, C - red, D - blue, E - green, F - turquoise, G - yellow). H: module distribution in UMAP. I: volcano plot showing module enrichment in aging.
Transcriptional Factor Analysis
I additionally analyzed TF regulation using hdWGCNA output and here discuss how it is organized for some of the most interesting genes (e.g., cluster markers or those from conserved modules).
First, the DPYD–FOXP1 co-occurrence was confirmed: DPYD is a top-3 target of FOXP1, while FOXP1 is the top-1 TF for DPYD, indicating that FOXP1 strongly and directly upregulates DPYD. Interestingly, FOXP2 is antagonistic to FOXP1 and is the strongest suppressor of DPYD expression, suggesting opposing roles for FOXP1 and FOXP2 in regulating microglial activation and homeostasis, respectively.
On the other hand, while FOXP1 upregulates LRRK2 (as its 5th-ranked TF), the strongest activator of LRRK2 is TCF4, whose role in microglia is poorly studied. Moreover, TCF4 and its homolog TCF12 (which appears in 4 out of 5 datasets in modules) are among the top-3 strongest activators of TMEM163, a frequent marker of activated microglia.
GPNMB is strongly upregulated by MITF – in fact, GPNMB is MITF’s top-2 target. This relationship has long been known [37], but notably, MITF is also the top-1 TF for several other genes in this signature (MYO1E, STARD13, KCNMA1). Other signature genes are primarily activated by POU3F1 (IQGAP2, ZNF804A, CPM, for which it is the top-1 TF) and, to a lesser extent, by CEBPA (PTPRG, EYA2), CEBPB (PPARG), and RBPJ (TPRG1). Interestingly, PPARG itself, despite being part of the GPNMB⁺ signature, does not upregulate other genes in the signature. Instead, it is the strongest activator of SPP1 and, at the same time, the strongest inhibitor of TMEM163, further supporting the idea that SPP1 and TMEM163 belong to distinct regulatory programmes.
Genes from the NRG3⁺ and ST18⁺ signatures are mostly upregulated by KLF12 (CADM2, NRXN1, MAGI2), POU3F2 (MAGI2), FOS (NRXN3, CADM2), and EN1 (CADM2, SYT1).
Most genes that appear repeatedly in hdWGCNA-derived modules, such as SORL1, MAML3, DIAPH2, ANKRD44, ITPR2, ADAM28, ABCC4, ATP8B4, FRMD4A, SRGAP2, and AOAH, are either activated or unaffected by key transcription factors with known or proposed homeostatic roles, including MEF2A, MEF2C, FLI1, KLF12, FOXP2, and FOXN3, suggesting their involvement in a homeostatic regulatory network. Moreover, these TFs act as repressors of genes associated with microglial activation, including DPYD, LRRK2, APOE, and GPNMB⁺ signature genes. Notably, MEF2C is the top-1 activator of GRID2, the heterogeneity of which in microglia has been observed in multiple studies.
In contrast, TANC2, which appears in multiple condition- or aging-enriched modules, is downregulated by MEF2A and upregulated by FOXP1 and FOXO1, further supporting its role in activation processes. A similar interpretation may apply to NHSL1 and FMN1, which are also present in old-enriched modules and repressed by MEF2A/MEF2C.
ETV6, also found in old-enriched modules, is upregulated by MEF2C as well as by HIF1A, suggesting a dual regulatory role. ETV6 itself is the strongest activator of ZFAND3, another old-enriched gene. Additionally, the old-enriched SND1 is activated by RBPJ and repressed by KLF12.
More details on these interactions are shown in Figure 14.
Discussion
ST18+ and NRG3+ Microglia: Artifact or Biology?
As I have already said, NRG3+ and particularly ST18+ microglia might be doublets, and nothing in my analysis claims against this. However, several papers suggest that alternative explanations for these clusters might be.
First, the ST18⁺ cluster was first described in 2019 by Schirmer et al. in their Nature article. They identified a cell cluster co-expressing ST18, PLP1, and MBP – markers characteristic of mature, myelinating oligodendrocytes – and proposed that this signature does not reflect endogenous expression by microglia, but rather results from myelin phagocytosis. During this process, microglia not only engulf myelin debris but also internalize oligodendrocyte-derived mRNAs, which remain stable in the cytoplasm and accumulate in the perinuclear space, making them detectable by snRNA-seq. The authors experimentally validated this mechanism by incubating both human- and mouse-derived microglia with rat-derived myelin and subsequently detecting rat-specific MBP and PLP1 transcripts within the microglial cells, thereby providing strong evidence against endogenous expression and supporting phagocytic RNA uptake as the underlying cause [38].
A more recent study published in 2025 has once again identified a distinct microglial state characterized by the co-expression of oligodendrocyte-enriched transcripts: ST18, MBP, and PLP1. The authors provided converging lines of evidence to support the interpretation that this signature reflects myelin phagocytosis rather than endogenous expression or technical artifacts. First, they isolated pure microglia from the cortices of LRRK2-G2019S Parkinson’s disease (PD) mouse models and found significant enrichment of myelin-associated transcripts (MBP, MOBP, and PLP1), consistent with internalized myelin debris. Second, immunohistochemistry on postmortem human cortical tissue revealed colocalization of IBA1⁺ microglia with myelin (MBP) – a pattern markedly more pronounced in dementia cases than in controls. Third, functional assays demonstrated that overexpression of MSR1 (macrophage scavenger receptor 1) in human microglial cells enhanced uptake of pHrodo-labeled myelin, confirming a direct role for MSR1 in myelin phagocytosis. Critically, when comparing AD, dementia with Lewy bodies (DLB), and Parkinson’s disease dementia (PDD) to non-cognitively impaired controls, this ST18⁺/MBP⁺/PLP1⁺ microglial state was consistently enriched across all dementia subtypes, suggesting it represents a shared response to myelin damage in neurodegenerative disease [39].
Compared with my analysis, GO and KEGG enrichment for the respective clusters indeed includes terms such as phagocytosis and autophagy—suggesting that these clusters may arise through these processes. As for disease associations, ST18⁺ microglia does tend to be condition-related in most datasets (except monkeys), although not statistically significant, and thus, my analysis generally supports the relatedness of ST18⁺ microglia to specific conditions, albeit without statistical significance as proof.
As for the NRG3⁺ microglia, a 2024 Nature Medicine article described two populations of PCDH9-high microglia. In this article, the first population was localized in the prefrontal cortex and had pro-inflammatory properties with markers such as PTPRC, ATM, C3, TLR2, SYK, etc. (I did not see a population with the same markers in my analysis), while the second was localized in the hippocampus and expressed markers such as NRG3, NRXN1, GRID1, and GRIK2, and was enriched in synapse-related genes – very similar to my NRG3⁺ microglia. Both subtypes express PCDH9, CADM2, and NRXN3, shared markers also found in the ST18⁺ and NRG3⁺ populations in my data. Notably, the authors not only detected PCDH9 in single-cell data, but also confirmed its expression at the protein level in microglial cells using immunohistochemistry in the cortex of healthy adult individuals, thereby excluding doublet or technical artefact explanations. However, the origin of the other genes (whether they reflect genuine microglial expression or are acquired through phagocytosis) remains underexplored [40]. It seems I have observed the second (hippocampal-like) population, but not restricted to the hippocampus: it appears across multiple brain regions, including the midbrain, prefrontal, temporal, and motor cortex, as well as in the macaque hippocampus.
Another argument “for” the existence of NRG3⁺ microglia comes from the HuMicA article. Although the authors excluded the ST18⁺ cluster, they described Ribo.DAM1 – a microglial state marked by PCDH9, CADM2, KCNIP4, RBFOX1, SYT1, LSAMP, and CNTNAP2, which is highly similar to the NRG3⁺ microglia I observed. I did not detect enrichment in ribosomal genes in my cluster, but mitochondrial markers were present in some datasets as markers, which aligns well with the “KEGG_OXIDATIVE_PHOSPHORYLATION” enrichment reported for Ribo.DAM1 [11].
But probably the most important article first describing NRG3⁺ microglia (in mice) came in 2025: the authors showed that it represents a regenerative state that is nearly absent in controls and is markedly increased after iNSC-exosome treatment. This state sits at the beginning of the differentiation trajectory and is enriched for genes involved in synapse formation, neurite outgrowth, neuronal development, and axon guidance. These microglia interact with neurons via NRXN1–3 → NLGN1 and NRG3 → ERBB4 signaling—and in my data, both NLGN1 and ERBB4 are highly expressed in NRG3⁺ and ST18⁺ microglia [41].
My research in general supports this vision (although without statistical significance): in most datasets, NRG3+ microglia tends to be increased in Control and Young groups.
Moreover, a recent study of anaplastic ependymoma and diffuse midline glioma revealed that astrocytes, oligodendrocytes, and microglia interact with neighboring cells via the NRG3–ERBB4 and PTN–PTPRZ1 ligand–receptor pairs, with NRG3–ERBB4 specifically enriched in ependymoma [42].
Based on all the evidence presented above, I incline to believe that the NRG3⁺ state more likely reflects genuine internal expression by microglia, whereas ST18⁺ clusters are artifacts of myelin phagocytosis, though they nonetheless capture an important biological process and should therefore be retained in future analyses. It would be interesting to calculate the ratio of processed to unprocessed RNA for genes associated with ST18⁺ and NRG3⁺ signatures (with the expectation that, if arising from phagocytosis, they would show abnormally high levels of processed transcripts, particularly when compared to cells that normally express them, such as oligodendrocytes for ST18 – since the RNA originates from the cytoplasm of other cells rather than from the microglial nucleus). Immunohistochemistry should be used to confirm or rule out true internal expression, as was done for PCDH9.
A Brief Inference About Key Genes Regulating Microglia Phenotypes
Here, I will discuss some of the genes I found to be the most interesting in terms of microglia regulation, what is known about them from the other studies (excluding obvious ones such as APOE and GPNMB), and what comes from my research.
DPYD.
DPYD is definitely one of the most important regulators of microglia activation, appearing both as a marker in cluster analysis and within activation-related gene networks, yet its role in microglia is not fully understood. It seems to be positively co-regulated with both GPNMB and LRRK2, and the key question will be whether DPYD’s activity in neurodegeneration represents an adaptive response (like GPNMB) or a maladaptive one (like LRRK2). If the latter, it might be a relevant therapeutic target.
DPYD (dihydropyrimidine dehydrogenase) is an enzyme that converts uracil and thymine into their 5,6-dihydro derivatives – the first step in their catabolism to beta-alanine. It is best studied in cancer, where DPYD also metabolizes 5-fluorouracil (5-FU). Several loss-of-function DPYD variants lead to increased 5-FU toxicity and are clinically relevant for treatment planning [43]. Moreover, DPYD inhibitors, such as gimeracil (which is included in Teysuno), are already used in oncology to enhance 5-FU efficacy [44].
Unfortunately, beyond bulk- and single-cell RNA-seq data (including this study) there is no experimental proof or mechanistic understanding of DPYD’s function in microglia. Even in existing articles, DPYD is mentioned only briefly and not as a central focus. If future experiments or at least computational approaches show that DPYD drives detrimental processes in the brain, this could provide the first rationale for repurposing gimeracil in brain aging and neurodegenerative disease [10,45,46].
SPP1/OPN.
The role of SPP1 (secreted phosphoprotein 1, also known as osteopontin, OPN) is better understood: it is a pro-inflammatory molecule that drives adverse activation signals. It is a secreted cytokine/chemokine that binds to its receptor CD44 and promotes proinflammatory responses, and this has been experimentally confirmed in numerous studies [47,48].
Notably, its role extends beyond microglia. For example, in blood vessels, SPP1–CD44 signaling in smooth muscle cells, fibroblasts, and macrophages drives the progression of atherosclerosis [49]. However, SPP1 signaling is context-dependent: for instance, its activation supports stem cell niche activity in skeletal muscle, where it is beneficial [50].
Anti-SPP1 therapies are currently in development for cancers and chronic inflammatory conditions. However, since SPP1 is not an enzyme, these are not small-molecule inhibitors but rather biologics such as antibodies, RNA aptamers, or siRNAs. This may pose challenges for delivery into brain tissue [51].
Interestingly, in my analysis, SPP1 did not show significant co-expression or association with other well-known microglial programs (such as APOE, GPNMB, or TMEM163), suggesting it may act as a relatively independent player. If the regulatory modules controlling SPP1 expression are further decoded, upstream druggable regulators might be identified.
TMEM163.
TMEM163 represents another relatively independent program driving microglia activation. The TMEM163 gene encodes a transmembrane zinc transporter and is mostly expressed in oligodendrocytes [52]. This transporter is required for myelination, and mutations impairing TMEM163 may cause hypomyelinating leukodystrophy, characterized by altered brain development and elevated cell death [53].
How TMEM163 relates to microglia activation remains elusive. There are currently no drugs targeting TMEM163. The only established links are that TMEM163 is an AD risk gene (by GWAS: [54]) and that high expression of TMEM163 has been observed in multiple studies in inflammatory microglia clusters—including in this study [11,55,56].
TCF4& TCF12.
In my analysis, TCF4 and TCF12 are the top-2 and top-3 TFs activating TMEM163, respectively. Additionally, TCF4 is the top-1 TF for LRRK2, while TCF12 appears in 4 modules across human datasets, mostly enriched in aging or disease. This raises important questions about how these genes are interconnected with microglial function and activation.
Regarding TCF4 (also referred to as E2-2, ITF-2, and SEF-2), studies show that astrocytes, GABAergic, and pyramidal neurons express it, while its expression in microglia is absent or very low [57]. In neurons, TCF4 has a well-established role in memory and synaptic plasticity [58]. It also suppresses inflammation in neural stem cells to support neurogenesis [59].
Like TCF4, TCF12 is primarily studied in neurons and oligodendrocytes, with little data available for microglia. Its deficiency is linked to craniosynostosis [60], while its hyperactivation can drive cancer cell proliferation, including in glioma. Interestingly, inhibition of the TCF12/VSIG4 axis by palbociclib not only reduces proliferation but also blocks M2 polarization in microglia, though the proposed mechanism is glioma-mediated [61].
Thus, the role of TCF4 and TCF12 in microglia, and even their expression, remains unclear. In my data, both show high expression across many clusters, which is unlikely to be an artifact. Further studies are needed to clarify their functional relevance in microglial regulation.
FOXP1.
FOXP1 is an important regulator of microglia physiology. Previous studies have shown that FOXP1 acts as a repressor of immune-related genes in the CNS, although not specifically characterized in microglia [62].
More recently, FOXP1 was identified as a transcriptional activator of SORL1 (which aligns with my TF network analysis, where FOXP1 was predicted to upregulate SORL1 expression) [63].
On the other hand, FOXP1 was found co-expressed with LRRK2 in the inflammatory II (MG8) microglia phenotype in the Kellis and Tsai study [9]. In my analysis, FOXP1 consistently co-occurs with DPYD and LRRK2 in several activation-related clusters and modules. Furthermore, TF inference predicts that FOXP1 directly activates DPYD and other pro-activation genes.
FOXP2& FOXN3
FOXP2 and FOXN3 are studied less than FOXP1, including in microglia. But in general, my data supports the vision that these genes are mostly homeostatic, involved in healthy modules, and sometimes antagonize FOXP1 (e.g. with DPYD).
Studies show that FOXP2 mRNA decreased in Pick’s disease and FTLD [64]. FOXP2-regulated network is multi-layered, and many of the respective genes are related to neurodegenerative diseases [65]. A recent study has shown that FOXP2 expression in microglia is almost absent in mice and macaques and is a human feature [66].
MEF2A& MEF2C.
MEF2A and MEF2C are transcription factors both expressed in microglia. They interact with PU.1 to help establish a cell-type-specific transcriptional profile by shaping enhancer activity [67].
Both MEF2A and MEF2C play critical roles in suppressing microglial activation and maintaining homeostatic states. Reduced expression or impaired function of these factors is observed in aging and neurodegenerative conditions. Notably, MEF2C deficiency leads to a hyperinflammatory microglial phenotype [68,69,70].
This aligns fully with my observations: MEF2A/C are strong activators of homeostatic genes and repressors of activation-related ones. Their presence in multiple conserved, putatively homeostatic modules across datasets further supports their central role in preserving microglial quiescence.
SORL1.
SORL1 encodes sortilin-related receptor 1 protein (SORLA), which sorts proteins, including lysosomal enzymes. Its activity is critically important for lysosomal function, and SORL1 is highly expressed in microglia [71]. There are AD-related SORL1 variants with loss of function, which lead to sporadic Alzheimer’s disease [72].
SORL1 is also responsible for sorting CD14, a proinflammatory molecule, and for lysosomal exocytosis, so it can positively regulate inflammatory responses. But in the context of neurodegeneration, SORL1 is mostly a protective factor: its dysfunction exacerbates disease [73,74].
This supports my anticipation that most SORL1-driven modules are primarily homeostatic.
MAML3.
Mastermind-like 3 (MAML3) is a transcriptional coactivator involved in key signaling pathways, including Notch and WNT, where it interacts with RBPJ and β-catenin, respectively. Its overexpression has been linked to hyperproliferation in certain cancers [75,76].
There is very little data on MAML3 in microglia or neurodegenerative contexts. One study reported that MAML3 is downregulated in reactive microglia in the hippocampus, which supports my observation that MAML3-associated gene modules are homeostatic and tend to decline in disease or aging conditions [77].
ADAM28.
ADAM28 (A disintegrin and metalloproteinase 28) encodes a metalloproteinase. It exists in both membrane-bound and soluble forms, and is able to activate TNF-α via partial proteolysis, and thus is mostly a pro-inflammatory molecule [78,79]. This makes particularly interesting the fact that ADAM28 was found in many health-related modules.
ABCC4.
ABCC4 (ATP-binding cassette subfamily C member 4) encodes a transporter protein. It may be involved in regulating the distribution of proinflammatory molecules such as eicosanoids, although information about its function in microglia remains scarce [80].
ELMO1.
ELMO1 (Engulfment and Cell Motility 1) is a protein important in phagocytosis and cell migration. It is a part of ELMO1-DOCK180 complex, which is important for Rac1 activity and cytoskeleton reorganization [81,82]. It was shown to also regulate inflammation [83]. Additionally, ELMO1 is important in regulating myelination and neuronal number [84].
TANC2.
TANC2 (Tetratricopeptide Repeat, Ankyrin Repeat and Coiled-Coil Containing 2) encodes a post-synaptic scaffold protein primarily functioning in neurons, where it plays a role in dendritic spine development. Mutations in TANC2 are associated with neurodevelopmental disorders [85].
Data on its role in microglia is extremely limited. However, in a recent study, a neuron-associated microglial cluster was described that expresses high levels of TANC2 [86].
It is very interesting as I found TANC2 within several activation-related modules and being negatively regulated by homeostatic state-driving TFs, but these data is highly preliminary.
FMN1.
FMN1 (Formin 1) is a cytoskeletal regulator that interacts with actin and plays a key role in cell shape changes and migration. In cancer, such as glioblastoma, it contributes to metastasis, and in T cells, it supports trafficking, and it is long known as a critical component of macrophage podosomes [87,88,89].
Its role in neurodegeneration remains poorly studied. In my analysis, FMN1 appeared in multiple clusters, primarily those associated with aging or disease conditions. This aligns with its function in microglial activation and motility. However, whether this increased activity is beneficial or detrimental in the context of neurodegeneration remains unclear and represents an important question for future functional studies.
NHSL1.
NHSL1 (Nance-Horan Syndrome-like 1), intriguingly, is a negative regulator of cytoskeleton motility via suppression of Scar/WAVE and Arp2/3 activity [90], yet it appeared in mostly activation-related modules and is suppressed by MEF2A/C, similar to FMN1.
There is little data on its role in microglia. In a recent study, an NHSL1-expressing cluster was annotated as homeostatic [91], which may conflict with my preliminary inference.
ETV6.
ETV6 (ETS variant transcription factor 6) is best known as a tumor suppressor, although it can act as an oncogene following chromosomal translocation. It also plays a key role in hematopoiesis [92].
Recent studies suggest a potential role for ETV6 in the immune system. For example, ETV6 promotes monocyte differentiation into dendritic cells and suppresses their differentiation into macrophages [93]. Moreover, ETV6 levels are elevated in aortic macrophages in atherosclerotic mice, and its repression reduces LDL-related inflammation [94]. This supports my observation that both ETV6 and its putative downstream target ZFAND3 are primarily involved in aging-related gene modules.
To summarize, there is only a very limited number of genes (including P2RY12, SORL1, TREM2, APOE, GPNMB, SPP1, C1QA/B/C), the function of which in microglia is well understood. The function of other genes, starting from DPYD and TMEM163 and including almost all module-composing genes mentioned in this study, remains elusive. Their understanding is critical for next generation anti-neurodegenerative therapy development.
Conclusions
In this study, I have identified several interesting mechanisms related to microglia activation and heterogeneity.
First, I found human homeostatic clusters to be highly heterogeneous in expression of GRID2 and CCDC26, although the functional meaning of this remains underexplored.
I have revealed that GPNMB⁺ subpopulation expansion is a common mechanism in aging and neurodegeneration, although this has been described before (for MG4 and Lipo.DAM). This response is adaptive by itself and thus not very interesting in terms of therapy development. Another intriguing detail was that GPNMB expression is highly specific to perivascular macrophages in monkeys, suggesting that its activity in microglia might be a human-specific trait, which requires further examination.
I suppose that assignment of ribosomal genes and C1Q-expressing microglia as “dystrophic” and “Ribo.DAM2” is misleading, as these clusters tend to be increased in youth, while the respective gene networks are significantly more active in health, suggesting that it is a healthy, metabolically active state, which is partially lost during aging.
Very interesting and underexplored are the ST18⁺ and NRG3⁺ subpopulations. Some genes may result from myelin phagocytosis, such as ST18 – and although these populations tend to be increased in neurodegenerations, it is a symptom of these diseases, not its mechanism, but they must be included in further analysis. As for NRG3⁺, it likely represents at least part of the PCDH9-high population, the existence of which has been proven. It will be interesting to calculate the ratio of processed and unprocessed forms for each gene and compare it to intrinsically expressing populations (such as oligodendrocytes for ST18) to estimate which genes are most likely to get into microglial cells as a result of phagocytosis. It will be intriguing to do this also for SNAP25, PEG10, and other neuron-derived genes – I saw these clusters, and although they are highly likely to be doublets or contamination, an increased percentage of processed transcripts may indicate neuronal phagocytosis, which would be important to consider in the context of neurodegeneration.
Going to gene coexpression networks, I identified multiple putative regulators of microglia homeostasis and activation. Unexpectedly, there is little or no information about most of them, and even the expression of many in microglia has not been reported. Understanding how these gene networks function and what role each gene plays is critical for developing next-generation therapies against brain aging and neurodegeneration. For instance, we can correlate the expression of these putative regulators with features such as inflammatory phenotype, lysosomal activity, or senescence across cells or clusters, or build differentiation trajectories to uncover how their expression changes over pseudotime.
The most interesting part would be to identify potential druggable targets. One candidate is DPYD, as it is clearly involved in numerous activation modules, and the DPYD inhibitor gimeracil is already in clinical use, making repurposing possible. However, it is critically important to establish whether its activation is adaptive or maladaptive. It is also highly promising to decode the regulatory networks behind SPP1 and TMEM163 to find druggable nodes there.
This all is the subject of future work.
Supplementary Materials
The following supporting information can be downloaded at the website of this paper posted on Preprints.org. Supplementary Table S1: Top-20 marker genes for each cluster (Datasets 1–6). Supplementary Table S2: Top-10 Gene Ontology (GO) enrichment terms for each cluster (Datasets 1–6). Supplementary Table S3: Top-10 KEGG enrichment terms for each cluster (Datasets 1–6). Supplementary Table S4: Results of quasi-binomial regression for cluster–condition associations (Datasets 1–6). Supplementary Table S5: Top-25 hub genes for each hdWGCNA-derived module (Datasets 1–6). Supplementary Table S6: Top-3 GO annotations per module (Datasets 1–5). Supplementary Table S7: Results of module–condition association tests (Datasets 1–6).
Acknowledgments
I would like to thank my research supervisor Ekaterina Khrameeva for managing my project, and my colleague Ilya Pletnev for advice on snRNA-seq data analysis.
References
- Hou, Yujun, Xiuli Dan, Mansi Babbar, Yong Wei, Steen G. Hasselbalch, Deborah L. Croteau, and Vilhelm A. Bohr. Ageing as a risk factor for neurodegenerative disease. Nature reviews neurology 2019, 15, 565–581. [Google Scholar] [CrossRef]
- Wilson, David M. , Mark R. Cookson, Ludo Van Den Bosch, Henrik Zetterberg, David M. Holtzman, and Ilse Dewachter. Hallmarks of neurodegenerative diseases. Cell 2023, 186, 693–714. [Google Scholar]
- Gao, Chao, Jingwen Jiang, Yuyan Tan, and Shengdi Chen. Microglia in neurodegenerative diseases: mechanism and potential therapeutic targets. Signal transduction and targeted therapy 2023, 8, 359. [Google Scholar] [CrossRef]
- Deczkowska, Aleksandra, Hadas Keren-Shaul, Assaf Weiner, Marco Colonna, Michal Schwartz, and Ido Amit. Disease-associated microglia: a universal immune sensor of neurodegeneration. Cell 2018, 173, 1073–1081. [Google Scholar] [CrossRef]
- Zhou, Yingyue, Wilbur M. Song, Prabhakar S. Andhey, Amanda Swain, Tyler Levy, Kelly R. Miller, Pietro L. Poliani et al. Human and mouse single-nucleus transcriptomics reveal TREM2-dependent and TREM2-independent cellular responses in Alzheimer’s disease. Nature medicine 2020, 26, 131–142. [Google Scholar] [CrossRef]
- Satoh, Jun-ichi, Yoshihiro Kino, Motoaki Yanaizu, Tsuyoshi Ishida, and Yuko Saito. Microglia express GPNMB in the brains of Alzheimer's disease and Nasu-Hakola disease. Intractable & Rare Diseases Research 2019, 8, 120–128. [Google Scholar] [CrossRef]
- Saade, Marina, Giovanna Araujo de Souza, Cristoforo Scavone, and Paula Fernanda Kinoshita. The role of GPNMB in inflammation. Frontiers in immunology 2021, 12, 674739. [Google Scholar] [CrossRef] [PubMed]
- Liu, Mei, Jianping Zhu, Jiawei Zheng, Xuan Han, Lijuan Jiang, Xiangzhen Tong, Yue Ke et al. GPNMB and ATP6V1A interact to mediate microglia phagocytosis of multiple types of pathological particles. Cell Reports 44, (2025).
- Sun, Na, Matheus B. Victor, Yongjin P. Park, Xushen Xiong, Aine Ni Scannail, Noelle Leary, Shaniah Prosper et al. Human microglial state dynamics in Alzheimer’s disease progression. Cell 2023, 186, 4386–4403. [Google Scholar]
- Prater, Katherine E. , Kevin J. Green, Sainath Mamde, Wei Sun, Alexandra Cochoit, Carole L. Smith, Kenneth L. Chiou et al. Human microglia show unique transcriptional changes in Alzheimer’s disease. Nature Aging 2023, 3, 894–907. [Google Scholar] [CrossRef] [PubMed]
- Martins-Ferreira, Ricardo, Josep Calafell-Segura, Bárbara Leal, Javier Rodríguez-Ubreva, Elena Martínez-Saez, Elisabetta Mereu, Paulo Pinho E Costa, Ariadna Laguna, and Esteban Ballestar. The Human Microglia Atlas (HuMicA) unravels changes in disease-associated microglia subsets across neurodegenerative conditions. Nature Communications 2025, 16, 739. [Google Scholar] [CrossRef]
- Martirosyan, Araks, Rizwan Ansari, Francisco Pestana, Katja Hebestreit, Hayk Gasparyan, Razmik Aleksanyan, Silvia Hnatova et al. Unravelling cell type-specific responses to Parkinson’s Disease at single cell resolution. Molecular neurodegeneration 2024, 19, 1–24. [Google Scholar]
- Lau, Shun-Fat, Han Cao, Amy KY Fu, and Nancy Y. Ip. Single-nucleus transcriptome analysis reveals dysregulation of angiogenic endothelial cells and neuroprotective glia in Alzheimer’s disease. Proceedings of the National Academy of Sciences 2020, 117, 25800–25809. [Google Scholar] [CrossRef]
- Pineda, S. Sebastian, Hyeseung Lee, Maria J. Ulloa-Navas, Raleigh M. Linville, Francisco J. Garcia, Kyriakitsa Galani, Erica Engelberg-Cook et al. Single-cell dissection of the human motor and prefrontal cortices in ALS and FTLD. Cell 2024, 187, 1971–1989. [Google Scholar] [CrossRef]
- Muralidharan, Chandramouli, Enikő Zakar-Polyák, Anita Adami, Anna A. Abbas, Yogita Sharma, Raquel Garza, Jenny G. Johansson et al. Human Brain Cell-Type-Specific Aging Clocks Based on Single-Nuclei Transcriptomics. Advanced Science 2025, e06109.
- Li, Zonghua, Yuka A. Martens, Yingxue Ren, Yunjung Jin, Hiroaki Sekiya, Sydney V. Doss, Naomi Kouri et al. APOE genotype determines cell-type-specific pathological landscape of Alzheimer’s disease. Neuron 2025, 113, 1380–1397. [Google Scholar] [CrossRef] [PubMed]
- Zhang, Hui, Jiaming Li, Jie Ren, Shuhui Sun, Shuai Ma, Weiqi Zhang, Yang Yu et al. Single-nucleus transcriptomic landscape of primate hippocampal aging. Protein & Cell 2021, 12, 695–716. [Google Scholar] [CrossRef]
- Wolf, F. Alexander, Philipp Angerer, and Fabian J. Theis. SCANPY: large-scale single-cell gene expression data analysis. Genome biology 2018, 19, 15. [Google Scholar] [CrossRef]
- Wolock, Samuel L. , Romain Lopez, and Allon M. Klein. Scrublet: computational identification of cell doublets in single-cell transcriptomic data. Cell systems 2019, 8, 281–291. [Google Scholar] [CrossRef]
- Domínguez Conde, C. , Chao Xu, Louie B. Jarvis, Daniel B. Rainbow, Sara B. Wells, Tamir Gomes, S. K. Howlett et al. Cross-tissue immune cell analysis reveals tissue-specific features in humans. Science 2022, 376, eabl5197. [Google Scholar]
- Xu, Chuan, Martin Prete, Simone Webb, Laura Jardine, Benjamin J. Stewart, Regina Hoo, Peng He, Kerstin B. Meyer, and Sarah A. Teichmann. Automatic cell-type harmonization and integration across Human Cell Atlas datasets. Cell 2023, 186, 5876–5891. [Google Scholar] [CrossRef] [PubMed]
- Hafemeister, Christoph, and Rahul Satija. Normalization and variance stabilization of single-cell RNA-seq data using regularized negative binomial regression. Genome biology 2019, 20, 296. [Google Scholar]
- Polański, Krzysztof, Matthew D. Young, Zhichao Miao, Kerstin B. Meyer, Sarah A. Teichmann, and Jong-Eun Park. BBKNN: fast batch alignment of single cell transcriptomes. Bioinformatics 2020, 36, 964–965. [Google Scholar] [CrossRef] [PubMed]
- Traag, Vincent A. , Ludo Waltman, and Nees Jan Van Eck. From Louvain to Leiden: guaranteeing well-connected communities. Scientific reports 2019, 9, 1–12. [Google Scholar]
- McInnes, Leland, John Healy, and James Melville. Umap: Uniform manifold approximation and projection for dimension reduction. arXiv preprint 2018, arXiv:1802.03426.
- Wu, Tianzhi, Erqiang Hu, Shuangbin Xu, Meijun Chen, Pingfan Guo, Zehan Dai, Tingze Feng et al. clusterProfiler 4.0: A universal enrichment tool for interpreting omics data. The innovation 2021, 2.
- Benjamini, Yoav, and Yosef Hochberg. Controlling the false discovery rate: a practical and powerful approach to multiple testing. Journal of the Royal statistical society: series B (Methodological) 1995, 57, 289–300. [Google Scholar] [CrossRef]
- Muzellec, Boris, Maria Teleńczuk, Vincent Cabeli, and Mathieu Andreux. PyDESeq2: a python package for bulk RNA-seq differential expression analysis. Bioinformatics 2023, 39, btad547. [Google Scholar]
- Morabito, Samuel, Fairlie Reese, Negin Rahimzadeh, Emily Miyoshi, and Vivek Swarup. hdWGCNA identifies co-expression networks in high-dimensional transcriptomics data. Cell reports methods 2023, 3.
- Childs, Jessica E., Samuel Morabito, Sudeshna Das, Caterina Santelli, Victoria Pham, Kelly Kusche, Vanessa Alizo Vera et al. Relapse to cocaine seeking is regulated by medial habenula NR4A2/NURR1 in mice. Cell reports 43, (2024).
- Huang, Shengzhu, Chenqi Zhang, Xing Xie, Yuanyuan Zhu, Qiong Song, Li Ye, and Yanling Hu. GRID2 aberration leads to disturbance in neuroactive ligand-receptor interactions via changes to the species richness and composition of gut microbes. Biochemical and Biophysical Research Communications 2022, 631, 9–17. [Google Scholar] [CrossRef]
- Vernet-der Garabedian, Béatrice, Paul Derer, Yannick Bailly, and Jean Mariani. Innate immunity in the Grid2 Lc/+ mouse model of cerebellar neurodegeneration: glial CD95/CD95L plays a non-apoptotic role in persistent neuron loss-associated inflammatory reactions in the cerebellum. Journal of Neuroinflammation 2013, 10, 829. [Google Scholar] [CrossRef]
- Gerrits, Emma, Nieske Brouwer, Susanne M. Kooistra, Maya E. Woodbury, Yannick Vermeiren, Mirjam Lambourne, Jan Mulder et al. Distinct amyloid-β and tau-associated microglia profiles in Alzheimer’s disease. Acta neuropathologica 2021, 141, 681–696. [Google Scholar] [CrossRef]
- Tanaka, Yuka, Atsuhiko Ishida, Hironori Harada, and Tetsuo Hirano. Long Noncoding RNA CCDC26 Interacts With Vimentin, HNRNPC, CBX1, and CBX5 Proteins in Multiple Intracellular Compartments of Myeloid Leukemia Cells. Genes to Cells 2025, 30, e70034. [Google Scholar] [CrossRef]
- Christodoulou, Christiana C. , Anna Onisiforou, Panos Zanos, and Eleni Zamba Papanicolaou. Unraveling the transcriptomic signatures of Parkinson’s disease and major depression using single-cell and bulk data. Frontiers in Aging Neuroscience 2023, 15, 1273855. [Google Scholar] [CrossRef] [PubMed]
- Neuron23. Neuron23. Accessed , 2025. https://neuron23.com/neuron23-announces-96-5-million-series-d-financing-and-first-patient-dosed-in-global-phase-2-neulark-clinical%20-trial-of-neu-411-for-early-parkinsons-disease/. 28 October.
- Gutknecht, Michael, Julian Geiger, Simone Joas, Daniela Dörfel, Helmut R. Salih, Martin R. Müller, Frank Grünebach, and Susanne M. Rittig. The transcription factor MITF is a critical regulator of GPNMB expression in dendritic cells. Cell Communication and Signaling 2015, 13, 19. [Google Scholar] [CrossRef]
- Schirmer, Lucas, Dmitry Velmeshev, Staffan Holmqvist, Max Kaufmann, Sebastian Werneburg, Diane Jung, Stephanie Vistnes et al. Neuronal vulnerability and multilineage diversity in multiple sclerosis. Nature 2019, 573, 75–82. [Google Scholar] [CrossRef]
- Chia, Sook-Yoong, Mengwei Li, Zhihong Li, Haitao Tu, Jolene Wei Ling Lee, Lifeng Qiu, Jingjing Ling et al. Single-nucleus transcriptomics reveals a distinct microglial state and increased MSR1-mediated phagocytosis as common features across dementia subtypes. Genome medicine 2025, 17, 92. [Google Scholar] [CrossRef]
- Chen, Xinyue, Yin Huang, Liangfeng Huang, Ziliang Huang, Zhao-Zhe Hao, Lahong Xu, Nana Xu et al. A brain cell atlas integrating single-cell transcriptomes across human brain regions. Nature medicine 2024, 30, 2679–2691. [Google Scholar] [CrossRef]
- Li, Jiaojiao, Maoxiang Xu, Boyu Cai, Xiangyu Li, Zhanping Liang, Xiaohuan Xia, Haitao Zhang, Zhiwen Zhang, Fei Tan, and Jialin Charlie Zheng. Clinically Inspired Multimodal Treatment Using Induced Neural Stem Cells-Derived Exosomes Promotes Recovery of Traumatic Brain Injury through Microglial Modulation. Advanced Science 2025, e08574.
- Zang, Dongdong, Zilong Dong, Yuecheng Liu, and Qian Chen. Single-cell RNA sequencing of anaplastic ependymoma and H3K27M-mutant diffuse midline glioma. BMC neurology 2024, 24, 74. [Google Scholar]
- Sharma, Bhavina B. , Karan Rai, Heather Blunt, Wenyan Zhao, Tor D. Tosteson, and Gabriel A. Brooks. Pathogenic DPYD variants and treatment-related mortality in patients receiving fluoropyrimidine chemotherapy: a systematic review and meta-analysis. The Oncologist 2021, 26, 1008–1016. [Google Scholar] [CrossRef] [PubMed]
- “Teysuno | European Medicines Agency (EMA),” , 2018. https://www.ema.europa.eu/en/medicines/human/EPAR/teysuno. 7 March.
- Guvenek, Aysegul, Neelroop Parikshak, Daria Zamolodchikov, Sahar Gelfman, Arden Moscati, Lee Dobbyn, Eli Stahl, Alan Shuldiner, and Giovanni Coppola. Transcriptional profiling in microglia across physiological and pathological states identifies a transcriptional module associated with neurodegeneration. Communications Biology 2024, 7, 1168. [Google Scholar] [CrossRef]
- Mao, Meng, Xiwen Ma, Xiaochuan Wang, and Jianping Ye. Microglial APOE4 promotes neuron degeneration in Alzheimer's disease through inhibition of lipid droplet autophagy. Acta Pharmaceutica Sinica. B 2024, 15, 657. [Google Scholar]
- Lan, Yangning, Xiaoxuan Zhang, Shaorui Liu, Chen Guo, Yuxiao Jin, Hui Li, Linyixiao Wang et al. Fate mapping of Spp1 expression reveals age-dependent plasticity of disease-associated microglia-like cells after brain injury. Immunity 2024, 57, 349–363. [Google Scholar] [CrossRef] [PubMed]
- Lei, Shizhen, Mang Hu, and Zhongtao Wei. Single-cell sequencing reveals an important role of SPP1 and microglial activation in age-related macular degeneration. Frontiers in Cellular Neuroscience 2024, 17, 1322451. [Google Scholar] [CrossRef] [PubMed]
- Cheng, Jun, Hong Wu, Cheng Xie, Yangyan He, Rong Mou, Hongkun Zhang, Yan Yang, and Qingbo Xu. Single-cell mapping of large and small arteries during hypertensive aging. The Journals of Gerontology: Series A 2024, 79, glad188. [Google Scholar]
- Liu, Ling, Soochi Kim, Matthew T. Buckley, Jaime M. Reyes, Jengmin Kang, Lei Tian, Mingqiang Wang et al. Exercise reprograms the inflammatory landscape of multiple stem cell compartments during mammalian aging. Cell stem cell 2023, 30, 689–705. [Google Scholar] [CrossRef]
- Klement, John D. , Dakota B. Poschel, Chunwan Lu, Alyssa D. Merting, Dafeng Yang, Priscilla S. Redd, and Kebin Liu. Osteopontin blockade immunotherapy increases cytotoxic T lymphocyte lytic activity and suppresses colon tumor progression. Cancers 2021, 13, 1006. [Google Scholar] [CrossRef]
- Styrpejko, Daniel J. , and Math P. Cuajungco. Transmembrane 163 (TMEM163) protein: a new member of the zinc efflux transporter family. Biomedicines 2021, 9, 220. [Google Scholar]
- Do Rosario, Michelle C. , Guillermo Rodriguez Bey, Bruce Nmezi, Fang Liu, Talia Oranburg, Ana SA Cohen, Keith A. Coffman et al. Variants in the zinc transporter TMEM163 cause a hypomyelinating leukodystrophy. Brain 2022, 145, 4202–4209. [Google Scholar]
- Schwartzentruber, Jeremy, Sarah Cooper, Jimmy Z. Liu, Inigo Barrio-Hernandez, Erica Bello, Natsuhiko Kumasaka, Adam MH Young et al. Genome-wide meta-analysis, fine-mapping and integrative prioritization implicate new Alzheimer’s disease risk genes. Nature genetics 2021, 53, 392–402. [Google Scholar] [CrossRef]
- Brase, Logan, Shih-Feng You, Ricardo D’Oliveira Albanus, Jorge L. Del-Aguila, Yaoyi Dai, Brenna C. Novotny, Carolina Soriano-Tarraga et al. Single-nucleus RNA-sequencing of autosomal dominant Alzheimer disease and risk variant carriers. Nature communications 2023, 14, 2314. [Google Scholar] [CrossRef]
- Lee, Donghoon, James M. Vicari, Christian Porras, Collin Spencer, Milos Pjanic, Xinyi Wang, Seon Kinrot et al. Plasticity of human microglia and brain perivascular macrophages in aging and Alzheimer’s disease. medRxiv 2024.
- Kim, Hyojin, Noah C. Berens, Nicole E. Ochandarena, and Benjamin D. Philpot. Region and cell type distribution of TCF4 in the postnatal mouse brain. Frontiers in neuroanatomy 2020, 14, 42. [Google Scholar] [CrossRef] [PubMed]
- Kennedy, Andrew J. , Elizabeth J. Rahn, Brynna S. Paulukaitis, Katherine E. Savell, Holly B. Kordasiewicz, Jing Wang, John W. Lewis et al. Tcf4 regulates synaptic plasticity, DNA methylation, and memory function. Cell reports 2016, 16, 2666–2685. [Google Scholar]
- Shariq, Mohammad, Vinaya Sahasrabuddhe, Sreevatsan Krishna, Swathi Radha, null Nruthyathi, Ravishankara Bellampalli, Anukriti Dwivedi et al. Adult neural stem cells have latent inflammatory potential that is kept suppressed by Tcf4 to facilitate adult neurogenesis. Science Advances 2021, 7, eabf5606. [Google Scholar] [CrossRef]
- Sharma, Vikram P. , Aimée L. Fenwick, Mia S. Brockop, Simon J. McGowan, Jacqueline AC Goos, A. Jeannette M. Hoogeboom, Angela F. Brady et al. Mutations of TCF12, encoding a basic-helix-loop-helix partner of TWIST1, are a frequent cause of coronal craniosynostosis. The Lancet 2013, 381, S114. [Google Scholar] [CrossRef]
- Li, Chuankun, Ruichun Li, Yuan Wang, and Haitao Jiang. Inhibition of the TCF12/VSIG4 axis by palbociclib diminishes the proliferation and migration of glioma cells and decreases the M2 polarization of glioma-associated microglia. Drug Development Research 2024, 85, e22230. [Google Scholar] [CrossRef] [PubMed]
- Tang, Bin, Kristina Becanovic, Paula A. Desplats, Brian Spencer, Austin M. Hill, Colum Connolly, Eliezer Masliah, Blair R. Leavitt, and Elizabeth A. Thomas. Forkhead box protein p1 is a transcriptional repressor of immune signaling in the CNS: implications for transcriptional dysregulation in Huntington disease. Human molecular genetics 2012, 21, 3097–3111. [Google Scholar]
- Fu, Xiaofeng, Shuiyue Quan, Wenping Liang, Yu Li, Huimin Cai, Ziye Ren, Yinghao Xu, Zhe Wang, and Longfei Jia. FOXP1 is a Transcription Factor for the Alzheimer's Disease Risk Gene SORL1. Journal of Neurochemistry 2025, 169, e70011. [Google Scholar] [CrossRef]
- López-González, Irene, Andre Palmeira, Ester Aso, Margarita Carmona, Liana Fernandez, and Isidro Ferrer. FOXP2 expression in frontotemporal lobar degeneration-Tau. Journal of Alzheimer’s Disease 2016, 54, 471–475. [Google Scholar] [CrossRef]
- Oswald, Franz, Patricia Klöble, André Ruland, David Rosenkranz, Bastian Hinz, Falk Butter, Sanja Ramljak, Ulrich Zechner, and Holger Herlyn. The FOXP2-driven network in developmental disorders and neurodegeneration. Frontiers in cellular neuroscience 2017, 11, 212. [Google Scholar] [CrossRef] [PubMed]
- Tang, Lei, Nana Xu, Mengyao Huang, Wei Yi, Xuan Sang, Mingting Shao, Ye Li et al. A primate nigrostriatal atlas of neuronal vulnerability and resilience in a model of Parkinson’s disease. Nature Communications 2023, 14, 7497. [Google Scholar] [CrossRef]
- Butovsky, Oleg, and Howard L. Weiner. Microglial signatures and their role in health and disease. Nature Reviews Neuroscience 2018, 19, 622–635. [Google Scholar]
- Nguyen, Celina, Emily H. Broersma, Anna S. Warden, Cristina Mora, Claudia Z. Han, Zahara Keulen, Nathanael Spann et al. Transcriptional and epigenetic targets of MEF2C in human microglia contribute to cellular functions related to autism risk and age-related disease. Nature Immunology 2025, 1–15.
- Xue, Feng, Jing Tian, Chunxiao Yu, Heng Du, and Lan Guo. Type I interferon response-related microglial Mef2c deregulation at the onset of Alzheimer's pathology in 5× FAD mice. Neurobiology of disease 2021, 152, 105272. [Google Scholar]
- Wu, Jiangnan, Yanjing Guo, Wei Li, Zihao Zhang, Xinlei Li, Qidi Zhang, Qihang Du, Xinhuan Niu, Xijiang Liu, and Gongming Wang. Microglial priming induced by loss of Mef2C contributes to postoperative cognitive dysfunction in aged mice. Experimental neurology 2023, 365, 114385. [Google Scholar] [CrossRef]
- Mishra, Swati, Nader Morshed, Sonia Beant Sidhu, Chizuru Kinoshita, Beth Stevens, Suman Jayadev, and Jessica E. Young. The Alzheimer's Disease Gene SORL1 Regulates Lysosome Function in Human Microglia. Glia 2025.
- Barthelson, Karissa, Morgan Newman, and Michael Lardelli. Sorting out the role of the sortilin-related receptor 1 in Alzheimer’s disease. Journal of Alzheimer's disease reports 2020, 4, 123–140. [Google Scholar] [CrossRef]
- Ovesen, Peter Lund, Kristian Juul-Madsen, Narasimha S. Telugu, Vanessa Schmidt, Silke Frahm, Helena Radbruch, Emma Louise Louth et al. Alzheimer's Disease Risk Gene SORL1 Promotes Receptiveness of Human Microglia to Pro-Inflammatory Stimuli. Glia 2025, 73, 857–872. [Google Scholar] [CrossRef]
- Mishra, Swati, Allison Knupp, Jessica E. Young, and Suman Jayadev. Depletion of the AD risk gene SORL1 causes endo-lysosomal dysfunction in human microglia. Alzheimer's & Dementia 2022, 18, e068943. [Google Scholar]
- Oyama, Toshinao, Kenichi Harigaya, Nobuo Sasaki, Yoshiaki Okamura, Hiroki Kokubo, Yumiko Saga, Katsuto Hozumi et al. Mastermind-like 1 (MamL1) and mastermind-like 3 (MamL3) are essential for Notch signaling in vivo. Development 2011, 138, 5235–5246. [Google Scholar] [CrossRef]
- Alzofon, Nathaniel, Katrina Koc, Kristin Panwell, Nikita Pozdeyev, Carrie B. Marshall, Maria Albuja-Cruz, Christopher D. Raeburn et al. Mastermind like transcriptional coactivator 3 (MAML3) drives neuroendocrine tumor progression. Molecular Cancer Research 2021, 19, 1476–1485. [Google Scholar] [CrossRef]
- Chintamen, Sana, Pallavi Gaur, Nicole Vo, Elizabeth M. Bradshaw, Vilas Menon, and Steven G. Kernie. Unique Microglial Transcriptomic Signature within the Hippocampal Neurogenic Niche. bioRxiv 2021.
- Bendavid, Guillaume, Céline Hubeau, Fabienne Perin, Alison Gillard, Marie-Julie Nokin, Oriane Carnet, Catherine Gerard et al. Role for the metalloproteinase ADAM28 in the control of airway inflammation, remodelling and responsiveness in asthma. Frontiers in Immunology 2023, 13, 1067779. [Google Scholar] [CrossRef] [PubMed]
- Zhao, Lanlan, Wei Liu, and Fei Wang. Research progress on ADAM28 in malignant tumors. Discover Oncology 2025, 16, 566. [Google Scholar] [CrossRef] [PubMed]
- Villa, Maria, Jingyun Wu, Stefanie Hansen, and Jens Pahnke. Emerging role of ABC transporters in glia cells in health and diseases of the central nervous system. Cells 2024, 13, 740. [Google Scholar] [CrossRef] [PubMed]
- Das, Soumita, Arup Sarkar, Sarmistha Sinha Choudhury, Katherine A. Owen, Victoria L. Derr-Castillo, Sarah Fox, Lars Eckmann, Michael R. Elliott, James E. Casanova, and Peter B. Ernst. Engulfment and cell motility protein 1 (ELMO1) has an essential role in the internalization of Salmonella Typhimurium into enteric macrophages that impact disease outcome. Cellular and Molecular Gastroenterology and Hepatology 2015, 1, 311–324. [Google Scholar]
- Xiong, Hu, Zhenzhen Chen, Jie Zhao, Wei Li, and Shun Zhang. TNF-α/ENO1 signaling facilitates testicular phagocytosis by directly activating Elmo1 gene expression in mouse Sertoli cells. The FEBS Journal 2022, 289, 2809–2827. [Google Scholar] [CrossRef]
- Ma, Di, Xiaoxiao Liu, Jinyu Li, Hanxin Wu, Jiaxuan Ma, and Wenlin Tai. ELMO1 regulates macrophage directed migration and attenuates inflammation via NF-κB signaling pathway in primary biliary cholangitis. Digestive and Liver Disease 2024, 56, 1897–1905. [Google Scholar] [CrossRef]
- Mikdache, Aya, Laura Fontenas, Shahad Albadri, Celine Revenu, Julien Loisel-Duwattez, Emilie Lesport, Cindy Degerny, Filippo Del Bene, and Marcel Tawk. Elmo1 function, linked to Rac1 activity, regulates peripheral neuronal numbers and myelination in zebrafish. Cellular and Molecular Life Sciences 2020, 77, 161–177. [Google Scholar] [CrossRef]
- Guo, Hui, Elisa Bettella, Paul C. Marcogliese, Rongjuan Zhao, Jonathan C. Andrews, Tomasz J. Nowakowski, Madelyn A. Gillentine et al. Disruptive mutations in TANC2 define a neurodevelopmental syndrome associated with psychiatric disorders. Nature communications 2019, 10, 4679. [Google Scholar] [CrossRef] [PubMed]
- Ge, Yong, Changjun Yang, Mojgan Zadeh, Shane M. Sprague, Yang-Ding Lin, Heetanshi Sanjay Jain, Brenden Fitzgerald Determann et al. Functional regulation of microglia by vitamin B12 alleviates ischemic stroke-induced neuroinflammation in mice. Iscience 2024, 27. [Google Scholar]
- Gibieža, Paulius, and Vilma Petrikaitė. The regulation of actin dynamics during cell division and malignancy. American journal of cancer research 2021, 11, 4050. [Google Scholar]
- Thompson, Scott B. , Adam M. Sandor, Victor Lui, Jeffrey W. Chung, Monique M. Waldman, Robert A. Long, Miriam L. Estin, Jennifer L. Matsuda, Rachel S. Friedman, and Jordan Jacobelli. Formin-like 1 mediates effector T cell trafficking to inflammatory sites to enable T cell-mediated autoimmunity. elife 2020, 9, e58046. [Google Scholar]
- Miller, Matthew R. , and Scott D. Blystone. Human macrophages utilize the podosome formin FMNL1 for adhesion and migration. CellBio 2015, 4, 1. [Google Scholar]
- Law, Ah-Lai, Shamsinar Jalal, Tommy Pallett, Fuad Mosis, Ahmad Guni, Simon Brayford, Lawrence Yolland et al. Nance-Horan Syndrome-like 1 protein negatively regulates Scar/WAVE-Arp2/3 activity and inhibits lamellipodia stability and cell migration. Nature communications 2021, 12, 5687. [Google Scholar] [CrossRef]
- Masrori, Pegah, Baukje Bijnens, Laura Fumagalli, Kristofer Davie, Suresh Kumar Poovathingal, Tim Meese, Annet Storm et al. C9orf72 hexanucleotide repeat expansions impair microglial response in ALS. Nature Neuroscience 2025, 1–14. [Google Scholar]
- Hock, Hanno, and Akiko Shimamura. ETV6 in hematopoiesis and leukemia predisposition. In Seminars in hematology, vol. 54, no. 2, pp. 98–104. WB Saunders, 2017.
- Villar, Javiera, Adeline Cros, Alba De Juan, Lamine Alaoui, Pierre-Emmanuel Bonte, Colleen M. Lau, Ioanna Tiniakou, Boris Reizis, and Elodie Segura. ETV3 and ETV6 enable monocyte differentiation into dendritic cells by repressing macrophage fate commitment. Nature immunology 2023, 24, 84–95. [Google Scholar] [CrossRef] [PubMed]
- Xiong, Xiaofang, Zheng Yan, Wei Jiang, and Xuejun Jiang. ETS variant transcription factor 6 enhances oxidized low-density lipoprotein-induced inflammatory response in atherosclerotic macrophages via activating NF-κB signaling. International Journal of Immunopathology and Pharmacology 2022, 36, 20587384221076472. [Google Scholar] [CrossRef] [PubMed]
Figure 2.
GPNMB+ microglia. A-E: GPNMB+ signature in Datasets 1-5 (A - 1, B - 2, C - 3, D - 4, E - 5). F-J: GPNMB+ microglia clusters on the UMAPs (F - 1, G - 2, H - 3, I - 4, J - 5).
Figure 2.
GPNMB+ microglia. A-E: GPNMB+ signature in Datasets 1-5 (A - 1, B - 2, C - 3, D - 4, E - 5). F-J: GPNMB+ microglia clusters on the UMAPs (F - 1, G - 2, H - 3, I - 4, J - 5).
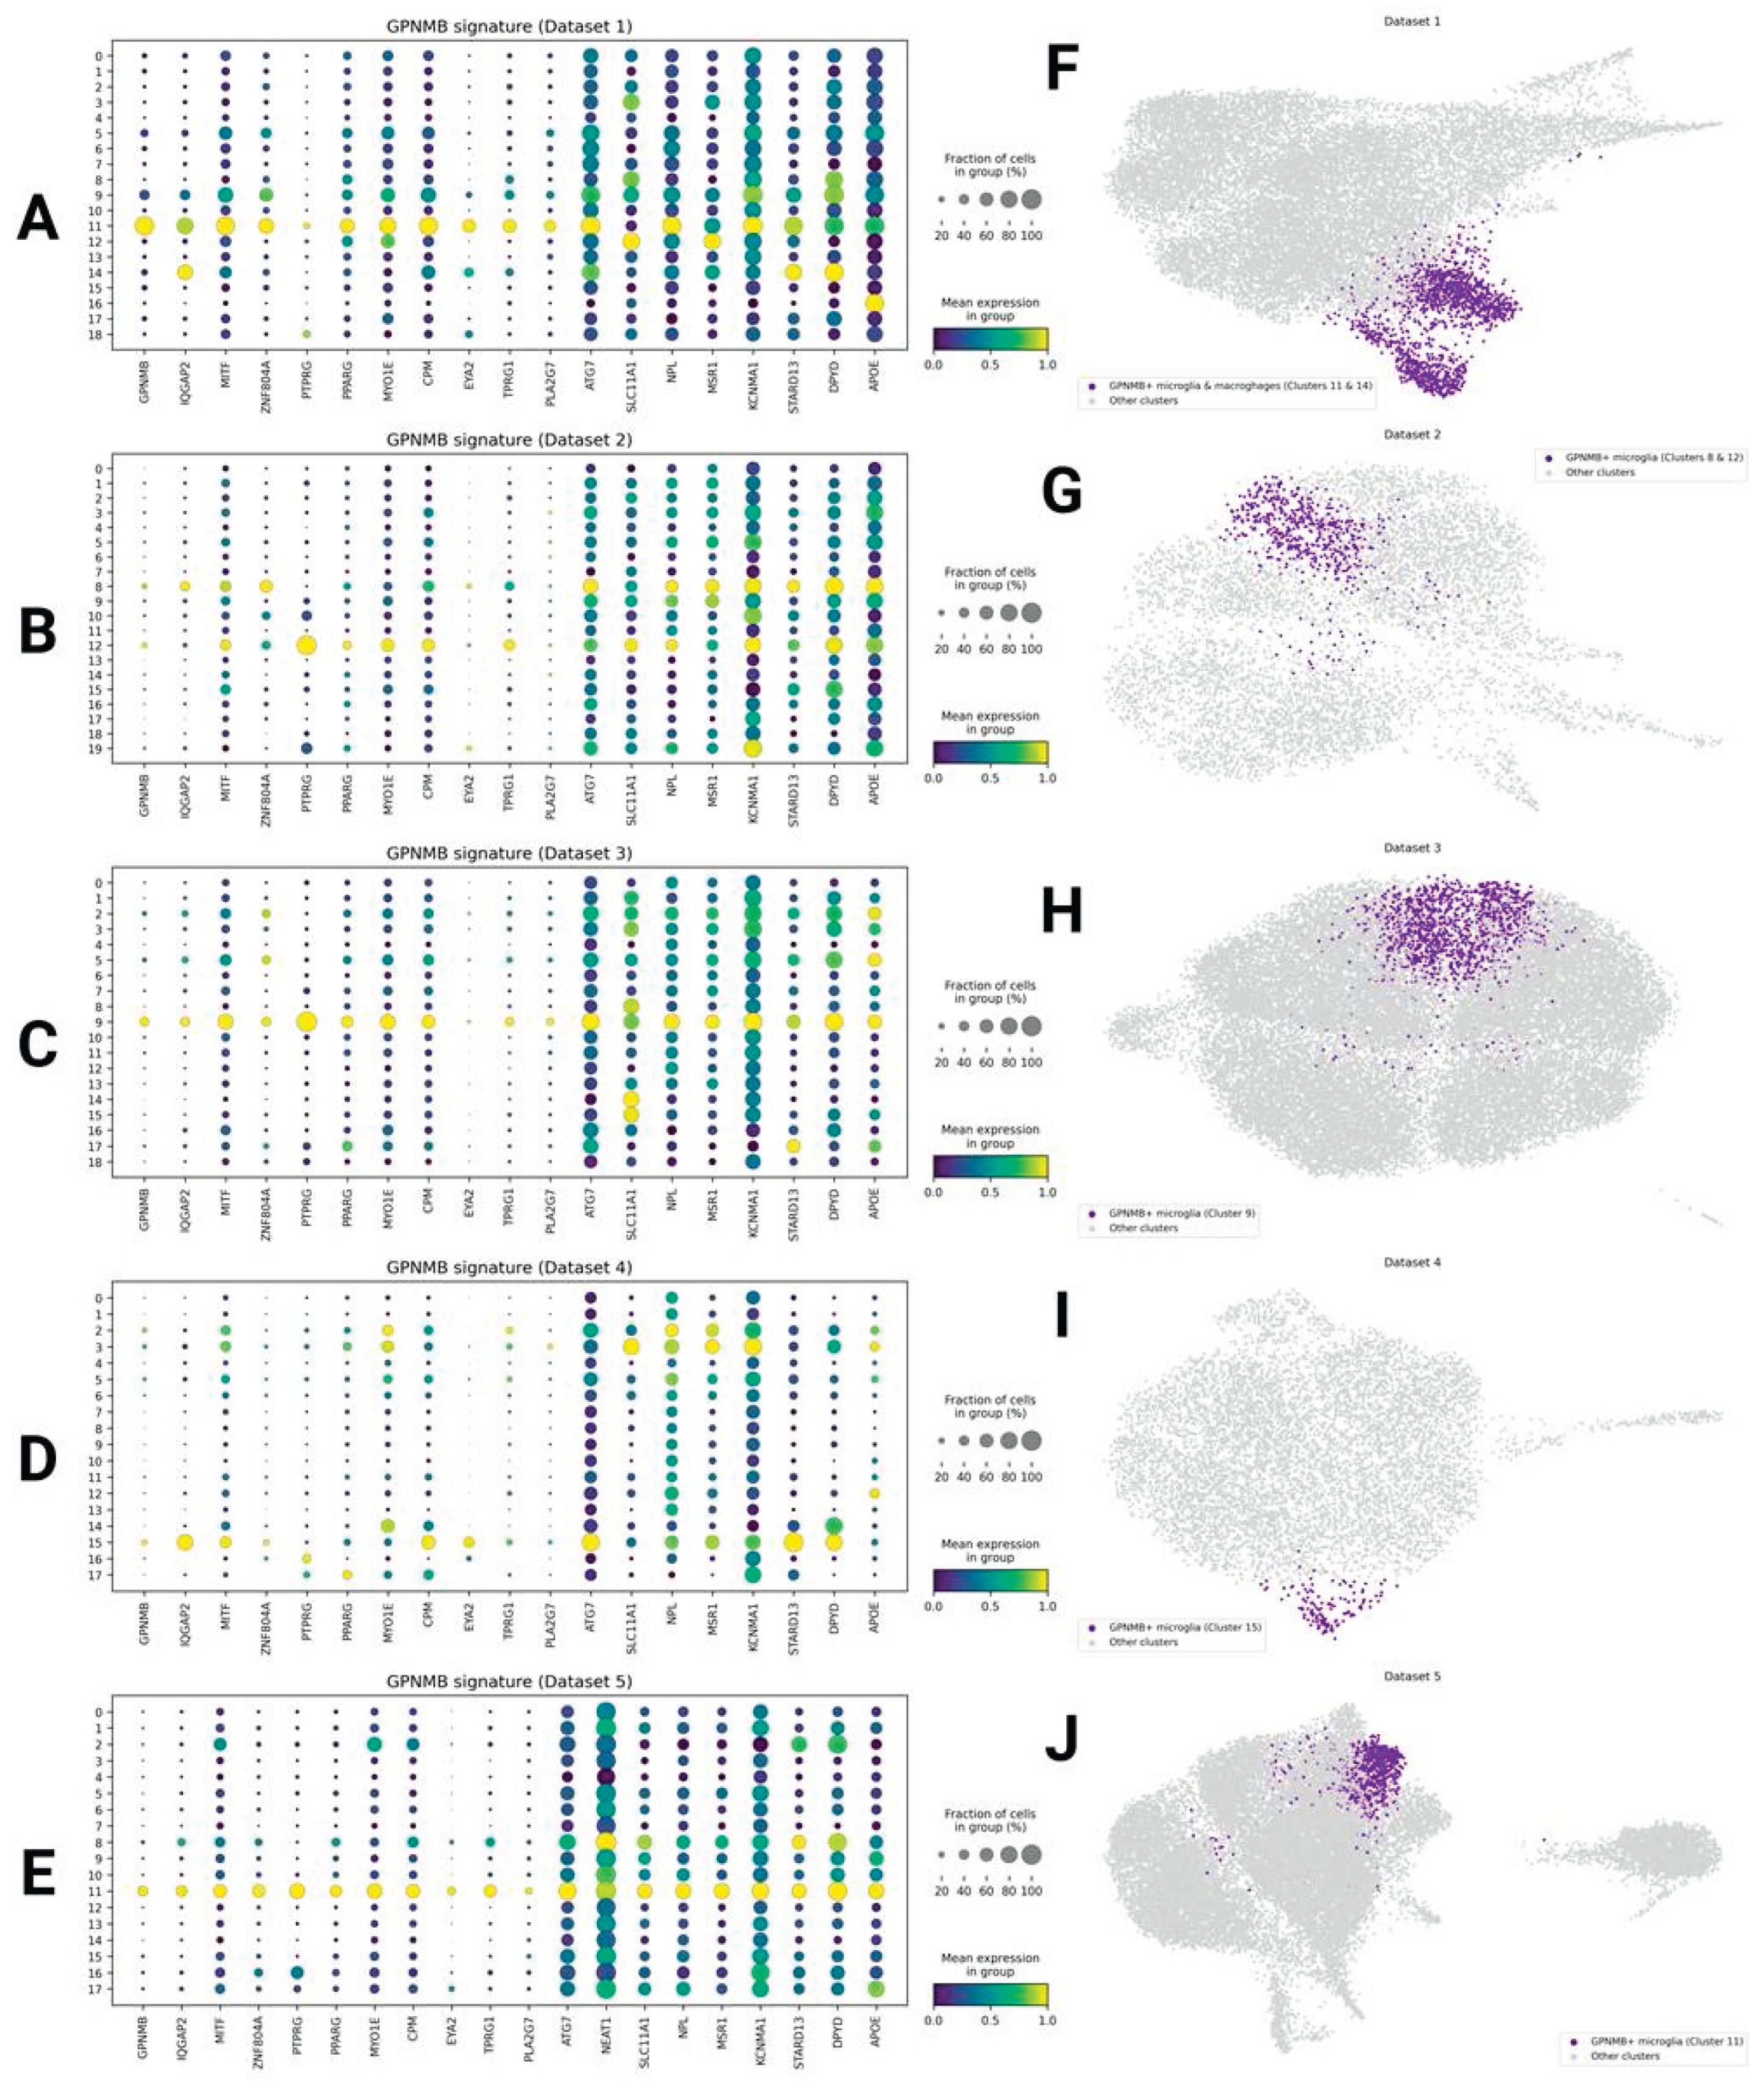
Figure 6.
Dividing microglia. A: D3C16 on the UMAP. B: marker genes of D3C16.
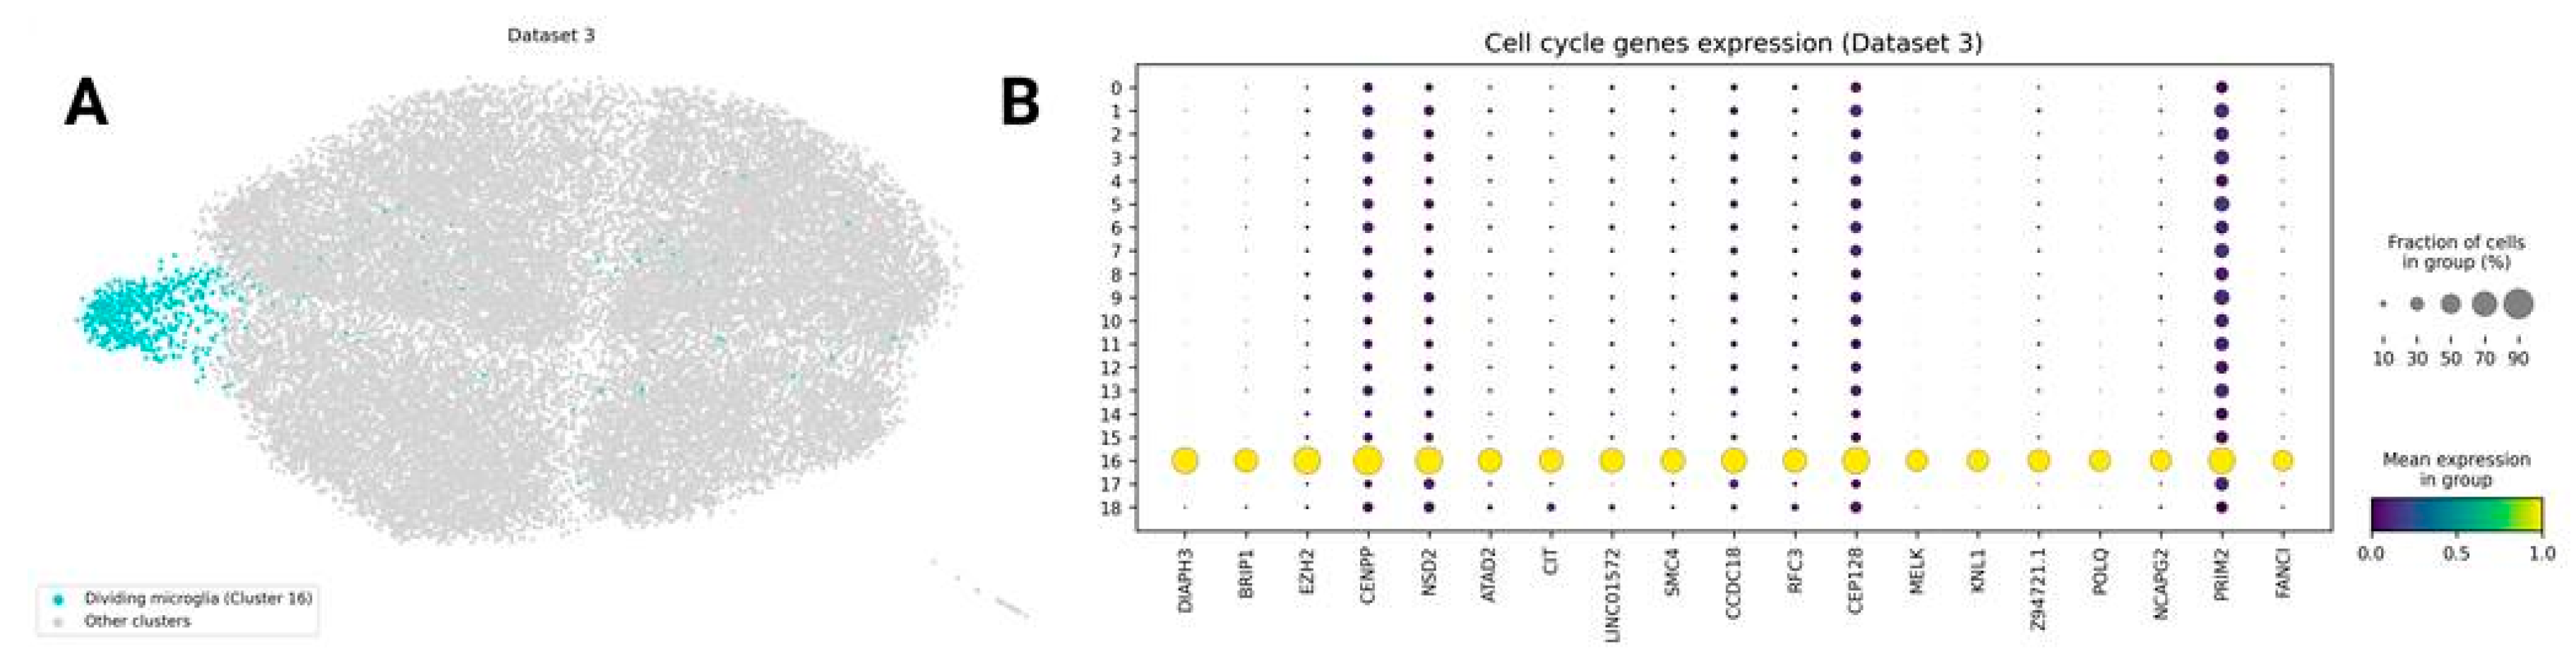
Figure 7.
NRG3+ and ST18+ microglia. A-E: dotplots showing marker genes (the same set across 5 datasets: A - 1, B - 2, C - 3, D - 4, E - 5): more ST18-related on the left, more NRG3-related on the right and common in the middle. F: dotplot showing NRG3+ and ST18+ signature genes in microglia clusters (the same as in the Dataset 5) and oligodendrocytes/OPCs clusters (the same as on Figure 1). G-K: UMAPs showing NRG3+ and ST18+ clusters for 5 datasets: G - 1, H - 2, I - 3, J - 4, K - 5.
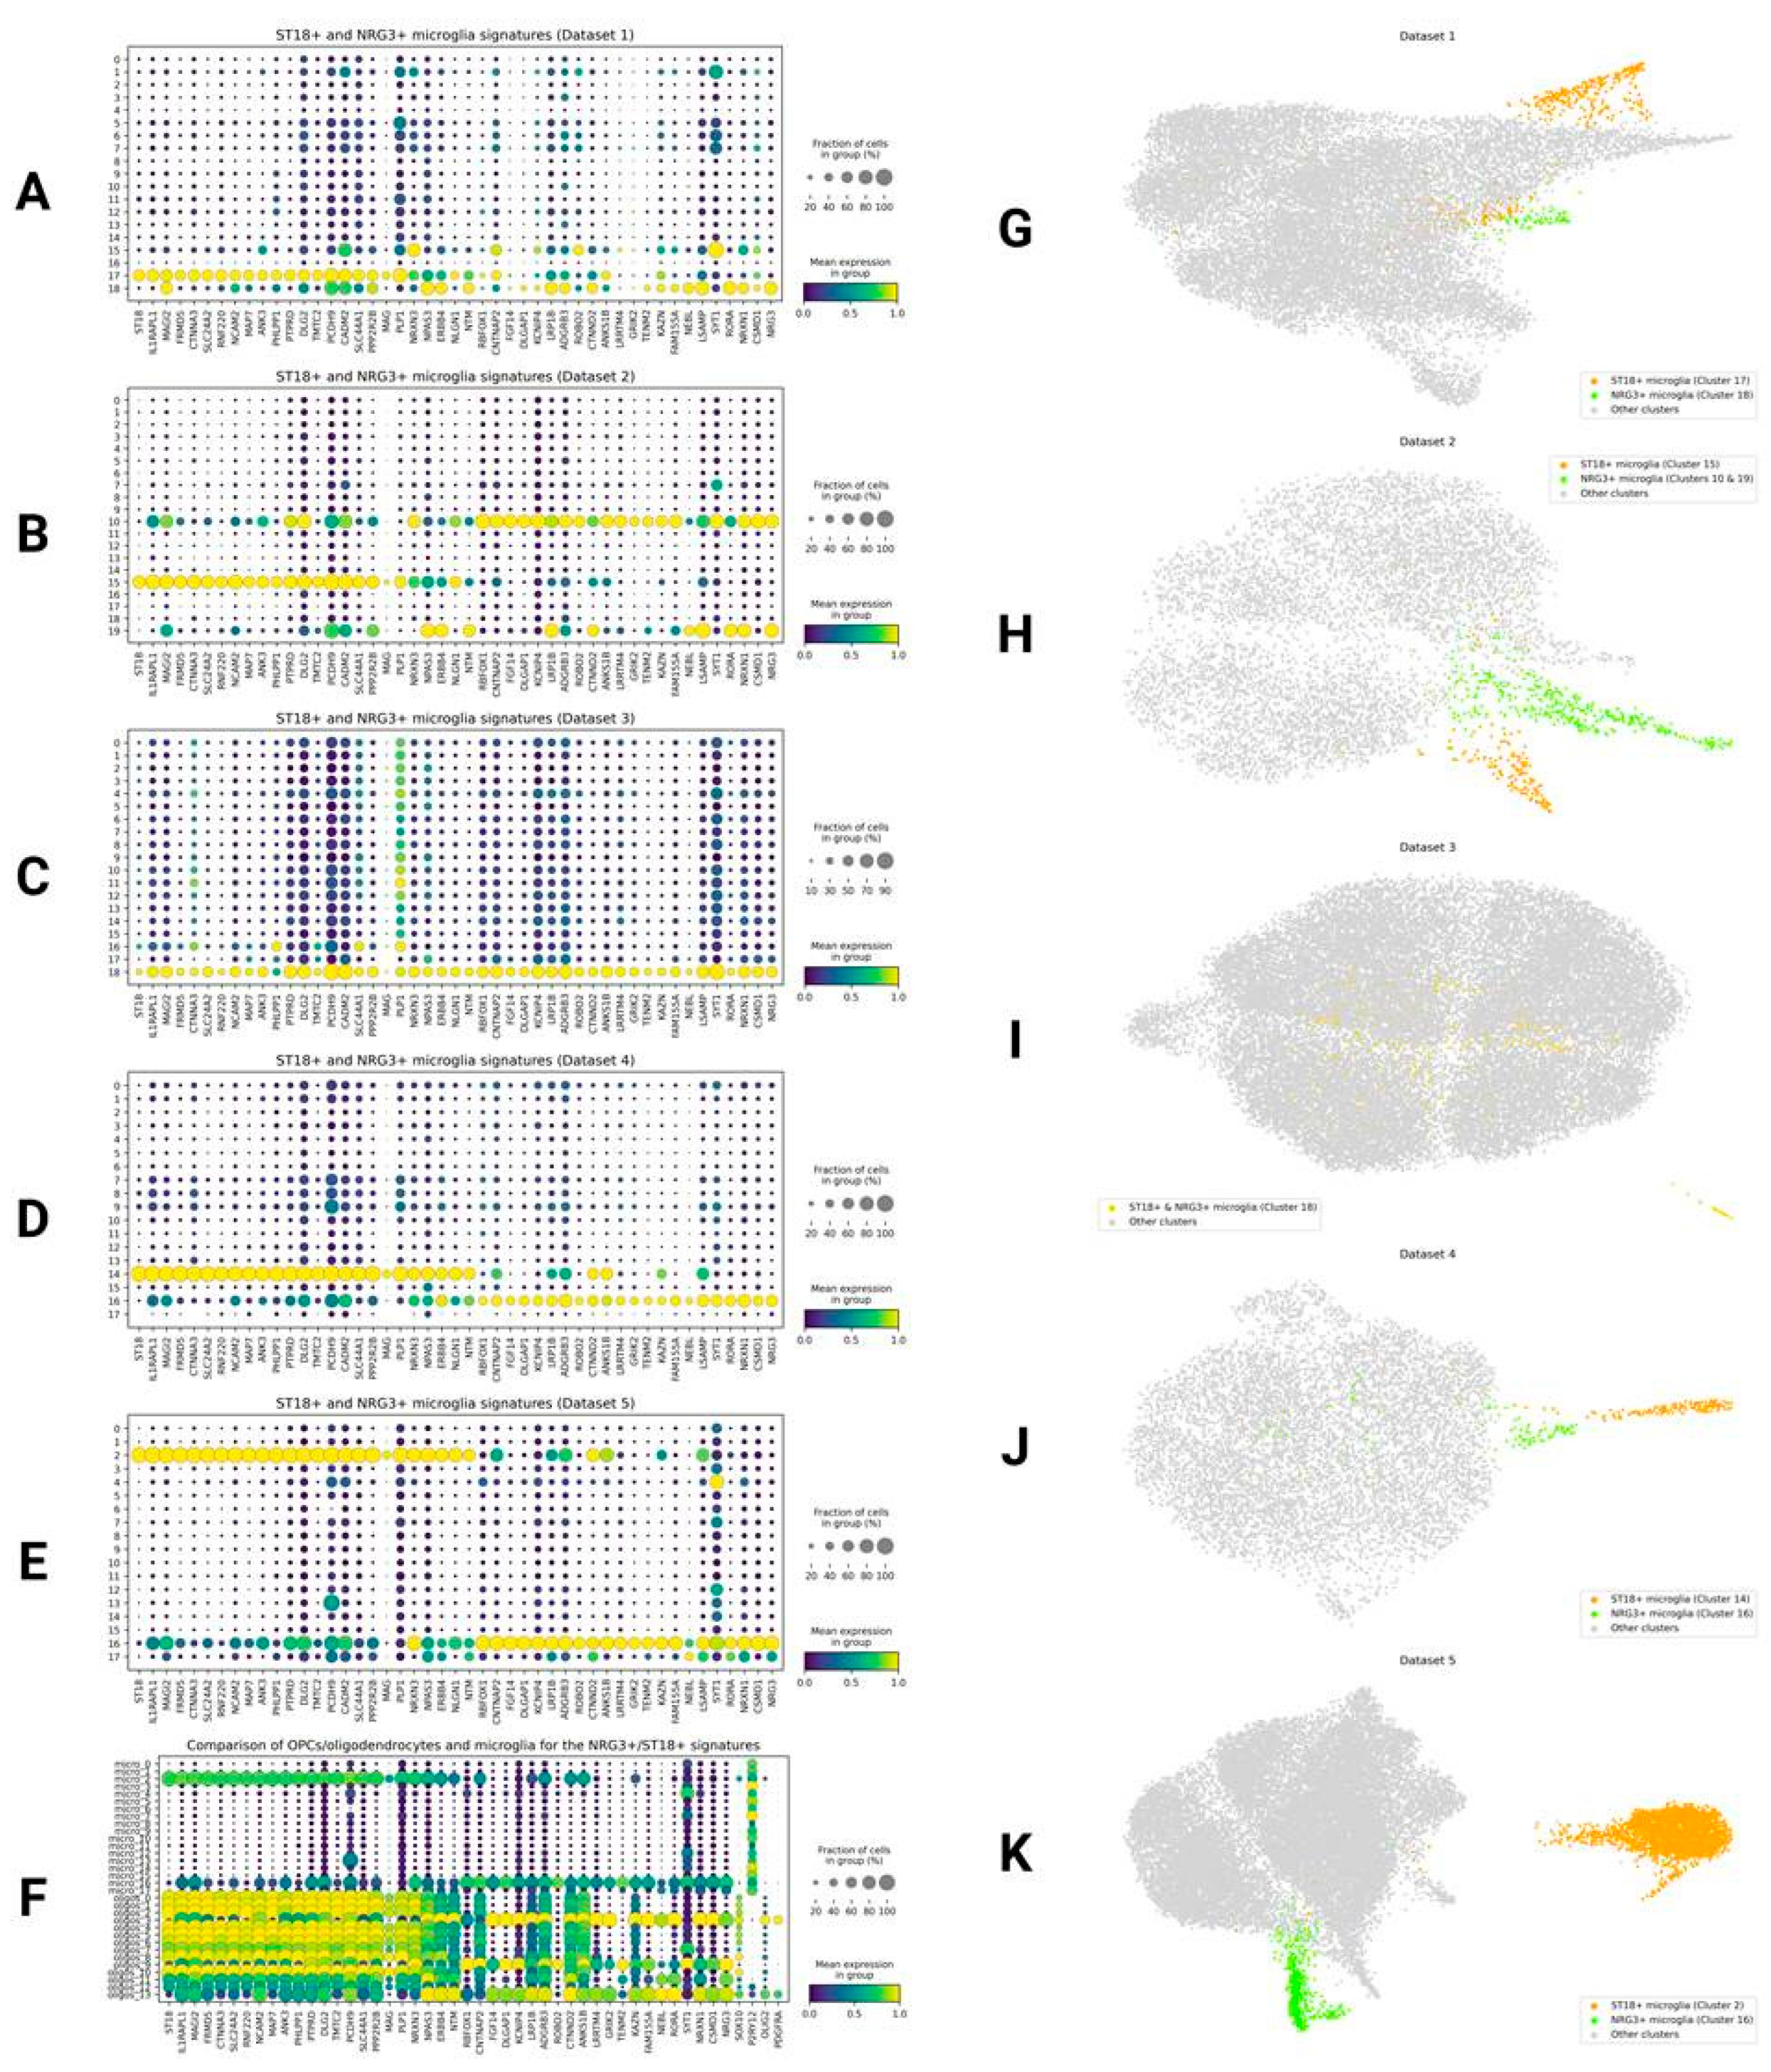
Figure 8.
Distribution of other DAM-related genes across clusters, and cluster enrichment analysis results. A-E: dotplots for Datasets 1-5 (A – 1, B – 2, C – 3, D – 4, E – 5). F-L: quasi-binomial regression results for datasets (F - D1, G - D2, H - D3 (ALS vs Control), I - D3 (FTLD vs Control), J - D3 (ALS vs FTLD), K - D4, L - D5).
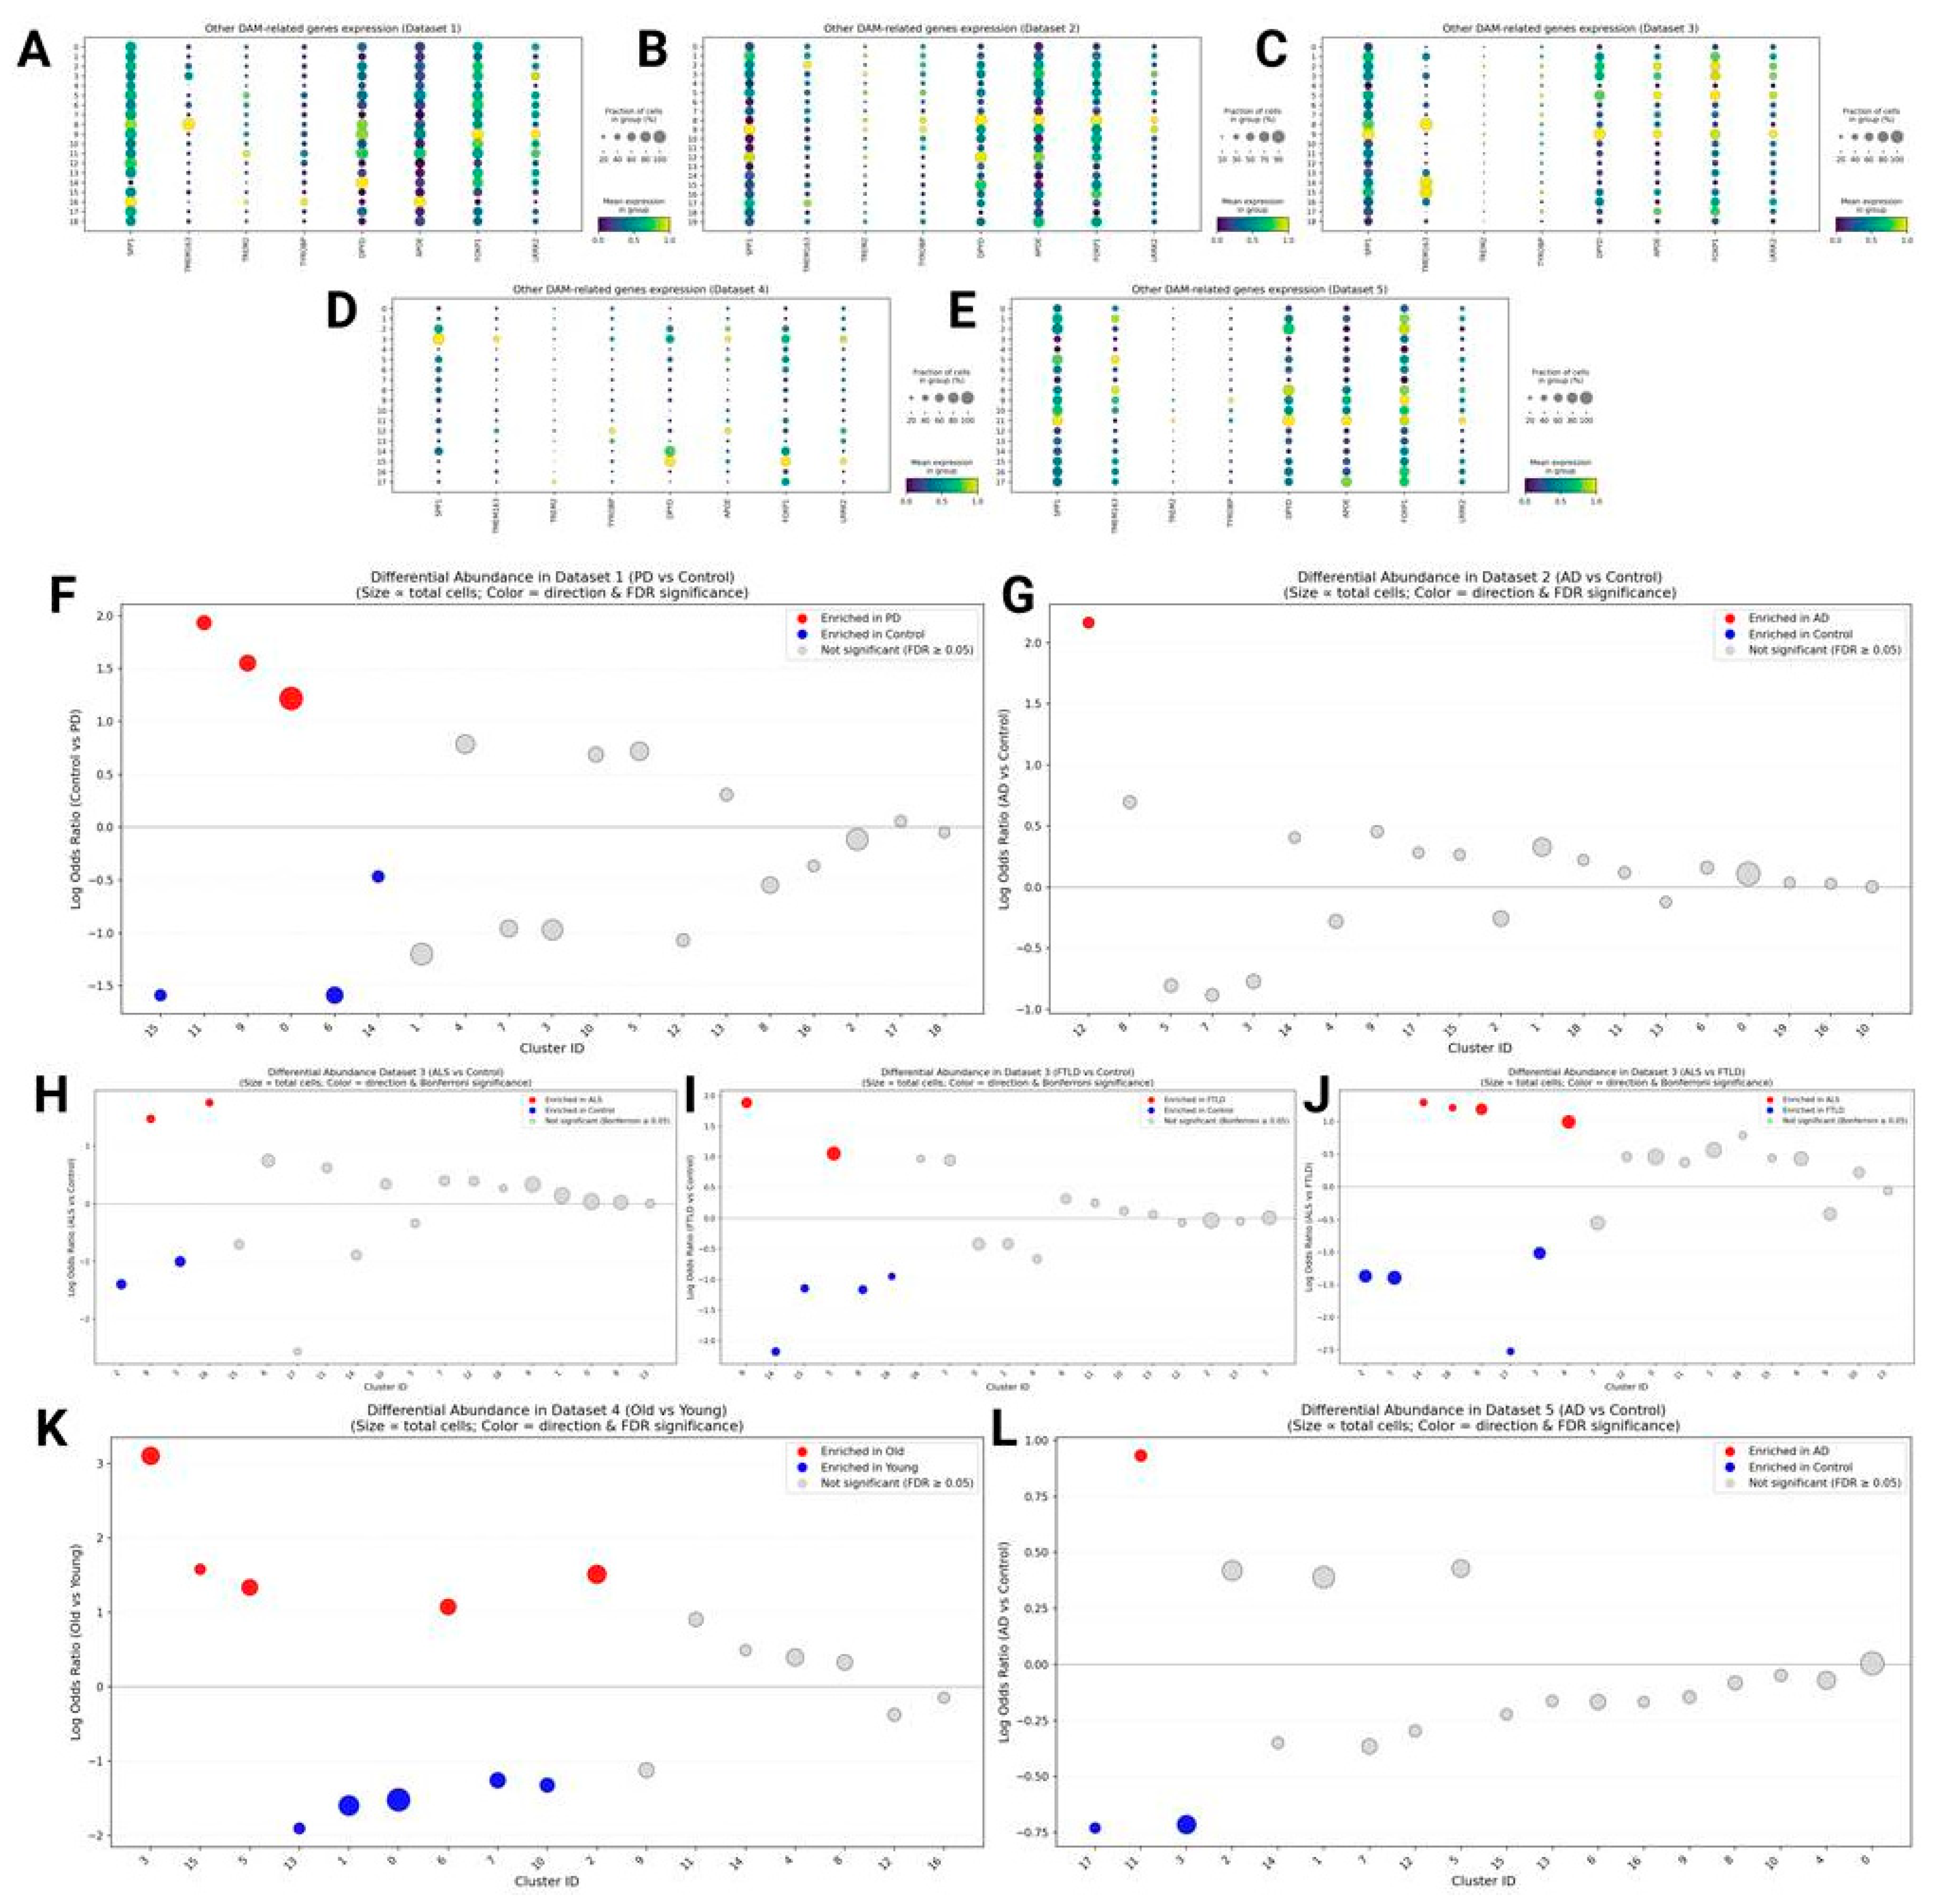
Figure 9.
Results of the monkey aging dataset analysis. A: dotplot with PLD5 and marker genes for differentially enriched clusters. B: ST18+ and NRG3+ signatures. C: GPNMB+ signature. D: visualization of quasi-binomial regression results. E: UMAP with clusters identified in the analysis. F: UMAP with cell types assigned by CellTypist.
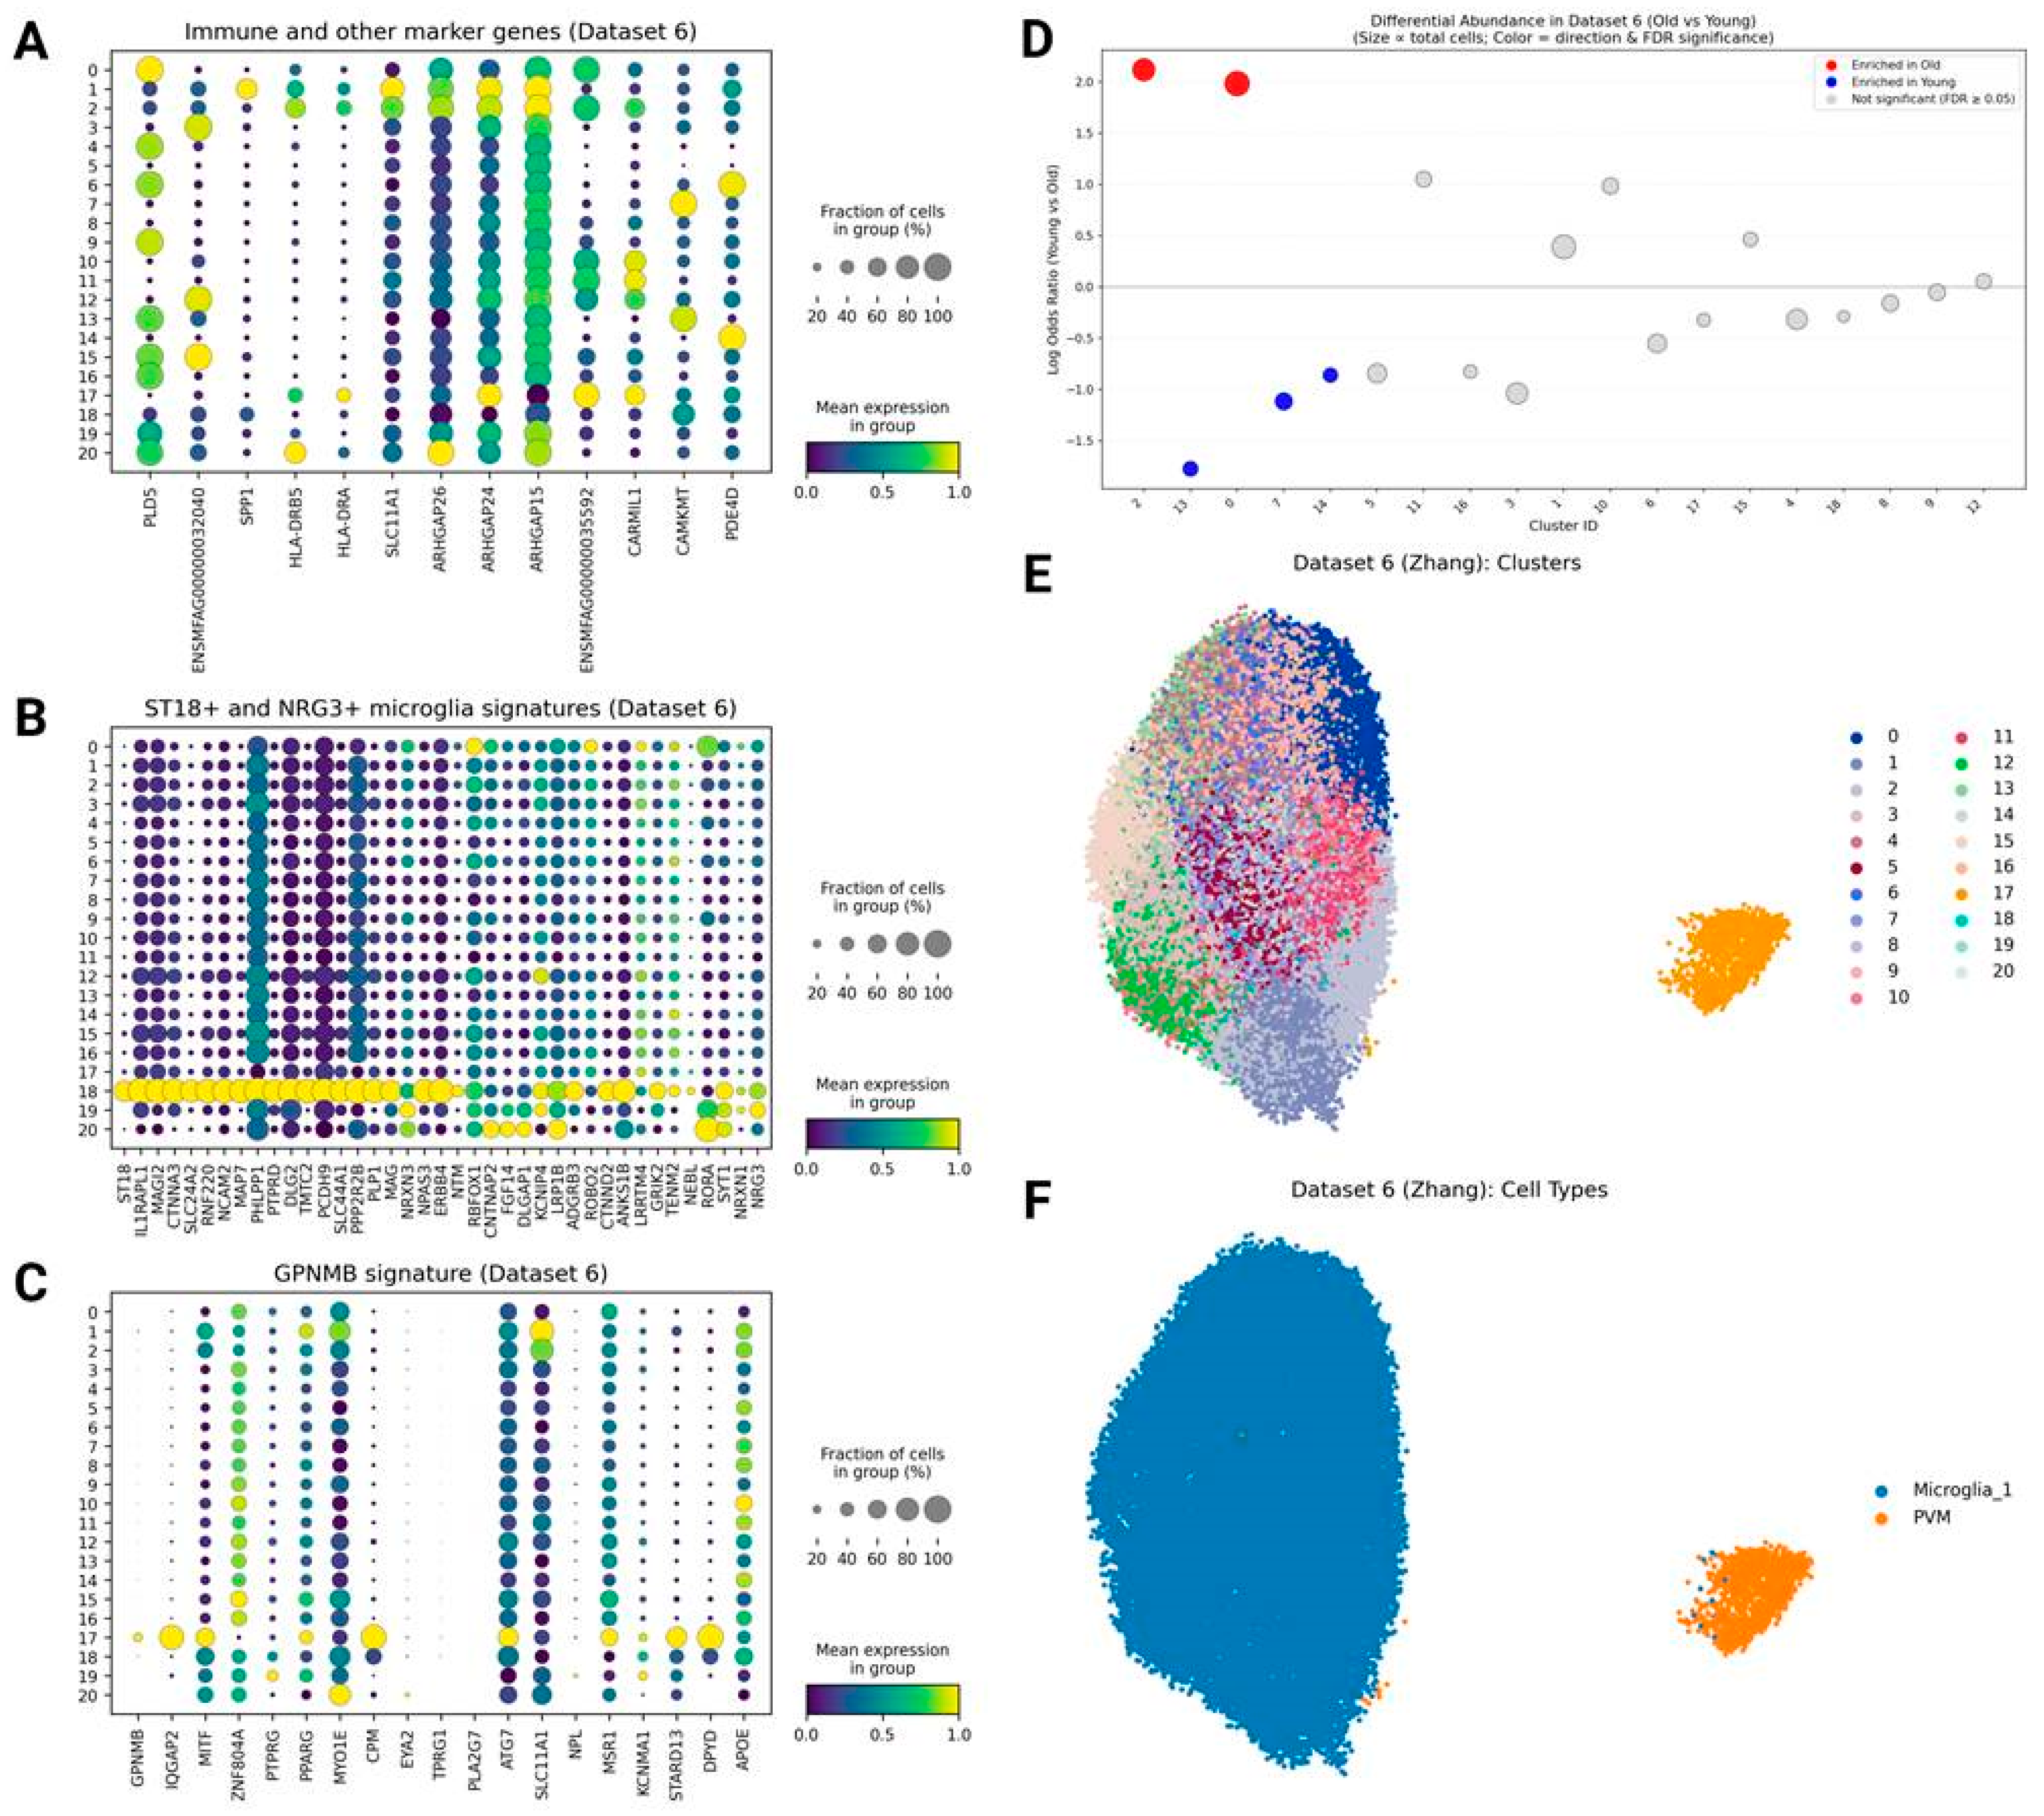
Figure 10.
Modules related to REM-FT/C1Q signature, and module-trait correlation analysis results. A-F: REM-FT/C1Q modules (A - Dataset 1 magenta, B - Dataset 2 paleturquoise, C - Dataset 2 salmon, D - Dataset 3 darkred, E - Dataset 4 black, F - Dataset 2 royalblue). G-M: volcano plots for module-trait correlation results (all modules): G - Dataset 1 (PD vs Control), H - Dataset 2 (AD vs Control), I - Dataset 3 (ALS vs Control), J - Dataset 3 (FTLD vs Control), K - Dataset 3 (ALS vs FTLD), L - Dataset 4 (Old vs Young), M - Dataset 5 (AD vs Control).
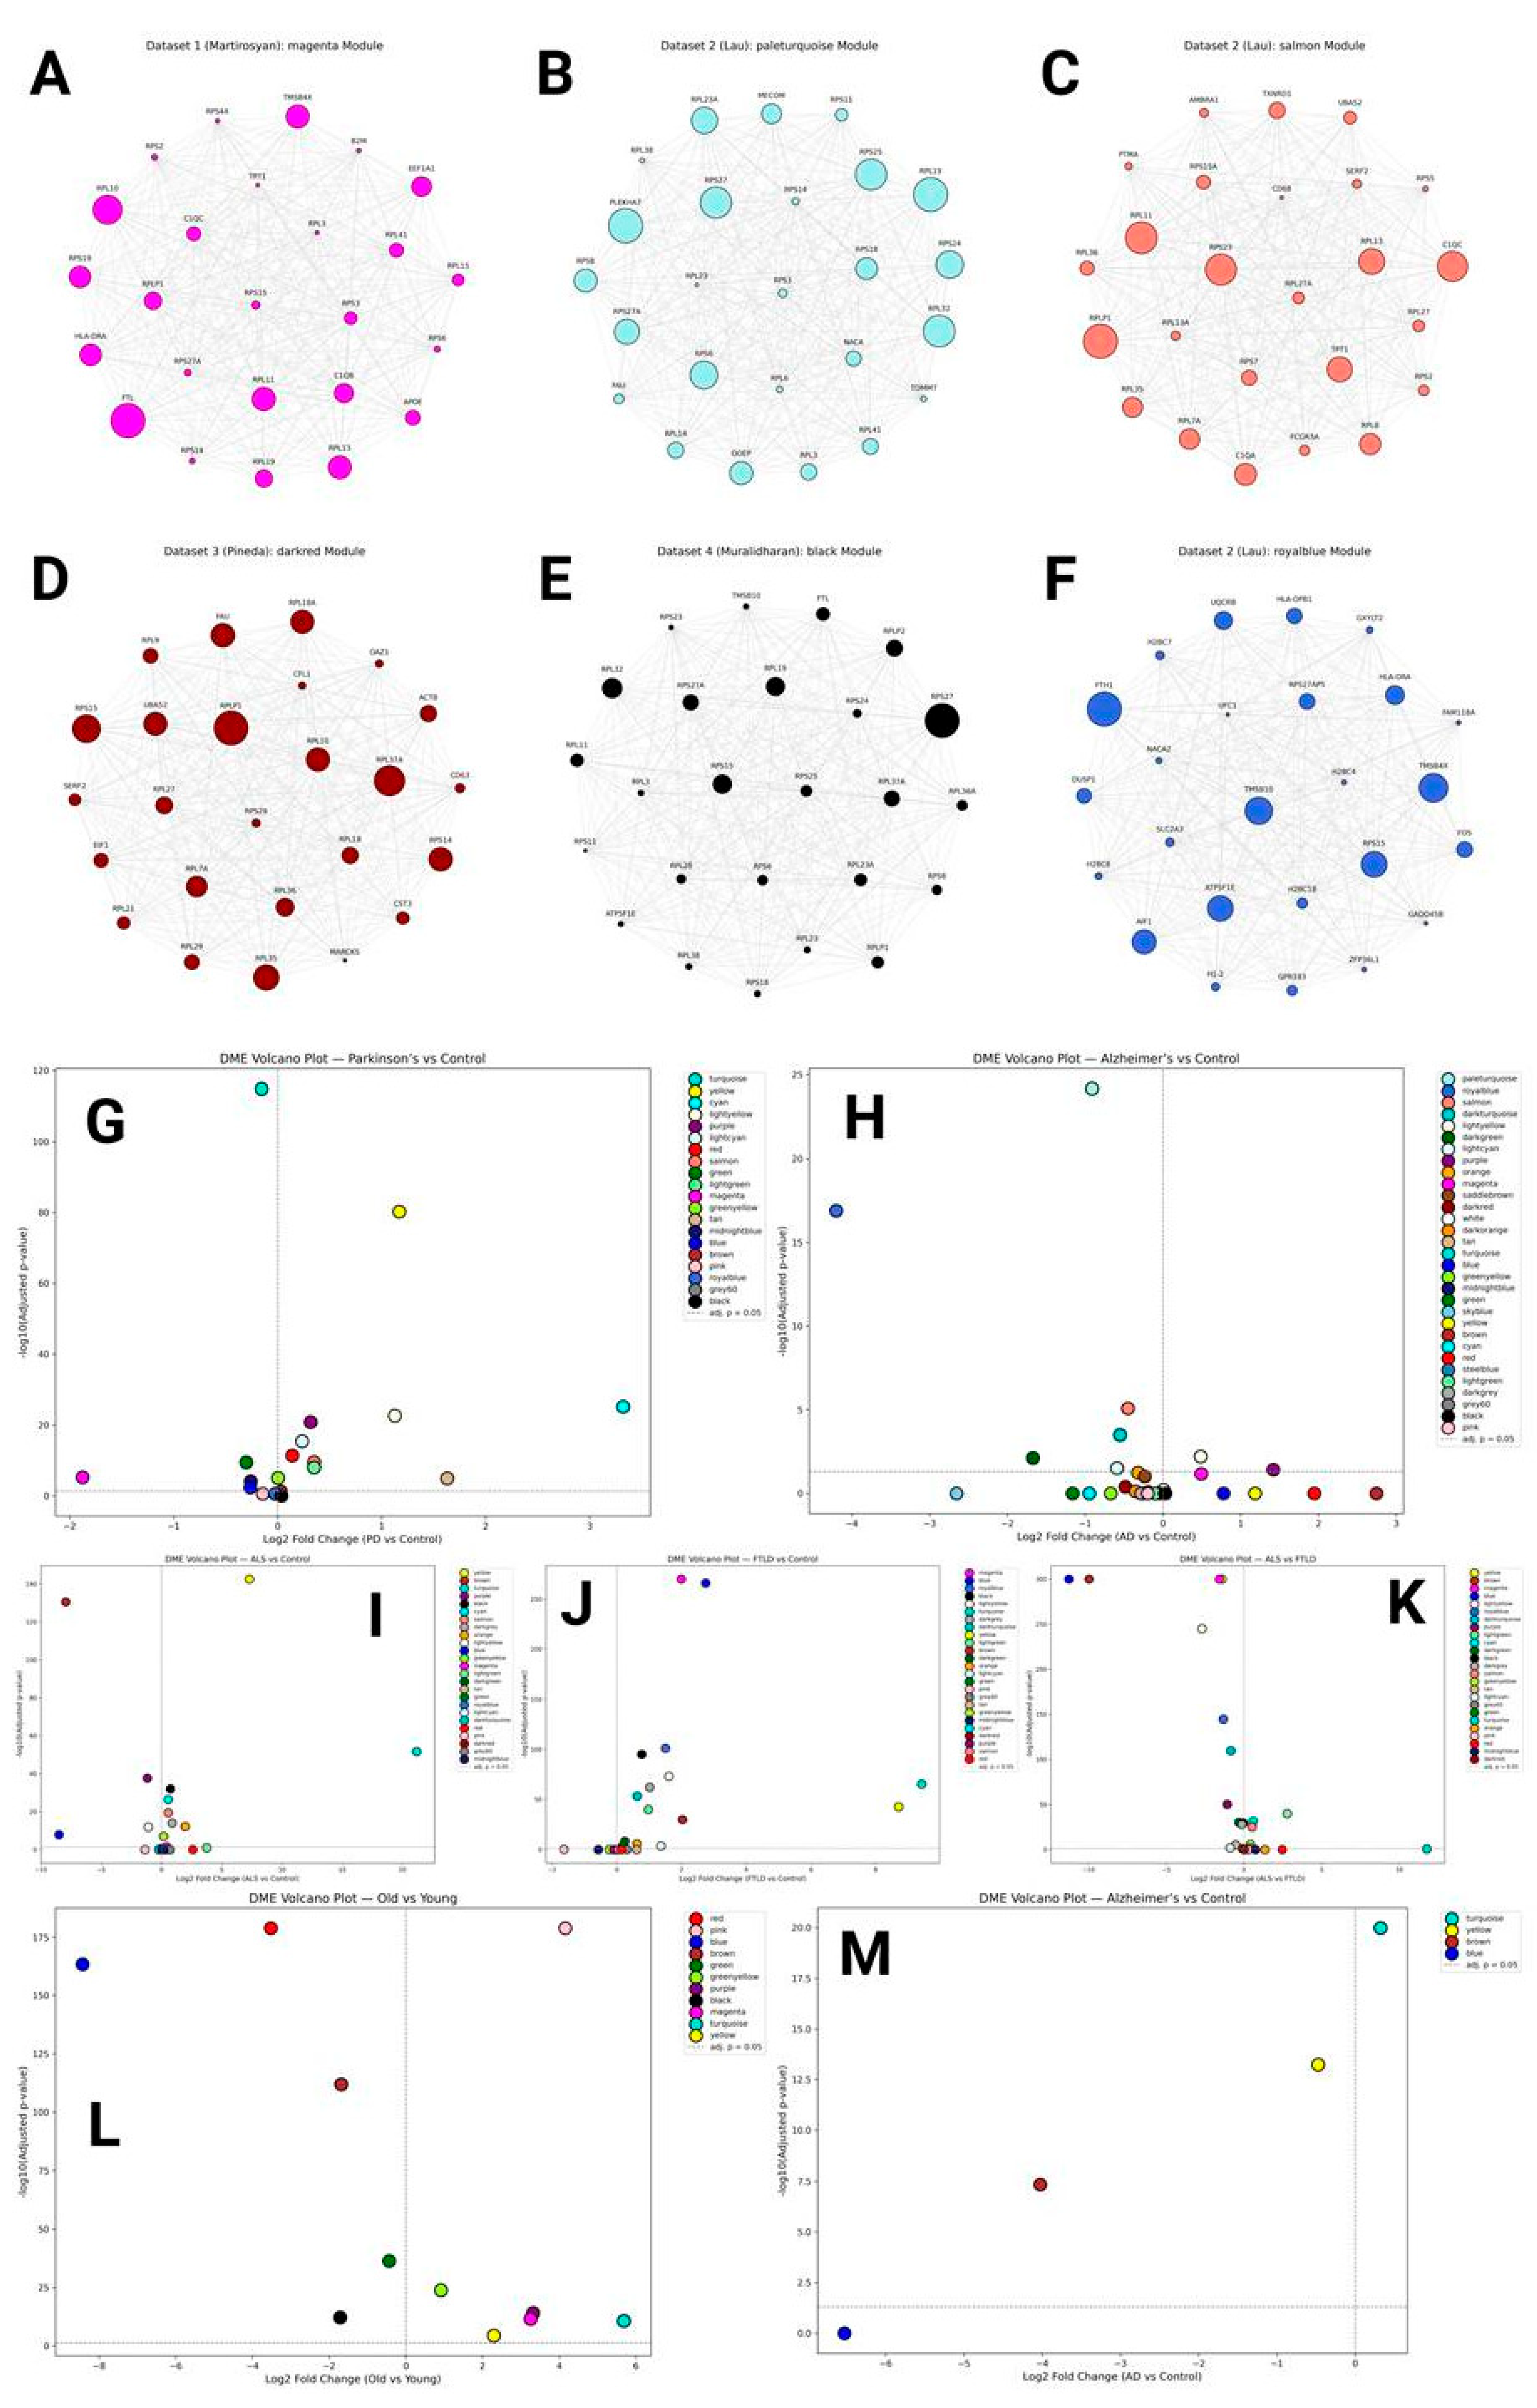
Figure 11.
Gene coexpression modules discussed in this section. A - Dataset 1 cyan, B - Dataset 3 lightgreen, C - Dataset 3 royalblue, D - Dataset 3 turquoise, E - Dataset 3 brown, F - Dataset 5 blue, G - Dataset 3 magenta, H - Dataset 4 pink.
Figure 11.
Gene coexpression modules discussed in this section. A - Dataset 1 cyan, B - Dataset 3 lightgreen, C - Dataset 3 royalblue, D - Dataset 3 turquoise, E - Dataset 3 brown, F - Dataset 5 blue, G - Dataset 3 magenta, H - Dataset 4 pink.
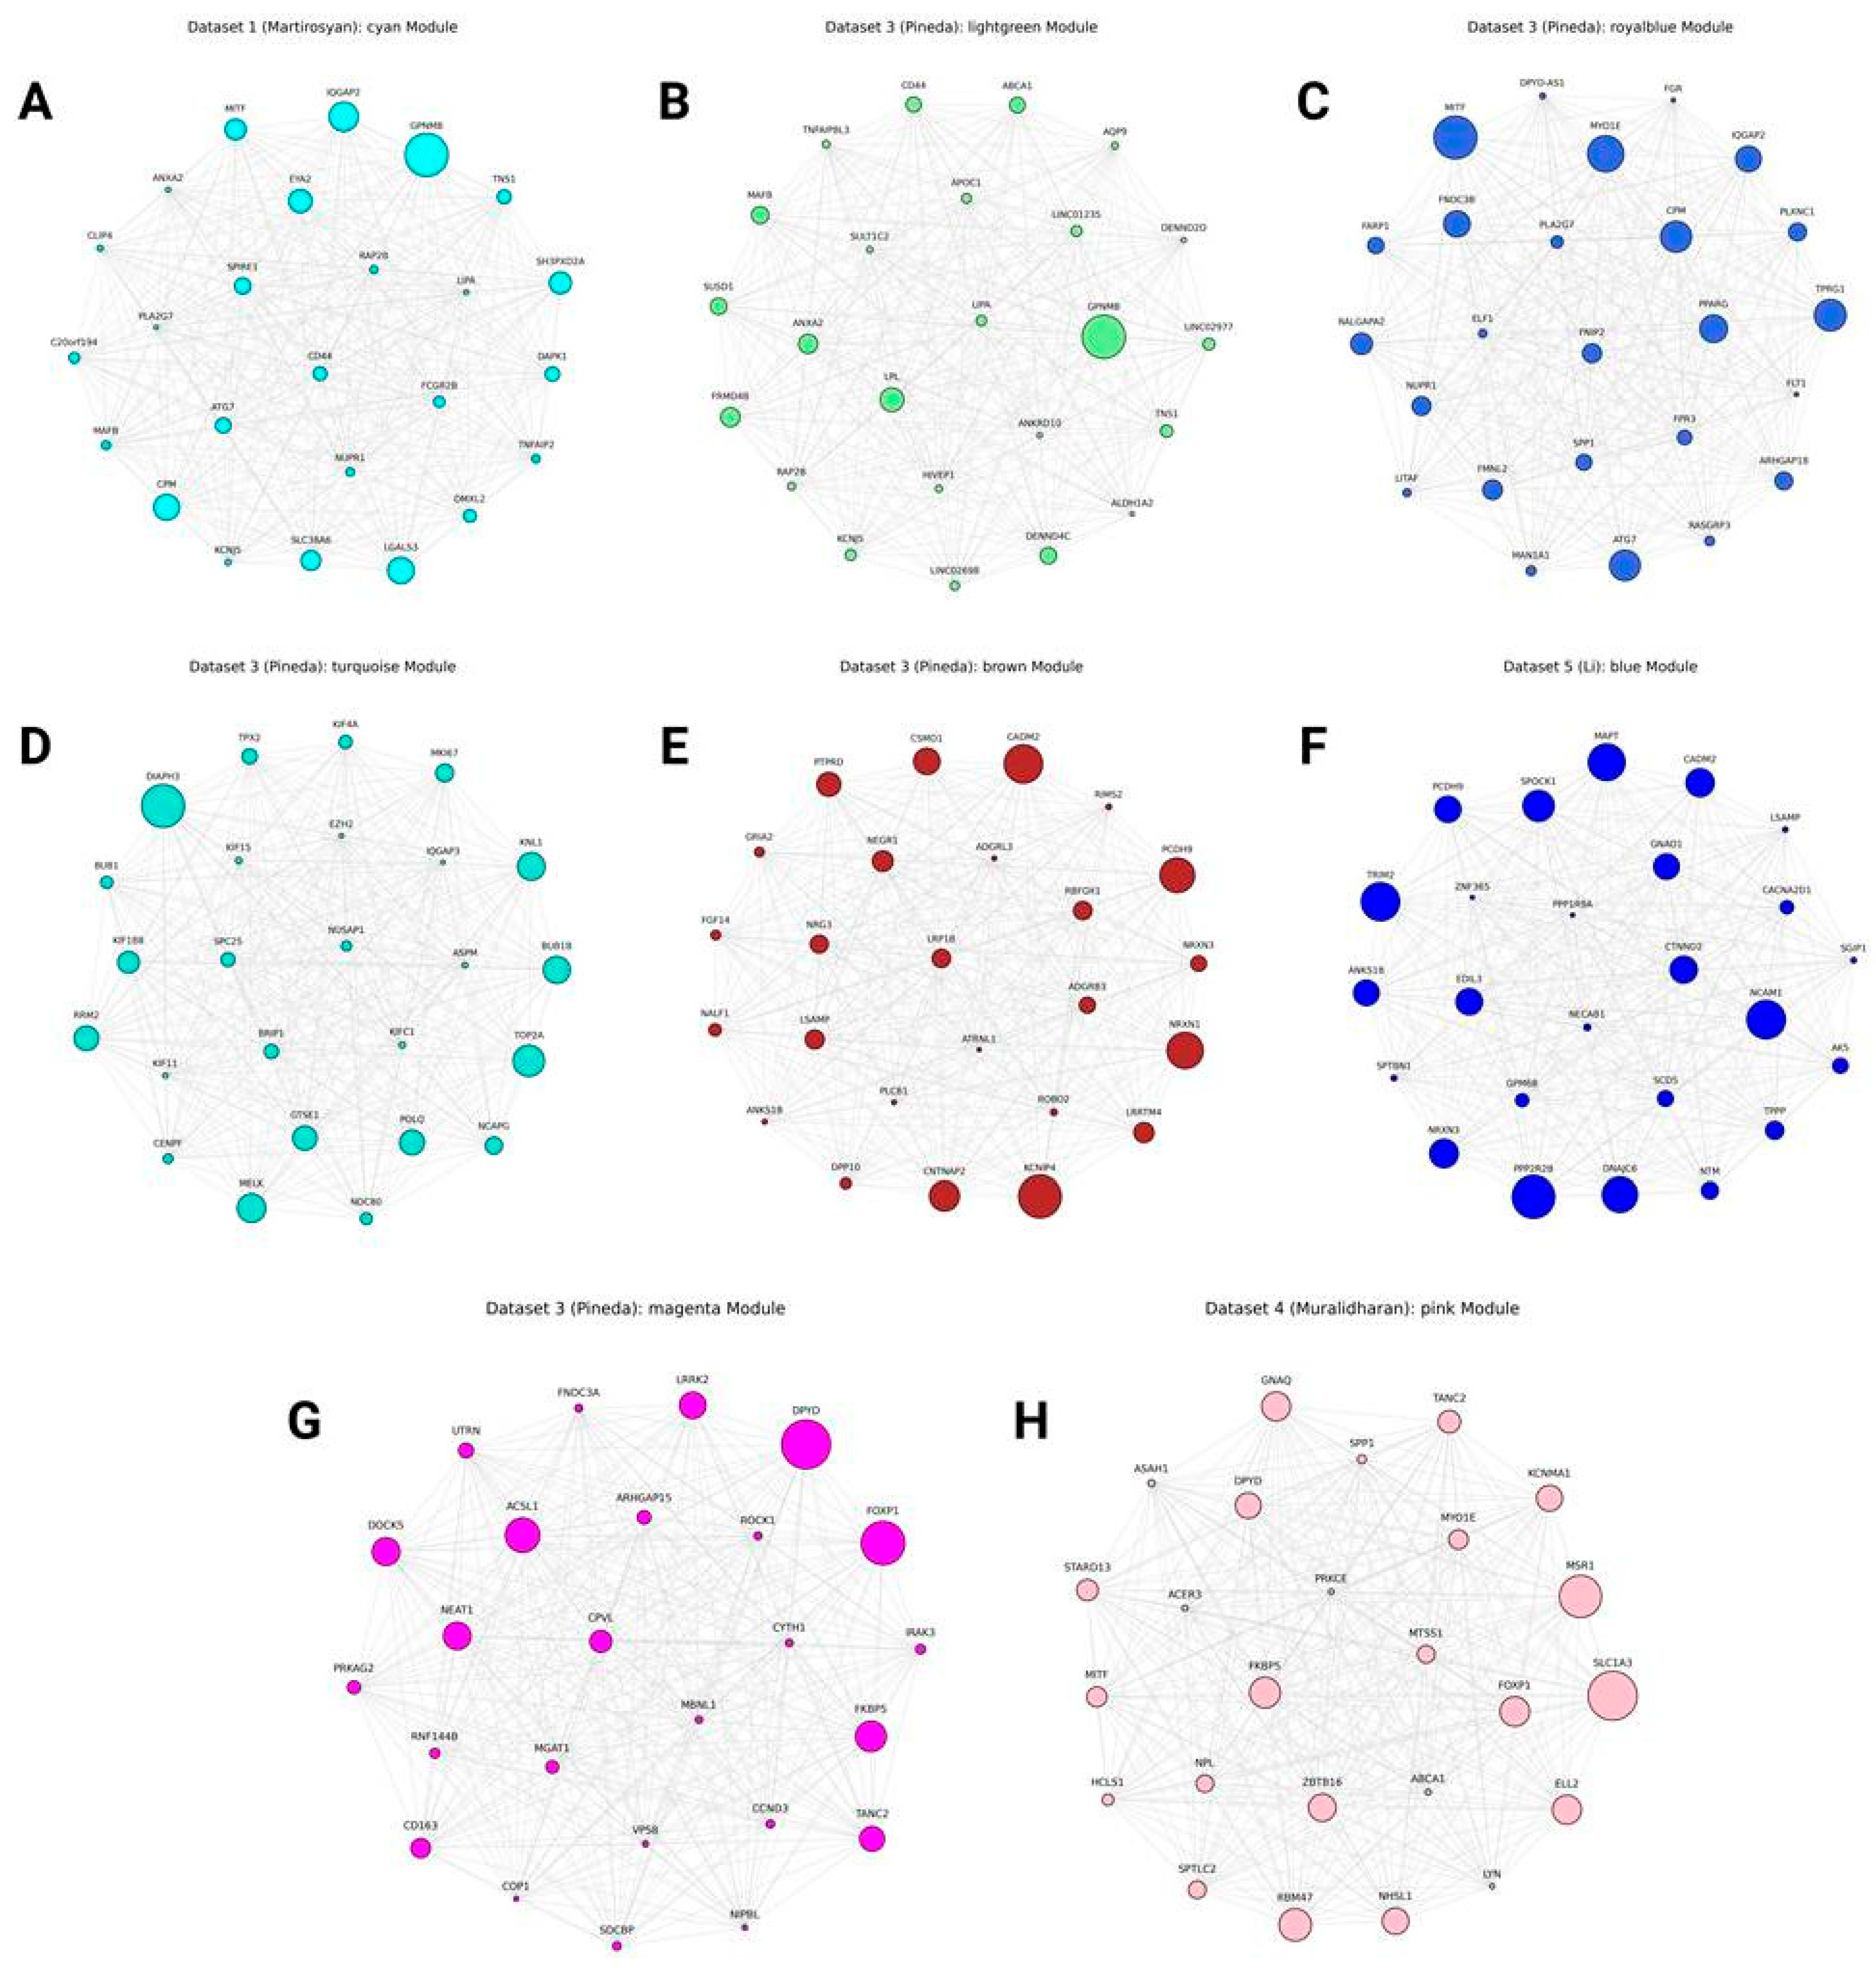
Figure 12.
Gene coexpression modules containing putative central regulators. A - Dataset 4 brown, B - Dataset 1 green, C - Dataset 4 red, D - Dataset 2 orange, E - Dataset 5 yellow, F - Dataset 3 black, G - Dataset 5 turquoise, H - Dataset 2 white, I - Dataset 2 blue, J - Dataset 3 cyan.
Figure 12.
Gene coexpression modules containing putative central regulators. A - Dataset 4 brown, B - Dataset 1 green, C - Dataset 4 red, D - Dataset 2 orange, E - Dataset 5 yellow, F - Dataset 3 black, G - Dataset 5 turquoise, H - Dataset 2 white, I - Dataset 2 blue, J - Dataset 3 cyan.
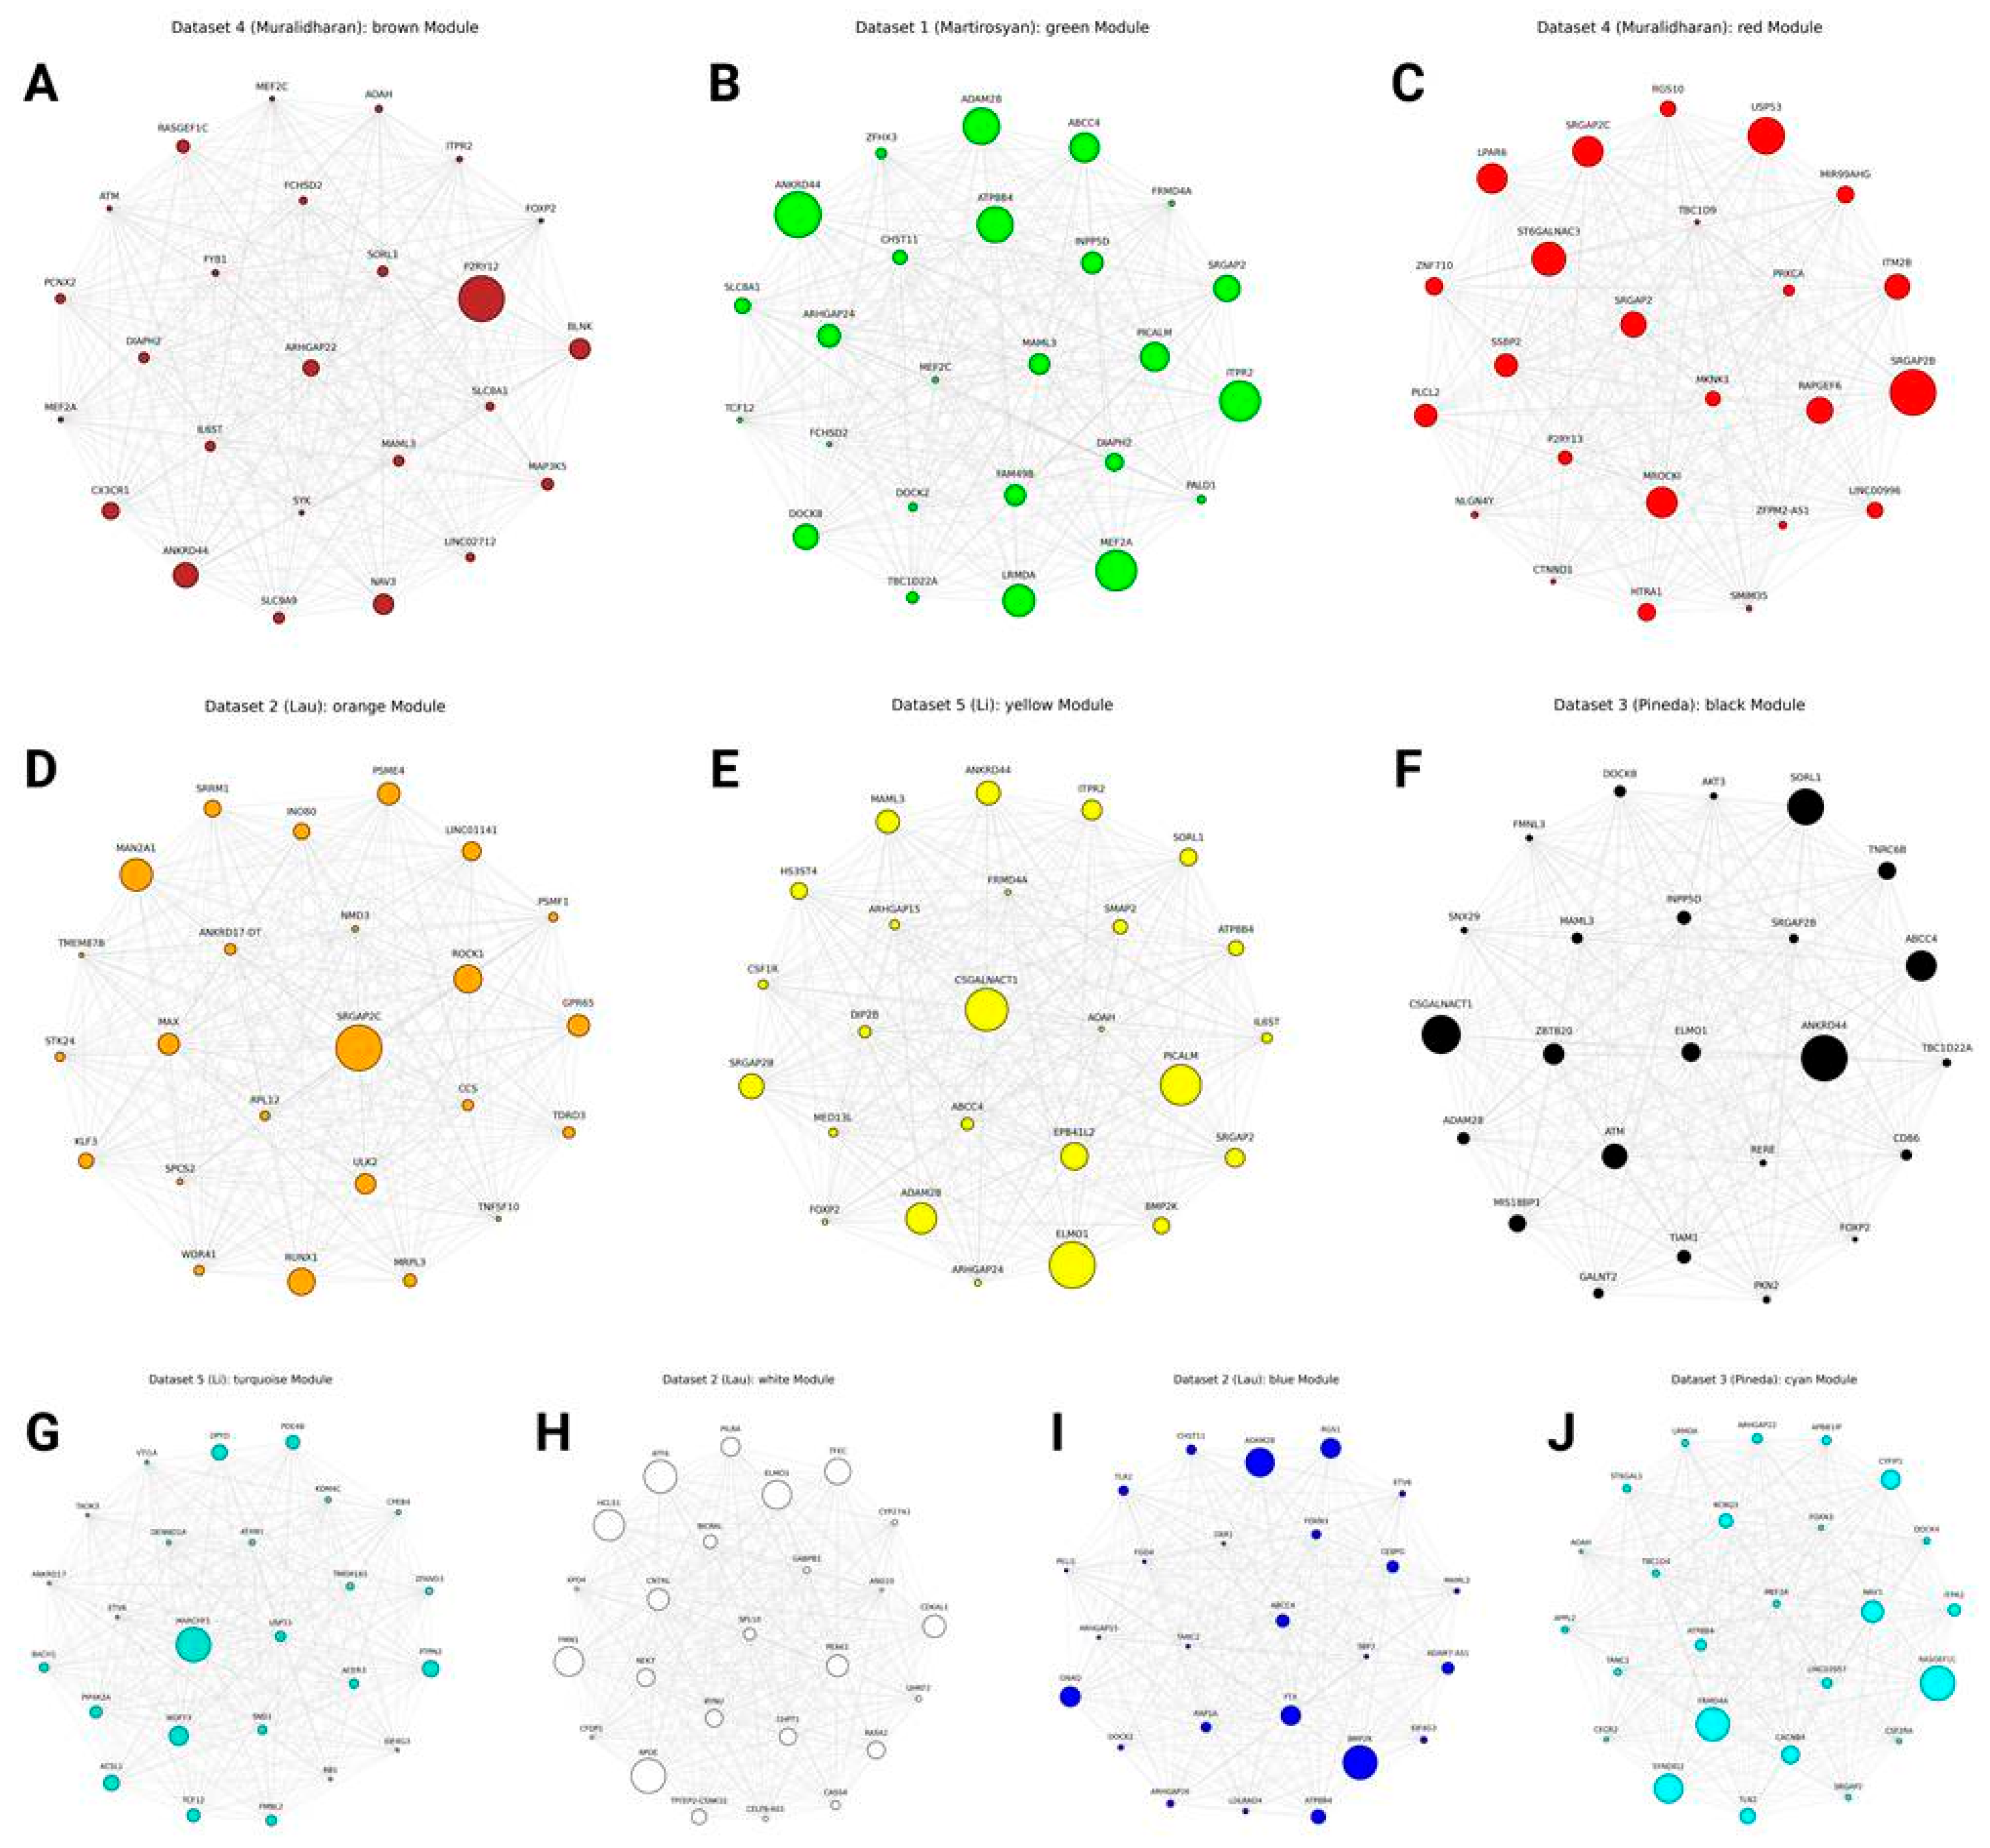
Figure 14.
Transcriptional factor analysis results. A-C: top targets for selected TFs (A - FOXP1, B - FOXP2, C - MITF). D-L: top TFs for selected targets (D - DPYD, E - LRRK2, F - GPNMB, G - IQGAP2, H - SPP1, I - TMEM163, J - SORL1, K - TANC2, L - NHSL1). M: heatmap for all TF-target pairs discussed in this section.
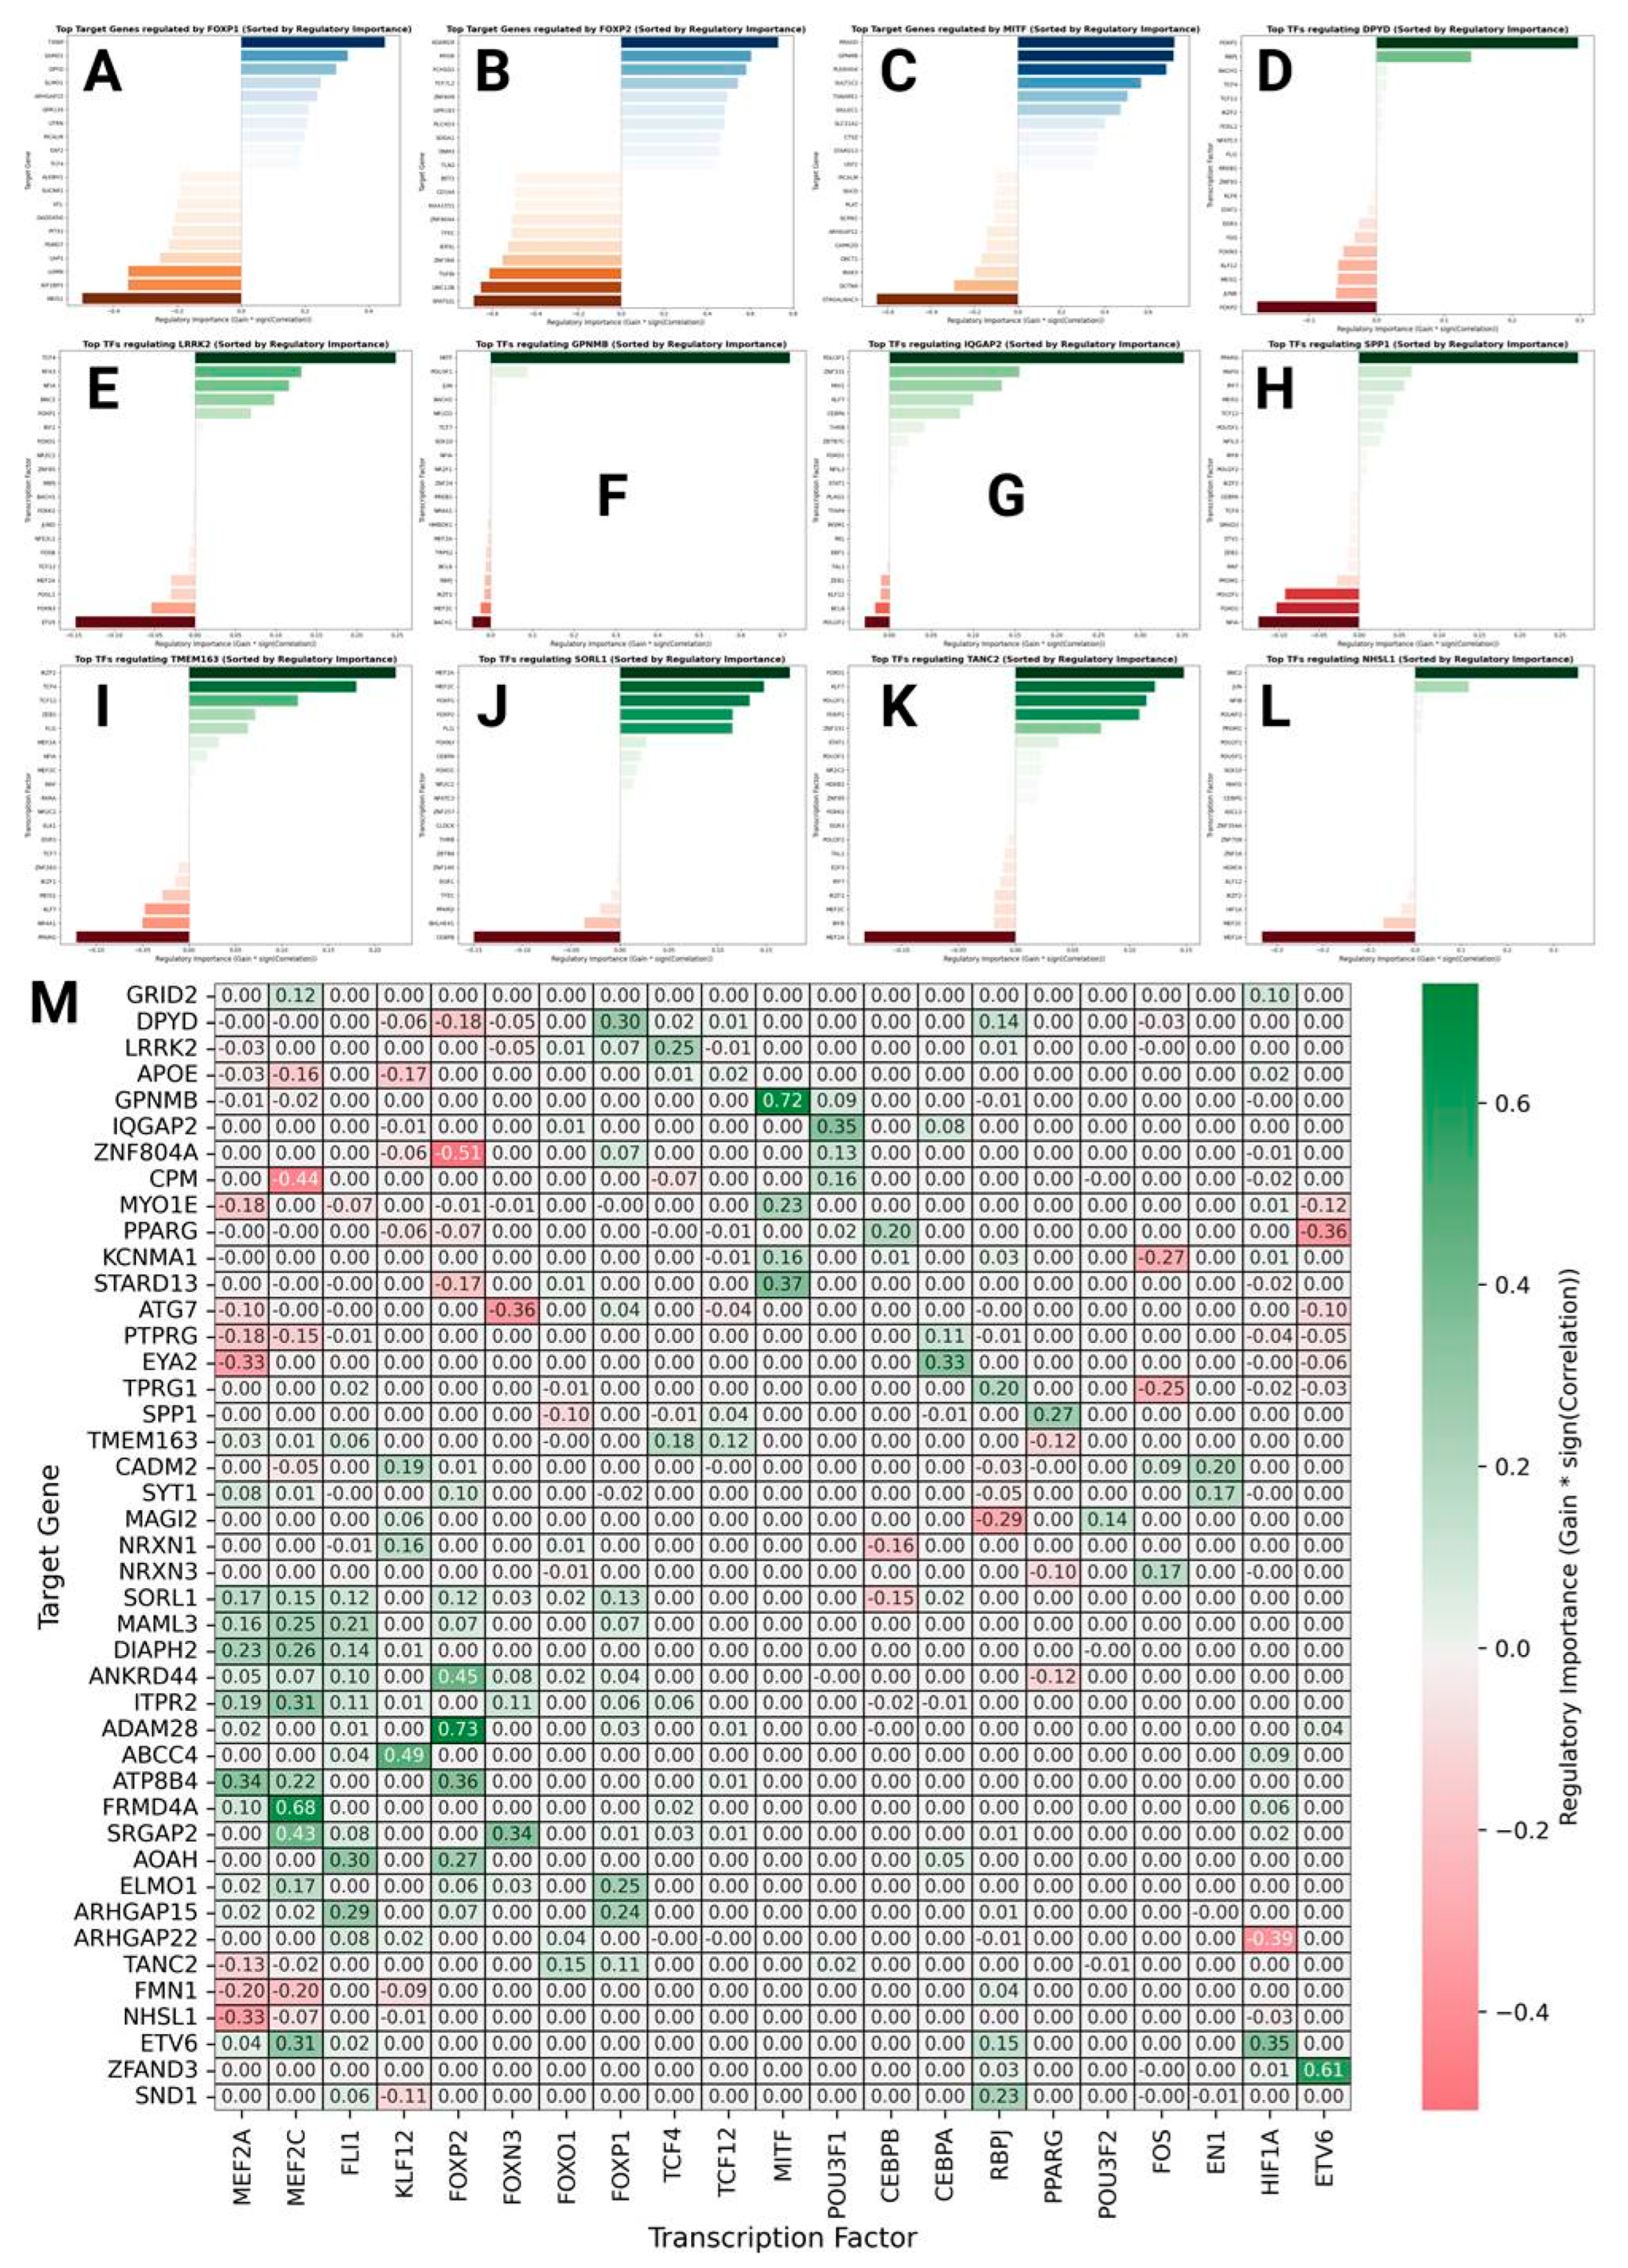

Table 1.
Overview of datasets used in this study.
| Dataset | First author (Year) | Species | Condition(s) | Brain region(s) | Sample count | Microglia nuclei count | Reference |
| Dataset 1 | Martirosyan (2024) | Homo sapiens | PD vs Control | Midbrain | 29 | 18,149 | [12] |
| Dataset 2 | Lau (2020) | Homo sapiens | AD vs Control | Prefrontal cortex | 21 | 6,702 | [13] |
| Dataset 3 | Pineda (2024) | Homo sapiens | ALS vs FTLD vs Control | Prefrontal cortex + Motor cortex | 145 (73 donors) | 27,735 | [14] |
| Dataset 4 | Muralidharan (2025) | Homo sapiens | Old vs Young | Prefrontal cortex | 31 | 7,739 | [15] |
| Dataset 5 | Li (2025) | Homo sapiens | AD vs Control | Temporal cortex | 56 | 22,865 | [16] |
| Dataset 6 | Zhang (2021) | Macaca fascicularis | Old vs Young | Hippocampus | 15 | 39,589 | [17] |
Table 2.
Hub genes found in hdWGCNA-derived modules across 4 or 5 human datasets.
| Dataset | Module (position among hub genes) |
Module GO enrichment (first term) |
Module enrichment (logFC, p-value) |
| SORL1 | |||
| Dataset 1 | greenyellow (5) | Protein Phosphorylation (GO:0006468) | PD (0.003, 8.96E-06) |
| Dataset 2 | lightyellow (3) | Positive Regulation Of Supramolecular Fiber Organization (GO:1902905) | AD (0.483, 0.0062) |
| Dataset 3 | black (3) | Positive Regulation Of T Cell Proliferation (GO:0042102) | ALS > Control (0.730, 9.46E-33); FTLD > Control (0.768, 1.01E-95); FTLD > ALS (-0.038, 2.83E-30) |
| Dataset 4 | brown (12) | Positive Regulation Of GTPase Activity (GO:0043547) | Young (-1.689, 1.23E-112) |
| Dataset 5 | yellow (11) | Regulation Of Intracellular Signal Transduction (GO:1902531) | Control (-0.473, 5.78E-14) |
| MAML3 | |||
| Dataset 1 | green (14) | Positive Regulation Of GTPase Activity (GO:0043547) | Control (-0.302, 3.5E-10) |
| Dataset 2 | blue (18) | Regulation Of Intracellular Signal Transduction (GO:1902531) | NS AD (0.777, 1.00) |
| Dataset 3 | black (14) | Positive Regulation Of T Cell Proliferation (GO:0042102) | ALS > Control (0.730, 9.46E-33); FTLD > Control (0.768, 1.01E-95); FTLD > ALS (-0.038, 2.83E-30) |
| Dataset 4 | brown (10) | Positive Regulation Of GTPase Activity (GO:0043547) | Young (-1.689, 1.23E-112) |
| Dataset 5 | yellow (8) | Regulation Of Intracellular Signal Transduction (GO:1902531) | Control (-0.473, 5.78E-14) |
| ARHGAP15 | |||
| Dataset 1 | brown (4) | Regulation Of Small GTPase Mediated Signal Transduction (GO:0051056) | NS PD (0.032, 0.055) |
| Dataset 2 | blue (23) | Regulation Of Intracellular Signal Transduction (GO:1902531) | NS AD (0.777, 1.00) |
| Dataset 3 | magenta (12) | Peptidyl-Serine Phosphorylation (GO:0018105) | ALS > Control (0.407, 0.029); FTLD > Control (1.991, 1.35E-270); FTLD > ALS (-1.584, 0.00) |
| Dataset 4 | yellow (2) | Positive Regulation Of Axon Extension (GO:0045773) | Old (2.293, 3.67E-05) |
| Dataset 5 | yellow (19) | Regulation Of Intracellular Signal Transduction (GO:1902531) | Control (-0.473, 5.78E-14) |
| ETV6 | |||
| Dataset 1 | brown (22) | Regulation Of Small GTPase Mediated Signal Transduction (GO:0051056) | NS PD (0.032, 0.055) |
| Dataset 2 | blue (16) | Regulation Of Intracellular Signal Transduction (GO:1902531) | NS AD (0.777, 1.00) |
| Dataset 3 | green (12) | Growth Hormone Receptor Signaling Pathway Via JAK-STAT (GO:0060397) | NS ALS > Control (0.069, 1.00); FTLD > Control (0.173, 3.02E-04); NS FTLD > ALS (-0.104, 0.083) |
| Dataset 4 | turquoise (8) | Protein Phosphorylation (GO:0006468) | Old (5.685, 1.72E-12) |
| Dataset 5 | turquoise (21) | Regulation Of Protein Kinase Activity (GO:0045859) | AD (0.323, 1.05E-20) |
| FMNL2 | |||
| Dataset 1 | blue (4) | Positive Regulation Of Pinocytosis (GO:0048549) | Control (-0.264, 0.0048) |
| Dataset 2 | yellow (20) | Detection Of Muscle Stretch (GO:0035995) | NS AD (1.184, 1.00) |
| Dataset 3 | royalblue (10) | Negative Regulation Of Autophagosome Assembly (GO:1902902) | NS ALS > Control (0.177, 1.00); FTLD > Control (1.500, 1.38E-102); FTLD > ALS (-1.323, 2.44E-145) |
| Dataset 4 | turquoise (24) | Protein Phosphorylation (GO:0006468) | Old (5.685, 1.72E-12) |
| Dataset 5 | turquoise (9) | Regulation Of Protein Kinase Activity (GO:0045859) | AD (0.323, 1.05E-20) |
| ELMO1 | |||
| Dataset 1 | brown (5) | Regulation Of Small GTPase Mediated Signal Transduction (GO:0051056) | NS PD (0.032, 0.055) |
| Dataset 2 | white (5) | Sterol Catabolic Process (GO:0016127) | NS AD (0.008, 0.617) |
| Dataset 3 | black (8) | Positive Regulation Of T Cell Proliferation (GO:0042102) | ALS > Control (0.730, 9.46E-33); FTLD > Control (0.768, 1.01E-95); FTLD > ALS (-0.038, 2.83E-30) |
| Dataset 4 | Not included | ||
| Dataset 5 | yellow (1) | Regulation Of Intracellular Signal Transduction (GO:1902531) | Control (-0.473, 5.78E-14) |
| ZFAND3 | |||
| Dataset 1 | brown (6) | Regulation Of Small GTPase Mediated Signal Transduction (GO:0051056) | NS PD (0.032, 0.055) |
| Dataset 2 | Not included | ||
| Dataset 3 | midnightblue (9) | Response To Lipopolysaccharide (GO:0032496) | NS ALS > Control (0.160, 1.00); NS Control > FTLD (-0.576, 1.00); NS ALS > FTLD (0.736, 1.00) |
| Dataset 4 | turquoise (2) | Protein Phosphorylation (GO:0006468) | Old (5.685, 1.72E-12) |
| Dataset 5 | turquoise (14) | Regulation Of Protein Kinase Activity (GO:0045859) | AD (0.323, 1.05E-20) |
| MEF2A | |||
| Dataset 1 | green (2) | Positive Regulation Of GTPase Activity (GO:0043547) | Control (-0.302, 3.5E-10) |
| Dataset 2 | yellow (2) | Detection Of Muscle Stretch (GO:0035995) | NS AD (1.184, 1.00) |
| Dataset 3 | cyan (19) | Positive Regulation Of Arp2/3 Complex-Mediated Actin Nucleation (GO:2000601) | ALS > Control (0.561, 1.41E-27); NS Control > FTLD (-0.024, 1); ALS > FTLD (0.585, 5.58E-32) |
| Dataset 4 | brown (21) | Positive Regulation Of GTPase Activity (GO:0043547) | Young (-1.689, 1.23E-112) |
| Dataset 5 | Not included | ||
| ITPR2 | |||
| Dataset 1 | green (3) | Positive Regulation Of GTPase Activity (GO:0043547) | Control (-0.302, 3.5E-10) |
| Dataset 2 | Not included | ||
| Dataset 3 | cyan (9) | Positive Regulation Of Arp2/3 Complex-Mediated Actin Nucleation (GO:2000601) | ALS > Control (0.561, 1.41E-27); NS Control > FTLD (-0.024, 1); ALS > FTLD (0.585, 5.58E-32) |
| Dataset 4 | brown (21) | Positive Regulation Of GTPase Activity (GO:0043547) | Young (-1.689, 1.23E-112) |
| Dataset 5 | yellow (9) | Regulation Of Intracellular Signal Transduction (GO:1902531) | Control (-0.473, 5.78E-14) |
| ADAM28 | |||
| Dataset 1 | green (4) | Positive Regulation Of GTPase Activity (GO:0043547) | Control (-0.302, 3.5E-10) |
| Dataset 2 | blue (2) | Regulation Of Intracellular Signal Transduction (GO:1902531) | NS AD (0.777, 1.00) |
| Dataset 3 | black (13) | Positive Regulation Of T Cell Proliferation (GO:0042102) | ALS > Control (0.730, 9.46E-33); FTLD > Control (0.768, 1.01E-95); FTLD > ALS (-0.038, 2.83E-30) |
| Dataset 4 | Not included | ||
| Dataset 5 | yellow (4) | Regulation Of Intracellular Signal Transduction (GO:1902531) | Control (-0.473, 5.78E-14) |
| ABCC4 | |||
| Dataset 1 | green (7) | Positive Regulation Of GTPase Activity (GO:0043547) | Control (-0.302, 3.5E-10) |
| Dataset 2 | blue (7) | Regulation Of Intracellular Signal Transduction (GO:1902531) | NS AD (0.777, 1.00) |
| Dataset 3 | black (5) | Positive Regulation Of T Cell Proliferation (GO:0042102) | ALS > Control (0.730, 9.46E-33); FTLD > Control (0.768, 1.01E-95); FTLD > ALS (-0.038, 2.83E-30) |
| Dataset 4 | Not included | ||
| Dataset 5 | yellow (16) | Regulation Of Intracellular Signal Transduction (GO:1902531) | Control (-0.473, 5.78E-14) |
| ATP8B4 | |||
| Dataset 1 | green (5) | Positive Regulation Of GTPase Activity (GO:0043547) | Control (-0.302, 3.5E-10) |
| Dataset 2 | blue (6) | Regulation Of Intracellular Signal Transduction (GO:1902531) | NS AD (0.777, 1.00) |
| Dataset 3 | cyan (10) | Positive Regulation Of Arp2/3 Complex-Mediated Actin Nucleation (GO:2000601) | ALS > Control (0.561, 1.41E-27); NS Control > FTLD (-0.024, 1); ALS > FTLD (0.585, 5.58E-32) |
| Dataset 4 | Not included | ||
| Dataset 5 | yellow (14) | Regulation Of Intracellular Signal Transduction (GO:1902531) | Control (-0.473, 5.78E-14) |
| SRGAP2 | |||
| Dataset 1 | green (9) | Positive Regulation Of GTPase Activity (GO:0043547) | Control (-0.302, 3.5E-10) |
| Dataset 2 | Not included | ||
| Dataset 3 | cyan (21) | Positive Regulation Of Arp2/3 Complex-Mediated Actin Nucleation (GO:2000601) | ALS > Control (0.561, 1.41E-27); NS Control > FTLD (-0.024, 1); ALS > FTLD (0.585, 5.58E-32) |
| Dataset 4 | red (8) | Positive Regulation Of Ras Protein Signal Transduction (GO:0046579) | Young (-3.523, 0.00) |
| Dataset 5 | yellow (10) | Regulation Of Intracellular Signal Transduction (GO:1902531) | Control (-0.473, 5.78E-14) |
| SRGAP2B | |||
| Dataset 1 | Not included | ||
| Dataset 2 | cyan (1) | Regulation Of Postsynapse Organization (GO:0099175) | NS Control (-0.948, 1.00) |
| Dataset 3 | black (18) | Positive Regulation Of T Cell Proliferation (GO:0042102) | ALS > Control (0.730, 9.46E-33); FTLD > Control (0.768, 1.01E-95); FTLD > ALS (-0.038, 2.83E-30) |
| Dataset 4 | red (1) | Positive Regulation Of Ras Protein Signal Transduction (GO:0046579) | Young (-3.523, 0.00) |
| Dataset 5 | yellow (6) | Regulation Of Intracellular Signal Transduction (GO:1902531) | Control (-0.473, 5.78E-14) |
| FRMD4A | |||
| Dataset 1 | green (23) | Positive Regulation Of GTPase Activity (GO:0043547) | Control (-0.302, 3.5E-10) |
| Dataset 2 | yellow (19) | Detection Of Muscle Stretch (GO:0035995) | NS AD (1.184, 1.00) |
| Dataset 3 | cyan (2) | Positive Regulation Of Arp2/3 Complex-Mediated Actin Nucleation (GO:2000601) | ALS > Control (0.561, 1.41E-27); NS Control > FTLD (-0.024, 1); ALS > FTLD (0.585, 5.58E-32) |
| Dataset 4 | Not included | ||
| Dataset 5 | yellow (22) | Regulation Of Intracellular Signal Transduction (GO:1902531) | Control (-0.473, 5.78E-14) |
| SND1 | |||
| Dataset 1 | red (2) | ERAD Pathway (GO:0036503) | PD (0.139, 4.09E-12) |
| Dataset 2 | Not included | ||
| Dataset 3 | red (1) | Response To Endoplasmic Reticulum Stress (GO:0034976) | NS ALS > Control (2.594, 1.00); NS FTLD > Control (0.137, 1.00); NS ALS > FTLD (2.456, 1.00) |
| Dataset 4 | magenta (5) | Innate Immune Response-Activating Signaling Pathway (GO:0002758) | Old (3.250, 3.03E-12) |
| Dataset 5 | turquoise (13) | Regulation Of Protein Kinase Activity (GO:0045859) | AD (0.323, 1.05E-20) |
| ARHGAP22 | |||
| Dataset 1 | greenyellow (3) | Protein Phosphorylation (GO:0006468) | PD (0.003, 8.96E-06) |
| Dataset 2 | cyan (14) | Regulation Of Postsynapse Organization (GO:0099175) | NS Control (-0.948, 1.00) |
| Dataset 3 | cyan (12) | Positive Regulation Of Arp2/3 Complex-Mediated Actin Nucleation (GO:2000601) | ALS > Control (0.561, 1.41E-27); NS Control > FTLD (-0.024, 1); ALS > FTLD (0.585, 5.58E-32) |
| Dataset 4 | brown (6) | Positive Regulation Of GTPase Activity (GO:0043547) | Young (-1.689, 1.23E-112) |
| Dataset 5 | Not included | ||
| ANKRD44 | |||
| Dataset 1 | green (1) | Positive Regulation Of GTPase Activity (GO:0043547) | Control (-0.302, 3.5E-10) |
| Dataset 2 | Not included | ||
| Dataset 3 | black (1) | Positive Regulation Of T Cell Proliferation (GO:0042102) | ALS > Control (0.730, 9.46E-33); FTLD > Control (0.768, 1.01E-95); FTLD > ALS (-0.038, 2.83E-30) |
| Dataset 4 | brown (2) | Positive Regulation Of GTPase Activity (GO:0043547) | Young (-1.689, 1.23E-112) |
| Dataset 5 | yellow (7) | Regulation Of Intracellular Signal Transduction (GO:1902531) | Control (-0.473, 5.78E-14) |
| TCF12 | |||
| Dataset 1 | green (24) | Positive Regulation Of GTPase Activity (GO:0043547) | Control (-0.302, 3.5E-10) |
| Dataset 2 | darkturquoise (6) | Mitochondrial Membrane Organization (GO:0007006) | Control (-0.552, 3.23E-04) |
| Dataset 3 | Not included | ||
| Dataset 4 | turquoise (4) | Protein Phosphorylation (GO:0006468) | Old (5.685, 1.72E-12) |
| Dataset 5 | turquoise (7) | Regulation Of Protein Kinase Activity (GO:0045859) | AD (0.323, 1.05E-20) |
| FMN1 | |||
| Dataset 1 | yellow (4) | Cellular Response To Epidermal Growth Factor Stimulus (GO:0071364) | PD (1.168, 5.51E-81) |
| Dataset 2 | white (4) | Sterol Catabolic Process (GO:0016127) | NS AD (0.008, 0.617) |
| Dataset 3 | blue (6) | Response To Unfolded Protein (GO:0006986) | Control > ALS (-8.516, 1.48E-08); FTLD > Control (2.746, 9.93E-267); FTLD > ALS (-11.262, 0.00) |
| Dataset 4 | turquoise (23) | Protein Phosphorylation (GO:0006468) | Old (5.685, 1.72E-12) |
| Dataset 5 | Not included | ||
| ATM | |||
| Dataset 1 | greenyellow (2) | Protein Phosphorylation (GO:0006468) | PD (0.003, 8.96E-06) |
| Dataset 2 | lightyellow (1) | Positive Regulation Of Supramolecular Fiber Organization (GO:1902905) | AD (0.483, 0.00623) |
| Dataset 3 | black (8) | Positive Regulation Of T Cell Proliferation (GO:0042102) | ALS > Control (0.730, 9.46E-33); FTLD > Control (0.768, 1.01E-95); FTLD > ALS (-0.038, 2.83E-30) |
| Dataset 4 | brown (22) | Positive Regulation Of GTPase Activity (GO:0043547) | Young (-1.689, 1.23E-112) |
| Dataset 5 | Not included | ||
| FAM135A | |||
| Dataset 1 | greenyellow (9) | Protein Phosphorylation (GO:0006468) | PD (0.003, 8.96E-06) |
| Dataset 2 | magenta (2) | mRNA Splicing, Via Spliceosome (GO:0000398) | NS AD (0.493, 0.068) |
| Dataset 3 | darkturquoise (3) | Immunoglobulin Mediated Immune Response (GO:0016064) | NS Control > ALS (-0.225, 1.00); FTLD > Control (0.632, 4.20E-54); FTLD > ALS (-0.856, 1.69E-110) |
| Dataset 4 | yellow (18) | Positive Regulation Of Axon Extension (GO:0045773) | Old (2.293, 3.67E-05) |
| Dataset 5 | Not included | ||
| SPTLC2 | |||
| Dataset 1 | grey60 (11) | Plasma Membrane Bounded Cell Projection Assembly (GO:0120031) | NS PD (0.038, 1.00) |
| Dataset 2 | cyan (22) | Regulation Of Postsynapse Organization (GO:0099175) | NS Control (-0.948, 1.00) |
| Dataset 3 | greenyellow (8) | N-glycan Processing (GO:0006491) | ALS > Control (0.165, 1.05E-07); NS Control > FTLD (-0.238, 1.00); ALS > FTLD (0.403, 1.82E-06) |
| Dataset 4 | pink (17) | Sphingosine Metabolic Process (GO:0006670) | Old (4.156, 1.57E-179) |
| Dataset 5 | Not included | ||
| ACER3 | |||
| Dataset 1 | grey60 (19) | Plasma Membrane Bounded Cell Projection Assembly (GO:0120031) | NS PD (0.038, 1.00) |
| Dataset 2 | Not included | ||
| Dataset 3 | green (11) | Growth Hormone Receptor Signaling Pathway Via JAK-STAT (GO:0060397) | NS ALS > Control (0.069, 1.00); FTLD > Control (0.173, 3.02E-04); NS FTLD > ALS (-0.104, 0.083) |
| Dataset 4 | pink (23) | Sphingosine Metabolic Process (GO:0006670) | Old (4.156, 1.57E-179) |
| Dataset 5 | turquoise (12) | Regulation Of Protein Kinase Activity (GO:0045859) | AD (0.323, 1.05E-20) |
| TANC2 | |||
| Dataset 1 | lightgreen (5) | Regulation Of Lipid Biosynthetic Process (GO:0046890) | PD (0.350, 1.06E-08) |
| Dataset 2 | blue (21) | Regulation Of Intracellular Signal Transduction (GO:1902531) | NS AD (0.777, 1.00) |
| Dataset 3 | magenta (8) | Peptidyl-Serine Phosphorylation (GO:0018105) | ALS > Control (0.407, 0.029); FTLD > Control (1.991, 1.35E-270); FTLD > ALS (-1.584, 0.00) |
| Dataset 4 | pink (12) | Sphingosine Metabolic Process (GO:0006670) | Old (4.156, 1.57E-179) |
| Dataset 5 | Not included | ||
| NHSL1 | |||
| Dataset 1 | lightgreen (17) | Regulation Of Lipid Biosynthetic Process (GO:0046890) | PD (0.350, 1.06E-08) |
| Dataset 2 | cyan (15) | Regulation Of Postsynapse Organization (GO:0099175) | NS Control (-0.948, 1.00) |
| Dataset 3 | lightyellow (11) | Humoral Immune Response Mediated By Circulating Immunoglobulin (GO:0002455) | Control > ALS (-1.103, 1.41E-12); FTLD > Control (1.604, 6.71E-74); FTLD > ALS (-2.708, 9.42E-246) |
| Dataset 4 | pink (9) | Sphingosine Metabolic Process (GO:0006670) | Old (4.156, 1.57E-179) |
| Dataset 5 | Not included | ||
| BMP2K | |||
| Dataset 1 | Not included | ||
| Dataset 2 | blue (1) | Regulation Of Intracellular Signal Transduction (GO:1902531) | NS AD (0.777, 1.00) |
| Dataset 3 | greenyellow (9) | N-glycan Processing (GO:0006491) | ALS > Control (0.165, 1.05E-07); NS Control > FTLD (-0.238, 1.00); ALS > FTLD (0.403, 1.82E-06) |
| Dataset 4 | yellow (1) | Positive Regulation Of Axon Extension (GO:0045773) | Old (2.293, 3.67E-05) |
| Dataset 5 | yellow (13) | Regulation Of Intracellular Signal Transduction (GO:1902531) | Control (-0.473, 5.78E-14) |
| AOAH | |||
| Dataset 1 | Not included | ||
| Dataset 2 | darkred (8) | Positive Regulation Of Mast Cell Degranulation (GO:0043306) | NS Control (-0.485, 0.403) |
| Dataset 3 | cyan (25) | Positive Regulation Of Arp2/3 Complex-Mediated Actin Nucleation (GO:2000601) | ALS > Control (0.561, 1.41E-27); NS Control > FTLD (-0.024, 1); ALS > FTLD (0.585, 5.58E-32) |
| Dataset 4 | brown (18) | Positive Regulation Of GTPase Activity (GO:0043547) | Young (-1.689, 1.23E-112) |
| Dataset 5 | yellow (25) | Regulation Of Intracellular Signal Transduction (GO:1902531) | Control (-0.473, 5.78E-14) |
Disclaimer/Publisher’s Note: The statements, opinions and data contained in all publications are solely those of the individual author(s) and contributor(s) and not of MDPI and/or the editor(s). MDPI and/or the editor(s) disclaim responsibility for any injury to people or property resulting from any ideas, methods, instructions or products referred to in the content. |
© 2025 by the authors. Licensee MDPI, Basel, Switzerland. This article is an open access article distributed under the terms and conditions of the Creative Commons Attribution (CC BY) license (http://creativecommons.org/licenses/by/4.0/).
Copyright: This open access article is published under a Creative Commons CC BY 4.0 license, which permit the free download, distribution, and reuse, provided that the author and preprint are cited in any reuse.


