
Submitted:
28 November 2025
Posted:
02 December 2025
You are already at the latest version
Abstract
Since there is no cure for Parkinson's disease yet, pharmacobiotic drugs based on the gut microbiota capable of producing the necessary pharmacologically active compo-nents are being developed. The drug LfU21 based on the strain of Limosilactobacillus fermentum U-21 is proposed as a candidate for pharmacobiotics in this work. To char-acterize the effectiveness of the studied drug, a combined LPS and lactacystin (LAC) induced PD model in the Wistar rat line was used. The analysis was performed using behavioral, biochemical, immune, and transcriptomic biomarkers. LfU21 reduces the level of α-synuclein, changes motor activity in the “Rung ladder” test and the expres-sion of the bdnf gene in both hemispheres of the brain. When exposed to LPS, LfU21 prevents changes in the level of the immune response, GSH, expression of the drd2 and bdnf genes, and the number of goblet cells in the intestine. When exposed to LAC and LAC+LPS, LfU21 prevents an increase in α-synuclein, a decrease in bdnf expression, and indicators in the “Open Field” and “Rung ladder” tests, respectively. The effect of LfU21 in a combined model of Parkinson's disease confirms its multifunctionality. This allows us to determine the cohort of patients for future clinical trials of LfU21.
Keywords:
Limosilactobacillus fermentum U-21
; pharmacobiotic
; Parkinson’s disease
; combined model
; lactacystin
1. Introduction
Parkinson's disease (PD), one of the most common neurodegenerative diseases, is particularly prevalent in people over the age of 65, and today more than 6 million people worldwide suffer from PD [1]. Most cases of PD are not caused by changes in the human genome, and genetic mutations are found in less than 15% of patients; the etiology of the disease requires further research [2,3,4]. According to the WHO, the prevalence of PD has doubled over the past 25 years. Global estimates suggest that more than 8.5 million people suffered from PD in 2019. Current estimates show that PD resulted in 5.8 million disability-adjusted life years (DALYs), which is 81% more than in 2000, and caused 329,000 deaths, which is more than 100% more than in 2000 [5]. In recent years, studies have emerged on the impact of COVID-19 on the progression of Parkinson's disease through neuroinflammation caused by cytokine storms [6]. PD leads to severe disability and requires significant treatment and rehabilitation costs, making it an important social problem [7]. One of the key problems in the treatment of PD is its late diagnosis, due to the late onset of clinical symptoms and the lack of biomarkers that would allow PD to be identified at an early stage [8,9,10,11]. The clinical motor symptoms of PD include resting tremor, bradykinesia, muscle rigidity, and gait and balance disorders. These motor disorders occur in patients in the late stages of the disease, when the loss of dopamine neurons exceeds 50%. The clinical manifestations of PD are preceded by a prodromal stage of the disease, characterized by progressive functional changes in the autonomic nervous system, including dysfunction of the enteric nervous system (ENS), manifested by disturbances in the motility of the gastrointestinal tract and the accumulation of the PD-pathognomonic protein α-synuclein in the neurons of the ENS [12]. According to one of the leading hypotheses [13], the pathogenesis of PD involves the gradual spread of pathological forms of α-synuclein from the peripheral nervous system to structures of the central nervous system (CNS), including the substantia nigra. The etiological factor triggering the pathological process of α-synuclein accumulation in the CNS may be inflammation in the intestine [14], as evidenced by increased α-synuclein expression and epithelial barrier permeability in the colon [15,16].
Lactacystin (LAC), a proteasome inhibitor, when administered to the substantia nigra, striatum, or medial forebrain bundle of experimental animals, caused increased α-synuclein expression and neurodegeneration in the nigrostriatal system [17]. However, it is not known whether there are any changes in structures of the nervous system more distant from the site of lactacystin administration, including the peripheral nervous system (PNS). There are also no data on the combined effect of inflammation and suppression of the ubiquitin-proteasome system in the CNS.
Classic toxic and neuroinflammatory models of PD do not reproduce one of the key features of PD in CNS neurons: the formation of Lewy bodies. However, according to the literature, the combined administration of neurotoxins with lactacystin caused the appearance of α-synuclein aggregates in the neurons of the substantia nigra [18,19]. In this regard, we hypothesized that the administration of lactacystin in a neuroinflammation model would also reproduce the formation of intraneuronal α-synuclein aggregates in neurons of the central and/or peripheral nervous system.
Thanks to the multifunctional connection between the enteric, central nervous, and immune systems, the gut can serve as a “point of application” for various therapeutic approaches to treating neurodegenerative diseases. The influence of functional bacteria and their metabolites on the processes of immune and nervous regulation of functions in the human body is currently being widely studied [8,20].
The development of drugs capable of effectively treating PD faces several challenges. The first is the presence of a large number of disorders (biomarkers of damage) in various organs and systems of the human body. Second, the inability of existing and developing synthetic and semi-synthetic drugs to correct disorders (damage) in several areas. Third, the low adequacy of existing animal models of Parkinson's disease and, as a result, problems with translating the data obtained to the human body. Fourth, the heterogeneity of the disease, its etiology, and the need for careful selection of patient cohorts for clinical trials. To a certain extent, these problems can be solved based on a new conceptual approach that we proposed in a recently published review [8]. This involves the development of live biotherapeutic drugs based on commensal bacteria (Lactobacillus) from the intestines of healthy individuals with a potentially multifunctional (multi-target) effect on the patient's body; construction of a model of the functional architecture of PD, involving the identification of key signs of the disease: neurological, neuroendocrine, immune, neuroinflammatory, biochemical, genetic, epigenetic, and others; selection of animal models and their combinations aimed at simulating the early stages of PD; subsequent selection of a cohort of patients for clinical trials adequate for the multi-locus effect of the pharmabiotics drug.
In this study, the strain Limosilactobacillus fermentum U-21 was investigated as a candidate for pharmabiotics. The strain was isolated from the feces of a healthy man (a astronaut after flight) living in the central European part of Russia. The strain is deposited in the All-Russian Collection of Industrial Microorganisms (VKPM) No. B-12075. Genome assembly in GenBank NCBI ASM286982v2. L. fermentum U-21 is characterized by the presence of genes and products with potential neuromodulatory, immunomodulatory, and anti-inflammatory activity [21]. The studied strain L. fermentum U-21 showed high antioxidant activity in vitro and in vivo studies using the oxidative stress inducer paraquat. In the E. coli K-12 bioluminescence system, it was found that the culture fluid of the L. fermentum U-21 strain inhibits paraquat activity by 25%. [22]. In a model of the free-living nematode Caenorhabditis elegans, the L. fermentum U-21 strain increased the median lifespan of nematodes under oxidative stress conditions [23]. In a model of induced Parkinsonism in rodents, the administration of L. fermentum U-21 in parallel with paraquat injections prevented the degradation of dopaminergic neurons in the brain [23] and pathological changes in internal organs [24]. In parallel with studies of the strain's properties in various in vitro and in vivo models, an analysis and search for low-molecular-weight metabolites, proteins, and enzymes that potentially determine the identified properties of the L. fermentum U-21 strain, the identification and characterization of pharmacologically active ingredients (PAIs) that determine the specific nosological properties of the pharmabiotics are among the key requirements for live biotherapeutic drugs being developed today. [21,25,26]. Using genomic, metabolomic, proteomic, and transcriptomic analysis, candidates for pharmacologically active ingredients were identified: ATP-dependent Clp protease ClpL, Chaperone protein DnaK, Thioredoxin reductase, NAD(P)/FAD-dependent oxidoreductase, LysM peptidoglycan-binding domain-containing protein, NlpC/P60 domain-containing protein, tryptophan, and niacin. Understanding that under normal intestinal conditions and during inflammatory processes, the strain can alter gene expression and produce a shifted PAI profile, transcriptomic and proteomic analysis was performed under the action of hydrogen peroxide (H2O2) [27]. Groups of genes that significantly alter their expression were identified: genes of the putative urea carboxylase operon, transport genes, including Fe2+ and Cu2+ metal ions, as well as the synthesis and catabolism of certain amino acids. Genomic analysis of the strain allowed the identification of 29 genes, including genes of the thioredoxin complex, whose products may exhibit antioxidant properties. Taken together, the data obtained demonstrate the unique antioxidant properties of the strain, allowing it to be positioned as a promising candidate for the development of a live biotherapeutic drug for the therapy of certain forms of Parkinson's disease. [24,28,29,30,31].
This study investigated various indicators associated with PD development: tyrosine hydroxylase, IBA1 protein in the brain, total and phosphorylated α-synuclein in the ganglia of the myenteric plexus in the intestine, expression of the genes ngf, drd2, bdnf, trkB in the striatum, markers of redox potential in the liver - superoxide dismutase (SOD), catalase (CAT), reduced glutathione (GSH); levels of cytokines IL6, IL10, TNF in the liver; assessment of the condition using behavioral tests. Tyrosine hydroxylase is an enzyme that limits the rate of dopamine synthesis, so studying this biomarker is important for assessing the degree of neurodegeneration in the brain [32]. IBA1 is considered a potential biomarker of microglial activation and early changes in PD [33,34]. Detection of α-synuclein and phosphorylated α-synuclein levels in the peripheral nervous system allows for the identification of earlier stages of PD [35]. The binding of BDNF (brain-derived neurotrophic factor) to its related receptor, TrkB, promotes the health of dopaminergic neurons by activating the receptor. BDNF gene expression is reduced in patients with PD [36,37]. NGF (nerve growth factor) has nerve growth-stimulating activity and is involved in the regulation of the growth and differentiation of sympathetic and sensory neurons [38,39]. The drd2 gene encodes the D2 dopamine receptor, one of the most common types of dopamine receptors in the brain. D2 receptors ensure the functioning of the dopaminergic system [40]. Oxidative stress plays a significant role in the pathogenesis of PD. The antioxidant enzymes superoxide dismutase (SOD) [41], сatalase (CAT) and GSH level reflect the redox balance [42]. Proinflammatory (IL6, TNF) and anti-inflammatory (IL10) cytokines reflect systemic inflammation, which is closely associated with neurodegeneration. Conducting “Open field” and “Rung ladder” tests in rats with a PD model is critical for an objective assessment of the motor and behavioral disorders characteristic of this disease. These tests allow us to judge the severity of neurodegenerative changes [43].
Research objective: to evaluate the effect of the studied pharmabiotics LfU21 based on the L.fermentum U-21 strain on biochemical, immunomodulatory, and transcriptional biomarkers, as well as animal behavior in a combined LPS+LAC model of PD in Wistar rats; to use the signatures of selected biomarkers in the subsequent formation of a cohort of patients for clinical studies.
2. Results
2.1. Histological Study for Tyrosine Hydroxylase and IBA1
The degree of damage to the dopaminergic system and the severity of the neuroinflammatory response were assessed by immunohistochemical staining for tyrosine hydroxylase, a key enzyme in catecholamine synthesis, and for the microglial protein IBA1. Intranigral administration of lactacystin, as well as combined exposure to lactacystin and LPS, led to a statistically significant decrease in the area of the right substantia nigra pars compacta (p<0.05) (Figure 1 and Figure 2). At the same time, an increase in the intensity of IBA1 immunostaining was observed in these groups (Figure 3), indicating microglial activation. In animals receiving only LPS, an increase in the intensity of IBA1 staining was noted at the trend level (p = 0.0610) (Figure 3). At the same time, the administration of LfU21 did not have a significant effect on the prevention of neurodegenerative changes and the development of a neuroinflammatory response in the substantia nigra pars compacta.
2.2. Transcriptional Biomarkers in the Rat Striatum
2.2.1. Dopamine Receptor D2 Gene Expression
RT-PCR was used to analyze the expression level of the dopamine D2 receptor gene in the striatum of rat brains in both hemispheres (Figure 4). The LfU21 drug itself does not cause a statistically significant change in drd2 gene expression in either hemisphere compared to expression in control animals. Intraperitoneal administration of LPS leads to a significant (~3-fold) increase in expression in the right hemisphere compared to the expression of this gene in control animals (Figure 4B). Administration of LfU21 corrects the effect of LPS (Figure 4B). In addition, the expression of the drd2 gene under the influence of LPS in the right hemisphere is statistically significantly different from the groups with lactacystin (LAC+NaCl) and combined (LAC+LPS) Parkinson's disease models (Figure 4B). The administration of LAC does not lead to a change in the expression of the drd2 gene in either the right or left hemisphere. There is a statistically significant difference between the expression of the drd2 gene in the left hemisphere under the influence of LAC and in the combined model (Figure 4A). Comparison of the hemispheres showed a difference in drd2 gene expression between the hemispheres in the NaCl+LPS (p<0.05) and LAC+LPS (p<0.05) groups.
2.2.2. Nerve Growth Factor Gene Expression
RT-PCR was used to analyze the expression level of the nerve growth factor (ngf) gene in the striatum of rat brains in both hemispheres (Figure 5). The drug LfU21 does not cause a statistically significant change in ngf gene expression in both hemispheres compared to expression in control animals (Figure 5). Intraperitoneal administration of LPS resulted in a slight decrease in gene expression in the right hemisphere compared to the control group (Figure 5B), while in the left hemisphere, expression was at the level of expression in control animals (Figure 5A). LAC injection did not lead to a significant change in expression in either hemisphere, as did the combined administration of LPS and lactacystin.
2.2.3. Brain-Derived Neurotrophic Factor Gene Expression
RT-PCR was used to analyze the expression level of the brain-derived neurotrophic factor gene (bdnf) in the striatum of rat brains in both hemispheres (Figure 6). The drug LfU21 led to a statistically significant change in gene expression in the left and right hemispheres. The administration of LPS led to a decrease in bdnf gene expression in both hemispheres, while the drug prevented a sharp drop in expression. Injection of LAC, as well as the combined effect of LAC and LPS, led to a statistically significant decrease in bdnf gene expression in the right hemisphere—the hemisphere where lactacystin was administered (Figure 6B), which was not observed in the left hemisphere (Figure 6A). The drug prevented a statistically significant decrease in bdnf gene expression in the combined BP model in the right hemisphere (Figure 6B). Comparison of the effects of substances and drugs on different hemispheres showed a difference in bdnf gene expression between hemispheres in the Ctrl group (p<0.001): bdnf gene expression in the left hemisphere is lower than in the right, Ctrl+LfU21 (p<0.001): expression in the left hemisphere is higher than in the right.
2.2.4. Neuronal Receptor Tyrosine Kinase-2 Gene Expression
RT-PCR was used to analyze the expression level of the neuronal receptor tyrosine kinase-2 gene (trkB) in the striatum of rat brains in both hemispheres (Figure 7). The drug LfU21 had no statistically significant effect on trkB gene expression in any of the groups studied. Injection of LAC, administration of LPS, and their combined effect also did not lead to changes in trkB gene expression.
2.3. Morphometric Study of the Small Intestine
2.3.1. Immunofluorescence Staining for Total and Phosphorylated α-Synuclein in the Ganglia of the Myenteric Plexus of the Small Intestine of Rats Wistar
A statistically significant increase in staining intensity was observed in the small intestine for both total (Figure 8, 10A) and phosphorylated α-synuclein (Figure 9 and Figure 10B) compared to the control in all experimental groups. Administration of LfU21 led to a decrease in staining intensity for total α-synuclein in all experimental groups and for phosphorylated α-synuclein in the group receiving lactacystin.
2.3.2. Assessment of the Number of Goblet Cells in the Epithelium of the Small Intestine of Rats
Both in the combined model and when LAC and LPS were administered separately, there was a statistically significant increase in the number of goblet cells in the intestinal epithelium. The most pronounced changes were observed in the group that received only LPS. The drug LfU21 caused a significant decrease in the number of goblet cells in the group that received LPS (Figure 11 and Figure 12).
2.4. Investigation of Biochemical Markers in the Liver of Rats Wistar
Under the influence of oxidative stress, the activity of SOD, which catalyzes the conversion of superoxide anion into oxygen and hydrogen peroxide, increases. The SOD level in the NaCl+LPS and LAC+LPS groups is higher than in the control group, indicating a response to oxidative stress (Figure 13A). The drug LfU21 prevents an increase in SOD activity in the LAC+LPS+LfU21 group. The level of SOD activity is statistically significantly reduced in the combined model with the addition of the drug LfU21 compared to the corresponding group that did not receive the drug. In the latter case, SOD activity is lower than its activity in the control group of animals. In the group that received only lactacystin (LAC+NaCl), SOD activity is reduced relative to the control, while the drug LfU21 normalizes SOD to the control level. The use of the drug itself does not change SOD activity compared to the control group.
CAT catalyzes the decomposition of hydrogen peroxide. CAT activity increases during oxidative stress. CAT activity levels are elevated in the LAC+LPS and NaCl+LPS groups. In the NaCl+LPS+LfU21 group, the drug normalizes CAT to the level of the control group. In the LAC+LPS+LfU21 group, the effect of the drug is less expressed. The use of the drug does not change CAT activity in the Ctrl +LfU21 group relative to the control group (Figure 13B).
Reduced glutathione is oxidized by superoxide anion or hydroxyl anion and, therefore, is consumed during oxidative stress (Figure 13C). A significant decrease in GSH is observed in the NaCl+LPS and LAC+LPS groups. The drug LfU21 prevents the GSH decrease in the NaCl+LPS+LfU21 and LAC+LPS+LfU21 groups. The addition of the drug LfU21 increases the GSH content in the liver of rats compared to the control group.
2.5. Immunomodulatory Biomarkers in Liver of Rats Wistar
Using enzyme-linked immunosorbent assay (ELISA), the content of proinflammatory cytokines IL6, TNF, and anti-inflammatory cytokine IL10 was assessed in the livers of rats from different experimental groups (Figure 14). The LfU21 drug itself does not lead to statistically significant activation of IL6, IL10, or TNF. Intraperitoneal administration of LPS leads to a statistically significant increase in the amount of IL6, IL10, and TNF in the livers of rats, while the drug LfU21 prevents an increase in these indicators. The administration of lactacystin slightly reduces the levels of IL6 and IL10, and the drug prevents a decrease in these indicators. With combined administration of LPS and lactacystin, no activation of the cytokines under study is observed. However, there is a statistically significant difference in the quantitative content of cytokines in the liver of rats between the experimental groups, for IL6 between the NaCl+LPS and LAC+NaCl groups, and between LAC+NaCl and LAC+LPS; for IL10 between the LAC+NaCl and LAC+LPS groups; for TNF between the NaCl+LPS and LAC+NaCl groups, and between NaCl+LPS and LAC+LPS. (Figure 14).
2.6. Analysis of the General Condition of Rats Wistar by Behavioral Tests
2.6.1. Quality of Execution of the Step in the “Rung ladder” Test
The Rung ladder test showed that animals with a combined PD model (LAC+LPS) demonstrated a significant decrease in the quality of their front limb steps compared to control animals (p = 0.04). The administration of LfU21 had a multidirectional effect: in animals with a combined PD model (LAC+LPS+LfU21), the drug prevented a decrease in the quality of stepping (p = 0.04), whereas in control animals (Ctrl+LfU21), on the contrary, a deterioration in this indicator was observed (p = 0.02). In animals receiving only LPS or only LAC, the administration of the drug had no significant effect on step performance (p > 0.05) (Figure 15).
When analyzing step performance with the hind limbs, no statistically significant differences between the groups were found (p > 0.05).
When comparing the index for the left limbs, a tendency (p = 0.07) toward a decrease in step quality was found in animals in the LAC+LPS group compared to control animals (Figure 16A).
A similar analysis for the right limbs showed more marked differences: animals receiving LPS (NaCl+LPS) showed a significant decrease in step quality compared to control animals (p = 0.03). In addition, control animals receiving the drug (Ctrl+LfU21) showed a decrease in step quality compared to control animals without the drug (p = 0.002) (Figure 16B).
Analysis of the total test time showed that animals receiving LAC demonstrated a significant increase in total time compared to control animals (p = 0.006). Similarly, animals exposed to the combined effects of LAC and LPS also showed an increase in total time compared to control animals (p = 0.03). The effect of the drug on the studied indicator was not detected (p > 0.05) (Figure 17A).
As for neurotization indicators, an increase in the total score was noted on the corresponding scale in animals that received LPS and LAC separately, as well as in those exposed to the combined effects of these toxins (p = 0.05, p = 0.03, and p = 0.03, respectively) (Figure 17B).
2.6.1. Assessment of Motor Activity in the “Open Field” Test
In the “Open field” test, a significant decrease in the number of rears was observed in animals in the LAC group (p = 0.02) and a tendency toward a decrease in the LAC+LPS group (p = 0.09). Administration of the drug prevented a decrease in the indicator in both animals receiving only LAC (p = 0.01) and animals with a combined PD model (p = 0.03) (Figure 18).
A multidirectional effect of the drug on horizontal motor activity indicators was also noted. Animals receiving only LAC showed a decrease in distance traveled (p = 0.004), while animals with a combined model showed a tendency toward an increase (p = 0.08) (Figure 19A).
In addition, it was found that animals receiving only LAC, as well as animals with a combined PD model, showed a significant decrease in the number of grooming acts compared to the control group (p = 0.007 and p = 0.03, respectively) (Figure 19B).
3. Discussion
Parkinson's disease is associated with functional disorders (damage) of many genes in various organs and systems of the body at different stages of its development. This was the reason for choosing L.fermentum U-21 (LfU21) as a candidate for live biotherapeutic products. Previously, using omics technologies, it has been shown that it is capable of synthesizing a number of pharmacologically active substances with potential anti-Parkinson's properties [21,22,23]. The multifunctionality of the synthesized ingredients suggests that the LfU21 drug candidate is capable of recovering (correcting) several impaired functions. The next important step was to select a combined PD model.
In this study, we propose a combined model of Parkinsonism to simulate the multifactorial etiology of PD and reproduce the key features of the disease. The first “hit” is a neurotoxic effect of lactacystin on the substantia nigra pars compacta. This toxin acts as an inhibitor of proteasome activity through its derivative, clasto-lactacystin-β-lactone, which irreversibly blocks the 20S proteasome complex, contributing to the pathological accumulation of α-synuclein and its subsequent aggregation [44]. The second “hit” was the systemic activation of the immune system caused by intraperitoneal administration of lipopolysaccharide (LPS) from the bacterial wall of gram-negative bacteria. As shown, the endotoxin used, acting as a pathogen-associated pattern, is capable of activating pattern recognition receptors, which ultimately stimulates immune cells to activate the cytokine response. Synthesized peripheral cytokines can be actively transported to the CNS through the circumventricular organs, where the blood-brain barrier is more permeable, or transmit impulses through their receptors on the afferents of the vagus nerve. These events together may contribute to the development of neuroinflammation through local cytokine production by microglia and astrocytes, leading to the loss of dopaminergic neurons and exacerbating the course of the disease [45].
In our work, we used various biomarkers covering different aspects involved in the development of PD. The brain, liver, and the intestine were selected as the main organs for analysis. In the brain, the following were analyzed: tyrosine hydroxylase and IBA1 protein levels and the expression of the drd2, ngf, bdnf, and trkB genes. In the liver, the redox potential and cytokine content were analyzed by measuring SOD, CAT, GSH, IL6, IL10, and TNF. In the intestine, the levels of total and phosphorylated α-synuclein were measured, as well as the number of goblet cells. In addition to functional biomarkers, the results of the “Rung ladder” and “Open Field” behavioral tests were recorded to assess the general condition of the body.
In our study, intranigral administration of lactacystin, both alone and in combination with lipopolysaccharide, caused marked degeneration of the dopaminergic system and activation of microglia in the substantia nigra pars compacta. The data obtained are consistent with the results of previous studies showing that the combined effect of a proteasome inhibitor and a systemic inflammatory stimulus (lipopolysaccharide) enhances the neurotoxic effect and reproduces key pathomorphological features of Parkinsonism, including the death of dopaminergic neurons and activation of microglia [46]. Despite the antioxidant and potentially neuroprotective properties of LfU21, in this case, its use did not prevent the development of neurodegenerative and neuroinflammatory changes. Previous studies have shown that oral administration of LfU21 can mitigate the glial response and reduce the accumulation of phosphorylated α-synuclein in a model of PD induced by the combined effects of intranigral LPS and systemic administration of paraquat, although it did not prevent the death of dopaminergic neurons [31].
The dopamine D2 receptor (DRD2) is one of five different dopamine receptors that have been identified in humans and shows high expression in both the pituitary gland and the central nervous system [47]. DRD2 is involved in the regulation of dopaminergic signaling, motor control, and a number of cognitive processes. Mice with reduced DRD2 density show significant neuroinflammatory response and increased vulnerability of dopaminergic neurons to MPTP-induced neurotoxicity [48]. In rats with a significant deficit in dopamine release, D2 receptor levels are elevated. In addition, increased D2 receptor activity is observed in the human putamen in the early stages of sporadic PD [49]. Thus, drd2 gene expression may be a marker of dopamine deficiency and, importantly. As mentioned above, drd2 receptor activation increases with dopamine deficiency in the early stages of PD, which we observe in our study: in the right hemisphere of rats receiving LPS, the level of drd2 gene expression is higher compared to the control group, the combined PD model group, and the group receiving lactacystin. The effect of LPS was also noted in the left hemisphere, since the drd2 expression level in the combined PD model group was higher compared to the group that received only lactacystin.
Nerve growth factor (NGF) is a neurotrophic factor responsible for the development and survival of sympathetic, sensory, and cholinergic neurons [39]. Degenerative diseases are almost always associated with the loss of neuronal structure and function, which may be related to insufficient synthesis and/or release of neurotrophic factors, including NGF [50]. Studies show that NGF signaling is significantly affected in neurodegenerative brain diseases [51]. However, in our study, ngf gene expression was not altered in either hemisphere in all study groups, indicating a weak effect of the studied factors (LPS and lactacystin) on the expression of this gene.
The second growth factor related to the neurotrophin family, like NGF, is BDNF (brain-derived neurotrophic factor). BDNF promotes neuron survival, maturation, synapse formation, synaptic plasticity, and neurogenesis in the central nervous system [52]. In PD, there is a decrease in BDNF levels in the nigrostriatal pathway, where the dopaminergic neurons affected by the disease are located. This decrease is associated with the progression of neurodegeneration and deterioration of motor and cognitive functions [53]. BDNF, interacting with its receptor - neuronal receptor tyrosine kinase-2 (TrkB), contributes to the creation of the BDNF/TrkB signaling pathway. This signaling pathway is reduced in neuropathology and PD [54]. This reduction correlates positively with the severity and duration of the disease [55]. Currently, drugs are being actively developed that activate the BDNF/TrkB signaling pathway and can attenuate PD neuropathology [37]. Thus, joint analysis of bdnf and trkB gene expression can contribute to the detection of the degree of pathology and, in our study, serve as an indicator of the model quality. In our work, we observe a decrease in bdnf gene expression in both the combined PD model and when the rats were exposed to LPS and lactacystin separately, which indicates that both the combined model and separate exposure to LPS and lactacystin contribute to the simulation of the pathological condition. The drug LfU21 prevents such a strong decrease in bdnf gene expression.
In addition, in the right hemisphere—the hemisphere where lactacystin was administered—there was a statistically significant decrease in BDNF gene expression in both the combined model and when LPS or lactacystin was administered separately. In the left hemisphere, a statistically significant decrease in BDNF gene expression was observed only in the group receiving LPS alone. Thus, we established different effects of the studied substances on the right and left hemispheres. The effect of the drug LfU21 also turned out to be multidirectional and different in the hemispheres: in the left hemisphere, the drug leads to a statistically significant increase in BDNF gene expression, while in the right hemisphere, a statistically significant decrease in this indicator is observed. Thus, LfU21 probably involves different PAIs and different mechanisms when acting on the right and left hemispheres of the brain. The identification of PAIs and their mechanisms of action is undoubtedly of significant fundamental interest. In addition, there is a difference between the expression of the bdnf gene in the right and left hemispheres of control animals: gene expression is higher in the right hemisphere than in the left, which has been noted in other studies [56]. BDNF is directly involved in BDNF/TrkB signaling, which, according to the literature, is reduced in PD [37]. In our study, we found that the expression level of the trkB gene remained unchanged in all experimental groups. This suggests that in the combined PD model studied, BDNF/TrkB signaling is most likely limited by a decrease in bdnf gene expression, but not trkB.
It is known that reactive oxygen species (ROS) are key mediators of various neurological disorders. LPS causes neuroinflammation and neurodegeneration mediated by LPS-induced reactive oxygen species and, consequently, oxidative stress [57,58]. Indicators of oxidative stress levels are oxidative stress markers, primarily superoxide dismutase (SOD), reduced glutathione (GSH), and catalase (CAT) [59]. The presence of oxidative stress is expressed in increased levels of SOD and CAT activity and decreased GSH content.
Glutathione is an important antioxidant that exists in cells in two forms: reduced (GSH) and oxidized (GSSG). The ratio of these forms is an important indicator of the redox state of the cell and plays a key role in protecting cells from oxidative stress by neutralizing free radicals and absorbing O2, H2O2, and LOOH. GSH is a substrate for enzymes necessary for the degradation of hydrogen peroxide. Glutathione is involved in detoxification and metabolism, providing protection against damage caused by toxins and inflammation [60]. According to various studies, GSH levels decrease during both short-term and long-term oxidative stress [61,62]. The experiments showed a significant decrease in GSH content in the NaCl+LPS and LAC+LPS groups. LfU21 prevented the decrease in GSH in the NaCl+LPS+LfU21 and LAC+LPS+LfU21 groups compared to the corresponding groups without the drug. The most significant positive effect of LfU21 was observed in the LAC+LPS+LfU21 group compared to LAC+LPS. The administration of LfU21 increases the GSH level relative to the control group, but no significant changes were found in the LAC+NaCl+LfU21 group compared to LAC+NaCl (where no decrease in GSH was observed).
Superoxide dismutase (SOD) plays an important role in the balance of oxidation and antioxidation in vivo. SOD catalyzes the dismutation of superoxide into oxygen and hydrogen peroxide, which prevents damage to cells by superoxide anions. When oxidative stress occurs, SOD activity increases, but during prolonged oxidative stress, SOD activity decreases [63]. In experiments, SOD levels were elevated in the NaCl+LPS and LAC+LPS groups, indicating a response to oxidative stress. The drug LfU21 prevents an increase in SOD activity in the NaCl+LPS+LfU21 and LAC+LPS+LfU21 groups without affecting enzyme activity in the control group.
Catalase (CAT) is an enzyme capable of effectively decomposing hydrogen peroxide and is a binding enzyme with iron porphyrin. Catalase activity increases with increased oxidative stress and decreases with decreased oxidative stress [64]. The experiments showed an increase in CAT activity in the LAC+LPS and NaCl+LPS groups. In the NaCl+LPS+LfU21 group, the drug normalized CAT activity to the level of the control group, while in the LAC+LPS+LfU21 group, the effect was less expressed. The administration of LfU21 did not change CAT activity in the Ctr+LfU21 group compared to the control. According to the results of a study of biochemical markers in the liver of rats, the drug LfU21 contributes significantly to the normalization of antioxidant enzyme and glutathione levels in groups that received LPS intraperitoneally.
Balanced immune system function plays an important role in the pathogenesis of PD. Changes in innate and adaptive immunity underlie central and peripheral inflammation. Cytokines are key modulators of the immune response, controlling both pro- and anti-inflammatory responses [65]. According to many studies, there is upregulation of both TNF and IL6 in the cerebrospinal fluid, brain tissue, and peripheral blood of patients with PD [66,67,68]. Also, IL6 levels in the blood correlate with the severity of PD [69]. The level of the anti-inflammatory cytokine IL10 is also elevated in the blood serum in PD and correlates with clinical indicators of gastrointestinal dysfunction in patients [70]. Since the liver plays a central role in the perception of systemic inflammation and the response to it, in our study we investigated the content of cytokines specifically in the liver, which is explained by the more accurate level of detection in the ELISA method used [71]. In our study, we found increased levels of both pro-inflammatory (TNF, IL6) and anti-inflammatory (IL10) cytokines in the livers of rats in the LPS-treated group, which correlates with existing studies [72,73]. The drug LfU21 prevents an increase in the expression of the cytokines studied in the group receiving LPS, which indicates its significant immunomodulatory properties. In addition, differences in IL6 and IL10 levels in the liver were observed between the combined model groups and the group receiving lactacystin, which also indicates a significant effect of LPS on the levels of pro- and anti-inflammatory cytokines. LPS as a single substance leads to stronger TNF activation than in combination with lactacystin. The mechanisms of this antisynergism require further study.
It is believed that one of the triggers leading to the development of PD is a form of intestinal microbiome dysbiosis and the accumulation of pathogenic bacteria capable of producing various toxins and LPS [8]. This leads to damage to the intestinal epithelial barrier and an increase in blood LPS levels [74]. The effect of LPS on the tissues of the intestine itself leads to the development of inflammation in it, which, in turn, leads to an increase in the expression of α-synuclein in the structures of the enteric nervous system [74].
One of the morphological signs of inflammation in the intestine is an increase in the number of goblet cells in the epithelium and an increase in the amount of mucus they produce. In our study, the number of goblet cells in the epithelium of intestinal villi increased in the groups treated with LPS, LAC, and LPS+LAC. The mucus produced by goblet cells creates a protective layer that prevents pathogens from penetrating the epithelium [75]. The increase in the number of goblet cells reflects the response of the epithelium to stress associated with inflammation (with systemic administration of LPS) and damage to the nigrostriatal system of the brain (with intracerebral administration of lactacystin). Experimental studies show that neurodegeneration in the nigrostriatal system can lead to morphological signs of inflammation in the intestine, including an increase in the number of goblet cells in the epithelium [76]. In our study, an increase in the number of goblet cells in the epithelium was accompanied by an increase in the content of total and phosphorylated α-synuclein in the myenteric ganglia of the small intestine. Contrary to our expectations, the administration of LPS in combination with lactacystin did not lead to more significant phosphorylation of α-synuclein in the intestine.
Since the relationship between the gut microbiota and the development of various neurodegenerative diseases, including PD, is widely accepted and studied in the scientific community, the possibility of modulating the pathogenesis of these diseases by altering the microbiota is undoubtedly relevant [77,78,79,80]. According to the “gut-brain axis” hypothesis, the earliest changes associated with the accumulation of α-synuclein are observed in the nervous tissue of the intestine [81]. These changes trigger the pathological process leading to neurodegeneration in the brain. According to this hypothesis, influencing the gut microbiota to reduce the accumulation of α-synuclein in the enteric nervous tissue can slow down or even stop the entire pathogenic process. In our study, we investigated the effect of the drug LfU21 on the dynamics of changes in the number of goblet cells in the epithelium and the accumulation of total and phosphorylated α-synuclein in rats treated with LPS, LAC, and LPS+LAC. Administration of LfU21 prevented an increase in the number of goblet cells in the LPS-treated rats. These results indicate a probable anti-inflammatory effect of strain U-21 in the intestine. Our results also showed the effectiveness of strain U-21 in reducing the accumulation of α-synuclein in the myenteric ganglia of the intestine, which supports its therapeutic potential in the early stages of PD.
In our study, the combined effect of LPS and LAC led to motor dysfunction in the “Rung Ladder” test, manifested in a decrease in step quality and an increase in test completion time. Similar results in a similar model were previously demonstrated by Deneyer et al. [46], who showed a decrease in the time animals remained on a rotating drum in the “Rotarod” test. At the same time, motor disorders, both with combined exposure to toxins and each component separately, were accompanied by the development of non-motor disorders, which manifested itself in the intensification of a neurosis-like state. The neuroticism of the animals was assessed on a corresponding scale. Our data are consistent with the results of other studies in which the administration of 6-OHDA caused anxiety-like behavior in rats in the elevated plus maze test [82].
The results of the “Open field” test showed that the administration of lactacystin had the most significant effect on the manifestation of motor symptoms of PD. Animals that received only lactacystin showed a decrease in vertical motor activity and the number of grooming acts, which was apparently caused by a disruption in the nigrostriatal pathway that regulates the execution of coordinated motor patterns [83].
The effect of LfU21 on motor disorders is multidirectional: for example, administration of the drug prevents a decline in step quality in experimental animals, whereas in control animals it worsens this indicator. These effects may be caused, in the first case, by the protective action of prolonged exposure through the modulation of inflammatory processes during the development of neurodegeneration [84,85,86], and in the second case, by the induction of systemic low-grade inflammation [87]. Thus, the modulatory effect of the drug is manifested mainly in pathological conditions and also depends on the physiological status of the host organism.
These results are consistent with previously published data. Thus, the use of various probiotics, prebiotics, or combinations thereof (Lactobacillus salivarius AP-32, Bifidobacterium animalis ssp. lactis Bb12, and Lactobacillus rhamnosus GG) alleviated motor impairments in rats with PD models induced by intracerebral administration of 6-OHDA or LPS in tests such as the “rotarod”, “apomorphine test”, “cylinder”, and “narrowing beam” [88,89].
LfU21 did not have a significant effect on the time taken to complete the “Rung Ladder” test. This may indicate that the protective effect is manifested primarily in the quality of the steps performed, rather than in the speed of task completion.
Thus, our results demonstrate that LfU21 has a protective effect on motor function in rats with a combined model of PD induced by LAC and LPS, presumably through antioxidant mechanisms and a reduction in the accumulation of α-synuclein in the intestine.
Table 1 summarizes the results of changes in the studied biomarkers obtained on the combined PD model, its components, and their correction with LfU21.
Table S1 lists the genes and proteins of the Limosilactobacillus fermentum U-21 strain that could potentially determine its pharmacological properties, characterizing the potential anti-Parkinson's properties of the drug. The action of the substances produced by these genes can be realized in several ways: 1) by interacting with TLR epithelial cells of the intestine [90]; 2) by directly entering the bloodstream [91,92,93]; 3 3) by packaging into vesicles and transporting them [94]. The drug LfU21 produces a number of amino acids: histidine, glycine, and arginine, which, through metabolism in the intestine, can influence processes in the brain [95,96,97]. In addition, the drug produces ATP-dependent Clp protease, which has proven disaggregating properties, and a number of proteasomes (Zinc metalloprotease HtpX, ATP-dependent zinc metalloprotease FtsH), which may be involved in the processes of reducing α-synuclein content in the intestine [98]. LfU21 produces proteins of the thioredoxin complex, which is responsible for antioxidant potential [99].
Identifying and refining the mechanisms of PAIs presented in Table S1 that cause the correction of specific PD biomarkers at various stages of the disease is a necessary and difficult process for the advancement of any LBP aimed at treating a specific nosology, in this case PD.
4. Materials and Methods
4.1. Bacterial Strain
The strain Limosilactobacillus fermentum U-21 (NCBI Reference Sequence NZ_CP103293.1), belonging to the collection of the Laboratory of Bacterial Genetics of the Vavilov Institute of General Genetics of the Russian Academy of Sciences, was isolated from the feces of an astronaut. The strain was deposited in the All-Russian Collection of Industrial Microorganisms under the number B-12075.
4.2. Culture Media, Growth Conditions and Lyophilization
Limosilactobacillus fermentum U-21 was cultivated in an industrial-type culture medium developed by our laboratory under controlled fermentation conditions. The production medium contained: 75% whey obtained from 12% skimmed milk powder, 7% lactopeptone, 2% yeast extract, 2% inulin, 0.002% ascorbic acid, 0.05% sodium chloride, 0.005% manganese sulfate, and 0.02% magnesium sulfate. Cultivation was carried out in laboratory fermenters (Prointech, Russia) at a temperature of 37 °C and a stirring speed of 100 rpm, without aeration; the initial pH of the medium was 6.8. The production medium was inoculated with 2% (v/v) of the seed material obtained after sequential cultivation of the strain on MRS agar medium (HiMedia, India) and subsequent growth in MRS liquid medium. MRS liquid medium contains proteose peptone 10 g/L, beaf extract 10 g/L, yeast extract 5 g/L, dextrose 20 g/L, tween-80 1 g/L, ammonium citrate 2 g/L, sodium acetate 5 g/L, magnesium sulfate 0.1 g/L, manganese sulfate 0.05 g/L, sodium hydrophosphate 2 g/L. In MRS solid agar medium, the composition is identical to the liquid medium except for the replacement of sodium hydrophosphate with potassium hydrophosphate 2 g/L, and the addition of agar-agar 12 g/L.
For lyophilisation, the 20-h culture (3х109 CFU/mL) was centrifuged at 7000g at 4 °C for 10 min, then washed with PBS buffer (potassium dihydrophosphate 1.7 mM, sodium dihydrophosphate 5.2 mM, sodium chloride 150 mM, pH = 7.4), resuspended in lyophilisation medium (10% sucrose, 1% gelatin). The mixture was kept at -20 °C for 24 hours and then dried at -52 °C and 0.42 mbar pressure for 72 hours on a Labconco 2.5 lyophilic dryer (Labconco, USA). The obtained lyophilisates were stored at 4 °C. Their viability and titre were checked before use in the experiment.
4.3. Animal Collection and Maintenance
All experiments were conducted in compliance with appropriate bioethical standards for working with laboratory animals, including the possible reduction in the number of animals used. The studies were approved by the Ethics Committee of the Russian Center of Neurology and Neurosciences (protocol No. 2-4/25 dated February 17, 2025).
The study was conducted on male Wistar rats (n=82) at the age of 3.5 months, with a body weight of 300-350 g at the start of the experiment.
Manipulations with animals were carried out in accordance with Recommendation No. 33 of the Board of the Eurasian Economic Commission dated November 14, 2023 “On Guidelines for Working with Laboratory (Experimental) Animals in Preclinical (Non-Clinical) Studies,” as well as guided by the “Rules for Working with Laboratory Rodents and Rabbits” (GOST 33216-2014). The animals were kept in standard vivarium conditions, with free access to food and water, under a 12-hour light/dark cycle. Prior to the start of the experiment, the animals were kept in quarantine for 14 days.
4.4. Surgical Operations and Experimental Design
For stereotactic operations, animals were placed on a laboratory stereotaxis frame (RWD, PRC), the scalp was incised, and trepanation holes were drilled in the skull using a portable drill to access specific brain structures according to the coordinates of the rat brain atlas [100]. When placing animals in stereotaxis, a cotton-gauze mattress was placed between the animal and the work surface to prevent hypothermia during the operation.
The lactacystin (LAC) solution (ENZO, Switzerland) (4 μg in 3 μl of saline solution) was administered once into the substantia nigra pars compacta of the brain of rats on the right side (n=43) in accordance with the coordinates of the Paxinos rat brain atlas: (AP = –4.8; L = 2.2; V = 8.0). The same volume of saline was injected into the left side. Sham-operated (control) animals (n=39) received bilateral injections of 3 μl of saline. Intraperitoneal (i.p.) administration of LPS solution from Escherichia coli O111:B4 (Sigma-Aldrich, USA) at a dose of 1 mg/kg was started 3 days after the administration of lactacystin and was performed twice a week for 4 weeks, for a total of 8 injections, with a volume of 0.25 ml. The pharmabiotics L. fermentum U-21 (1.5x10¹⁰ CFU) were diluted in 3 ml of saline solution and administered orally (per os), starting 2 days after surgery, at a daily dose of 0.3 ml of solution [24].
The experimental animals were divided into 8 groups: 1) sham-operated animals with i.p. and per os administration of saline solution (“Ctrl”, n=9), 2) sham-operated animals with i.p. administration of saline and per os administration of pharmabiotic (“Ctrl+LfU21”, n=9), 3) rats with lactacystin injection and i.p. and per os administration of saline (“LAC+NaCl+NaCl”, n=11), 4) rats with lactacystin injection, i.p. administration of saline, and per os administration of LfU21 (“LAC+NaCl+LfU21”, n=10), 5) sham-operated rats with i.p. administration of LPS and per os administration of saline (NaCl+LPS+NaCl, n=11), 6) sham-operated rats with i.p. administration of LPS and per os administration of LfU21 (NaCl+LPS+LfU21, n=10), 7) rats with lactacystin injection, i.p. administration of LPS, and per os administration of saline (“LAC+LPS+NaCl,” n=11), 8) rats with lactacystin injection, i.p. administration of LPS, and per os administration of LfU21 (“LAC+LPS+LfU21”, n=11).
The animals were removed from the experiment two months after stereotactic surgery to measure the studied parameters (Figure 20).
4.4. Analysis of Behavioral Activity
In order to identify the development of neurotoxins (lactacystin and LPS), the behavior of animal biomodels was tested at intervals determined by the experimental design (8 weeks after stereotactic surgery). The tests used in the study were the “Rung Ladder” test [101] and the “Open Field” test [102].
The “Rung Ladder” test is used to assess motor function and coordination in rats and mice. The test evaluates the number of correct paw placements on the rungs and the number of slips and misses when placing the paw (in points), followed by the calculation of the Skilled walking performance score (SWPS), as well as neuroticism [103] and test completion time [104]. A more complex version of the test involves gaps in the bars, which are used to assess coordination between the front and hind limbs (OpenScience, Russia).
Motor disorders were assessed in the “Open Field” test. The setup consists of a 78x78x40 box made of rigid PVC, and the test lasts 3 minutes.
Recording and subsequent analysis of behavioral indicators were performed using the Any-Maze video surveillance system (Stoelting Inc., USA) with software.
4.5. Transcription Analysis
4.5.1. RNA Extraction and Reverse Transcription Reaction
After the end of the experiment, three individuals were taken from each experimental group. The rats were decapitated using a guillotine, and the striatum samples on ice were placed in IntactRNA (Eurogen, Russia) and subsequently stored according to the manufacturer's protocol. RNA was isolated from striatum tissue using ExtractRNA reagent (Eurogen, Russia) according to manufacturer’s recommendations. Extracted RNA was dissolved in water without nucleases (Eurogen, Russia). To analyze the quality of the isolated RNA, gel electrophoresis was performed. After the RNA was isolated and its quality was checked, additional processing was carried out. The samples were processed with DNase I (diaGene, Russia) according to the manufacturer's protocol. The reverse transcription reaction was performed using the MMLV RT kit (Eurogen, Russia) according to the manufacturer's recommendations.
4.5.2. Real-Time qPCR
The reaction mixture was prepared using the qPCRmix-HS SYBR kit (Eurogen, Russia) according to the manufacturer's recommendations. qPCR was performed on a CFX96 device (Bio-Rad, USA). The amplification program was carried out as follows: melting – 5 minutes, 95 °C, denaturation – 30 seconds, 95 °C, annealing – 30 seconds, 57,6 °C (for drd2 gene), 64 °C (for ngf gene), 54,7 °C (for bdnf gene), or 62°C (for trkB gene) elongation – 30 seconds, 72 °C. The last three steps were repeated cyclically 40 times, then a DNA melting curve was obtained. To analyze the qPCR data, the CFX Manager V 3.1 program (Bio-Rad, USA) was used. The relative normalized expressions in three biological replicates (three independent individuals per point) were calculated as ∆∆Cq, the actb household gene was taken as the reference [105]. The primers were selected using primer-BLAST [106] (Table A1).
4.6. Markers of Redox Potential Analysis
A rat liver sample was homogenized in liquid nitrogen and placed in a PBS (0.01M pH7.4) 1v/10v buffer cooled to +4 °C, vortexed and centrifuged at 10000g for 10 minutes to remove undissolved particles. An undiluted solution was used to measure the GSH content, and to determine the activity of CAT and SOD, the solution was diluted 10 times. The SOD activity, CAT activity, the content of reduced glutathione (GSH) were measured using a colorimetric method using a commercial kits (E-BC-K031-S, Elabscience, China; IS104(A001-1-2), Cloud-Clone Corp., China; E-BC-K030-S, Elabscience, China) according to the manufacturer's instructions.
4.7. The Study of the Immunomodulatory Activity of the Strain Using ELISA
Rat liver samples were homogenized in a fresh lysis buffer (25 mM Tris-HCl pH 7.4, 150 mM NaCl, 1 mM EDTA and 1% NP-40) with a glass homogenizer on ice. Then, ultrasound treatment with the Vibra Cell device (Sonics, Newtown, CT, USA) was performed. The program was set as follows: amplitude 40%, 5 s working mode, 10 s rest, 15 cycles. Then, centrifugation at 10,000×g for 15 min at 4 °C was performed. The supernatant was collected into new tubes, and the protein concentration in the samples was measured using a Qubit fluorimeter (Invitrogen, USA). Commercial ELISA kits were used to determine the quantitative content of cytokines in rat liver (HEA133Ra, HEA079Ra, HEA056Ra, Cloud-Clone Corp., China). Optical density was measured at 450 nm using a Multimode Detector DTX 880 reader (Beckman Coulter, USA).
4.8. Histological Preparations and Analysis
4.8.1. Morphometric Study of the Substantia nigra pars compacta
For morphological examination, decapitation was performed using a guillotine, the brain was removed and fixed for 24 hours in 10% formalin. Frontal sections 10 μm thick were prepared using a Tissue-Tek Cryo3 Flex cryostat (manufactured by Sakura FineTek®, USA). Thermal unmasking of antigens was performed in a steam cooker for 15 min (citrate buffer, pH 6.0). The sections were incubated with the corresponding primary antibodies in a humid chamber for 18 h at room temperature.
To detect tyrosine hydroxylase, monoclonal rabbit antibodies (1:250, ab137869, Abcam, UK) and secondary polyclonal antibodies to rabbit immunoglobulins (1:250, goat, Anti-Rb, CF488, SAB4600045-250UL (Sigma)). To detect microglia, monoclonal rabbit antibodies to the IBA1 (ionized calcium-binding adapter molecule 1) protein (1:300, ab178847, Anti-IBA1 Rb (abcam)) and secondary polyclonal antibodies to rabbit immunoglobulins (1:250, goat, Anti-Rb, CF488, SAB4600045-250UL (Sigma)). The sections were counterstained with DAPI. For the study, 5-6 consecutive sections (selected approximately every 50 μm) of substantia nigra were selected in the area of intranigral lactacystin administration. For quantitative assessment, the region of interest (the compact and reticular parts of the substantia nigra on the left and right) was manually selected in ImageJ ver. 1.54p (NIH) from images obtained with the same microscope lighting settings (Nikon SMZ-18). The staining intensity of IBA1 was evaluated in the selected area. Similarly, by selecting the area of interest and using the Bernsen threshold segmentation algorithm, the areas stained for tyrosine hydroxylase (neuron bodies and their processes) were segmented in the substantia nigra, and the area fraction of immunostained tissue was evaluated.
4.8.2. Morphometric Study of the Small Intestine
4.8.2.1. Immunofluorescence Staining for Total and Phosphorylated α-Synuclein in the Ganglia of the Myenteric Plexus of the Small Intestine of Rats Wistar
For immunomorphometric analysis, six animals were selected from each group. Sections of the small intestine approximately 10 cm long were excised at a distance of 30-40 cm from the pylorus and fixed in formalin for 24 hours. They were then cut crosswise into 3 mm thick pieces, impregnated with a 30% sucrose solution, then with Tissue-Tek O.C.T. (“Optimal cutting temperature”) Compound (Sakura Finetek, Japan) cryoblock reagent, and cut on a cryostat into 10 μm thick sections. Immunofluorescence reactions were performed using an indirect method, with primary antibodies to total α-synuclein (Rb, Sigma, 1:300) and α-synuclein phosphorylated at serine-129 (Ms, Abcam, 1:250) and secondary antibodies (goat anti-mouse CF488, Sigma, 1:250 and goat anti-rabbit Alexa fluor 594, Abcam, 1:250). The preparations were examined and photographed under a Nikon Eclipse NiU microscope with a Nikon DS-Qi digital camera at 40x magnification with the same microscope lighting system settings. Morphometry was performed using ImageJ software on photographs, with at least 30 fields of view per animal examined. The content of total and phosphorylated α-synuclein in the myenteric (intermuscular) ganglia was assessed indirectly by measuring the average intensity of fluorescent staining for these markers in the myenteric ganglia, the area of which was manually selected in the photographs, with correction for background staining.
4.8.2.2. Goblet Cells Count
To estimate the number of goblet cells in the epithelium, cryostat sections of the small intestine were stained with Alcian blue and counterstained with hematoxylin, then photographed at 25x magnification. The number of goblet cells per 100 μm of intestinal villi length was estimated from the photographs.
4.9. Statistical Analysis
Statistical processing of the results was carried out using GraphPad Prism 10.3.1 software (GraphPad, San Diego, CA, USA). To determine the statistical significance of the differences, a three-way ANOVA was used, a posteriori Fisher’s LSD test was used for comparison between groups, the results are presented as (mean ± SEM). The differences were considered significant at p<0.05.
5. Conclusions
In this study, biomarkers that can be adjusted by the biotherapeutic drug LfU21 were identified for the first time in a combined LAC+LPS model in Wistar rats. To date, at least two mechanisms of action of live biotherapeutic products (LBPs) on the host organism have been considered [8,88,107]. The first is the direct effect of pharmacologically active ingredients synthesized by functional bacteria on certain target biomarkers. Delivery can be carried out to the desired organ through the bloodstream and/or as part of vesicles formed by a specific functional bacterium [107]. Second, the LBP used directly or indirectly brings about positive changes in the composition of the body's intestinal microbiome. This study did not set out to elucidate the mechanisms of delivery of pharmacologically active ingredients to specific organs and systems, but it is clear that this is a necessary cycle of research for LfU21 and other LBPs. A complex and challenging task when using LBP is to identify the PAIs that target a specific nosology, in this case PD, and to study the molecular mechanisms of action on the host organism. LfU21 is the first in a series of live biotherapeutic products that can be potentially used in the treatment of PD. It is evident that, in the long term, it is necessary to seek a combination of complementary LBPs from functional bacteria in the gut microbiota using omics technologies and comprehensive databases. Since everything begins with inflammatory processes, and very often in the gut, the task is to select LBPs that normalize intestinal permeability. It is strategically important to form a functional architecture of PD [8], based on an integrated gene network of biomarkers in the human body and intestinal microbiota. The use of artificial intelligence technologies, including machine learning, can help in solving this problem. More specific tasks also need to be addressed: metabolomic analysis and the search for functionally significant biomarkers in feces, blood serum, and other accessible organs. The question of translating the results obtained to selected patient cohorts is the subject of our immediate interest.
Supplementary Materials
The following supporting information can be downloaded at the website of this paper posted on Preprints.org, Table S1: Characterization of the gene (protein) composition of the Limosilactobacillus fermentum U-21 strain with potential anti-parkinsonian properties. Asterisks (*) indicate the presence of these products in the vesicles.
Author Contributions
Conceptualization, A.V.S., S.N.I. and V.N.D.; methodology, D.A.R., O.B.B., A.V.S., D.N.V., A.A.V.; formal analysis, D.A.R., A.A.G., A.K.P., M.V.I.; investigation, D.A.R., O.B.B., A.V.S., D.N.V., A.A.G., A.K.P., I.A.P., V.S.L., M.V.O., D.A.M.; resources, S.N.I., V.N.D.; writing—original draft preparation, D.A.R., O.B.B., A.V.S., D.N.V., A.A.G., A.K.P., V.N.D.; writing—review and editing, D.A.R., O.B.B., A.V.S., A.K.P., V.S.L., M.V.O., D.A.M., A.A.V., S.N.I., V.N.D.; visualization, D.A.R., A.A.G., A.K.P.; supervision, O.O.B., A.V.S., A.A.V.; project administration, S.N.I., V.N.D.; funding acquisition, S.N.I., V.N.D.. All authors have read and agreed to the published version of the manuscript.
Funding
This research was funded by a grant of the Ministry of Science and Higher Education of the Russian Federation for the implementation of major scientific projects in priority areas of scientific and technological development (No. 075-15-2024-638).
Institutional Review Board Statement
The animal study protocol was approved by the Ethics Committee of Russian Сenter of Neurology and Neurosciences (protocol No. 2-4/25 of February 17, 2025)
Informed Consent Statement
Not applicable.
Data Availability Statement
Not applicable.
Acknowledgments
During the preparation of this manuscript, the authors used pictures rat-adult icon by Servier https://smart.servier.com/ is licensed under CC-BY 3.0 Unported https://creativecommons.org/licenses/by/3.0/; intestine icon by Servier https://smart.servier.com/ is licensed under CC-BY 3.0 Unported https://creativecommons.org/licenses/by/3.0/; arrow-right icon by Servier https://smart.servier.com/ is licensed under CC-BY 3.0 Unported https://creativecommons.org/licenses/by/3.0/ for the purposes of visualization. The authors have reviewed and edited the output and take full responsibility for the content of this publication.
Conflicts of Interest
The authors declare no conflicts of interest. The funders had no role in the design of the study; in the collection, analyses, or interpretation of data; in the writing of the manuscript; or in the decision to publish the results.
Abbreviations
The following abbreviations are used in this manuscript:
| PD | Parkinson's disease |
| LfU21 | Limosilactobacillus fermentum U-21 |
| LPS | lipopolysaccharide |
| LAC | lactacystin |
| ENS | enteric nervous system |
| CNS | central nervous system |
| PNS | peripheral nervous system |
| PAI | pharmacologically active ingredients |
| SOD | superoxide dismutase |
| CAT | catalase |
| GSH | reduced glutathione |
| BDNF | brain-derived neurotrophic factor |
| TrkB | neuronal receptor tyrosine kinase-2 |
| NGF | nerve growth factor |
| DRD2 | D2 dopamine receptor |
| IL6 | Interleukin 6 |
| IL10 | Interleukin 10 |
| TNF | tumor necrosis factor |
| ELISA | enzyme-linked immunosorbent assay |
Appendix A

Table A1.
Primers used for qPCR.
| Target gene | R/F1 | Nucleotide sequence (5‘→3’) | NCBI RefSeq |
| ngf | F | GTTTTGCCAAGGACGCAGCTTTC | NM_001277055.1 |
| R | GTTCTGCCTGTACGCCGATCAA | ||
| drd2 | F | GGCCCTTCAATGGGTCAGAA | NM_012547.3 |
| R | GTAGACCACAAAGGCAGGGT | ||
| bdnf | F | GAGCGTGTGTGACAGTATTAG | NM_001270635.1 |
| R | GTAGTTCGGCATTGCGAGTTC | ||
| trkB | F | GTGGAGGAAGGGAAGTCTGTG | XM_008771425.4 |
| R | CAGTGGTGGTCTGAGGTTGGA | ||
| βactin | F | AAGGCCAACCGTGAAAAGAT | NM_031144.3 |
| R | TGGTACGACCAGAGGCATAC |
1 F - forward sequence, R - reverse sequence.
References
- Tolosa, E.; Garrido, A.; Scholz, S.W.; Poewe, W. Challenges in the Diagnosis of Parkinson’s Disease. Lancet Neurol 2021, 20, 385–397. [Google Scholar] [CrossRef]
- Illarioshkin, S.N. Current Views on the Etiology of Parkinson’s Disease. 2015, 20, 4–13.
- Bonato, G.; Antonini, A.; Pistonesi, F.; Campagnolo, M.; Guerra, A.; Biundo, R.; Pilleri, M.; Bertolin, C.; Salviati, L.; Carecchio, M. Genetic Mutations in Parkinson’s Disease: Screening of a Selected Population from North-Eastern Italy. Neurol Sci 2025, 46, 165–174. [Google Scholar] [CrossRef]
- Trevisan, L.; Gaudio, A.; Monfrini, E.; Avanzino, L.; Di Fonzo, A.; Mandich, P. Genetics in Parkinson’s Disease, State-of-the-Art and Future Perspectives. Br Med Bull 2024, 149, 60–71. [Google Scholar] [CrossRef]
- WHO Parkinson Disease Available online: https://www.who.int/news-room/fact-sheets/detail/parkinson-disease (accessed on 14 November 2025).
- Zhang, J. Investigating Neurological Symptoms of Infectious Diseases like COVID-19 Leading to a Deeper Understanding of Neurodegenerative Disorders Such as Parkinson’s Disease. Front Neurol 2022, 13, 968193. [Google Scholar] [CrossRef] [PubMed]
- Stocchi, F.; Bravi, D.; Emmi, A.; Antonini, A. Parkinson Disease Therapy: Current Strategies and Future Research Priorities. Nat Rev Neurol 2024, 20, 695–707. [Google Scholar] [CrossRef] [PubMed]
- Poluektova, E.U.; Stavrovskaya, A.; Pavlova, A.; Yunes, R.; Marsova, M.; Koshenko, T.; Illarioshkin, S.; Danilenko, V. Gut Microbiome as a Source of Probiotic Drugs for Parkinson’s Disease. Int J Mol Sci 2025, 26, 9290. [Google Scholar] [CrossRef] [PubMed]
- Ugrumov, M. Development of Early Diagnosis of Parkinson’s Disease: Illusion or Reality? CNS Neurosci Ther 2020, 26, 997–1009. [Google Scholar] [CrossRef]
- Katunina, E.A.; Blokhin, V.; Nodel, M.R.; Pavlova, E.N.; Kalinkin, A.L.; Kucheryanu, V.G.; Alekperova, L.; Selikhova, M.V.; Martynov, M.Y.; Ugrumov, M.V. Searching for Biomarkers in the Blood of Patients at Risk of Developing Parkinson’s Disease at the Prodromal Stage. Int J Mol Sci 2023, 24, 1842. [Google Scholar] [CrossRef]
- Blokhin, V.; Pavlova, E.N.; Katunina, E.A.; Nodel, M.R.; Kataeva, G.V.; Moskalets, E.R.; Pronina, T.S.; Ugrumov, M.V. Dopamine Synthesis in the Nigrostriatal Dopaminergic System in Patients at Risk of Developing Parkinson’s Disease at the Prodromal Stage. J Clin Med 2024, 13, 875. [Google Scholar] [CrossRef]
- Higinbotham, A.S.; Kilbane, C.W. The Gastrointestinal Tract and Parkinson’s Disease. Front Cell Infect Microbiol 2023, 13, 1158986. [Google Scholar] [CrossRef]
- Braak, H.; Rüb, U.; Gai, W.P.; Del Tredici, K. Idiopathic Parkinson’s Disease: Possible Routes by Which Vulnerable Neuronal Types May Be Subject to Neuroinvasion by an Unknown Pathogen. J Neural Transm (Vienna) 2003, 110, 517–536. [Google Scholar] [CrossRef]
- Pajares, M.; I Rojo, A.; Manda, G.; Boscá, L.; Cuadrado, A. Inflammation in Parkinson’s Disease: Mechanisms and Therapeutic Implications. Cells 2020, 9, 1687. [Google Scholar] [CrossRef]
- Kelly, L.P.; Carvey, P.M.; Keshavarzian, A.; Shannon, K.M.; Shaikh, M.; Bakay, R.A.E.; Kordower, J.H. Progression of Intestinal Permeability Changes and Alpha-Synuclein Expression in a Mouse Model of Parkinson’s Disease. Mov Disord 2014, 29, 999–1009. [Google Scholar] [CrossRef]
- Malekian Naeini, S.; Lopez, M.D.; Fraser, P.E.; Tandon, A. Parkinson’s Disease beyond the Brain: Implications for Treatments. Front Aging Neurosci 2025, 17, 1600782. [Google Scholar] [CrossRef]
- Del Rey, N.L.-G.; Balzano, T.; Martin-Rodriguez, L.; Salinas-Rebolledo, C.; Trigo-Damas, I.; Rojas-Fernandez, A.; Alvarez-Erviti, L.; Blesa, J. Lack of Parkinsonian Pathology and Neurodegeneration in Mice After Long-Term Injections of a Proteasome Inhibitor in Olfactory Bulb and Amygdala. Front Aging Neurosci 2021, 13, 698979. [Google Scholar] [CrossRef]
- Sawada, H.; Kohno, R.; Kihara, T.; Izumi, Y.; Sakka, N.; Ibi, M.; Nakanishi, M.; Nakamizo, T.; Yamakawa, K.; Shibasaki, H.; et al. Proteasome Mediates Dopaminergic Neuronal Degeneration, and Its Inhibition Causes Alpha-Synuclein Inclusions. J Biol Chem 2004, 279, 10710–10719. [Google Scholar] [CrossRef]
- Inden, M.; Kondo, J.-I.; Kitamura, Y.; Takata, K.; Nishimura, K.; Taniguchi, T.; Sawada, H.; Shimohama, S. Proteasome Inhibitors Protect against Degeneration of Nigral Dopaminergic Neurons in Hemiparkinsonian Rats. J Pharmacol Sci 2005, 97, 203–211. [Google Scholar] [CrossRef] [PubMed]
- Chen, C.; Wang, G.; Li, D.; Zhang, F. Microbiota–Gut–Brain Axis in Neurodegenerative Diseases: Molecular Mechanisms and Therapeutic Targets. Mol Biomed 2025, 6, 64. [Google Scholar] [CrossRef] [PubMed]
- Odorskaya, M.V.; Mavletova, D.A.; Nesterov, A.A.; Tikhonova, O.V.; Soloveva, N.A.; Reznikova, D.A.; Galanova, O.O.; Vatlin, A.A.; Slynko, N.M.; Vasilieva, A.R.; et al. The Use of Omics Technologies in Creating LBP and Postbiotics Based on the Limosilactobacillus Fermentum U-21. Front Microbiol 2024, 15, 1416688. [Google Scholar] [CrossRef] [PubMed]
- Marsova, M.; Abilev, S.; Poluektova, E.; Danilenko, V. A Bioluminescent Test System Reveals Valuable Antioxidant Properties of Lactobacillus Strains from Human Microbiota. World J Microbiol Biotechnol 2018, 34, 27. [Google Scholar] [CrossRef]
- Marsova, M.; Poluektova, E.; Odorskaya, M.; Ambaryan, A.; Revishchin, A.; Pavlova, G.; Danilenko, V. Protective Effects of Lactobacillus Fermentum U-21 against Paraquat-Induced Oxidative Stress in Caenorhabditis Elegans and Mouse Models. World J Microbiol Biotechnol 2020, 36, 104. [Google Scholar] [CrossRef]
- Danilenko, V.N.; Stavrovskaya, A.V.; Voronkov, D.N.; Gushchina, A.S.; Marsova, M.V.; Yamshchikova, N.G.; Ol’shansky, А.S.; Ivanov, M.V.; Illarioshkin, S.N. The Use of a Pharmabiotic Based on the Lactobacillus Fermentum U-21 Strain to Modulate the Neurodegenerative Process in an Experimental Model of Parkinson Disease. Annals of Clinical and Experimental Neurology 2020, 14, 62–69. [Google Scholar] [CrossRef]
- FDA Early Clinical Trials With Live Biotherapeutic Products: Chemistry, Manufacturing, and Control Information. Available online: https://www.fda.gov/regulatory-information/search-fda-guidance-documents/early-clinical-trials-live-biotherapeutic-products-chemistry-manufacturing-and-control-information (accessed on 29 October 2025).
- Yunes, R.A.; Poluektova, E.U.; Belkina, T.V.; Danilenko, V.N. Lactobacilli: Legal Regulation and Prospects for New Generation Drugs. Appl Biochem Microbiol 2022, 58, 652–664. [Google Scholar] [CrossRef]
- Poluektova, E.U.; Mavletova, D.A.; Odorskaya, M.V.; Marsova, M.V.; Klimina, K.M.; Koshenko, T.A.; Yunes, R.A.; Danilenko, V.N. Comparative Genomic, Transcriptomic, and Proteomic Analysis of the Limosilactobacillus Fermentum U-21 Strain Promising for the Creation of a Pharmabiotic. Russian Journal of Genetics 2022, 58, 1079–1090. [Google Scholar] [CrossRef]
- Danilenko V; Devyatkin A; Marsova M; Shibilova M; Ilyasov R; Shmyrev V Common Inflammatory Mechanisms in COVID-19 and Parkinson’s Diseases: The Role of Microbiome, Pharmabiotics and Postbiotics in Their Prevention. J Inflamm Res. 2021, 14, 6349–6381. [CrossRef]
- Averina, O.V.; Poluektova, E.U.; Marsova, M.V.; Danilenko, V.N. Biomarkers and Utility of the Antioxidant Potential of Probiotic Lactobacilli and Bifidobacteria as Representatives of the Human Gut Microbiota. Biomedicines 2021, 9, 1340. [Google Scholar] [CrossRef]
- Poluektova, E.; Yunes, R.; Danilenko, V. The Putative Antidepressant Mechanisms of Probiotic Bacteria: Relevant Genes and Proteins. Nutrients 2021, 13, 1591. [Google Scholar] [CrossRef]
- Stavrovskaya, A.V.; Voronkov, D.N.; Marsova, M.V.; Olshansky, A.S.; Gushchina, A.S.; Danilenko, V.N.; Illarioshkin, S.N. Effects of the Pharmabiotic U-21 under Conditions of a Combined Neuroinflammatory Model of Parkinson’s Disease in Rats. Bull Exp Biol Med 2024, 177, 225–230. [Google Scholar] [CrossRef]
- Bueno-Carrasco, M.T.; Cuéllar, J.; Flydal, M.I.; Santiago, C.; Kråkenes, T.-A.; Kleppe, R.; López-Blanco, J.R.; Marcilla, M.; Teigen, K.; Alvira, S.; et al. Structural Mechanism for Tyrosine Hydroxylase Inhibition by Dopamine and Reactivation by Ser40 Phosphorylation. Nat Commun 2022, 13, 74. [Google Scholar] [CrossRef] [PubMed]
- Oizumi, H.; Yamasaki, K.; Suzuki, H.; Ohshiro, S.; Saito, Y.; Murayama, S.; Sugimura, Y.; Hasegawa, T.; Fukunaga, K.; Takeda, A. Phosphorylated Alpha-Synuclein in Iba1-Positive Macrophages in the Skin of Patients with Parkinson’s Disease. Annals of Clinical and Translational Neurology 2022, 9, 1136–1146. [Google Scholar] [CrossRef] [PubMed]
- Jiao, P.; An, Y.; Wu, S.; Li, H.; Li, G. Cinnamaldehyde Attenuates the Expression of IBA1 and GFAP to Inhibit Glial Cell Activation and Inflammation in the MPTP-Induced Acute Parkinson’s Disease Model. Parkinson’s Disease 2024, 2024, 9973140. [Google Scholar] [CrossRef] [PubMed]
- Bu, L.-L.; Huang, K.-X.; Zheng, D.-Z.; Lin, D.-Y.; Chen, Y.; Jing, X.-N.; Liang, Y.-R.; Tao, E.-X. Alpha-Synuclein Accumulation and Its Phosphorylation in the Enteric Nervous System of Patients Without Neurodegeneration: An Explorative Study. Front Aging Neurosci 2020, 12, 575481. [Google Scholar] [CrossRef]
- Numakawa, T.; Kajihara, R. The Role of Brain-Derived Neurotrophic Factor as an Essential Mediator in Neuronal Functions and the Therapeutic Potential of Its Mimetics for Neuroprotection in Neurologic and Psychiatric Disorders. Molecules 2025, 30, 848. [Google Scholar] [CrossRef]
- Ali, N.H.; Al-Kuraishy, H.M.; Al-Gareeb, A.I.; Alexiou, A.; Papadakis, M.; AlAseeri, A.A.; Alruwaili, M.; Saad, H.M.; Batiha, G.E.-S. BDNF/TrkB Activators in Parkinson’s Disease: A New Therapeutic Strategy. J Cell Mol Med 2024, 28, e18368. [Google Scholar] [CrossRef]
- Barker, P.A.; Mantyh, P.; Arendt-Nielsen, L.; Viktrup, L.; Tive, L. Nerve Growth Factor Signaling and Its Contribution to Pain. J Pain Res 2020, 13, 1223–1241. [Google Scholar] [CrossRef] [PubMed]
- Aloe, L.; Rocco, M.L.; Balzamino, B.O.; Micera, A. Nerve Growth Factor: A Focus on Neuroscience and Therapy. Curr Neuropharmacol 2015, 13, 294–303. [Google Scholar] [CrossRef]
- Troshev, D.; Pavlova, E.; Bogdanov, V.; Ugrumov, M. Expression of Genes Encoding Receptors for Classical Neurotransmitters, Neuropeptides and Hormones in the Substantia Nigra, Especially in Dopaminergic Neurons, in Intact Mice and Mouse Models of Parkinson’s Disease. Cells 2025, 14, 1570. [Google Scholar] [CrossRef]
- Chidambaram, S.B.; Anand, N.; Varma, S.R.; Ramamurthy, S.; Vichitra, C.; Sharma, A.; Mahalakshmi, A.M.; Essa, M.M. Superoxide Dismutase and Neurological Disorders. IBRO Neurosci Rep 2024, 16, 373–394. [Google Scholar] [CrossRef] [PubMed]
- Tahavvori, A.; Gargari, M.K.; Yazdani, Y.; Mamalo, A.S.; Beilankouhi, E.A.V.; Valilo, M. Involvement of Antioxidant Enzymes in Parkinson’s Disease. Pathol Res Pract 2023, 249, 154757. [Google Scholar] [CrossRef]
- Sheta, R.; Bérard, M.; Musiol, D.; Martínez-Drudis, L.; Oueslati, A. Behavioral Analysis of Motor and Non-Motor Impairment in Rodent Models of Parkinson’s Disease. Front Aging Neurosci 2024, 16, 1464706. [Google Scholar] [CrossRef]
- Behl, T.; Kumar, S.; Althafar, Z.M.; Sehgal, A.; Singh, S.; Sharma, N.; Badavath, V.N.; Yadav, S.; Bhatia, S.; Al-Harrasi, A.; et al. Exploring the Role of Ubiquitin-Proteasome System in Parkinson’s Disease. Mol Neurobiol 2022, 59, 4257–4273. [Google Scholar] [CrossRef]
- Zhang, J.; Xue, B.; Jing, B.; Tian, H.; Zhang, N.; Li, M.; Lu, L.; Chen, L.; Diao, H.; Chen, Y.; et al. LPS Activates Neuroinflammatory Pathways to Induce Depression in Parkinson’s Disease-like Condition. Front Pharmacol 2022, 13, 961817. [Google Scholar] [CrossRef]
- Deneyer, L.; Albertini, G.; Bentea, E.; Massie, A. Systemic LPS-Induced Neuroinflammation Increases the Susceptibility for Proteasome Inhibition-Induced Degeneration of the Nigrostriatal Pathway. Parkinsonism Relat Disord 2019, 68, 26–32. [Google Scholar] [CrossRef]
- Mi, H.; Thomas, P.D.; Ring, H.Z.; Jiang, R.; Sangkuhl, K.; Klein, T.E.; Altman, R.B. PharmGKB Summary: Dopamine Receptor D2. Pharmacogenet Genomics 2011, 21, 350–356. [Google Scholar] [CrossRef]
- Shao, W.; Zhang, S.; Tang, M.; Zhang, X.; Zhou, Z.; Yin, Y.; Zhou, Q.; Huang, Y.; Liu, Y.; Wawrousek, E.; et al. Suppression of Neuroinflammation by Astrocytic Dopamine D2 Receptors via αB-Crystallin. Nature 2013, 494, 90–94. [Google Scholar] [CrossRef]
- Delgado-Goñi, T.; Connor-Robson, N.; Cioroch, M.; Paisey, S.; Marshall, C.; Lane, E.L.; Hauton, D.; McCullagh, J.; Magill, P.J.; Cragg, S.J.; et al. Dopamine D2 Receptor Upregulation in Dorsal Striatum in the LRRK2-R1441C Rat Model of Early Parkinson’s Disease Revealed by in Vivo PET Imaging. Sci Rep 2025, 15, 15943. [Google Scholar] [CrossRef] [PubMed]
- Connor, B.; Dragunow, M. The Role of Neuronal Growth Factors in Neurodegenerative Disorders of the Human Brain. Brain Res Brain Res Rev 1998, 27, 1–39. [Google Scholar] [CrossRef] [PubMed]
- McAllister, A.K. Neurotrophins and Neuronal Differentiation in the Central Nervous System. Cell Mol Life Sci 2001, 58, 1054–1060. [Google Scholar] [CrossRef] [PubMed]
- Björkholm, C.; Monteggia, L.M. BDNF - a Key Transducer of Antidepressant Effects. Neuropharmacology 2016, 102, 72–79. [Google Scholar] [CrossRef]
- Palasz, E.; Wysocka, A.; Gasiorowska, A.; Chalimoniuk, M.; Niewiadomski, W.; Niewiadomska, G. BDNF as a Promising Therapeutic Agent in Parkinson’s Disease. Int J Mol Sci 2020, 21, 1170. [Google Scholar] [CrossRef]
- Miller, K.M.; Mercado, N.M.; Sortwell, C.E. Synucleinopathy-Associated Pathogenesis in Parkinson’s Disease and the Potential for Brain-Derived Neurotrophic Factor. NPJ Parkinsons Dis 2021, 7, 35. [Google Scholar] [CrossRef] [PubMed]
- Huang, Y.; Huang, C.; Yun, W. Peripheral BDNF/TrkB Protein Expression Is Decreased in Parkinson’s Disease but Not in Essential Tremor. J Clin Neurosci 2019, 63, 176–181. [Google Scholar] [CrossRef] [PubMed]
- Almeida, F.B.; Gomez, R.; Barros, H.M.T.; Nin, M.S. Hemisphere-Dependent Changes in mRNA Expression of GABAA Receptor Subunits and BDNF after Intra-Prefrontal Cortex Allopregnanolone Infusion in Rats. Neuroscience 2019, 397, 56–66. [Google Scholar] [CrossRef] [PubMed]
- Khan, M.S.; Ali, T.; Kim, M.W.; Jo, M.H.; Jo, M.G.; Badshah, H.; Kim, M.O. Anthocyanins Protect against LPS-Induced Oxidative Stress-Mediated Neuroinflammation and Neurodegeneration in the Adult Mouse Cortex. Neurochem Int 2016, 100, 1–10. [Google Scholar] [CrossRef] [PubMed]
- Long, L.; Zhang, M.; Qin, H.-Z.; Xu, L.-B.; Wang, B.-B.; Wu, W.-Y.; Zhu, H.; Lin, S. Isorhamnetin Protects against D-GalN/LPS-Induced Acute Liver Injury in Mice through Anti-Oxidative Stress, Anti-Inflammation, and Anti-Apoptosis. BMC Complement Med Ther 2025, 25, 297. [Google Scholar] [CrossRef]
- Chang, K.-H.; Chen, C.-M. The Role of Oxidative Stress in Parkinson’s Disease. Antioxidants 2020, 9. [Google Scholar] [CrossRef]
- Ortiz, G.G.; Moráles-Sánchez, E.W.; Pacheco-Moisés, F.P.; Jiménez-Gil, F.J.; Macías-Islas, M.A.; Mireles-Ramírez, M.A.; González-Usigli, H. Effect of melatonin administration on cyclooxygenase-2 activity, serum levels of nitric oxide metabolites, lipoperoxides and glutathione peroxidase activity in patients with Parkinson’s disease. Gac Med Mex 2017, 153, S72–S81. [Google Scholar] [CrossRef]
- Leão, A.H.F.F.; Sarmento-Silva, A.J.; Santos, J.R.; Ribeiro, A.M.; Silva, R.H. Molecular, Neurochemical, and Behavioral Hallmarks of Reserpine as a Model for Parkinson’s Disease: New Perspectives to a Long-Standing Model. Brain Pathol 2015, 25, 377–390. [Google Scholar] [CrossRef]
- da Cunha Germano, B.C.; de Morais, L.C.C.; Idalina Neta, F.; Fernandes, A.C.L.; Pinheiro, F.I.; do Rego, A.C.M.; Araújo Filho, I.; de Azevedo, E.P.; de Paiva Cavalcanti, J.R.L.; Guzen, F.P.; et al. Vitamin E and Its Molecular Effects in Experimental Models of Neurodegenerative Diseases. Int J Mol Sci 2023, 24, 11191. [Google Scholar] [CrossRef]
- Wang, J.; Tang, Y.; Guo, C.; Du, Z.; Chen, F.; Fang, S.; Tang, Y. Epigallocatechin Gallate Mitigates the Motor Deficits in a Rotenone-Induced Parkinson’s Disease Rat Model via Promoting Protein Kinase D1 and Inhibiting Neuronal Parthanatos. Transl Neurosci 2025, 16, 20250366. [Google Scholar] [CrossRef]
- Nandi, A.; Yan, L.-J.; Jana, C.K.; Das, N. Role of Catalase in Oxidative Stress- and Age-Associated Degenerative Diseases. Oxid Med Cell Longev 2019, 2019, 9613090. [Google Scholar] [CrossRef]
- Dzamko, N. Cytokine Activity in Parkinson’s Disease. Neuronal Signal 2023, 7, NS20220063. [Google Scholar] [CrossRef] [PubMed]
- Mogi, M.; Harada, M.; Narabayashi, H.; Inagaki, H.; Minami, M.; Nagatsu, T. Interleukin (IL)-1 Beta, IL-2, IL-4, IL-6 and Transforming Growth Factor-Alpha Levels Are Elevated in Ventricular Cerebrospinal Fluid in Juvenile Parkinsonism and Parkinson’s Disease. Neurosci Lett 1996, 211, 13–16. [Google Scholar] [CrossRef] [PubMed]
- Mogi, M.; Harada, M.; Kondo, T.; Riederer, P.; Inagaki, H.; Minami, M.; Nagatsu, T. Interleukin-1 Beta, Interleukin-6, Epidermal Growth Factor and Transforming Growth Factor-Alpha Are Elevated in the Brain from Parkinsonian Patients. Neurosci Lett 1994, 180, 147–150. [Google Scholar] [CrossRef] [PubMed]
- Brodacki, B.; Staszewski, J.; Toczyłowska, B.; Kozłowska, E.; Drela, N.; Chalimoniuk, M.; Stepien, A. Serum Interleukin (IL-2, IL-10, IL-6, IL-4), TNFalpha, and INFgamma Concentrations Are Elevated in Patients with Atypical and Idiopathic Parkinsonism. Neurosci Lett 2008, 441, 158–162. [Google Scholar] [CrossRef]
- Green, H.F.; Khosousi, S.; Svenningsson, P. Plasma IL-6 and IL-17A Correlate with Severity of Motor and Non-Motor Symptoms in Parkinson’s Disease. J Parkinsons Dis 2019, 9, 705–709. [Google Scholar] [CrossRef]
- Kim, R.; Kim, H.-J.; Kim, A.; Jang, M.; Kim, A.; Kim, Y.; Yoo, D.; Im, J.H.; Choi, J.-H.; Jeon, B. Peripheral Blood Inflammatory Markers in Early Parkinson’s Disease. J Clin Neurosci 2018, 58, 30–33. [Google Scholar] [CrossRef]
- Robinson, M.W.; Harmon, C.; O’Farrelly, C. Liver Immunology and Its Role in Inflammation and Homeostasis. Cell Mol Immunol 2016, 13, 267–276. [Google Scholar] [CrossRef]
- Vargovic, P.; Laukova, M.; Ukropec, J.; Manz, G.; Kvetnansky, R. Lipopolysaccharide Induces Catecholamine Production in Mesenteric Adipose Tissue of Rats Previously Exposed to Immobilization Stress. Stress 2016, 19, 439–447. [Google Scholar] [CrossRef]
- Treffkorn, L.; Scheibe, R.; Maruyama, T.; Dieter, P. PGE2 Exerts Its Effect on the LPS-Induced Release of TNF-Alpha, ET-1, IL-1alpha, IL-6 and IL-10 via the EP2 and EP4 Receptor in Rat Liver Macrophages. Prostaglandins Other Lipid Mediat 2004, 74, 113–123. [Google Scholar] [CrossRef]
- Brown, G.C.; Camacho, M.; Williams-Gray, C.H. The Endotoxin Hypothesis of Parkinson’s Disease. Mov Disord 2023, 38, 1143–1155. [Google Scholar] [CrossRef] [PubMed]
- Dupont, A.; Heinbockel, L.; Brandenburg, K.; Hornef, M.W. Antimicrobial Peptides and the Enteric Mucus Layer Act in Concert to Protect the Intestinal Mucosa. Gut Microbes 2014, 5, 761–765. [Google Scholar] [CrossRef] [PubMed]
- Pellegrini, C.; Ippolito, C.; Segnani, C.; Dolfi, A.; Errede, M.; Virgintino, D.; Fornai, M.; Antonioli, L.; Garelli, F.; Nericcio, A.; et al. Pathological Remodelling of Colonic Wall Following Dopaminergic Nigrostriatal Neurodegeneration. Neurobiol Dis 2020, 139, 104821. [Google Scholar] [CrossRef]
- He, Y.; Wang, K.; Su, N.; Yuan, C.; Zhang, N.; Hu, X.; Fu, Y.; Zhao, F. Microbiota-Gut-Brain Axis in Health and Neurological Disease: Interactions between Gut Microbiota and the Nervous System. J Cell Mol Med 2024, 28, e70099. [Google Scholar] [CrossRef]
- Yang, H.; Shao, Y.; Hu, Y.; Qian, J.; Wang, P.; Tian, L.; Ni, Y.; Li, S.; Al-Nusaif, M.; Liu, C.; et al. Fecal Microbiota from Patients with Parkinson’s Disease Intensifies Inflammation and Neurodegeneration in A53T Mice. CNS Neurosci Ther 2024, 30, e70003. [Google Scholar] [CrossRef]
- Suresh, S.B.; Malireddi, A.; Abera, M.; Noor, K.; Ansar, M.; Boddeti, S.; Nath, T.S. Gut Microbiome and Its Role in Parkinson’s Disease. Cureus 2024, 16, e73150. [Google Scholar] [CrossRef]
- Borghammer, P.; Van Den Berge, N. Brain-First versus Gut-First Parkinson’s Disease: A Hypothesis. J Parkinsons Dis 2019, 9, S281–S295. [Google Scholar] [CrossRef]
- Oliver, P.J.; Civitelli, L.; Hu, M.T. The Gut-Brain Axis in Early Parkinson’s Disease: From Prodrome to Prevention. J Neurol 2025, 272, 413. [Google Scholar] [CrossRef]
- Vieira, J.C.F.; Bassani, T.B.; Santiago, R.M.; de O Guaita, G.; Zanoveli, J.M.; da Cunha, C.; Vital, M.A.B.F. Anxiety-like Behavior Induced by 6-OHDA Animal Model of Parkinson’s Disease May Be Related to a Dysregulation of Neurotransmitter Systems in Brain Areas Related to Anxiety. Behav Brain Res 2019, 371, 111981. [Google Scholar] [CrossRef]
- Pelosi, A.; Girault, J.-A.; Hervé, D. Unilateral Lesion of Dopamine Neurons Induces Grooming Asymmetry in the Mouse. PLoS One 2015, 10, e0137185. [Google Scholar] [CrossRef] [PubMed]
- Lee, J.; Hwang, K.-T.; Chung, M.-Y.; Cho, D.-H.; Park, C.-S. Resistance of Lactobacillus Casei KCTC 3260 to Reactive Oxygen Species (ROS): Role for a Metal Ion Chelating Effect. Journal of Food Science 2005, 70, m388–m391. [Google Scholar] [CrossRef]
- Kullisaar, T.; Zilmer, M.; Mikelsaar, M.; Vihalemm, T.; Annuk, H.; Kairane, C.; Kilk, A. Two Antioxidative Lactobacilli Strains as Promising Probiotics. Int J Food Microbiol 2002, 72, 215–224. [Google Scholar] [CrossRef]
- Castelli, V.; d’Angelo, M.; Lombardi, F.; Alfonsetti, M.; Antonosante, A.; Catanesi, M.; Benedetti, E.; Palumbo, P.; Cifone, M.G.; Giordano, A.; et al. Effects of the Probiotic Formulation SLAB51 in in Vitro and in Vivo Parkinson’s Disease Models. Aging (Albany NY) 2020, 12, 4641–4659. [Google Scholar] [CrossRef] [PubMed]
- Hradicka, P.; Adamkova, P.; Lenhardt, L.; Gancarcikova, S.; Iannaccone, S.F.; Demeckova, V. Addressing Safety Concerns of Long-Term Probiotic Use: In Vivo Evidence from a Rat Model. Journal of Functional Foods 2023, 104, 105521. [Google Scholar] [CrossRef]
- Tsao, S.-P.; Nurrahma, B.A.; Kumar, R.; Wu, C.-H.; Yeh, T.-H.; Chiu, C.-C.; Lee, Y.-P.; Liao, Y.-C.; Huang, C.-H.; Yeh, Y.-T.; et al. Probiotic Enhancement of Antioxidant Capacity and Alterations of Gut Microbiota Composition in 6-Hydroxydopamin-Induced Parkinson’s Disease Rats. Antioxidants (Basel) 2021, 10, 1823. [Google Scholar] [CrossRef]
- Parra, I.; Martínez, I.; Vásquez-Celaya, L.; Gongora-Alfaro, J.L.; Tizabi, Y.; Mendieta, L. Neuroprotective and Immunomodulatory Effects of Probiotics in a Rat Model of Parkinson’s Disease. Neurotox Res 2023, 41, 187–200. [Google Scholar] [CrossRef] [PubMed]
- Chen, L.; Zhang, L.; Hua, H.; Liu, L.; Mao, Y.; Wang, R. Interactions between Toll-like Receptors Signaling Pathway and Gut Microbiota in Host Homeostasis. Immun Inflamm Dis 2024, 12, e1356. [Google Scholar] [CrossRef]
- Wikoff, W.R.; Anfora, A.T.; Liu, J.; Schultz, P.G.; Lesley, S.A.; Peters, E.C.; Siuzdak, G. Metabolomics Analysis Reveals Large Effects of Gut Microflora on Mammalian Blood Metabolites. Proc Natl Acad Sci U S A 2009, 106, 3698–3703. [Google Scholar] [CrossRef]
- Li, C.; Liang, Y.; Qiao, Y. Messengers From the Gut: Gut Microbiota-Derived Metabolites on Host Regulation. Front Microbiol 2022, 13, 863407. [Google Scholar] [CrossRef]
- Dekkers, K.F.; Sayols-Baixeras, S.; Baldanzi, G.; Nowak, C.; Hammar, U.; Nguyen, D.; Varotsis, G.; Brunkwall, L.; Nielsen, N.; Eklund, A.C.; et al. An Online Atlas of Human Plasma Metabolite Signatures of Gut Microbiome Composition. Nat Commun 2022, 13, 5370. [Google Scholar] [CrossRef]
- Zhang, X.; Wang, Y.; E, Q.; Naveed, M.; Wang, X.; Liu, Y.; Li, M. The Biological Activity and Potential of Probiotics-Derived Extracellular Vesicles as Postbiotics in Modulating Microbiota-Host Communication. J Nanobiotechnology 2025, 23, 349. [Google Scholar] [CrossRef]
- Hu, K.; Zhou, Z.; Li, H.; Xiao, J.; Shen, Y.; Ding, K.; Zhang, T.; Wang, G.; Hao, H.; Liang, Y. Regulation of Histidine Metabolism by Lactobacillus Reuteri Mediates the Pathogenesis and Treatment of Ischemic Stroke. Acta Pharm Sin B 2025, 15, 239–255. [Google Scholar] [CrossRef]
- Morozova, M.V.; Borisova, M.A.; Snytnikova, O.A.; Achasova, K.M.; Litvinova, E.A.; Tsentalovich, Y.P.; Kozhevnikova, E.N. Colitis-Associated Intestinal Microbiota Regulates Brain Glycine and Host Behavior in Mice. Scientific Reports 2022, 12, 16345. [Google Scholar] [CrossRef]
- Ikuta, K.; Joho, D.; Kakeyama, M.; Matsumoto, M. Bifidobacterium Animalis Subsp. Lactis and Arginine Mixture Intake Improves Cognitive Flexibility in Mice. Front. Nutr. 2023, 10. [Google Scholar] [CrossRef] [PubMed]
- Al Ebrahim, R.N.; Alekseeva, M.G.; Bazhenov, S.V.; Fomin, V.V.; Mavletova, D.A.; Nesterov, A.A.; Poluektova, E.U.; Danilenko, V.N.; Manukhov, I.V. ClpL Chaperone as a Possible Component of the Disaggregase Activity of Limosilactobacillus Fermentum U-21. Biology (Basel) 2024, 13, 592. [Google Scholar] [CrossRef] [PubMed]
- Sudhadevi, T.; Harijith, A. Thioredoxin: An Antioxidant, a Therapeutic Target and a Possible Biomarker. Pediatric Research 2024, 96, 1117–1119. [Google Scholar] [CrossRef]
- Paxinos, G.; Watson, C. The Rat Brain in Stereotaxic Coordinates.; 7th ed. 2013. [Google Scholar]
- Metz, G.A.; Whishaw, I.Q. Cortical and Subcortical Lesions Impair Skilled Walking in the Ladder Rung Walking Test: A New Task to Evaluate Fore- and Hindlimb Stepping, Placing, and Co-Ordination. J Neurosci Methods 2002, 115, 169–179. [Google Scholar] [CrossRef]
- Shi, X.; Bai, H.; Wang, J.; Wang, J.; Huang, L.; He, M.; Zheng, X.; Duan, Z.; Chen, D.; Zhang, J.; et al. Behavioral Assessment of Sensory, Motor, Emotion, and Cognition in Rodent Models of Intracerebral Hemorrhage. Front Neurol 2021, 12, 667511. [Google Scholar] [CrossRef]
- Sweis, B.M.; Bachour, S.P.; Brekke, J.A.; Gewirtz, J.C.; Sadeghi-Bazargani, H.; Hevesi, M.; Divani, A.A. A Modified Beam-Walking Apparatus for Assessment of Anxiety in a Rodent Model of Blast Traumatic Brain Injury. Behav Brain Res 2016, 296, 149–156. [Google Scholar] [CrossRef] [PubMed]
- Antonow-Schlorke, I.; Ehrhardt, J.; Knieling, M. Modification of the Ladder Rung Walking Task-New Options for Analysis of Skilled Movements. Stroke Res Treat 2013, 2013, 418627. [Google Scholar] [CrossRef]
- Haimes, J.D.; Kelley, M.L. Demonstration of a ΔΔCq Calculation Method to Compute Relative Gene Expression from qPCR Data.; 2015.
- Ye, J.; Coulouris, G.; Zaretskaya, I.; Cutcutache, I.; Rozen, S.; Madden, T.L. Primer-BLAST: A Tool to Design Target-Specific Primers for Polymerase Chain Reaction. BMC Bioinformatics 2012, 13, 134. [Google Scholar] [CrossRef] [PubMed]
- Krzyżek, P.; Marinacci, B.; Vitale, I.; Grande, R. Extracellular Vesicles of Probiotics: Shedding Light on the Biological Activity and Future Applications. Pharmaceutics 2023, 15, 522. [Google Scholar] [CrossRef] [PubMed]
Figure 1.
Results of the assessment of the area of tissue stained for tyrosine hydroxylase in the substantia nigra. Left hemisphere - control; right hemisphere - damaged. Three-way ANOVA was used for statistical analysis. Data are presented as mean + SEM.
Figure 1.
Results of the assessment of the area of tissue stained for tyrosine hydroxylase in the substantia nigra. Left hemisphere - control; right hemisphere - damaged. Three-way ANOVA was used for statistical analysis. Data are presented as mean + SEM.
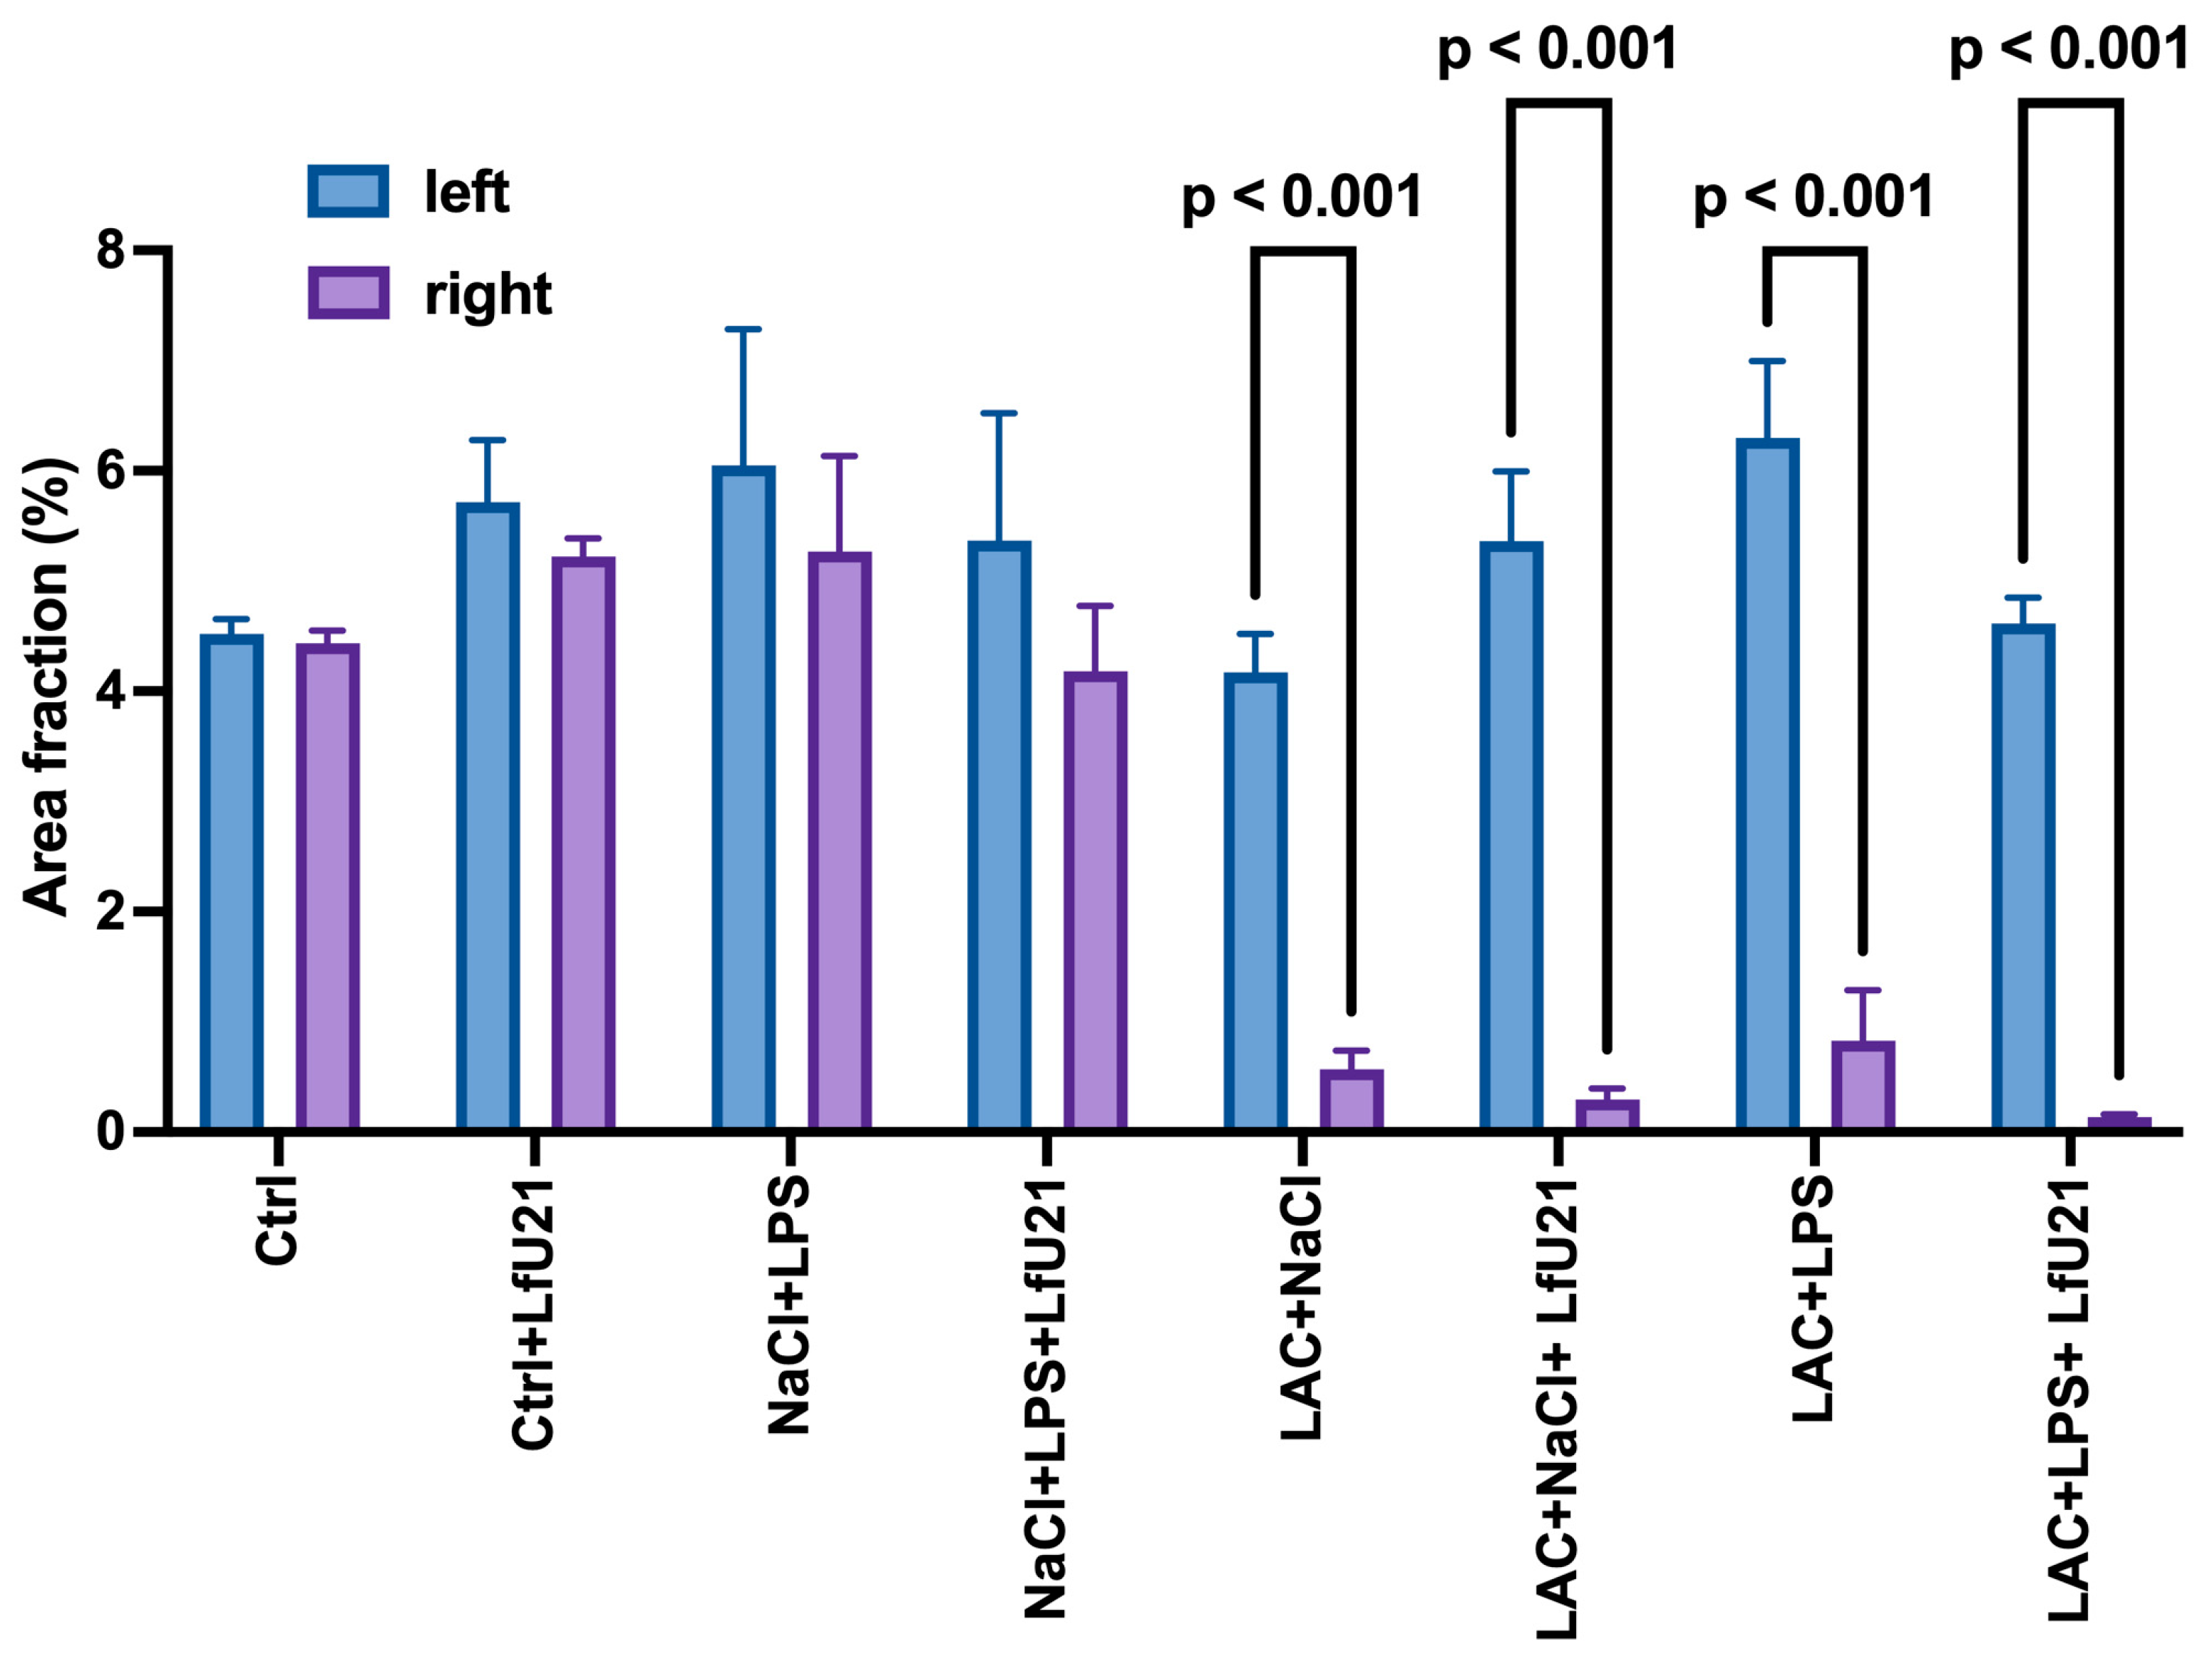
Figure 2.
Changes in the intensity of staining for tyrosine hydroxylase in the substantia nigra pars compacta.
Figure 2.
Changes in the intensity of staining for tyrosine hydroxylase in the substantia nigra pars compacta.
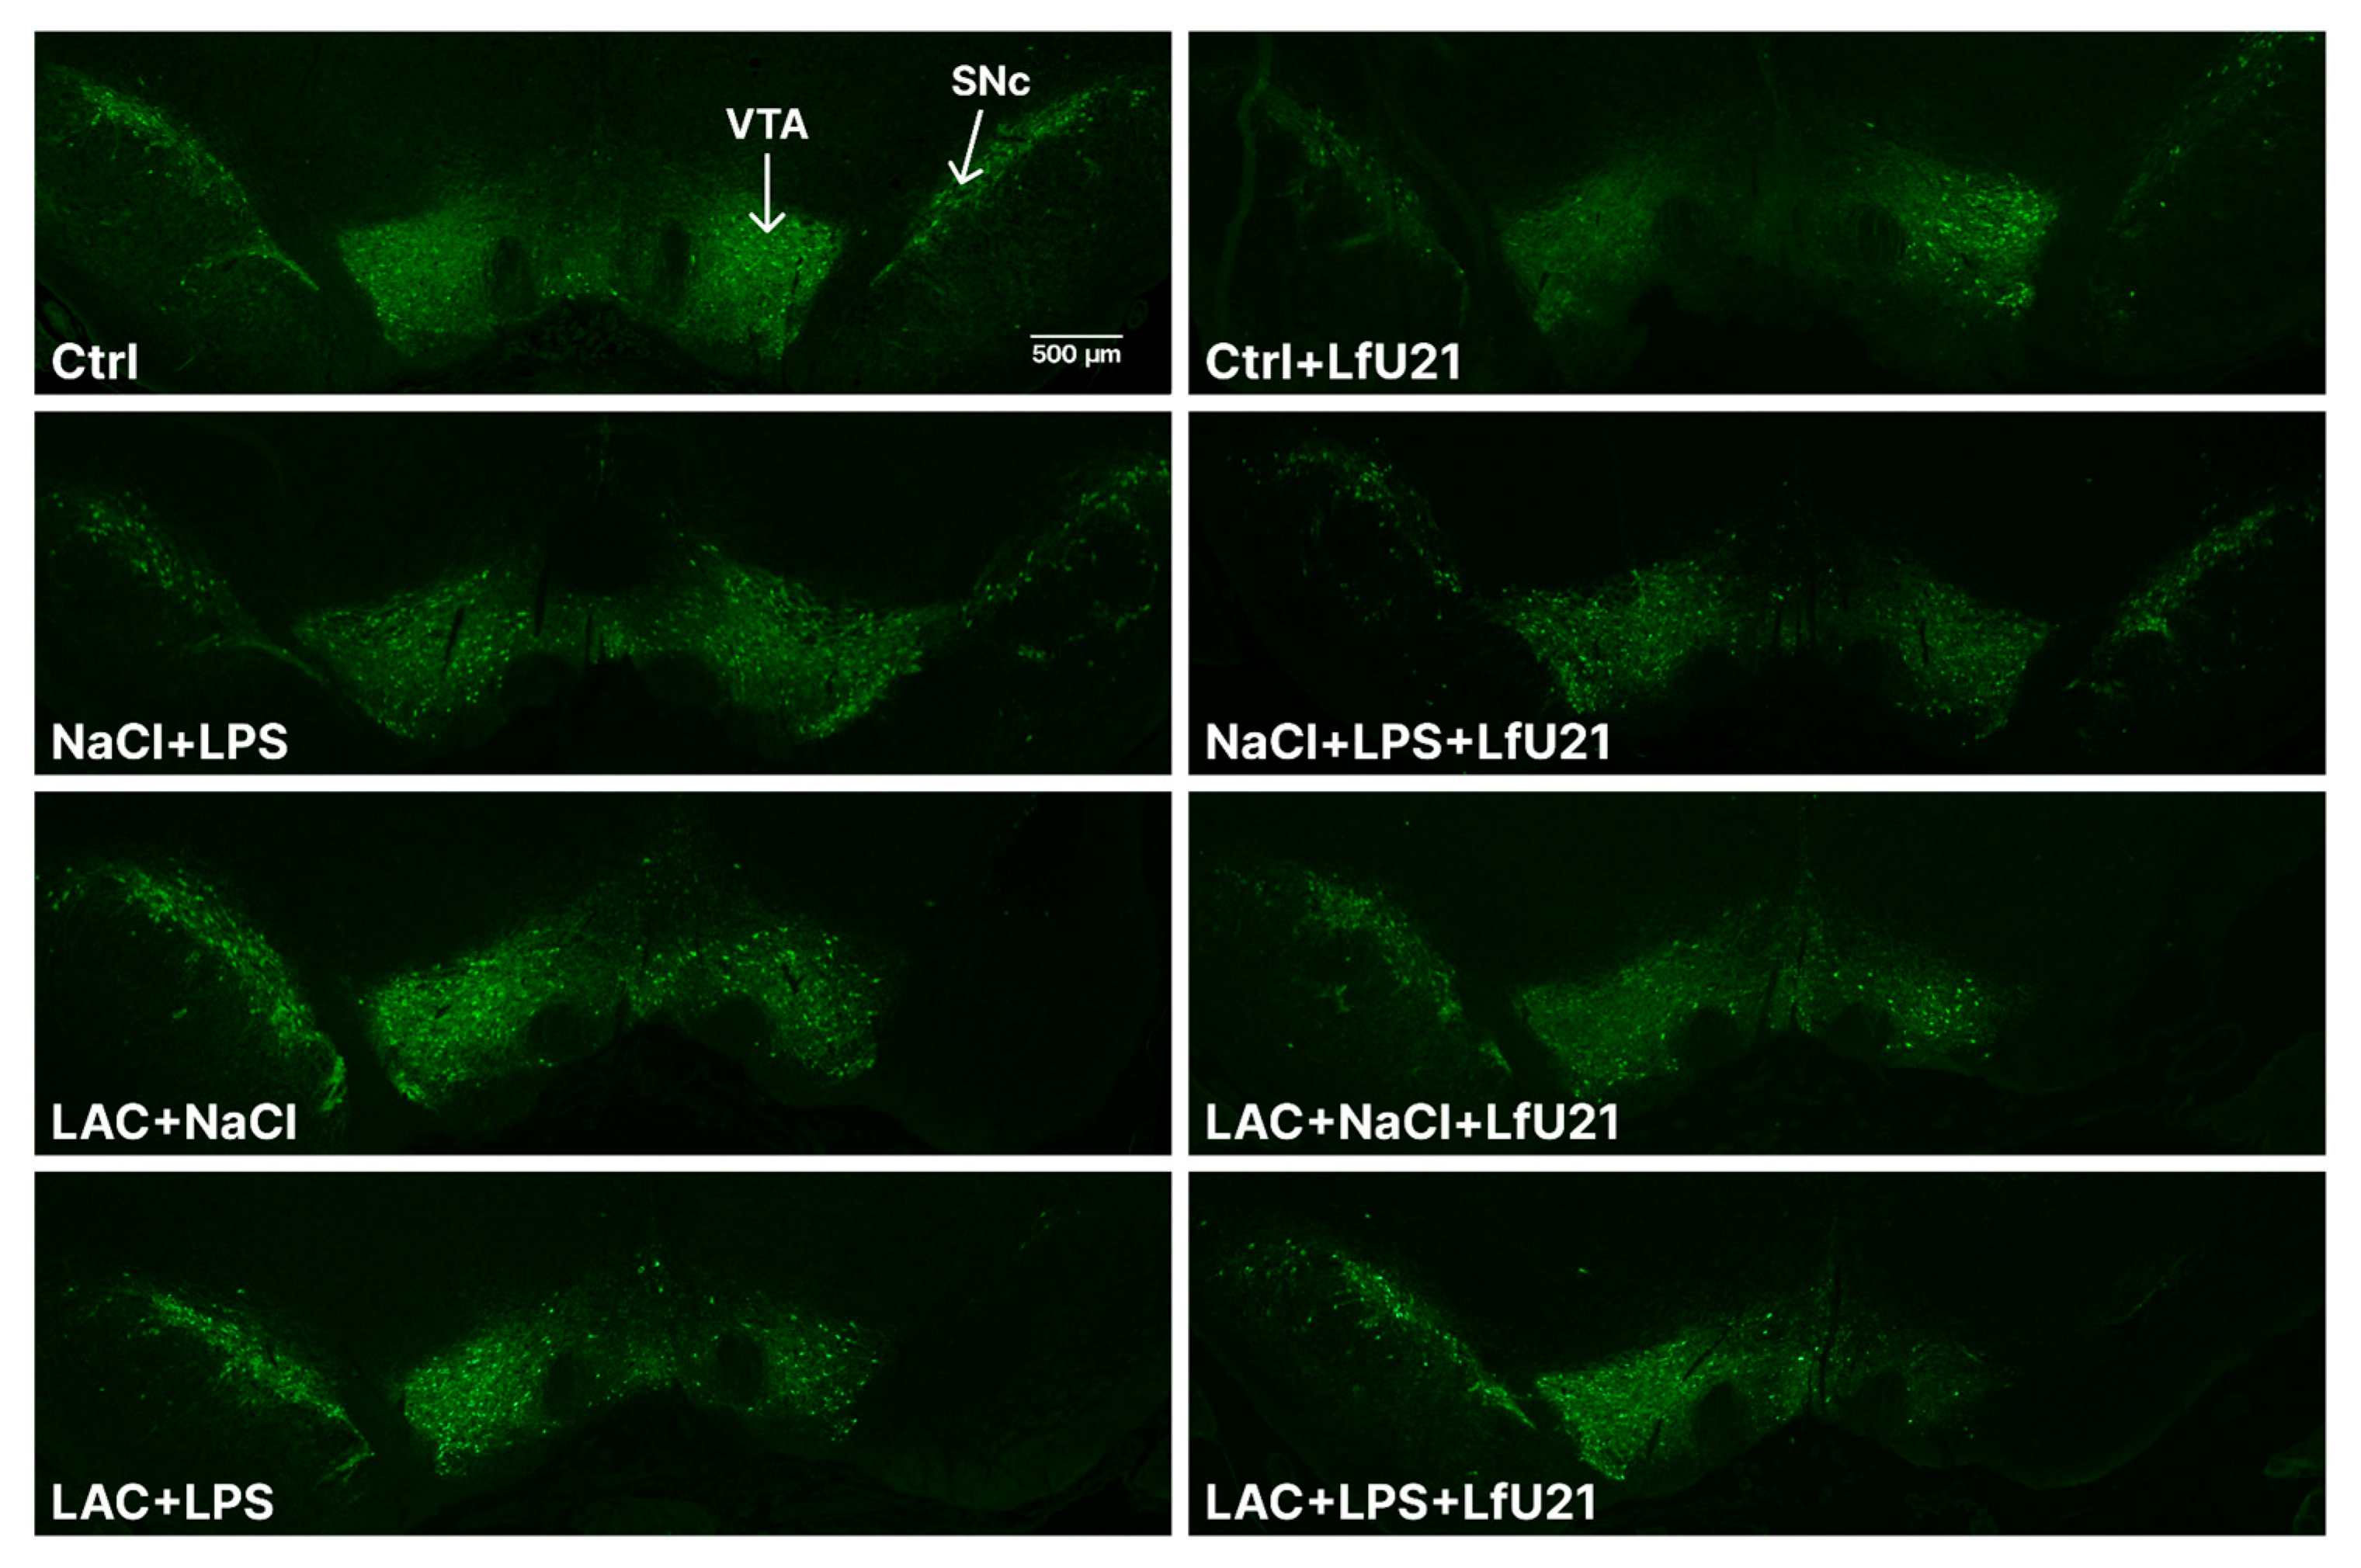
Figure 3.
The effect of LfU21 on microglial activation following separate administration of LAC or LPS, or a combination of both. IBA1 staining intensity is given as a percentage of the left black substance (contralateral to LAC or NaCl administration). Significant differences are indicated on the graphs. * - p<0.05 compared to Ctrl, # - p < 0.05 compared to the corresponding groups without strain administration. Three-way ANOVA was used for statistical analysis. Data are presented as mean + SEM.
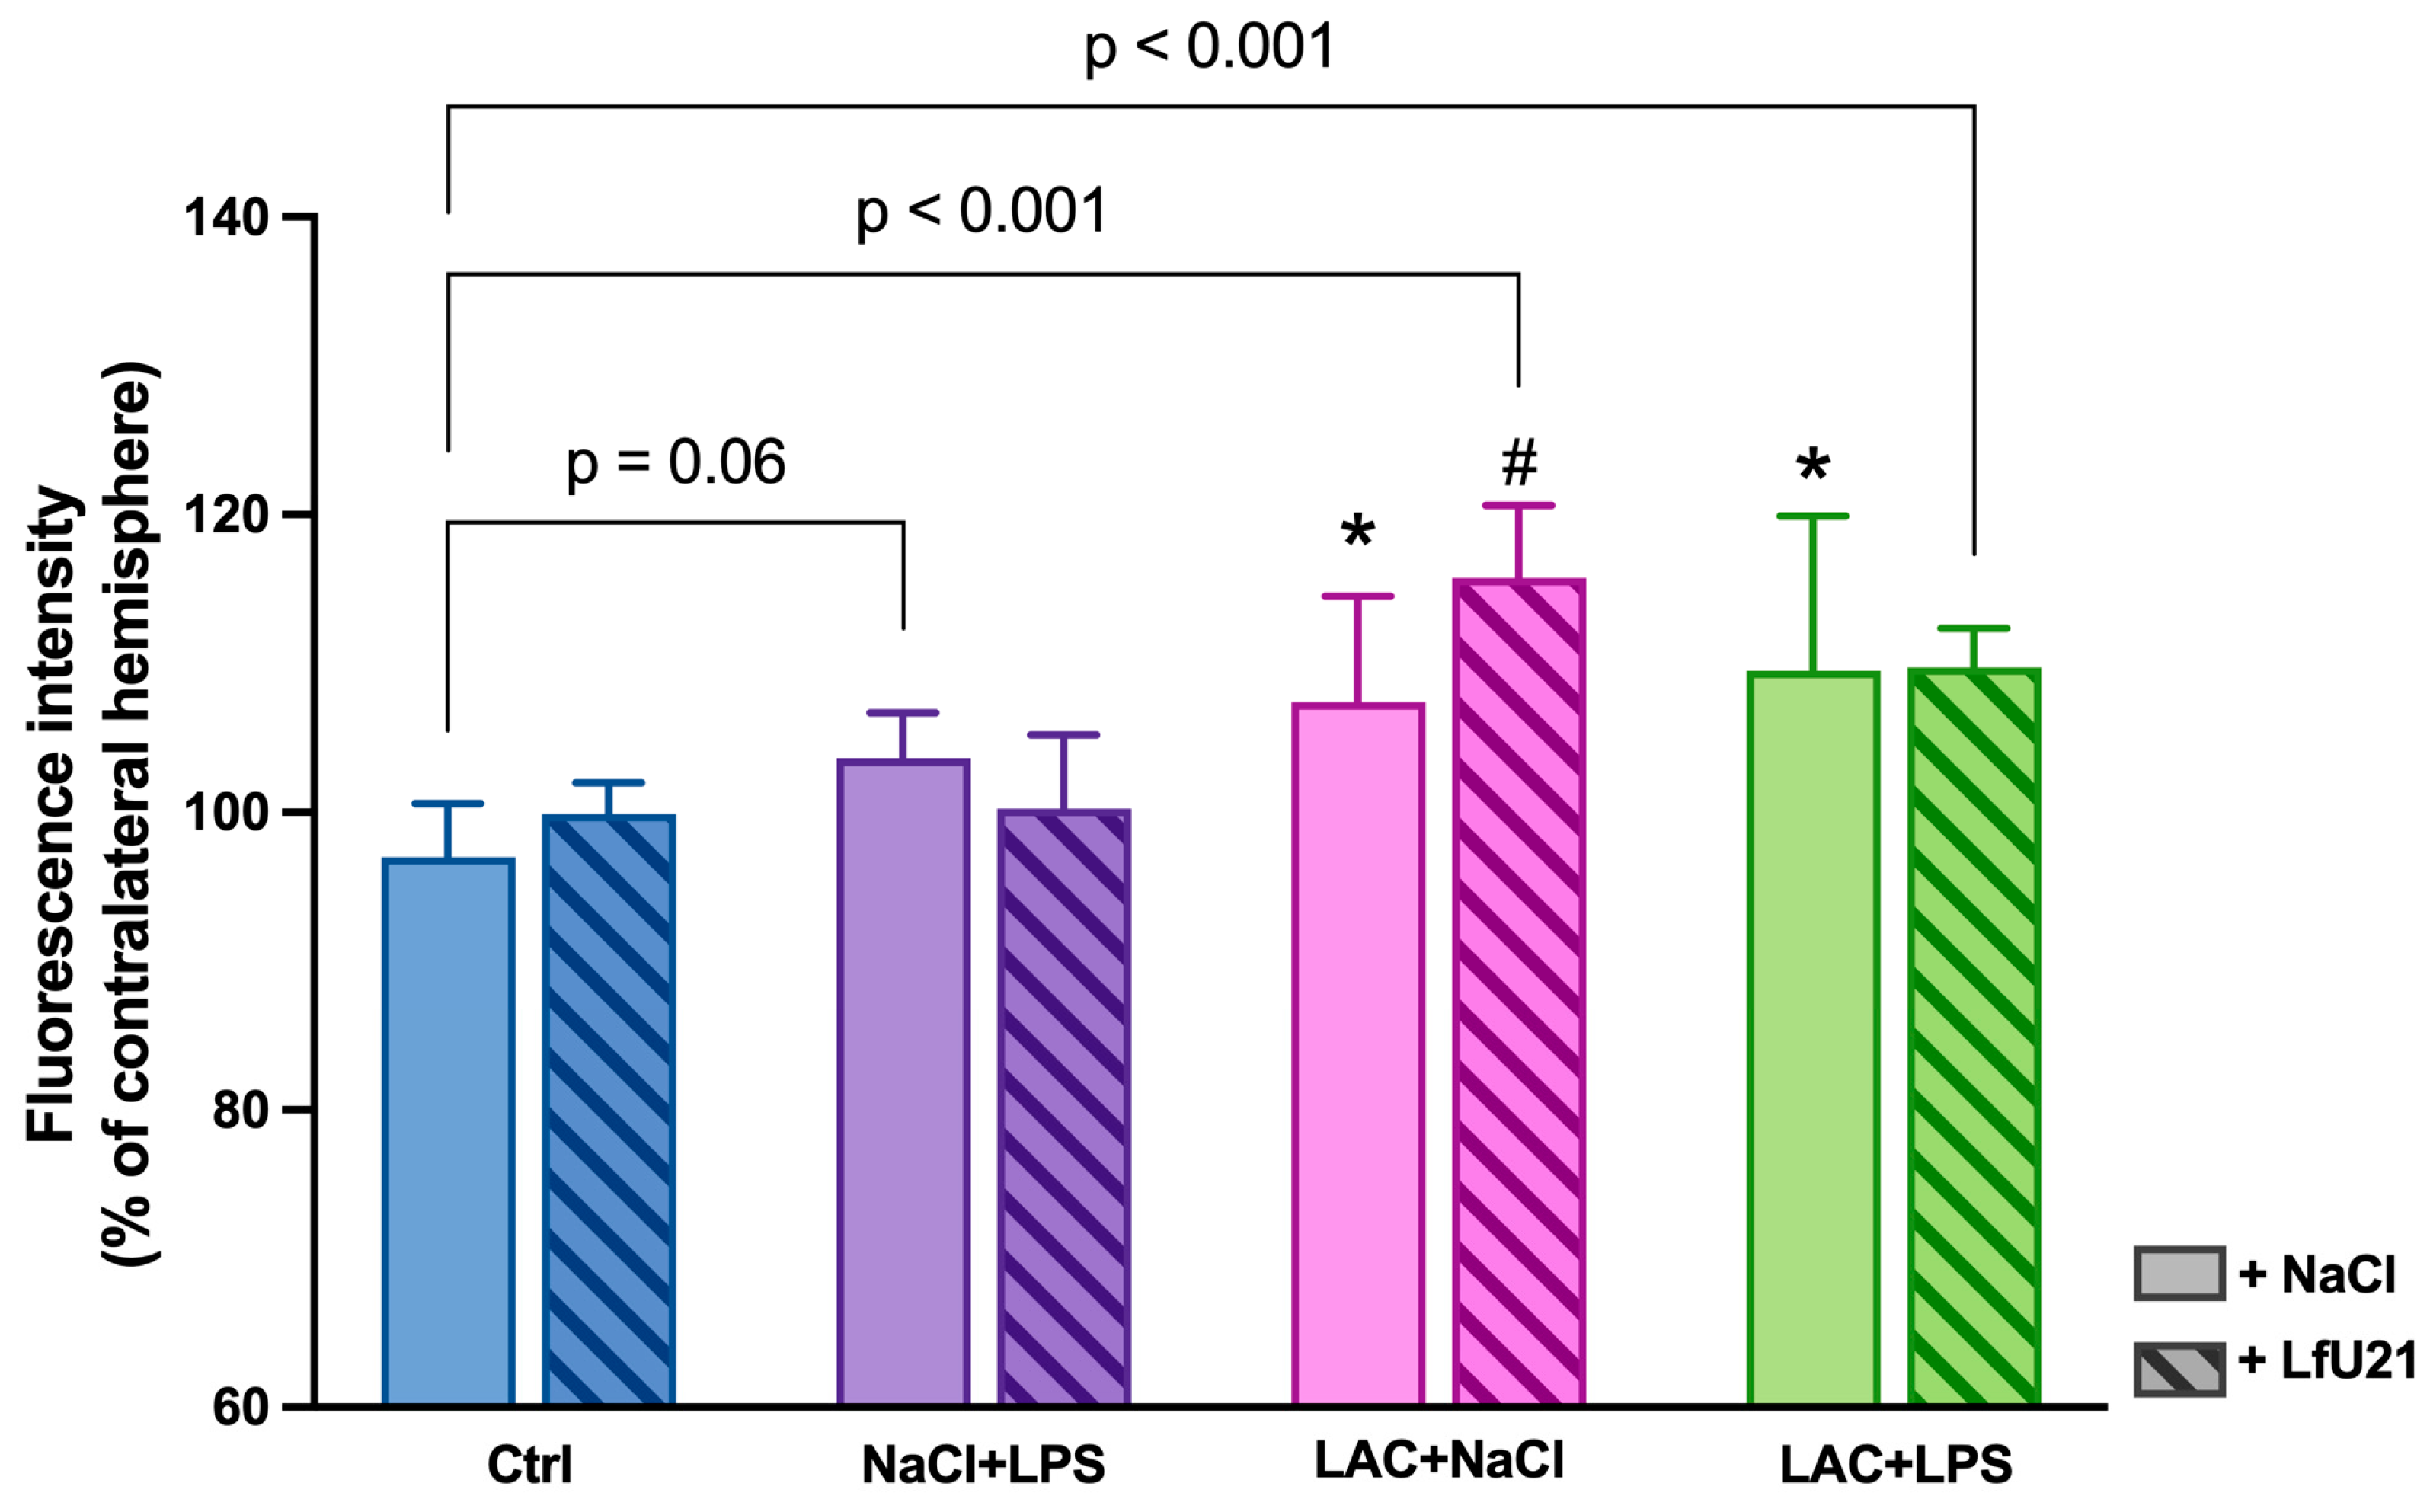
Figure 4.
A.drd2 mRNA level in the striatum in the left hemisphere. B. drd2 mRNA level in the striatum in the right hemisphere. The data is presented as mean ± SEM of three biological replicates. Gene-specific signals were normalized on actb cDNA. Each sample was analyzed in triplicate. The mRNA levels in the untreated group were taken as 1. Three-way ANOVA was used for statistical analysis, ns - p≥0.05, * - p<0.001 compared to Ctrl, # - p<0.05 compared to the group with the corresponding designation.
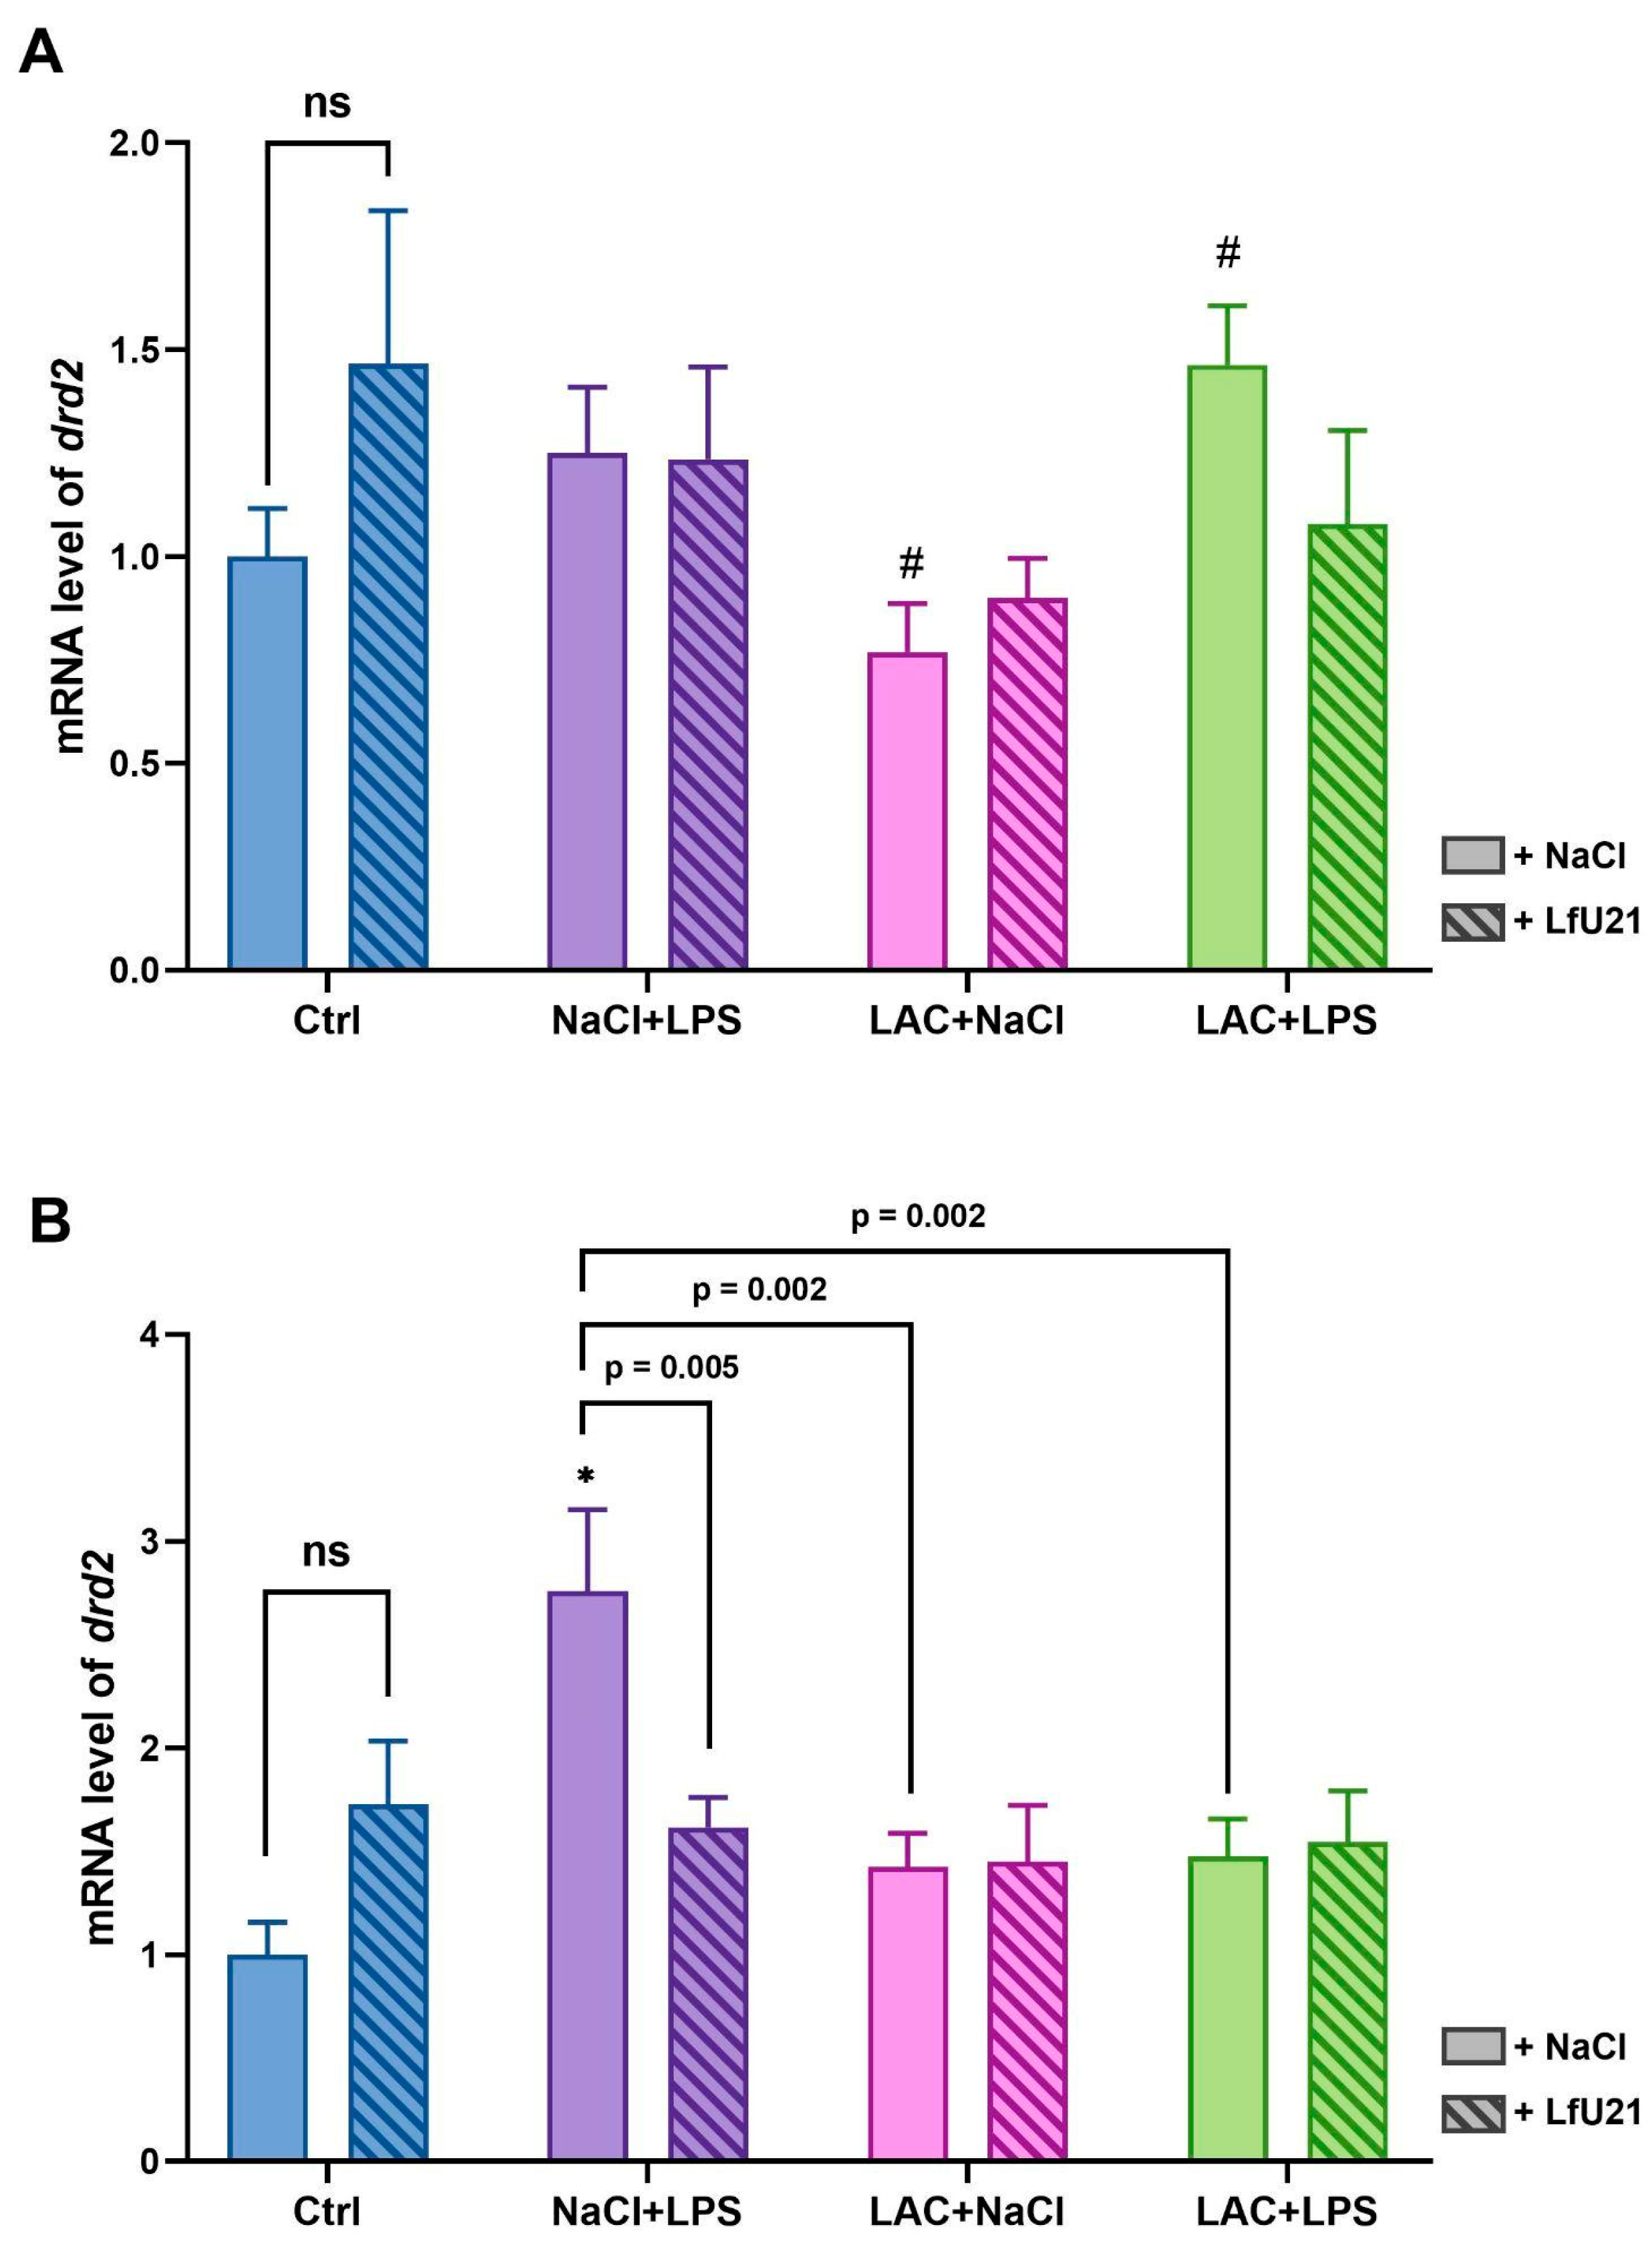
Figure 5.
A.ngf mRNA level in the striatum in the left hemisphere. B. ngf mRNA level in the striatum in the right hemisphere. The data is presented as mean ± SEM of three biological replicates. Gene-specific signals were normalized on actb cDNA. Each sample was analyzed in triplicate. The mRNA levels in the untreated group were taken as 1. Three-way ANOVA was used for statistical analysis, ns - p≥0.05.
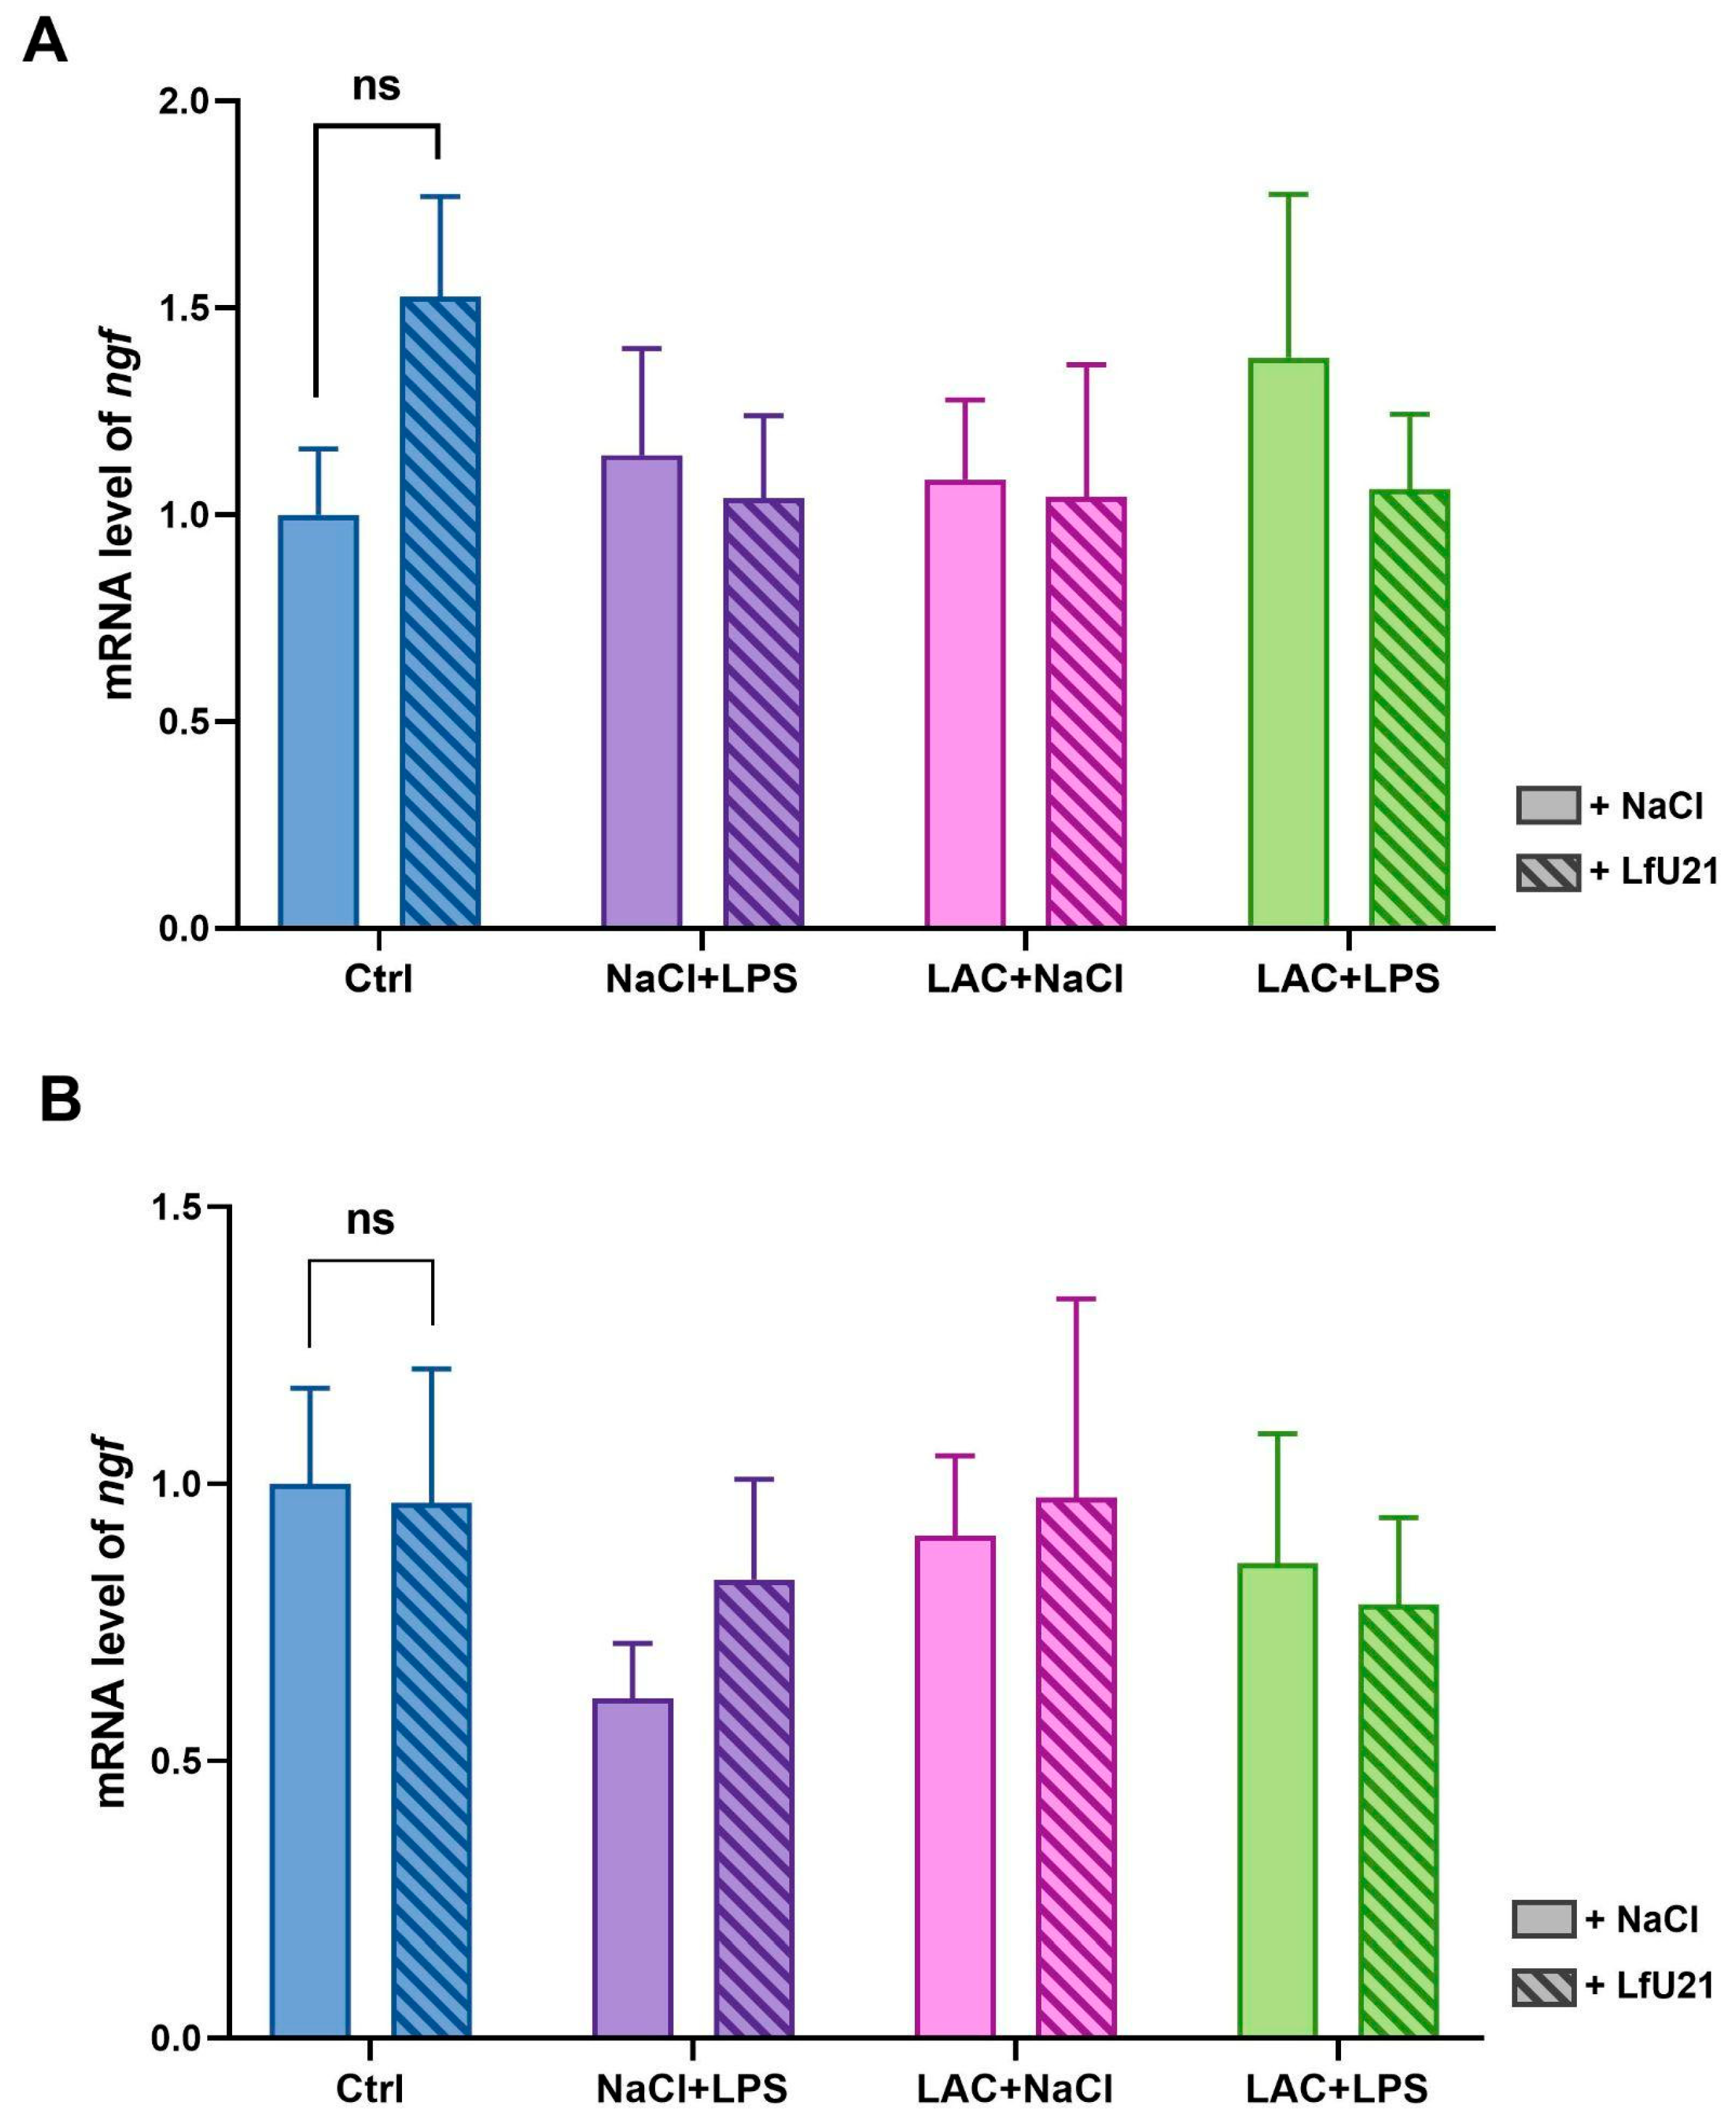
Figure 6.
A.bdnf mRNA level in the striatum in the left hemisphere. B. bdnf mRNA level in the striatum in the right hemisphere. The data is presented as mean ± SEM of three biological replicates. Gene-specific signals were normalized on actb cDNA. Each sample was analyzed in triplicate. The mRNA levels in the untreated group were taken as 1. Three-way ANOVA was used for statistical analysis, * - p<0.05, ** - p<0.01, *** - p<0.001, # - p<0.0001 compared to Ctrl.
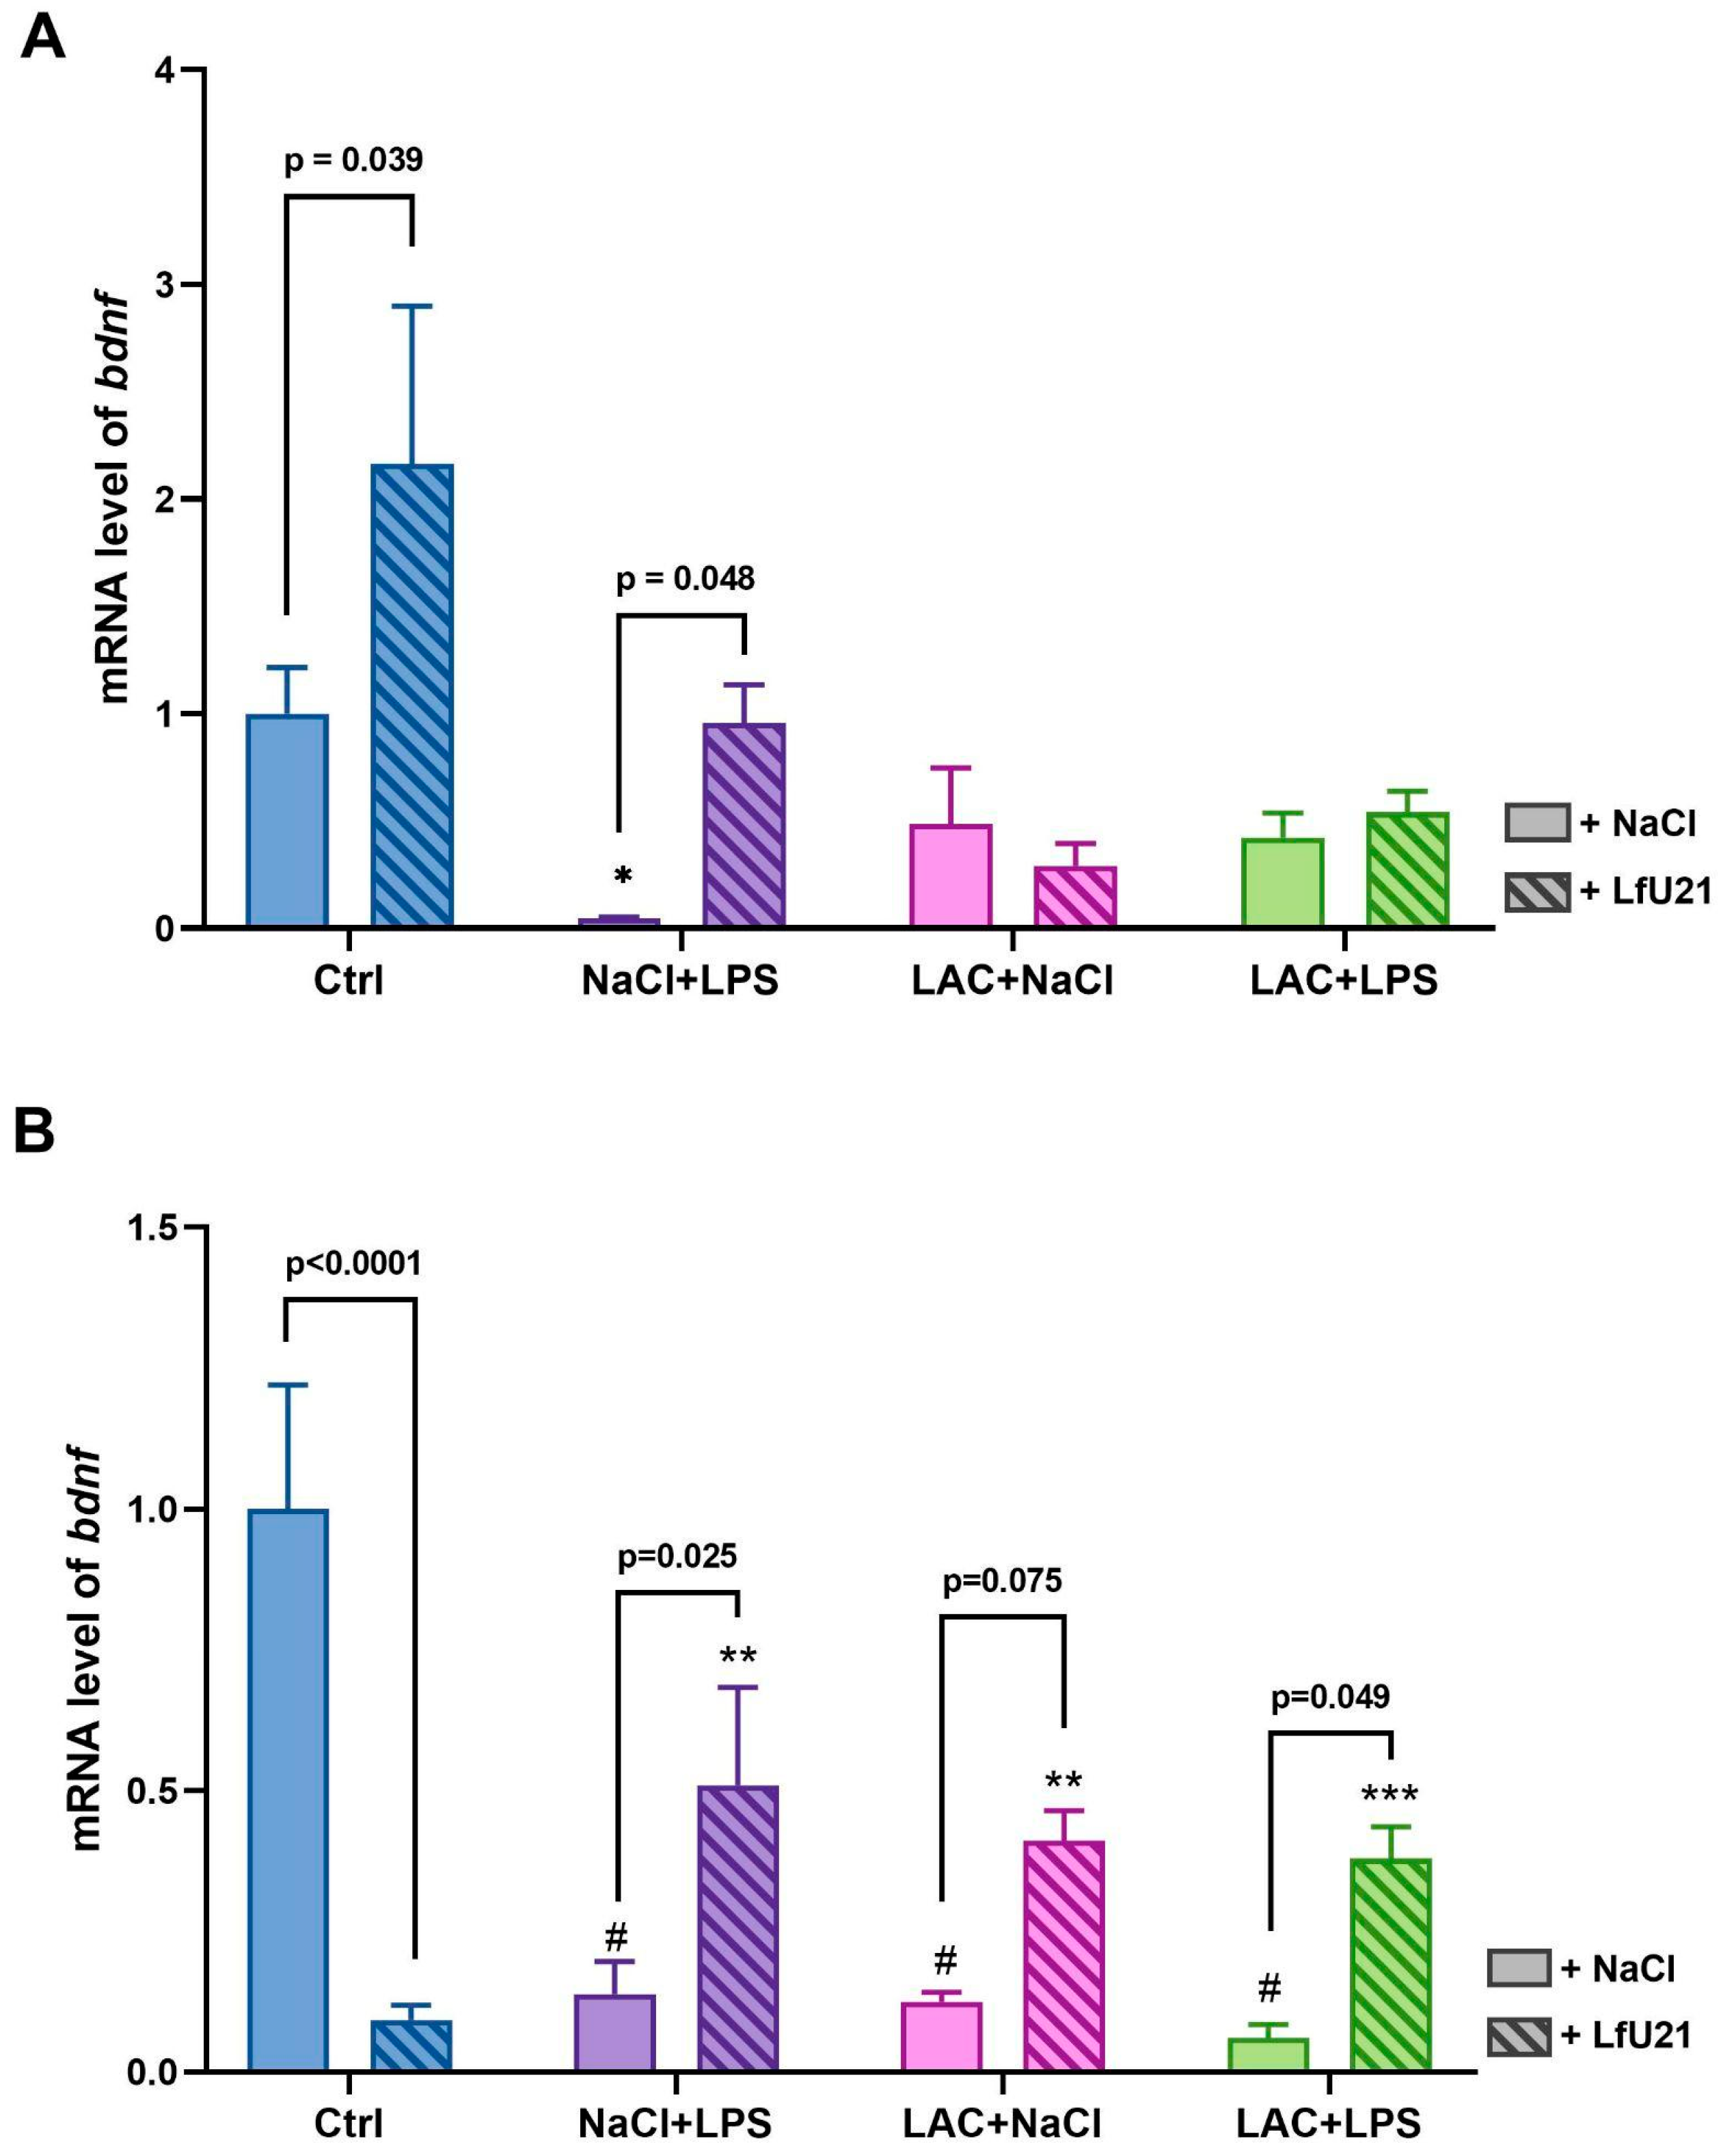
Figure 7.
A.trkB mRNA level in the striatum in the left hemisphere. B. trkB mRNA level in the striatum in the right hemisphere. The data is presented as mean ± SEM of three biological replicates. Gene-specific signals were normalized on actb cDNA. Each sample was analyzed in triplicate. The mRNA levels in the untreated group were taken as 1. Three-way ANOVA was used for statistical analysis, ns - p≥0.05.
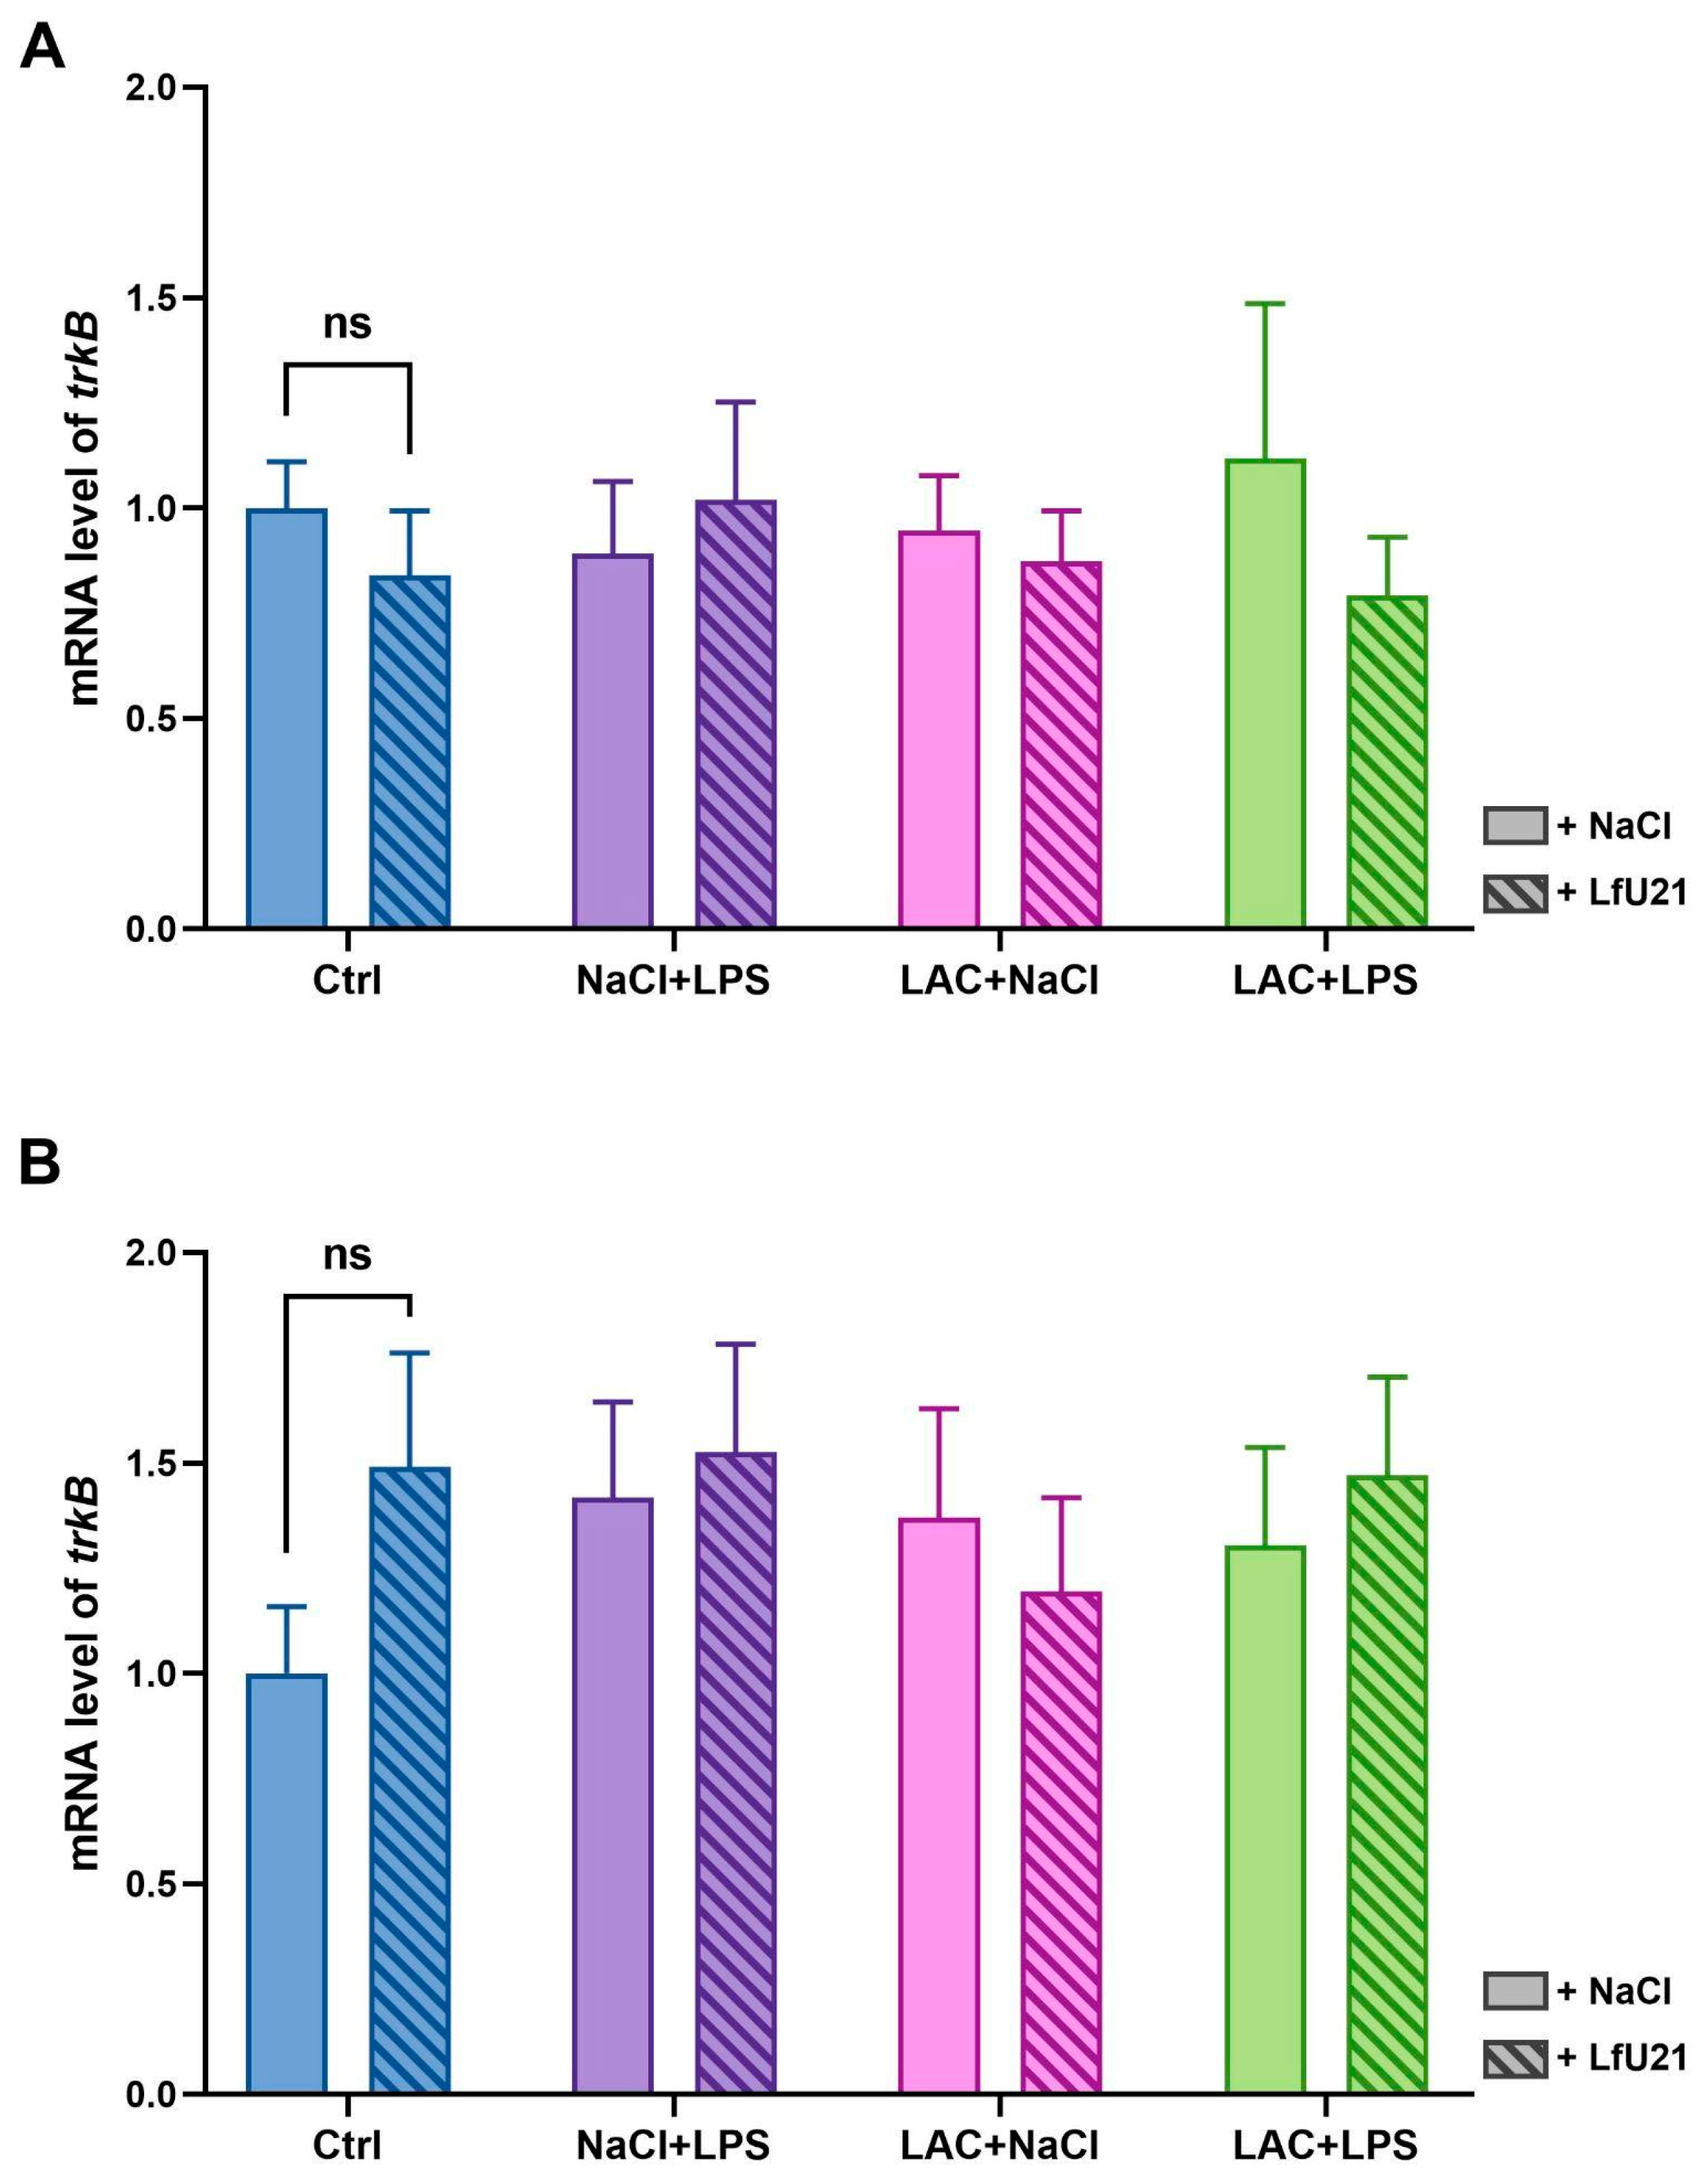
Figure 8.
Immunofluorescence staining for total α-synuclein in the ganglia of the myenteric plexus following administration of LfU21 to groups receiving LAC, LPS, and LAC+LPS. Scale: 100 μm.
Figure 8.
Immunofluorescence staining for total α-synuclein in the ganglia of the myenteric plexus following administration of LfU21 to groups receiving LAC, LPS, and LAC+LPS. Scale: 100 μm.
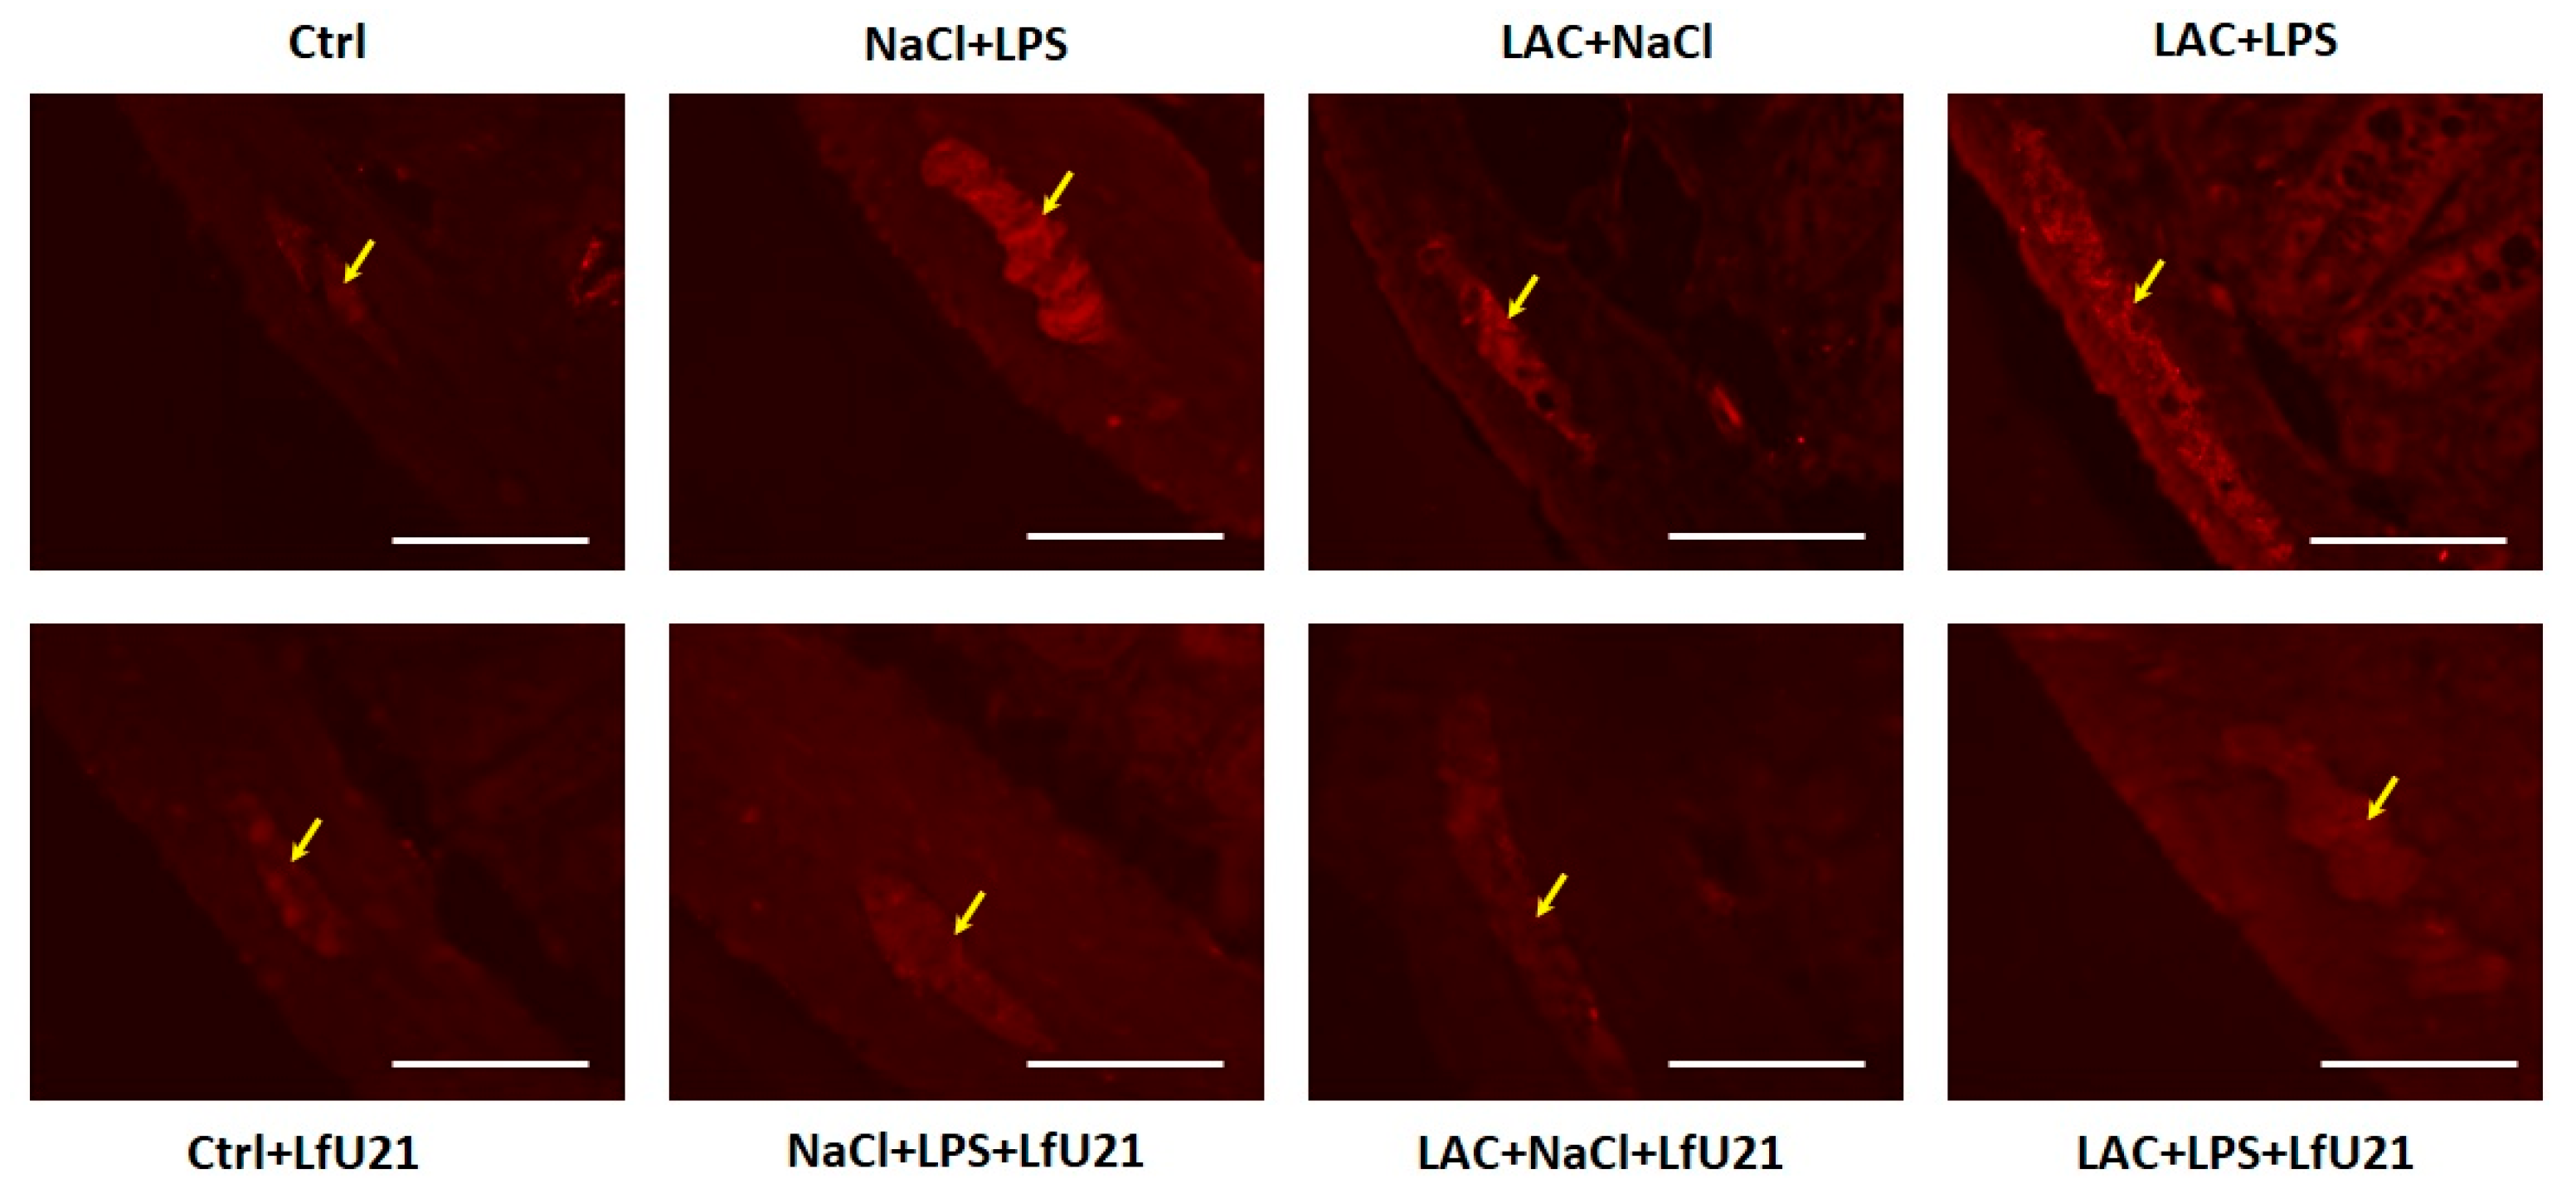
Figure 9.
Immunofluorescence staining (arrows) for phosphorylated α-synuclein in the ganglia of the myenteric plexus following administration of LfU21 to groups receiving LAC, LPS, and LAC+LPS. Scale: 50 μm.
Figure 9.
Immunofluorescence staining (arrows) for phosphorylated α-synuclein in the ganglia of the myenteric plexus following administration of LfU21 to groups receiving LAC, LPS, and LAC+LPS. Scale: 50 μm.
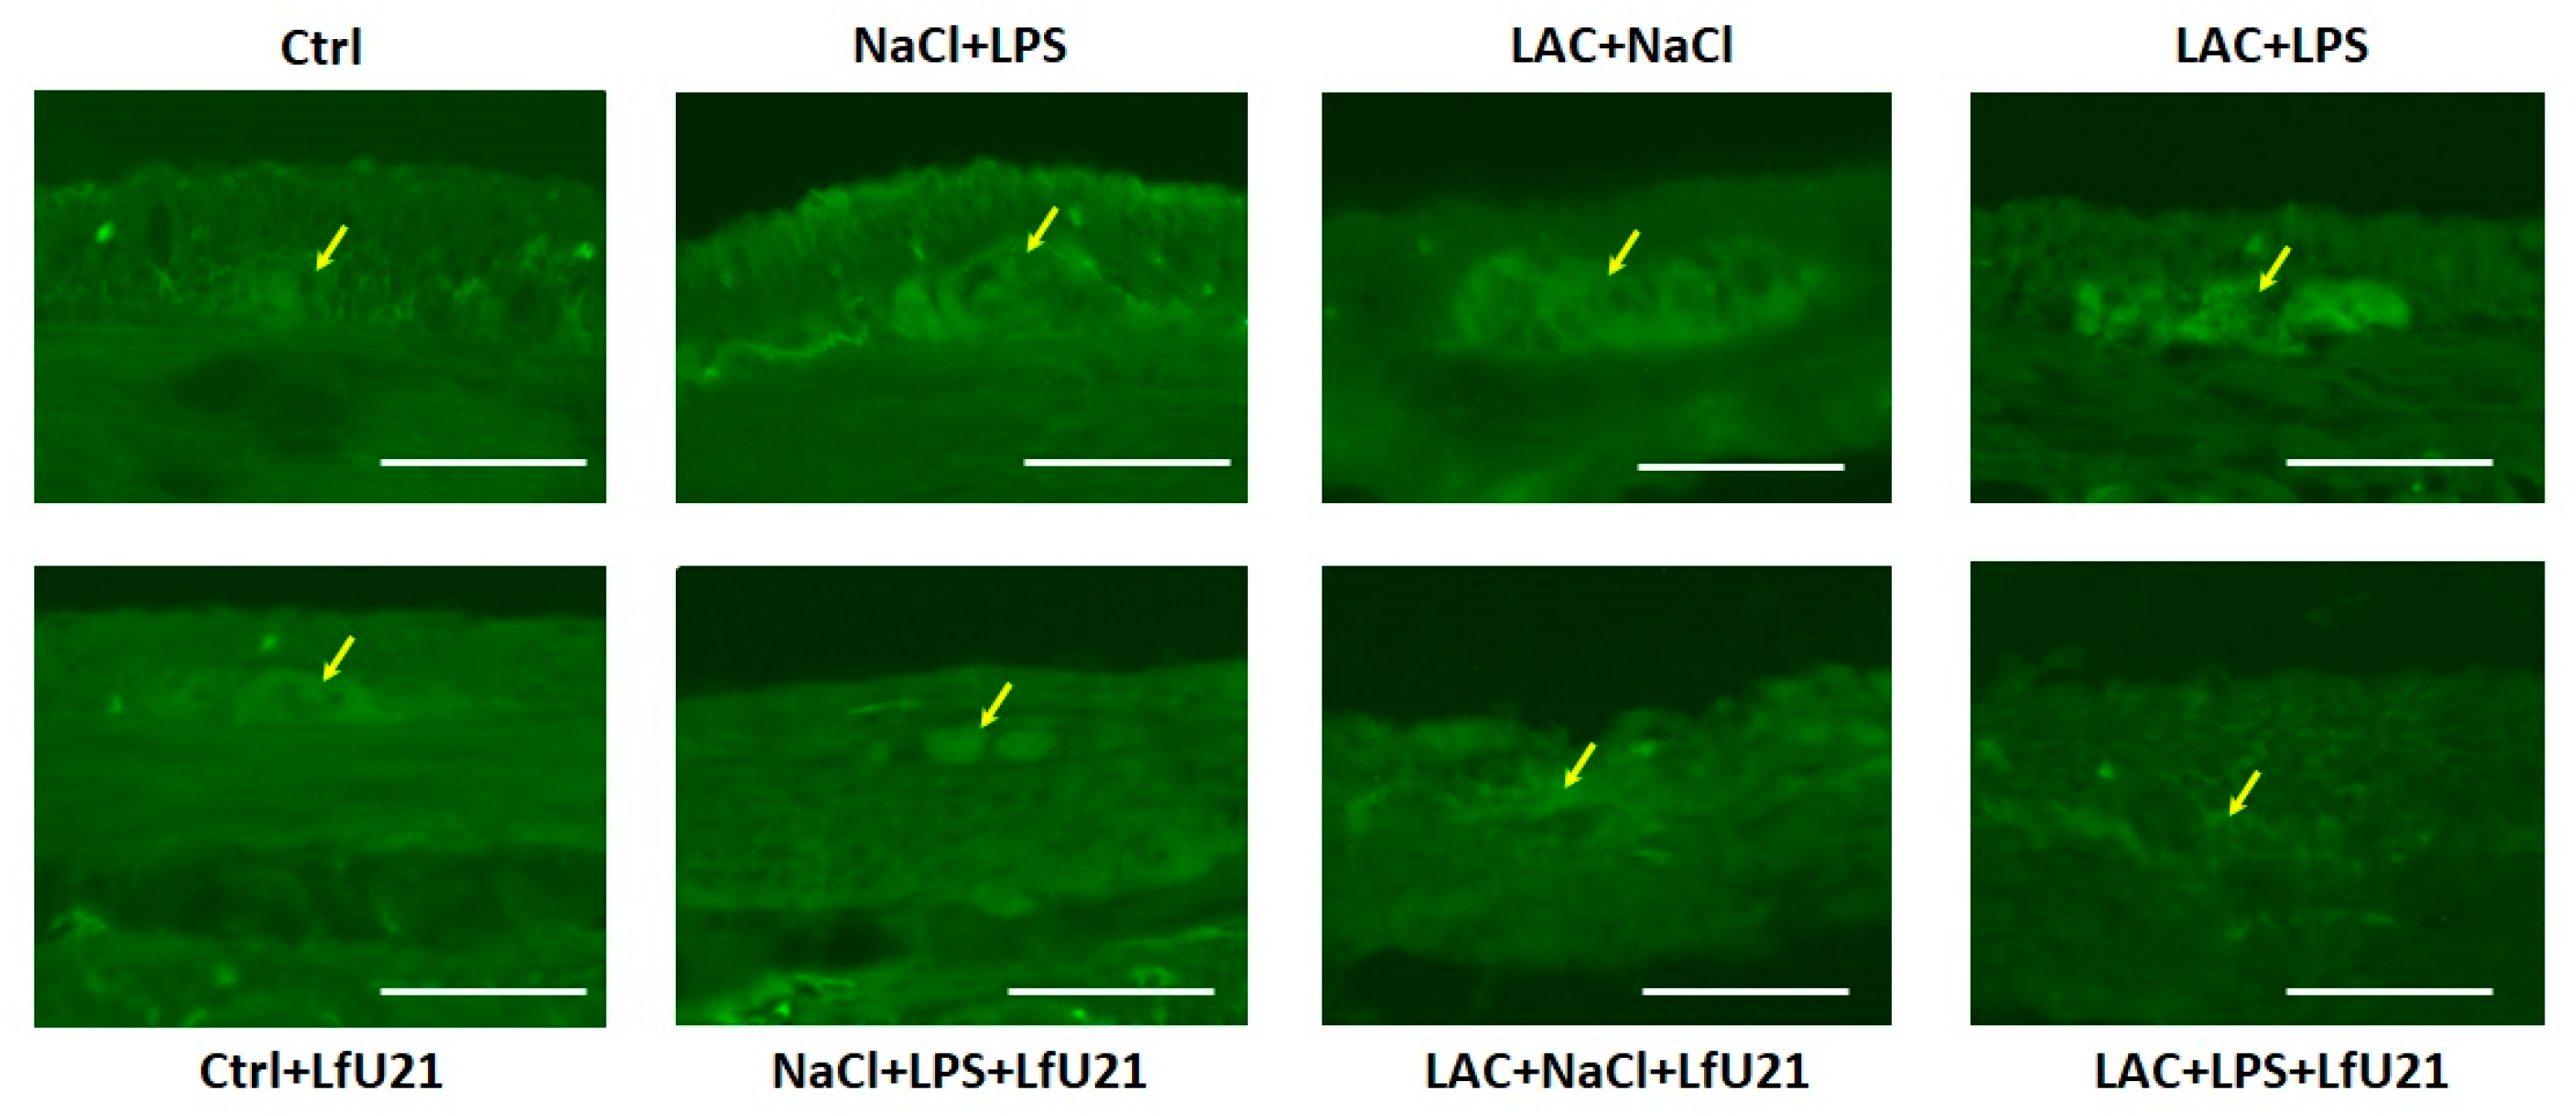
Figure 10.
Intensity of immunofluorescence staining for total α-synuclein (A) and phosphorylated α-synuclein (B) in the ganglia of the myenteric plexus after administration of LfU21 to groups receiving LAC, LPS, and LAC+LPS. Three-way ANOVA was used for statistical analysis. Significant differences are indicated on the graphs (* - p<0.001 compared to Ctrl, # - p < 0.05 compared to the corresponding groups without strain administration). The data is presented as mean ± SEM.
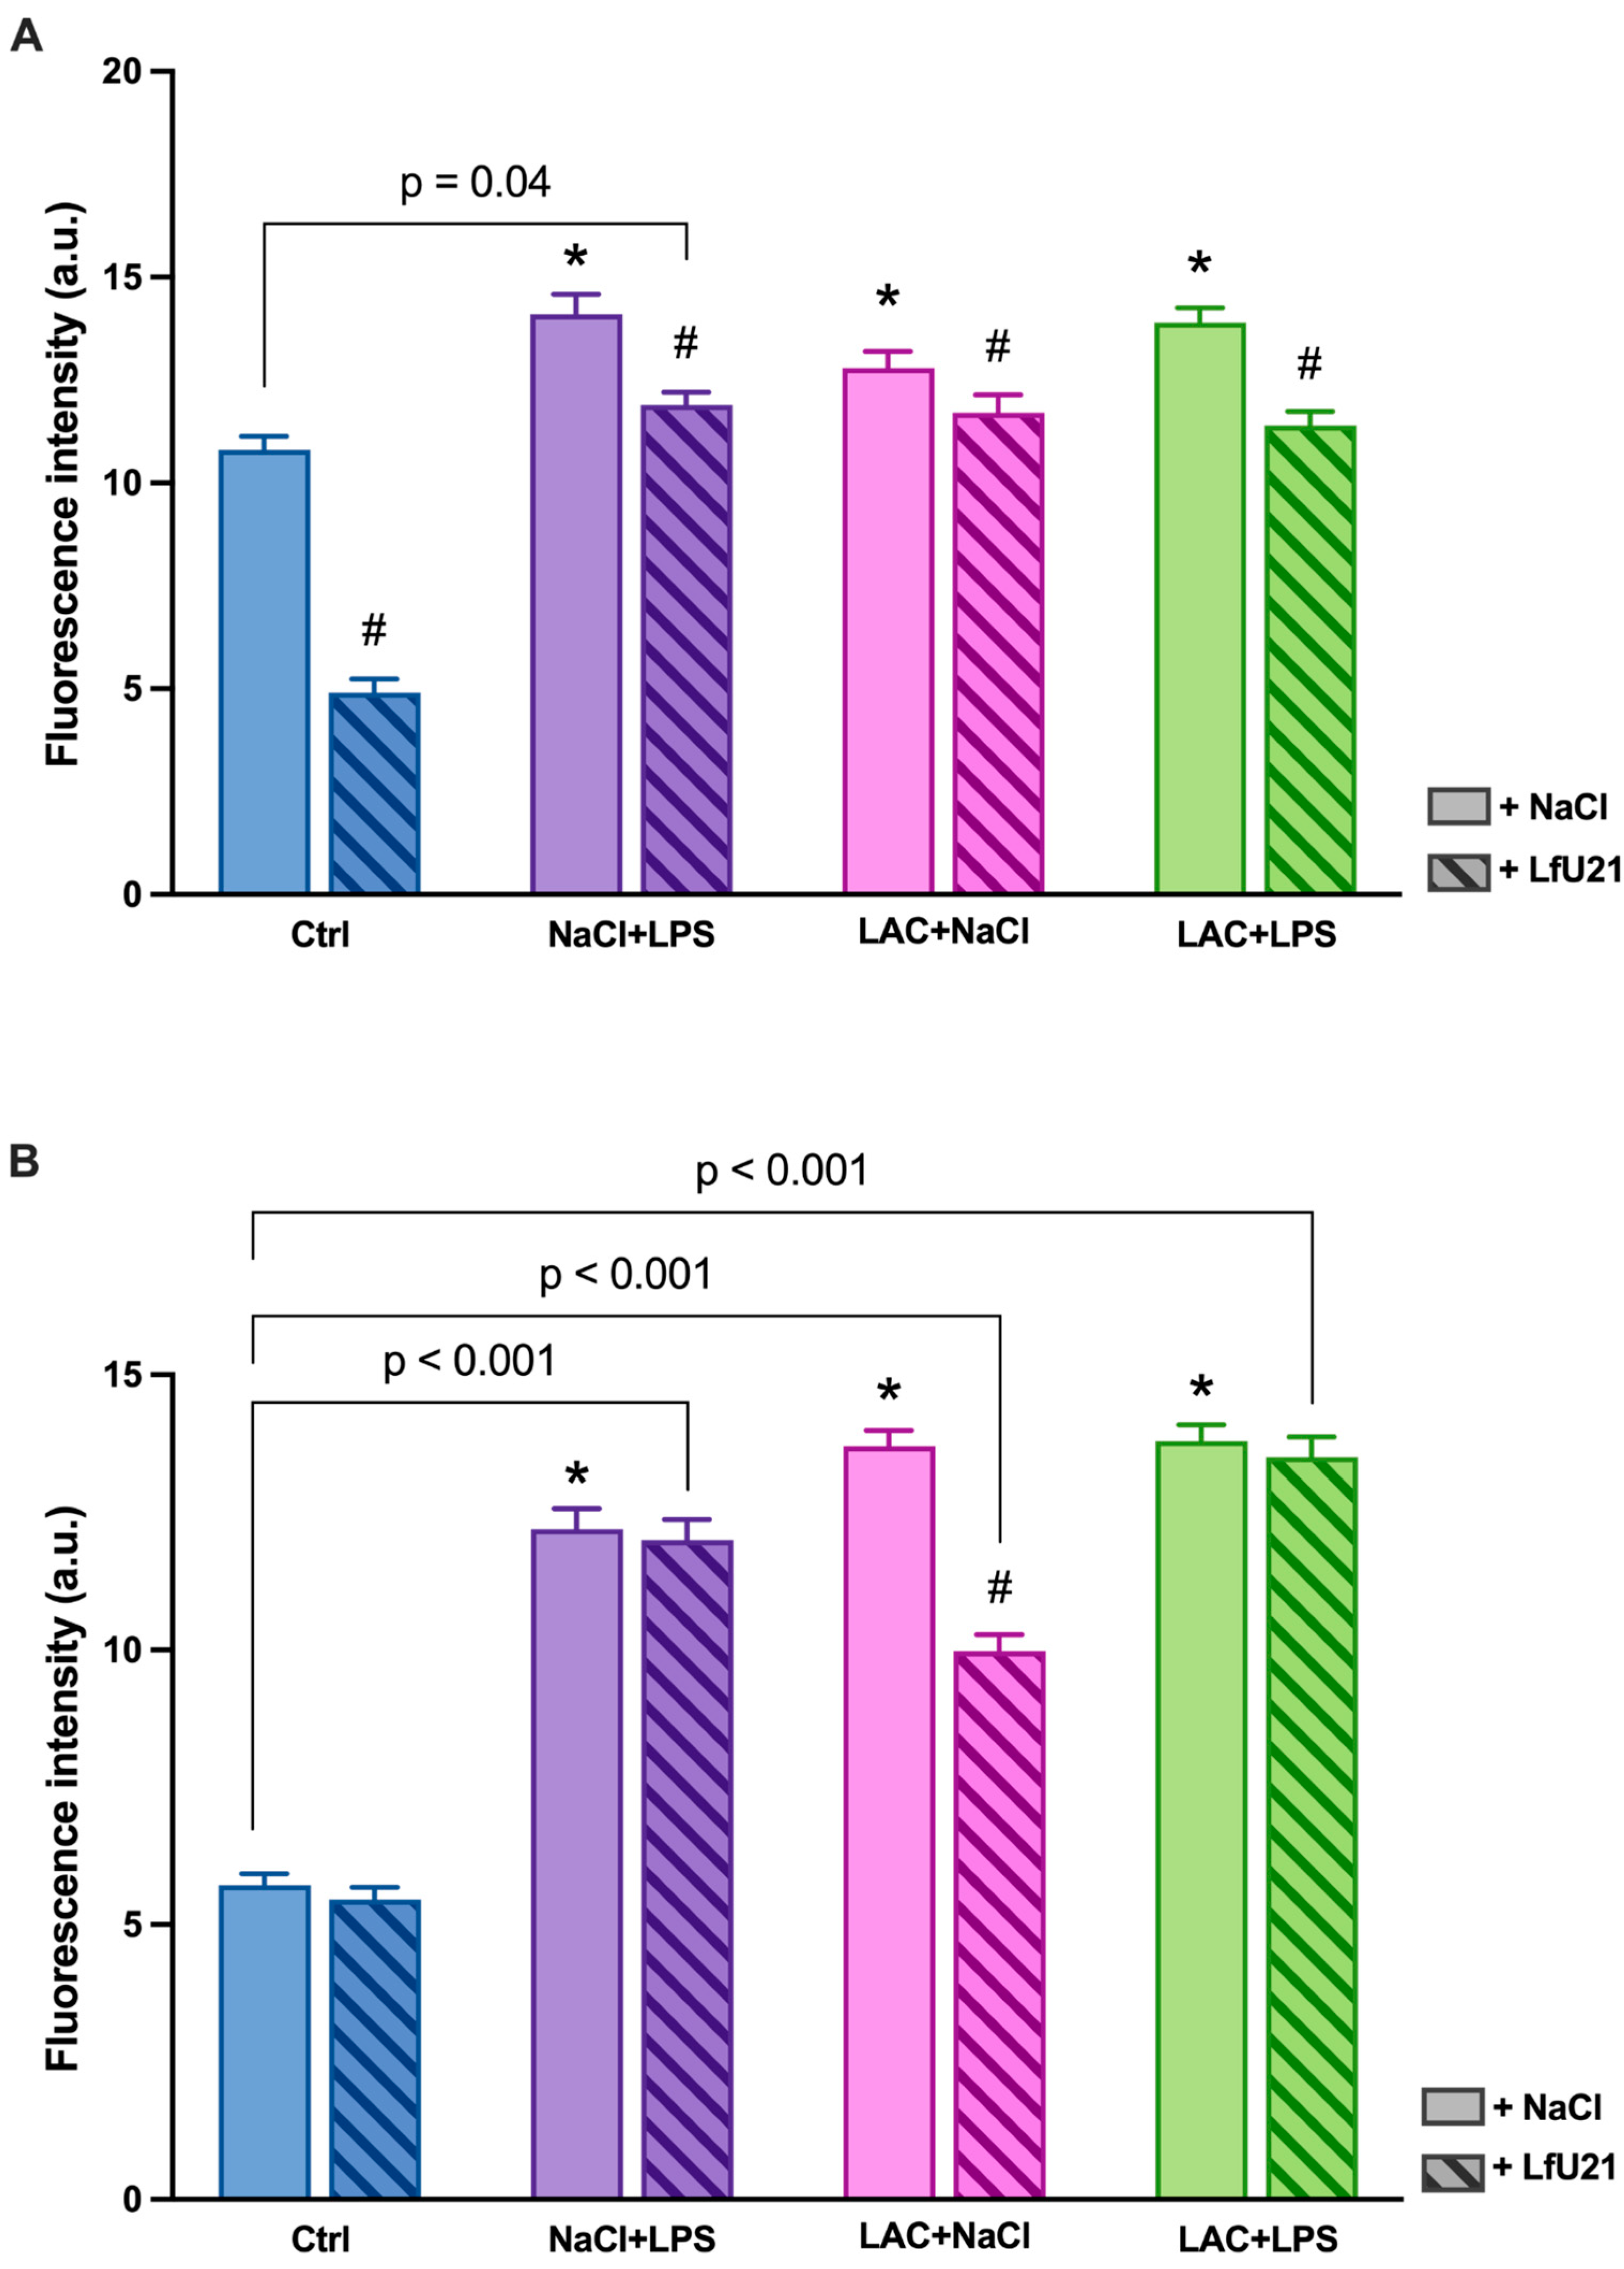
Figure 11.
Goblet cells in the epithelium of the small intestine after administration of LfU21 to groups receiving LAC, LPS, and LAC+LPS. Stained with Alcian blue. Scale: 100 μm.
Figure 11.
Goblet cells in the epithelium of the small intestine after administration of LfU21 to groups receiving LAC, LPS, and LAC+LPS. Stained with Alcian blue. Scale: 100 μm.
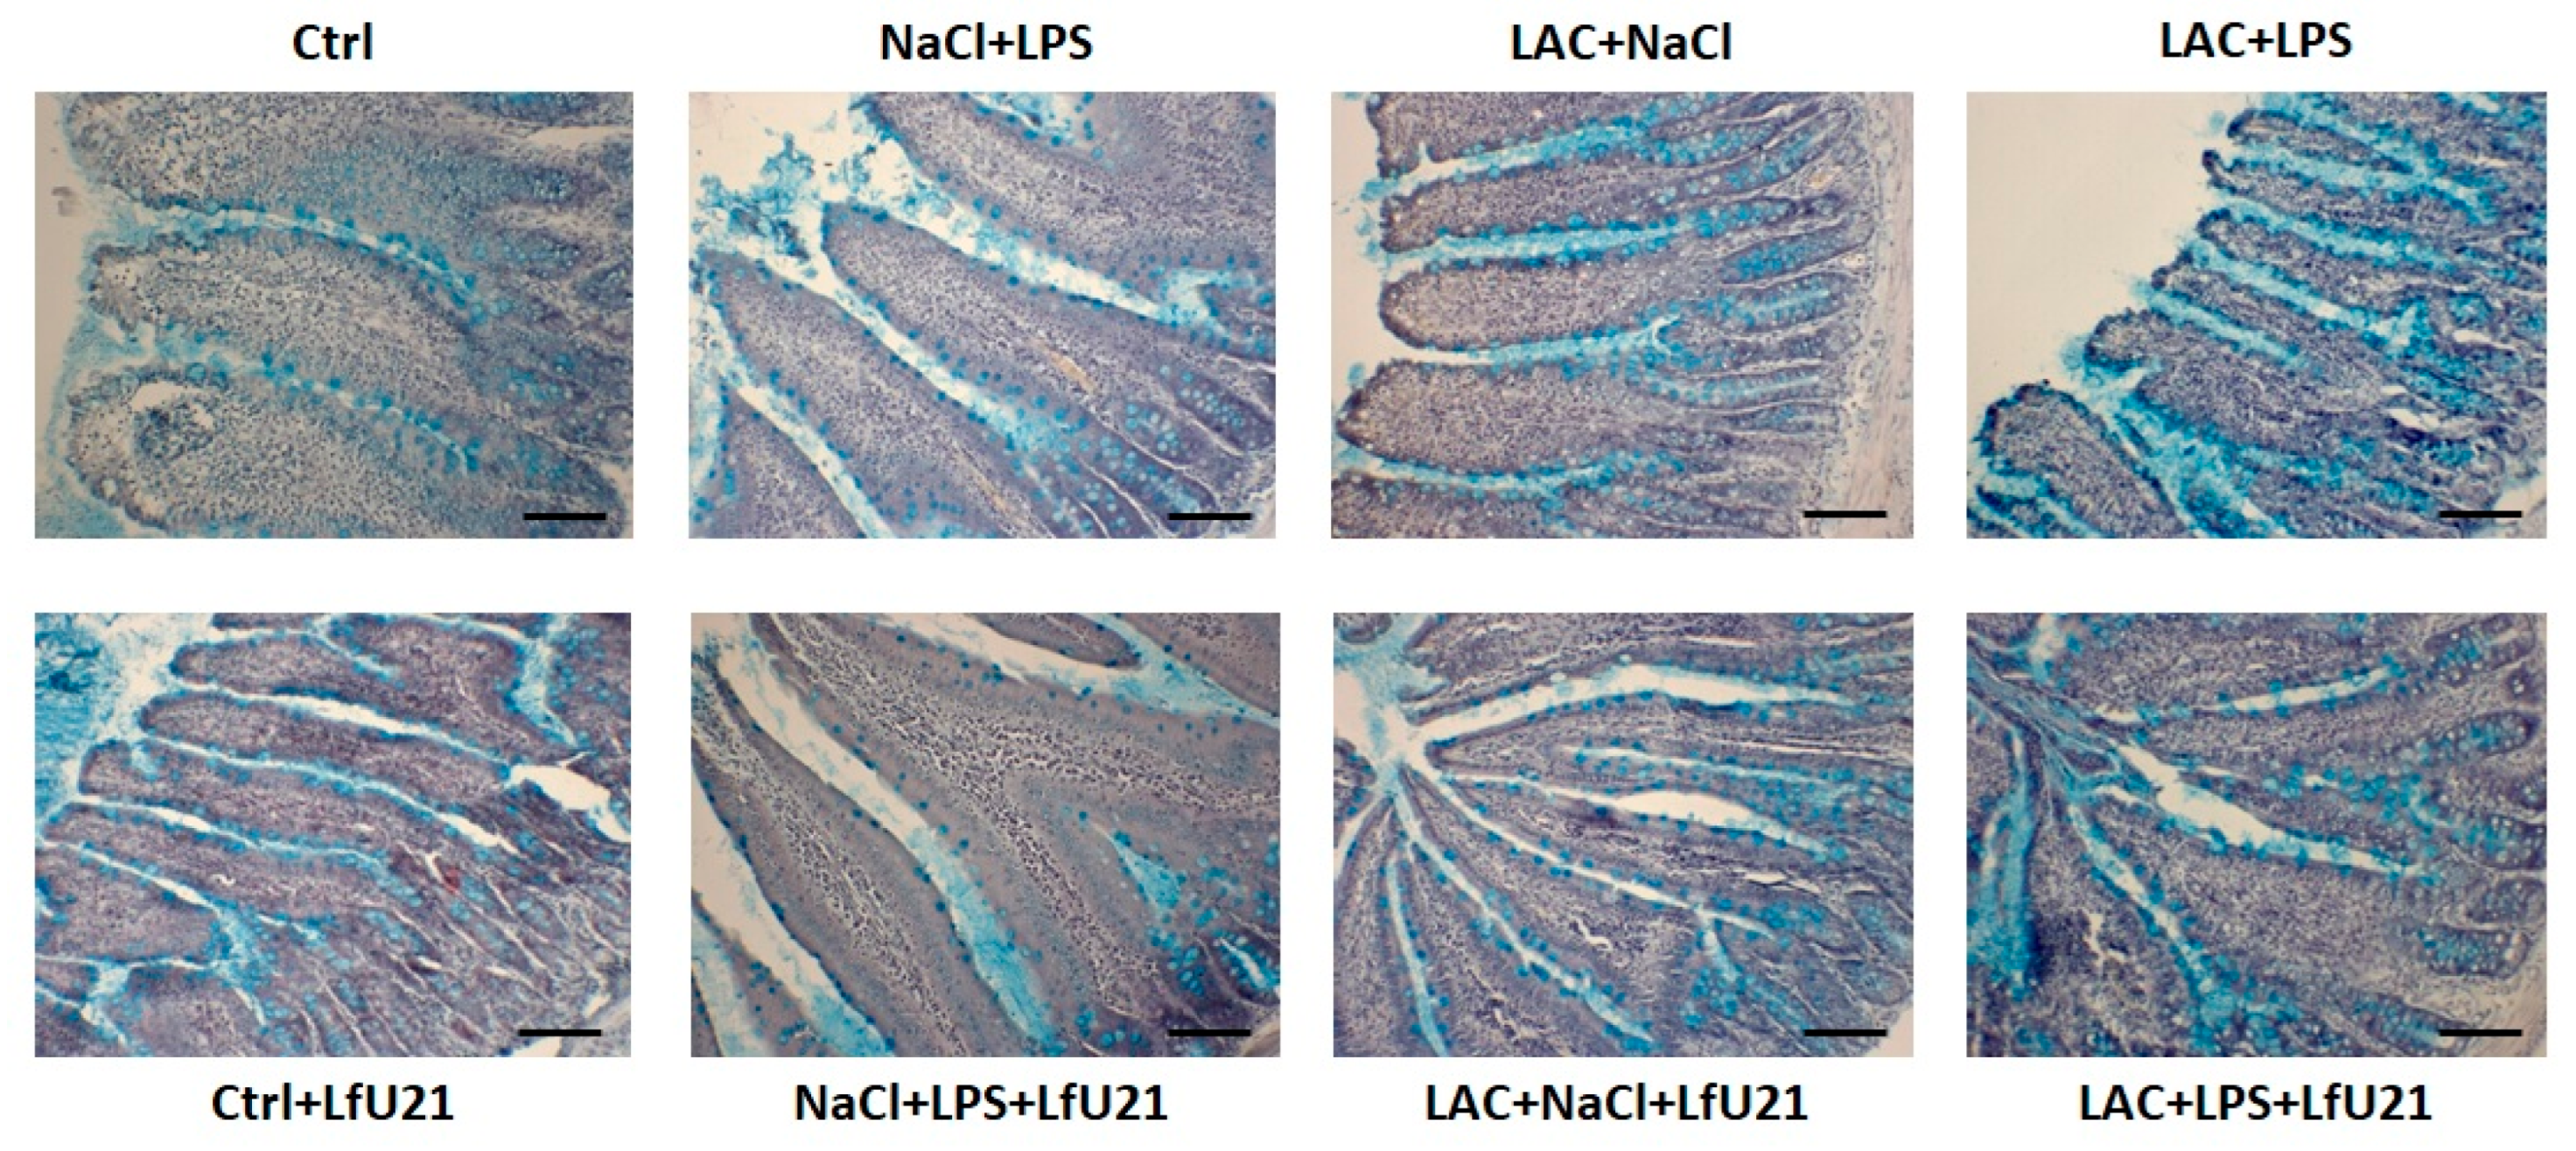
Figure 12.
Number of goblet cells per 100 μm of intestinal villus length after administration of strain U-21 to groups receiving LAC, LPS, and LAC+LPS. Three-way ANOVA was used for statistical analysis. Significant differences are indicated on the graphs (* - p<0.001 compared to Ctrl, # - p < 0.05 compared to the corresponding groups without strain administration). The data is presented as mean ± SEM.
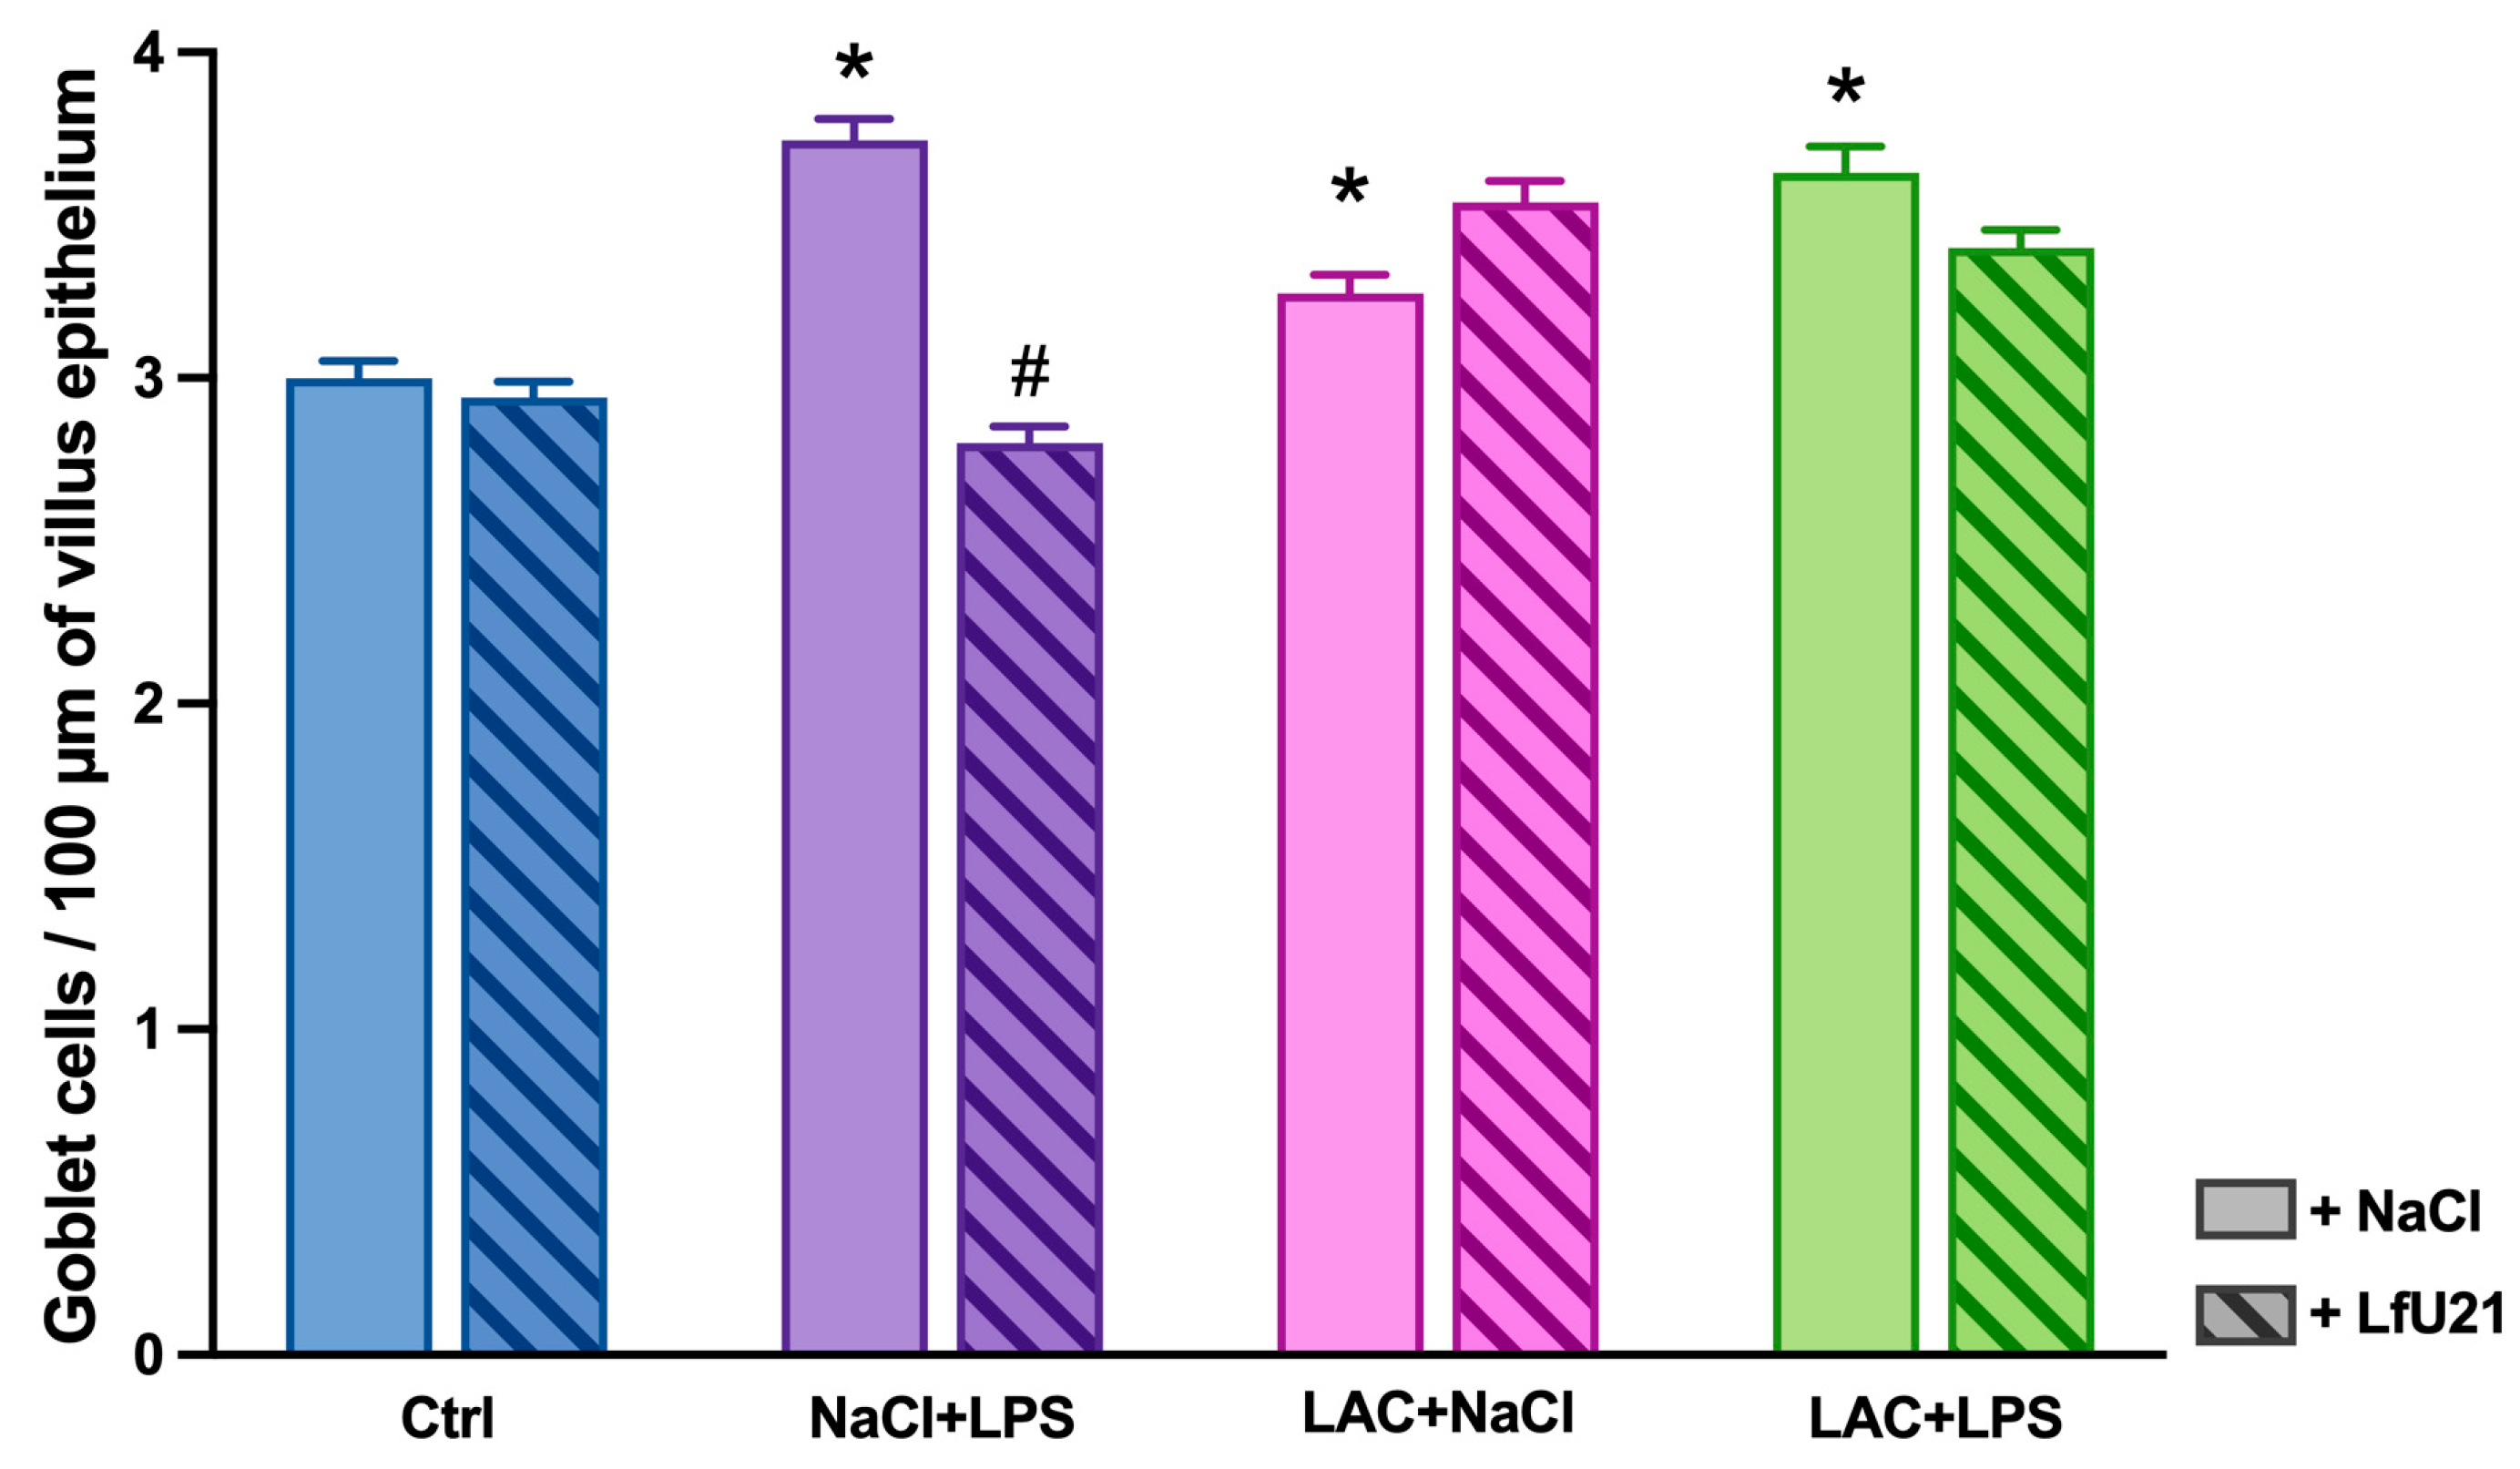
Figure 13.
A. Total superoxide dismutase activity in the liver of rats. B. Catalase activity in the liver of rats. C. The amount of GSH in the liver of rats. The data is presented as mean ± SEM of three biological replicates. Three-way ANOVA was used for statistical analysis, ns - p≥0.05, asterisks, * - p<0.05, ** - p<0.01, *** - p<0.001, **** - p<0.0001 compared to Ctrl.
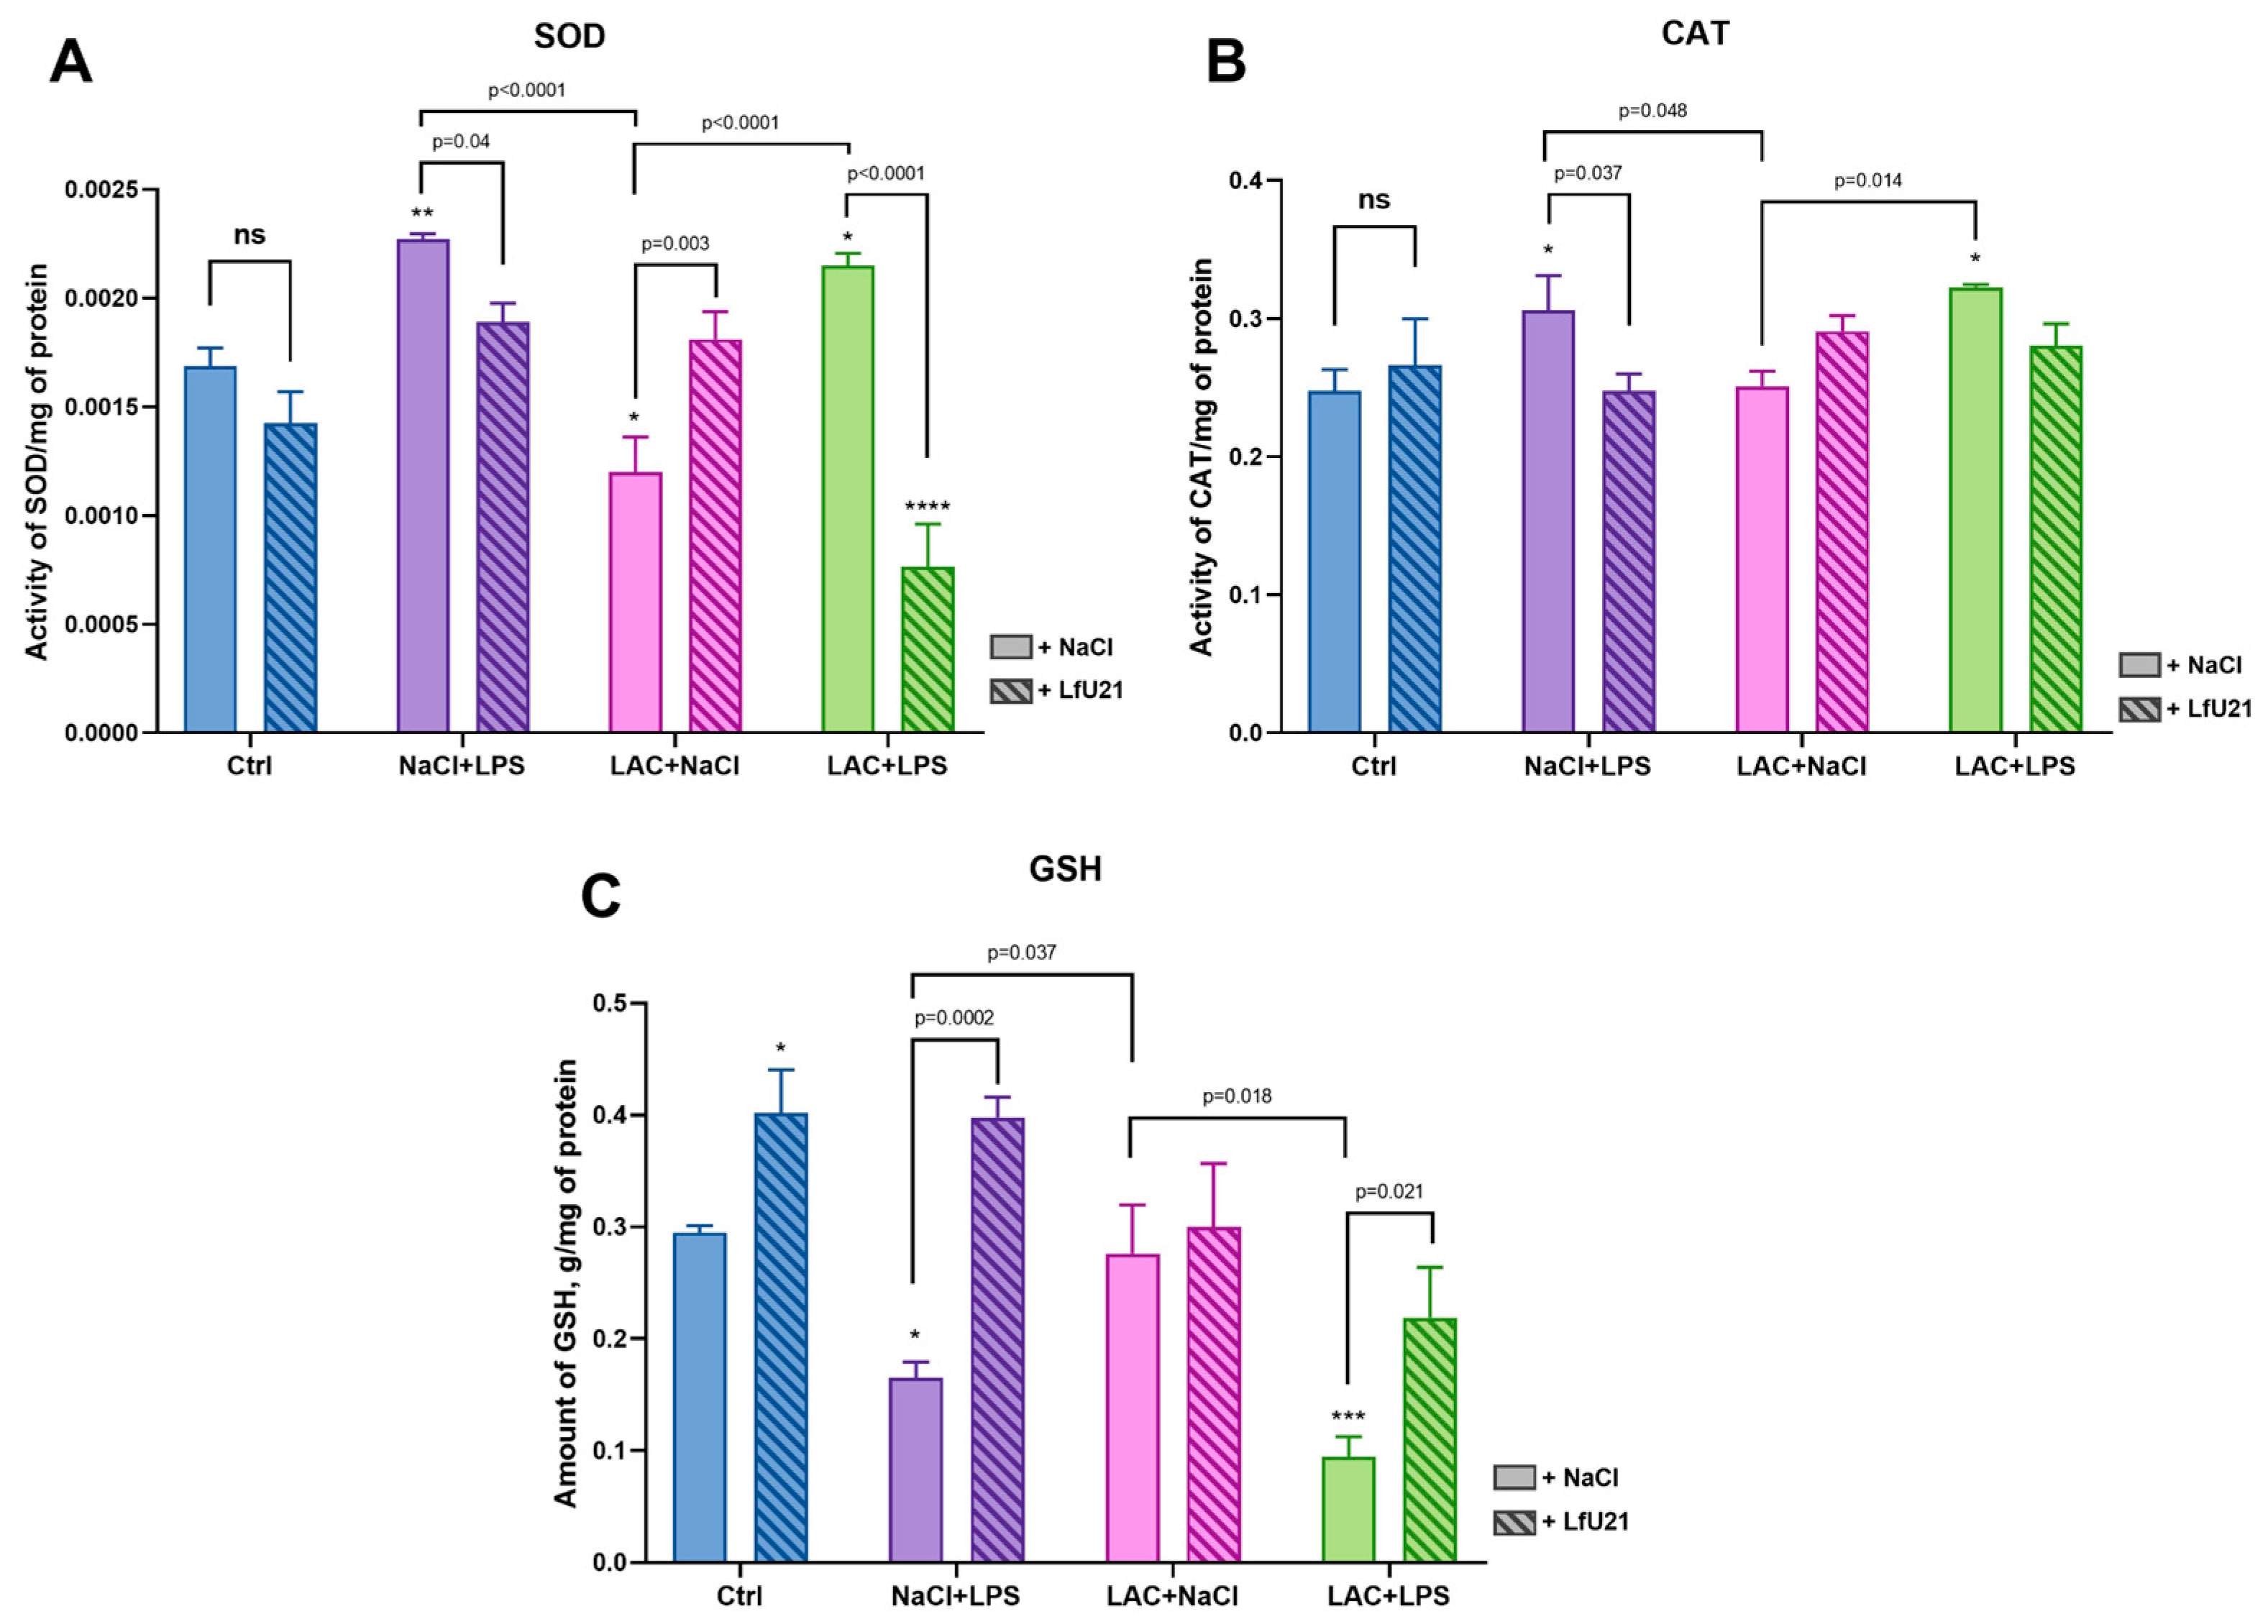
Figure 14.
A. IL6 content in the liver of rats. B. IL10 content in the liver of rats. C. TNF content in the liver of rats. The data is presented as mean ± SEM of three biological replicates. Three-way ANOVA was used for statistical analysis, ns - p≥0.05. Comparison of group with # is with the corresponding group with the same designation, the number of # indicates the p-value, p<0.05 (#), p<0.01 (##) or p<0.001 (###).
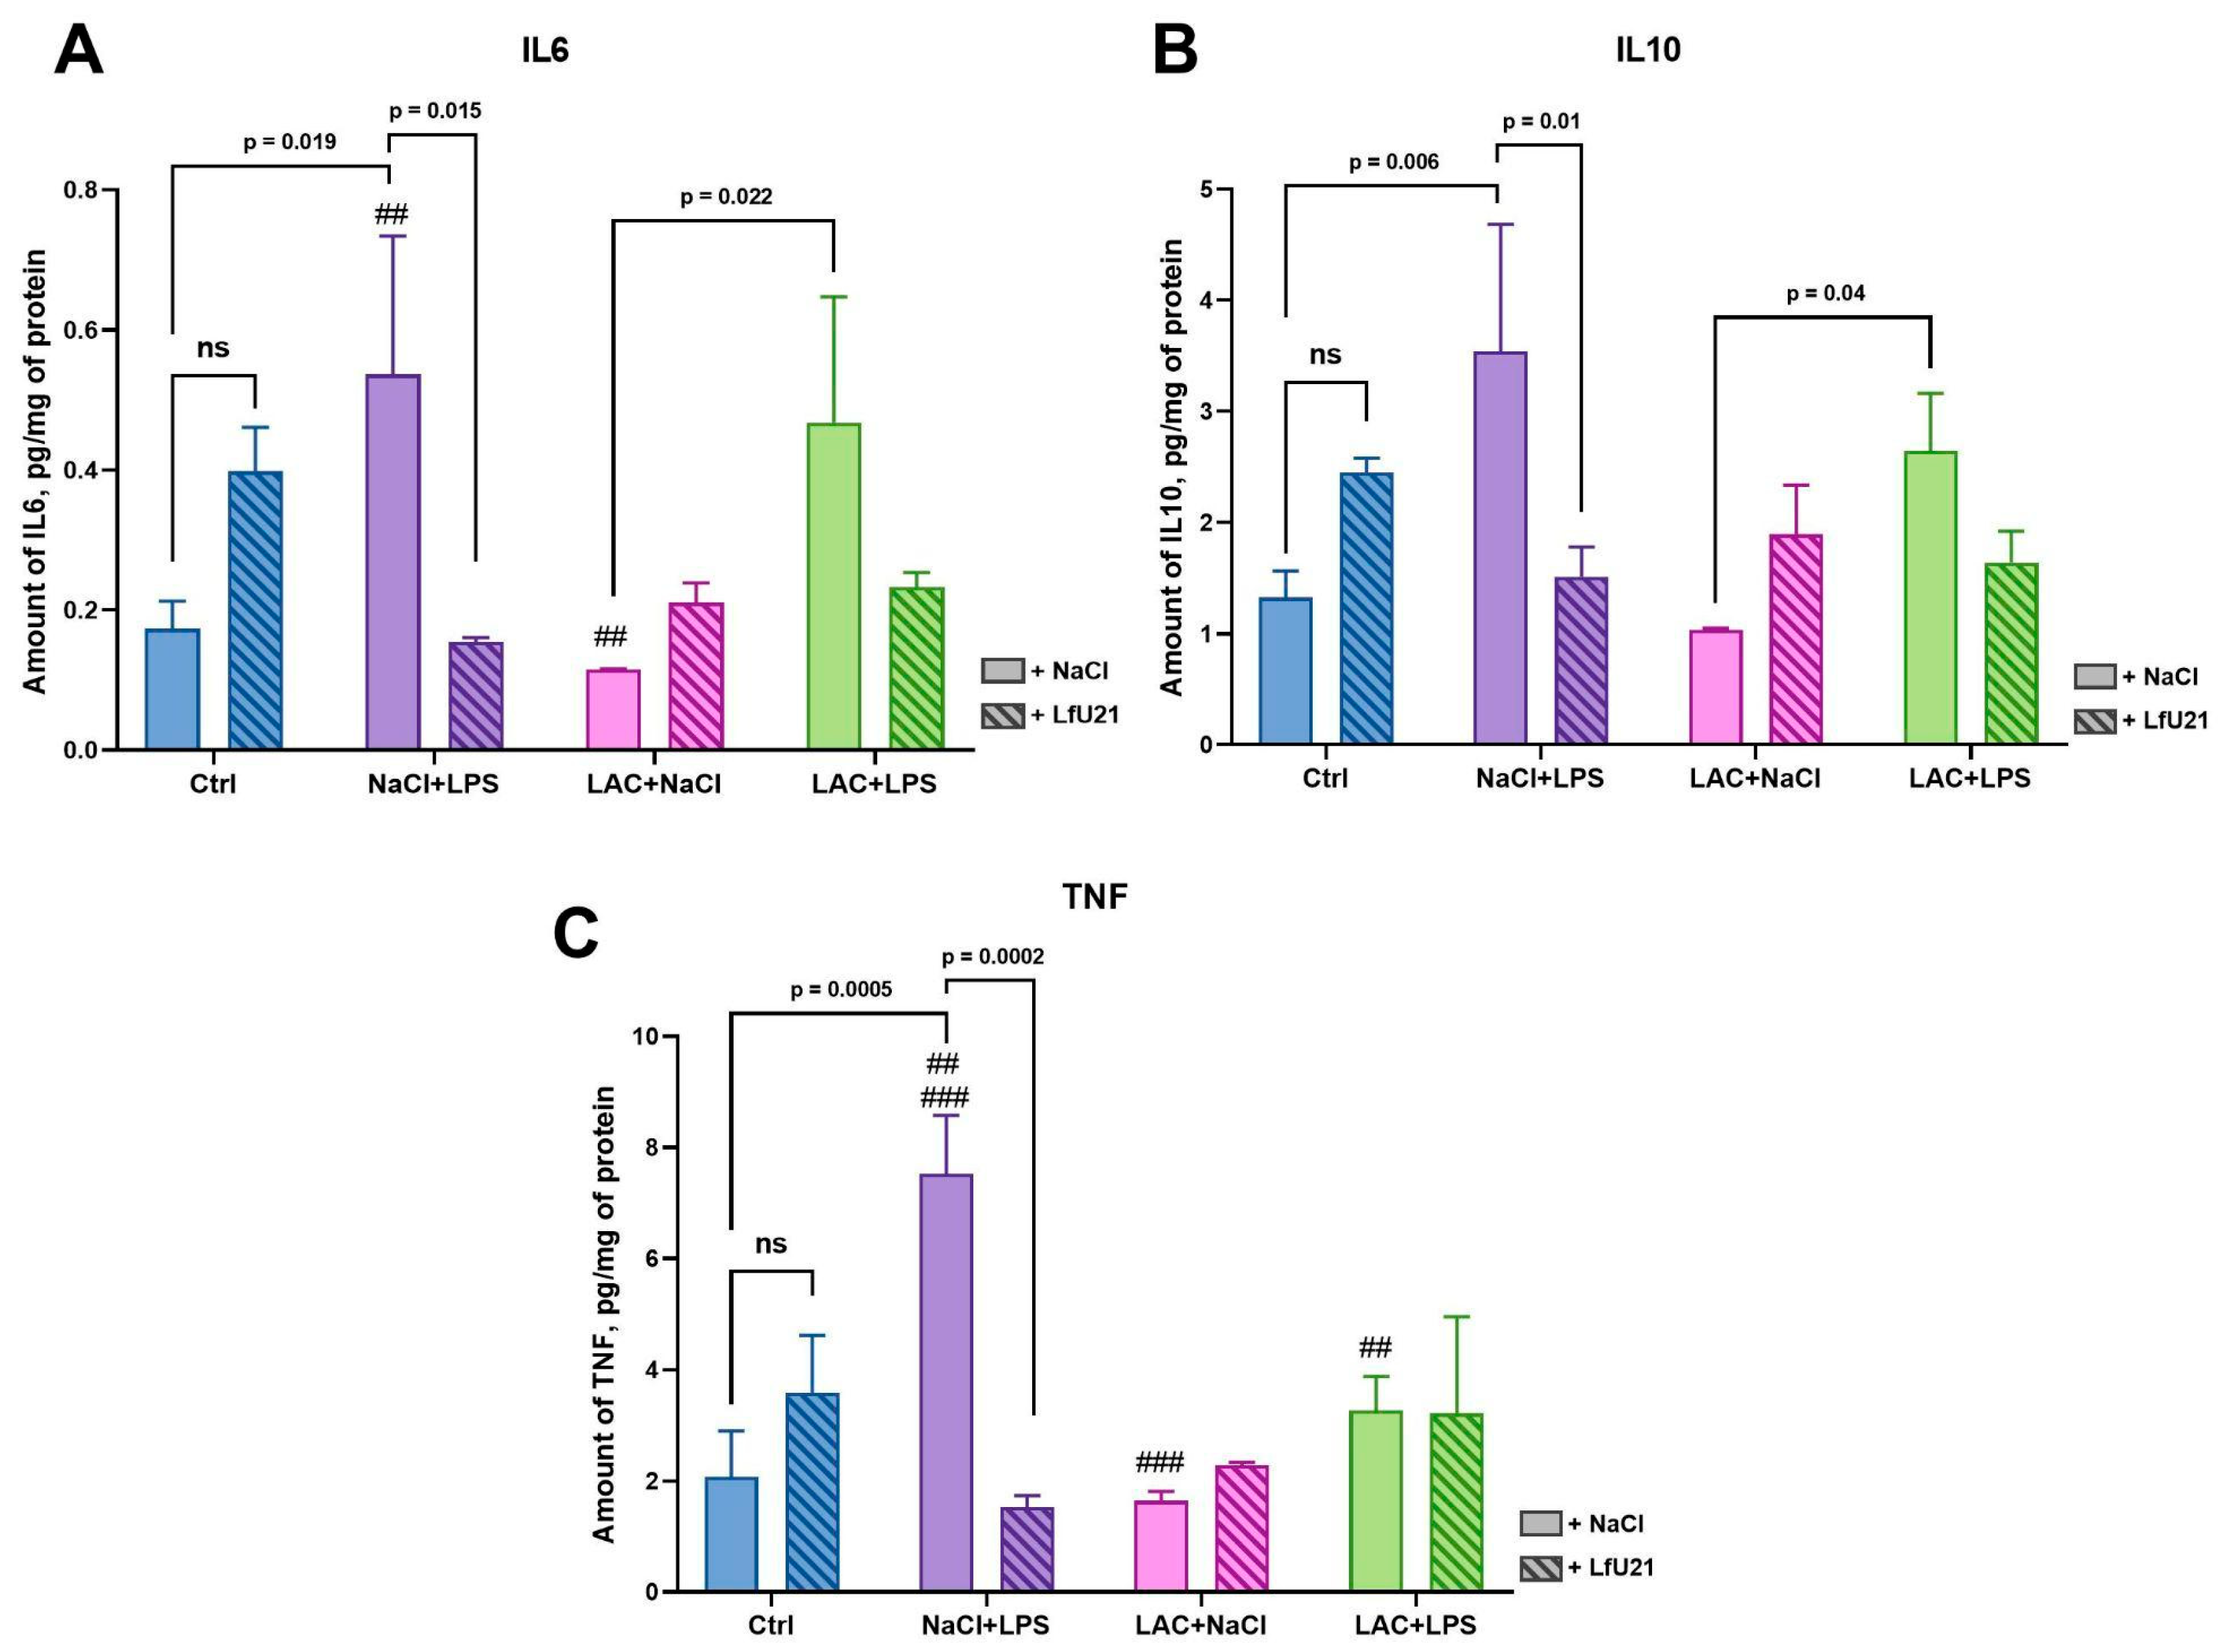
Figure 15.
Effect of LfU21 on the quality of the front limb step in the “Rung ladder” test against the background of both separate administration of LAC or LPS and their combination. Significant differences are indicated in the graphs. Three-way ANOVA was used for statistical analysis. Data are presented as mean ± SEM.
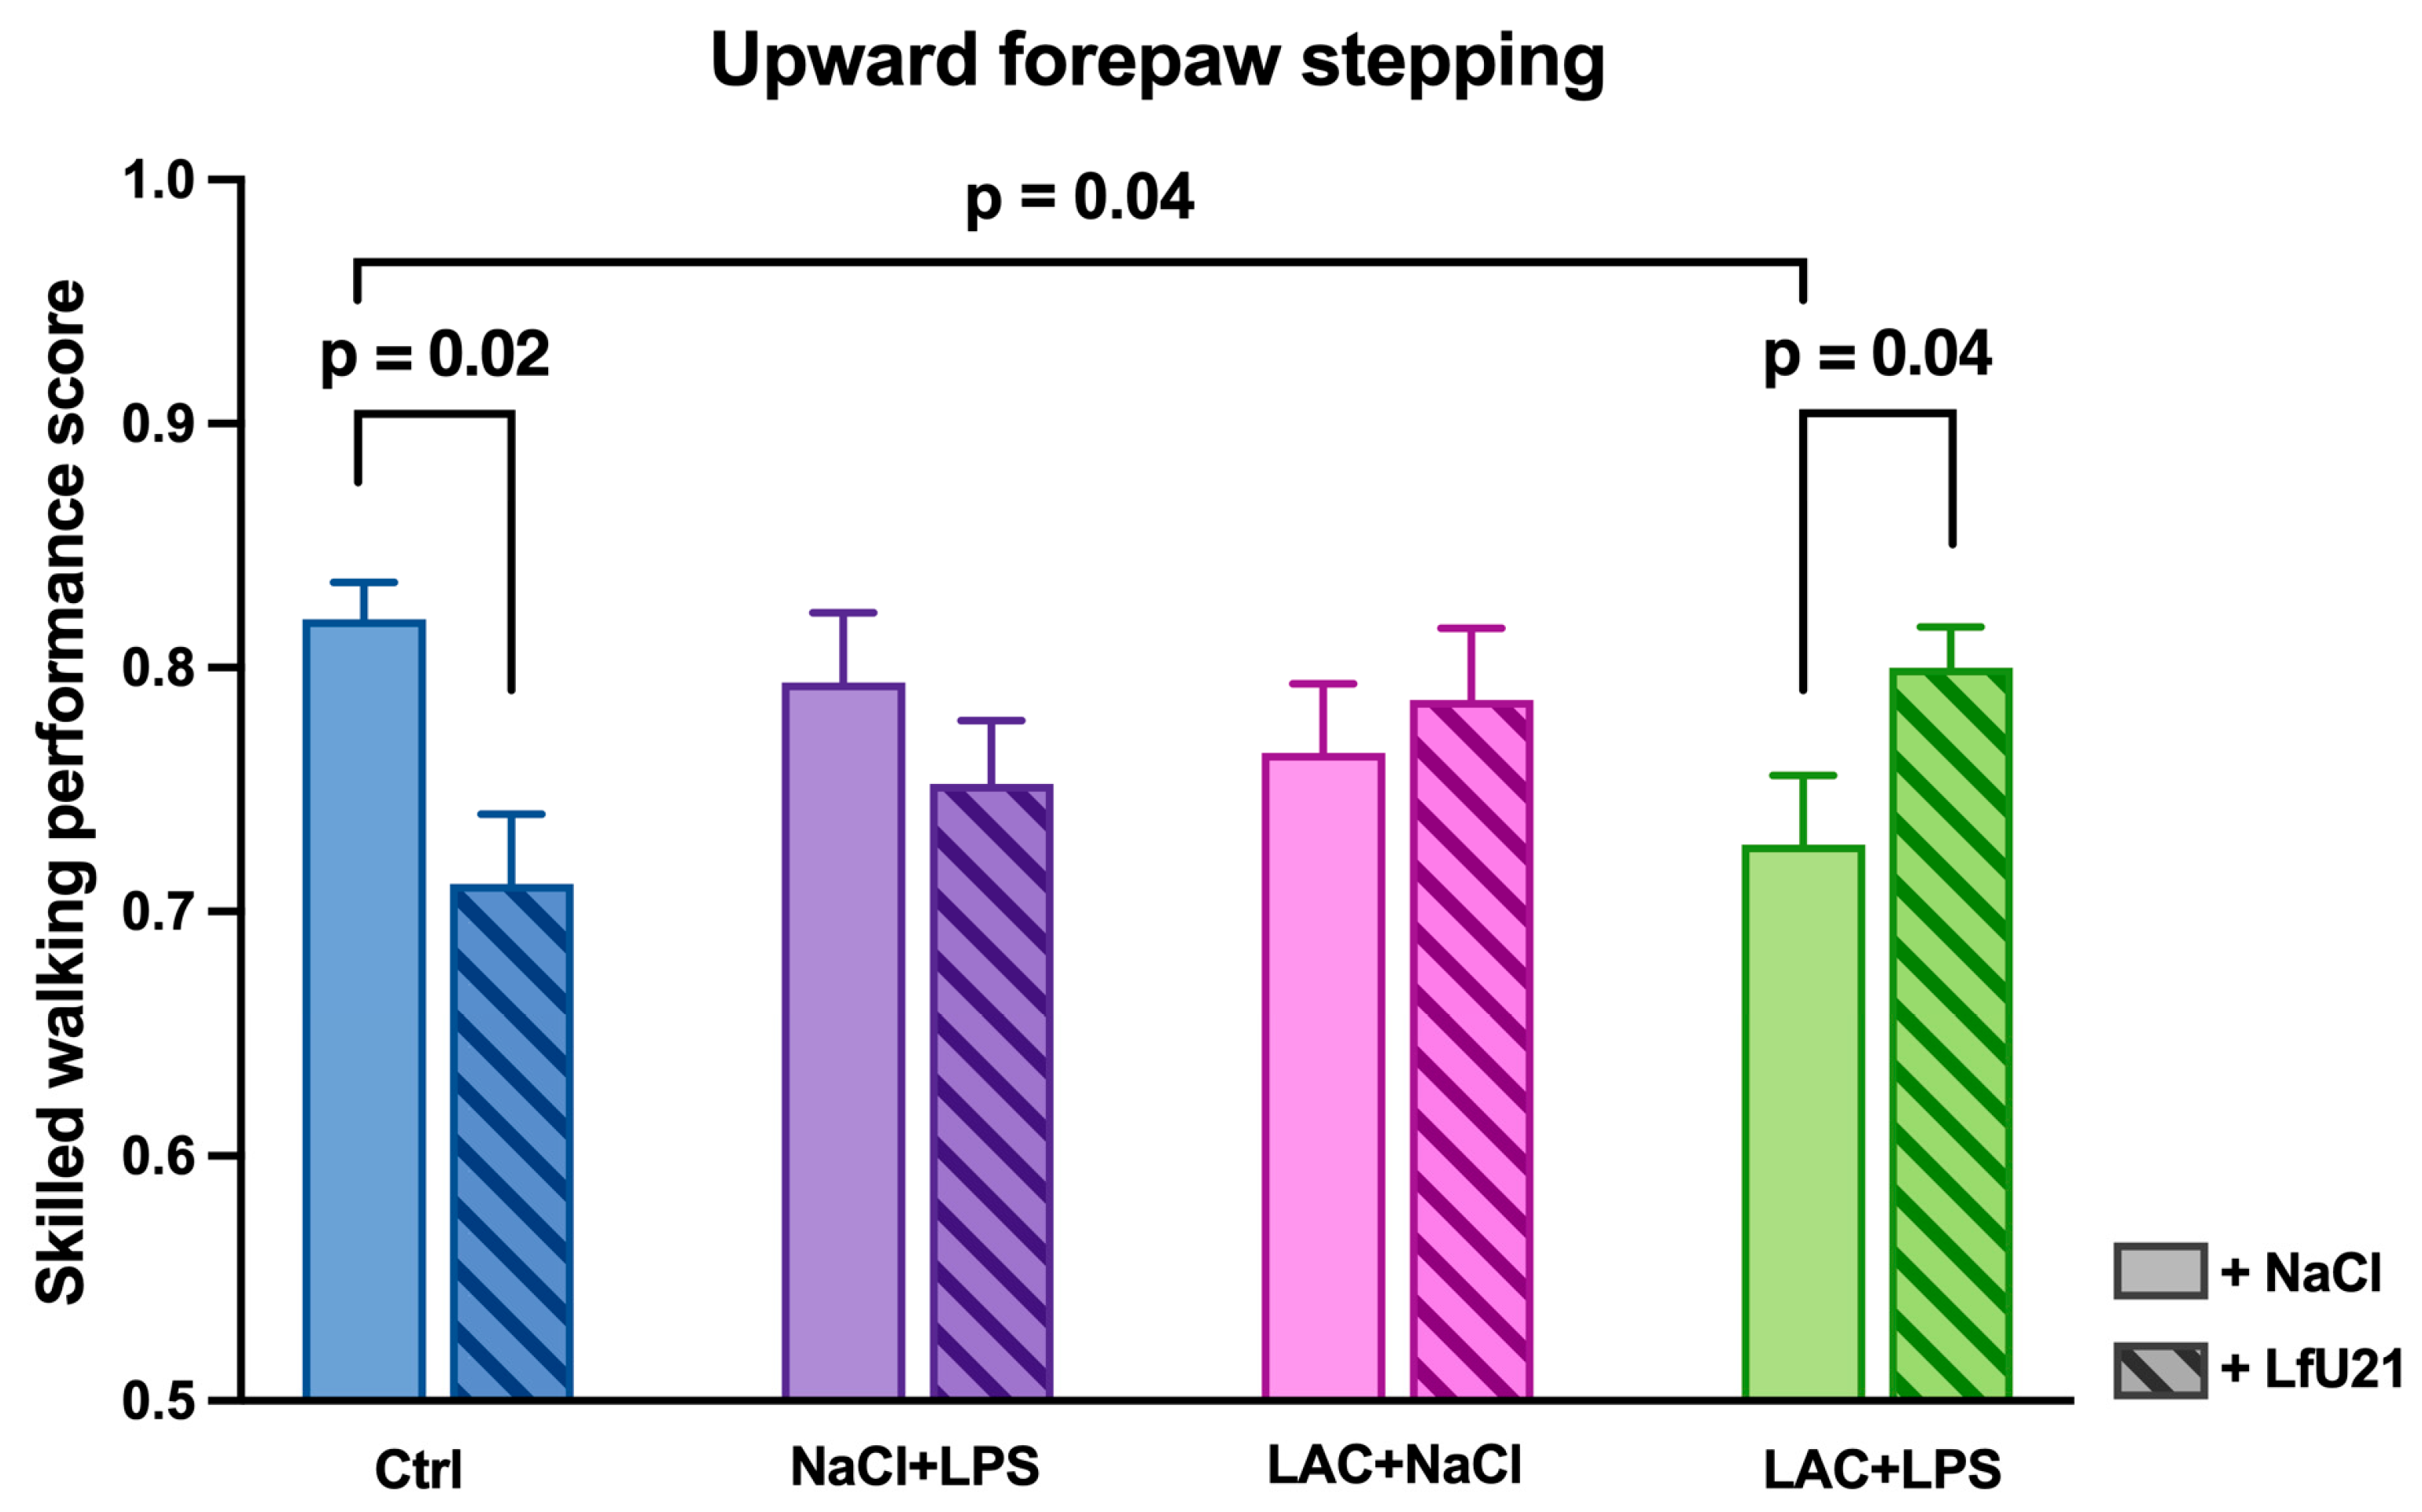
Figure 16.
The effect of LfU21 on the quality of step performance with the left (A) and right (B) limbs in the “Rung ladder” test against the background of both separate administration of LAC or LPS and their combination. Significant differences are indicated in the graphs. Three-way ANOVA was used for statistical analysis. Data are presented as mean ± SEM.
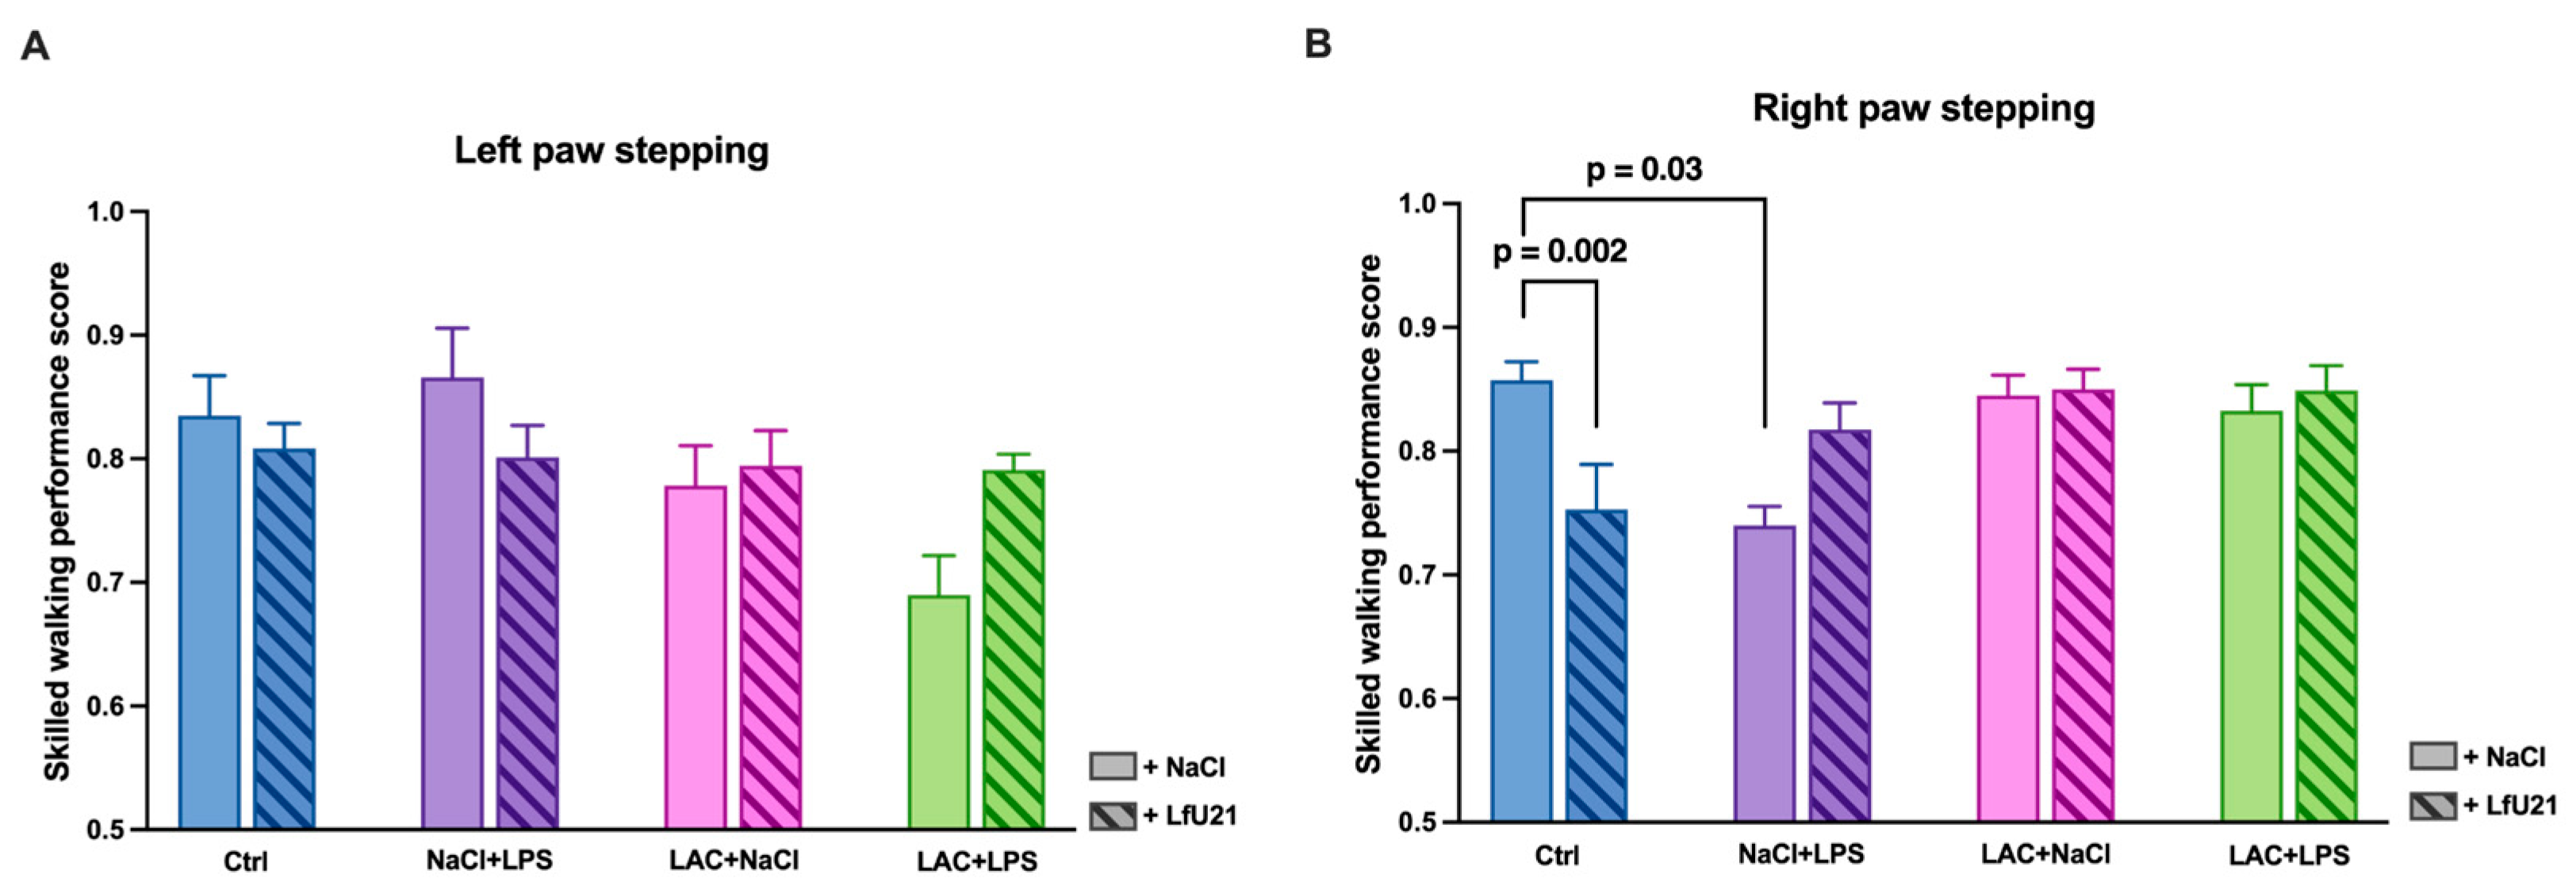
Figure 17.
The effect of LfU21 on the neuroticism score (B) and total testing time (A) in the “Rung ladder” test against the background of both separate administration of LAC or LPS and their combination. Significant differences are indicated in the graphs. Three-way ANOVA was used for statistical analysis. Data are presented as mean ± SEM.
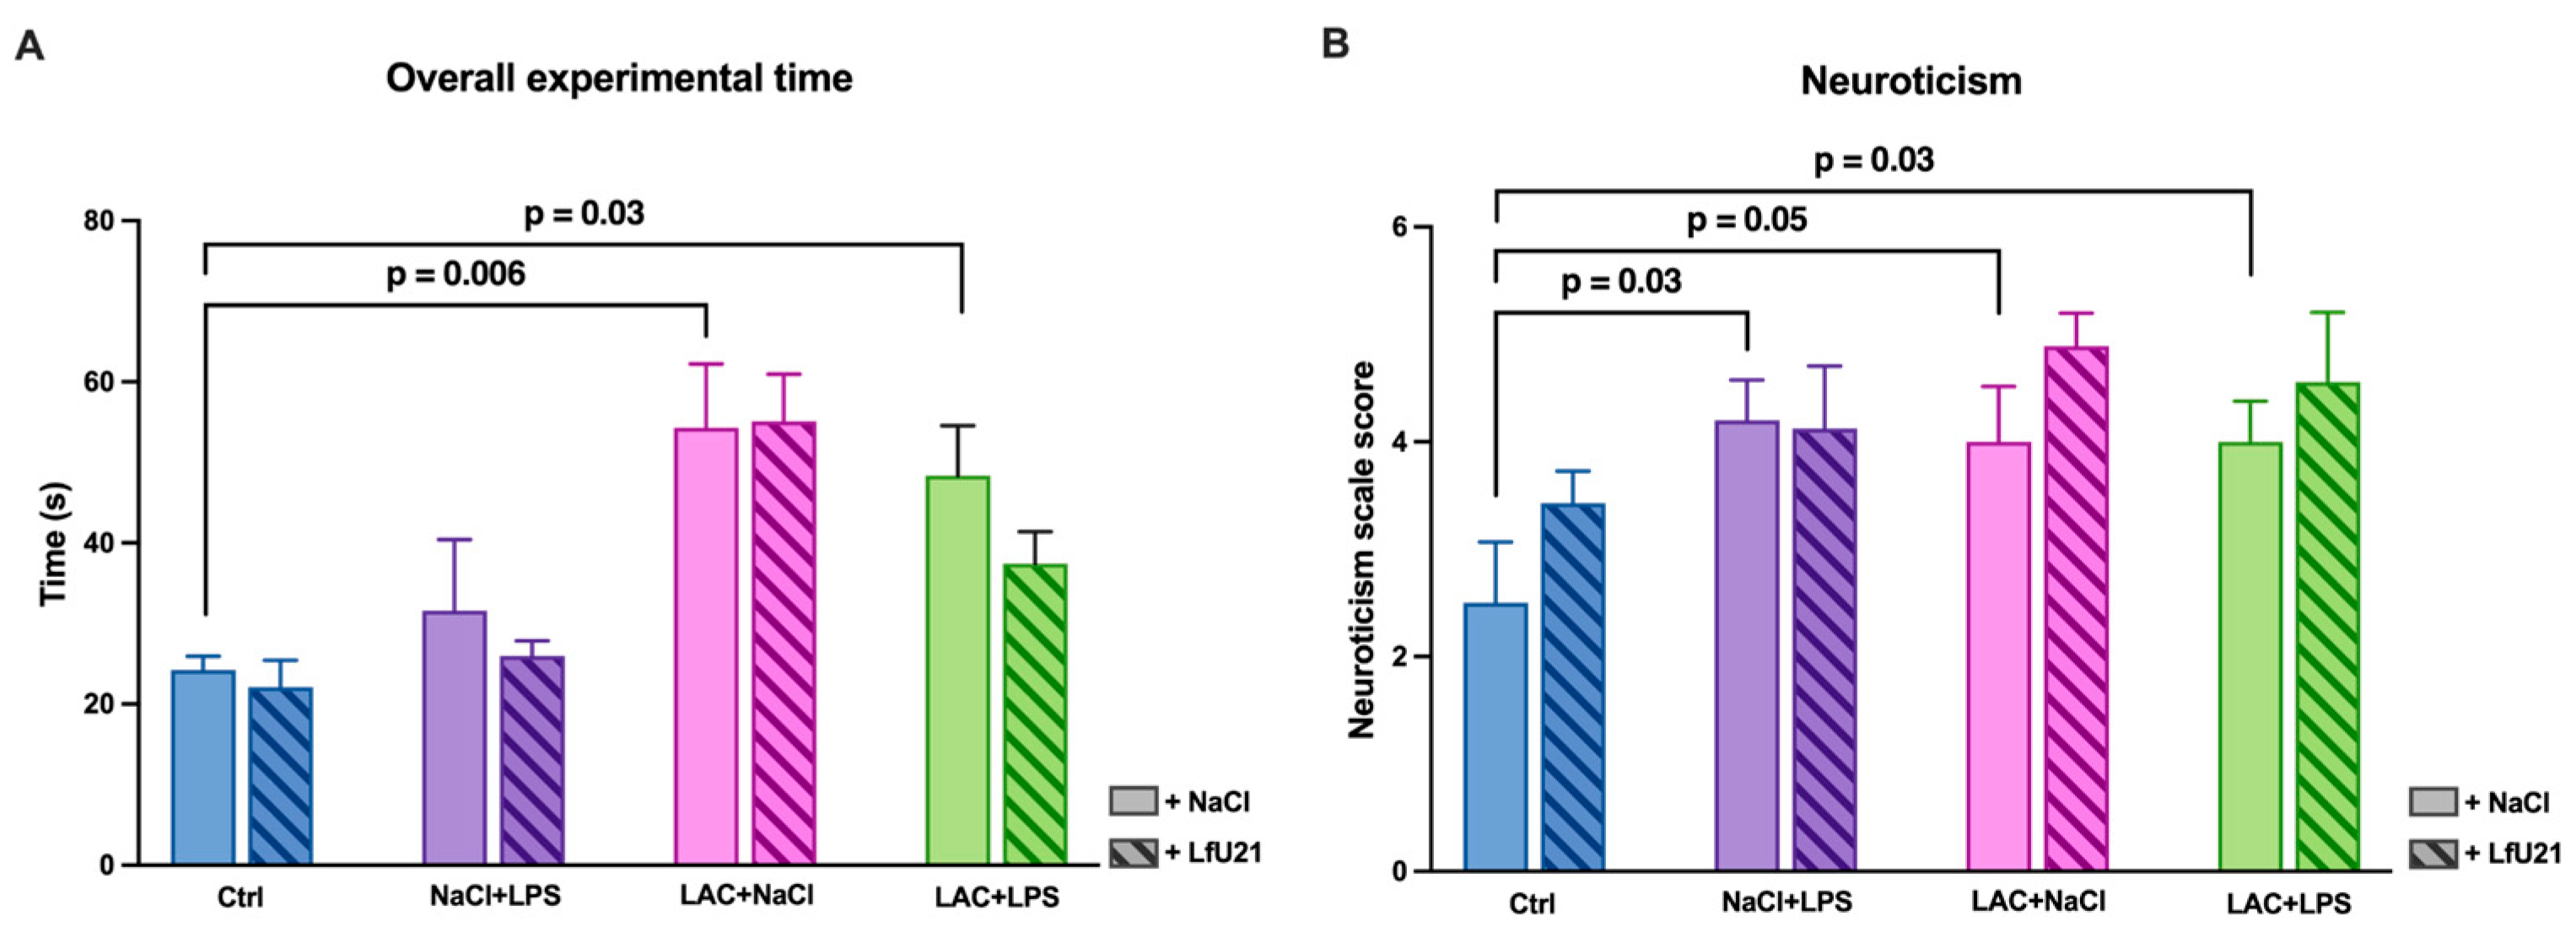
Figure 18.
The effect of LfU21 on vertical motor activity in the Open Field test against the background of both separate administration of LAC or LPS and their combination. Three-way ANOVA was used for statistical analysis. Significant differences are indicated on the graphs (* - p<0.05 compared to Ctrl, # - p < 0.05 compared to the corresponding groups without strain administration). Data are presented as mean + SEM.
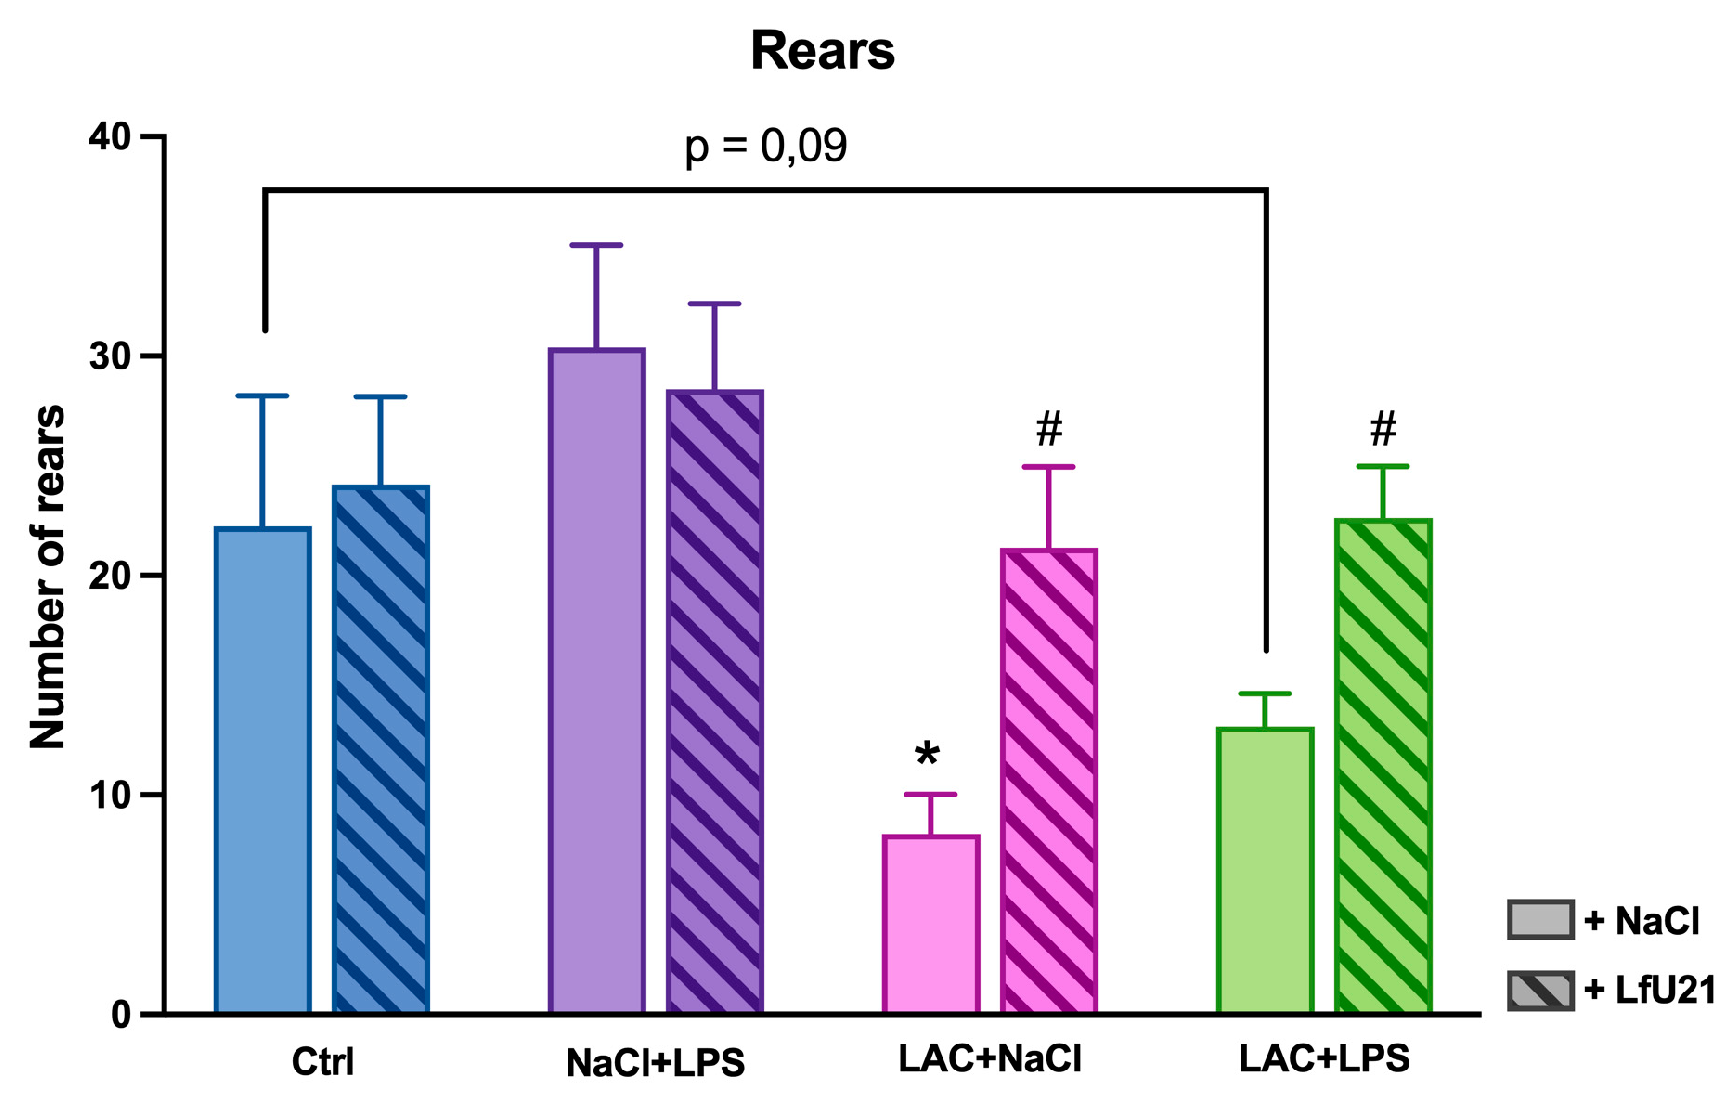
Figure 19.
The effect of LfU21 on horizontal motor activity (A) and the number of grooming acts (B) in the Open Field test against the background of both separate administration of LAC or LPS and their combination. Three-way ANOVA was used for statistical analysis. Significant differences are indicated on the graphs (* - p<0.05 compared to Ctrl, # - p < 0.05 compared to the corresponding groups without strain administration). Data are presented as mean + SEM.
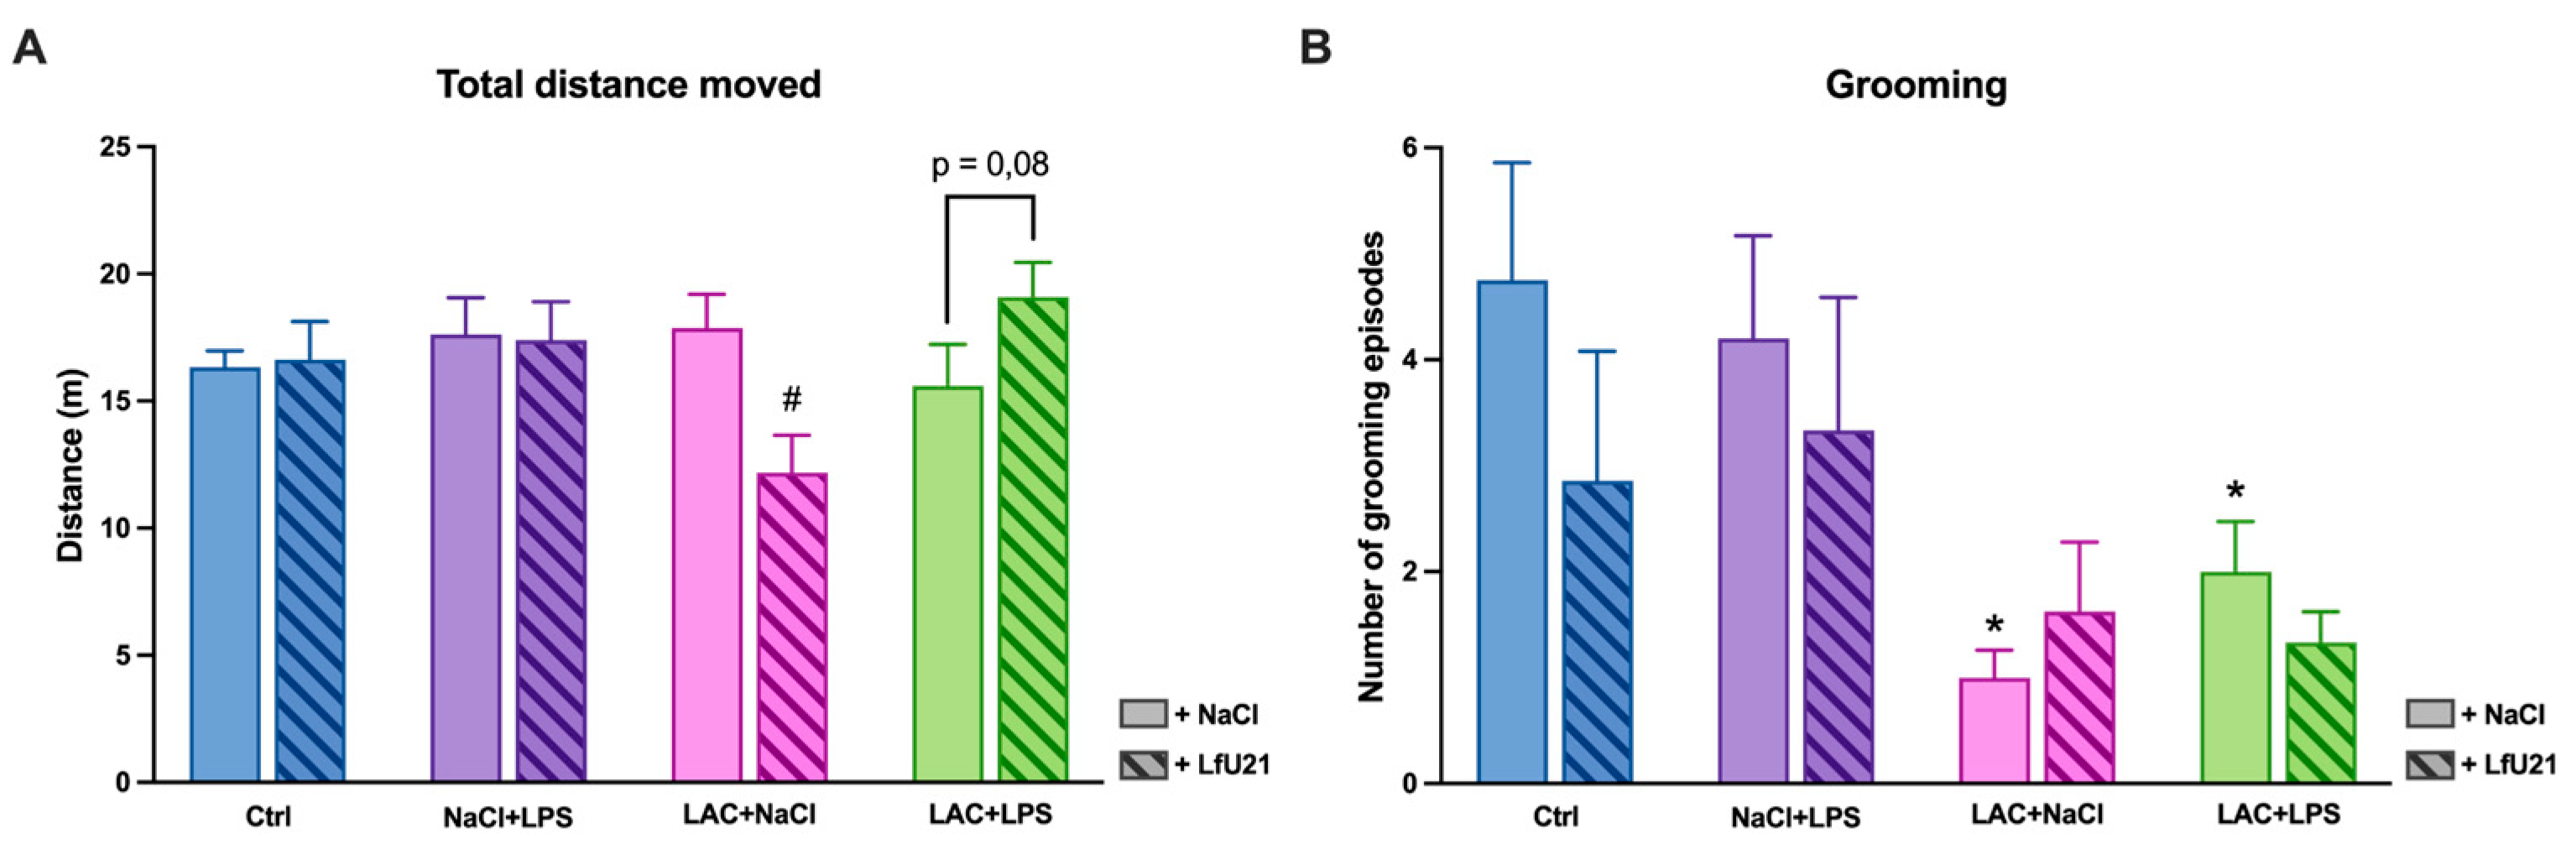
Figure 20.
General diagram of measured biomarkers.
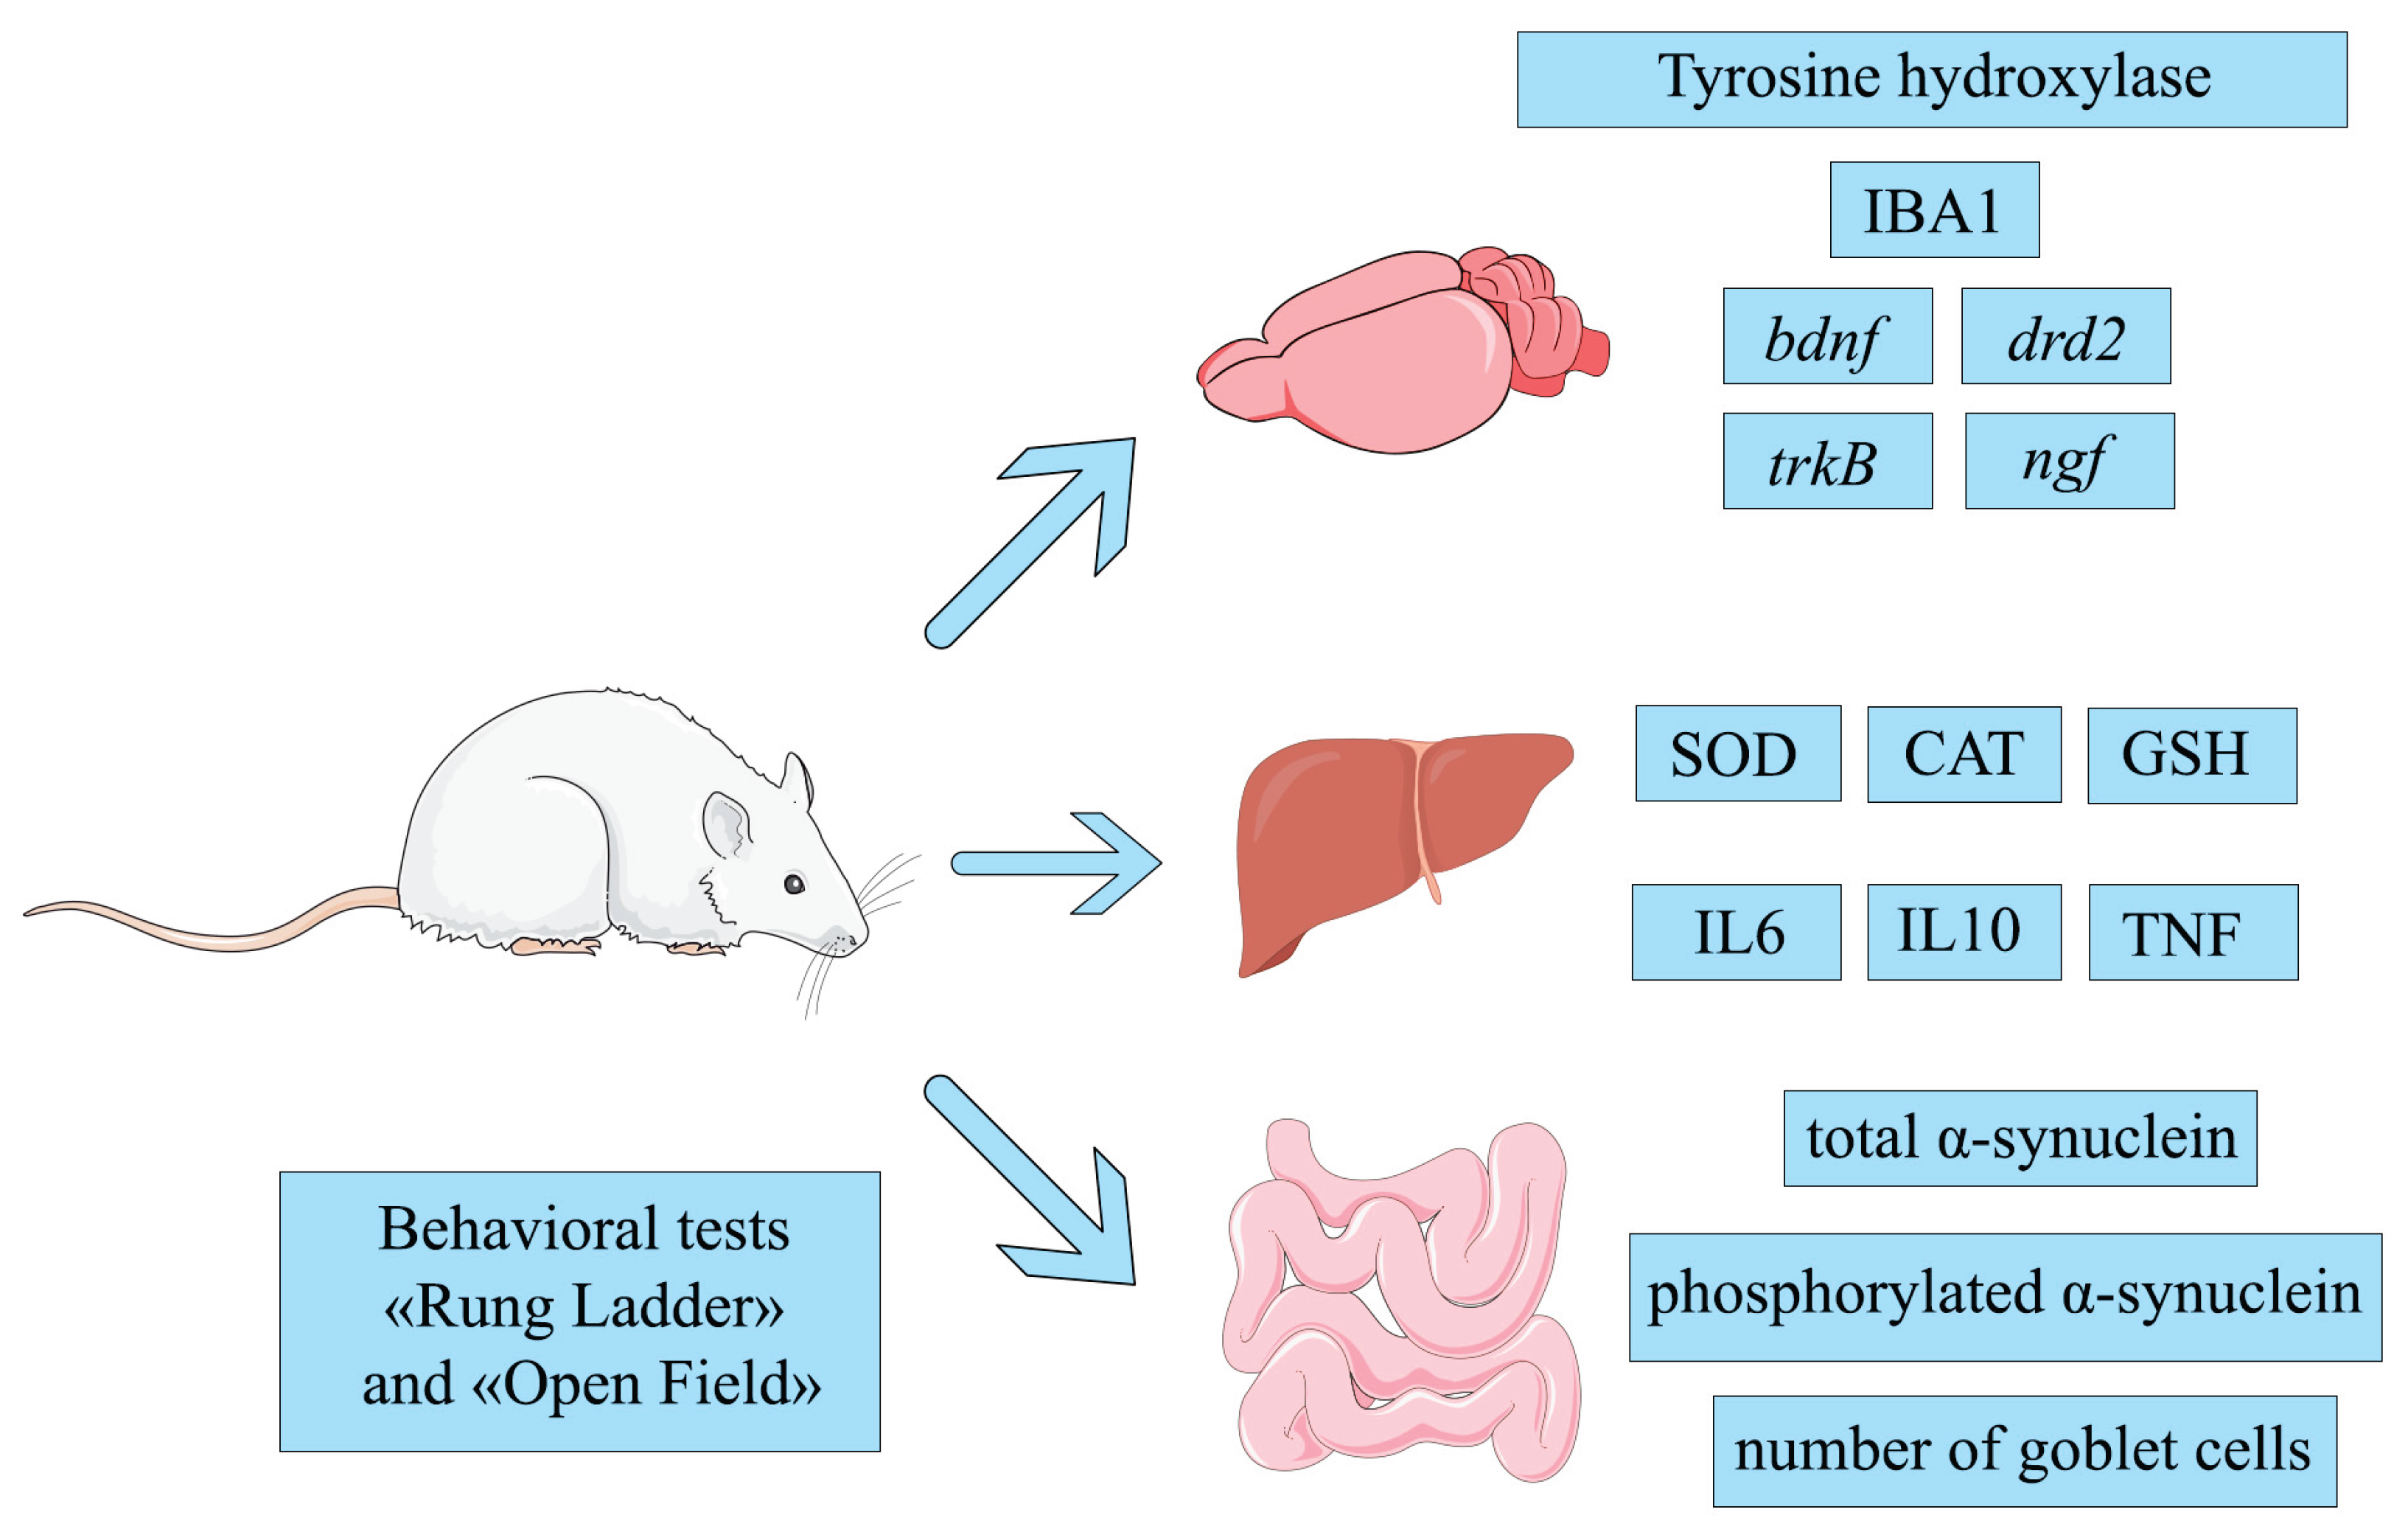
Table 1.
Effect of exposure to two factors—LPS and lactacystin (LAC)—with clarification of the effect of each toxin separately on the studied biomarkers in rats. Arrows indicate a decrease/increase in indicators relative to the control group. r - right hemisphere, l - left hemisphere.
Table 1.
Effect of exposure to two factors—LPS and lactacystin (LAC)—with clarification of the effect of each toxin separately on the studied biomarkers in rats. Arrows indicate a decrease/increase in indicators relative to the control group. r - right hemisphere, l - left hemisphere.
| Experimental group | Without L. fermentum U-21 | L. fermentum U-21 | Indicators normalized by L. fermentum U-21 |
| Ctrl |
bdnf(l)↑, bdnf(r)↓, total α-synuclein↓, GSH↑, upward forepaw stepping↓ in the “Rung Ladder” test, quality of stepping with right limbs in the “Rung Ladder” test↓ |
||
| NaCl+LPS |
drd2(r)↑, bdnf(l)↓, bdnf(r)↓, total α-synuclein↑, phosphorylated α-synuclein↑, number of goblet cells↑, SOD↑, CAT↑, GSH↓, IL6↑, IL10↑, TNF↑, quality of right limb stepping in the “Rung Ladder” test↓, level of neuroticism in the “Rung Ladder” test↑ |
bdnf(r)↓, total α-synuclein↑, phosphorylated α-synuclein↑, |
drd2(r), bdnf(l), number of goblet cells, SOD, CAT, GSH, IL6, IL10, TNF |
| LAC+NaCl | Tyrosine hydroxylase (r)↓, IBA1↑, bdnf(r)↓, total α-synuclein↑, phosphorylated α-synuclein↑, number of goblet cells↑, SOD↓, testing time in the “Rung Ladder” test↑, neuroticism level in the “Rung Ladder” test↑, vertical motor activity in the “Open Field” test↓, number of grooming acts in the “Open Field” test↓ |
Tyrosine hydroxylase (r)↓, IBA1↑, bdnf(r)↓, phosphorylated α-synuclein↑ | total α-synuclein, SOD, vertical motor activity in the “Open Field” test |
| LAC+LPS | Tyrosine hydroxylase (r)↓, IBA1↑, bdnf(r)↓, total α-synuclein↑, phosphorylated α-synuclein↑, number of goblet cells↑, SOD↑, CAT↑, GSH↓, upward forepaw stepping↓ in the “Rung Ladder” test, testing time in the “Rung Ladder” test↑, neuroticism level in the “Rung ladder” test↑, number of grooming acts in the “Open field” test↓ |
Tyrosine hydroxylase (r)↓, IBA1↑, bdnf(r)↓, phosphorylated α-synuclein↑, SOD↓ | total α-synuclein, GSH, upward forepaw stepping in the “Rung Ladder” test |
Disclaimer/Publisher’s Note: The statements, opinions and data contained in all publications are solely those of the individual author(s) and contributor(s) and not of MDPI and/or the editor(s). MDPI and/or the editor(s) disclaim responsibility for any injury to people or property resulting from any ideas, methods, instructions or products referred to in the content. |
© 2025 by the authors. Licensee MDPI, Basel, Switzerland. This article is an open access article distributed under the terms and conditions of the Creative Commons Attribution (CC BY) license (http://creativecommons.org/licenses/by/4.0/).
Copyright: This open access article is published under a Creative Commons CC BY 4.0 license, which permit the free download, distribution, and reuse, provided that the author and preprint are cited in any reuse.


