Preprint
Article

This version is not peer-reviewed.

Destination Personality, Experience, and Loyalty: Insight into Perceived Destination Resilience in Osaka Kansai, Case of Korean travelers in Osaka Expo 2025

Submitted:

25 November 2025

Posted:

28 November 2025

You are already at the latest version

Abstract

This study examines how destination personality, visitor experience, and destination loyalty jointly contribute to tourism resilience in Osaka-Kansai, particularly in the context of Expo 2025. A key aim is to develop a sustainability perspective lens for understanding destination loyalty and perceived destination resilience. Using Korean travelers as the empirical focus given that Osaka-Kansai is one of their most favored destinations the research investigates whether the region can sustain tourism after the mega-event concludes. The study's significance is heightened by examining traveler’s perceived destination resilience under conditions of change and adversity in the Osaka-Kansai area, including post-pandemic recovery, economic fluctuations, and the transition from mega-event excitement to sustained visitor interest. The structural model tests how destination personality shapes visitor experience, which influences destination loyalty, ultimately determining the area's capacity for post-Expo resilience. This empirical research with Korean travelers provides a sustainability-oriented framework for analyzing these interrelationships, offering critical insights for destinations navigating uncertainty and transformation, with both theoretical and practical implications for destination management.

Keywords: 
;  ;  ;  ;  ;  ;  

1. Introduction

The Osaka Convention & Tourism Bureau reported that foreign inbound visitors to Osaka reached approximately 8.5 million as of June 2025 which is 23% increase compared to the same period in 2024. Notably, 60% of these arrivals originated from East Asia. However, year-on-year growth remained steady between January and March, it slowed considerably to just 8% by June (Nikkei, July 2025). This deceleration was particularly pronounced in key markets such as South Korea, Taiwan, and Hong Kong, driven by declining visitor satisfaction and heightened anxieties surrounding natural disasters (ABC News, July 2025; Nikkei, July 2025).
With these challenges, the upcoming Osaka Expo 2025 has emerged as a powerful catalyst for reviving global tourism interest and attracting foreign investment. However, despite this momentum, Osaka’s travel infrastructure is under considerable strain, and overtourism pressures have intensified (Japan Today, August 2025). These developments risk degrading tourists’ experiences and eroding destination loyalty.
While destination resilience has garnered increasing academic and policy attention, limited empirical work has explored resilience from the perspective of loyal travelers. Specifically, little is known about how destination personality sustains destination experience and loyalty under conditions of overtourism and adversity. This gap is especially salient in the context of mega-events, which often amplify both opportunities and vulnerabilities in destination systems.
Understanding the mechanisms that foster destination loyalty and resilience requires examining how constructs destination personality experience operate in high stakes environment. contexts like Osaka Expo 2025. Prior research demonstrates that favorable destination personality traits positively shape tourist behavior and evaluations (Chen & Phou, 2013; Ekinci & Hosany, 2006; Usakli & Baloglu, 2011; Baloglu, Henthorne, & Sahin, 2014; Zeugner-Roth & Zabkar, 2015), while recent evidence suggests that memorable tourism experiences reciprocally influence perceived destination personality (Tešin et al., 2023).
This study investigates how destination personality, visitor experience, and destination loyalty interact to enhance perceived tourism resilience in Osaka through the lens of Korean travelers as one of Osaka's largest and most significant inbound markets. By examining Korean tourists' perspectives, this research explores how destination personality shapes destination experience and loyalty, and subsequently how loyalty influences tourists' perceptions of destination resilience. The Korean traveler lens provides critical insights into how emotional attributes and qualifications translate into behavioral and psychological outcomes essential for sustainable tourism competitiveness under conditions of change and adversity.

2. Literature Review

2.1. Destination Personality

The concept of destination personality has gained prominence in tourism research as a valuable lens for understanding tourists' characteristics’ responses. Ekinci and Hosany (2006) first applied brand personality theory to tourism contexts, defining destination personality as "the set of human characteristics associated with a destination" (p. 128) and adapting Aaker's (1997) Brand Personality Scale. They demonstrated that tourists ascribe personality traits to destinations and identified three core dimensions: sincerity, excitement, and conviviality.
Building on self-congruity theory, subsequent research has examined how alignment between a destination's perceived personality and tourists' self-concepts influences behavioral intentions. Studies confirm that the congruence between destination personality and tourists' actual self-concept is crucial for developing loyalty and encouraging repeat visits and recommendations (Usakli & Baloglu, 2011; Kumar & Nayak, 2016).
The measurement of destination personality is predominantly based on Aaker's (1997) Brand Personality Scale (BPS), which identified five dimensions among American consumers: sincerity, excitement, competence, sophistication, and ruggedness. Recognizing that brand perceptions depend on consumers' internalized cultural values and beliefs, Aaker, Martinez, and Garolera (2001) extended this framework cross-culturally. Their research revealed that while some dimensions are universal (sincerity, excitement, competence, and sophistication), others are culturally specific such as peacefulness in Japan and passion in Spain.
Kim and Lehto (2013) applied all five original BPS dimensions to destination personality assessment. Building on this foundation and incorporating cultural specificity, Kim and Stepchenkova (2017) examined Jeju Island—a preferred tourism destination in South Korea—and identified eight salient dimensions: sincerity, excitement, competence, sophistication, ruggedness, peacefulness, uniqueness, and traditionalism. Following this culturally informed approach, the present study adopts this expanded eight-dimension framework to assess destination personality in Osaka-Kansai, integrating both universal and culturally specific dimensions relevant to East Asian tourism contexts.

2.2. Destination Experience

The experience management perspective emphasizes that both the mechanics and humanics of service delivery must be carefully designed, integrated, and managed to ensure emotional connection, loyalty, and satisfaction (Pullman & Gross, 2004; Schmitt, 1999, 2003; Yuan & Wu, 2008). Pullman and Gross (2004) distinguish between these two essential components: mechanics encompass tangible, physical, and environmental design elements that evoke sensory and functional satisfaction, while humanics comprise intangible, behavioral, and interpersonal factors that shape emotion and meaning. When properly aligned, these mechanics and humanics form a holistic destination experience that strengthens emotional connection, loyalty, and satisfaction.
The experiential dimension triggers emotional responses that serve as critical antecedents of destination loyalty. Specific emotions such as joy, love, and positive surprise have been shown to shape destination image and satisfaction, which in turn drive destination loyalty (Kim, 2012; Prayag et al., 2016). Extensive research demonstrates that tourism experiences influence behavioral intentions, including the desire to revisit, share experiences with others, and recommend destinations (Sharma & Nayak, 2019; Sthapit et al., 2019). These destination experiences particularly strengthen revisit intentions (Yu et al., 2019), consolidating and reinforcing pleasurable memories that sustain long-term destination loyalty (Ritchie & Ritchie, 1998).
The understanding of experience has impact for emotional responses to the specific emotions such as joy, love, and positive surprise were shown to be antecedents of destination’s image and satisfaction that drive the destination loyalty (Kim, 2012; Prayag et al., 2016).

2.3. Destination Loyalty

Destination loyalty has become a central construct in tourism studies due to its strategic importance for destination competitiveness and visitor retention. It is commonly defined as a tourist's intention to revisit a destination and to recommend it to others, reflecting both behavioral and attitudinal forms of loyalty. Early conceptualizations highlight that loyalty extends beyond repeat visitation, it also involves an emotional attachment and behavioral commitment to a place (Oppermann, 2000; Yoon & Uysal, 2005). These dual dimensions, behavioral commitment and emotional attachment imply that destination loyalty is shaped by both cognitive evaluations and affective responses, aligning with broader relationship marketing theories that distinguish between transactional and relational forms of consumer engagement.
A substantial body of research has examined the antecedents of destination loyalty. Key predictors include tourist satisfaction, perceived value, perceived service quality, memorable tourism experiences, and destination personality (Chi & Qu, 2008; Kim et al., 2012; Bigné et al., 2001). Satisfaction and perceived value capture tourists' evaluative judgments of their experiences, while constructs such as memorable experiences and destination personality emphasize more affective and symbolic aspects of destination engagement. Together, these antecedents illustrate that destination loyalty is a multifaceted outcome emerging from both utilitarian assessments and deeper emotional connections.
Expanding on these foundational perspectives, Cossio-Silva et al. (2019) introduced a synthetic measurement framework for destination loyalty, proposing composite indices that expectation, perception integrate global image, satisfaction, and intentions for future overnight stays. Their approach reflects a growing trend in tourism research toward more holistic and multidimensional modeling of destination loyalty. By combining perceptual and behavioral indicators, this line of work offers a more comprehensive assessment of how tourists internalize their experiences and translate them into the destination loyalty.

2.4. Perceived Destination Resilience

Recent research on destination loyalty and resilience, catalyzed by COVID-19 disruptions, has interconnected nature of these concepts. Studies from this period consistently position destination loyalty as a critical component of market resilience and long-term stability, particularly for destinations in vulnerable or uncertain environments (Cruz-Milan, 2023; Prayag, 2020). Empirical evidence demonstrates that sustained traveler loyalty during crises significantly enhances a destination's capacity to recover, maintain demand, and ensure economic continuity (Biggs et al., 2012; Hall et al., 2017). While established motivational drivers such as perceived value and satisfaction remain central to loyalty formation (Yoon & Uysal, 2005), recent scholarship highlights the growing importance of perceived destination resilience particularly travelers' emotional and psychological responses to potential threats. This perceptual dimension is critical because travelers respond not to objective risks alone, but to their subjective assessments of how safe, stable, and adaptable a destination appears (Seabra et al., 2020). These assessments are shaped by emotional factors, including anxiety, perceived vulnerability, concerns about natural disasters, and exposure to crisis-related rumors, all of which significantly influence destination evaluations and behavioral intentions.
This perspective is particularly relevant to Osaka and the broader Kansai region, where recurring public discourse and rumors about natural disasters, especially earthquakes and tsunamis may increase visitors' sense of uncertainty. In such contexts, perceived resilience travelers' assessments of how well a destination can withstand, manage, and recover from adverse events becomes a critical predictor of loyalty. As travelers form emotional judgments about safety and crisis preparedness, their perceived resilience assessments can either reinforce or undermine their willingness to revisit or recommend the destination.
These findings suggest that perceived destination resilience provides a more comprehensive framework for understanding traveler behavior in crisis contexts. Unlike traditional loyalty models, it captures both functional evaluations and the affective and psychological dimensions that shape travel decisions, thereby illuminating how visitor perceptions and loyalty contribute to perceived destination resilience.

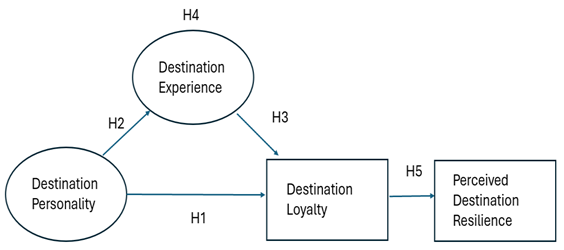
3. Conceptual Framework

Destination personality has emerged as a significant determinant of tourists' evaluations of a destination. Prior research indicates that destination personality shapes tourists' self-congruity and emotional attachment, which in turn fosters stronger destination loyalty (Usakli & Baloglu, 2011; Kumar & Nayak, 2016; Stylos et al., 2017). Complementing this perspective, Ritchie and Ritchie (1998) demonstrate that destinations offering a unique and memorable travel experience create durable emotional bonds and pleasurable memories that encourage sustained engagement and repeat visitation. These theoretical foundations converge to support the expectation that positive perceptions of destination personality enhance tourists' loyalty.

3.1. H1: Destination Personality Positively Affects Destination Loyalty.

Beyond loyalty, destination personality is also known to influence the quality of tourists’ experiential encounters. A well-established, attractive, and distinctive personality contributes to more meaningful, enjoyable, and memorable destination experiences (Ekinci & Hosany, 2006). In line with the view that a strong brand promise promotes memorable encounter formation (Ritchie & Ritchie, 1998), destination personality is expected to positively shape destination experiences.

3.2. H2: Destination Personality Positively Affects Destination Experience.

Kim et al. (2010) demonstrates that memorable experiences influence future behavioral intentions both directly and indirectly, challenging satisfaction as the sole predictor. Similarly, the destination brand experience framework captures the multifaceted ways tourists emotionally, intellectually, and sensorially engage with a place (Jeong et al., 2020). Accordingly, richer and more meaningful destination experiences are likely to enhance tourists’ loyalty.

3.3. H3: Destination Experiences Positively Affect Destination Loyalty.

Destination experiences mediate the relationship between destination personality and loyalty (Ekinci & Hosany, 2006). A positive and appealing personality shapes tourists’ experiential encounters, which in turn strengthen loyalty. Considering Ritchie and Ritchie’s (1998) conceptualization of destinations as experience-driven entities, this mediation effect is theoretically grounded.

3.4. H4: Destination Experiences Mediate the Relationship Between Destination Personality and Destination Loyalty.

The sustained traveler’s loyalty for destination enhances its capacity to recover, maintain demand, and ensure economic continuity (Biggs et al., 2012; Hall et al., 2017). While established motivational drivers such as perceived value and satisfaction remain central to loyalty formation (Yoon & Uysal, 2005), recent scholars highlight the growing importance of perceived destination resilience, how travelers' emotional and psychological responses to potential threats shape their loyalty decisions and recovery of destination demand.

3.5. H5: Destination Loyalty Positively Affects Perceived Destination Resilience.

H1: Destination Personality positively affects Destination Loyalty.
H2: Destination Personality positively affects Destination Experience.
H3: Destination Experiences positively affect Destination Loyalty.
H4: Destination Experiences mediate the relationship between Destination Personalities and Destination Loyalty.
H5: Destination Loyalty affects positively Perceived Destination Resilience.
Preprints 186651 i001

4. Research Method

4.1. Data Collection

An empirical evaluation of the developed instrument was conducted using data from Korean travelers who had previously visited Osaka in the Kansai region. Data collection took place in October 2025, coinciding with the conclusion of Expo 2025 Osaka. Participants responded to all 38 items using a 7-point Likert-type scale (1 = strongly disagree to 7 = strongly agree). A total of 202 survey responses were collected. Following data screening, four responses were excluded due to incomplete data, resulting in a final sample of 198 usable responses for analysis.

4.2. Descriptive Statistics

A total of 198 valid responses were obtained from Korean nationals. The demographic and travel characteristics of the participants are summarized below.
Gender: The sample comprised 93 males (47.0%) and 105 females (53.0%), indicating a slightly higher proportion of female respondents.
Age distribution” The largest age cohorts were those aged 45–54 years (29.8%) and 35–44 years (21.7%), followed by respondents aged 25–34 years (15.7%), 65 years or older (14.1%), 55–64 years (12.6%), and 18–24 years (6.1%). These findings suggest that the majority of respondents belonged to middle-aged and older adult demographic segments.
Osaka visitation experiences All participants reported having previously visited Osaka and the Kansai region. Regarding travel frequency within the past year, 49.0% had visited once, 24.7% had visited two to three times, and 4.5% had visited four or more times, while 21.7% had not visited during this period. The modal length of stay was 2–3 nights (57.0%), followed by 4–5 nights (33.0%), one night or less (approximately 3.0%), and six nights or longer (6.0%).
Purpose of visit The majority of respondents visited Osaka for leisure and tourism purposes (approximately 69.0%), followed by business travel (11.0%), visiting friends or relatives (7.6%), and planned visits related to the Osaka Expo 2025 (5.0%). A small proportion of respondents indicated other purposes, including education, fieldwork, or organized group tours.
Annual household income The income distribution revealed that respondents earning 100 million KRW or more (22.0%) constituted the largest group, followed by those earning 40–59.9 million KRW (18.0%), 20–39.9 million KRW (18.0%), 60–79.9 million KRW (15.0%), 80–99.9 million KRW (14.0%), and less than 20 million KRW (13.0%). These data indicate a relatively high proportion of middle- to upper-income participants.
Measurement items. All items were measured using a seven-point Likert scale (1 = strongly disagree; 7 = strongly agree).

4.3. Preliminary Data Analysis

A total of 198 valid responses were obtained from Korean nationals. The demographic and travel characteristics

4.1. Data Collection

Prior to conducting the factor analyses, the adequacy of the data for factor extraction was evaluated. The Kaiser–Meyer–Olkin (KMO) measure of sampling adequacy was .935, which exceeds the recommended threshold of .90 and indicates excellent suitability for factor analysis (Kaiser, 1974). In addition, Bartlett’s test of sphericity was significant (χ² = 3583.461, df = 231, p < .001), confirming that the correlation matrix was identified the matrix and that the data were appropriate for factor extraction. The preliminary analysis of the data, based on factor loading for each variable, different indicators observed that make up each of the construct of the model, the unrelated variables eliminated for constructs of variables (q12,13,17,20,21,22,25,39). The final selection of variables listed at table 2 with the factor loading results.
Internal consistency reliability was examined using Cronbach’s alpha for each construct. All four scales displayed acceptable to excellent levels of reliability. Destination Personality exhibited good internal consistency (α = .83), and Destination Experience demonstrated similarly strong reliability (α = .84). Destination Loyalty showed excellent reliability, with a notably high coefficient (α = .95), and Destination Resilience also demonstrated excellent internal consistency (α = .90). Collectively, these results confirm that the measurement scales used in this study are internally consistent and suitable for subsequent confirmatory factor analysis and structural modeling.

5. Results

5.1. Measurement Model Validation

The CFA results (Table 2) provide empirical support for the measurement model. All constructs demonstrated acceptable reliability and good convergent validity, while discriminant validity was adequately established. Despite some fit indices falling slightly below conventional thresholds, the four-factor structure is theoretically sound and statistically adequate for testing the hypothesized structural relationships.
Table 2. Results of the Measurement Model (N = 198).
Indicator Standardized loading z-value
q9. Osaka and the Kansai region are generally sincere and honest. 0.7609 21.54
q10. Osaka and the Kansai region are safe and trustworthy. 0.7997 25.29
q11. Osaka and the Kansai region are peaceful and relaxing. 0.8281 28.63
q14. Osaka and the Kansai region are adventurous and bold. 0.4528 7.32
q15. Osaka and the Kansai region preserve tradition. 0.6295 13.24
q16. Osaka and the Kansai region offer unique experiences that cannot be found elsewhere. 0.6252 12.7
Destination Personality (DP) (Cronbach’s α = 0.83).
Indicator Standardized loading z-value
q18. I feel an emotional attachment to Osaka and the Kansai region. 0.8161 25.1
q19. I feel that Osaka and the Kansai region are like my second hometown. 0.7206 17.37
q23. My trip to Osaka and the Kansai region sparked my curiosity about Japanese culture. 0.8134 25.45
q24. I actively participated in tourism activities in Osaka and the Kansai region. 0.6727 14.97
Destination Experience (DE) (Cronbach’s α = 0.84).
Indicator Standardized loading z-value
q26. My trip to Osaka and the Kansai region met my overall expectations. 0.8843 51.67
q27. I was satisfied with the overall service quality in Osaka and the Kansai region. 0.8039 30.22
q28. My overall impression and image of Osaka and the Kansai region are positive. 0.9115 66.04
q29. I am satisfied with my overall travel experience in Osaka and the Kansai region. 0.921 73.02
q30. I would recommend Osaka and the Kansai region to others planning a trip. 0.8913 54.58
q31. I will revisit Osaka and the Kansai region. 0.8479 39.17
q32. I prefer to travel in Osaka and the Kansai region with at least one overnight stay. 0.8143 32.03
Destination Loyalty (DL) (Cronbach’s α = 0.95).
Indicator Standardized loading z-value
q33. Osaka and the Kansai region can recover quickly after crises. 0.8228 29.87
q34. Osaka and the Kansai region have well-established safety and disaster response systems. 0.8463 33.47
q35. Local merchants and residents in Osaka and the Kansai region adapt well to changes. 0.8356 32.2
q36. I feel safe visiting Osaka and the Kansai region even during uncertain times. 0.7487 20.61
q37. Osaka and the Kansai region remain attractive travel destinations during difficult times. 0.7835 23.91
Perceived Destination Resilience (DR) (Cronbach’s α = 0.9).
Model Fit Indices
Fit Index Value
Chi-square (χ²) 626.47
Degrees of freedom (df) 205
χ²/df 3.06
Comparative Fit Index (CFI) 0.9
Normed Fit Index (NFI) 0.88
Incremental Fit Index (IFI) 0.91
RMSEA 0.102
Note. Items q12, q13, q17, q20, q21, q22, q25, and q38 were deleted due to low reliability and weak factor loadings. All standardized factor loadings are significant at p < .001. Fit indices represent an acceptable measurement model. Extraction method: Maximum Likelihood with missing values (MLMV).
The measurement model was evaluated using data collected from visitors to Osaka (N = 198). The dataset included respondents’ assessments of four latent constructs: Destination Personality (DP), Destination Experience (DE), Destination Loyalty (DL), and Destination Resilience (DR). Each construct was operationalized as a composite of its corresponding Likert-type items, consistent with prior research on destination personality and tourist behavioral outcomes (Ekinci & Hosany, 2006; Stylos et al., 2017).
The overall fit of the four-factor measurement model was evaluated using multiple goodness-of-fit indices. The chi-square test was significant, χ²(203) = 580.52, p < .001; however, this statistic is sensitive to sample size and model complexity, limiting its interpretability (Bentler & Bonett, 1980). The SRMR value (.063) indicated good fit, falling well below the recommended threshold of .08 (Hu & Bentler, 1999). The RMSEA was .097 (90% CI [.088, .106]), approaching the acceptable cutoff of .10 but exceeding the preferred threshold of .08. The CFI (.893) and TLI (.878) were slightly below the conventional cutoff of .90, suggesting modest fit. Collectively, these indices indicate that while the measurement model provides an acceptable representation of the underlying constructs, model specification could be refined to improve fit.
Convergent validity was examined using standardized factor loadings, Average Variance Extracted (AVE), and Composite Reliability (CR). All standardized loadings were statistically significant (p < .001) and ranged from .46 to .92 across constructs, meeting the minimum recommended threshold of .50 for most items. AVE values met or exceeded the .50 criterion for three constructs (DE = .556, DL = .777, DR = .647), while DP showed a marginally acceptable AVE (.507). Composite Reliability values were strong for all constructs (DP = .857, DE = .832, DL = .962, DR = .900), surpassing the recommended threshold of .70. These results provide overall support for convergent validity.
Discriminant validity was evaluated using the Fornell–Larcker criterion, comparing the square root of AVE for each construct with the inter-construct correlations. The square root of AVE exceeded the inter-construct correlations for DL and DR, indicating satisfactory discriminant validity for these constructs. However, DP and DE showed high inter-factor correlations (e.g., DP–DE = .739; DE–DR = .788), which were comparable to or slightly higher than the square roots of their AVE values (DP = .712; DE = .746). This suggests partial discriminant validity, with some conceptual overlap between Destination Personality, Destination Experience, and Destination Resilience. Such overlap is theoretically plausible, as personality perceptions often influence emotional bonding and perceived resilience of a destination.
2)
SEM Hypothesis testing
Overall, the hypothesized structural model was empirically supported: destination personality enhanced both destination experience and loyalty, destination experience strengthened loyalty, and loyalty functioned as a key antecedent of perceived destination resilience (Table 3.). The structural model was tested using SEM with maximum likelihood estimation with missing values (MLMV) on data from visitors to Osaka (N = 198). The hypothesized model specified directional relationships among Destination Personality (DP), Destination Experience (DE), Destination Loyalty (DL), and Destination Resilience (DR). Model fit indices indicated an overall acceptable but improvable fit, χ²(205) = 626.47, p < .001. Given the chi-square statistic’s sensitivity to sample size (Bentler & Bonett, 1980), additional fit indices were considered. The SRMR (.063) fell below the recommended .08 threshold (Hu & Bentler, 1999), indicating acceptable residual fit. RMSEA was .098 (90% CI [.090, .107]), slightly above the recommended cutoff of .08 but within the upper bound of moderate fit (< .10). The CFI (.885) and TLI (.871) were marginally below the ideal .90 threshold, suggesting a need for model refinement, though the model remained theoretically defensible.
All structural paths were statistically significant and aligned with theoretical expectations (Table 3.) Destination Personality had a strong positive effect on Destination Experience (β = .74, SE = .05, z = 15.96, p < .001), supporting H1. DP also exerted a significant positive direct effect on Destination Loyalty (β = .49, SE = .08, z = 5.88, p < .001), supporting H2. Destination Experience positively predicted Destination Loyalty (β = .40, SE = .09, z = 4.69, p < .001), supporting H3. Destination Loyalty significantly predicted Perceived Destination Resilience (β = .73, SE = .04, z = 19.22, p < .001), supporting H5.
The indirect effect of Destination Personality on Destination Loyalty through Destination Experience was positive and statistically significant, indicating mediation (β_indirect = .30; .740 × .400). Because both the direct and indirect effects were significant, the results indicate partial mediation, supporting H4.
The structural model results provide strong empirical support for the hypothesized relationships among Destination Personality (DP), Destination Experience (DE), Destination Loyalty (DL), and Destination Resilience (DR). Consistent with theoretical expectations, the measurement model demonstrated satisfactory psychometric properties, and all standardized factor loadings were significant at p < .001. The overall model fit was acceptable (χ² = 626.47, df = 205, χ²/df = 3.06; CFI = .90; NFI = .88; IFI = .91; RMSEA = .102), indicating that the four-factor structure represents a reasonable approximation of the underlying data.
In the structural model, Destination Personality exhibited a strong and significant positive effect on Destination Experience (β = .740, z = 15.96, p < .001), supporting H2. This indicates that visitors who perceive Osaka and the Kansai region as sincere, trustworthy, traditional, bold, or offering unique experiences tend to report richer and more emotionally meaningful travel experiences.
Destination Personality also significantly influenced Destination Loyalty both directly (β = .490, z = 5.88, p < .001) and indirectly through Destination Experience. Destination Experience demonstrated a significant positive effect on Destination Loyalty (β = .400, z = 4.69, p < .001), supporting H3. Together, these paths support H1 and indicate a complementary mechanism: favorable perceptions of destination personality strengthen loyalty not only directly but also by enhancing experiential satisfaction.
A bootstrap mediation test (2,000 replications) further confirmed the indirect effect of Destination Personality on Destination Loyalty through Destination Experience (β = .306, SE = .106, 95% CI [.098, .514], p = .004), supporting H4. This provides robust evidence that destination personality catalyzes deeper experiential engagement, which subsequently fosters stronger loyalty intentions.
Finally, Destination Loyalty had a strong and statistically significant effect on Tourism Resilience (β = .734, z = 19.22, p < .001), supporting H5. This finding suggests that loyal visitors—who express satisfaction, repeat visitation intentions, and willingness to recommend the destination—serve as a stabilizing force during periods of crisis or external disruption (e.g., pandemics, natural disasters). In other words, high visitor loyalty contributes meaningfully to a destination’s resilience by sustaining demand and supporting recovery in uncertain times.
Overall, the results demonstrate a coherent and theoretically meaningful pattern: destination personality enhances destination experiences, which in turn build loyalty, and strong loyalty ultimately reinforces perceived destination resilience. This integrated causal chain highlights the strategic importance of cultivating positive destination personality perceptions as a foundation for long-term sustainability and crisis preparedness.

6. Discussion and Implication

The results provide the support for all hypotheses, offering insights to examine how destination personality, destination experience, and destination loyalty jointly contribute to perceived tourism resilience in Osaka–Kansai. The structural model results provide strong empirical support for the proposed theoretical relationships and extend previous work on destination branding, experiential value, and perceived destination resilience within the context of an international mega-event, Osaka Expo 2025.
Consistent with prior research (Ekinci & Hosany, 2006; Stylos et al., 2017), destination personality significantly influenced both destination experience and destination loyalty. Visitors who perceived Osaka as sincere, unique, trustworthy, safe, traditional, and adventurous (q9–q16) reported significant emotional experiences (H2, β = 0.74, p < .001) and destination loyalty (H1, β = 0.49, p < .001), implying, on one hand, that a stronger and more consistent personality image significantly enhances visitors’ reported experiences. Destinations perceived as “friendly,” “vibrant,” or “innovative” tend to create higher emotional engagement and satisfaction levels. Furthermore, on the other hand, visitors who attribute more distinctive and positive personality traits to the destination (e.g., sincerity, excitement, sophistication) are substantially more likely to express loyalty intentions—such as willingness to revisit and recommend Osaka to others. This latter result aligns with previous studies highlighting the emotional component of destination attachment (Murphy et al., 2007). Moreover, both results confirm that personality attributes function as emotional cues such as experience and loyalty that shape visitors’ cognitive and affective interpretations of a destination as well as substantiate the idea that branding elements of personality translate into experimental value, a key element for differentiating urban destinations competing for international market place. Consequently, a strong and positive personality image serves as a foundational branding asset, enabling destinations to differentiate themselves in increasingly competitive tourism markets.
The path from destination experience to destination loyalty (H3; β = 0.40, p < .001) was significant, aligning with the evidence that experiential quality serves as a primary driver of loyalty. The finding confirms that experience and its emotional connection shaped by destination enjoyment, emotional engagement, cultural experience, and perceived authenticity (q18–q25) remains a critical antecedent of loyalty formation. This result echoes prior tourism loyalty models (Chen & Tsai, 2008), reinforcing the view that experience is the pivotal mechanism through which perceptions are converted into behavioral intentions.
Hypothesis 4 tested whether destination experience mediates the relationship between destination personality and destination loyalty. The indirect effect was significant (β = 0.306, p = .004, 95% CI [.098, .514]), supporting partial mediation. This means that Osaka’s personality traits do not translate directly into loyalty alone; instead, much of their influence works through enhanced experiential evaluations. In practical terms, personality-based branding contributes to loyalty primarily when it successfully manifests in destination experiences that visitors perceive as consistent with the brand narrative. The magnitude of the indirect effect demonstrates that destination experience serves as a key mechanism through which destination personality influences destination loyalty. In a nutshell, this suggests that Osaka’s perceived personality enhances loyalty mainly through improved experiential outcomes—for example, visitors who view Osaka as “energetic” or “authentic” tend to report more engaging experiences, which in turn foster loyalty. The mediation can be described as strong partial (almost full) mediation.
Finally, the direct effect of destination loyalty on perceived destination resilience (H5; β = 0.734, p < .001) underscores one of the most important implications of this study: loyal visitors are substantially more likely to perceive Osaka–Kansai as a resilient, safe, and sustainable destination. This strong relationship highlights that loyalty functions not only as a behavioral outcome but also as a critical sustainability resource, enhancing a destination’s ability to withstand crises, recover from disruptions, and maintain long-term attractiveness. In the context of the Osaka–Kansai region’s sustainability agenda and its preparation for Osaka Expo 2025, strengthening destination loyalty becomes a strategic pathway through which the region can reinforce tourism resilience and support sustainable development. This result implies at the end that loyal visitors perceive the destination as more capable of enduring crises, adapting to changes, and maintaining its attractiveness over time. In a scenario of post-pandemic tourism recovery, this finding is particularly relevant: loyalty functions not only as a marketing outcome but also as a resilience resource, that helps destinations sustain demand and reputation after external shocks (Prayag, 2016).
Overall, all five hypotheses (H1–H5) are empirically supported. The results delineate a causal chain linking destination personality (DP), experience (DE), loyalty (DL), and resilience (PDR). Specifically, we may stablish the relationship among Personality → Experience → Loyalty. The analysis highlights the mediating role of experiences. Destination branding should therefore focus on creating consistent personality traits that are also operationally reflected in service encounters, cultural events, and digital communication. Concerning the relationship Loyalty → Resilience, we may state that loyalty enhances resilience by building stable demand and positive word-of-mouth even under uncertainty. Managers can therefore leverage loyal tourists as ambassadors, reinforcing social media narratives and community engagement.
The results suggest that destination loyalty is not merely a function of affective and behavioral performance but is also strongly tied to emotional, experiential, and symbolic meanings attached to the destination. However, several challenges remain. The relationship between attitudinal and behavioral loyalty is not always straightforward, as situational constraints and opportunity sets can moderate intentions to revisit. Additionally, cross-cultural variations in loyalty expression and the role of digital touchpoints in shaping contemporary destination relationships warrant further investigation. This multidimensional understanding provides a basis for developing more nuanced models of tourist behavior and for designing retention strategies that appeal not only to tourists' satisfaction but also to their identity, memory, and emotional engagement with the destination.
Furthermore, as strategic implications for Osaka and Kansai, we find at least three: strengthen the “Osaka personality” around authenticity, creativity, and warmth; integrating personality cues into tangible experiences (street food, hospitality, local character) and finally using loyal visitors’ narratives to foster a resilient destination identity in anticipation of Expo 2025 Osaka-Kansai.
However, despite results achieved and the usefulness of their implications, this study has limitations that suggest future areas of research. Firstly, sample is formed just by Korean people, so further research should address to visitors from other countries, in order to contrast generalization of results to the complete universe of tourists. Secondly, sample might be enhanced in size to make it more significative, as well as to include more relevant questions related to destination personality (DP) and destination experience (DE), in line with JTO questionary.
Finally, future research should be addressed to the normative arena, that is, to analyze how to improve infrastructures of services in Osaka and in Kansai area, and what kind of policies should be implemented, in order to increase DP and DE, and consequently destination loyalty (DL).

References

  1. Aaker, D. A. (1991). Managing brand equity: Capitalizing on the value of a brand name. Free Press.
  2. Aaker, J. L., Benet-Martínez, V., & Garolera, J. (2001). [Study on brand personality across individuals, product categories, and cultural contexts]. [Incomplete reference—publication details not provided].
  3. ABC News. (2025, July). Japanese disaster claim impacting tourism as deadline approaches. ABC News.
  4. Ankers, P. (1997). [Study on brand and product personality]. [Incomplete reference—publication details not provided].
  5. Baloglu, S., Henthorne, T. L., & Sahin, Ş. (2014). Destination image and brand personality of Jamaica: A model of tourist behavior. Journal of Travel & Tourism Marketing, 31(8), 1057-1070. [CrossRef]
  6. Bentler, P. M., & Bonett, D. G. (1980). Significance tests and goodness of fit in the analysis of covariance structures. Psychological Bulletin, 88(3), 588–606. [CrossRef]
  7. Benet-Martínez, V., & Garolera, J. (2001). [Study on cultural influences in brand personality]. [Incomplete reference—publication details not provided].
  8. Bigné, J. E., Sánchez, M. I., & Sánchez, J. (2001). Tourism image, evaluation variables and after-purchase behaviour: Inter-relationship. Tourism Management, 22, 607-616. [CrossRef]
  9. Biggs, D., Hall, C. M., & Stoeckl, N. (2012). The resilience of formal and informal tourism enterprises to disasters: Reef tourism in Phuket, Thailand. Journal of Sustainable Tourism, 20(5), 645–665.
  10. Chen, C. F., & Phou, S. (2013). A closer look at destination: Image, personality, relationship and loyalty. Tourism Management, 36, 269-278. [CrossRef]
  11. Chen, C., & Tsai, M., (2008). Perceived value, satisfaction, and loyalty of TV travel product shopping: Involvement as a moderator. Tourism Management, Volume 29, Issue 6.
  12. Chi, C. G.-Q., & Qu, H. (2008). Examining the structural relationships of destination image, tourist satisfaction and destination loyalty: An integrated approach. Tourism Management, 29(4), 624-636. [CrossRef]
  13. Cossío-Silva, F.-J., Revilla-Camacho, M.-Á., & Vega-Vázquez, M. (2019). The tourist loyalty index: A new indicator for measuring tourist destination loyalty? Journal of Innovation & Knowledge, 4(2), 71-77. [CrossRef]
  14. Cruz-Milán, O. (2023). Loyalty in the time of COVID-19: A review of the literature in tourism destination settings. Frontiers in Psychology, 14, 1119737. [CrossRef]
  15. Ekinci, Y., & Hosany, S. (2006). Destination personality: An application of brand personality to tourism destinations. Journal of Travel Research, 45(2), 127–139. [CrossRef]
  16. Hall, C. M., Prayag, G., & Amore, A. (2017). Tourism and Resilience: Individual, organisational and destination perspectives. Channel View Publications.
  17. Hu, L., & Bentler, P. M. (1999). Cutoff criteria for fit indexes in covariance structure analysis: Conventional criteria versus new alternatives. Structural Equation Modeling: A Multidisciplinary Journal, 6(1), 1–55. [CrossRef]
  18. Jeong, Y., Kim, E., & Kim, S.-K. (2020). Understanding active sport tourist behaviors in small-scale sports events: Stimulus-organism-response approach. Sustainability, 12(19), 8192. https://www.mdpi.com/2071-1050/12/19/8192/pdf.
  19. Japan National Tourism Organization. (2025, September). Japan tourism statistics. Data list | Japan Tourism Statistics.
  20. Japan Today. (2025, August). Osaka anticipates steady growth, but serious bottlenecks remain in Japan's tourist infrastructure. Japan Today.
  21. Kim, H., & Stepchenkova, S. (2017). Understanding destination personality through visitors’ experience: A cross-cultural perspective. Journal of Destination Marketing & Management, 6(4), 416–425. [CrossRef]
  22. Kim, J.-H., Ritchie, J. R. B., & McCormick, B. (2010). Development of a Scale to Measure Memorable Tourism Experiences. Journal of Travel Research, 51(1), 12-25. (Original work published 2012). [CrossRef]
  23. Kim, S., & Lehto, X. Y. (2012). Projected and perceived destination brand personalities: The case of South Korea. Journal of Travel Research, 52(1), 117–130. [CrossRef]
  24. Kumar, V., & Nayak, J. K. (2016). Destination personality and self-congruity in predicting tourist behaviour. Journal of Destination Marketing & Management, 6(4), 363–372.
  25. Murphy, L., Benckendorff, P., & Moscardo, G. (2007). Linking Travel Motivation, Tourist Self-Image and Destination Brand Personality. Journal of Travel & Tourism Marketing, 22(2), 45–59. [CrossRef]
  26. Nikkei News. (2025, July). 大阪府のインバウンド客、25年1〜6月は最多の847万人 高額消費は減少 [Osaka Prefecture’s inbound visitors hit record 8.47 million in Jan–Jun 2025, but high spending declines]. 日本経済新聞 (The Nikkei).
  27. Oppermann, M. (2000). Tourism destination loyalty. Journal of Travel Research, 39 (1), 78-84. [CrossRef]
  28. Prayag, G., Hosany, S., Muskat, B., & Chiappa, G. (2016). Understanding the Relationships between Tourists’ Emotional Experiences, Perceived Overall Image, Satisfaction, and Intention to Recommend. Journal of Travel Research. https://journals.sagepub.com/doi/10.1177/0047287515620567.
  29. Pullman, M. E., & Gross, M. A. (2004). Ability of experience design elements to elicit emotions and loyalty behaviors. Decision Sciences, 35(3), 551–578.
  30. Ritchie, J. R. B., & Ritchie, R. J. B. (1998, September). The branding of tourism destinations: Past achievements and future challenges. In P. Keller (Ed.), Destination marketing: Scope and limitations – Proceedings of the 48th Annual Congress of the International Association of Scientific Experts in Tourism (AIEST), Marrakech, Morocco (pp. 89-116).
  31. Rojas-Méndez, J. I., Erenchun Podlech, I., & Silva-Olave, E. (2004). [Study on brand personality in cultural contexts]. [Incomplete reference—publication details not provided].
  32. Seabra, C., Dolnicar, S., & Abrantes, J. (2020). Risk perception and travel behavior: What have we learned? Tourism Management.
  33. Sharma, P., & Nayak, J. K. (2019). Understanding memorable tourism experiences as the determinants of tourists' behaviour. International Journal of Tourism Research, 21(4), 504-518.
  34. Stylos, N., Bellou, V., Andronikidis, A., & Vassiliadis, C. A. (2017). Linking the dots among destination image, place attachment and revisit intentions: A study among British and Russian tourists. Journal of Travel Research, 54(3), 302-315.
  35. Tešin, A., Kovačić, S., & Obradović, S. (2023). The experience I will remember: The role of tourist personality, motivation, and destination personality. Journal of Vacation Marketing, 29(3), 13567667231164768.
  36. Usakli, A., & Baloglu, S. (2011). Brand personality of tourist destinations: An application of self-congruity theory. Journal of Travel Research, 50(5), 501–514.
  37. Yoon, Y., & Uysal, M. (2005). An examination of the effects of motivation and satisfaction on destination loyalty: A structural model. Tourism Management, 26(1),4556. [CrossRef]
  38. Zeugner-Roth, K. P., Žabkar, V., & Diamantopoulos, A. (2015). Consumer ethnocentrism, national identity, and consumer cosmopolitanism as drivers of consumer behavior: A social identity theory perspective. Journal of International Marketing, 23(2), 25-54. [CrossRef]
Table 1. Sample Characteristics and Descriptive Statistics (N = 198).
Variable Category Number & Distribution (%)
Gender
Age (years)

Purpose of visit


Average length of stay
Annual household income (KRW)
Male
Female
18–24
25–34
35–44
45–54
55–64
≥ 65
Leisure/tourism
Business
Visiting friends/relatives
Osaka Expo 2025 (planned)
Other (e.g., education, fieldwork, group tours)
None
Once
2–3 times
≥ 4 times
Day trip–1 night
2–3 nights
4–5 nights
≥ 6 nights
< 20 million
20–39.9 million
40–59.9 million
60–79.9 million
80–99.9 million
≥ 100 million
93 (47.0)
105 (53.0)
12 (6.1)
31 (15.7)
43 (21.7)
59 (29.8)
25 (12.6)
28 (14.1)
137 (69.0)
22 (11.0)
15 (7.6)
10 (5.0)
14 (7.4)
43 (21.7)
97 (49.0)
49 (24.7)
9 (4.5)
6 (3.0)
113 (57.0)
65 (33.0)
12 (6.0)
26 (13.0)
36 (18.0)
36 (18.0)
30 (15.0)
28 (14.0)
42 (22.0)
Note. Percentages are rounded to one decimal place and may not total 100% due to rounding.
Table 3. Results for Research Hypotheses.
Paths Path Standardized β SE z p-value Hypothesis
H1 DP → DL 0.49 0.083 5.88 < .001 supported
H2 DP → DE 0.74 0.046 15.96 < .001 supported
H3 DE→DL 0.4 0.085 4.69 < .001 supported
H5 DL → PDR 0.734 0.038 19.22 < .001 supported
Indirect Path H4 Standardized β SE z p-value 95% CI
DP →DE→DL 0.306 0.306 2.89 0.004 [.098, .514] supported (partial mediation)
Disclaimer/Publisher’s Note: The statements, opinions and data contained in all publications are solely those of the individual author(s) and contributor(s) and not of MDPI and/or the editor(s). MDPI and/or the editor(s) disclaim responsibility for any injury to people or property resulting from any ideas, methods, instructions or products referred to in the content.
Copyright: This open access article is published under a Creative Commons CC BY 4.0 license, which permit the free download, distribution, and reuse, provided that the author and preprint are cited in any reuse.
Prerpints.org logo

Preprints.org is a free preprint server supported by MDPI in Basel, Switzerland.

Subscribe

Disclaimer

Terms of Use

Privacy Policy

Privacy Settings

© 2025 MDPI (Basel, Switzerland) unless otherwise stated