
Submitted:
27 November 2025
Posted:
28 November 2025
You are already at the latest version
Abstract
Myeloproliferative neoplasms (MPNs) are a heterogeneous group of diseases originating from hematopoietic stem cell transformation, characterized by clonal proliferation of hematopoietic progenitors. A specific subset includes myeloid/lymphoid neoplasms with eosinophilia and tyrosine kinase (TK) gene fusions, particularly involving PDGFR A or B, which are sensitive to TK inhibitor treatment. We report a case of a 21-year-old patient with a myeloproliferative/ myelodysplastic neoplasm, presenting with hyperleukocytosis, anemia, thrombocytopenia, and elevated LDH. Peripheral blood smear showed hypogranular neutrophils, eosinophils, basophils, and myeloid precur-sors. Absence of BCR::ABL1 and mutations in JAK2, CALR, and MPL ex-cluded common MPNs. Cytogenetic analysis revealed a rearrangement between chromosomes 5 and 14. FISH analysis confirmed an inverted insertion from chromosome 5 to chromosome 14, involving the PDGFRB gene. WGS and RNAseq identified a fusion between PDGFRB and CCDC88C, causing constitutive activation of PDGFRB. The fusion gene was confirmed by sequencing. This allowed for targeted therapy with a tyrosine kinase inhibitor (TKI), leading to molecular remission monitored by RT-qPCR. This case demonstrates how a multidisciplinary approach can identify atypical transcripts in MPN, guiding targeted therapy with TK inhibitors, resulting in effective treatment and molecular remission.
Keywords:
myeloproliferative neoplasms (MPNs)
; PDGFRB gene
; CCDC88C gene
; cytogenetics
; whole genome sequencing (WGS)
; RNA sequencing (RNAseq)
; imatinib
; case report
1. Introduction
PDGFRB gene (5q32) encoding platelet-derived growth factor receptor-beta, which are characterised by five extracellular immunoglobulin-like domains and a split intracellular kinase domain. PDGFRB binds preferentially to members of the PDGF ligand family, particularly PDGF-B and PDGF-D. Ligand engagement triggers receptor dimerization, followed by tyrosine autophosphorylation and activation of key intracellular signaling pathways. These include the Ras/MAPK, PI3K/Akt, and PLCγ cascades, which collectively promote cell proliferation, differentiation, survival, and migration—processes that are essential during embryonic development and for maintaining tissue homeostasis in adult organisms. The excessive activation of these receptors is implicated in various malignancies as well as in disorders characterized by uncontrolled cell proliferation [1,2]. Gene fusions following chromosomal translocations that involving PDGFRB gene, identify a specific subgroup of hematological malignancies defined as myeloid/lymphoid neoplasms with eosinophilia and tyrosine kinase gene fusions by latest WHO/ICC classifications [3,4]. These malignancies frequently share clinical feature with myeloproliferative neoplasms (MPNs), are commonly associated with eosinophilia and show high sensitivity to tyrosine kinase inhibitors (TKI) [5,6]. Cytogenetic and molecular monitoring of these patients has shown that low dose tyrosine kinase inhibitor (i.d. 100-200 mg imatinib) is sufficient to induce and maintain long-lasting molecular remissions [7].
2. Results
2.1. Case Report
We herein describe a case of a 21-year-old male patient who initially presented to the emergency department with symptoms of fatigue and fever. A complete blood count revealed hyperleukocytosis with a white blood cell (WBC) count of 115,000/mm³, hemoglobin (Hb) of 9.7 g/dL, thrombocytopenia with a platelet count (PLT) of 116,000/mm³, and elevated lactate dehydrogenase (LDH) levels of 850 IU/mL. Based on these findings, the patient was urgently transferred to AOU Federico II Hematology Division for further investigations. Peripheral blood smear showed 35% hypogranulated neutrophils, along with immature cells, including promyelocytes (4%), myelocytes (25%), and metamyelocytes (10%). Additionally, eosinophilia (7% of WBC - 7,170/mmc) and basophilia (2% of WBC - 2,048/mmc) were observed. Cytoreduction with hydroxyurea was then started and a trephine biopsy performed, revealing an increased bone marrow cellularity, with hyperplasia of megakaryocyte and granulopoietic precursors, with increased eosinophilic differentiation. No excess of blast cells was detected. Flow cytometry confirmed absence of blasts cells, and the presence of a granular hyperplasia (89%) with abnormalities in maturation. Peripheral blood molecular analysis by PCR excluded BCR::ABL1 rearrangement, mutations in the JAK2 gene and overexpression of WT1 gene. Mutational analysis was extended by using a next-generation sequencing (NGS) panel of 30 myeloid-targeted genes (Table 1). NGS analysis identified three mutated genes variants (Table 2), all classified as variants of unknown clinical significance by major genomic databases (ClinVar, Cosmic and Franklin Genoox).
2.2. Cytogenetic Analysis
Cytogenetic evaluation revealed in 90% of the metaphases rearrangement involving one copy of chromosome 5 and one copy of chromosome 14 (Figure 1A). The chromosome rearrangement consisted in a balanced translocation involving the long arm of a chromosome 5 at position q12 and the long arm of a chromosome 14 at position q32. To better understand the nature of this rearrangement, a FISH with whole chromosome painting probes was performed, revealing that the aberration consisted in an insertion of a large segment of the long arm of a chromosome 5 into the long arm of a chromosome 14 (Figure 1B). To better define the potential chromosome breakpoints and chromosomal regions involved in the anomaly, a FISH with locus-specific probes was set up. For chromosome 5, a mixture of three probes was used. The first hybridizing on the short arm at the level of the p15 chromosomal region and labeled with the fluorophore aqua was used as a hybridization control. The other two probes hybridize on the chromosomal region 5q31 (labeled with the orange fluorophore) and region 5q33 (labeled with the green fluorophore). As shown in Figure 1, FISH assay showed normal signals on the intact copy of chromosome 5, whereas for the pathological chromosome 5, the loss of the 5q31 region was highlighted. It was found that the segment from chromosome 5 was relocated on the derivative chromosome 14 in a region much further upstream than expected. Typically, in a simple insertion, this marker would be located in the terminal portion of the derivative chromosome 14. However, in this case, the marker was found in a diametrically opposite position to what was expected. This condition suggests that the chromosome segment was inserted in an inverted orientation within the recipient chromosome. Overall, this experiment confirmed the presence of the insertion and further revealed that the patient also had an inversion (Figure 1C). Based on this result, we hypothesized the involvement of the IGH gene as the insertion point on chromosome 14 was located near its locus. To verify this, a FISH assay with break-apart (BA) probes for the IGH gene was performed, which yielded a negative result, thus excluding the involvement of the IGH gene (Figure 1D). Subsequently, the break-apart probes were used for the PDGFRB gene, located on chromosome 5q32 and occasionally involved in hematologic malignancies. The FISH assay showed the relocalization of the 3’ region of the PDGFRB gene on chromosome 14 at position q32 (Figure 1E), confirming the PDGFRB rearrangement without however identifying the specific fusion partner.
2.3. Whole Genome Sequencing and RNA Sequencing Analysis
At this point, it was decided to proceed with the analysis of somatic variants by whole genome sequencing (WGS) on DNA isolated from the bone marrow matched with germline DNA from peripheral blood as control tissue. This experiment was conducted to validate the results obtained from the FISH experiments and to better understand the nature of the inverted insertion. It is well known that apparently balanced events, as observed at chromosomal level, may hide deletions or duplications at the breakpoints that are cryptic at the karyotype level. The results of the somatic copy number alteration (CNA) analysis demonstrated the presence of two regions of loss (with CN=1) both mapping at 5q11 (Figure 2). The first copy number alteration was approximately 1.9 Mb, contained 17 genes and was classified as pathogenic according to the American College of Medical Genetics (ACMG) guidelines. The second copy number alteration, located roughly 7 Mb downstream, was about 150 Kb and was classified as a variant of unknown significance (VUS) as it did not contain any gene. Moreover, in the somatic structural variants (SV) analysis, breakpoints were found to support an inverted insertion event of a large segment of chromosome 5 from 5q11 to 5q32 (about 92 Mb containing 694 genes) on chromosome 14q32 (Figure 2). To better characterize the PDGFRB fusion partner and assess its expression levels, an RNA sequencing experiment (RNAseq) was carried out. The bioinformatics analysis of the transcriptome and the search for fusion genes subsequently confirmed and added details to the data obtained by WGS. Specifically, three fusion events were identified: the first between the PDGFRB gene (on chromosome 5) and CCDC88C (on chromosome 14); the second fusion involved the genes SKIV2L2 and C14orf159 (on chromosomes 5 and 14, respectively); and the third involved the genes SKIV2L2 and GPBP1 (both on chromosome 5). The first two fusion events supported the inverted insertion of chromosome 5 on chromosome 14 whereas the third fusion was a consequence of the pathogenic CN loss involving SKIV2L2 and GPBP1 (both on chromosome 5). Additional investigations showed that only the PDGFRB::CCDC88C fusion gene (Figure 3A) retained a complete open reading frame, potentially preserving the integrity of the original protein domains. The resulting fusion protein, comprising 1028 amino acids, is characterized by the hook-type domain of the CCDC88C protein and the kinase domain of the PDGFRB protein (Figure 3B). Finally, RNAseq analysis demonstrated that the fusion messenger RNA exhibited expression levels similar to those of CCDC88C, from which it inherited the regulatory region (Figure 3C). Considering that PDGFRB::CCDC88C fusion identified by our analysis is able to dimerize, and that the fusion product could lead to the constitutive activation of the kinase function of PDGFRB [8], a final diagnosis of myeloid/lymphoid neoplasms with eosinophilia and tyrosine kinase gene fusion according to WHO 2022 was made, and patient was started on low dose imatinib (200 mg od) accordingly. Based on the fusion gene sequence predicted by the RNAseq analysis, a pair of primers was designed (Table 3) to selectively amplify the cDNA of the fusion gene at the diagnosis by qualitative RT-PCR and a probe (Table 3) was designed to follow the molecular response by RT-qPCR in the bone marrow of the patient during the targeted therapy.
3. Discussion
In summary, we describe a case of myeloproliferative neoplasms associated with t(5;14) (q33; q32) with the formation of the rare fusion gene CCDC88C::PDGFRB. Cytogenetic analysis allowed us to highlight an atypical rearrangement and subsequent involvement of the PDGFRB gene, which is involved in chronic myeloproliferative neoplasms with eosinophilia. Thanks to the rapid identification of a rare PDGFRB gene rearrangement, the patient was able to benefit from a targeted therapy with imatinib after only two weeks from bone marrow biopsy. To date, the patient remains on imatinib therapy (200 mg/day) in complete molecular remission.
Author Contributions
C.B and V.A.L wrote the manuscript. B.I, V.I, R.R and M.C designed the study and participated in the manuscript review. S.E, I.P, M.C, M.C, F.Q, A.P, R.V, A.G, A.Z, C.D.P, T.F and G.E performed the laboratory tests, interpreted and discussed the data. F.G and N.P contributed to the clinical decision and to the clinical care of this patient. All authors reviewed and approved the final manuscript.
Funding
This research received no external funding.
Etichs Statement
Written informed consent was acquired from the patient, both for the diagnostic procedures and for the publication of clinical and molecular data.
Data Availability Statement
The data that support the findings of this study are available from the corresponding author upon reasonable request.
Acknowledgments
The authors gratefully acknowledge the patient described in this case report.
Conflicts of Interest
The authors declare no conflicts of interest.
References
- Heldin CH, Lennartsson J. Structural and functional properties of platelet-derived growth factor and stem cell factor receptors. Cold Spring Harb Perspect Biol. 2013 Aug 1;5(8):a009100. PMID: 23906712; PMCID: PMC3721287. [CrossRef]
- Florence A. Arts, Raf Sciot, Bénédicte Brichard, Marleen Renard, Audrey de Rocca Serra, Guillaume Dachy, Laura A. Noël, Amélie I. Velghe, Christine Galant, Maria Debiec-Rychter, An Van Damme, Miikka Vikkula, Raphaël Helaers, Nisha Limaye, Hélène A. Poirel, Jean-Baptiste Demoulin, PDGFRB gain-of-function mutations in sporadic infantile myofibromatosis, Human Molecular Genetics, Volume 26, Issue 10, 15 May 2017, Pages 1801–1810, . [CrossRef]
- Khoury JD, Solary E, Abla O, et al. The 5th edition of the World Health Organization Classification of Haematolymphoid Tumours: Myeloid and Histiocytic/Dendritic Neoplasms. Leukemia 2022;36(7):1703–1719.
- Arber DA, Orazi A, Hasserjian RP, et al. International Consensus Classification of Myeloid Neoplasms and Acute Leukemias: integrating morphologic, clinical, and genomic data. Blood 2022;140(11):1200–1228.
- Oya S, Morishige S, Ozawa H, et al. Beneficial tyrosine kinase inhibitor therapy in a patient with relapsed BCR-ABL1-like acute lymphoblastic leukemia with CCDC88C-PDGFRB fusion. Int J Hematol 2021;113(2):285–289.
- Coutré S, Gotlib J. Targeted treatment of hypereosinophilic syndromes and chronic eosinophilic leukemias with imatinib mesylate. Semin Cancer Biol 2004;14(4):307–315.
- Di Giacomo D, Quintini M, Pierini V, et al. Genomic and clinical findings in myeloid neoplasms with PDGFRB rearrangement. Ann Hematol 2022;101(2):297–307.
- Gosenca D, Kellert B, Metzgeroth G, et al. Identification and functional characterization of imatinib-sensitive DTD1-PDGFRB and CCDC88C-PDGFRB fusion genes in eosinophilia-associated myeloid/lymphoid neoplasms. Genes Chromosomes Cancer 2014;53(5):411–421.
Figure 1.
Karyotype from bone marrow blood and molecular cytogenetic analysis with a Metasystem probes. A | It can be observed the rearrangement involving a chromosome 5 and a chromosome 14. B | FISH with whole chromosome painting (WPC) probes for chromosomes 5 and 14. Probes that hybridize with chromosome 14 are marked in green, and probes that hybridize with chromosome 5 are marked with orange fluorophore. From the image produced by the experiment, it shows how the portion of chromosome 5 goes inside chromosome 14. Defining the rearrangement as an insertion and not a translocation. C | FISH with LSI probes. One probe hybridizing to the 5p15(control region) is labeled with Aqua fluorophore, the other two probes hybridizing to the 5q31 and 5q33 regions are labeled with orange and green fluorophores, respectively. The image produced by the experiment shows how the 5q31 region fits invertedly within the derivative chromosome 14, while the 5q33 region remains conserved in the derivative chromosome 5. D | FISH with Break Apart probes for the IGH gene. As can be seen from the image, the gene has no rearrangement. The two signals green and orange respectively are close, highlighting the integrity of the gene and non-involvement in rearrangement. E | FISH with Break Apart robe for the PDGFRB gene. In the image produced, the involvement of the gene in the rearrangement can be seen, highlighting how the 3’ region of the gene (marked with orange fluorophore) has relocated to the central part of derivative chromosome 14. In contrast, the 5’ region of the gene (marked with green fluorophore) remains conserved in the derivative chromosome 5.
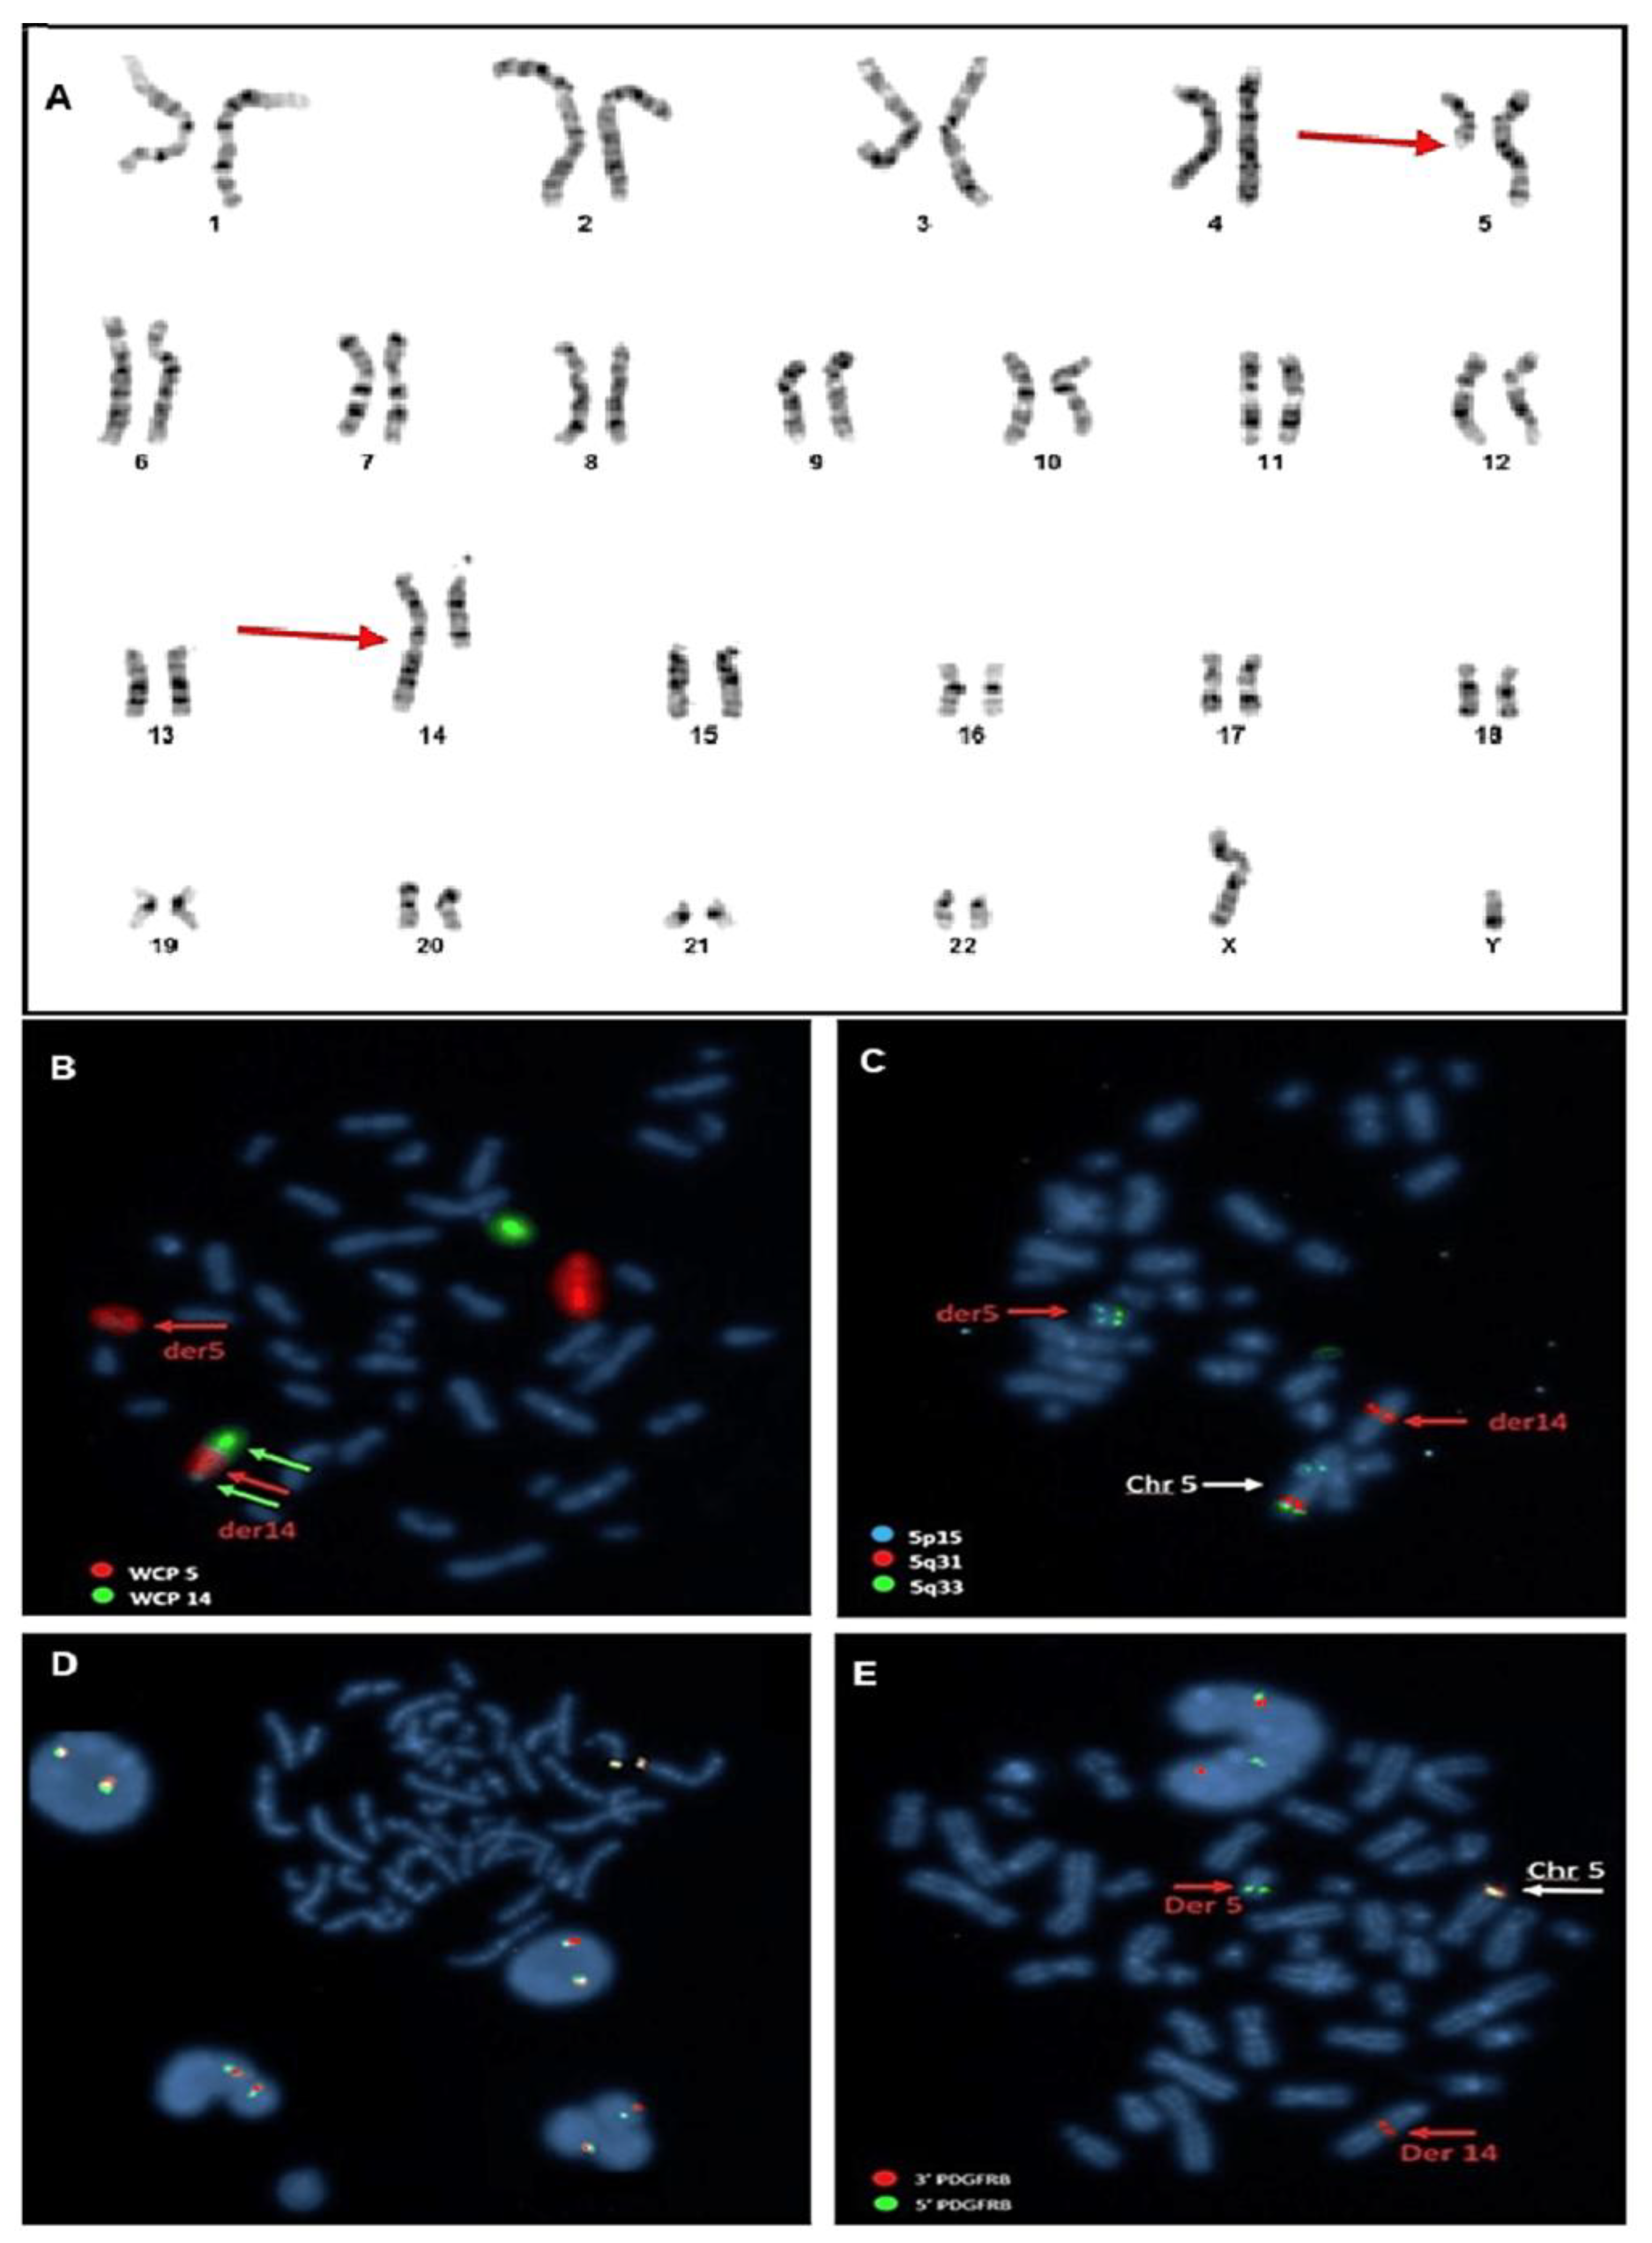
Figure 2.
Circos view of the chromosomes involved in the inverted insertion. The circos plot shows, from outside to inside, the chromosome names and ideograms, the CN profile (green: CN=2, blue: CN=1), the arcs at the center (the light blue area) show the breakpoints on chromosome 5 and the insertion point on chromosome 14. A | Zoom-in of the insertion point on chromosome 14. B | Zoom-in of the up-stream break point on chromosome 5. The CN losses are in blue. C | Zoom-in of the down-stream break point on chromosome 5. The position of the FISH probes showed in Figure 1 are also reported.
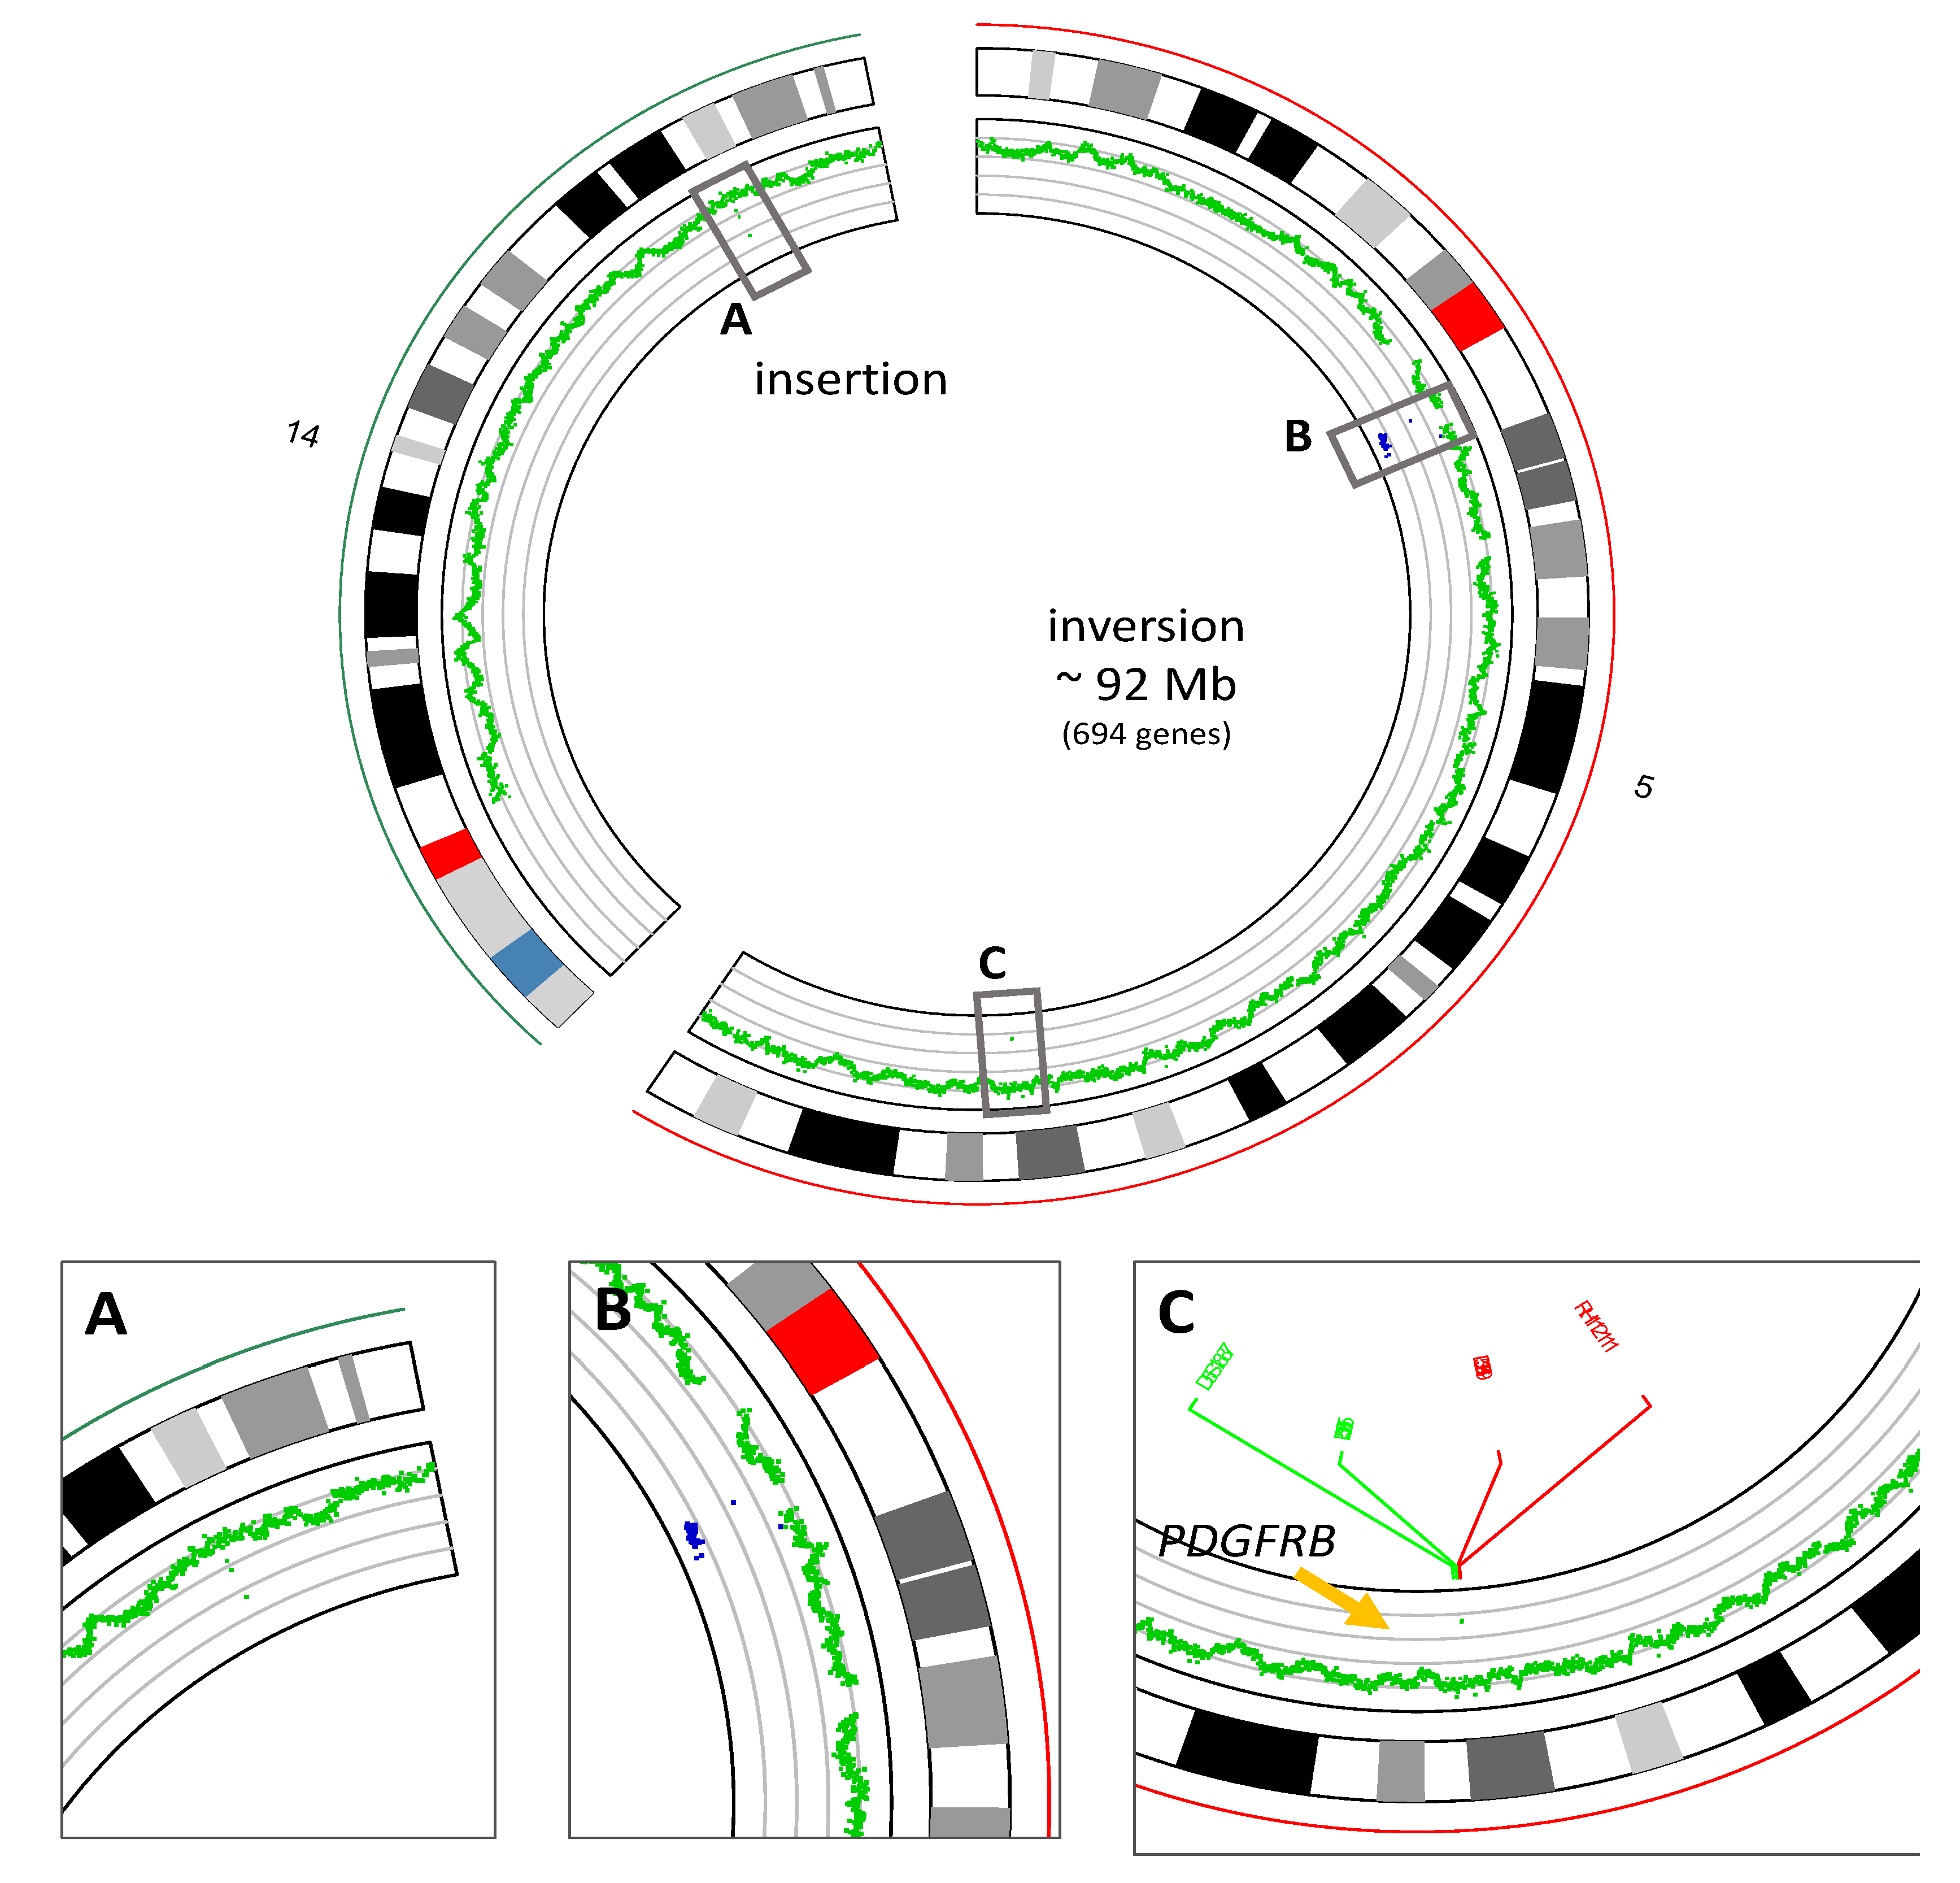
Figure 3.
Characterization of the PDGFRB ::CCDC88C fusion. A | Genomic view of the fusion genes. On the left CCDC88C locus on chromosome 14; on the right PDGFRB locus on chromosome 5. The fusion event involved the exons 1 to 12 of CCDC88C and from 10 to 22 of PDGFRB (grey highlighted areas). The plots report the normalized number of reads mapping on the mRNAs (from RNAseq data). GH14J091391: GeneHancer ID of the CCDC88C regulatory region. B | Schematic view of the involved protein domains. C | The plot shows the expression levels of the normal genes as compared to the level of the fusion gene.
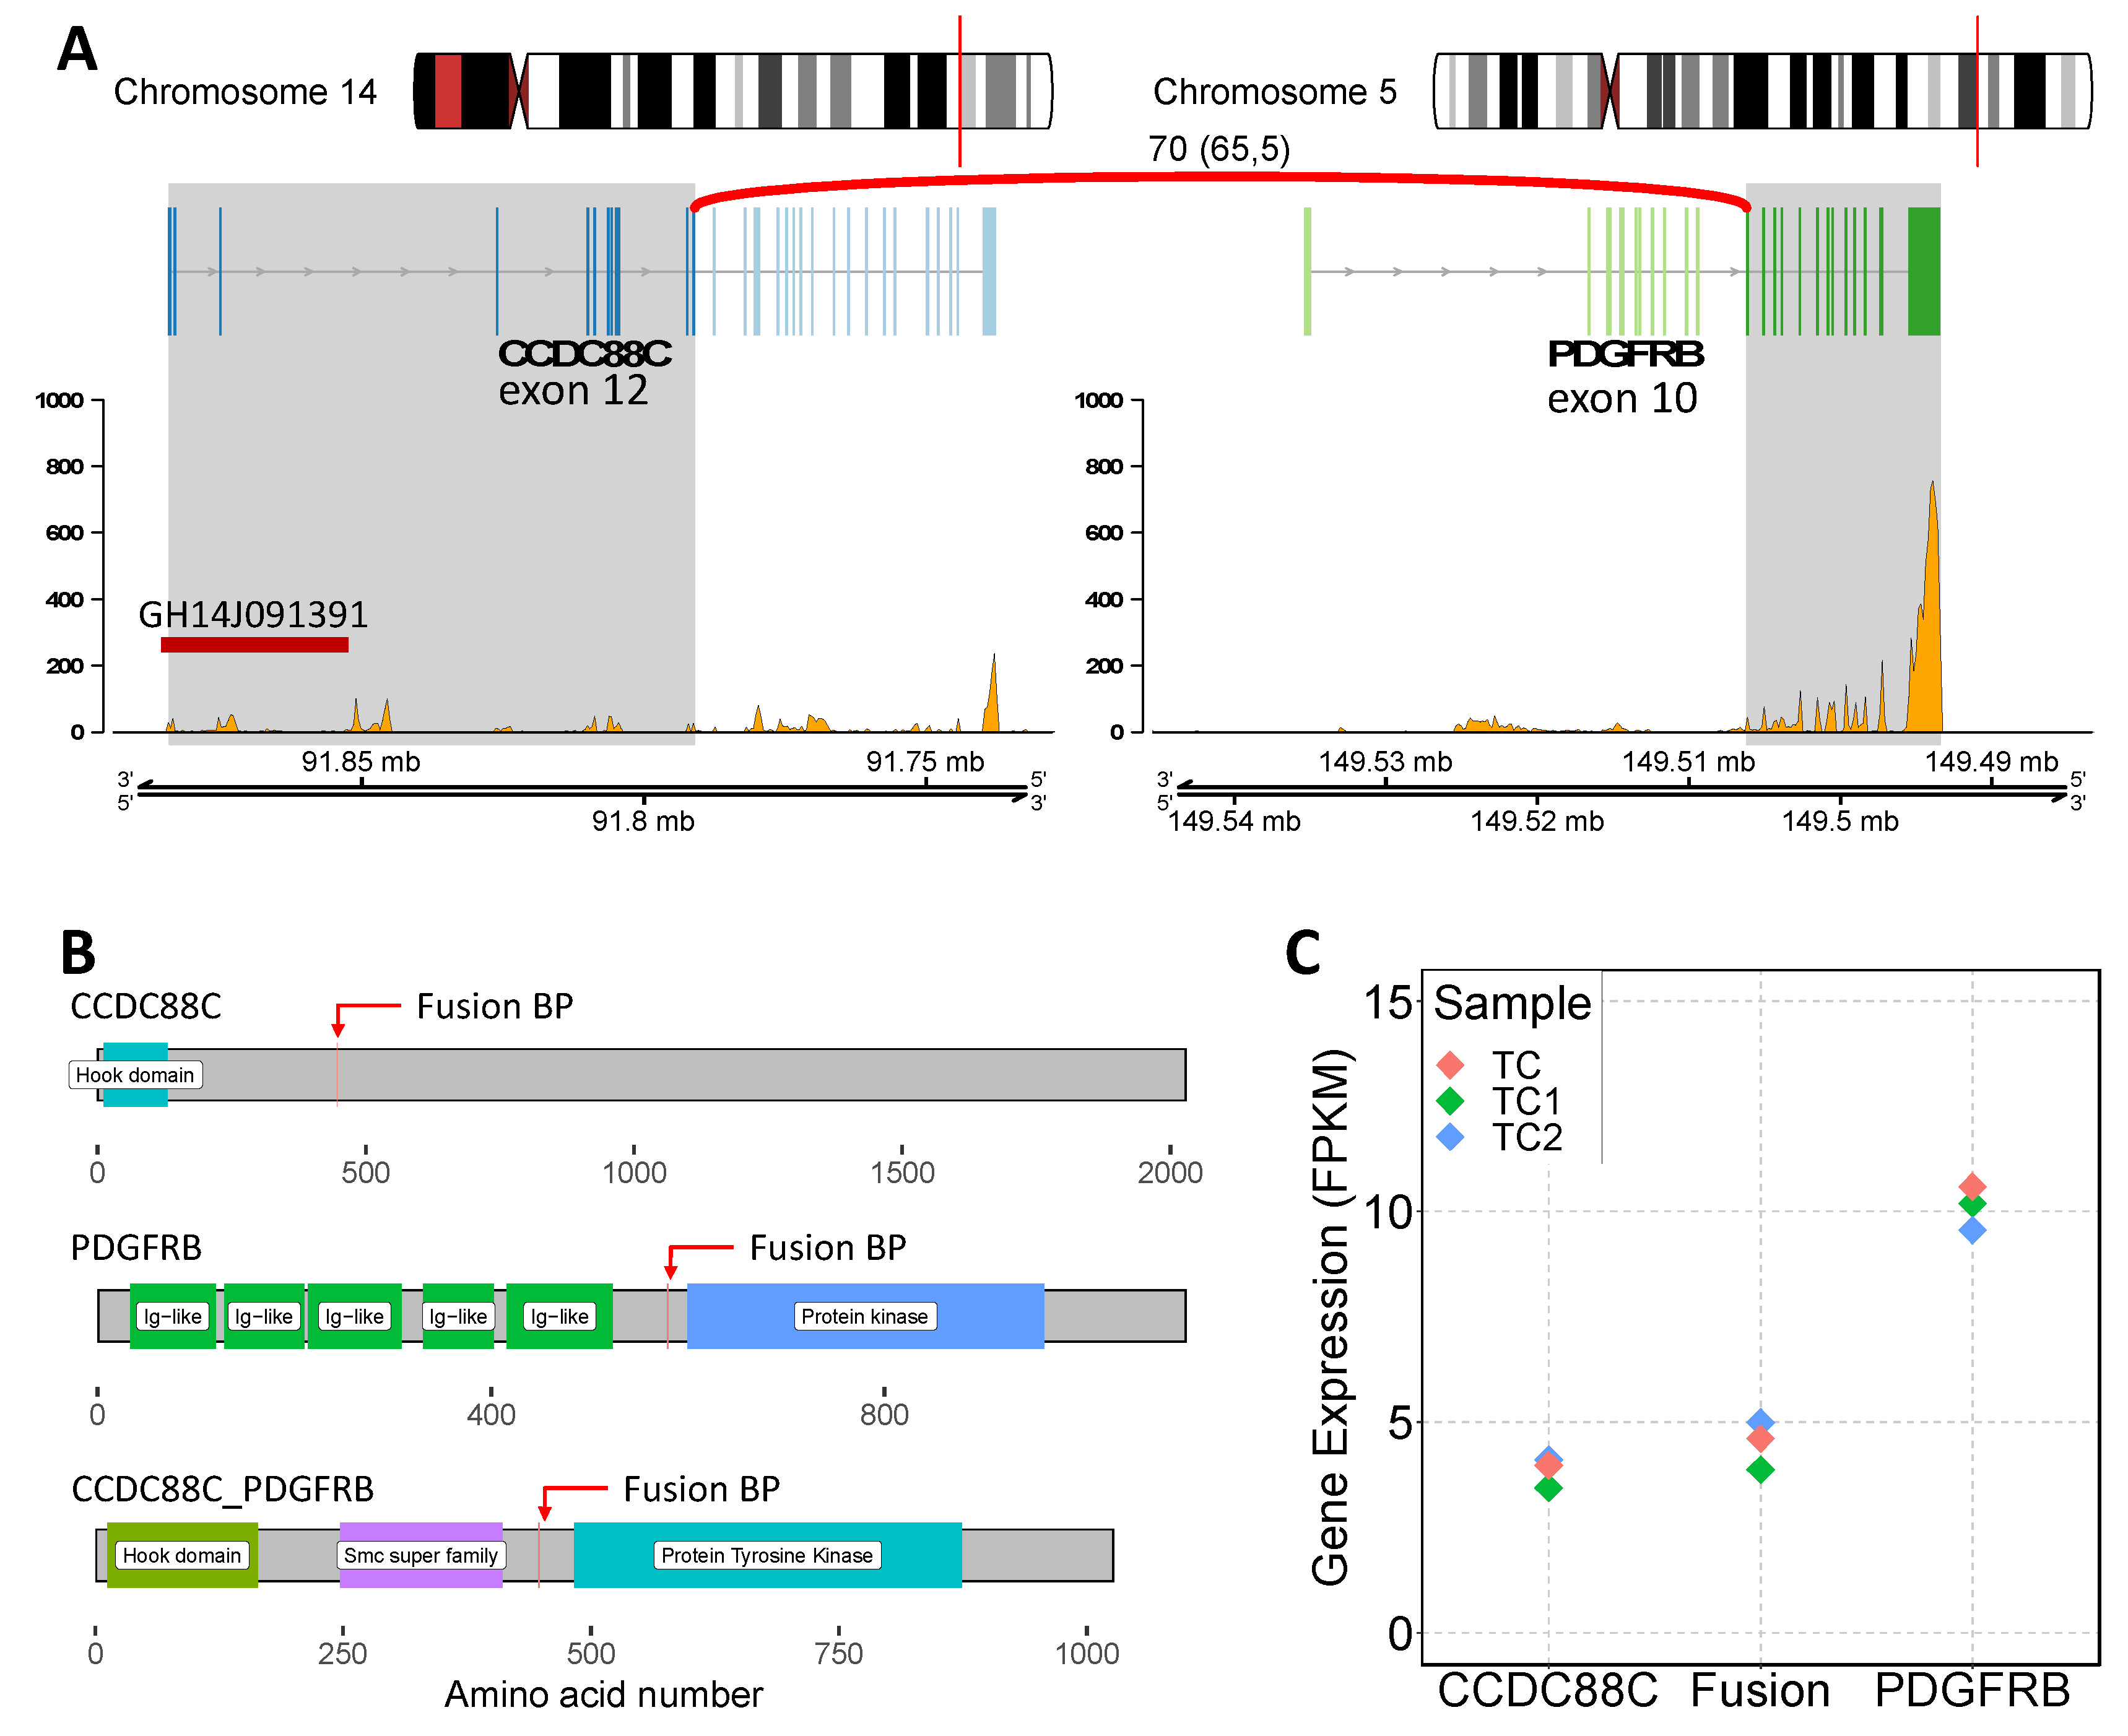

Table 1.
NGS Myeloid Panel genes.
| Gene | Exons Tested | Gene | Exons Tested |
| WT1 | 6-10 | PTPN11 | 3,7-13 |
| SETBP1 | 4 | HRAS | 2,3 |
| FLT3 | 13-15,20 | CALR | 9 |
| CBL | 8,9 | IDH2 | 4 |
| CEBPA | All | KRAS | 2,3 |
| TP53 | 2-11 | NRAS | 2,3 |
| ETV6 | All | SRSF2 | 1 |
| MPL | 10 | SF3B1 | 10-16 |
| BRAF | 15 | CSF3R | All |
| IDH1 | 4 | EZH2 | All |
| ASXL1 | 9,11,12,14 | KIT | 2,8-11,13,17,18 |
| JAK2 | All | RUNX1 | All |
| TET2 | All | ABL1 | 4-9 |
| U2AF1 | 2,6 | NPM1 | 10,11 |
| ZRSR2 | All | DNMT3A | All |
Table 2.
NGS Myeloid Panel results.
| Gene | Type | Description | VAF (%) |
| ZRSR2 | Inframe insertion | c.1338_1343dup | 97.8 |
| SETBP1 | Missense mutation | c.691G>C | 49.2 |
| KIT | Missense mutation | c.1621A>C | 99.7 |
Table 3.
Oligonucleotide primers and probe used in RT-PCR and RT-qPCR.
| Primer/Probe | Sequence | Tm (°C) |
| FW (Forward) | GAGATTGCACAGAAGCAGAG | 47.8 |
| RV (Reverse) | AGGATGATAAGGGAGATGATGG | 47.6 |
| Probe | FAM-5’ ACGCAGACTTGTCAGACGCCTTGCC 3’-TAMRA | - |
Disclaimer/Publisher’s Note: The statements, opinions and data contained in all publications are solely those of the individual author(s) and contributor(s) and not of MDPI and/or the editor(s). MDPI and/or the editor(s) disclaim responsibility for any injury to people or property resulting from any ideas, methods, instructions or products referred to in the content. |
© 2025 by the authors. Licensee MDPI, Basel, Switzerland. This article is an open access article distributed under the terms and conditions of the Creative Commons Attribution (CC BY) license (http://creativecommons.org/licenses/by/4.0/).
Copyright: This open access article is published under a Creative Commons CC BY 4.0 license, which permit the free download, distribution, and reuse, provided that the author and preprint are cited in any reuse.


