1. Introduction
Peripheral T-cell lymphomas (PTCL) account for 5–20% of non-Hodgkin lymphomas and are relatively more frequent in Asia. In Asia, PTCL, not otherwise specified (PTCL-NOS) and angioimmunoblastic T-cell lymphoma (AITL) represent the second and third most common PTCL subtypes [
1]. Histologically, they partly overlap, and diagnostic reproducibility is imperfect even among experts [
2]. The 2016 WHO revision and subsequent 5th edition emphasize the concept of a T-follicular helper (TFH) lineage for AITL and a subset of PTCL-NOS, defined by variable expression of PD-1, ICOS, CXCR5, CD10, and/or BCL6. These lymphomas are usually accompanied by a distinctive microenvironment with arborizing high-endothelial venules, follicular dendritic cell meshwork, and EBV-positive B-immunoblasts [
3,
4]. The TFH framework is supported genomically by frequent mutations in
TET2 and
DNMT3A, the
IDH2 R172 hotspot, and the
RHOA G17V switch, often co-occurring and tightly linked to TFH differentiation [
5,
6,
7,
8]. Patients with TFH lymphomas have shown sustained response to hypomethylating agents and proximal TCR pathway inhibition, whereas non-TFH PTCL-NOS exhibit distinct dependencies [
9,
10]. These genetic differences in tumors may impact chemotherapy sensitivity.
This study aimed to explore the contribution of
KMT2A rearrangements (
KMT2A-r) to nodal PTCL biology, which remains poorly defined. Although
KMT2A-r is a founding lesion in acute leukemias, mechanistic and clinical data in mature T-cell neoplasms are scarce [
11]. Using next-generation sequencing (NGS), we conducted a bi-center analysis to identify clinicopathologic and genomic features across AITL and PTCL-NOS and assess the prognostic impact of
KMT2A-r and treatment options in first-line chemotherapy.
2. Materials and Methods
2.1. Patient Selection
We conducted a retrospective cohort study of patients diagnosed with de novo AITL or PTCL-NOS between January 2021 and September 2024 at Seoul St. Mary’s Hospital and Yeouido St. Mary’s Hospital. All biopsies were reviewed by hematopathologists with expertise in T-cell lymphomas. This study was approved by the Institutional Review Board and Ethics Committee of the Catholic Medical Center, South Korea (XC25RIDI0050). The requirement for informed consent was waived because only anonymized archival material and routine clinical data were used.
2.2. NGS
Targeted NGS was conducted using the QIAseq Pan-cancer Multimodal Panel (Qiagen, Hilden, Germany), which assesses DNA aberrations spanning 523 cancer-associated genes. At diagnosis, RNA and DNA were extracted from Formalin-fixed, paraffin-embedded (FFPE) tissue blocks using the QIAamp DNA FFPE Tissue Kit (Qiagen, Hilden, Germany) according to the manufacturer’s protocol. Input DNA quantity and integrity were evaluated using the QIAseq DNA QuantiMIZE Array, ensuring that the material met the requirements for downstream library construction.
Library construction was performed according to the QIAseq Multimodal Panel HT Handbook (Qiagen). The workflow comprised enzymatic DNA fragmentation, end-repair, A-tailing (adenine overhang addition), adapter ligation, and polymerase chain reaction (PCR) amplification. Unique molecular identifiers were incorporated during library build to minimize PCR duplicates and sequencing artifacts, thereby improving the accuracy of variant detection. Libraries were sample-indexed, quantified using quantitative PCR, and quality-checked on an Agilent Bioanalyzer to confirm fragment-size distribution and effective adapter trimming.
Sequencing was performed on Illumina instruments (Illumina, San Diego, CA, USA) using Qiagen-supplied custom sequencing primers. Primary data processing and variant calling were executed in the QIAGEN CLC Genomics Workbench, and downstream variant annotation and clinical interpretation were performed using QIAGEN Clinical Insight Interpret. A comprehensive list of all molecular alterations detected in the cohort is provided in
Supplementary Table S1.
2.3. Therapy and Response Assessment
First-line therapy was selected at the physician’s discretion and included CHOP/CHOEP, ProMACE-CytaBOM, or brentuximab vedotin (BV) plus cyclophosphamide, doxorubicin, and prednisone (CHP) [
12,
13,
14]. Regimen selection was done based on age, comorbidity, CD30 expression, and performance status. Responses were evaluated according to the Lugano 2014 criteria. Consolidation with autologous stem-cell transplantation (ASCT) was considered for fit patients attaining complete remission (CR). Staging was consistently evaluated using the Lugano classification and Deauville score. CR was defined as the disappearance of target lesions on computed tomography with normalization of 18F-fluorodeoxyglucose positron emission tomography-computed tomography uptake at all sites (Deauville score, 1–3) [
15]. BuMelTT protocols (busulfan, melphalan, and thiotepa) were initiated as previously described [
16].
Survival endpoints were overall survival (OS) and progression-free survival (PFS). Curves were generated using Kaplan–Meier estimates with log-rank tests. Univariate Cox models were used to screen clinical and genomic variables. Owing to sample size, multivariable modeling was limited to prespecified factors (age, Eastern Cooperative Oncology Group [ECOG], lactate dehydrogenase [LDH], marrow involvement, histology,
KMT2A-r). Pearson correlation matrices were constructed to evaluate variable co-movement and visualized using heatmaps. Network analysis was performed using the igraph package, with absolute correlation as edge weights; node degree and betweenness were used to identify hubs [
17]. A decision tree (package named rpart) based on binary features (1=present, 0=absent) was used to distinguish AITL from PTCL-NOS. To reveal multi-gene rules in this small cohort, we report the maximal, unpruned tree (very low cp; reduced minsplit/minbucket; increased maxdepth), showing node counts and class probabilities [
18]. All analyses were performed using R version 4.2.3 software (R Core Team, Vienna, Austria), and two-sided P-values <0.05 were considered statistically significant.
3. Results
3.1. Patient Cohort, Baseline Features, and Survival Outcomes
A total of 37 patients were included in the study (AITL n=14; PTCL-NOS n=23). The median age was 61 years (interquartile range: 54–69), and 18 (48.6%) patients were women. Most patients had advanced-stage disease (stage III–IV, 91.9%), and 40.5% had bone-marrow involvement. LDH levels were elevated above the upper limit of normal in 62.2% of cases. TFH markers, including CD10, BCL6, and PD-1, were significantly more frequent in AITL than in PTCL-NOS. Additionally,
RHOA mutations were enriched in AITL (95.7% vs. 57.1%; P=0.014).
KMT2A-r was present in nine patients (9/37, 24.3%), without strong enrichment based on histology. Additional baseline characteristics are presented in
Table 1.
At a median follow-up of 24 months among survivors, 2-year OS was higher in AITL versus PTCL-NOS (70.7% vs. 38.8%; P=0.040), whereas PFS was similar. BV-CHP did not significantly improve OS or PFS in the overall population, and differences in CD30 did not affect treatment outcomes. This is consistent with uncertainty regarding the benefit of BV-CHP in PTCL subtypes except for anaplastic large cell lymphoma [
19]. Patients undergoing ASCT consolidation had longer OS and PFS than those managed without ASCT (
Figure 1). Although improved survival outcomes with ASCT have been consistently reported, careful interpretation is required owing to the risk of selection bias favoring chemotherapy responders [
20,
21].
3.2. Impact of Genetic Alteration on Survival Outcomes
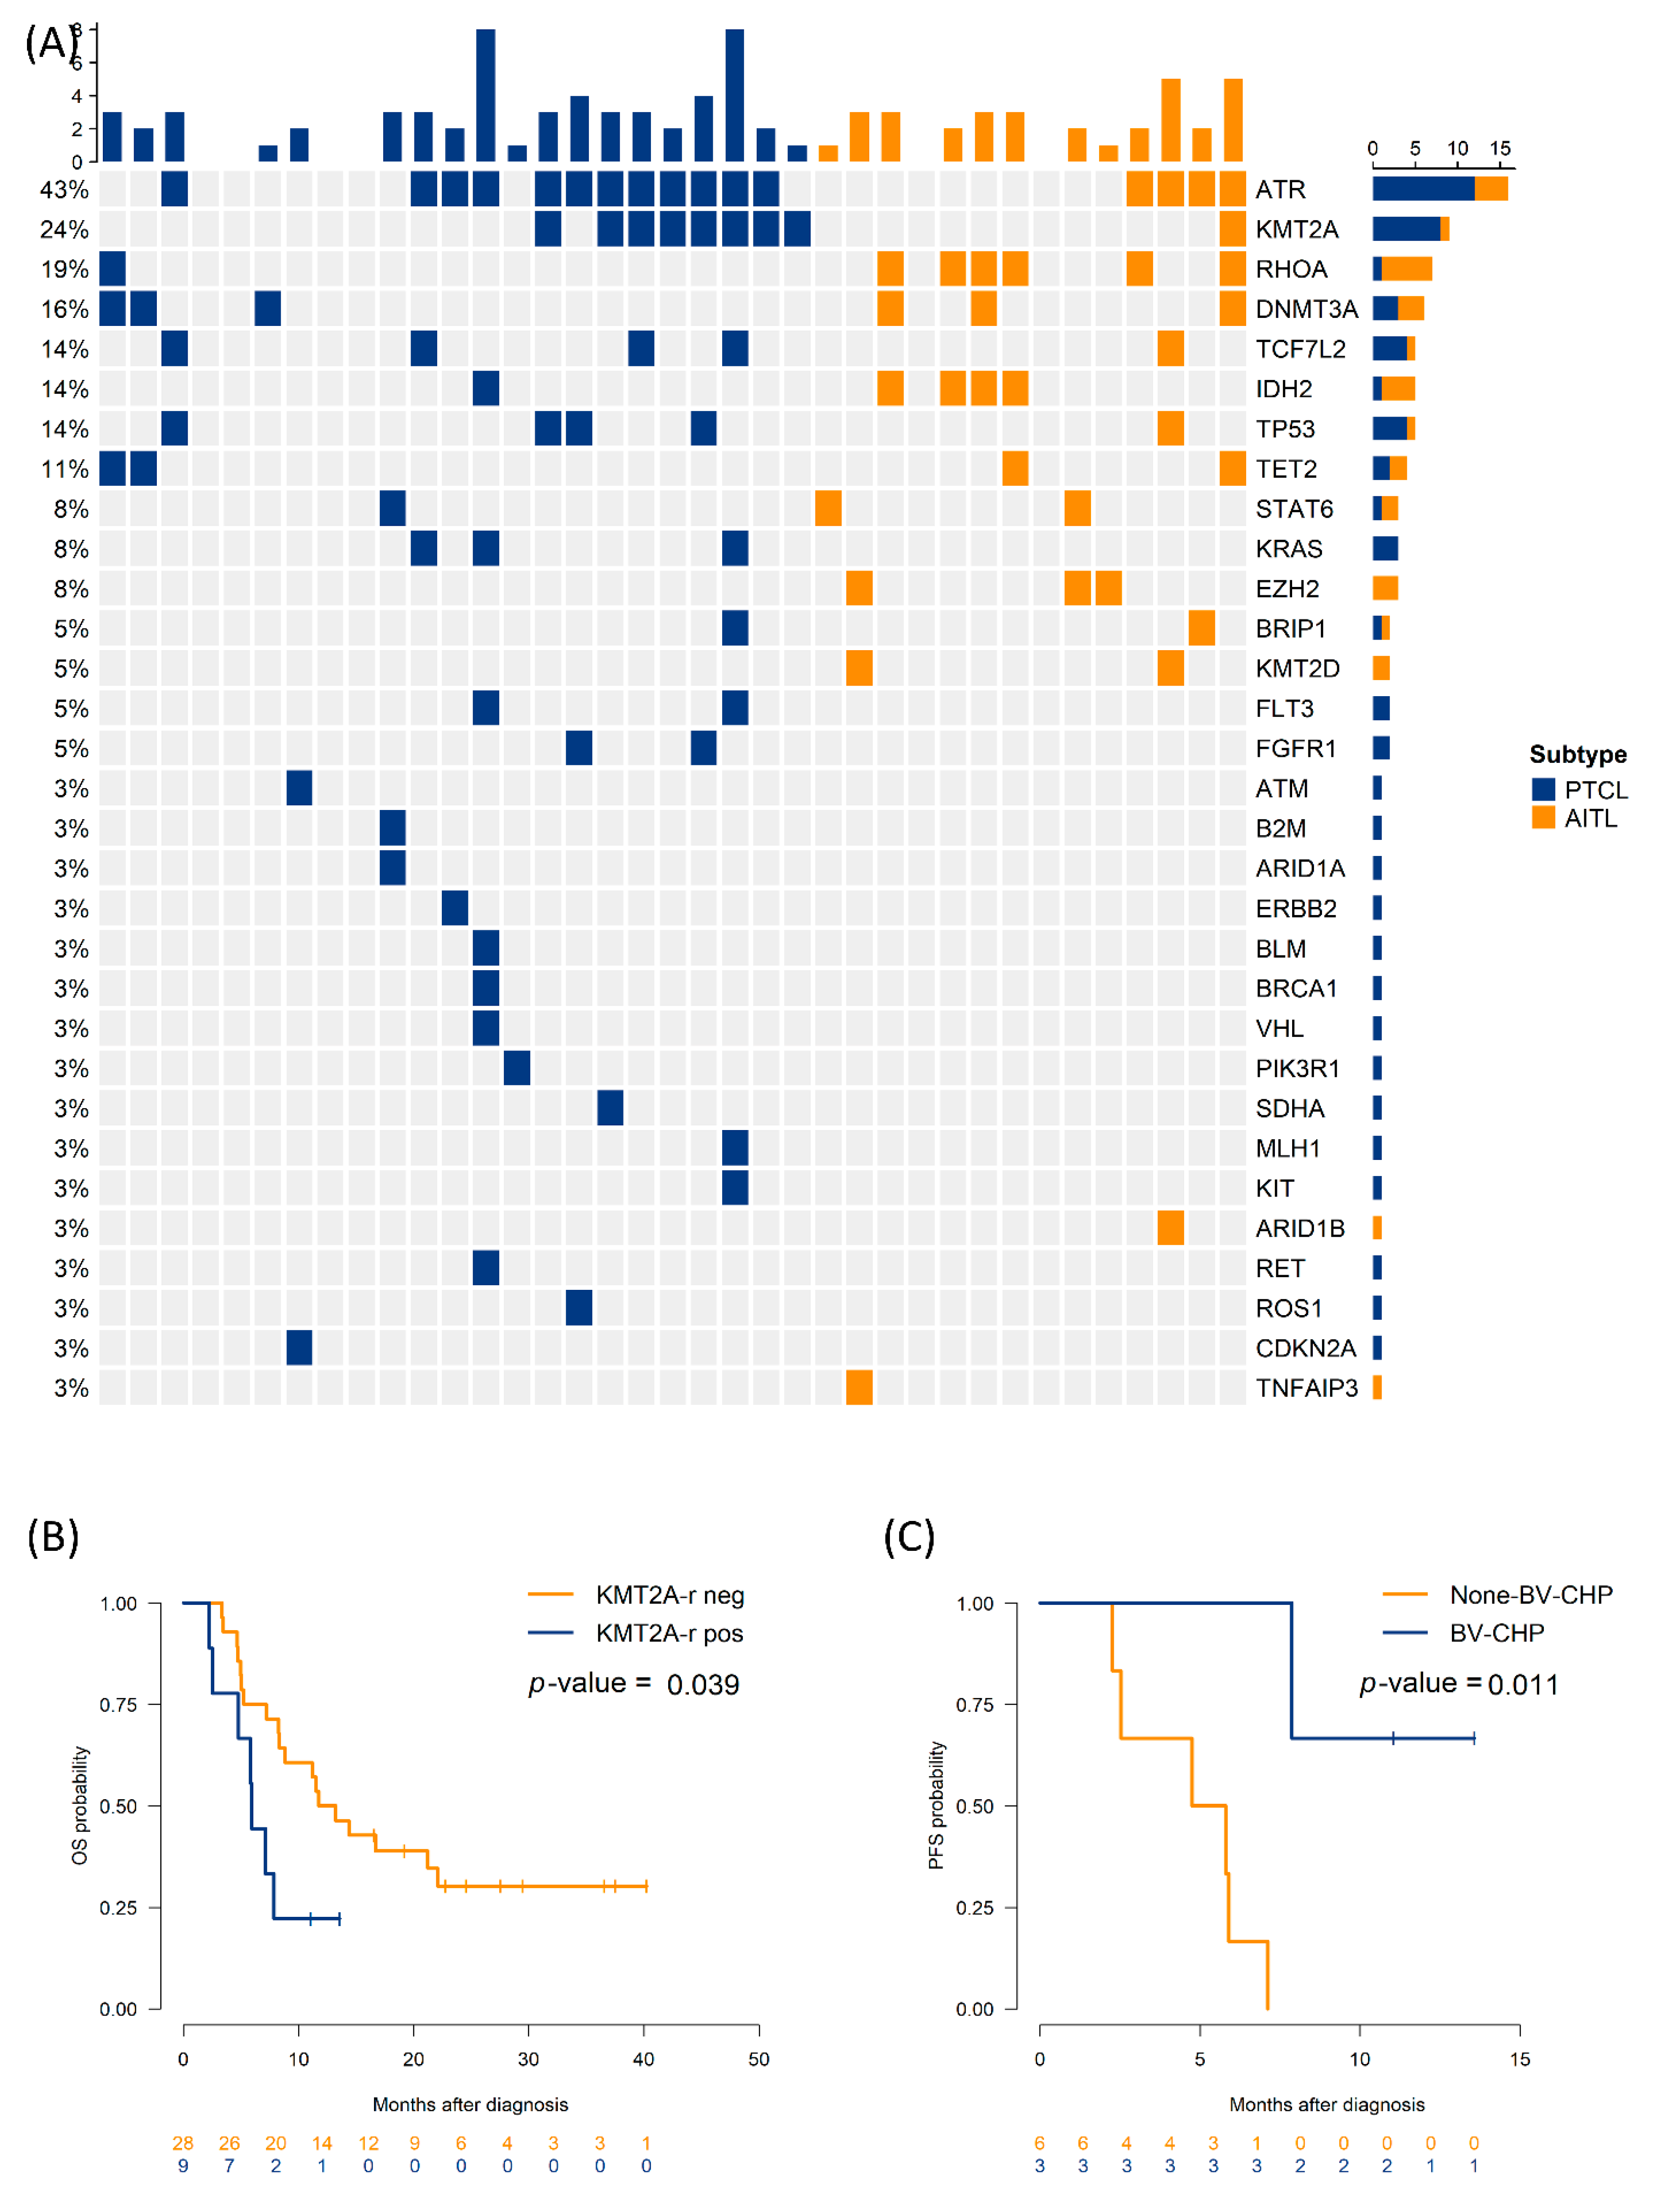
Across the cohort,
ATR mutations were the most frequent (43.2%), followed by
KMT2A-r,
RHOA,
DNMT3A, and
IDH2 (
Figure 2A). Univariate Cox analyses revealed that LDH elevation (hazard ratio [HR]: 3.10, 95% confidence interval [CI]: 1.27–7.58), bone marrow involvement (HR: 2.98, 95% CI: 1.25–7.08), and
KMT2A-r (HR: 2.56, 95% CI: 1.02–6.45) predicted shorter PFS.
DNMT3A mutation, ECOG≥2, LDH elevation trended toward inferior OS (
Table 2 and
Table S2).
DNMT3A mutations often correlated with higher ECOG and older age, both of which contribute to poorer OS. This finding aligns with prior reports that clinical indices (e.g., ECOG, LDH) affect survival outcomes across PTCL subtypes [
4]. Median PFS was 5.9 months in patients with
KMT2A-r, compared to 12.5 months in those without
KMT2A-r (log-rank P=0.039).
Figure 2B and 2C illustrate survival according to
KMT2A-r and treatment regimen. Among the six patients with
KMT2A-r who received BV-CHP, median PFS was not reached at 12 months, compared with 4.8 months (95% CI: 2.1–7.5) in three patients with
KMT2A-r treated with other regimens (P=0.011); however, numbers are small, with wide confidence intervals. Baseline CD30 levels did not differ substantially between the
KMT2A-r and non-
KMT2A-r groups.
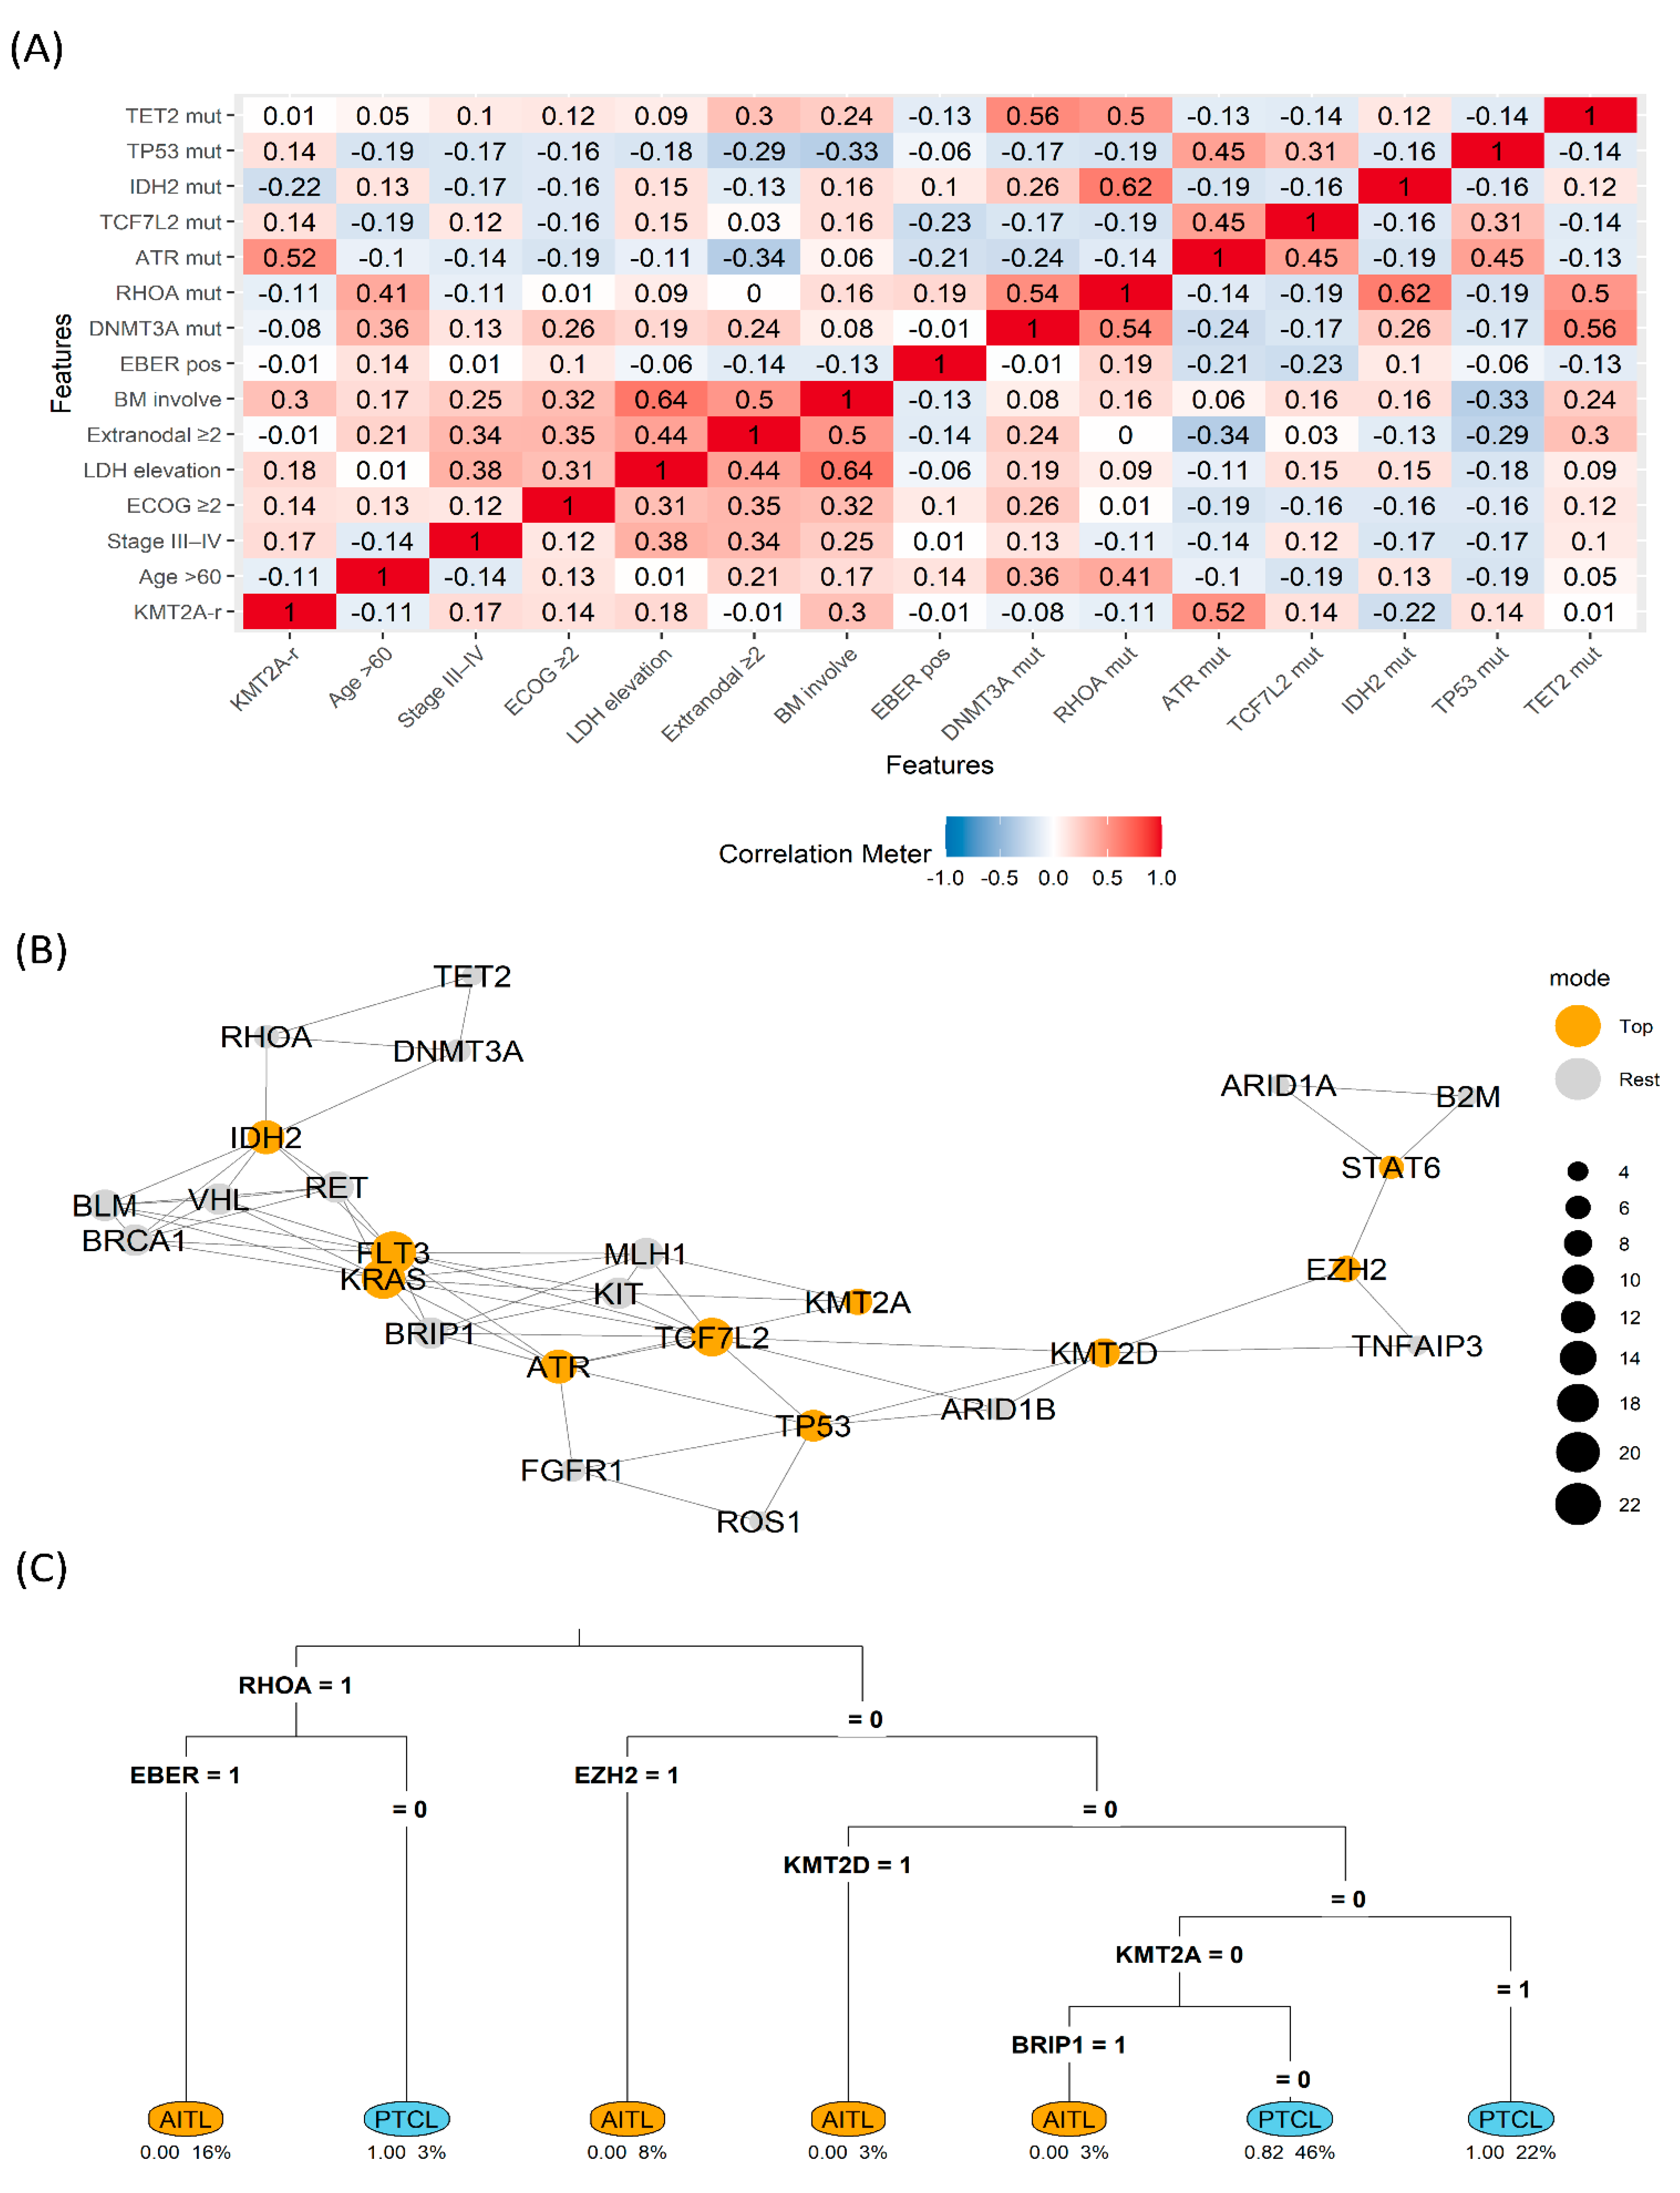
3.3. Interrelationship Among the Molecular Landscape
Heatmap analysis revealed a cluster linking
KMT2A-r with elevated LDH (correlation coefficient=0.41) and bone marrow involvement (correlation coefficient=0.36), whereas the canonical TFH cluster (
RHOA, IDH2, TET2/DNMT3A) tended to anti-correlate with
KMT2A-r. In the network view,
KMT2A and
ATR emerged as high-betweenness nodes bridging a DNA-damage repair motif (
ATR–MLH1) and receptor tyrosine-kinase signaling (
KIT), suggestive of crossed stress and growth cues. The decision tree split first on
RHOA (1→
AITL), then used EBV-encoded RNA in situ hybridization and
EZH2 for refinement. Within the
RHOA=0/
EZH2=0 branch,
KMT2A=1 predicted PTCL classification, indicating that
KMT2A is informative, particularly when TFH signals are absent (
Figure 3).
4. Discussion
This two-center study integrated clinicopathologic and genomic data in patients with PTCL-NOS or AITL to examine the impact of
KMT2A-r in nodal PTCL. Our findings align with established TFH biology in AITL and its overlap with PTCL-NOS. Sequencing studies have shown that
RHOA mutations frequently co-occur with mutations in
TET2 (and often
DNMT3A), and that
IDH2 mutations provide a convergent methylation program; together these lesions drive TFH differentiation and the characteristic microenvironment [
22]. The Human Pathology multicenter study further demonstrated that increasing numbers of positive TFH markers track with AITL-like histology and that PTCL-TFH overlaps with, but is not identical to, AITL [
23]. Within that framework, our data place
KMT2A-r outside the TFH cluster and closer to non-TFH PTCL-NOS behavior—consistent with shorter PFS and higher tumor-burden markers.
KMT2A rearrangements have been sparsely investigated in PTCLs. In experimental models, enforced expression of the KMT2A–AF9 fusion is sufficient to induce leukemia, highlighting the strong oncogenic potential of KMT2A fusion proteins [
24]. In our cohort,
KMT2A-rearranged cases correlated with elevated LDH and bone-marrow involvement, features that typically accompany advanced disease. Moreover, correlation-network analysis revealed that
KMT2A alterations frequently co-occurred with other genetic events (for example, ATR), consistent with a heavier overall genomic alteration burden.
Although ASCT in first remission was associated with superior survival in our cohort, a major practical challenge is that durable CR is not reliably achieved with current induction regimens. Therefore, prolonging the first PFS—by selecting front-line chemotherapy that delivers rapid, deep, and sustained disease control—becomes the key determinant of long-term outcome.
BV is an antibody–drug conjugate that targets CD30 and delivers the microtubule poison Monomethyl auristatin E after receptor-mediated internalization, culminating in mitotic arrest and apoptosis. In ECHELON-2, adding BV to CHP significantly improved OS in CD30-positive PTCL; however, the trial was dominated by Anaplastic large cell lymphoma (ALCL), leaving the effect size in non-ALCL subtypes (AITL and PTCL-NOS) less certain. Moreover, across non-ALCL cohorts the predictive value of CD30 intensity has been inconsistent, and CD30 negativity does not invariably preclude benefit [
13,
25]. In our cohort, survival outcomes did not differ by CD30 status, reinforcing the view that CD30 expression—while biologically relevant to the mechanism of BV—may be an imperfect surrogate for clinical benefit in AITL or PTCL-NOS. The positive signal for BV-CHP in
KMT2A-r cases—although exploratory and sample-limited—supports the hypothesis that microtubule-disrupting payloads may be particularly effective when the DNA damage response (DDR) stress is high [
26].
Regarding future treatment strategies, menin inhibitors such as revumenib, which is currently used for the treatment of
KMT2A-rearranged leukemias, may be a potential option [
27]. From a biology-driven standpoint, 5-azacitidine—alone or combined with romidepsin—has shown activity in TFH-derived nodal PTCL (AITL and PTCL-NOS with a TFH phenotype), in which epigenetic lesions involving
DNMT3A and
TET2 are frequent [
9,
28,
29]. Given its comparatively low-intensity profile, this epigenetic approach is a rational option for older, poor-performance patients with
DNMT3A-mutated PTCL-NOS. In contrast, in our series,
KMT2A-rearranged cases clustered away from the canonical TFH program, suggesting limited sensitivity to hypomethylating or histone deacetylase inhibitor combinations and a need for alternative strategies.
This study has certain limitations, including the small sample size, retrospective design, heterogeneous frontline regimens, and the lack of centralized pathologic review for all cases. Additionally, NGS was uniform but targeted; thus, structural variants outside the panel’s scope may have been under-captured. Moreover, our exploratory network and decision-tree analyses illustrate associations rather than causation. Nonetheless, the integration of molecular profiling, immunohistochemistry, and outcomes provides a coherent hypothesis: KMT2A-r identifies a clinically aggressive, TFH-sparse subset of nodal PTCL in which BV-CHP and ASCT may attenuate risk.
Prospective, multicenter validation is needed to refine the prognostic impact of KMT2A-r, delineate partner genes and breakpoint biology, and evaluate tailored regimens, while recognizing that lineage-specific context will determine translatability.
5. Conclusions
KMT2A-r is associated with adverse PFS and clinicogenomic features of aggressive disease in nodal PTCL. It lies largely outside the TFH program and shows connectivity to DDR and receptor tyrosine kinase modules in systems analyses. BV-CHP and ASCT may mitigate risk in selected patients. Larger studies are warranted to validate KMT2A-r as a biomarker and clarify its therapeutic implications.
Supplementary Materials
The following supporting information can be downloaded at the website of this paper posted on Preprints.org, Table S1: Molecular alteration in the study cohort; Table S2: Univariate analysis of the overall survival outcomes of patients with PTCL-NOS and AITL.
Author Contributions
Conceptualization, T.Y.K. and Y.-W.J.; methodology, T.Y.K.; validation, G.J.M. and S.-G.C.; formal analysis, T.Y.K.; data curation and resources, T.J.K., E.J.H.—original draft preparation, T.Y.K; writing review and editing, Y.-W.J., T.-J.K., E.J.H., G.J.M., and S.-G.C.; supervision, Y.-W.J.; project administration, Y.-W.J. All authors have read and agreed to the published version of the manuscript.
Funding
This research received no external funding.
Institutional Review Board Statement
The study was conducted in accordance with the Declaration of Helsinki and approved by the Institutional Review Board and Ethics Committee of the Catholic Medical Center, South Korea (approval numbers: XC25RIDI0050).
Informed Consent Statement
The requirement for patient consent was waived because of the retrospective design of the study.
Data Availability Statement
The original data presented in the study are openly available in Dryad (Dataset DOI: 10.5061/dryad.c866t1gm9).
Acknowledgments
Not applicable.
Conflicts of Interest
The authors declare no conflicts of interest.
Abbreviations
The following abbreviations are used in this manuscript:
| AITL |
Angioimmunoblastic T-cell lymphoma |
| PTCL-NOS |
Peripheral T-cell lymphoma, not otherwise specified |
| NGS |
Next-generation sequencing |
| FFPE |
Formalin-fixed, paraffin-embedded |
| PCR |
Polymerase chain reaction |
| DDR |
DNA damage response |
| |
|
| BV |
Brentuximab vedotin |
| BV-CHP |
Brentuximab vedotin plus cyclophosphamide, doxorubicin, and prednisone |
| ASCT |
Autologous stem cell transplantation |
| TFH |
T-follicular helper (cell) |
| LDH |
Lactate dehydrogenase |
| ECOG PS |
Eastern Cooperative Oncology Group performance status |
| ALCL |
Anaplastic large cell lymphoma |
| EBER |
EBV-encoded RNA in situ hybridization |
| IPI |
International Prognostic Index |
| HR |
Hazard ratio |
| CI |
Confidence interval |
| PFS |
Progression-free survival |
| OS |
Overall survival |
|
KMT2A-r |
KMT2A rearrangement |
| CHP |
Cyclophosphamide, doxorubicin, and prednisone |
| CR |
Complete remission |
References
- Bellei, M.; Chiattone, C.S.; Luminari, S.; Pesce, E.A.; Cabrera, M.E.; de Souza, C.A.; Gabús, R.; Zoppegno, L.; Zoppegno, L.; Milone, J. , et al. T-cell lymphomas in South America and Europe. Rev. Bras. Hematol. Hemoter. 2012, 34, 42–47. [Google Scholar] [CrossRef]
- Vega, F.; Medeiros, L.J. A suggested immunohistochemical algorithm for the classification of T-cell lymphomas involving lymph nodes. Hum. Pathol. 2020, 102, 104–116. [Google Scholar] [CrossRef] [PubMed]
- Swerdlow, S.H.; Campo, E.; Pileri, S.A.; Harris, N.L.; Stein, H.; Siebert, R.; Advani, R.; Ghielmini, M.; Salles, G.A.; Zelenetz, A.D. , et al. The 2016 revision of the World Health Organization classification of lymphoid neoplasms. Blood 2016, 127, 2375–2390. [Google Scholar] [CrossRef] [PubMed]
- Paik, J.H.; Koh, J.; Han, B.; Kim, S.; Lee, K.R.; Lee, S.; Lee, J.O.; Kim, T.M.; Kim, W.Y.; Jeon, Y.K. Distinct and overlapping features of nodal peripheral T-cell lymphomas exhibiting a follicular helper T-cell phenotype: a multicenter study emphasizing the clinicopathological significance of follicular helper T-cell marker expression. Hum. Pathol. 2023, 131, 47–60. [Google Scholar] [CrossRef] [PubMed]
- Dobson, R.; Du, P.Y.; Rásó-Barnett, L.; Yao, W.Q.; Chen, Z.; Casa, C.; Ei-Daly, H.; Farkas, L.; Soilleux, E.; Wright, P. , et al. Early detection of T-cell lymphoma with T follicular helper phenotype by RHOA mutation analysis. Haematologica 2022, 107, 489–499. [Google Scholar] [CrossRef]
- Leca, J.; Lemonnier, F.; Meydan, C.; Foox, J.; El Ghamrasni, S.; Mboumba, D.L.; Duncan, G.S.; Fortin, J.; Sakamoto, T.; Tobin, C. , et al. IDH2 and TET2 mutations synergize to modulate T Follicular Helper cell functional interaction with the AITL microenvironment. Cancer Cell 2023, 41, 323–339.e10. [Google Scholar] [CrossRef]
- Couronné, L.; Bastard, C.; Bernard, O.A. TET2 and DNMT3A mutations in human T-cell lymphoma. N. Engl. J. Med. 2012, 366, 95–96. [Google Scholar] [CrossRef]
- Cortes, J.R.; Ambesi-Impiombato, A.; Couronné, L.; Quinn, S.A.; Kim, C.S.; da Silva Almeida, A.C.; West, Z.; Belver, L.; Martin, M.S.; Scourzic, L. , et al. RHOA G17V induces t follicular helper cell specification and promotes lymphomagenesis. Cancer Cell 2018, 33, 259–273.e7. [Google Scholar] [CrossRef]
- Lemonnier, F.; Dupuis, J.; Sujobert, P.; Tournillhac, O.; Cheminant, M.; Sarkozy, C.; Pelletier, L.; Marçais, A.; Robe, C.; Fataccioli, V. , et al. Treatment with 5-azacytidine induces a sustained response in patients with angioimmunoblastic T-cell lymphoma. Blood 2018, 132, 2305–2309. [Google Scholar] [CrossRef]
- Vallois, D.; Dobay, M.P.; Morin, R.D.; Lemonnier, F.; Missiaglia, E.; Juilland, M.; Iwaszkiewicz, J.; Fataccioli, V.; Bisig, B.; Roberti, A. , et al. Activating mutations in genes related to TCR signaling in angioimmunoblastic and other follicular helper T-cell-derived lymphomas. Blood 2016, 128, 1490–1502. [Google Scholar] [CrossRef]
- Rao, R.C.; Dou, Y. Hijacked in cancer: the KMT2 (MLL) family of methyltransferases. Nat. Rev. Cancer 2015, 15, 334–346. [Google Scholar] [CrossRef]
- Montserrat, E.; García-Conde, J.; Viñolas, N.; López-Guillermo, A.; Hernández-Nieto, L.; Zubizarreta, A.; Maldonado, J.; Alcalá, A.; Faura, M.V.; Llorente, A. , et al. CHOP vs. ProMACE-CytaBOM in the treatment of aggressive non-Hodgkin's lymphomas: long-term results of a multicenter randomized trial. (PETHEMA: Spanish Cooperative Group for the Study of Hematological Malignancies Treatment, Spanish Society of Hematology). Eur. J. Haematol. 1996, 57, 377–383. [Google Scholar] [CrossRef]
- Horwitz, S.; O'Connor, O.A.; Pro, B.; Trümper, L.; Iyer, S.; Advani, R.; Bartlett, N.L.; Christensen, J.H.; Morschhauser, F.; Domingo-Domenech, E. , et al. The ECHELON-2 Trial: 5-year results of a randomized, phase III study of brentuximab vedotin with chemotherapy for CD30-positive peripheral T-cell lymphoma. Ann. Oncol. 2022, 33, 288–298. [Google Scholar] [CrossRef] [PubMed]
- Sibon, D. Peripheral T-Cell Lymphomas: Therapeutic Approaches. Cancers (Basel) 2022, 14, 2332. [Google Scholar] [CrossRef] [PubMed]
- Younes, A.; Hilden, P.; Coiffier, B.; Hagenbeek, A.; Salles, G.; Wilson, W.; Seymour, J.F.; Kelly, K.; Gribben, J.; Pfreunschuh, M. , et al. International Working Group consensus response evaluation criteria in lymphoma (RECIL 2017). Ann. Oncol. 2017, 28, 1436–1447. [Google Scholar] [CrossRef] [PubMed]
- Yoon, J.H.; Min, G.J.; Park, S.S.; Jeon, Y.W.; Lee, S.E.; Cho, B.S.; Eom, K.S.; Kim, Y.J.; Lee, S.; Kim, H.J. , et al. Autologous hematopoietic cell transplantation using dose-reduced intravenous busulfan, melphalan, and thiotepa for high-risk or relapsed lymphomas. Bone Marrow Transplant 2019, 54, 330–333. [Google Scholar] [CrossRef]
- Csardi, G.; Nepusz, T.; Traag, V.; Horvát, S.; Zanini, F.; Noom, D.; Müller, K. igraph: Network analysis and visualization in R. 2024. R package version, 2.
- Therneau, T.M.; Atkinson, B. rpart: Recursive partitioning and regression trees. 2024.
- Timmins, M.A.; Wagner, S.D.; Ahearne, M.J. The new biology of PTCL-NOS and AITL: current status and future clinical impact. Br. J. Haematol. 2020, 189, 54–66. [Google Scholar] [CrossRef]
- Kim, T.Y.; Min, G.J.; Jeon, Y.W.; Park, S.S.; Park, S.; Shin, S.H.; Yahng, S.A.; Yoon, J.H.; Lee, S.E.; Cho, B.S. , et al. Impact of Epstein-Barr virus on peripheral T-cell lymphoma not otherwise specified and angioimmunoblastic T-cell lymphoma. Front. Oncol. 2021, 11, 797028. [Google Scholar] [CrossRef]
- Park, S.I.; Horwitz, S.M.; Foss, F.M.; Pinter-Brown, L.C.; Carson, K.R.; Rosen, S.T.; Pro, B.; Hsi, E.D.; Federico, M.; Gisselbrecht, C. , et al. The role of autologous stem cell transplantation in patients with nodal peripheral T-cell lymphomas in first complete remission: Report from COMPLETE, a prospective, multicenter cohort study. Cancer 2019, 125, 1507–1517. [Google Scholar] [CrossRef]
- Odejide, O.; Weigert, O.; Lane, A.A.; Toscano, D.; Lunning, M.A.; Kopp, N.; Kim, S.; van Bodegom, D.; Bolla, S.; Schatz, J.H. , et al. A targeted mutational landscape of angioimmunoblastic T-cell lymphoma. Blood 2014, 123, 1293–1296. [Google Scholar] [CrossRef]
- Martín García-Sancho, A.; Rodríguez-Pinilla, S.M.; Domingo-Domenech, E.; Climent, F.; Sánchez-Garcia, J.; López Jiménez, J.; García-Cosío Piqueras, M.; Castellvi, J.; González, A.J.; González de Villambrosia, S. , et al. Peripheral T-cell lymphoma with a T follicular-helper phenotype: A different entity? Results of the Spanish Real-T study. Br. J. Haematol. 2023, 203, 182–193. [Google Scholar] [CrossRef]
- Chen, W.; Kumar, A.R.; Hudson, W.A.; Li, Q.; Wu, B.; Staggs, R.A.; Lund, E.A.; Sam, T.N.; Kersey, J.H. Malignant transformation initiated by Mll-AF9: gene dosage and critical target cells. Cancer Cell 2008, 13, 432–440. [Google Scholar] [CrossRef]
- Jagadeesh, D.; Horwitz, S.; Bartlett, N.L.; Kim, Y.; Jacobsen, E.; Duvic, M.; Little, M.; Trepicchio, W.; Fenton, K.; Onsum, M. , et al. Response to brentuximab vedotin by CD30 expression in non-Hodgkin lymphoma. Oncologist 2022, 27, 864–873. [Google Scholar] [CrossRef]
- Pilié, P.G.; Tang, C.; Mills, G.B.; Yap, T.A. State-of-the-art strategies for targeting the DNA damage response in cancer. Nat. Rev. Clin. Oncol. 2019, 16, 81–104. [Google Scholar] [CrossRef]
- Issa, G.C.; Aldoss, I.; Thirman, M.J.; DiPersio, J.; Arellano, M.; Blachly, J.S.; Mannis, G.N.; Perl, A.; Dickens, D.S.; McMahon, C.M. , et al. Menin inhibition with revumenib for KMT2A-rearranged relapsed or refractory acute leukemia (AUGMENT-101). J. Clin. Oncol. 2025, 43, 75–84. [Google Scholar] [CrossRef]
- Falchi, L.; Ma, H.; Klein, S.; Lue, J.K.; Montanari, F.; Marchi, E.; Deng, C.; Kim, H.A.; Rada, A.; Jacob, A.T. , et al. Combined oral 5-azacytidine and romidepsin are highly effective in patients with PTCL: a multicenter phase 2 study. Blood 2021, 137, 2161–2170. [Google Scholar] [CrossRef]
- O'Connor, O.A.; Falchi, L.; Lue, J.K.; Marchi, E.; Kinahan, C.; Sawas, A.; Deng, C.; Montanari, F.; Amengual, J.E.; Kim, H.A. , et al. Oral 5-azacytidine and romidepsin exhibit marked activity in patients with PTCL: a multicenter phase 1 study. Blood 2019, 134, 1395–1405. [Google Scholar] [CrossRef] [PubMed]
Figure 1.
Survival according to histology, and initial regimen, and ASCT. Kaplan–Meier curves for OS and PFS by (A, B) histology (AITL vs. PTCL-NOS), (C, D) initial regimen (BV-CHP vs. non-BV-CHP), and (E, F) ASCT use. Tick marks denote censoring; numbers at risk are shown below the axes. OS, overall survival; PFS, progression-free survival; AITL, angioimmunoblastic T-cell lymphoma; PTCL-NOS, peripheral T-cell lymphoma, not otherwise specified; BV-CHP, brentuximab vedotin + cyclophosphamide, doxorubicin, and prednisone; ASCT, autologous stem-cell transplantation.
Figure 2.
Genomic landscape and outcome by KMT2A rearrangement (KMT2A-r) (A) Oncoprint summarizing alteration frequencies (rows) across cases (columns), colored based on histology (B) OS by KMT2A-r (positive vs negative) (C) PFS by regimen (BV-CHP vs. non-BV-CHP) in KMT2A-r positive group. OS, overall survival; PFS, progression-free survival; AITL, angioimmunoblastic T-cell lymphoma; PTCL, peripheral T-cell lymphoma; BV-CHP, brentuximab vedotin + cyclophosphamide, doxorubicin, and prednisone; neg, negative; pos, positive.
Figure 3.
Clinicogenomic map (A) Correlation heatmap across clinical and genomic features (B) Gene co-variation network with betweenness highlighting (Top vs. Rest) (C) rpart decision tree separating AITL vs. PTCL using binary features (1=present) AITL, angioimmunoblastic T-cell lymphoma; PTCL, peripheral T-cell lymphoma; LDH, lactate dehydrogenase; ECOG, Eastern Cooperative Oncology Group; KMT2A-r, KMT2A rearrangement; BM, bone marrow; mut, mutation; EBER, EBV-encoded RNA in situ hybridization.
Table 1.
Baseline characteristics according to histology (AITL vs. PTCL-NOS).
Table 1.
Baseline characteristics according to histology (AITL vs. PTCL-NOS).
| Variables |
Total
(n=37) |
AITL
(n=14) |
PTCL
(n=23) |
P-value
|
| Sex, N (%) |
|
|
|
0.64 |
| Female |
18 (48.6) |
8 (57.1) |
10 (43.5) |
|
| Male |
19 (51.4) |
6 (42.9) |
13 (56.5) |
|
| Diagnosed Age |
|
|
|
0.76 |
| ≤60 years |
21 (56.8) |
7 (50.0) |
14 (60.9) |
|
| >60 years |
16 (43.2) |
7 (50.0) |
9 (39.1) |
|
| Ann Arbor stage |
|
|
|
0.65 |
| I–II |
3 (8.1) |
2 (14.3) |
1 (4.3) |
|
| III–IV |
34 (91.9) |
12 (85.7) |
22 (95.7) |
|
| ECOG2 |
|
|
|
0.698 |
| <2 |
32 (86.5) |
13 (92.9) |
19 (82.6) |
|
| ≥2 |
5 (13.5) |
1 (7.1) |
4 (17.4) |
|
| Lactate dehydrogenase |
|
|
|
0.124 |
| Normal |
14 (37.8) |
8 (57.1) |
6 (26.1) |
|
| Elevated |
23 (62.2) |
6 (42.9) |
17 (73.9) |
|
| Extranodal site involvement |
|
|
|
0.76 |
| <2 |
16 (43.2) |
7 (50.0) |
9 (39.1) |
|
| ≥2 |
21 (56.8) |
7 (50.0) |
14 (60.9) |
|
| Bone marrow involvement |
|
|
|
0.417 |
| Negative |
22 (59.5) |
10 (71.4) |
12 (52.2) |
|
| Positive |
15 (40.5) |
4 (28.6) |
11 (47.8) |
|
The International Prognostic Index for
Non-Hodgkin’s lymphoma |
|
|
|
0.526 |
| Low or Low-Intermediate risk |
20 (54.1) |
9 (64.3) |
11 (47.8) |
|
| High-Intermediate or High risk |
17 (45.9) |
5 (35.7) |
12 (52.2) |
|
| T-follicular helper type |
|
|
|
0.168 |
| Negative |
32 (86.5) |
14 (100.0) |
18 (78.3) |
|
| Positive |
5 (13.5) |
0 (0.0) |
5 (21.7) |
|
| Frontline regimen |
|
|
0.699 |
| BV-CHP |
8 (21.6) |
2 (14.3) |
6 (26.1) |
|
| CHOP/CHOEP |
17 (45.9) |
7 (50.0) |
10 (43.5) |
|
| ProMACE-CytaBOM |
12 (32.4) |
5 (35.7) |
7 (30.4) |
|
| ASCT |
|
|
|
0.083 |
| No |
26 (70.3%) |
7 (50.0%) |
19 (82.6%) |
|
| Yes |
11 (29.7%) |
7 (50.0%) |
4 (17.4%) |
|
| Immunophenotype |
|
|
|
|
| Epstein–Barr virus-encoded RNAs |
|
|
|
0.14 |
| Negative |
12 (32.4) |
2 (14.3) |
10 (43.5) |
|
| Positive |
25 (67.6) |
12 (85.7) |
13 (56.5) |
|
| CD30 |
|
|
|
0.394 |
| Negative |
29 (80.6) |
9 (69.2) |
20 (87.0) |
|
| Positive |
7 (19.4) |
4 (30.8) |
3 (13.0) |
|
| CD10 |
|
|
|
0.001 |
| Negative |
26 (74.3) |
5 (38.5) |
21 (95.5) |
|
| Positive |
9 (25.7) |
8 (61.5) |
1 (4.5) |
|
| CD21 |
|
|
|
0.001 |
| Negative |
19 (54.3) |
1 (7.1) |
18 (85.7) |
|
| Positive |
16 (45.7) |
13 (92.9) |
3 (14.3) |
|
| CD23 |
|
|
|
0.011 |
| Negative |
10 (45.5) |
3 (21.4) |
7 (87.5) |
|
| Positive |
12 (54.5) |
11 (78.6) |
1 (12.5) |
|
| BCL6 |
|
|
|
0.004 |
| Negative |
13 (39.4) |
1 (7.1) |
12 (63.2) |
|
| Positive |
20 (60.6) |
13 (92.9) |
7 (36.8) |
|
| PD1 |
|
|
|
0.014 |
| Negative |
9 (25.7) |
0 (0.0) |
9 (42.9) |
|
| Positive |
26 (74.3) |
14 (100.0) |
12 (57.1) |
|
| Ki-67 proliferation index |
64.9±21.8 |
65.4±22.9 |
64.6±21.7 |
0.917 |
| Next-generation sequencing |
|
|
|
|
| ATR |
|
|
|
0.288 |
| Unmutated |
21 (56.8) |
10 (71.4) |
11 (47.8) |
|
| Mutated |
16 (43.2) |
4 (28.6) |
12 (52.2) |
|
|
KMT2A rearrangement |
|
|
|
0.132 |
| Negative |
28 (75.7) |
13 (92.9) |
15 (65.2) |
|
| Positive |
9 (24.3) |
1 (7.1) |
8 (34.8) |
|
| RHOA |
|
|
|
0.014 |
| Unmutated |
30 (81.1) |
8 (57.1) |
22 (95.7) |
|
| Mutated |
7 (18.9) |
6 (42.9) |
1 (4.3) |
|
| DNMT3A |
|
|
|
0.833 |
| Unmutated |
31 (83.8) |
11 (78.6) |
20 (87.0) |
|
| Mutated |
6 (16.2) |
3 (21.4) |
3 (13.0) |
|
| TCF7L2 |
|
|
|
0.698 |
| Unmutated |
32 (86.5) |
13 (92.9) |
19 (82.6) |
|
| Mutated |
5 (13.5) |
1 (7.1) |
4 (17.4) |
|
| IDH2 |
|
|
|
0.111 |
| Unmutated |
32 (86.5) |
10 (71.4) |
22 (95.7) |
|
| Mutated |
5 (13.5) |
4 (28.6) |
1 (4.3) |
|
| TP53 |
|
|
|
0.698 |
| Unmutated |
32 (86.5) |
13 (92.9) |
19 (82.6) |
|
| Mutated |
5 (13.5) |
1 (7.1) |
4 (17.4) |
|
| TET2 |
|
|
|
>0.999 |
| Unmutated |
33 (89.2) |
12 (85.7) |
21 (91.3) |
|
| Mutated |
4 (10.8) |
2 (14.3) |
2 (8.7) |
|
Table 2.
Univariate Cox analysis for progression-free survival.
Table 2.
Univariate Cox analysis for progression-free survival.
| Variables |
HR (95% CI) |
P-value |
| PTCL-NOS vs. AITL |
2 (0.85, 4.68) |
0.111 |
| Female vs. Male |
0.52 (0.23, 1.14) |
0.102 |
| Age >60 years vs. ≤60 |
1.01 (0.47, 2.19) |
0.979 |
| Ann Arbor stage, III–IV vs. I–II |
3.14 (0.42, 23.4) |
0.263 |
| ECOG PS ≥2 vs. <2 |
2.62 (0.86, 8.03) |
0.092 |
| LDH elevation vs. normal |
3.1 (1.27, 7.58) |
0.013 |
| Extranodal site involvement, ≥2 vs. <2 |
1.57 (0.71, 3.49) |
0.266 |
| Bone marrow involvement, positive vs. negative |
2.98 (1.25, 7.08) |
0.014 |
| IPI score ≥3 vs. <3 |
1.74 (0.79, 3.82) |
0.167 |
| TFH phenotype, yes or no |
1.74 (0.65, 4.68) |
0.269 |
| Frontline regimen: BV-CHP vs. others |
0.56 (0.19, 1.61) |
0.28 |
| EBER positive vs. negative |
0.56 (0.25, 1.28) |
0.169 |
|
ATR mutation vs. unmutated |
1.48 (0.68, 3.22) |
0.327 |
|
KMT2A rearranged, yes vs. no |
2.56 (1.02, 6.45) |
0.046 |
|
RHOA mutation vs. unmutated |
1.33 (0.53, 3.33) |
0.542 |
|
DNMT3A mutation vs. unmutated |
2.28 (0.90, 5.81) |
0.083 |
|
TCF7L2 mutation vs. unmutated |
1.23 (0.42, 3.61) |
0.705 |
|
IDH2 mutation vs. unmutated |
2.05 (0.75, 5.56) |
0.16 |
|
TP53 mutation vs. unmutated |
1.58 (0.54, 4.65) |
0.402 |
|
TET2 mutation vs. unmutated |
1.79 (0.61, 5.30) |
0.29 |
|
Disclaimer/Publisher’s Note: The statements, opinions and data contained in all publications are solely those of the individual author(s) and contributor(s) and not of MDPI and/or the editor(s). MDPI and/or the editor(s) disclaim responsibility for any injury to people or property resulting from any ideas, methods, instructions or products referred to in the content. |
© 2025 by the authors. Licensee MDPI, Basel, Switzerland. This article is an open access article distributed under the terms and conditions of the Creative Commons Attribution (CC BY) license (http://creativecommons.org/licenses/by/4.0/).