
Submitted:
11 December 2023
Posted:
11 December 2023
You are already at the latest version
Abstract
Background: Cell-free DNA (cfDNA) analysis has become a promising tool for diagnosis, prognosis and monitoring of lymphoma cases. Until now, research in this area has mainly focused in aggressive lymphomas with scanty information from other lymphoma subtypes. Methods: We selected 256 patients diagnosed with lymphomas including a large variety of B-cell and T-cell non-Hodgkin and Hodgkin lymphomas and quantified cfDNA from plasma at the time of diagnosis. We further selected 49 large B cell lymphomas (LBCL) and analyzed cfDNA levels at diagnosis (pre-therapy) and after therapy. In addition, we performed NGS in cfDNA and tissue in this cohort of LBCL. Results: Lymphoma patients showed a statistically significant higher cfDNA concentration than healthy controls (mean 53.0 ng/mL vs 5.6 ng/mL, p <0.001). The cfDNA concentration correlated with lymphoma subtype, lactate dehydrogenase, International Prognostic Index (IPI) score, Ann Arbor (AA) and B-symptoms. In 49 LBCL cases, the cfDNA concentration decreased after therapy in cases who achieved complete response (CR), and increased in non-responders. The median cfDNA at diagnosis of patients who achieved CR and later relapsed was higher (81.5 ng/mL) compared with levels of those who did not (38.6 ng/mL). A concordance of 84% was observed between NGS results in tumor and cfDNA samples. Higher VAF in cfDNA correlated with advanced stage and bulky disease. Conclusions: cfDNA analysis can be easily performed in almost all lymphoma cases. The cfDNA concentration correlated with the characteristics of aggressiveness of the lymphomas and in LBCL with the response achieved after therapy. These results support the utility of cfDNA analysis as a complementary tool in the management of lymphoma patients.
Keywords:
cfDNA
; Liquid biopsy
; Lymphoma
; monitoring
1. Introduction
Cell-free DNA (cfDNA) are short double-stranded DNA fragments (~166 base pairs) present in the circulation as a result of its release following cell death (by apoptosis, necrosis or pyroptosis) and active cell secretion as microvesicles [1,2,3]. The amount of cfDNA in plasma is variable among individuals, and may be modified by physiological situations like physical exercise or pregnancy and also chronic conditions such as cirrhosis or renal dysfunction, although several studies have reported that cfDNA mainly originates from hematopoietic cells [4,5,6,7]. One of the main interests in the analysis of cfDNA is focused on the fact that cancer patients have higher amounts of cfDNA than healthy subjects and that levels of cfDNA may change after exposure to radiotherapy or chemotherapy [8,9,10]. The cfDNA derived from cancer cells is known as circulating tumoral DNA (ctDNA). The opportunity to analyze the cfDNA present in the liquid compartments of the organism has generated the concept of liquid biopsy and has opened up an opportunity to improve the diagnosis and management of different cancer types.
In the lymphoma setting, the value of cfDNA has been mainly studied in diffuse large B cell lymphoma (DLBCL) [11,12,13], and Hodgkin lymphoma [14,15], but there is limited information in other lymphoma subtypes at the time of diagnosis.
Moreover, cfDNA is being postulated as an opportunity to monitor minimal residual disease and to detect treatment failure or resistance [16,17]. In DLBCL, the study of cfDNA in plasma allows the identification of patients at risk of relapse 3.5 months before clinical evidence of disease, suggesting to be a useful biomarker in this setting [11].
The aim of this work was to assess the amount of cfDNA at diagnosis in a cohort of 256 patients with several lymphoma entities from a single institution. Moreover, we carried out a sub-study in a cohort of 49 LBCL patients to analyze the molecular profile by Next Generation Sequencing (NGS) in tissue and in liquid biopsy, as well as the kinetics of cfDNA levels after first-line therapy.
2. Material and Methods
2.1. Patient Selection and Study Design
This is a retrospective single-center study including patients diagnosed with any subtype of lymphoma between January 2015 to March 2019 in Hospital del Mar. The study was carried out in agreement with the Declaration of Helsinki and the International Conference on Harmonization Guidelines for Good Clinical Practice, and was approved by the local ethics committee. Patients gave informed consent for blood sample collection at diagnosis and during follow-up.
The diagnosis was made by histopathological and immunophenotypical studies of lymph nodes, extranodal tumors and/or trephine bone marrow biopsies, according to the WHO revised 4th edition [18].
256 lymphoma cases were included: 88 (34.8%) large B cell lymphomas (LBCL) (60 diffuse LBCL not otherwise specified (DLBCL-NOS), 13 transformations from indolent B-cell lymphoma (tDLBCL), 7 primary mediastinal LBCL (PML), 5 primary LBCL of the central nervous system (DLBCL-CNS) and 3 high grade B-cell lymphomas with MYC and BCL2 rearrangement (HGBL)); 48 (18.8%) follicular lymphomas (FL); 35 (13.7%) marginal zone lymphomas (MZL) (21 extranodal MZL, 11 splenic MZL, 3 nodal MZL); 31 (12.1%) classic Hodgkin lymphomas (cHL); 14 (5.5%) mantle cell lymphomas (MCL); 7 (2.7%) small lymphocytic lymphoma/chronic lymphocytic leukemia (SLL/CLL); 5 (2.0%) lymphoplasmacytic lymphoma/Waldenström macroglobulinemia (LpL/WM); 1 (0,4%) Burkitt lymphoma; 6 (2.3%) circulating low grade unclassifiable B-cell lymphomas (LPS-NOS); 9 (3.5%) angioimmunoblastic T-cell lymphoma (AITL); 6 other T-cell lymphomas (2.3%; 2 anaplastic T-cell lymphomas of the skin, 1 primary cutaneous gamma/delta T-cell lymphoma, 1 peripheral T-cell lymphoma not otherwise specified, 1 transformed mycosis fungoides and 1 T-cell prolymphocytic leukemia) and 6 others (2.3%; 5 HIV positive B-cell lymphomas and 1 interdigitating dendritic cell sarcoma). In addition, 33 healthy subject controls were also included.
2.2. Sample Collection, cfDNA Isolation and Quantification
After every patient signed the informed consent and before the start of any kind of therapy, 10 mL of whole blood was collected in EDTA tubes. Within the first 4 hours after extraction, the tubes were centrifuged two times at 2800 rpm for 10 min. Plasma was collected and used for immediate extraction of cfDNA or stored at -80 ºC.
cfDNA isolation was performed with the MagMax cell-free DNA isolation kit (Thermo Fisher Scientific, Foster City, USA) following the recommendations of the manufacturer. cfDNA was quantified using Qubit (Thermo Fisher Scientific, Waltham, MA) and analysed by electrophoresis to discard the presence of genomic DNA (4200 TapeStation system, Agilent, Santa Clara, USA).
2.3. Next Generation Sequencing (NGS)
Molecular characterization was performed in tissue and cfDNA by NGS using 10-40 ng of cfDNA or 120 ng of DNA from FFPE samples. Libraries were prepared using a custom panel that covered the whole codifying region of 36 lymphoid-associated genes (QIAseq Custom DNA Panels, Qiagen): ARID1A, ATP6AP1, B2M, BCL2, BCL7A, CARD11, CCND3, CD58, CD79B, CDKN2A, CREBBP, EBF1, EP300, EZH2, FAS, FOXO1, GNA13, HIST1H1E, ID3, IDH2, IGLL5, KMT2D, MEF2B, MYD88, PIM1, PRDM1, RHOA, RRAGG, SGK1, SOCS1, STAT6, TCF3, TET2, TNFAIP3, TNFRSF14 and TP53. Library preparation incorporated unique molecular identifiers (UMIs) to tag individual DNA molecules, which enables high confidence variant detection by reducing false positives, PCR artefacts and library bias. This library preparation system is based on primer extension and allows analysis of short-sized fragments of cfDNA. Libraries were sequenced with 2x150-bp paired-end reads using NextSeq (Illumina, San Diego, CA, USA) with a 3000x minimum read depth for tissue and 6000x for plasma.
Sequencing files were processed using the GeneGlobe Data Analysis Center (Qiagen) for FASTQ trimming, alignment to the reference genome and generation of variant calling files (.vcf) (smCounter2, Qiagen). The obtained variants were then annotated and classified using Illumina VariantStudio 3.0 software according to genomic databases (GenomAD, Varsome, cBioPortal, dbSNP, COSMIC, My Cancer Genome, Cancer Genome Interpreter) and evidence of pathogenicity in the literature. Only variants classified as pathogenic or likely pathogenic were included in this study. The limit of detection established for variant detection was 5% variant allele frequency (VAF) in FFPE samples and 2% in cfDNA. Variants detected in the tissue were then sought in the paired plasma sample. In cases with low VAF, variants were confirmed visually using the Integrative Genomics Viewer (IGV) v2.8.9 software.
2.4. Statistical Analysis
Analysis of the amount of cfDNA was performed for the entire cohort and correlated with the major clinical characteristics. For the description and analysis of categorical variables descriptive statistics, Pearson’s X2 or Fisher’s exact tests were used. For continuous variables the Mann-Whitney U-test and Kruskal-Wallis test were used. The overall survival (OS) was established from the date of diagnosis until the date of last visit or dead; to calculate the progression free survival (PFS) the date of starting therapy and the date of confirmed progression or relapse was used. Survival curves were estimated using the Kaplan-Meier method with 95% interval of confidence (IC). A sub-analysis focused on LBCL patients with samples taken at diagnosis and after therapy with R-CHOP/anthracyclin-containing immunochemotherapies was made. The response assessment in LBCL was performed using PET-CT scan according to Lugano criteria. The statistical significance of the analysis was determined by the long-rank method and two-tailed P-values of 0.05 or less were considered significant. All the analysis was performed using the SPSS V20.0 software package (Chicago, IL, USA) and R (RStudio Version 1.4.1106).
3. Results
3.1. Levels of cfDNA According to Clinical Characteristics and Lymphoma Subtype
From the 256 patients included in the study, cfDNA was quantifiable after extraction from 1 mL of plasma in 249 (97.3%) cases. In 7 cases, cfDNA presence was undetectable by fluorometric analysis, which were mainly localized lymphomas according to Ann Arbor (AA) stage: 1 cHL (stage II), 5 MZL (1 nodal, stage II; 4 MALT: 1 gastric, stage II; 1 intestinal, stage I; 1 conjunctival, stage I and 1 primary cutaneous, stage I) and 1 FL grade 2 (stage III). The main clinical characteristics of the 249 cases with evaluable cfDNA are listed in Table 1. With respect to controls, 18 cases (55%) were females and 15 (45%) males, with a median age of 59 (51–69) years.
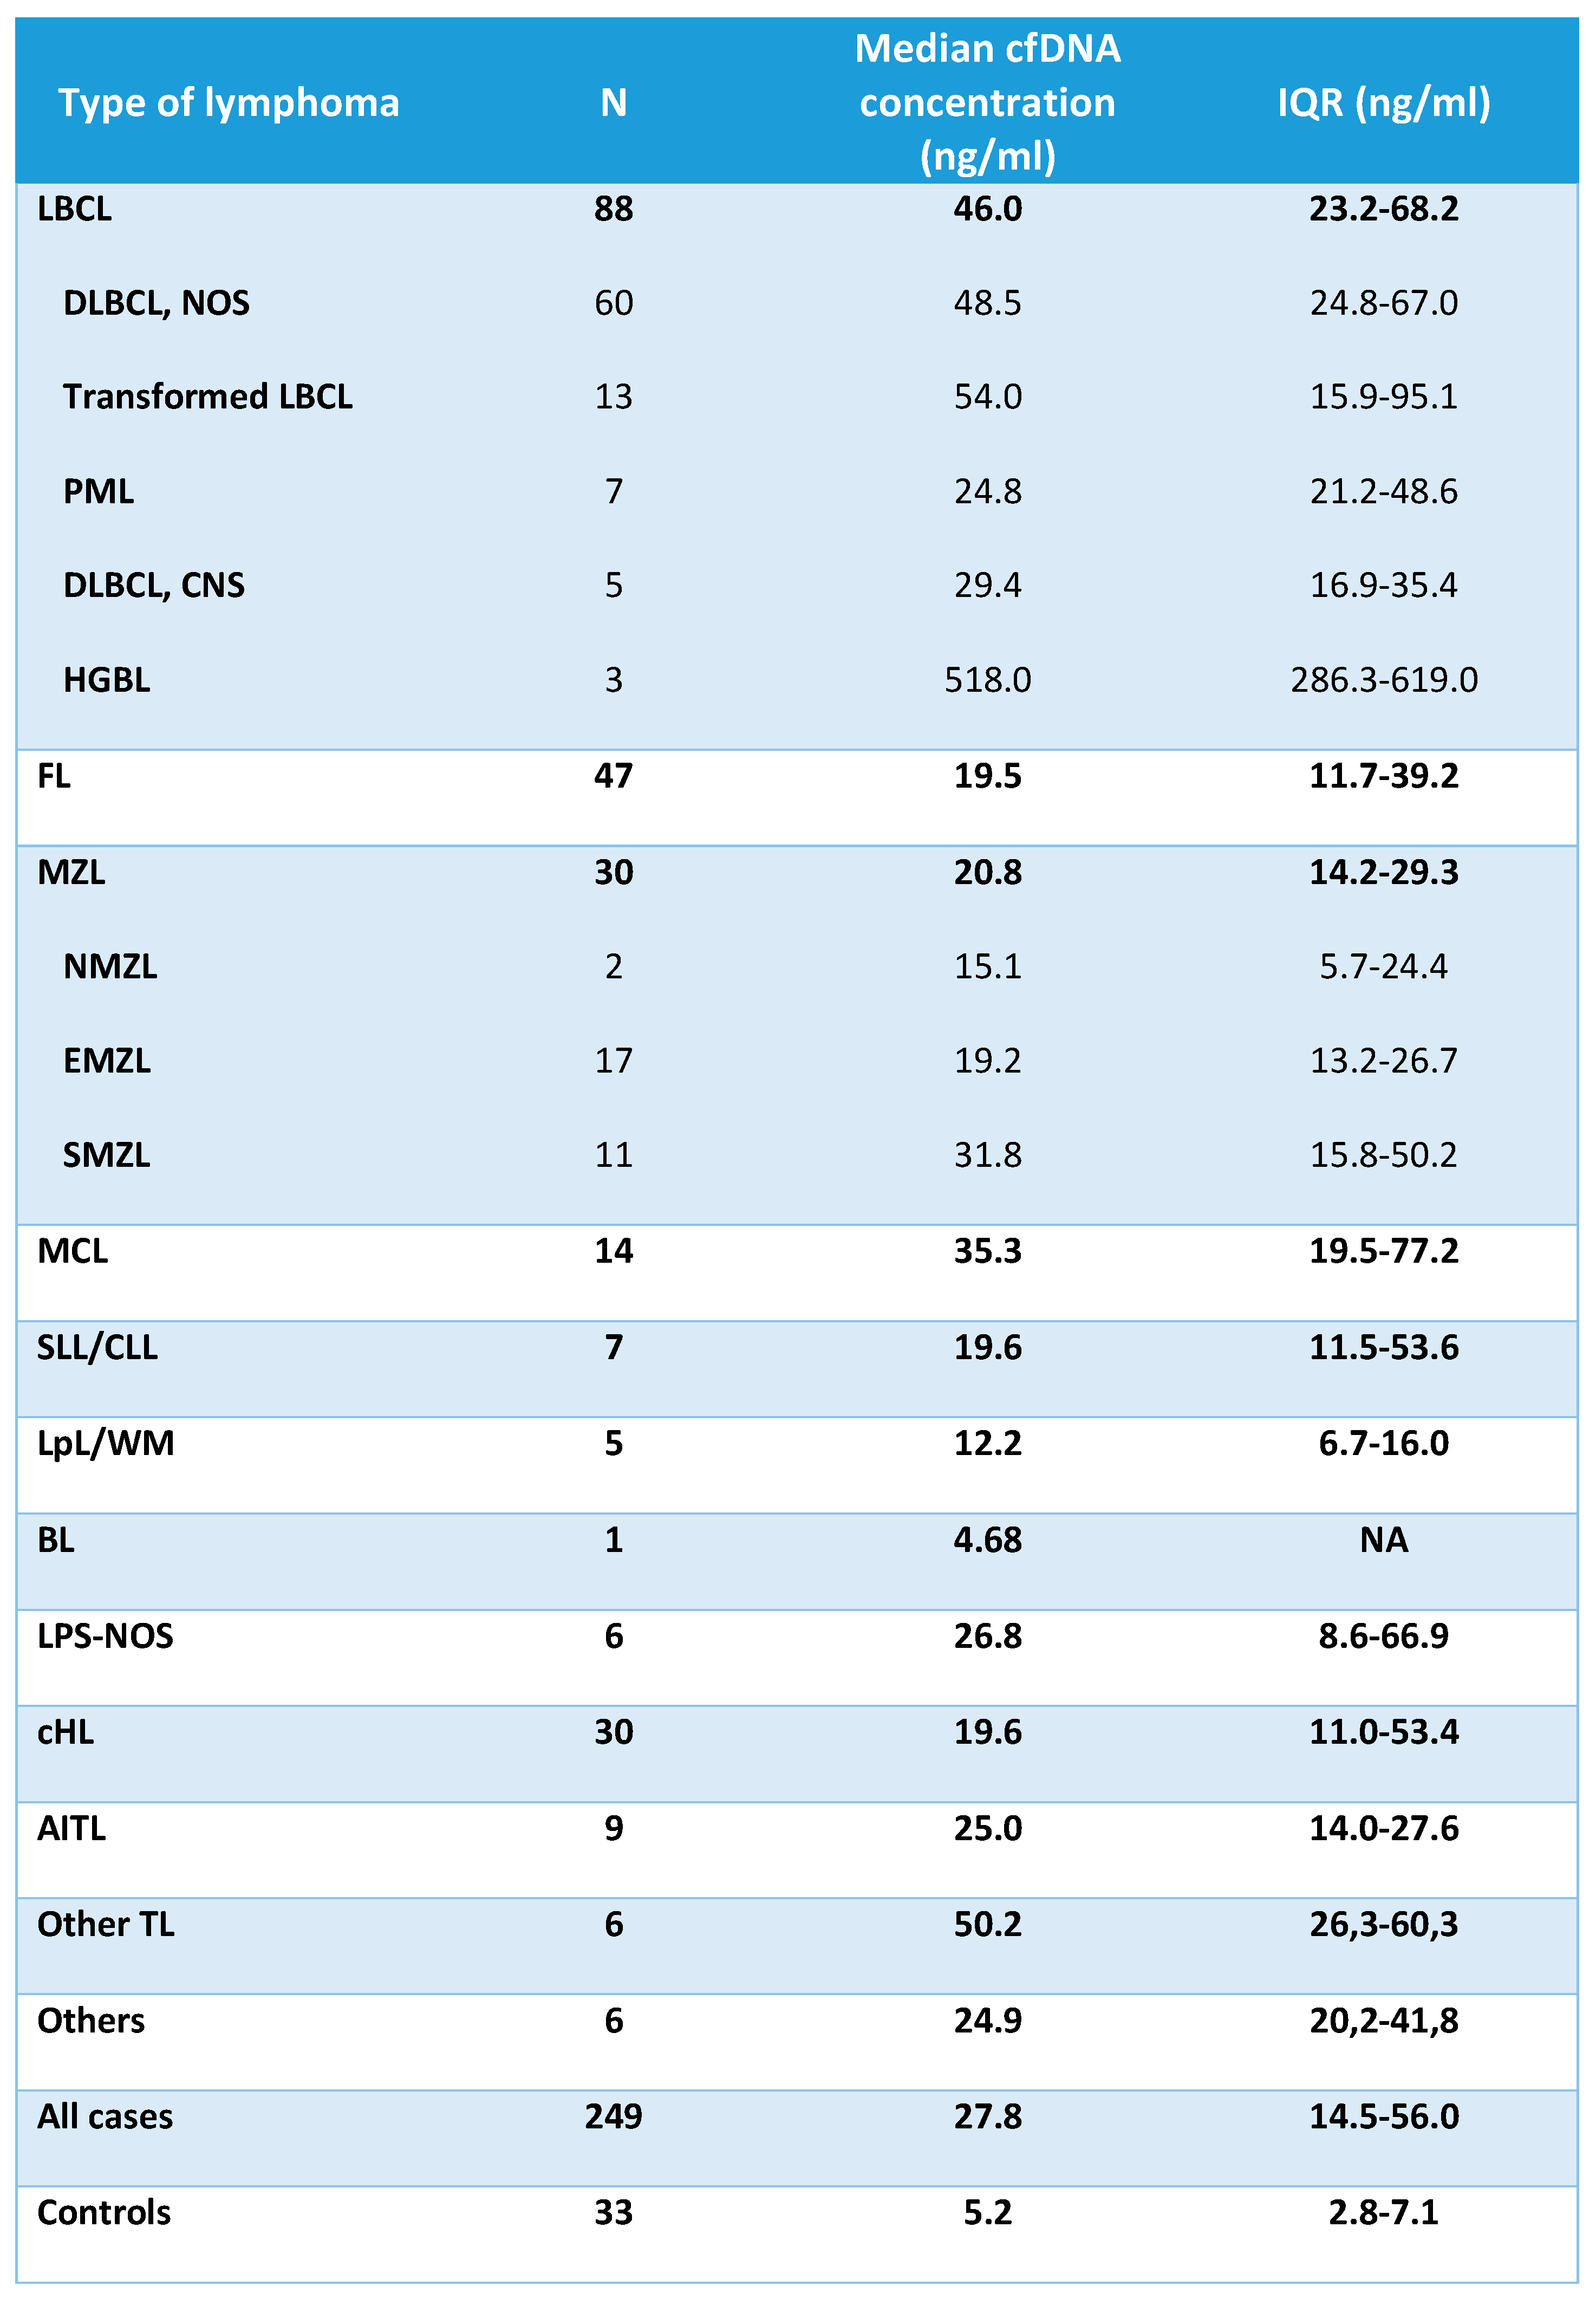
The median concentration of cfDNA obtained from healthy controls and cases according to lymphoma subtypes is shown in Table 2 and Figure 1. The median cfDNA concentration obtained from plasma was 27.8 ng/mL (IQR 14.5-56.0) for the lymphoma cases and 5.2 ng/mL (IQR 2.8-7.1) for healthy controls. There were no statistically significant differences in the levels of cfDNA among the cases according to age (<60years vs >60 years), gender or bone marrow involvement. However, significantly higher levels of cfDNA were found in lymphoma patients with elevated levels of lactate dehydrogenase (LDH), elevated levels of beta 2-microglobulin (B2-MG), advanced stage or B-symptoms (Supplementary Table 1). Moreover, levels of cfDNA were significantly correlated with LDH (r=0.320, p<0.0001), B2-MG (r=0.253, p<0.0001) and age (r=0.157, p=0.013) (Spearman test, Supplementary Figure 1).
Median cfDNA concentration was significantly higher in all lymphoma categories when compared to healthy controls (Supplementary Table 2). Aggressive NHL such as LBCL, MCL and other TL showed the highest median amount of cfDNA, followed by AITL, MZL, cHL, and FL (Table 2).
As shown in Figure 2A, analysis of cfDNA levels across LBCL subtypes showed that they were particularly elevated in patients with high grade lymphoma with rearrangement of MYC and BCL2 (median 518 ng/mL) in comparison with patients with other LBCL subtypes (p<0.001). DLBCL-NOS and tDLBCL had similar levels of cfDNA, both being about the double of the levels of patients with PML or primary DLBCL-CNS (48.5 ng/mL and 54 ng/mL vs 24.8 ng/mL and 29.4 ng/mL respectively, p=0.057). One patient with early stage BL localized at the intestine had also detectable levels of cfDNA.
Levels of cfDNA across MZL subtypes are shown in Figure 2B. In MZL, the median cfDNA concentration was 20.8 ng/mL (IQR: 14.2-29.3). Patients with splenic MZL had higher levels of cfDNA than extranodal MZL (p=0.028) and nodal MZL (p=0.231).
Of note, one patient with interdigitating dendritic cell sarcoma showed high cfDNA levels (47 ng/mL) and 5 patients with HIV+ B-cell lymphoma had median levels of 23.8 ng/mL (IQR: 2.6-37.3).
3.2. cfDNA Levels According to Characteristics at Presentation and Lymphoma Subtype
We further analyzed the levels of cfDNA according to the characteristics at presentation in the main lymphoma subtypes. In LBCL, levels of cfDNA were significantly higher in patients with B-symptoms (p=0.001), high LDH (p=0.003), high B2-MG (p=0.002) and higher International Prognostic Index (IPI) score (p=0.006) (Figure 3). In FL, higher cfDNA levels were found in older patients (p=0.017) and in those with advanced IPI (p=0.012). In cHL and in MZL, cfDNA concentration was significantly correlated with age and LDH, respectively (Supplementary Table 3).
3.3. Molecular Characterization at Diagnosis Using cfDNA and Tissue-DNA in LBCL (n=49)
We further analyzed the applicability of cfDNA for molecular profiling and longitudinal follow-up in the cohort of LBCL. To this aim, we included 49 patients with end-of-therapy evaluation and at least 12 months of follow-up (n=49; 34 DLBCL-NOS, 8 tDLBCL, 4 PML, 1 DLBCL-CNS, 1 HGBL, 1 HIV positive LBCL). The median age of this cohort was 62 years (range, 20-86); 27 (55%) were males, 16 (33%) had B-symptoms, and 27 (55%) showed an upper normal limit of LDH concentration. The AA stages were: I in 8 patients (16%), II in 15 (31%), III in 3 (6%) and IV in 23 (47%). The IPI distribution was low-risk in 14 patients (29%), low-intermediate in 18 (37%), intermediate-high in 12 (24%) and high-risk in 5 (10%) (Supplementary Table 4). The median cfDNA concentration from the 48 cases with plasma at the time of diagnosis was 38.4 ng/mL (IQR: 17.2-59.9). Similar to the whole LBCL cohort, patients with intermediate/high or high IPI had significantly higher cfDNA levels in comparison with those with low/low-intermediate IPI (median 58.10 ng/mL (IQR: 24.9-90.8) vs 27.40 ng/mL (IQR: 14.9-48.1), respectively; p=0.015) (Supplementary Table 5).
In 33 out of 48 (68.8%) patients, the amount of isolated cfDNA at baseline was enough to perform mutational analysis by NGS. Sequencing results were evaluable in 23 out of 33 cases (in 10 cases median read depth and therefore sensitivity was too low to perform a reliable analysis) showing one or more gene mutations in 21 out of 23 (91.3%) cases. To confirm the tumoral origin of the gene mutations detected in plasma, we performed NGS from the tumoral FFPE samples. Of the 49 cases included, tumor tissue was exhausted in 2 cases, extracted DNA was insufficient to perform NGS in 10 cases, and NGS data were non-evaluable in 5 cases. Successful NGS results from FFPE tissue were obtained in 32 out of 49 initial cases (65.3%). In 29 out of 32 cases one or more gene mutations were identified. Distribution of gene mutations in both tissue samples (N: 32) and cfDNA samples (N: 21) is shown in Figure 4. The median number of mutations per sample, for both tissue-DNA and cfDNA, was 5 (IQR: 2.7-7.0 and 3.0-6.0, respectively). In agreement with previous reports, the more frequently mutated genes in both tissue and cfDNA were KMT2D, CREBBP, TP53, IGLL5, BCL2, EBF1, TET2, EZH2 and MEF2B.
The paired tissue-plasma analysis was possible in 16 cases with valuable NGS. The correlation between the mutations identified in tissue-DNA and in cfDNA is shown in Figure 5. In these cases, a total of 82 gene mutations were found in tissue samples and 69 (84%) of them were detected in the cfDNA samples. When analyzing the variant allele frequency (VAF) of the mutations, the median VAF for tissue-DNA samples was 30.65% (IQR: 23.90-45.19%) and 13.77% for cfDNA samples (IQR: 4.77-32.79%). A correlation was observed between tissue DNA VAF and cfDNA VAF (r=0.426, p<0.0001) (Figure 6.A). In the cases in which mutations were missed in cfDNA, the median VAF in tissue was significantly lower than cases in which mutations were detected in cfDNA (20.94% (IQR: 12.15-27.05%) vs 32.20% (IQR: 24.66-48.10%), respectively; p<0.0001).
We further analyzed whether these differences in the VAF could be related to the clinical presentation of the disease. To this aim we defined two groups: group A that included patients with AA stages I or II and absence of bulky disease, and group B that comprised patients with advanced stage and/or bulky disease. Group A exhibited statistically significant lower VAF percentages than group B in cfDNA samples (p=0.0013) (Figure 6B).
3.4. cfDNA Concentration as a Prognosis Biomarker Before and After Therapy for LBCL (n=49)
To explore the applicability of cfDNA to monitor disease, we compared the amount of cfDNA obtained at diagnosis and at end of therapy. All 49 LBCL patients received immunochemotherapy regimens with curative intention, 37 cases (76%) received R-CHOP (rituximab, cyclophosphamide, doxorubicin, vincristine and prednisone), 8 patients (16%) received R-EPOCH-DA (rituximab, etoposide, prednisone, vincristine, doxorubicin and cyclophosphamide), and the remaining 4 patients (8%) received other rituximab-containing regimens. After therapy completion, response evaluation following the Lugano criteria was as follows: complete response (CR) in 42 patients (85.7%), partial response (PR) in 1 (2%), stable disease (SD) or disease progression (PD) in 6 (12.2%).
As stated above, at diagnosis cfDNA isolation was possible in 48 patients (from 1 patient there was not enough plasma sample at diagnosis) with a median cfDNA concentration of 35.5 ng/mL (IQR: 17.2-58.1); after therapy, cfDNA isolation could be done in 43 patients (5 patients did not have sample after treatment), and the median cfDNA concentration was 24.2 ng/mL (IQR: 13.6-35.8). Figure 7 summarizes the levels of the cfDNA before and after therapy according to response. Patients who achieved response showed a reduction of median levels of cfDNA from diagnosis to response evaluation (from 42.7 ng/mL to 22.0 ng/mL, respectively) (p=0.007). However, median levels of cfDNA increased in patients who did not achieve response (SD/PD) (from 18.1 ng/mL to 57.6 ng/mL (p=0.08)).
With a median follow-up for survivors of 50.9 months (IQR: 40.7-66.6), 4 patients relapsed at 13, 19, 25 and 41 months. Three out of these 4 cases achieved a second remission after treatment. The median cfDNA at diagnosis of patients who achieved CR and later relapsed was higher (median: 81.5 ng/mL; IQR: 57.0-124.5) compared with levels of those in CR who did not relapse (median: 38.6 ng/mL (IQR: 17.4-50.9)). At the end of treatment (EOT), the median cfDNA was not different between those cases in CR who relapsed and those who did not (median: 22.0 ng/mL (IQR: 20.0-24.4) vs 24.2 ng/mL (IQR: 11.7-36.1), respectively).
With this follow-up, 8 patients died and the median OS has not been reached. Five of these patients had a positive PET at EOT and, interestingly, in 3 of them the cfDNA had increased with respect to cfDNA levels at diagnosis. In all these 5 cases, the main cause of death was lymphoma progression. The 3 remaining patients who died had achieved CR with negative PET and showed diminished levels of cfDNA at EOT. Conversely, in only 1 of these 3 cases the cause of death was lymphoma progression.
We further explored the usefulness of adding the pre-post-treatment cfDNA kinetics to EOT-PET. Figure 8 shows PFS and OS according to the combined PET response at EOT to cfDNA kinetics. As expected, patients who achieved metabolic CR (Deauville Score (DS) 1-3) had prolonged PFS and OS, regardless of final cfDNA kinetics. However, the kinetics of cfDNA at EOT was able to distinguish those patients who, despite being considered PET positive (DS 4-5), showed a favorable outcome. Thus, PFS and OS of patients with PET positive (DS 4-5) who had decreased levels of cfDNA at EOT was similar to the outcome that of those PET negative patients. Of note, PET positive (DS 4-5) patients who had increased cfDNA kinetics at EOT showed a very poor outcome.
In the patients with ctDNA available, levels of ctDNA at the time of diagnosis were measured in haploid genome equivalents per milliliter (hGE/mL) and expressed in log scale (log hGE/mL). Using the threshold 2.5 log hGE/mL, as previously described [12], differences in PFS and OS were observed, but without reaching statistical significance probably due to the small sample size. None of the 3 cases below 2.5 log hGE relapsed (Supplemental Figure 2).
4. Discussion
In this single-center study, we have analyzed cfDNA in 256 patients with lymphoma, including the most frequent non-Hodgkin lymphoma entities, Hodgkin lymphoma, and also less common lymphomas, such as LpL/WM or AITL. cfDNA could be successfully isolated in up to 97% of our patients. The cases in which cfDNA could not be detected corresponded to patients with localized stages and/or with very little tumor burden and, mostly, indolent lymphomas (in particular, MZL).
Overall, cfDNA concentration was higher in all lymphoma categories, including indolent lymphomas, compared to healthy controls. Furthermore, the median concentration of cfDNA was higher in patients with aggressive lymphoma. Differences were also seen regarding LBCL subtype with greater cfDNA levels seen in HGBL, DLBCL-NOS and tDLBCL than in DLBCL-CNS and PML. In particular, patients with HGBL with MYC and BCL2 rearrangement presented strikingly higher cfDNA levels (10 times higher) than other categories of aggressive LBCL.
An interesting observation of our study was that although the MZLs had only a cfDNA isolation rate of 86%, the average concentrations were approximately 20.8 ng/mL, sufficient enough to perform ctDNA analysis, and higher than those reported in the recent MAGNOLIA study which were 6.9 ng/mL [19]. However, cfDNA levels depend on multiple technical factors, including sample processing and nucleic acid extraction methods which are not yet standardized, and therefore it is difficult to make comparisons among studies analyzing cfDNA [20,21].
Our study showed that baseline cfDNA levels significantly correlated with stage, B-symptoms, as well as LDH and B2-MG concentrations. Interestingly, older patients had also higher levels of cfDNA. In our cohort of patients with LBCL, cfDNA concentrations at diagnosis were correlated with IPI, LDH and B2-MG as previously described by other groups that analyzed ctDNA [11,15,22]. In FL cfDNA levels correlated with age and IPI. The association between ctDNA levels and tumor burden or risk scores in FL is not fully established. However recent studies have correlated baseline ctDNA with advanced stages, FLIPI score and prognosis [23]. In progressive FL with histological transformation, ctDNA have demonstrated capability to detect transformation related gene mutations that were not visible in the tumor biopsies [24]. In HL, both the amount of cfDNA and ctDNA concentrations at baseline have been correlated with stage, mutational tumoral burden, and the International Prognostic Score (IPS) [25]. In our study, cfDNA concentration was only significantly correlated with age and LDH. Camus et al. also reported higher pretreatment cfDNA levels in patients >45 years in a series of 60 cHL [26].
Several studies have highlighted the opportunity of using cfDNA as a source of genetic material for molecular study of aggressive lymphomas, especially DLBCL [11,12,27,28,29,30,31,32]; but also in HL [14,26,33,34], FL [35,36,37], MCL [38,39] , TCL [40,41] or PML [42,43] . Non-invasive genotyping by ctDNA profiling from blood plasma might represent a complementary tool or even, in the near future, an alternative option for lymphoma diagnosis, subtype classification and genetic characterization. These might be of particular interest in situations in which tumor tissue is inaccessible or in patients with high risk of complications due to comorbidities, and, in addition, ctDNA profiling can bring to light tumor heterogeneity from different tumoral sites.
In our LBCL cohort, genetic characterization both in tissue and plasma was performed by NGS customized panel including 36 genes and was able to identify at least one or more mutations in 90% of cases with available material. Interestingly, the median number of mutations per sample, for both tissue-DNA and cfDNA, was the same (5 mutated genes). Matched DNA-tissue and cfDNA analysis helped us to confirm the tumoral origin of the cfDNA and to distinguish clonal hematopoiesis related gene mutations. The findings from the genetic characterization in our LBCL cohort, despite the small sample size, were in line with previous studies [44,45,46]. Of note, genes related with prognosis and susceptible for targeted therapy, such as KMT2D, TP53, CREBBP and EZH2, were identified in ctDNA by our panel.
The genetic characterization of LBCL in cfDNA showed an 84% concordance versus DNA-tissue. cfDNA generally exhibited lower VAF in comparison to the corresponding DNA-tissue sample and a higher detection rate in ctDNA was associated to higher median VAF in tissue (around 30%). We hypothesized that this low VAF tissue mutations missed in the cfDNA analysis could have a subclonal origin. These findings align with previous reports across various lymphoma subtypes [47]. Moreover, LBCL patients with advanced Ann Arbor stage (III-IV) and those with bulky disease showed significantly higher VAF in ctDNA than those with localized disease or absence of bulky. This finding is in line with other solid tumors for which higher VAFs have been detected in more advanced and aggressive disease [48,49] probably due to a higher ctDNA/cfDNA ratio. Our deep sequencing NGS panel incorporates tagging of individual DNA molecules, facilitating ctDNA detection at low levels. However, it is well-known that cases with extremely low tumor burden, or during or after treatment in responding patients, current methods are limited by suboptimal sensitivity. Development of other approaches such as bioinformatic strategies like ‘PhasED-seq’ (Phased Variant Enrichment and Detection Sequencing) that tracks two or more variants (‘phased variants’) on the same strand of one single DNA molecule may increase the sensitivity of variant detection, thus facilitating ctDNA monitoring down to an analytical detection limit of ~0.00005% [47,50].
Usefulness of baseline ctDNA concentration has been explored to predict outcome after treatment, as well as its measurement during treatment, at the end of therapy and during surveillance. Higher concentration of cfDNA at diagnosis has been associated with poor survival in a study including 40 DLBCL [28]. Several studies that evaluated pretreatment ctDNA concentrations showed strong predictive value for PFS and OS in patients receiving standard immunochemotherapy [11,12,29,51], and also in patients receiving CART (Axi-cel) [52]. In our study, ctDNA levels at baseline were not found to have significance in the outcome after immunochemotherapy, probably due to the fact that our cohort of LBCL had to have end-of-therapy evaluation and also at least 12 months of follow-up, and consequently progressing patients during treatment were not included in the cfDNA subanalysis. However, our patients who achieved CR but then relapsed had significantly higher cfDNA levels than those patients who also achieved CR but did not relapse.
As expected, in responding patients, cfDNA concentration decreased from diagnosis to the end of treatment. However, the cfDNA concentration increased in patients who showed progression at the end of treatment. In fact, a reduction of 2.5 log hGE/mL from diagnosis to the end of treatment showed differences in PFS and OS, but without reaching statistical significance, probably due to the limited number of events. The ctDNA dynamics is something that has been recently explored in some lymphoma studies and clinical trials to predict outcome. Kurtz et al. observed in his 217 DLBCL series that a 2-log reduction in ctDNA after one cycle of therapy and 2.5-log reductions after two cycles were highly predictive of EFS and OS after first-line therapy [12]. Similarly, negative ctDNA levels after CART therapy were associated with durable response in a series of DLBCL [52,53]. Another phase 1 trial for recurrent/refractory CNS lymphomas treated with ibrutinib demonstrated better outcome for those patients that cleared ctDNA in cerebrospinal fluid after therapy [54].
Finally, we studied the value of cfDNA with respect to the metabolic response evaluated by PET. In line with previous studies, in patients with negative PET (DS 1-3) at the end of diagnosis, the cfDNA concentration did not show predictive usefulness in the outcome. However, patients with positive PET (Deauville score 4-5) and reduction in cfDNA at the end of treatment had a favorable prognosis, unlike those with positive PET and increase in cfDNA who had a dismal outcome [55,56].
In conclusion, cfDNA can be isolated in more than 95% of lymphoma patients in the routine clinical practice, including B-cell, T-cell and Hodgkin lymphomas, as well as aggressive and indolent lymphomas. cfDNA concentration at diagnosis varies among lymphoma subtypes, showing higher levels in more aggressive lymphoma types. In LBCL, NGS customized panel on cfDNA allowed the identification of 84% of the mutated genes detected in tissue-DNA. Moreover, cfDNA might help for PET response evaluation in LBCL. Our results add evidence for the incorporation of cfDNA/ctDNA measurement as a complementary tool for lymphoma management.
Supplementary Materials
Supplementay Table 1. Plasma cfDNA concentration (ng/mL) according to clinical features. N: 249. AA: Ann Arbor; LDH: lactate dehydrogenase; B2-MG: beta-2 microglobulin; BM: bone marrow. U-Mann-Whitney test, with exact Fisher correction when applicable. Supplementary Table 2. Comparison of cfDNA according to lymphoma subtype vs controls. LBCL: large B-cell lymphoma; FL: follicular lymphoma; MZL: marginal zone lymphoma; MCL: mantle cell lymphoma; small lymphocytic lymphoma/chronic lymphocytic leukemia; LpL/W: lymphoplasmacytic lymphoma/Waldenstöm macroglobulinemia; LPS-NOS: circulating low-grade unclassifiable B-cell lymphoma; cHL: classic Hodgkin lymphoma; AITL: angioimmunoblastic T-cell lymphoma; TCL: T-cell lymphoma. *1 localized BL patient was not considered. Supplementary Table 3. P values for associations of cfDNA levels with characteristics at presentation according to the main lymphoma subtypes. AA: Ann Arbor; LDH: lactate dehydrogenase; B2-MG: beta-2 microglobulin; BM: bone marrow; IPI: international prognostic index; FLIPI: follicular international prognostic index. Spearman test for age, LDH, B2-MG; U-Mann-Whitney test or Kruskal Wallis test for gender, stage, B-symptoms, BM involvement, IPI and FLIPI. Supplementary Table 4. Clinical features of LBCL patients at diagnosis. AA: Ann Arbor; LDH: lactate dehydrogenase; B2-MG: beta-2 microglobulin; BM: bone marrow; IPI: international prognostic index. Supplementary Table 5. Associations of cfDNA with clinical characteristics at diagnosis in de LBCL cohort. *1 patient without available cfDNA. AA: Ann Arbor; LDH: lactate dehydrogenase; B2-MG: beta-2 microglobulin; BM: bone marrow; IPI: international prognostic index. Supplementary Figure 1. Scattered plot showing correlations between cfDNA and LDH and beta 2-microglobulin (B2-MG) (N:249). Supplementary Figure 2. PFS and OS according to PET EOT and kinetics of log hGE ctDNA.
Author Contributions
RDF and MAC designed the study, collected the data, performed the statistical analysis, analyzed and interpreted the results and wrote the manuscript. AS and BB designed the study, interpreted the results and wrote the manuscript. JG collected the data, performed the statistical analysis and approve the final version. BS, LF, CFR, NGG, LCa, ML, IV and LCo collected the data and approved the final version.
Acknowledgments
This work was funded by grants from Instituto de Salud Carlos III-FEDER PI15/0459, PI19/00034, PI17/313, PT20/00023, AGAUR 2017SGR205 and 2021SGR628 and the Xarxa de Banc de Tumors de Catalunya. RDF received research grant from The Spanish Foundation of Hematology and Hemotherapy (FEHH).
Conflicts of Interest
The authors declare no conflict of interest.
References
- E. Gormally, E. Caboux, P. Vineis, and P. Hainaut, “Circulating free DNA in plasma or serum as biomarker of carcinogenesis: Practical aspects and biological significance,” Mutat Res Rev Mutat Res, vol. 635, no. 2–3, pp. 105–117, 2007. [CrossRef]
- K. R. Jahr S, Hentze H, Englisch S, Hardt D, Fackelmayer FO, Hesch RD, “DNA fragments in the blood plasma of cancer patients: quantitations and evidence for their origin from apoptotic and necrotic cells,” Cancer Res, vol. Feb 15;61(, pp. 1659–65, 2001.
- S. Trino, D. Lamorte, A. Caivano, L. De Luca, A. Sgambato, and I. Laurenzana, “Clinical relevance of extracellular vesicles in hematological neoplasms: from liquid biopsy to cell biopsy,” Leukemia, vol. 35, no. 3, pp. 661–678, 2021. [CrossRef]
- L. Y. Lui YY, Chik KW, Chiu RW, Ho CY, Lam CW, “Predominant hematopoietic origin of cell-free DNA in plasma and serum after sex-mismatched bone marrow transplantation,” Clin Chem, vol. Mar;48(3), pp. 421–7, 2002. [CrossRef]
- J. S. Matthew W Snyder, Martin Kircher, Andrew J Hill, Riza M Daza, “Cell-free DNA Comprises an In Vivo Nucleosome Footprint that Informs Its Tissues-Of-Origin,” Cell, vol. Jan 14;164, pp. 57–68, 2016. [CrossRef]
- N. Garcia-Gisbert et al., “Circulating cell-free DNA improves the molecular characterisation of Ph-negative myeloproliferative neoplasms,” Br J Haematol, vol. 192, no. 2, pp. 300–309, 2021. [CrossRef]
- J. Moss et al., “Comprehensive human cell-type methylation atlas reveals origins of circulating cell-free DNA in health and disease,” Nat Commun, vol. 9, no. 1, 2018. [CrossRef]
- C. M. Diehl F, Schmidt K, “Circulating mutant DNA to assess tumor dynamics,” Nat Med, vol. 14, pp. 985–990, 2008. [CrossRef]
- F. Diehl et al., “Detection and quantification of mutations in the plasma of patients with colorectal tumors,” Proc Natl Acad Sci U S A, vol. 102, no. 45, pp. 16368–16373, 2005. [CrossRef]
- X. Q. C. and M. S. Philippe Anker , Hugh Mulcahy, “Detection of circulating tumour DNA in the blood (plasma/serum) of cancer patients,” Cancer and Metastasis Reviews 18:, vol. 18, pp. 65–73, 1999. [CrossRef]
- M. Roschewski et al., “Comparative Study of Circulating Tumor DNA and Computerized Tomography Monitoring in Untreated Diffuse Large B-Cell Lymphoma,” Lancet Oncology, vol. 16, no. 5, pp. 541–549, 2015. [CrossRef]
- D. M. Kurtz et al., “Circulating tumor DNA measurements as early outcome predictors in diffuse large B-cell lymphoma,” Journal of Clinical Oncology, vol. 36, no. 28, pp. 2845–2853, 2018. [CrossRef]
- S. H. Shin et al., “Analysis of circulating tumor DNA by targeted ultra-deep sequencing across various non-Hodgkin lymphoma subtypes,” Leuk Lymphoma, vol. 60, no. 9, pp. 2237–2246, 2019. [CrossRef]
- K. Desch et al., “Genotyping circulating tumor DNA of pediatric Hodgkin lymphoma,” Leukemia, vol. 34, no. 1, pp. 151–166, 2020. [CrossRef]
- S. Hohaus et al., “Cell-free circulating DNA in Hodgkin’s and non-Hodgkin’s lymphomas,” Annals of Oncology, vol. 20, no. 8, pp. 1408–1413, 2009. [CrossRef]
- P. Razavi et al., “High-intensity sequencing reveals the sources of plasma circulating cell-free DNA variants,” Nat Med, vol. 25, no. 12, pp. 1928–1937, 2019. [CrossRef]
- K. Cervena, P. Vodicka, and V. Vymetalkova, “Diagnostic and prognostic impact of cell-free DNA in human cancers: Systematic review,” Mutat Res Rev Mutat Res, vol. 781, pp. 100–129, 2019. [CrossRef]
- T. J. Swerdlow SH, Campo E, Harris NL, Pileri SA, Jaffe ES, Stein H, WHO classification of Tumours of Haematopoietic and lymphoid tissues. 2017.
- M. Tatarczuch et al., “Molecular associations of response to the new generation BTK inhibitor zanubrutinib in marginal zone lymphoma,” Blood Adv, 2023. [CrossRef]
- A.-L. Volckmar, A. R. , Holger Sültmann, P. S. , Thoas Fioretos, V. Endris, and S. D. , Albrecht Stenzinger, “A Field Guide for Cancer Diagnostics using cell-free DNA: from Principles to Practice and Clinical Applications,” Genes Chromosomes Cancer, vol. Mar;57(3), pp. 123–139, 2018. [CrossRef]
- B. Bellosillo and C. Montagut, “High-accuracy liquid biopsies,” vol. 25, no. December, pp. 1820–1821, 2019.
- D. M. Kurtz et al., “Noninvasive monitoring of diffuse large B-cell lymphoma by immunoglobulin high-throughput sequencing,” Blood, vol. 125, no. 24, pp. 3679–3687, 2015. [CrossRef]
- M. Zhao et al., “Application of circulating tumour DNA in terms of prognosis prediction in Chinese follicular lymphoma patients,” Front Genet, vol. 14, 2023. [CrossRef]
- T. Hatipoğlu et al., “Plasma Concentrations and Cancer-Associated Mutations in Cell-Free Circulating DNA of Treatment-Naive Follicular Lymphoma for Improved Non-Invasive Diagnosis and Prognosis,” Front Oncol, vol. 12, Jun. 2022. [CrossRef]
- V. Camus and F. Jardin, “pharmaceuticals Cell-Free DNA for the Management of Classical Hodgkin Lymphoma,” Pharmaceuticals, vol. 14, p. 207, 2021. [CrossRef]
- V. Camus et al., “Targeted genotyping of circulating tumor DNA for classical Hodgkin lymphoma monitoring: A prospective study,” Haematologica, vol. 106, no. 1, pp. 154–162, 2021. [CrossRef]
- J. M. Darrah and A. F. Herrera, “Updates on Circulating Tumor DNA Assessment in Lymphoma,” Curr Hematol Malig Rep, vol. 13, no. 5, pp. 348–355, 2018. [CrossRef]
- M. Eskandari, S. Manoochehrabadi, H. Pashaiefar, M. A. Zaimy, and M. Ahmadvand, “Clinical significance of cell-free DNA as a prognostic biomarker in patients with diffuse large B-cell lymphoma,” Blood Res, vol. 54, no. 2, pp. 114–119, 2019. [CrossRef]
- J. Arzuaga-Mendez, E. Prieto-Fernández, E. Lopez-Lopez, I. Martin-Guerrero, J. C. García-Ruiz, and A. García-Orad, “Cell-free DNA as a biomarker in diffuse large B-cell lymphoma: A systematic review,” Crit Rev Oncol Hematol, vol. 139, pp. 7–15, 2019. [CrossRef]
- C. Melani, W. H. Wilson, and M. Roschewski, Monitoring clinical outcomes in aggressive B-cell lymphoma: From imaging studies to circulating tumor DNA, vol. 31, no. 3. Elsevier Ltd, 2018. [CrossRef]
- M. R. Christopher Melani, “Molecular Monitoring of Cell-Free Circulating Tumor DNA in Non-Hodgkin Lymphoma,” Oncology (Williston Park), vol. 8, 2016.
- S. Transl et al., “HHS Public Access lymphoma revealed by circulating tumor DNA,” vol. 8, no. 364, pp. 1–12, 2017. [CrossRef]
- M. Cirillo and S. Borchmann, “An update on disease biomarkers for Hodgkin lymphoma,” Expert Rev Hematol, vol. 13, no. 5, pp. 481–488, 2020. [CrossRef]
- V. Spina et al., “Circulating tumor DNA reveals genetics, clonal evolution, and residual disease in classical Hodgkin lymphoma,” Blood, vol. 131, no. 22, pp. 2413–2425, 2018. [CrossRef]
- M. H. Delfau-Larue et al., “Total metabolic tumor volume, circulating tumor cells, cell-free DNA: Distinct prognostic value in follicular lymphoma,” Blood Adv, vol. 2, no. 7, pp. 807–816, 2018. [CrossRef]
- C. Sarkozy et al., “The prognostic value of clonal heterogeneity and quantitative assessment of plasma circulating clonal IG-VDJ sequences at diagnosis in patients with follicular lymphoma,” Oncotarget, vol. 8, no. 5, pp. 8765–8774, 2017. [CrossRef]
- Distler et al., “A Prospective Study of Clonal Evolution in Follicular Lymphoma: Circulating Tumor DNA Correlates with Overall Tumor Burden and Fluctuates over Time without Therapy,” Blood, vol. 138, no. Supplement 1, pp. 1328–1328, 2021. [CrossRef]
- R. Lakhotia et al., “Circulating tumor DNA predicts therapeutic outcome in mantle cell lymphoma,” Blood Adv, vol. 6, no. 8, pp. 2667–2680, 2022. [CrossRef]
- R. Agarwal et al., “Dynamic molecular monitoring reveals that SWI–SNF mutations mediate resistance to ibrutinib plus venetoclax in mantle cell lymphoma,” Nat Med, vol. 25, no. 1, pp. 119–129, 2019. [CrossRef]
- D. Z. Chong Wei, Wei Wang, Yan Zhang, Danqing Zhao, Wei Zhang, “Mutation profiling, tumour burden assessment, outcome prediction and disease monitoring by circulating tumour DNA in peripheral T-cell lymphoma,” British Journal of Hematology, vol. 1, pp. 86–95, 2023. [CrossRef]
- M. Sakata-Yanagimoto et al., “Detection of the circulating tumor DNAs in angioimmunoblastic T- cell lymphoma,” Ann Hematol, vol. 96, no. 9, pp. 1471–1475, 2017. [CrossRef]
- V. Camus et al., “Circulating tumor DNA in primary mediastinal large B-cell lymphoma versus classical Hodgkin lymphoma: a retrospective study,” Leuk Lymphoma, vol. 63, no. 4, pp. 834–844, Mar. 2022. [CrossRef]
- Rivas-Delgado et al., “Cell-Free DNA for Genomic Analysis in Primary Mediastinal Large B-Cell Lymphoma,” Diagnostics, vol. 12, no. 7, Jul. 2022. [CrossRef]
- Rivas-Delgado et al., “Mutational landscape and tumor burden assessed by cell-free DNA in diffuse large B-cell lymphoma in a population-based study,” Clinical Cancer Research, vol. 27, no. 2, pp. 513–521, 2021. [CrossRef]
- F. Scherer et al., “Distinct biological subtypes and patterns of genome evolution in lymphoma revealed by circulating tumor DNA,” Sci Transl Med, vol. 8, no. 364, Nov. 2016. [CrossRef]
- D. Rossi et al., “Diffuse large B-cell lymphoma genotyping on the liquid biopsy,” Blood, vol. 129, no. 14, pp. 1947–1957, Apr. 2017. [CrossRef]
- E. M. Lauer, J. Mutter, and F. Scherer, “Circulating tumor DNA in B-cell lymphoma: technical advances, clinical applications, and perspectives for translational research,” Leukemia, vol. 36, no. 9, pp. 2151–2164, 2022. [CrossRef]
- M. Strijker et al., “Circulating tumor DNA quantity is related to tumor volume and both predict survival in metastatic pancreatic ductal adenocarcinoma,” Int J Cancer, vol. 146, no. 5, pp. 1445–1456, 2020. [CrossRef]
- Z. Wang et al., “Allele Frequency–Adjusted Blood-Based Tumor Mutational Burden as a Predictor of Overall Survival for Patients With NSCLC Treated With PD-(L)1 Inhibitors,” Journal of Thoracic Oncology, vol. 15, no. 4, pp. 556–567, 2020. [CrossRef]
- D. M. Kurtz et al., “Enhanced detection of minimal residual disease by targeted sequencing of phased variants in circulating tumor DNA,” Nat Biotechnol, vol. 39, no. 12, pp. 1537–1547, 2021. [CrossRef]
- S. Zhang et al., “Tracking the evolution of untreated high-intermediate/high-risk diffuse large B-cell lymphoma by circulating tumour DNA,” Br J Haematol, vol. 196, no. 3, pp. 617–628, Feb. 2022. [CrossRef]
- M. J. Frank et al., “Monitoring of Circulating Tumor DNA Improves Early Relapse Detection After Axicabtagene Ciloleucel Infusion in Large B-Cell Lymphoma: Results of a Prospective Multi-Institutional Trial,” Journal of Clinical Oncology, vol. 39, no. 27, pp. 3034–3043, 2021. [CrossRef]
- M. Bastos-Oreiro et al., “Cell-Free DNA Dynamic Concentration and Other Variables Are Predictors of Early Progression after Chimeric Antigen Receptor T Cell Therapy in Patients with Diffuse Large B Cell Lymphoma,” Transplant Cell Ther, vol. 29, no. 7, pp. 472.e1-472.e4, Jul. 2023. [CrossRef]
- Grommes et al., “Phase 1b trial of an ibrutinib-based combination therapy in recurrent/refractory CNS lymphoma,” Blood, vol. 133, no. 5, pp. 436–445, 2019. [CrossRef]
- M. Kurtz, “The many facets of liquid biopsies in lymphoma,” Blood, vol. 139, no. 12. Elsevier B.V., pp. 1780–1781, Mar. 24, 2022. [CrossRef]
- L. Meriranta et al., “Molecular features encoded in the ctDNA reveal heterogeneity and predict outcome in high-risk aggressive B-cell lymphoma,” Blood, vol. 139, no. 12, pp. 1863–1877, Mar. 2022. [CrossRef]
Figure 1.
cfDNA levels at diagnosis according to lymphoma subtype (N: 249). The “box” represents the middle 50% of the data, with the top edge of the box indicating the third quartile (75th percentile) and the bottom edge indicating the first quartile (25th percentile). Median is represented inside each box. The "lines" (whiskers) extend from the box to show the range of the data (1.5 times IQR), excluding outliers that are represented with separated dots or asterisks. LBCL: large B-cell lymphoma; FL: follicular lymphoma; MZL: marginal zone lymphoma; MCL: mantle cell lymphoma; SLL/CLL: small lymphocytic lymphoma/chronic lymphocytic leukemia; LpL/WM: lymphoplasmacytic lymphoma/Waldenström macroglobulinemia; LPS-NOS: circulating low-grade unclassifiable B-cell lymphoma; cHL: classic Hodgkin lymphoma; AITL: angioimmunoblastic T-cell lymphoma; TL: T-cell lymphoma; BL: Burkitt lymphoma.
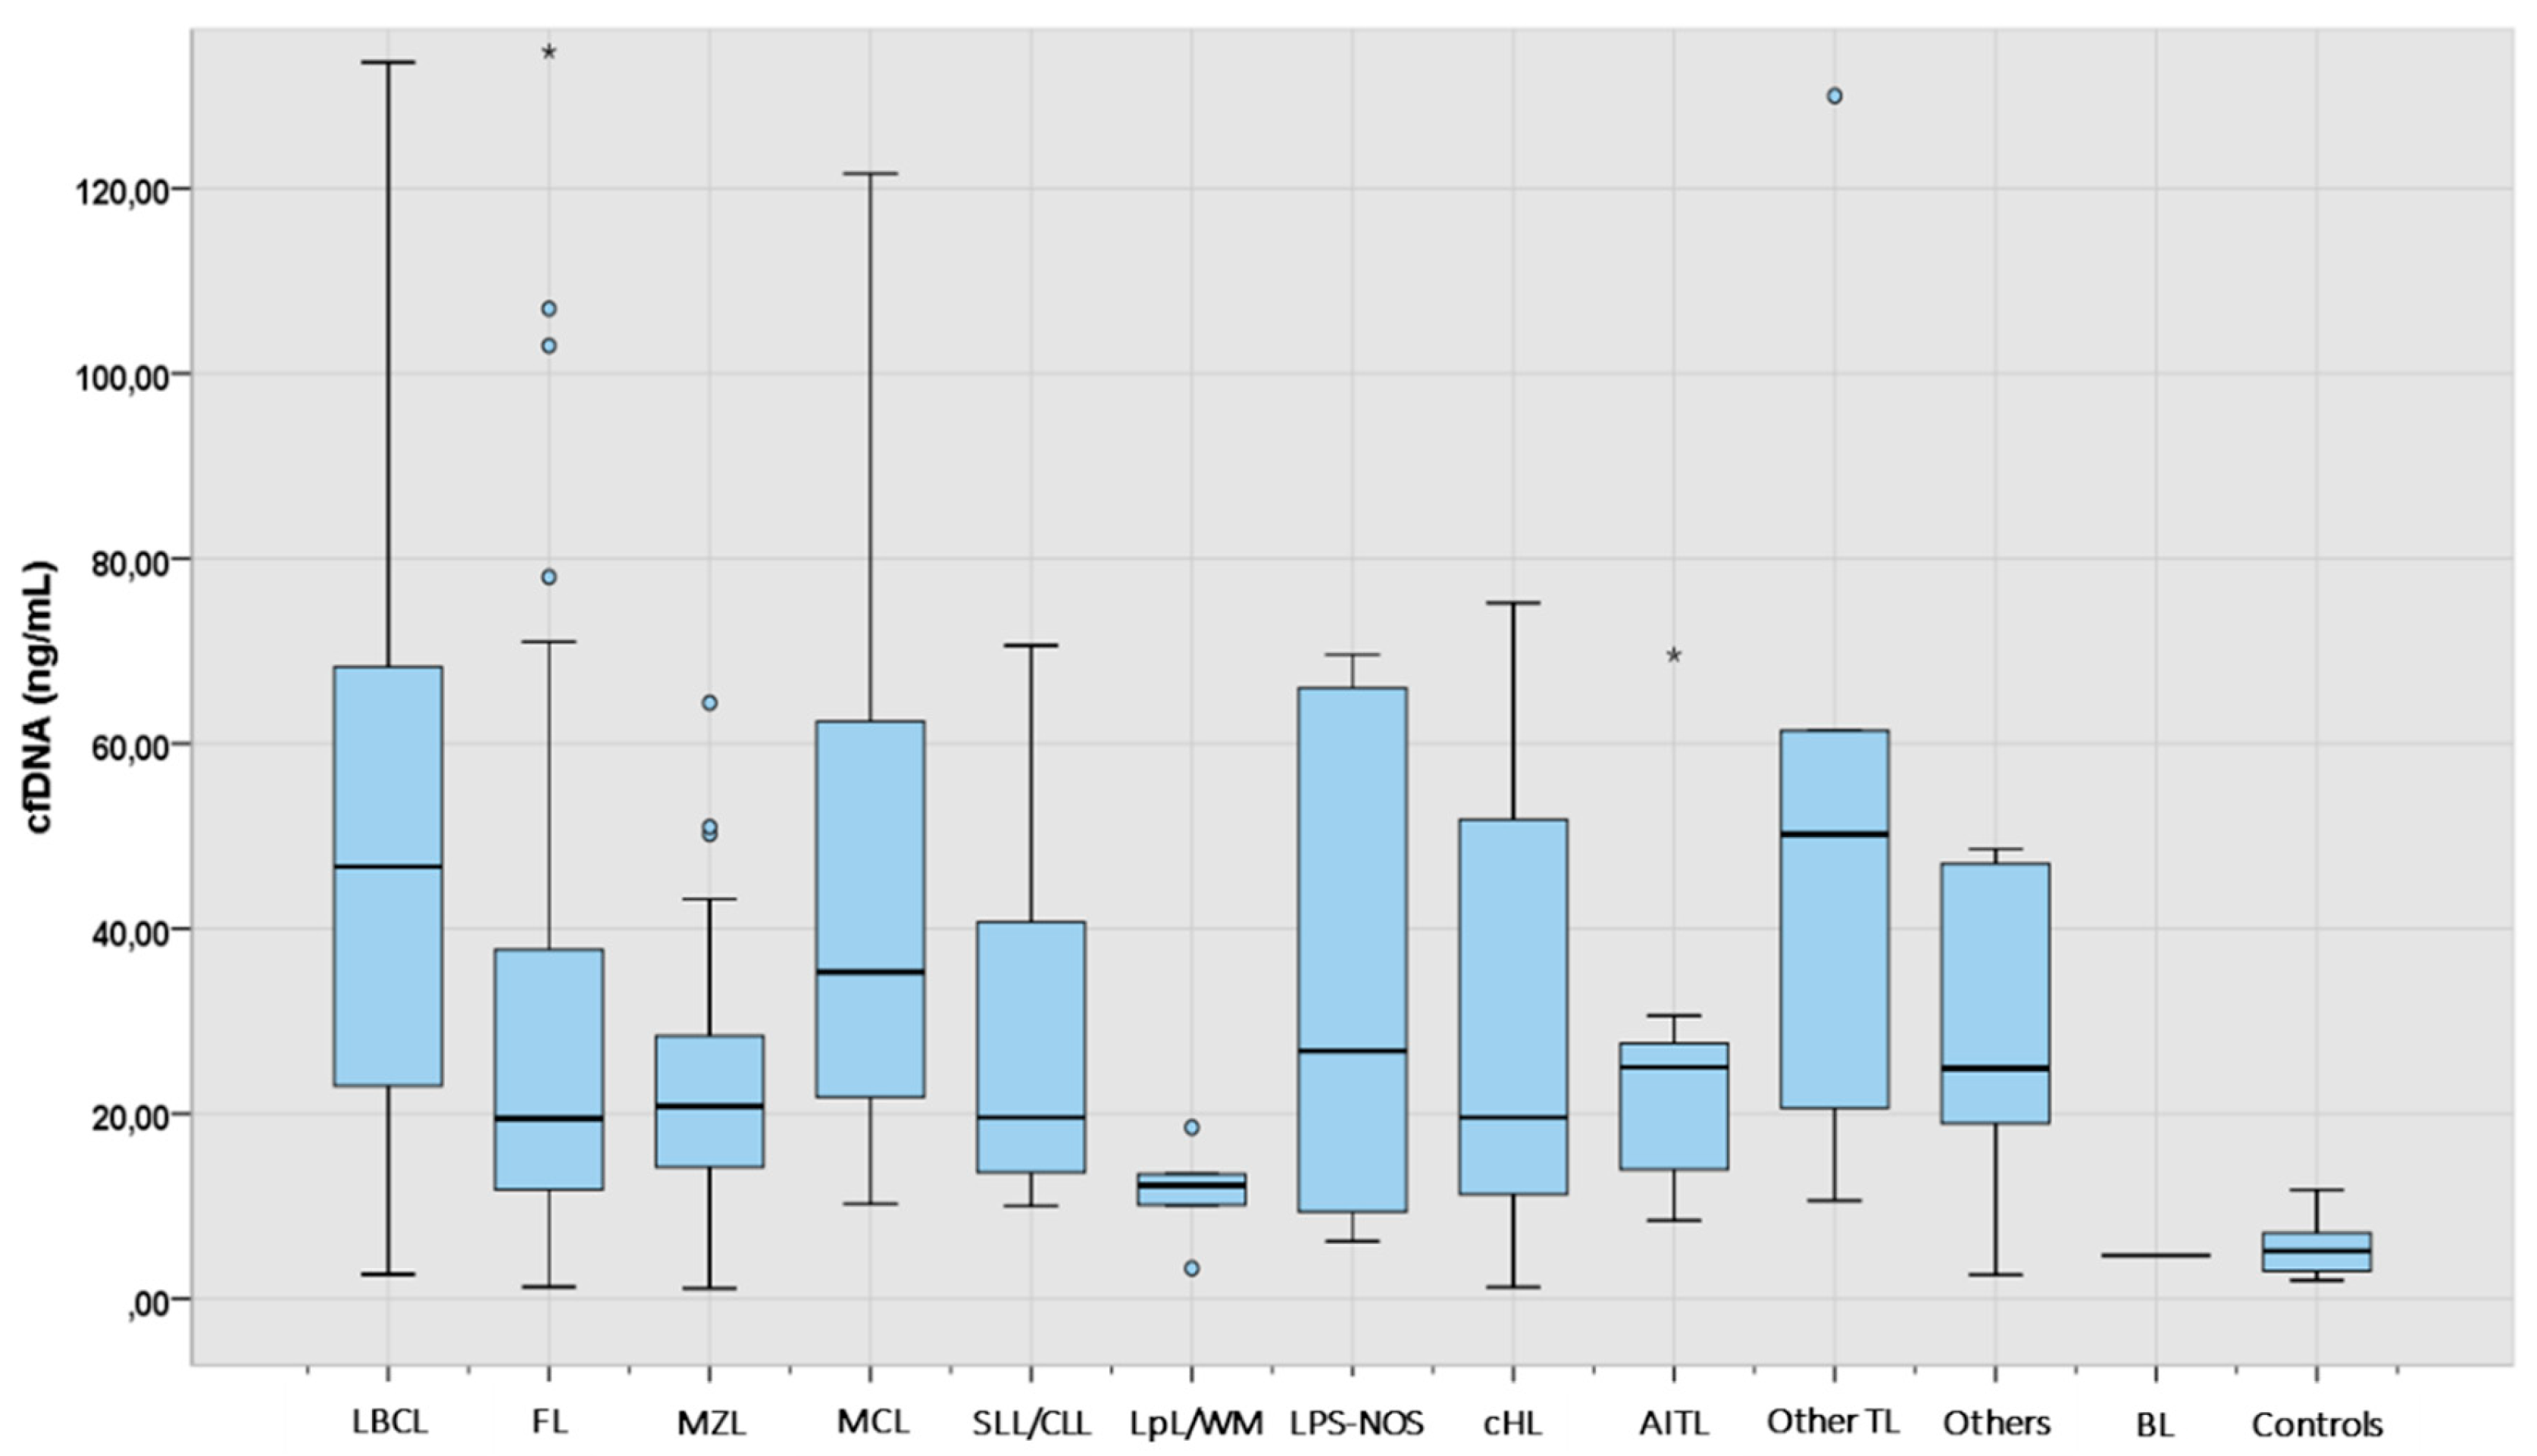
Figure 2.
A: cfDNA levels at diagnosis in the LBCL subgroup (N 88). B: cfDNA at diagnosis in the MZL subgroup (N:30). 1 asterisk (*) indicates a p-value <0.05. 3 asterisks (***) indicates a p-value <0.001. DLBCL: diffuse large B-cell lymphoma; NOS: not otherwise specified; tDLBCL: transformed large cell lymphoma; PML: primary mediastinal lymphoma; CNS: central nervous system; HGBL: high grade B-cell lymphoma with MYC and BCL2 rearrangement; SMZL: splenic marginal zone lymphoma; EMZL: extranodal marginal zone lymphoma; NMZL: nodal marginal zone lymphoma.
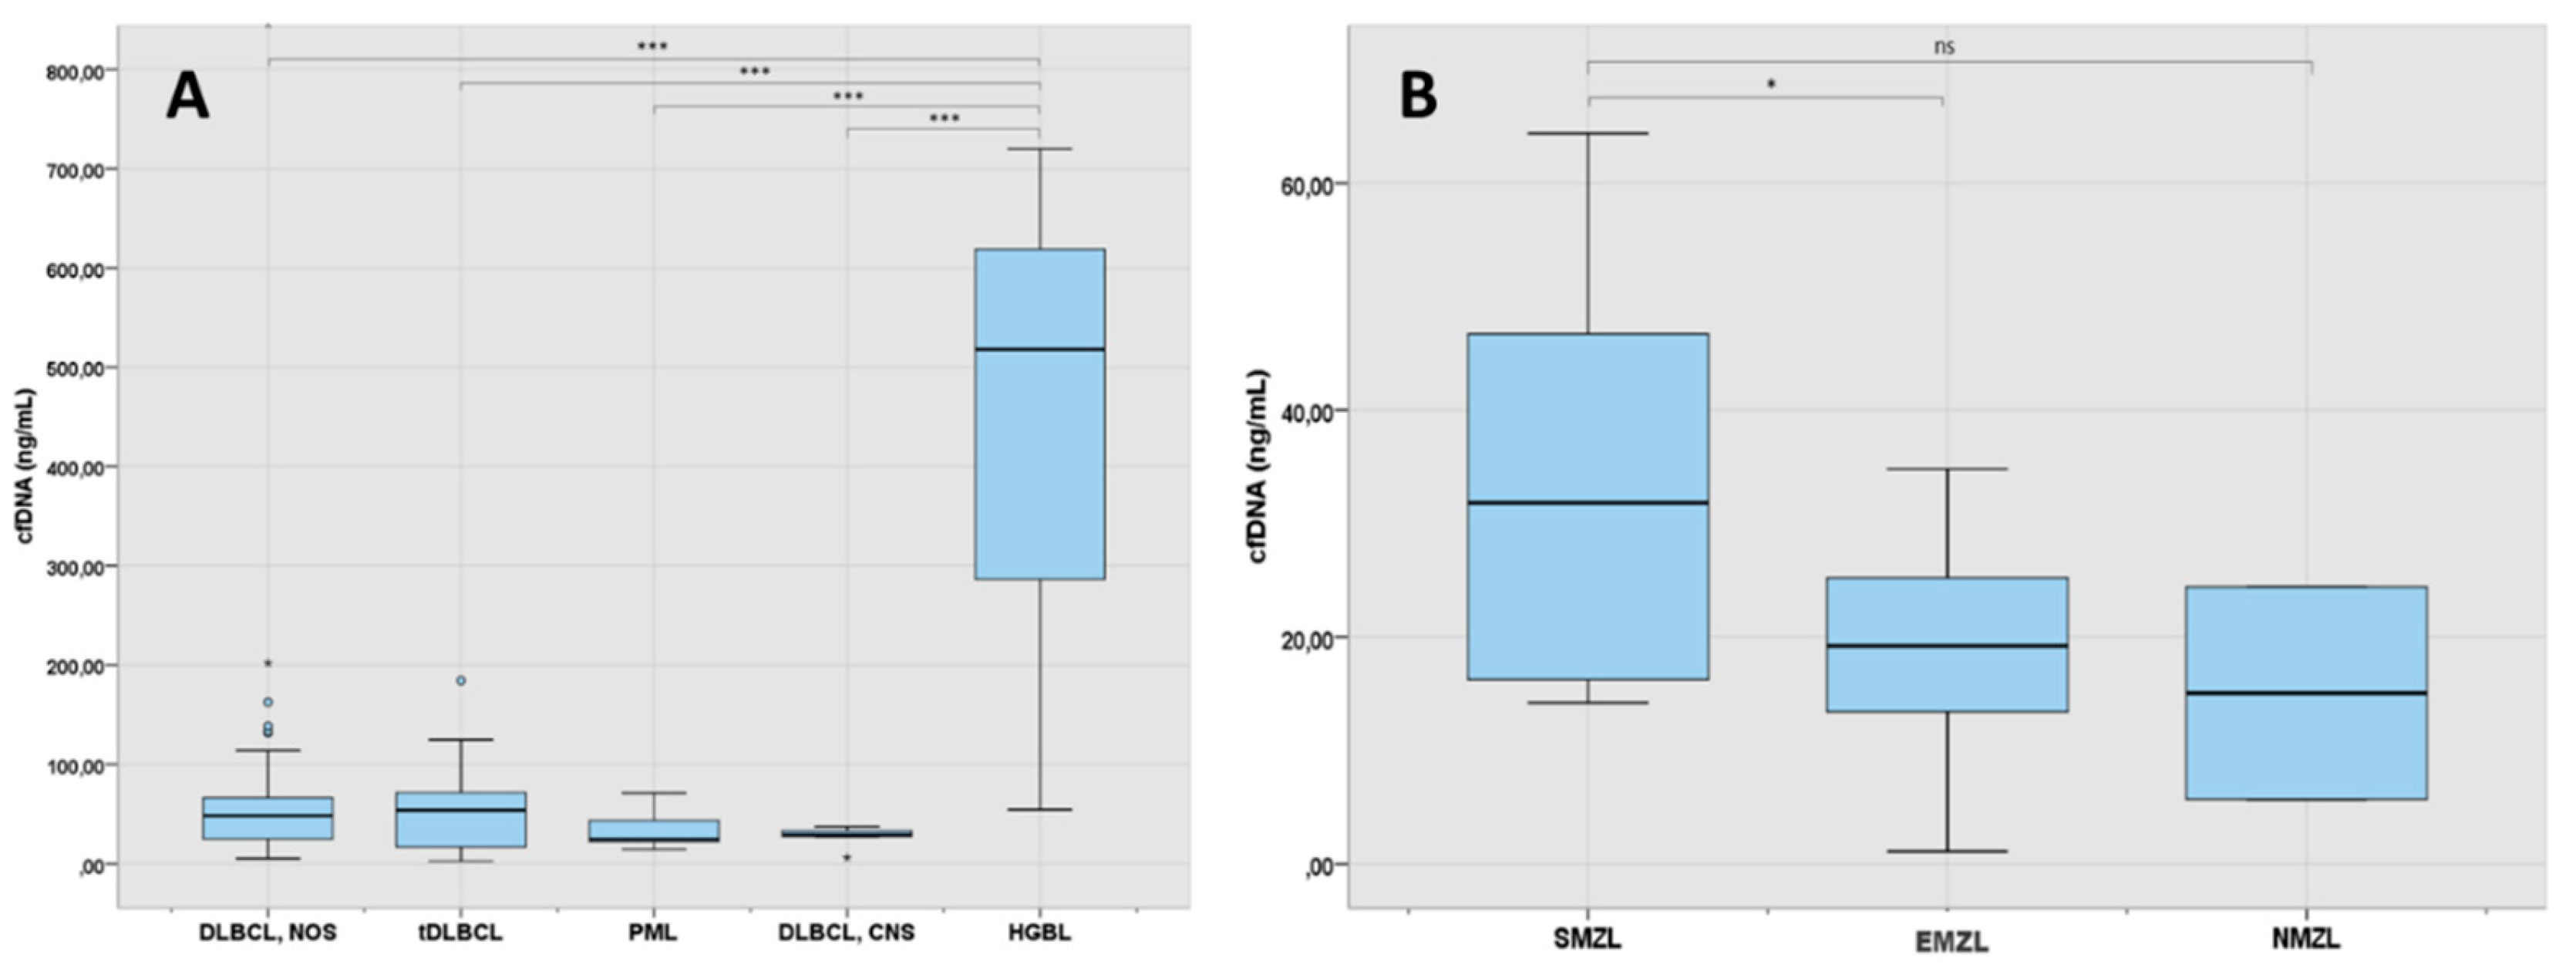
Figure 3.
cfDNA levels according to characteristics at presentation in LBCL. 2 asterisks (**) indicates a p-value <0.01. Int: intermediate.
Figure 3.
cfDNA levels according to characteristics at presentation in LBCL. 2 asterisks (**) indicates a p-value <0.01. Int: intermediate.
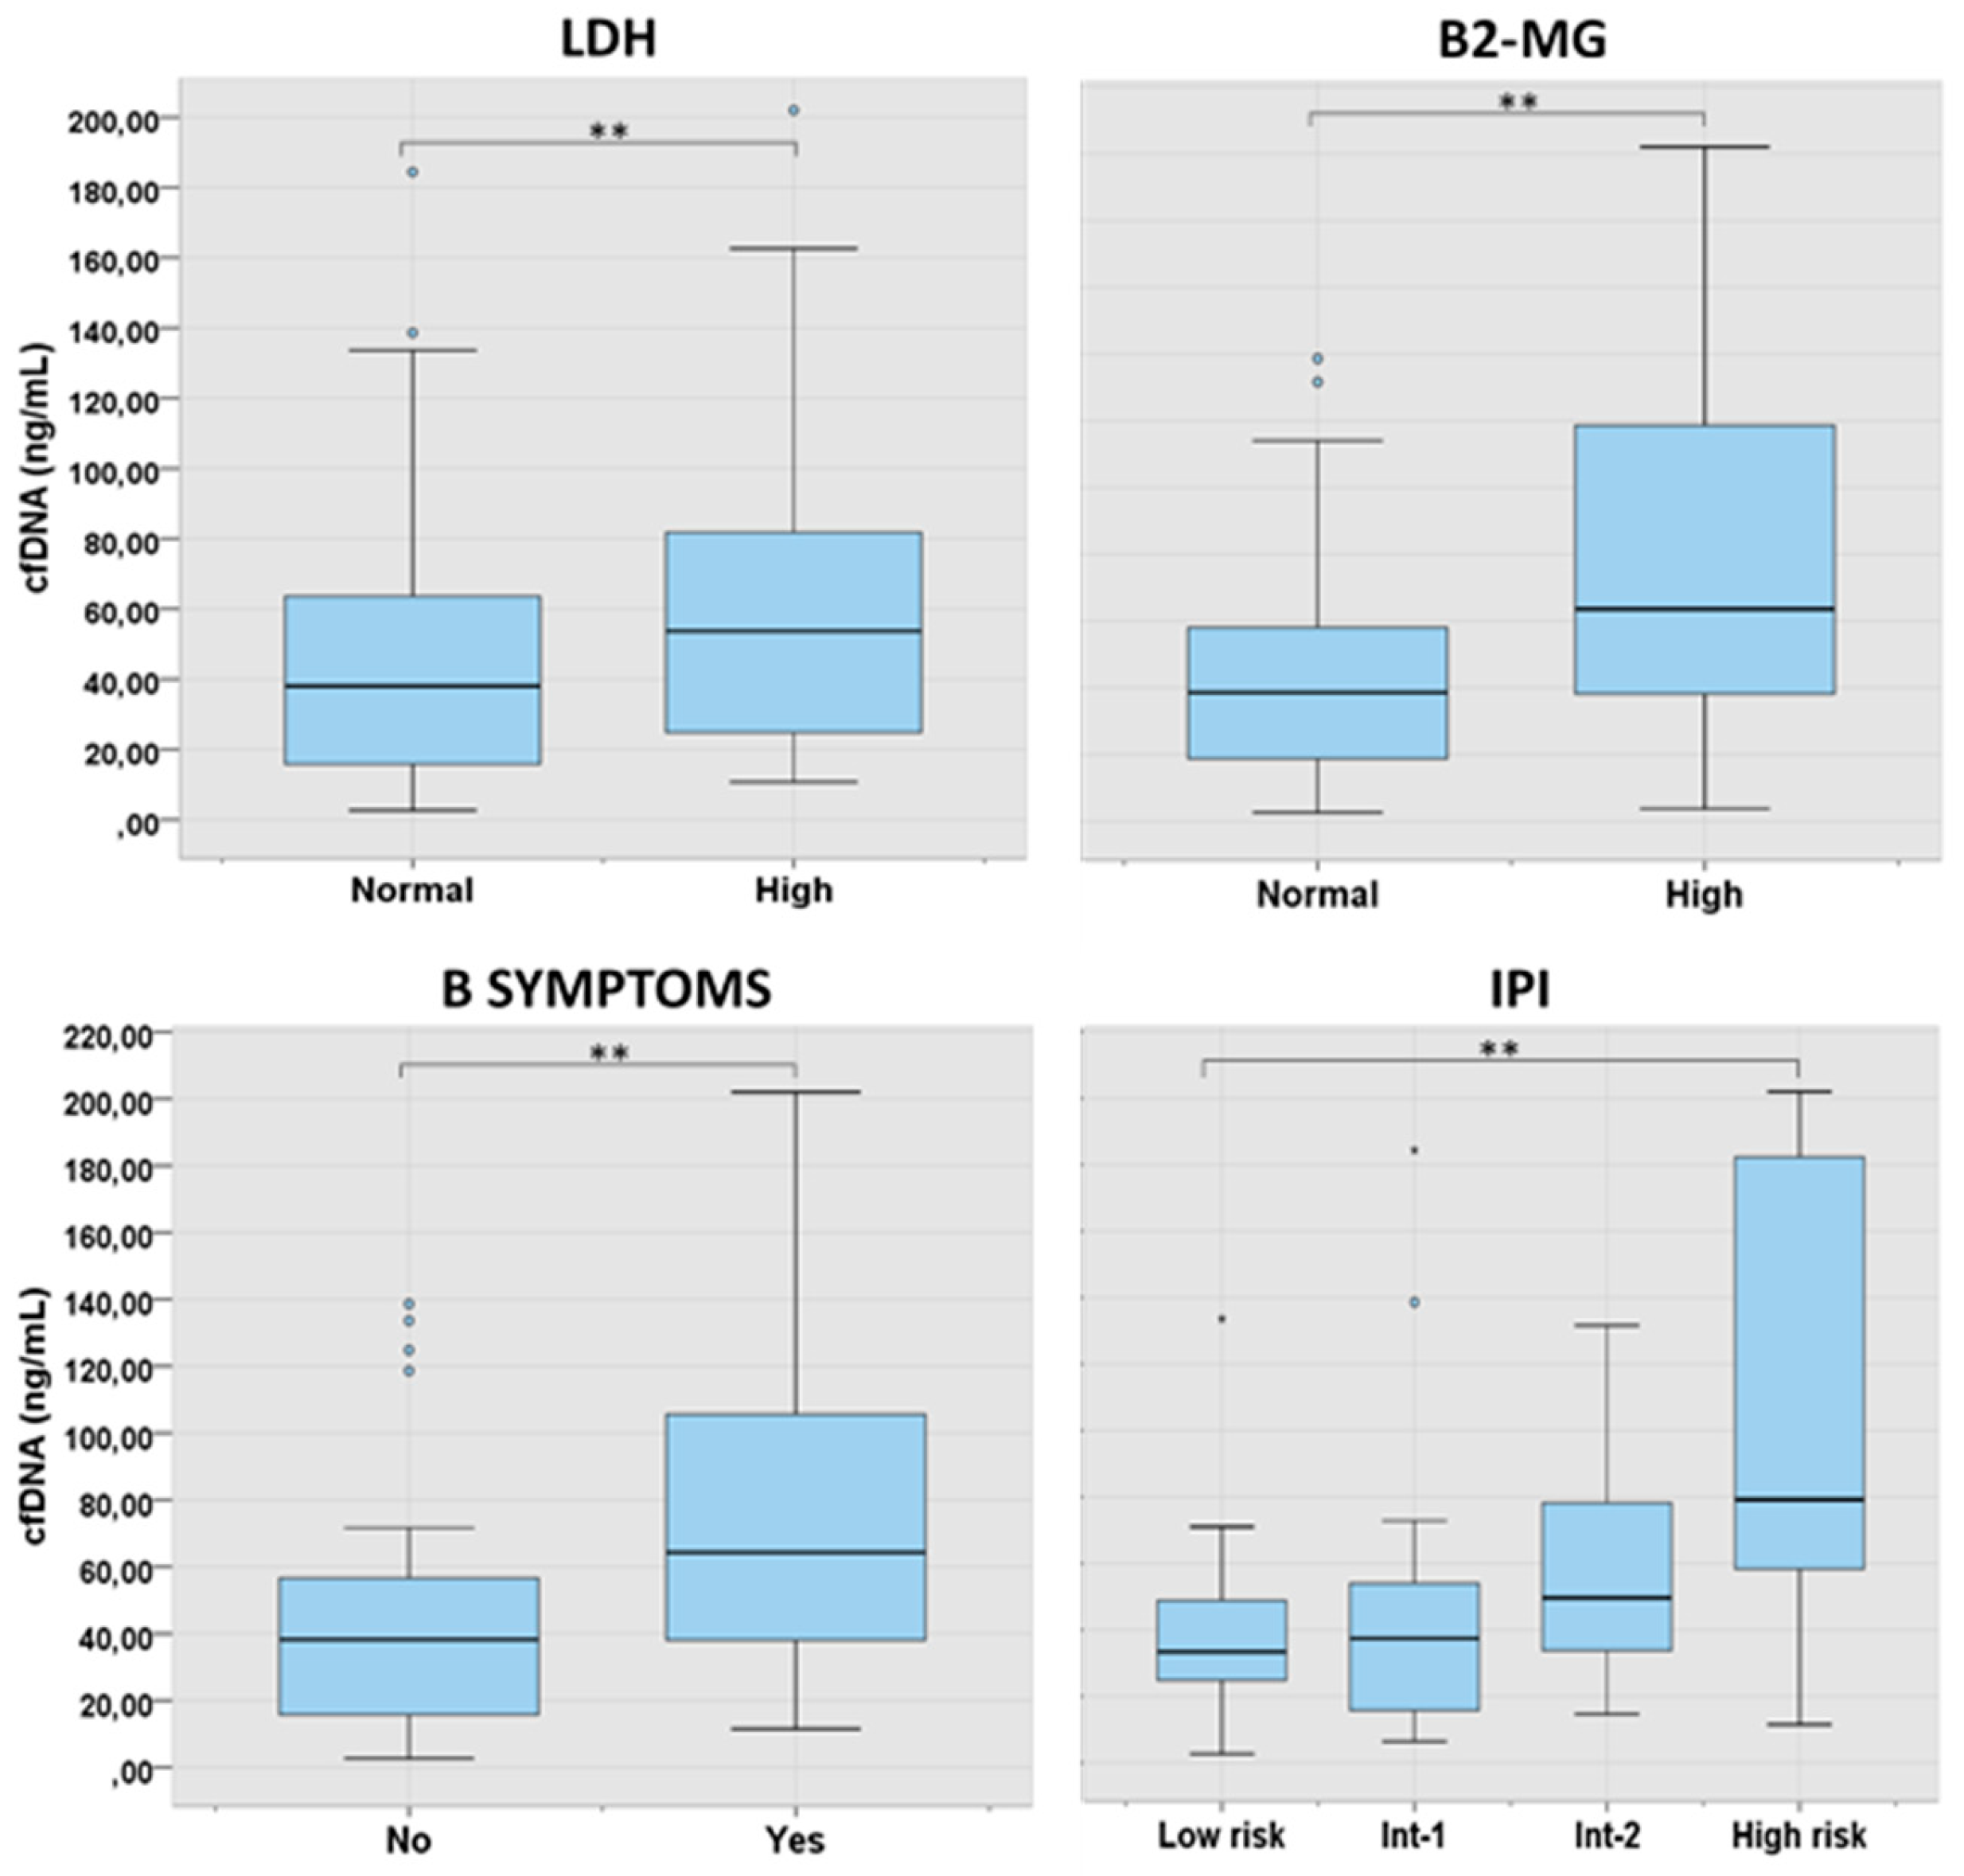
Figure 4.
Mutational profile of LBCL patients assessed in tissue-DNA (n= 32) and cfDNA (n= 23). DLBCL: Diffuse large B-cell lymphoma, tDLBCL: transformations of indolent B-cell lymphoma, HTB: high tumor burden, LTB: low tumor burden, CR: complete response, DE: double expressor, DH: double hit, TH: triple hit, NA: not available. .
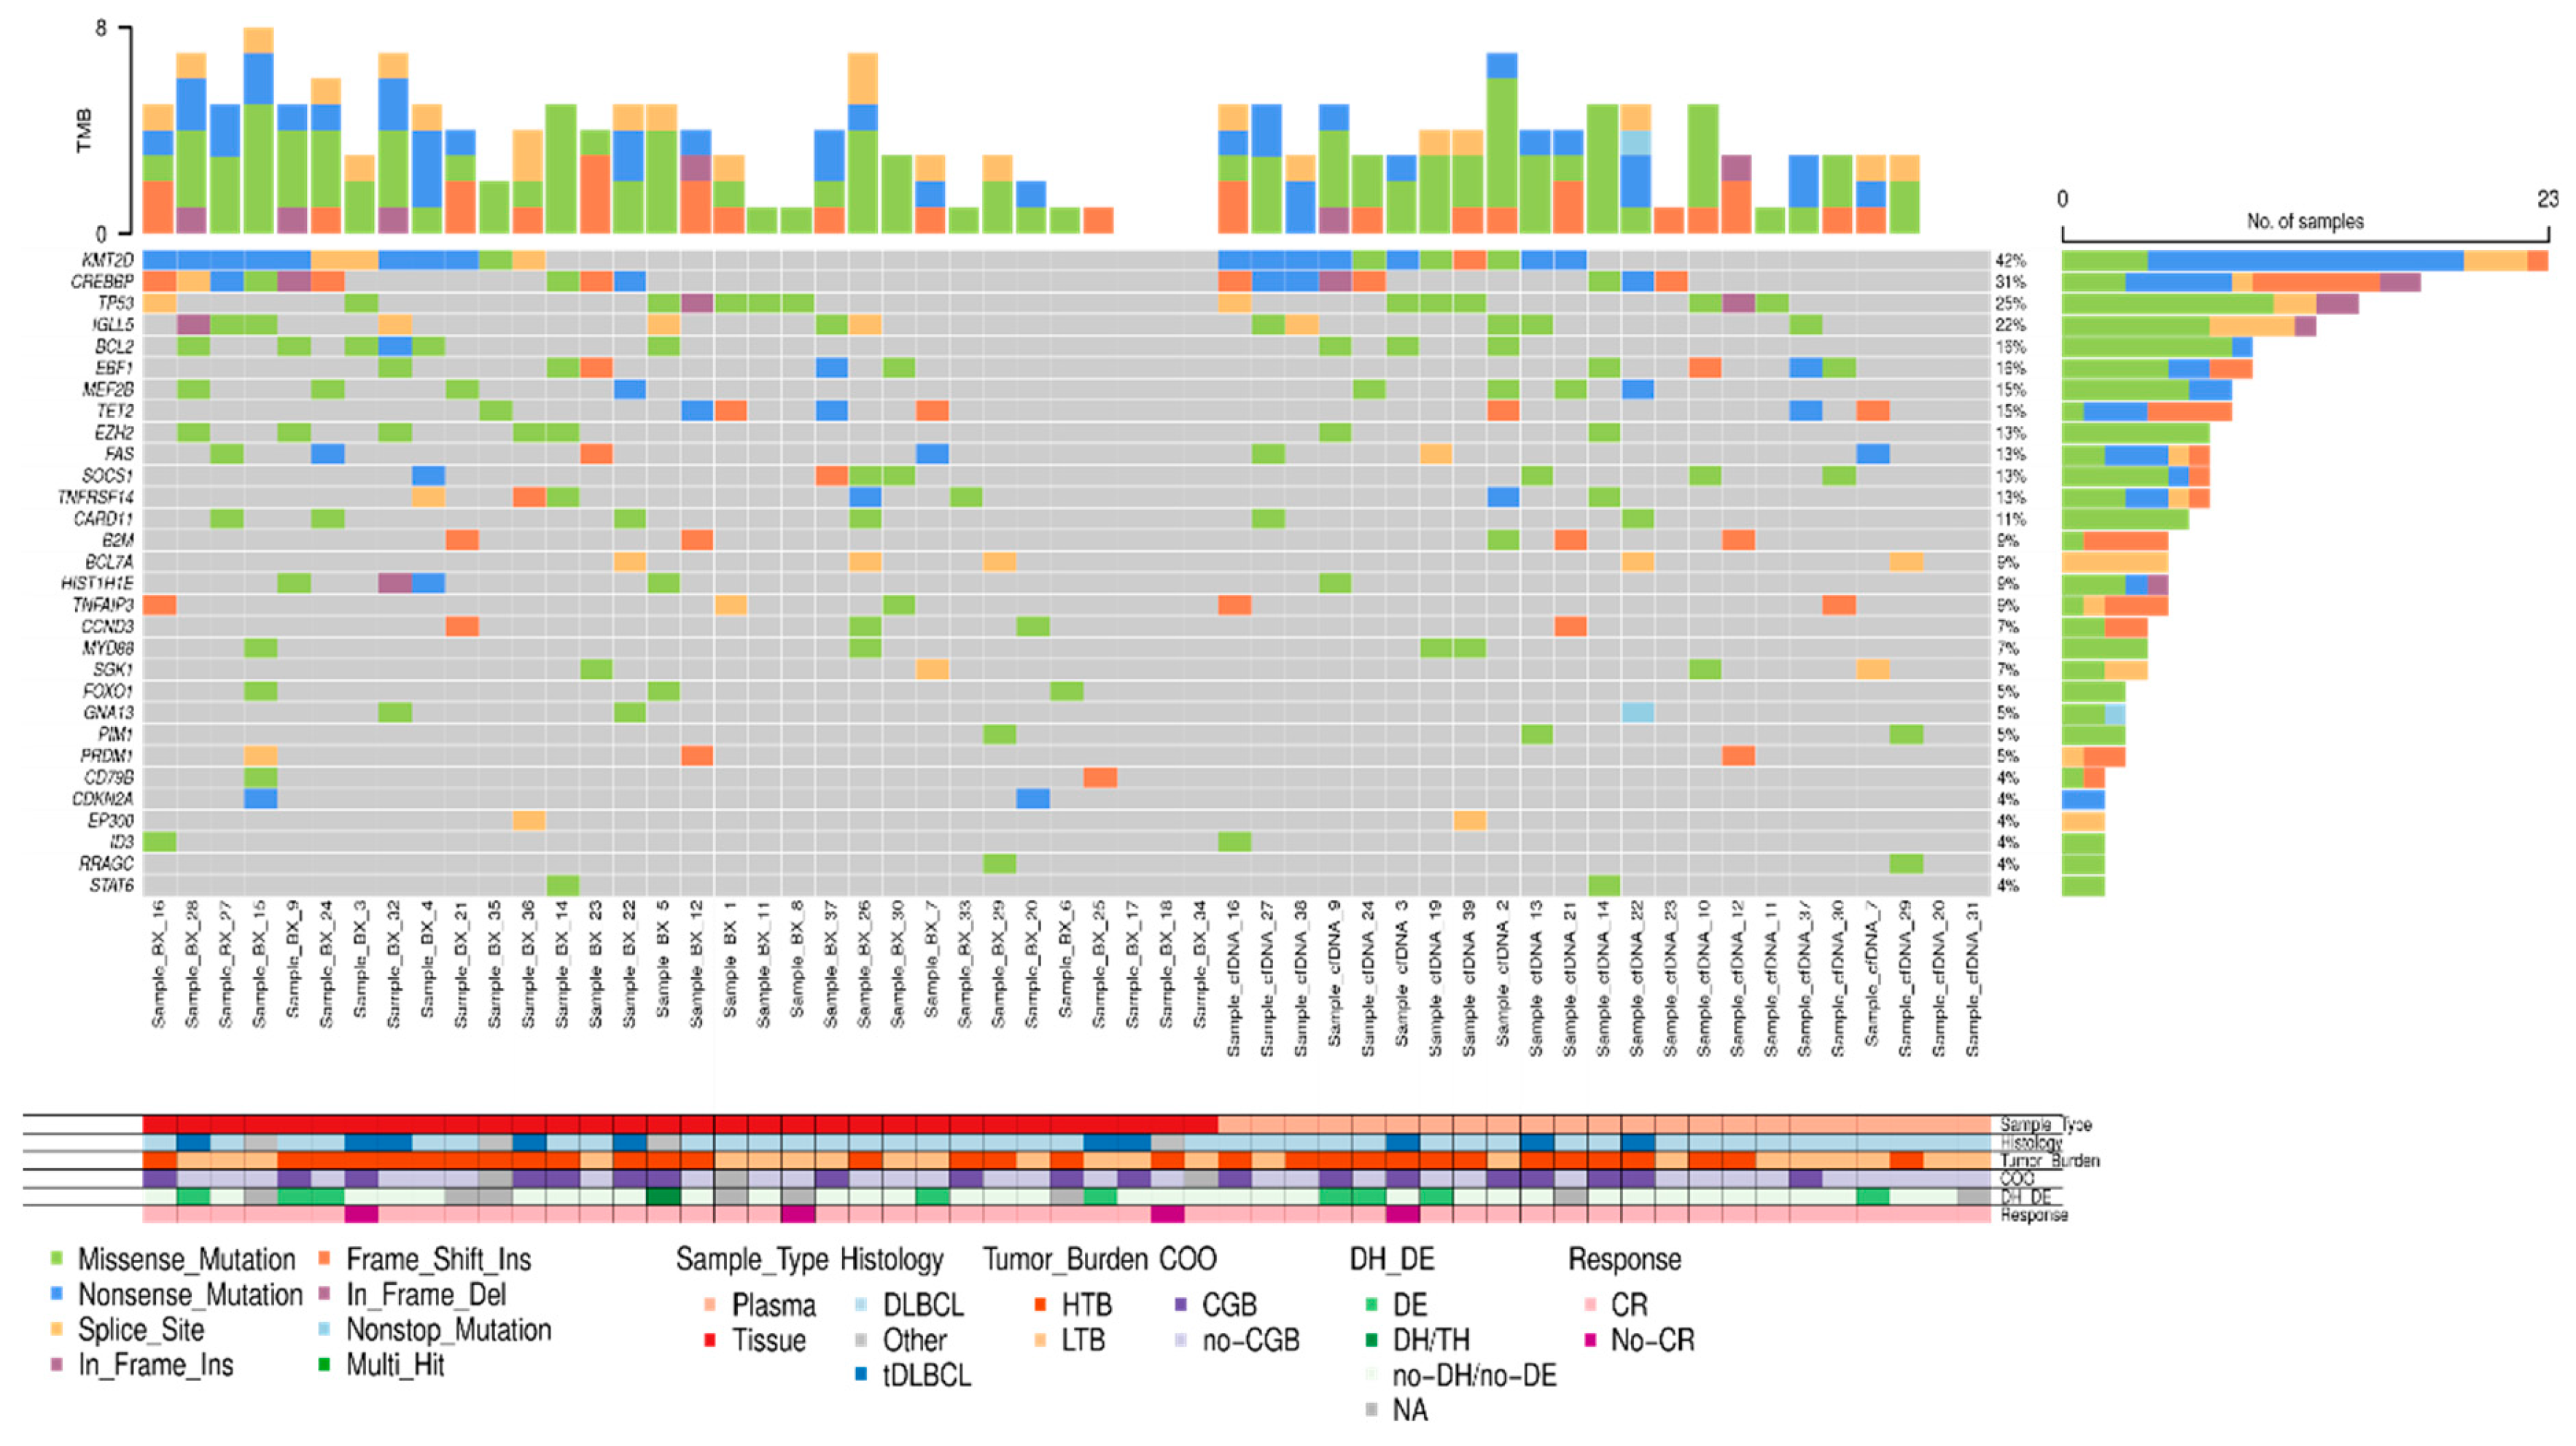
Figure 5.
Analysis of the mutational profile in 16 DLBCL with paired tissue and cfDNA samples. The black dots indicate the mutations present in the tissue that were not detected in the cfDNA. DLBCL: Diffuse large B-cell lymphoma, tDLBCL: transformations of indolent B-cell lymphoma, HTB: high tumor burden, LTB: low tumor burden, CR: complete response, DE: double expressor, DH: double hit, TH: triple hit, NA: not available.
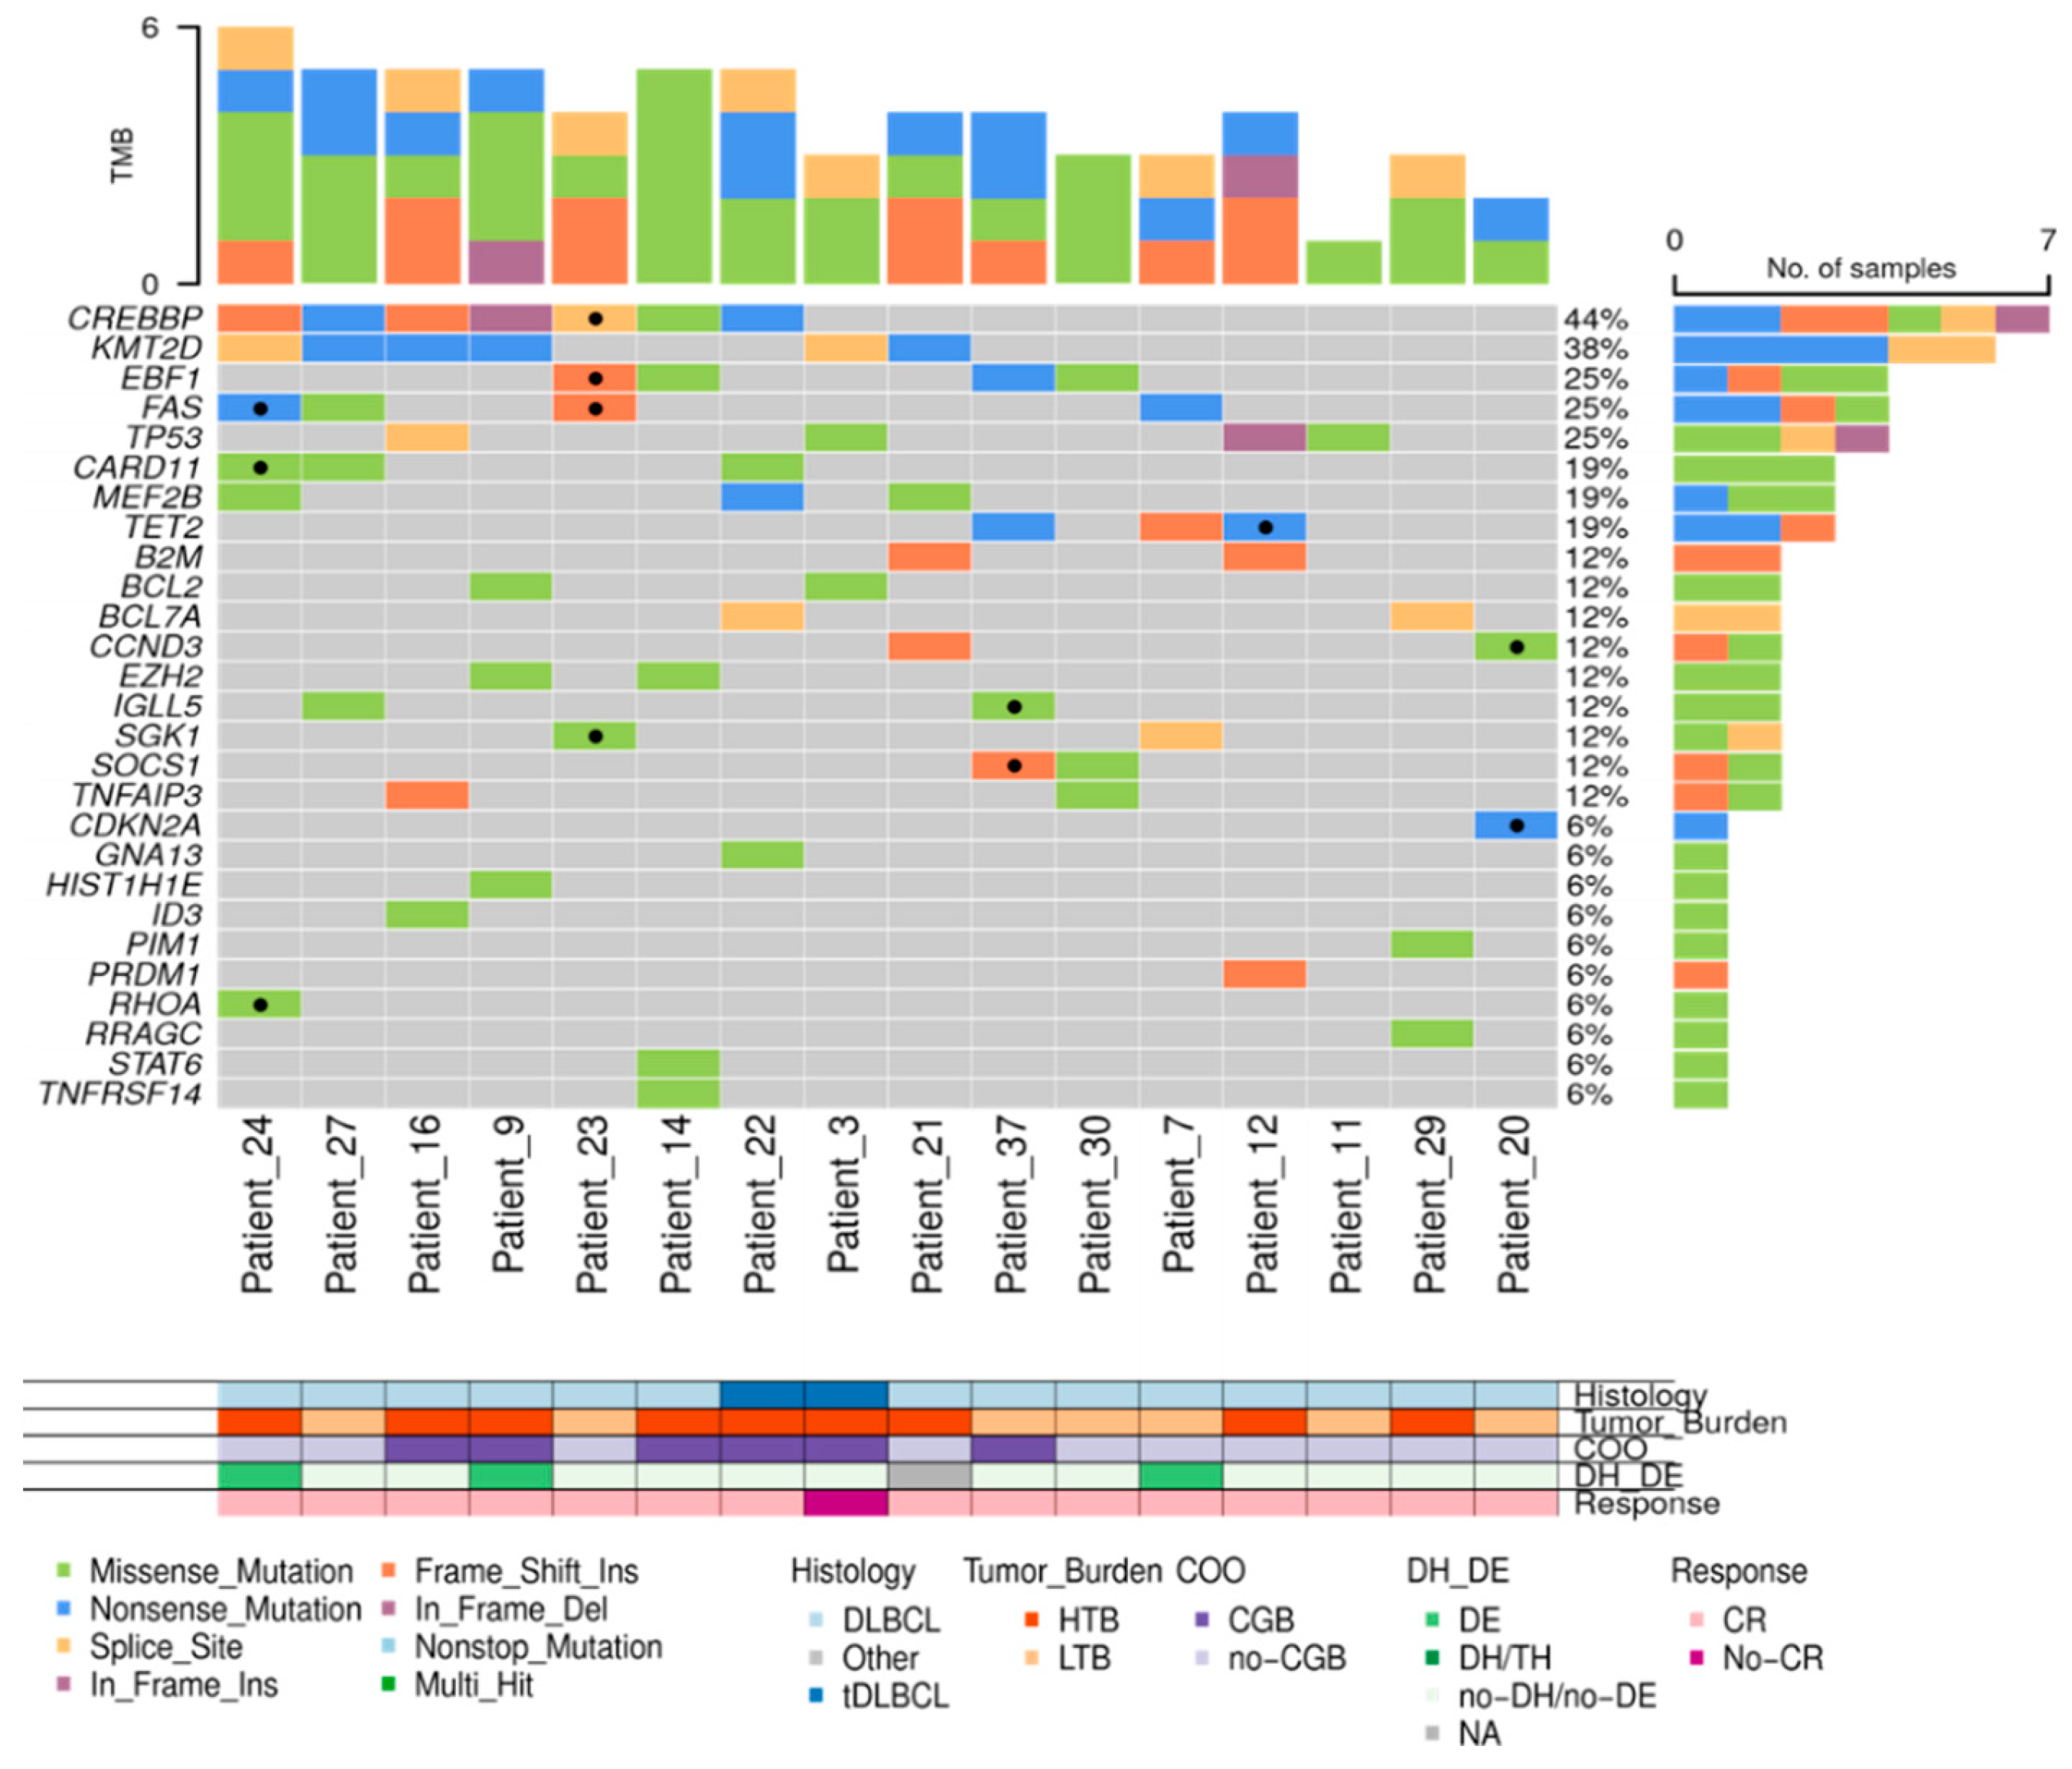
Figure 6.
A. Scattered plot showing correlation between Variant Allele Frequency (VAF) in cfDNA and tissue-DNA. Spearman test. B. Correlation between Variant Allele Frequency (VAF) in cfDNA and tissue-DNA with tumor burden in LBCL. Patients were classified in group A: Ann Arbor stage I/II and absence of bulky disease and group B: Ann Arbor stage III/IV or presence of bulky disease. In general, the Variant Allele Frequency (VAF) of the mutations were higher in tissue-DNA independently of the group. When comparing the group among them, group B vs group A showed a statistically significant higher VAF in cfDNA samples (p=0.0013). The dots represent gene mutations. The “boxes” represent the middle 50% of the data, with the top edge of the boxes indicating the third quartile (75th percentile) and the bottom edge indicating the first quartile (25th percentile). Median is represented inside each box. The "lines" (whiskers) extend from the box to show the range of the data (1.5 times IQR).
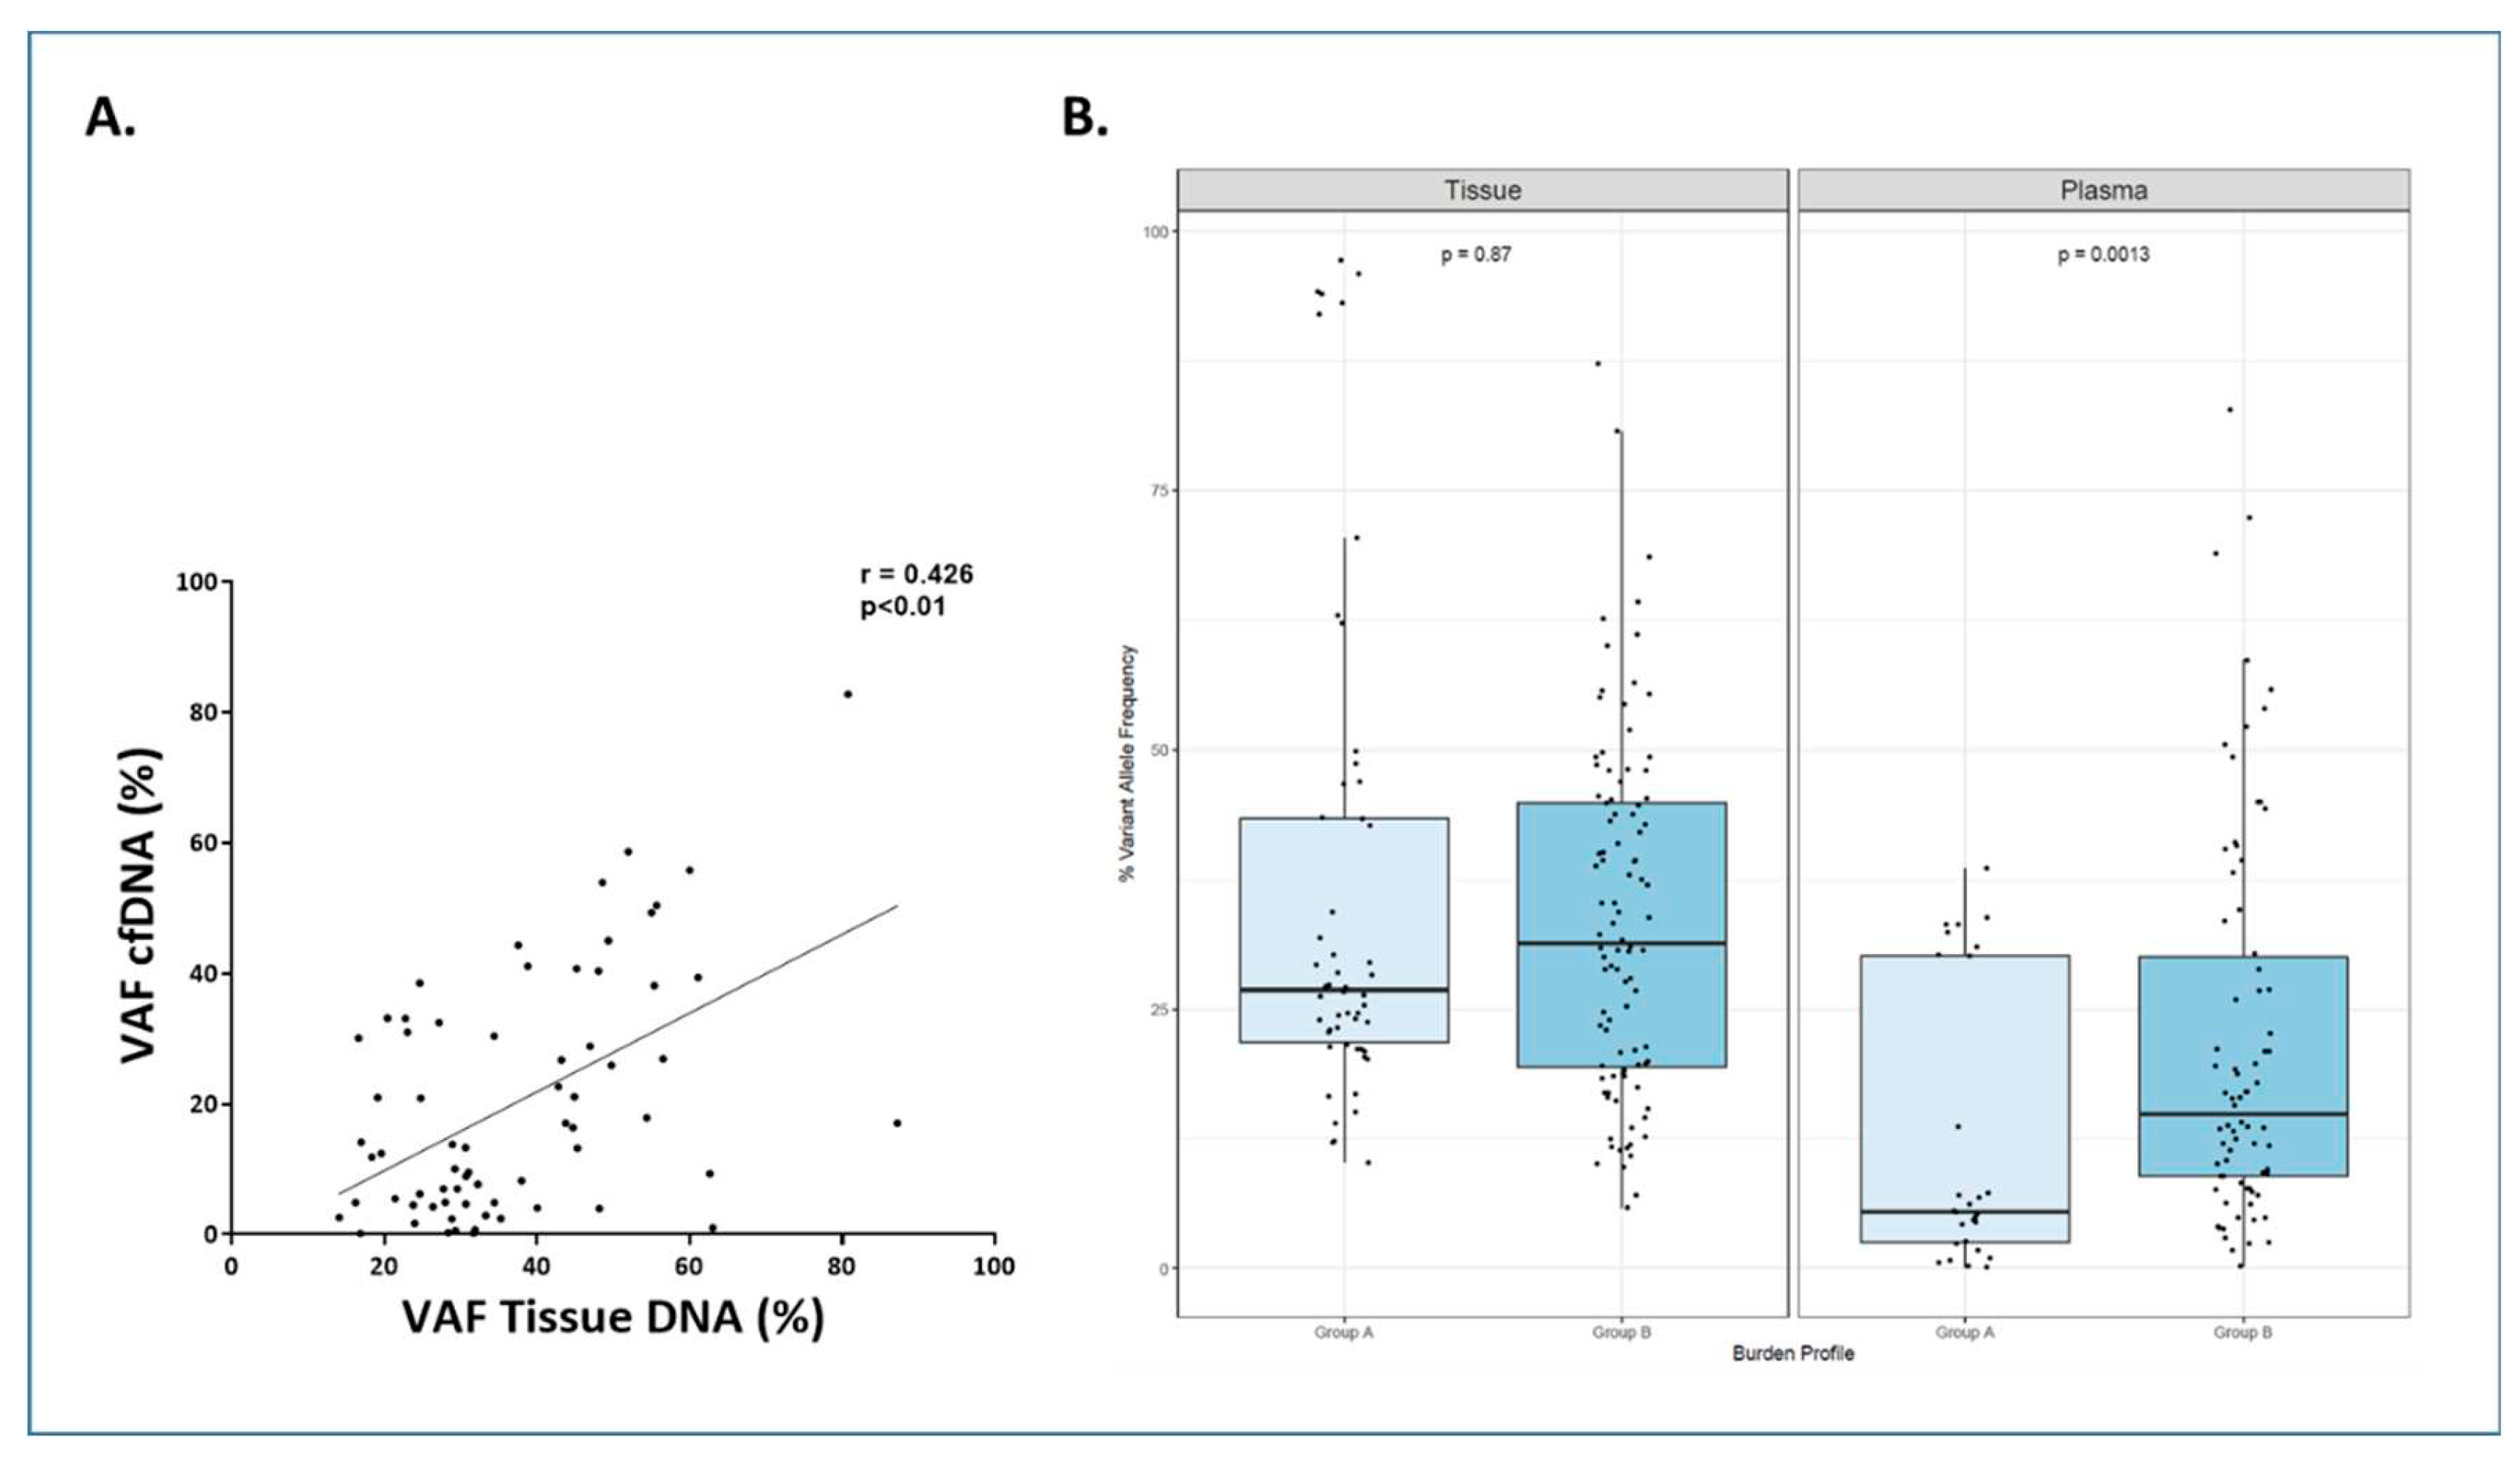
Figure 7.
cfDNA concentration (ng/mL) before and after therapy according to response (N = 43). Significant variations on cfDNA concentration were considered when at least 10% variation was observed between pre and post treatment values. Significant decreases are colored blue, significant increases are colored red and no variations are colored gray. A. Represents patients who achieved complete or partial response at the end of treatment (EOT). B. Represents non-responder patients who had stable or progressive disease at EOT. DX: Diagnosis.
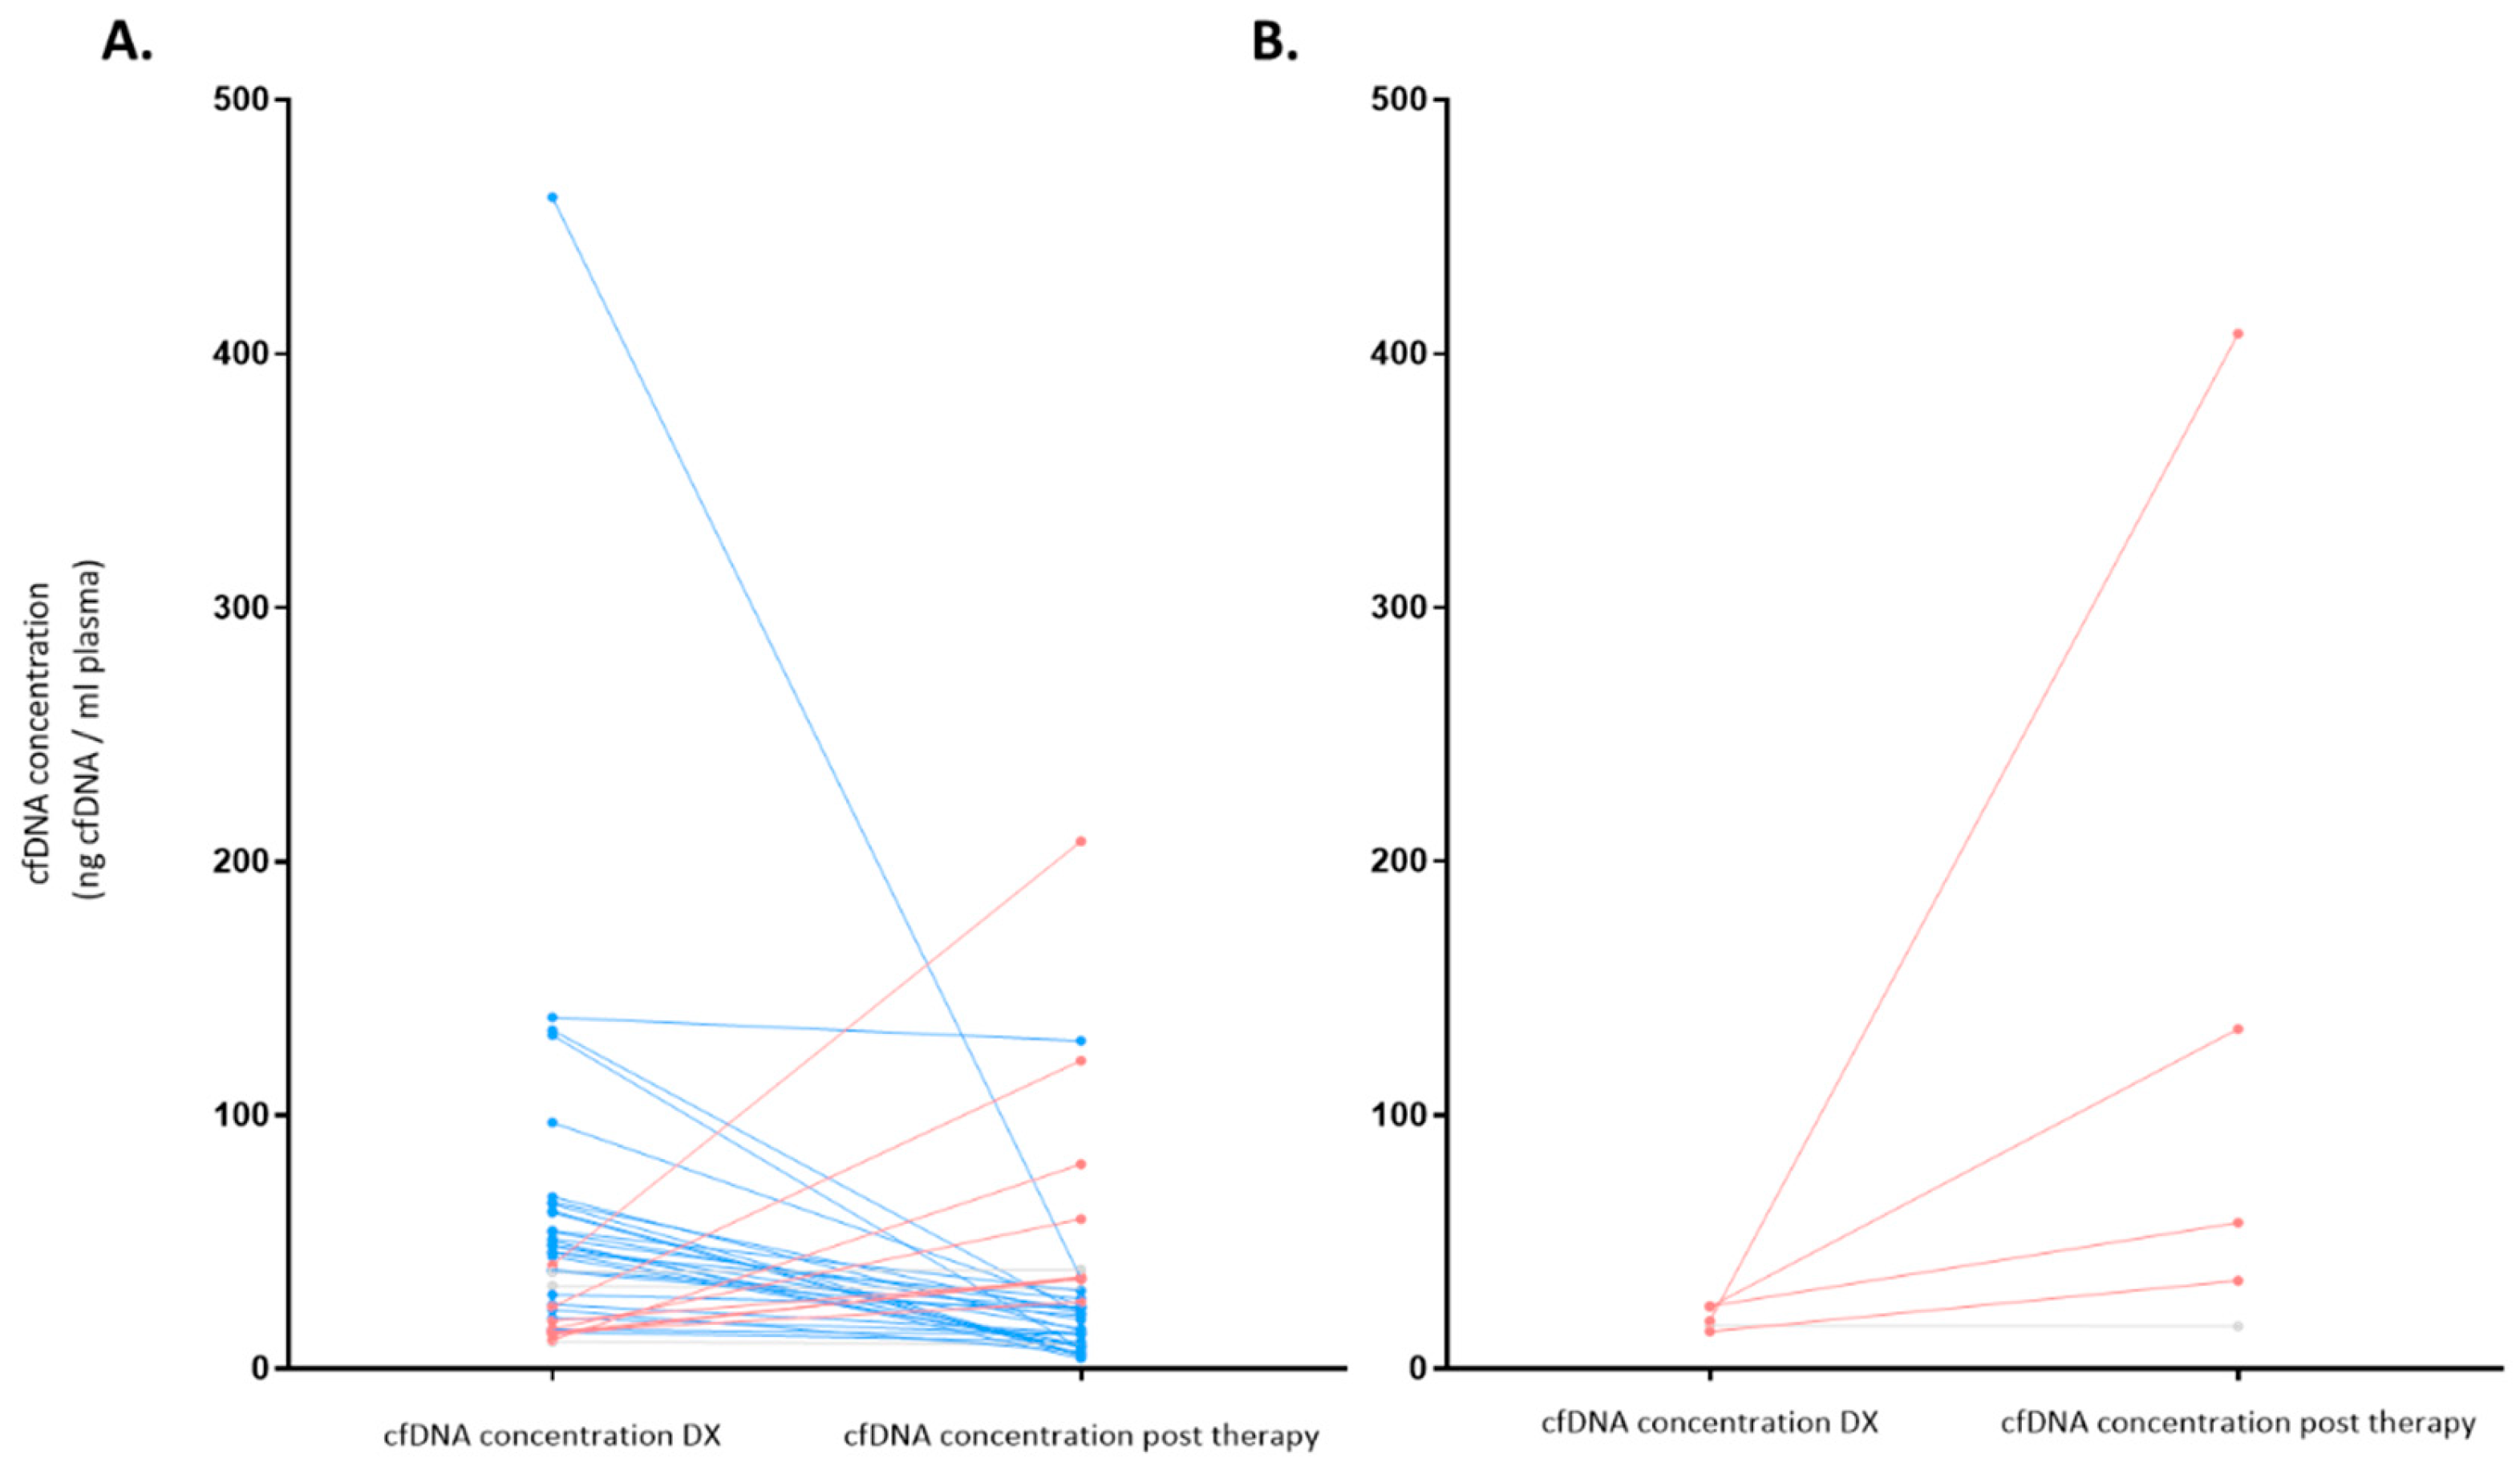
Figure 8.
Progression Free Survival (PFS) and Overall survival (OS) according to PET at end of treatment (EOT) and kinetics of cfDNA at the LBCL cohort (N:49). PET-/cfDNA -/+ group encompasses patients with a negative PET at EOT regardless of the cfDNA kinetics. PET+/cfDNA- includes patients with positive PET at EOT and decreased levels of cfDNA at the EOT. PET+/cfDNA+ encompasses patients with positive PET at EOT and increased levels of cfDNA at the EOT. Significant variations on cfDNA concentration were considered when at least 10% variation was observed between pre and post treatment values.
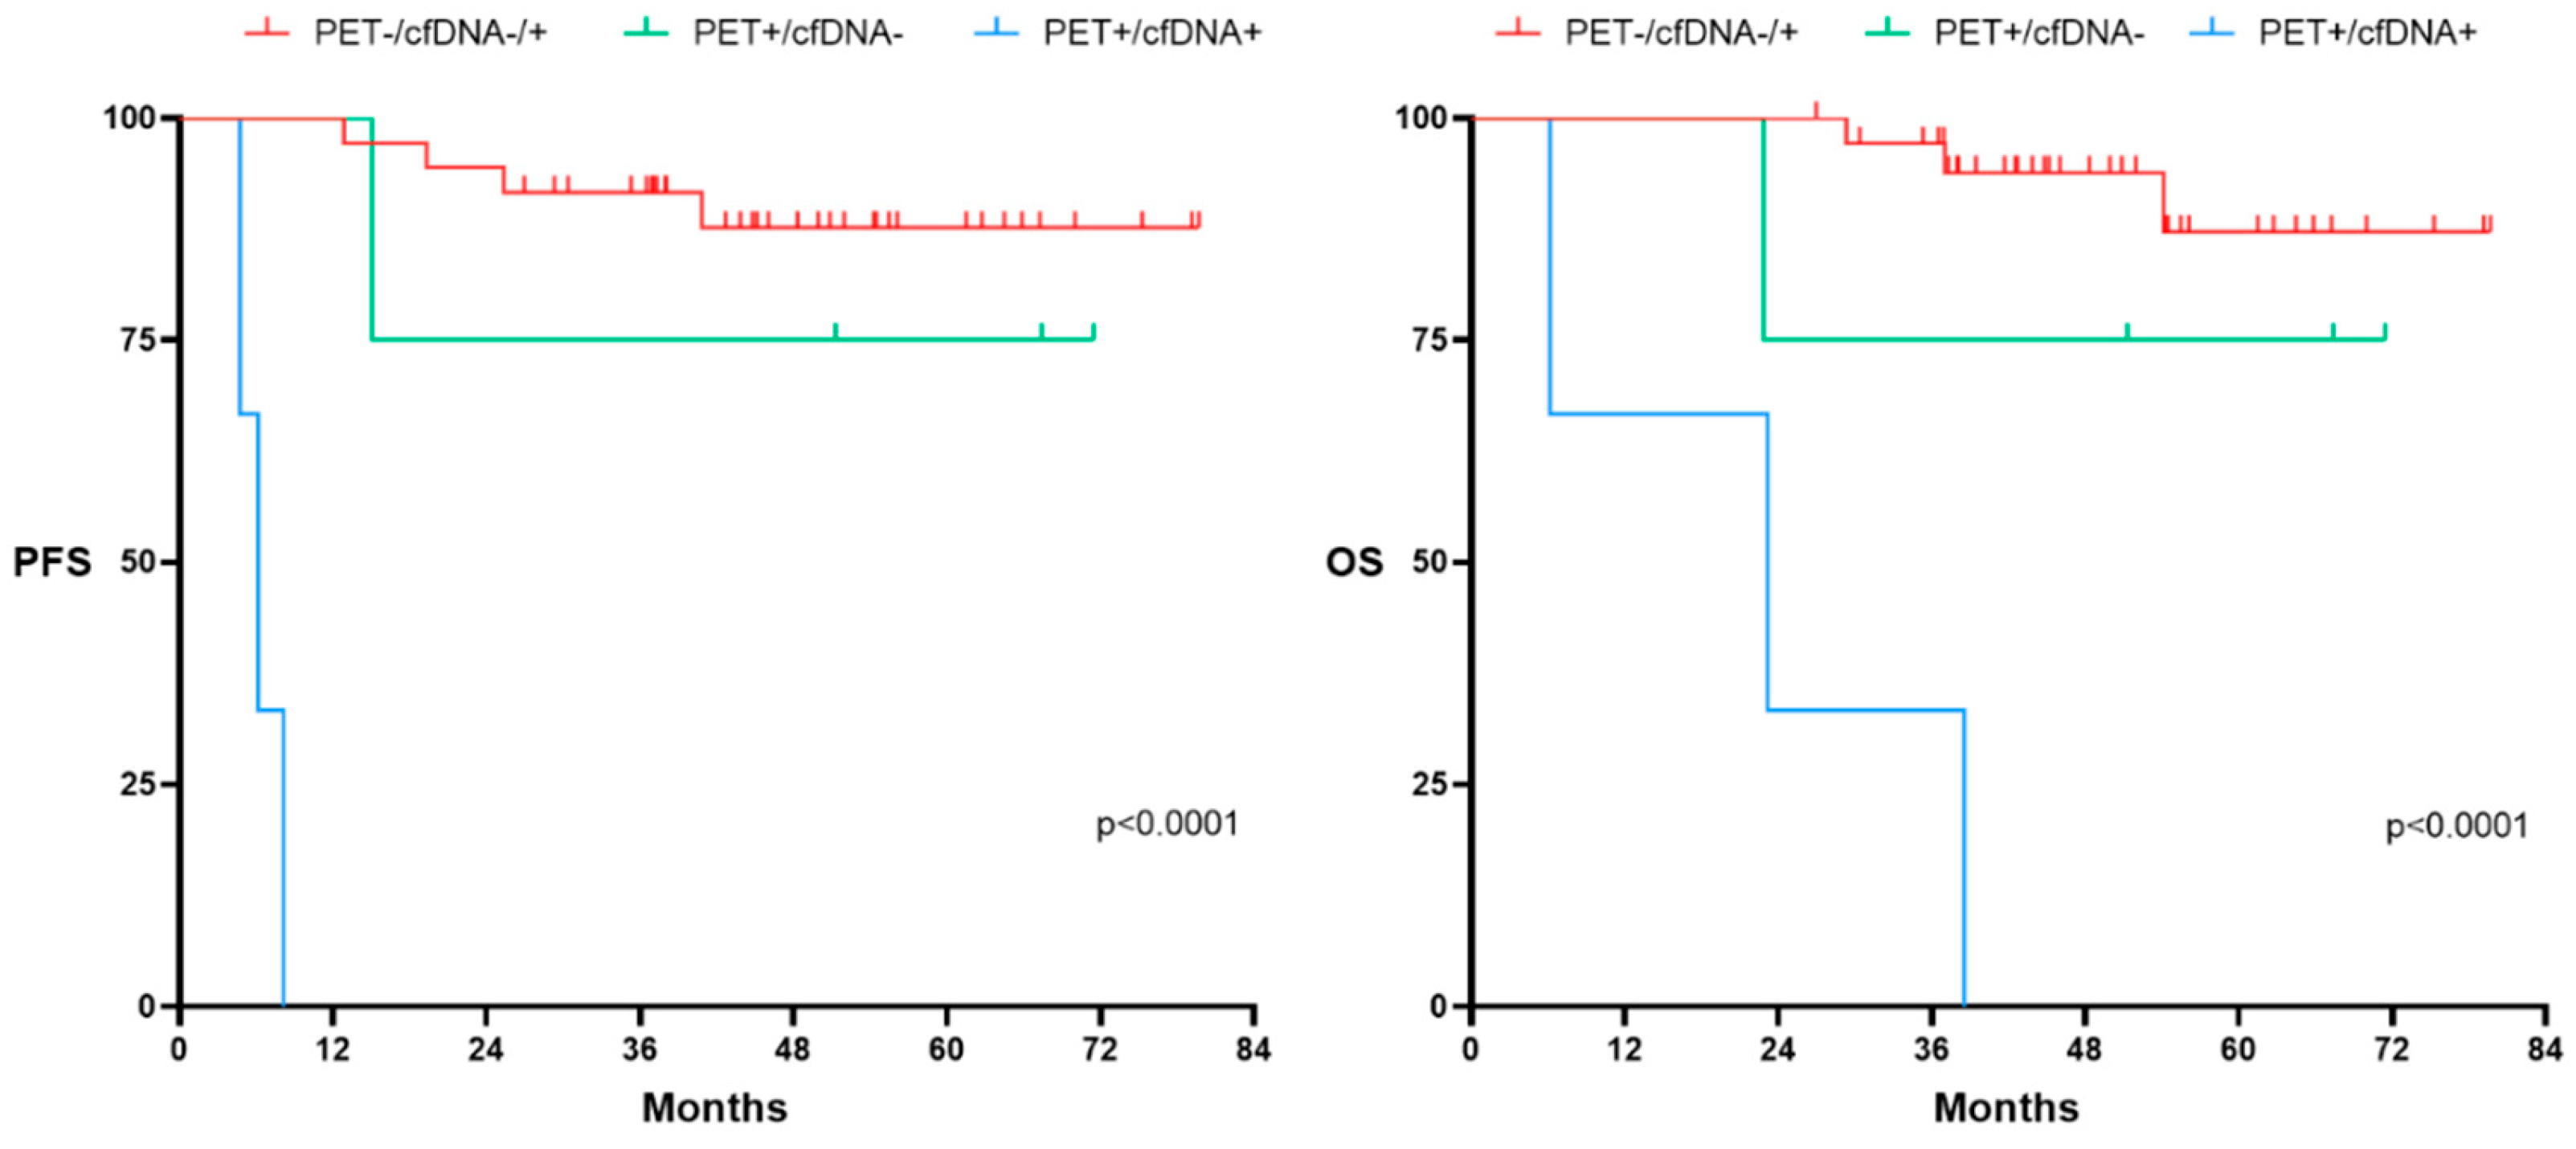

Table 1.
Clinical features of 249 patients with evaluable cfDNA at diagnosis. AA: Ann Arbor; LDH:
lactate dehydrogenase; BM: bone marrow. LBCL: large B-cell lymphoma; FL: follicular lymphoma;
MZL: marginal zone lymphoma; MCL: mantle cell lymphoma; SLL/CLL: small lymphocytic
lymphoma/chronic lymphocytic leukemia; LpL/WM: lymphoplasmacytic lymphoma/Waldenström
macroglobulinemia; BL: Burkitt lymphoma; LPS-NOS: circulating low-grade unclassifiable B-cell
lymphoma; cHL: classic Hodgkin lymphoma; AITL: angioimmunoblastic T-cell lymphoma; TL: T-cell
lymphoma.
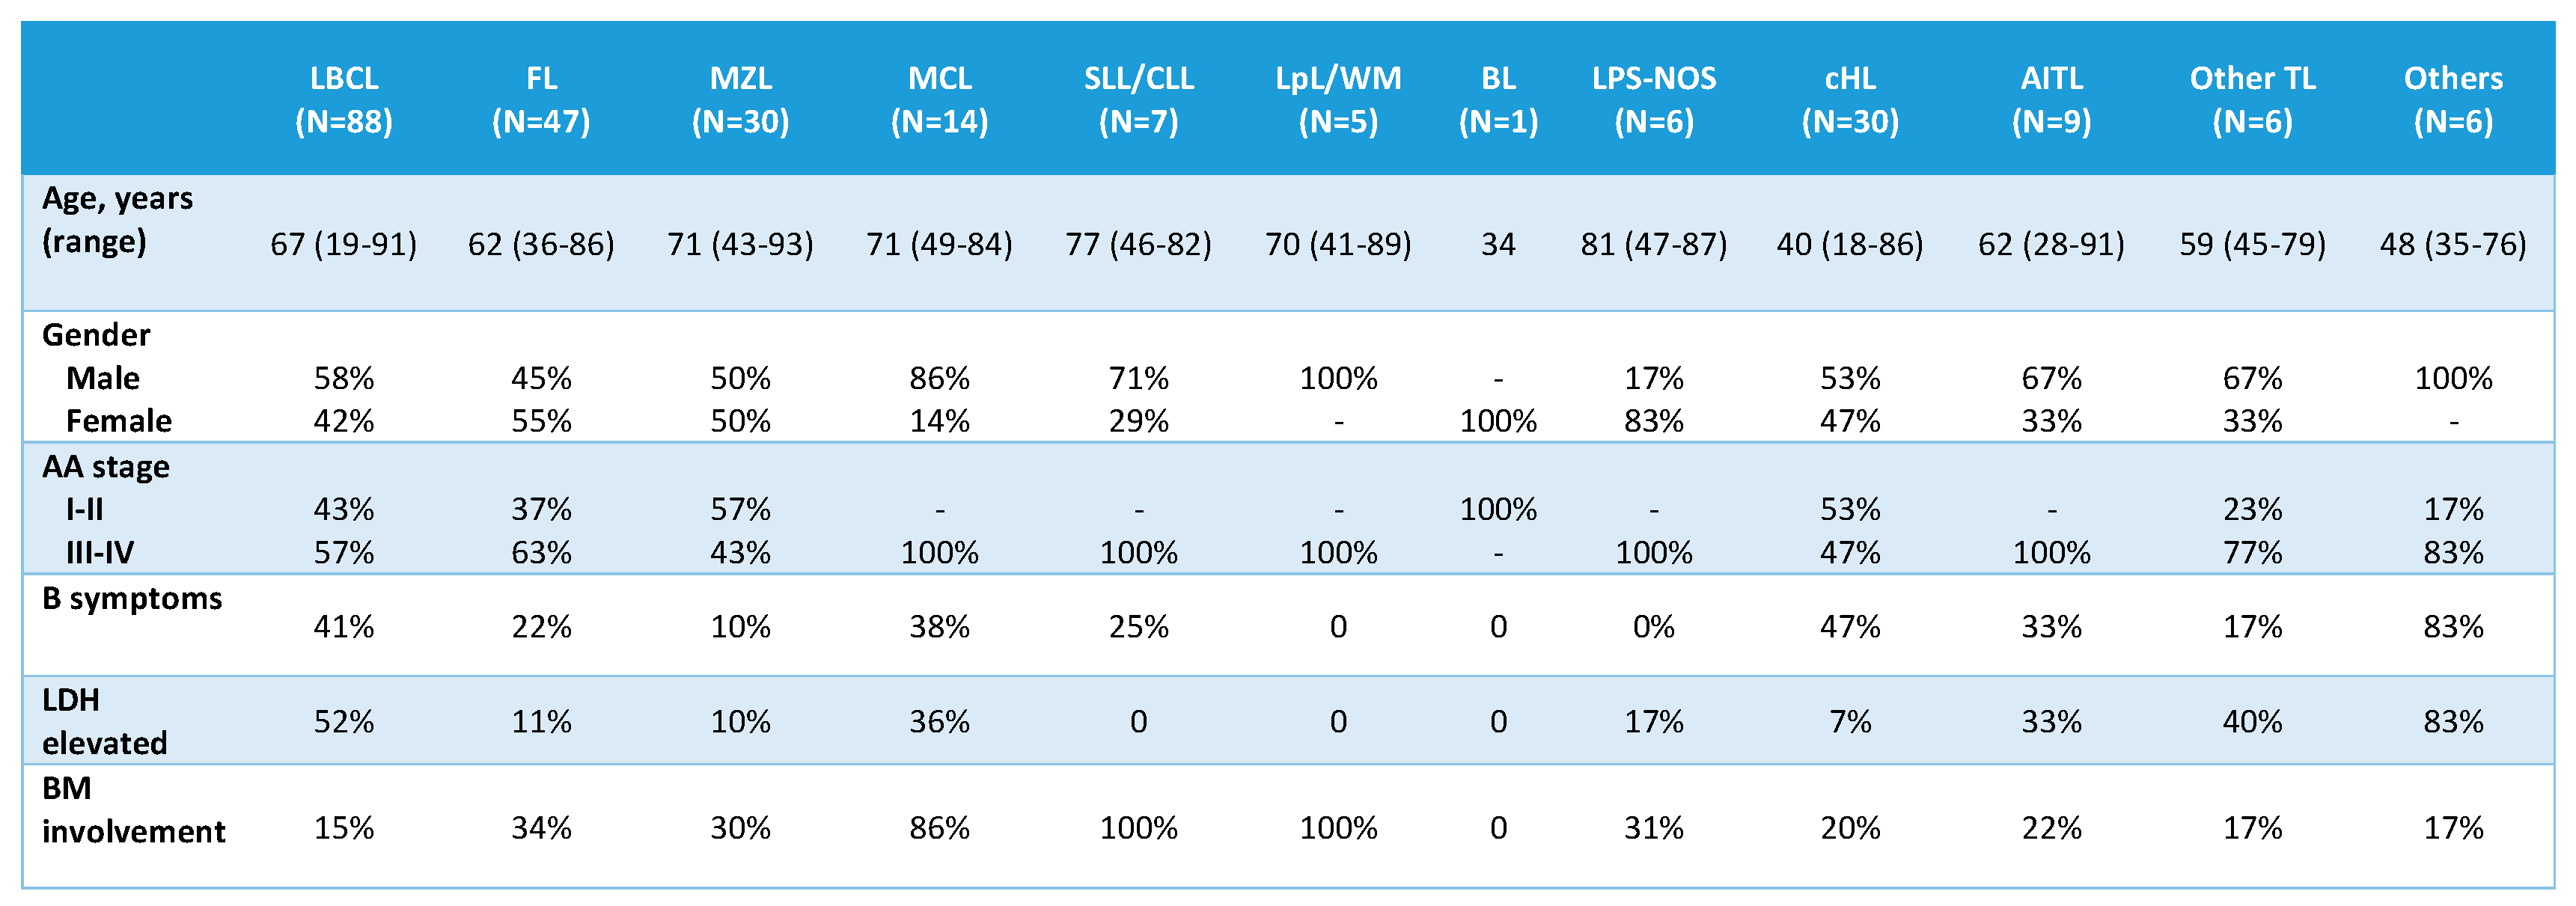
Table 2.
cfDNA levels (ng/mL) according to lymphoma subtypes and controls. LBCL: large B-cell
lymphoma; DLBCL: diffuse large B-cell lymphoma; NOS: not otherwise specified; PML: primary
mediastinal lymphoma; CNS: central nervous system; HGBL: high grade B-cell lymphoma
with MYC and BCL2 rearrangement; FL: follicular lymphoma; MZL: marginal zone lymphoma;
NMZL: nodal marginal zone lymphoma; EMZL: extranodal marginal zone lymphoma; SMZL: splenic
marginal zone lymphoma; MCL: mantle cell lymphoma; SLL/CLL: small lymphocytic
lymphoma/chronic lymphocytic leukemia; LpL/WM: lymphoplasmacytic lymphoma/Waldenström
macroglobulinemia; BL: Burkitt lymphoma; LPS-NOS: circulating low-grade unclassifiable B-cell
lymphoma; cHL: classic Hodgkin lymphoma; AITL: angioimmunoblastic T-cell lymphoma; TL: T-cell
lymphoma; IQR: interquartile range.
Disclaimer/Publisher’s Note: The statements, opinions and data contained in all publications are solely those of the individual author(s) and contributor(s) and not of MDPI and/or the editor(s). MDPI and/or the editor(s) disclaim responsibility for any injury to people or property resulting from any ideas, methods, instructions or products referred to in the content. |
© 2023 by the authors. Licensee MDPI, Basel, Switzerland. This article is an open access article distributed under the terms and conditions of the Creative Commons Attribution (CC BY) license (http://creativecommons.org/licenses/by/4.0/).
Copyright: This open access article is published under a Creative Commons CC BY 4.0 license, which permit the free download, distribution, and reuse, provided that the author and preprint are cited in any reuse.


