Submitted:
27 November 2025
Posted:
28 November 2025
You are already at the latest version
Abstract
The SNAKIN/GASA family comprises antimicrobial peptides with proven activity against phytopathogens that may play a significant role in citrus rootstock breeding. We identified 67 new curated GASA variants present in a germplasm collection. They were checked for the diagnostic 12-cysteine-domain and classified into three GASA subfamilies. Absolute expression of ten representative GASA genes was analyzed in floral, young leaf and mature leaf tissues from five accessions with contrasting levels of disease tolerance against Xanthomonas citri. Expression profiling revealed tissue-specific patterns, with higher transcript abundance in juvenile and floral tissues of tolerant accessions. Meta‑analysis of HLB‑related RNA‑seq datasets revealed the upregulation of specific GASA genes. Three candidate genes (PtGASA6, PtGASA8, and PtGASA10) derived from Poncirus trifoliata (a rootstock cultivar conferring disease tolerance), were selected and functionally assessed via transient overexpression in Nicotiana benthamiana. Overexpression of PtGASA6 and PtGASA10 significantly reduced disease symptoms caused by Pseudomonas syringae and enhanced hypersensitive response to Xanthomonas citri, whereas PtGASA8 showed no effect. Specific time-course dynamics and structural predictions suggest distinct antimicrobial mechanisms among these 2 genes. These findings provide new genetic targets for breeding and biotechnological strategies aimed at improving broad-spectrum bacterial disease resistance in citrus.
Keywords:
SNAKIN/GASA
; Pseudomonas syringae
; Xanthomonas citri
; Poncirus trifoliata
; broad-spectrum immunity
; antimicrobial protein
; Citrus germplasm
; Nicotiana benthamiana
; HLB
; AMP
; hypersensitive reaction
; agroinfiltration
1. Introduction
Antimicrobial peptides (AMPs) have emerged as promising molecular tools for enhancing plant immunity. The SNAKIN/GASA family represents a well-characterized group of cysteine-rich AMPs with multiple members and proven activity against bacterial and fungal pathogens in various plant species [1,2,3,4,5,6,7,8,9,10,11,12]. Some authors consider them to be the type of AMPs with the greatest effect against phytopathogens of fungal and bacterial origin [13]. These peptides exhibit broad-spectrum activity against bacterial and fungal pathogens and are implicated in diverse physiological processes, including growth regulation and stress responses [5,7,11]. Recent genomic surveys have revealed a large repertoire of GASA genes in citrus, with at least 18 annotated members and additional variants such as GASA9-like [14]. There are examples showing that the introduction of coding genes for antimicrobial peptides into citrus is a suitable alternative for the control of microorganisms [8,15,16]. Yet, functional characterization in citrus remains scarce, and the extent to which these genes contribute to broad-spectrum or specific immunity is unclear. Given the urgent need for durable resistance and the complexity of citrus breeding, identifying and validating endogenous GASA genes with antimicrobial activity could provide a strategic advantage for both conventional and biotechnological improvement.
The aim of this work is to identify and characterize new candidate endogenous genes by exploring the pan-genomic diversity of defense mechanisms among GASA genes present in Citrus rootstock germplasm, like P. trifoliata. This could help genetic breeding efforts by introgression or genomic edition of new resistance genes or alleles (yet to be discovered) present in germplasm accessions. In potato (Solanum tuberosum), members such as Snakin-1 and Snakin-3 have demonstrated strong antimicrobial effects and have been successfully deployed in transgenic strategies to reduce disease symptoms [1,7,11]. However, despite their potential, the mechanisms of action of GASA proteins remain poorly understood, partly due to pleiotropic effects that complicate functional studies.
Conventional breeding for disease resistance in citrus is notoriously difficult because of biological constraints, including long juvenile phases, apomixis, partial sterility, and frequent interspecific hybridization difficulty [17,18]. These limitations have shifted breeding efforts toward rootstock improvement, as tolerant rootstocks can confer resilience to the grafted scion [17,19,20]. However, different citrus accessions used as rootstocks were shown to confer very contrasting resistance or tolerance against bacterial diseases. Among these, trifoliate orange (Poncirus trifoliata) stands out as a key genetic resource due to its sexual compatibility with Citrus species and its documented tolerance to Huanglongbing (HLB) and other diseases [19,21].
Here, we adopt a pan-genomic approach to explore the diversity of GASA genes in citrus rootstock germplasm and to identify candidates with potential antimicrobial roles. We report the cloning and classification of 67 new GASA genomic variants across eight Citrus and related species, confirm their conservation within three major subfamilies, and analyze their expression patterns in tissues relevant to defense and development. To bridge genomic discovery with functional evidence, we selected three candidates—PtGASA6, PtGASA8, and PtGASA10—from Poncirus trifoliata, a rootstock known for its disease tolerance, and evaluated their activity in a model pathosystem using Nicotiana benthamiana challenged with Xanthomonas citri (incompatible interaction) and Pseudomonas syringae pv. tabaci (compatible interaction). Our findings provide new insights into the structural and functional diversity of citrus GASA proteins and highlight promising genetic targets for breeding and genome editing strategies aimed at improving bacterial disease resistance.
2. Results
2.1. Identification and Classification of New and Old Genomic Variants of Citrus GASA Genes
By using primers targeting conserved SNAKIN/GASA consensus DNA sequences, 67 different native genomic sequence variants present in a core Citrus germplasm bank collection were cloned and confirmed by DNA sequencing. All gene variants presented a signal peptide sequence and the SNAKIN/GASA domain, which includes the diagnostic signature of 12 cysteines in highly conserved positions. By using this information, a bioinformatic analysis was carried out using the NCBI [23,24] and Citrus Genome databases [25], in which the amino acid consensus sequence was used to identify the corresponding gene and obtain the probable identifiers of this family of proteins (see Table 1 and Figure 1).
Due to the difficulty of performing genetic crossing experiments and the high genomic diversity of the germplasm accessions (including interspecific hybrids, polyploids and diploid heterozygotic species) [2,3], it is challenging to differentiate polymorphic alleles of a single gene from different gene copies belonging to a related gene family (as in the case of GASA9 and GASA9-like). As expected, the variants that were cloned and sequenced in this work belong to both types (alleles of the same gene or paralog copies of different genes within the family). In Supplementary Figure 1, we illustrate possible bioinformatic interpretation errors that may occur in gene annotation of new sequences into the existing gene nomenclature. These 67 cloned genomic sequences were grouped into 16 different putative genes and designated according to the Citrus clementina GASA gene classification established by Wu et al. [4]. Sixteen of them (those present in Citrus x sinensis, Citrus x limon, and Poncirus trifoliata accessions) showed DNA and predicted protein sequences essentially identical to those annotated in the latest version of the reference Citrus sp. scaffolds [4] with just minor differences in their aminoacidic sequence. For Citrumelo (Citrus x paradisi x Poncirus trifoliata), 14 new GASA gene variants were cloned and sequenced. For Citrus jambhiri and Citrus warburgiana, the GASA genes cloned and sequenced were five for each of them (GASA6, 13, 5, 8 and 9-like; and 13, 11, 5, 8 and 9-like, respectively). For Citrus limonia and Citrus aurantium were six (GASA6, 13, 11, 5, 8 and 9-like, for both). The list of sequence names, gene IDs, number of exons, number of nucleotides in their coding sequences (CDS) and aminoacids in the encoded protein, are summarized in Table 1. Likewise, specific conserved domains allowed the subdivision into three subfamilies. Subfamily I showed two members: GASA6 and GASA13 (annotated as peamaclein). Subfamily II was represented by seven members: GASA8 (annotated as Gibberellin regulated protein 11); GASA9 (annotated as Snakin-2 or gibberellin-regulated protein 1-like), GASA9-like (annotated as gibberellin-regulated protein 1), GASA11 (annotated as gibberellin-regulated protein 14), GASA2 (annotated as Snakin-2 or gibberellin-regulated protein 3), GASA7 (annotated as snakin-2 isoform X1) and GASA5 (annotated as snakin-2-like). The subfamily III also showed seven members: GASA15 (annotated as Protein GAST1); GASA1 (annotated as protein GAST1-like), GASA10 (annotated as gibberellin-regulated protein 5), GASA12 (annotated as gibberellin-regulated protein 4), GASA3 (annotated as gibberellin-regulated protein 6), GASA14 (annotated as gibberellin-regulated protein 12-like) and GASA18 (annotated as protein GAST1).
2.2. Location of GASA Genes in Chromosomes and Synteny Blocks
These 16 identified GASA genes were mapped into six of the nine chromosomes of Citrus sinensis or into the seven chromosomes of Citrus limon and, to Poncirus trifoliata known sequence available in databases. The DNA sequence of the first two species is currently used as reference genomes together with Citrus clementina, because they were the first to be published, thoroughly curated and their genes are presented within their complete resolved haplotypes and located into their corresponding chromosomes maps [5,6,7] (see Figure 2). Although much more DNA sequence information for other Citrus species was published later (including P. trifoliata), these two reference genomes are the ones we show because they represented the most complete and best curated assemblies available. GASA8, 9 and 9-like were mapped in chromosome 3 in C. sinensis and C. limon reference maps, while in P. trifoliata they were mapped in chromosome 5. These 3 mentioned genes are part of a syntenic region in the chromosomes of C. limon, C. sinensis and P. trifoliata, where they show a common order of homologous genes and conservation of chromosomal sequences. In C. clementina only GASA8 and 9 have been annotated so far, but they are also joined in a syntenic block, like in C. limon, C. sinensis and P. trifoliata. In a similar way, GASA 11 and 12 are grouped in a syntenic block in C. sinensis, C. limon and P. trifoliata, as published in C. clementina. In the same way GASA14 and 15 are grouped in another syntenic block (see Figure 3).
2.3. Phylogenetic Analysis of GASA Genes
The phylogenetic relationship among all GASA proteins obtained from eight Citrus species was resolved in a dendrogram shown in Figure 4. As expected, all of them were clustered with their orthologs, i.e., the members of each subfamily grouped together. Evolutionary history was inferred using the Neighbor-Joining method [9]. These results indicate that, despite the important nucleotide sequence diversity evidenced, the 3 core subfamilies already found in other plant species, are conserved in Citrus germplasm as well [1,10,11,12,13]. This phylogenetic clustering leads to the hypothesis that defense mechanisms conferred by Citrus GASA genes may also follow three main possible modes of action (at least), according to the subfamily they belong to, as assumed in the studies described in section 2.5 and 2.6.
2.4. Differential Expression of Selected Citrus GASA Genes in Juvenile, Mature Leaves and Floral Tissues
Different Citrus accessions were shown to confer very contrasting resistance or tolerance against bacterial diseases [14,15,16]. Wu et al. [11] reported that GASA genes have a detectable basal gene expression in different tissues of a known cultivated variety of C. clementina. Based on these results, we followed a similar approach for the Citrus species analyzed here, with particular interest in the rootstock accessions used for breeding showing different levels of tolerance to bacterial diseases. To gain insight into the putative involvement of these new GASA candidate genes in broad-spectrum immunity, we measured their expression in juvenile tissues—specifically young leaves and floral tissues, which are expected to exhibit higher expression levels—versus mature leaves from C. limon var ‘Eureka’, C. reticulata var ‘Clemenule’, Poncirus trifoliata, Citrange Troyer and Rangpur by absolute quantitative RT-PCR (see Figure 5). This technique was used to quantify the number of transcripts corresponding to each of the genes and normalized for comparison of the baseline expression levels. Resulting absolute gene expression levels were represented by the heatmap shown in Figure 5.
In general, heterogeneous results were observed depending on the specific combination of GASA gene, plant genotype, and tissue analyzed. This variability becomes also evident in the next section, where the nucleotide sequence structure of the promoters is analyzed. Thus, heterogeneity could be attributed to the presence of multiple putative cis-regulatory elements in GASA gene promoters which are potentially influenced by tissue specificity, developmental stage, hormones, light, and other environmental factors. However, taking all the data together, there is a clear tendency for flower tissue and juvenile leaves to show (on average) higher levels of expression than mature leaves, suggesting that both tissue and ontology specificity are the predominant factors influencing expression. Overall, GASA genes with the highest expression levels (shown in dark red) were found in the tissues of interest (young leaf and/or floral tissue) in agreement with previous observations [17]. In contrast, the lowest expression levels were found in mature leaves (dark blue color). Among the genes with the highest accession-specific expression were: GASA9-like, 10, 11 and 12. On the contrary, GASA13 showed the lowest expression level in general. When considering GASA genes all together for most accessions, the best expression levels were observed for GASA1, 6, 9-like, 10, 11 and 12. Finally, when levels of expression were considered for each specific genotype, P. trifoliata, Citrange Troyer and Clemenule showed the highest tissue specific expression in flower tissue and young leaves.
Since the aim of this work is to identify and characterize the pan-genomic diversity of defense mechanisms among GASA genes present in Citrus rootstock germplasm, we decided to select at least one representative member from each subfamily branch to continue the functional characterization, regardless of the comparative level of basal expression between subfamilies. In addition, we considered (within each subfamily), other alternative criteria than showing high expression in young leaves or floral tissue of the plant. For instance, GASA6 (from subfamily I) was selected because it is the closest relative member to Snakin1 from Solanum tuberosum (StSN1), which is well known as antimicrobial peptide against multiple fungi and bacteria in different pathosystems [18,19,20,21,22] and showed better expression levels than its alternative in subfamily I (GASA13), which exhibited the lowest expression levels. Likewise, GASA8 and 10 are orthologs of StSN2 and StSN3, respectively. GASA8 presented a good expression in the floral tissue of P. trifoliata (an HLB-tolerant rootstock) and is also the only one that has a decreased expression in Rangpur, a rootstock with greater susceptibility to pathogens [3,15]. GASA10 showed a markedly higher expression in the most tolerant rootstock accessions (Citrange Troyer and P. trifoliata) and contrasting low levels in two of the most susceptible cultivars (C. clementina and C. limon var. Eureka).
Wu et al. [11] also reported that after experimental infection with X. citri in detached leaf explants of C. clementina, the expression of certain GASA genes is significatively increased, including CcGASA8 (among other 9 genes). We decided to look for the induction by alternative bacterial pathogens like Candidatus Liberibacter (the fastidious bacterium causing HLB disease). Because of its economic importance, there is a good deal of BioProjects deposited in public databanks like DDBJ, EMBL–EBI, NCBI as described in Supplementary Table 1. Such differential expression profiling can be associated with a response to HLB disease both, in susceptible Citrus cultivar species like C. sinensis or in HLB tolerant species like C. australasica [23,24]. In this context, recent publications report the upregulation of AMP genes after infection of HLB-resistant C. autralasicus plants with CLas [24]. To that end, a bioinformatic comparative analysis of RNASeq profiling specific for the different GASA genes was performed from the already mentioned public datasets. The results obtained from this approach are depicted in Figure 6. In the specific case of BioProject PRJNA417324 [25] (carried out using CLas infected leaves from C. sinensis), GASA10, 11, 12 and 13 significantly increased their expression over time until the last evaluation on day 322, showing their highest levels at that point, with a significant relative expression value for GASA10 of 4.7. Likewise, BioProject PRJNA645216 [26] denotes a significative time dependent specific increase of GASA6 and 14 up to 5 days post infection (dpi) in HLB infected oranges (using Diaphorina citri vector) when compared to uninfected negative controls. On the other hand, it is also worth mentioning that GASA8 showed the strongest downregulation effect in uninfected plants, while this did not occur in the infected ones. For BioProject PRJNA755969 [23], a non-significant trend for higher gene expression in leaves of C. australasica was observed for GASA8 and 14, while GASA12 showed a statistically significant increase. This last comparison may become relevant considering that the C. australasica belongs to a species considered to be tolerant to HLB [14,15,23,27].
In summary, GASA6 (subfamily I), 8 (subfamily II) and 10 (subfamily III) present both phylogenetic and structural distance between them, sequence similarity to well-studied orthologs in S. tuberosum, exhibit good basal expression levels in the juvenile leaves and/or floral tissue and demonstrate differential response in infected plants compared to their negative controls and/or increased levels of expression. As can be seen in Figure 6, in the last case, some reports demonstrated the upregulation of GASA8 after infection of C. clementina leaf explants with X. citri [11] or its downregulation with CLas in C. sinensis, while GASA6 and 10 were upregulated with CLas [25,26].
In addition, it is worth noticing that the rootstock species Poncirus trifoliata, known to be tolerant to HLB [21,38,40], presented high expression of GASA6, 8 and 10 in floral tissue, while the same happened with GASA6 and 10 in young leaves. Therefore, GASA6, 8 and 10 genes from P. trifoliata origin were selected for further evaluation of their potential antimicrobial activity by performing in planta experiments.
2.5. Promoter Analysis of Citrus GASA 6, 8 and 10 Selected Genes
SNAKIN/GASA peptides are not only known for playing an important role in response to pathogens but also display diversified biological activities in many aspects of plant growth and the development process that influence their relative expression. We decided to look in the promoter region of the selected genes from P. trifoliata in order to find if there are any specific cis-regulatory elements that may explain the above observed expression patterns. Thus, the putative promoter sequences from GASA6, GASA8 and GASA10 from Poncirus trifoliata, Citrus limon and Citrus sinensis were analyzed using the database of Plant cis-acting Regulatory DNA Elements (PlantCARE) to predict their cis-regulatory elements (see Table 2). Several abiotic stress-related cis-regulatory elements were identified, being clearly prevalent those putatively involved in light responsiveness (GATA-motif, GA-motif, ATCT-motif, TCT-motif, I-box, G-box, Box 4, AE-box, LAMP-element, GTGGC-motif, AF1 binding site, chs-CMA2a, GT1-motif). This cis-regulatory element composition is expected for leaf and floral tissues. Some other motifs found are hormone-related, like the methyl jasmonate-responsiveness elements (TGACG-motif, CGTCA-motif). They were found in all analyzed genes, except for GASA6 and GASA10 in C. limon. An ABA-responsive element (ABRE) involved in the abscisic acid response was also present in all analyzed genes, except in GASA8 of C. limon and P. trifoliata or in GASA10 of P. trifoliata. Another number of cis-regulatory elements associated with gibberellin-responsive elements (TATC-box, P-box), auxin-responsive elements (AuxRR-core) were also observed. Interestingly, a salicylic acid-responsive element (TCA element) was identified exclusively in the promoter of GASA10 gene from P. trifoliata (among all the genes analyzed). Since salicylic acid plays a master role in host-pathogen interactions, this distinctive presence may have an eventual connection to the upregulation of PtGASA10 gene upon HLB infection described in the section before. In the same way, in some of the GASA genes analyzed, other cis-regulatory elements were found, such as environmental response factors like low temperature response (LTR) and anaerobic induction. Likewise, elements involved in expression/differentiation of some tissues (palisade mesophyll cells, meristem, endosperm cells) were also found and may contribute to the tissue-specific expression patterns observed in Figure 5. For example, GASA10 promoters of the three Citrus species showed a putative meristem-specific cis-regulatory element. The same occurs for GASA8 which contains a leaf mesophyll-specific element. GASA8 and GASA10 also possess MYB binding sites putatively involved in flavonoid biosynthetic genes, drought-inducibility (MBSI and MBS) and light responsiveness (MRE). These results suggest that GASA genes are potentially involved in development processes and multiple abiotic stress responses, consistent with observations reported in other plant species. Except for the mentioned tissue-specific regulatory elements, which may explain the differences in basal gene expression levels between young and mature leaves or between flower tissues and leaves shown in Figure 5, and for the salicylic acid-responsive motif present in P. trifoliata GASA10 promoter, no highlighting differences were detected in the promoter sequences when homologous GASA genes from the three species were compared.
2.6. Overexpression of PtGASA6 and 10 Decreased Disease Symptoms Caused by Pseudomonas syringae pv. Tabaci
To assess the antimicrobial effect of selected GASA genes, we employed an in planta assay based on Nicotiana benthamiana agroinfiltration. This species was chosen because it is a well-established model for transient gene expression, is susceptible to several pathogens (making it a useful system studying plant–pathogen interactions) and has a fully characterized genome. Overexpression of PtGASA6, 8 and 10 genes was significant (p-value < 0.001) in agroinfiltrated leaves containing the corresponding gene constructs. PtGASA6, 8 and 10 showed 9.28. 6.72- and 5.78-fold increases in expression relative to the control, respectively (see Supplementary Figure 2). A disease assay was then performed by inoculating N. benthamiana with Pseudomonas syringae pv. tabaci, a natural pathogen of this plant species. To accomplish this, we performed three independent co-infiltrations with A. tumefaciens expressing PtGASA6, PtGASA8 or PtGASA10, or with an empty Ti plasmid A. tumefaciens as a negative control. Each leaf was infiltrated at 6 identical positions across 15 biological replicates (see Figure 7).
The development and progression of necrotic disease symptoms in individually infiltrated leaf circles were monitored for 7 dpi. The disease symptoms were measured using a Disease Index (DI). As a result, the overexpression of PtGASA6 and 10 significantly reduced symptom development compared to PtGASA8 or to the negative control. This reduction was especially fast and conspicuous for PtGASA10 (see Figure 8).
As the disease progressed, symptoms severity was monitored over time, and leaves expressing PtGASA6 or PtGASA10 presented much milder symptoms than those expressing PtGASA8 or the negative control, with PtGASA10 showing the greatest delay in disease progression (Figure 8). These data were subsequently used to calculate the area under the disease progress curve (AUDPC), revealing that PtGASA6 and especially PtGASA10 showed a significant reduction in AUDPC, indicating that the decrease in symptoms relative to the control persisted throughout the evaluation period (Figure 9).
2.7. Overexpression of PtGASA6 and 10 Increased Hypersensitive Response (HR) After Leaf Infiltration with Xanthomonas citri
Since disease symptom progression caused by P. syringae infecting N. benthamiana was retarded when PtGASA6 or 10 were overexpressed, a possible role in defense could be attributed to these genes. To confirm this hypothesis, we conducted an in planta HR assay by inducing this response through syringe-infiltration of 1x10⁷ cfu/ml of X. citri in N. benthamiana, considering that X. citri is non-pathogenic bacterium in this species. This experiment provides a contrasting scenario between a typical incompatible host-pathogen interaction and the compatible interaction analyzed in the previous section, in the well-known N. benthamiana model. Although X. citri induces an HR response in N. benthamiana, it is a highly pathogenic bacterium in Citrus varieties, making it interesting to analyze these results in connection with potential Citrus defense mechanisms.
A significantly higher induction of HR symptoms was observed upon overexpression of PtGASA10 and, especially, PtGASA6 (Figure 10 and Figure 11). In contrast, overexpression of PtGASA8 did not result in consistent significant differences compared with the negative control among both repetitions. The disease symptoms were quantified using an HR index (Figure 12). Each of the 6 infiltrated leaf circle positions was individually monitored across all leaf replicas at 14 dpi for visible HR symptoms (Figure 9B). PtGASA10 and particularly PtGASA6 presented a meaningfully increased HR response trend (Figure 12).
Interestingly, PtGASA6 enhanced the hypersensitive response by 30% more than PtGASA10, whereas PtGASA10 delayed necrosis by 40% more than PtGASA6. These contrasting results suggest that the mode of action of these proteins is different (Supplementary Figure 3). Collectively, the HR and disease assay results suggest that immunity may be heightened through rapid priming of an HR, potentially sustained over time, as indicated by the consistent trend line observed during GASA overexpression which remains relatively stable. Therefore, a reduction in disease symptoms is observed. However, an additional or parallel mechanism may also be involved. This is supported by the observation that PtGASA6 exhibited statistically significant higher DIs and AUDPCs in comparison to PtGASA10, but also a more pronounced HR index and area under the hypersensitive response progress curve. As detailed in discussion, we propose a model to illustrate these differences (Figure 13).
2.8. Structural and Funtional Comparison Between Predicted Tridimensional Structures of Citrus GASA Proteins Versus Reference SNAKIN Proteins from Solanum tuberosum
It was reported that the ability of plant AMPs to act against a large spectrum of pathogens depends on their structural stability [28,29]. For this reason, a comparative evaluation of the tertiary structure of the selected peptides was performed using the Alphafold2 tool and MMseqs2 [30] in the Colab v1.5.5 environment [31,32] to generate their structural visualization. The structures were then visualized using the NGL Viewer tool [33]. As can be observed in Figure 14, all proteins analyzed are predicted to adopt a helix-turn-helix (HTH) motif as well as random coil folding motifs. A common motif (denoted with a dotted line ·······) presented an identical conformation across all members of the three subfamilies and is identical in both species being compared, P. trifoliata and S. tuberosum. Crystallography studies of StSN1 demonstrated that this specific motif corresponds to the turn between the two helices of the HTH [34]. Although the three subfamilies seem to share other common motifs, it was noticed that those indicated with a solid line show greater similarity between subfamilies II and III, since they generate a looser arrangement of the α-helixes, which appear more separated. On the other hand, the characteristic motif of subfamily I, marked with lines and dots (-- · --), results in a more compact structure, with more condensed α-helixes.
As described by Nahirñak et al. [1], the SNAKIN/GASA proteins have three characteristic domains: (1) at the N-terminal end is the peptide signal; (2) an intermediate region; (3) at the C-terminal end is the SNAKIN/GASA motif, which includes the conserved aminoacidic positions that give the name to this family of proteins, such as the array of 12 cysteines responsible for the structural stability of the peptide, as well as variable regions that allow them to be classified into the 3 previously mentioned subfamilies. In full agreement with these conserved domains, Figure 15 shows that tertiary structures of the PtGASA6 and PtGASA10 proteins follow this architectural scheme. The HTH region has a large proportion of positively charged amino acids, such as arginine, histidine and lysine, in accordance with what has been described for StSN1, which could be indicative of their possible mechanism of action. Some authors point out that, in addition, structurally conserved α-helices must also be analyzed as an essential part of understanding the mechanism of action of proteins with AMP activity. In this context, a distinctive feature investigated is the presence of transmembrane domains that may help to predict differential subcellular targets like the apoplast, cellular membrane, or cell wall. To better understand this potential relationship between GASA protein structures and their putative antimicrobial mechanism, an in silico search of PtGASA6, 8 and 10 proteins was carried out using the Deep-TMHMM algorithm (Prediction of Transmembrane Helices in Proteins) [35] and compared to their closest potato orthologs (for some of which subcellular localization is available). PtGASA6, like StSN1, both belonging to subfamily I [1,11,28] do not appear to contain an anchoring site in the plasma membrane (Figure 16). It was reported that StSN1 interacts with StSUT1, a protein that targets phloem tissue [28] and the same could be true for PtGASA6 but must be investigated. On the contrary, PtGASA8 and PtGASA10 present at least one α-helix motif in their signal peptides with putative binding properties to membrane structures, suggesting they may either remain anchored or be secreted. These results are also consistent with those observed in C. clementina [11]. These predicted structural differences that suggest different subcellular targets between PtGASA6 and 10 reinforce our belief that their defensive mechanisms are somewhat different too.
3. Discussion
Bacterial diseases such as Huanglongbing (HLB) and citrus canker continue to threaten the sustainability of citrus production worldwide, challenging conventional breeding and demanding robust genetic targets for improved resistance for breeding [16,19,30]. To that end, identification of key genetic targets conferring such tolerance requires the screening of the wide Citrus pangenome diversity stored in germplasm banks. We recently generated a comprehensive co-expression network analysis using RNA-seq data from 17 public datasets offering a molecular framework for understanding HLB pathogenesis and host response. Among these key genetic targets, different antimicrobial peptides (AMP) families have been profiled during the recent years in order to explore new immune pathways for the control of destructive bacterial diseases like HLB (see Younas et al. [35], for a very recent example) in order to identify and introgress their encoding gene variants from resistant genotypes into the cultivated susceptible varieties. The SNAKIN/GASA gene family encodes small AMPs with such potential, since several studies have demonstrated their antimicrobial role against pathogenic agents of various origins, including bacteria and fungi [1,2,3,5,6,7,8,9,10,11,49]. However, their antimicrobial mechanisms of action are not yet understood, in part due to their pleiotropic effects, which severely affect the architectural phenotype in mutant plants [1,11,49,50].
Q1: The first question to answer here is if, within the citrus GASA family, are there any resistance genes in the citrus germplasm that could be used for breeding purposes against bacterial diseases?
To begin with, by leveraging a pan-genomic framework, our study expands the catalog of citrus GASA genes with 67 new curated variants across rootstock-enriched germplasm. Furthermore, we provide functional evidence that two members from Poncirus trifoliata, PtGASA6 (subfamily I) and PtGASA10 (subfamily III), modulate plant defense in vivo through distinct outcomes: specifically, PtGASA6 accelerated hypersensitive response (HR) whereas PtGASA10 delayed disease progression. Together with expression profiling, promoter cis-element prediction and structural/topological inference, these results position citrus GASA genes as candidates for further studies for their use in resistance breeding and biotechnology [1,2,3,5,6,7,8,9,10,11,14,16].
Q2: Are these genes induced or constitutively expressed?
Initially, previous studies by Wu et al. [14] demonstrated that several GASA genes exhibit basal expression in different tissues of C. clementina. In agreement with these findings, our results across rootstock accessions show that juvenile leaves and floral tissues display higher GASA expression than mature leaves (see Figure 5), a pattern coherent with developmental roles and defense priming in actively growing tissues [10,14]. Wu et al. [14] also investigated the comparative expression of GASA genes after infections with X. citri in detached leaf explants of C. clementina. From these experiments, the authors conclude that 6 genes, including GASA8, presented a significant increase in expression. The induction of these genes could indicate that, although they have a good basal expression in the tissues where the X. citri infection is produced, their expression increases after infection, so these genes could be playing some role against it [14] or be a collateral effect of the infection process. Moreover, meta-analysis of HLB-related RNA-seq datasets revealed upregulation of GASA10-13 in infected C. sinensis over extended time courses, as well as early induction of GASA6 and GASA14 upon psyllid feeding that transmits CLas [34,36,37]. Conversely, GASA8 exhibited contrasting behavior—repression in some uninfected conditions, but induction in C. clementina explants challenged with X. citri—highlighting context dependence across host–pathogen settings [14,34]. A final indication of specific gene induction by pathogens comes from Solanum tuberosum, where StSN3 (a potato ortholog of GASA10) is upregulated by Pseudomonas syringae pv. tabaci [5,11]. P. syringae is the very same pathogen that was used here to challenge GASA10 overexpression in N. benthamiana (see Figure 7, Figure 8 and Figure 9).
Q3: What regulatory logic underlies these expression patterns?
In addition. promoter mining provided a mechanistic bridge to these patterns. Specifically, all three selected genes contain light-responsive elements (consistent with leaf/flower expression), ABA/MeJA motifs (abiotic stress and defense). Most importantly, PtGASA10 exhibited a unique salicylic acid (SA)–responsive TCA element among the analyzed promoters [56,57]. Given SA’s central role in biotrophic pathogen defense and HR signaling, this cis-signature plausibly could underpin PtGASA10’s potential behavior under HLB-related contexts and its effect on delaying symptom development [16,34,35]. In contrast, PtGASA6 lacked a predicted membrane anchor and SA motif, pointing toward a different contribution mechanism to HR priming and signaling [5,7,11,14]. The fact that some of the members are induced by infection while others do not, show that some members adjust to the standard basic definition of acquired passive resistance (they are “just there”, passively waiting to prevent infection without any changes), while others are actively induced by the infection process. All together, these results suggest that among the wide pan-genomic diversity of GASA genes, more than one single mechanism of resistance may coexist within this large gene family.
Q4: Can we prove that any of the new genes/alleles really confer resistance to bacterial diseases, i.e. is there a functional validation available in a tractable pathosystem?
To address this, we performed transient expression assays in Nicotiana benthamiana. As a result, PtGASA6 and PtGASA10 enhanced defense responses through distinct mechanisms. PtGASA6 accelerated hypersensitive response (HR), while PtGASA10 delayed necrosis caused by Pseudomonas syringae pv. tabaci. These complementary effects suggest subfamily-specific roles in pathogen resistance [33,35; Figure 8, Figure 9, Figure 10, Figure 11 and Figure 12]. By contrast, PtGASA8—despite expression evidence in tolerant rootstocks—did not yield consistent phenotypic benefits under our specific conditions, underscoring the gene and context- specificity of AMP-mediated defense [11,14,34]. Therefore, these findings confirm that at least two GASA genes confer measurable resistance traits in vivo. Together, these results echo and extend past findings in potato: some members of the snakin family are inducible by pathogens and can curtail disease spread, but their net outcome depends on subfamily identity, expression level, and subcellular localization [1,5,7,11]. SNAKIN/GASA genes enhance defense against pathogens by a variety of mechanisms. Enhancement of hypersensitive response and necrosis reduction are just two of them, and maybe, GASA8 has others. Importantly, in our hands PtGASA10 delayed necrosis more robustly than PtGASA6 despite lower expression, suggesting higher functional efficiency, distinct kinetics, or greater protein stability in the infection milieu.
Q5: Is the resistance mechanism expression-dependent i.e. is the observed upregulation of GASA genes necessary for a more effective resistance?
Furthermore, our agroinfiltration assays demonstrate that overexpression of PtGASA6 or PtGASA10 effectively triggered HR after X. citri infection and significantly reduced symptoms caused by P. syringae pv. tabaci. In contrast, these effects were absent at basal expression levels in the negative control. Consequently, the mechanism appears to be expression-dependent for these two genes.
Q6: Does the observed diversity reflect coevolution or neutral drift i.e. does this wide pan-genomic diversity responds, at least partially, to a coevolution process with specific pathogen species or strains (like in the gene-for-gene interaction) or if it is just due to neutral selection and redundancy?
Most of the evidence collected so far in the literature and in this paper suggests that both could be true. Figure 16 shows a comparison between potato and citrus predicted protein structure of the mentioned protein members representing subfamilies I, II and III in potato and citrus. Comparison to reference potato snakin proteins (StSN1, StSN2, StSN3) evidenced a strong conservation of the tertiary structure despite the large phylogenetic distance between potatoes and citrus, consistently predicting the helix-turn-helix (HTH) fold with cysteine-rich motifs fundamental for antimicrobial peptide (AMP) stability and activity [7,39,44]. However, while for StSN1/GASA6 and StSN3/GASA10 comparison, only minor differences were noticed, for StGASA8 a novel signal peptide with predicted transmembrane properties is present when compared to StSN2, suggesting a major change in subcellular destination and that significative evolutionary changes occurred even within the same gene orthologs of subfamily II. In other words, despite cross-species conservation, we observed subfamily-specific structural signatures (compact α-helices in subfamily I vs. looser arrangements in II/III), consistent with potential differences in target interaction and mode of action [5,11,44] and suggests functional partitioning along evolutionary lines [5,11,14,27,28]. Taken together, structural and phylogenetic evidence suggests that both processes may be involved. On one hand, orthologous pairing to reference potato snakin proteins revealed strong conservation of tertiary structure despite large phylogenetic distance, indicating selection for antimicrobial peptide stability. On the other hand, high allelic and paralog diversity—exemplified by GASA9/GASA9-like—points to neutral drift and sub-functionalization [7,39].
Q7: Do multiple defense mechanisms coexist within the GASA family?
These differences are modeled in Figure 13 and could indicate that the mechanisms of action are either different or that they are involved in alternative steps of metabolic pathways. Although specific dose-response studies are needed to draw conclusions, it is noteworthy that PtGASA10 stronger effect in delaying disease necrosis occurred despite its lower expression level (twice as low as that of PtGASA6). This suggests that PtGASA10 possesses the remarkable ability to slow down the progression of the disease, even with reduced expression, which may indicate a high functional efficiency, a particularly effective mechanism of action or that it has a longer protein lifetime. In this context, it is noteworthy to mention that Pseudomonas syringae pv. tabaci induces the expression of StSN3 [5], which is an orthologue of PtGASA10. This could be an indication that, during infection caused by bacteria, the plant may use this protein to prevent the systemic spread of bacteria in plant tissue.
As mentioned before, PtGASA6 lacks the membrane anchoring site observed for PtGASA10 structure, suggesting that it could play its defensive role in a different cellular compartment, where it leads to the induction of a stronger HR compared to PtGASA10. The evolutionary dichotomy is consistent with the subfamily-dependent structural constraints we observed (HTH packing differences) and with literature reports of pleiotropy, where SN/GASA proteins balance developmental roles with immune activation [1,7,49,50]. Regarding the mechanism involved, we propose a working model in which PtGASA6 acts as an early amplifier of HR, likely through cellular pathways that escalate ROS bursts, ion fluxes, and localized cell death at infection foci—key components of incompatible responses [7,11,39]. Conversely, PtGASA10—harboring a predicted membrane targeting signature and a SA-responsive promoter element—appears to retard lesion expansion and limit tissue damage over time. It might operate at the cell wall–apoplast interface, attenuating bacterial colonization, neutralizing extracellular factors, or modulating cell wall integrity pathways; such localization would also enhance direct contact with pathogen cells during early invasion [11,14,39]. However, these speculations based on predictive models (i.e. structural and consensus cis-elements discovery) deserve a note of caution before making conclusive arguments because they must be corroborated experimentally, since discrepancies could occur [7].
Q8: Are there translational implications for citrus improvement?
From a breeding and biotech perspective, PtGASA6 and PtGASA10 emerge as complementary levers: one to reinforce HR priming (PtGASA6), and another to suppress disease progression (PtGASA10). Practical routes include: rootstock engineering (overexpression or promoter editing) to confer broad-spectrum protection versus scion modification [17,19,20], CRISPR-based promoter modulation (CRISPR motif editing) to recreate SA/MeJA responsiveness and mobilize defense only under challenge, mitigating pleiotropy [34,35,56,57], allele mining to discover naturally optimized variants with favorable efficacy–growth trade-offs [14,23,45]. Given the demonstrated sexual compatibility within Citrus and the recognized HLB tolerance in P. trifoliata, marker-assisted introgression or cisgenic approaches using PtGASA alleles provide realistic avenues toward field-relevant resilience [17,19,20,21].
4. Materials and Methods
4.1. Plant Material and Bacterial Strains
Citrus plant material was collected from the experimental germplasm bank orchard at EEA INTA Bella Vista (Corrientes Province, Argentina) including Citrus sinensis (sweet orange), C. limon (lemon), Citrumelo (Citrus x paradisi × Poncirus trifoliata) and EEA INTA Concordia (Entre Ríos Province, Argentina) including C. jambhiri (rough lemon), C. limonia (Rangpur), C. warburgiana (New Guinea wild lime), C. aurantium (bitter orange), and P. trifoliata (trifoliate orange). Fully developed trees were used as the tissue source for gene cloning, gene expression analysis, and template origin for transient expression assays.
Nicotiana benthamiana model system was used for agroinfiltration and infection assays. Plants were grown in controlled growth chambers under 22–25 °C, with a 16 h light and 8 h dark photoperiod.
Pseudomonas syringae pv. tabaci and Xanthomonas citri subsp. citri strains were used for infection assays. Bacterial suspensions were prepared from 24–48 h cultures in King’s B medium (P. syringae) or nutrient agar (X. citri) and adjusted to OD₆₀₀ = 0.3 (~10⁸ cfu/mL) in 10 mM MgCl₂.
4.2. Identification of GASA Genes/Allelic Variants, PCR Cloning and DNA Sequencing
Genomic and coding sequences (CDS) of Citrus GASA genes were retrieved from the Citrus Genome Database [36] and NBI [37]. DNA was extracted from citrus leaf tissue using a standard CTAB method [38]. DNA quality and concentration were measured using a NanoDrop 2000C spectrophotometer (Thermo Fisher Scientific, USA).
PCR amplifications were performed using oligonucleotides designed to amplify conserved GASA family sequences (listed in Supplementary Table 1). PCR products were cloned into pGEM-T Easy vector (Promega, USA), transformed in E. coli, and sequenced with universal M13F/M13R primers. Three independent clones were sequenced per product. In total, 67 curated genomic variants were obtained from 16 amplified loci and deposited in GenBank (accessions: OP728335 to OQ053292; complete list in Table 1).
4.3. Structural and Phylogenetic Analyses of GASA Sequences
Protein sequences were aligned using Clustal Omega [39]. The presence of conserved GASA domains was confirmed using JPred [40], and signal peptides were predicted with SignalP 5.0.
A phylogenetic dendrogram was constructed using the Neighbor-Joining method in MEGA11 [41], with bootstrap support from 1000 replicates. Evolutionary distances were calculated using the Poisson correction model [42], based on 83 amino acid sequences (194 aligned positions after pairwise deletion).
GASA gene chromosomal positions were mapped using genome data from C. sinensis, Poncirus trifoliata and C. limon of Citrus Genome database, and graphic represented using MapChart [8]. For promoter region analysis, 1500 bp DNA sequences upstream of the ATG site were extracted from Citrus genome Database and the putative cis-regulatory elements were determined with plantCARE database [43] and classified with TBTools [44].
4.4. Expression Analysis by RT-qPCR
Total RNA was extracted from citrus and N. benthamiana tissues using TransZol reagent (TransGen Biotech), following the manufacturer’s instructions. RNA integrity and purity were verified by agarose gel electrophoresis and spectrophotometry (NanoDrop 2000C, Thermo Fisher Scientific). Genomic DNA was removed by DNase I treatment (Thermo Scientific), and cDNA synthesis was carried out using M-MLV Reverse Transcriptase (Thermo Scientific) with random hexamer oligonucleotides and 1 µg of total RNA.
Quantitative PCR reactions were performed using Platinum™ Taq DNA Polymerase (Invitrogen), dNTPs (200 µM each), 3 mM MgCl₂, ROX passive reference dye (Thermo Fisher Scientific), and SYBR Green I (Thermo Fisher Scientific) in a final volume of 10 µL. Reactions were run on a StepOnePlus PCR System (Applied Biosystems).
For the analysis of GASA gene expression in citrus tissues, an absolute quantification approach was employed. Gene-specific oligonucleotides were used for each GASA and CsGAPC2 (Glyceraldehyde-3-phosphatedehydrogenase 2) [45] as reference for normalization. Standard curves were generated using serial dilutions of purified PCR amplicons cloned for each of the selected GASA genes. These curves were used to determine the absolute copy number of transcripts per ng of cDNA for each gene in floral, young leaf, and mature leaf tissues from five different citrus accessions.
To evaluate gene expression following transient agroinfiltration in N. benthamiana, a relative quantification method was used. Gene expression levels of PtGASA6, PtGASA8, and PtGASA10 were calculated using the comparative Ct method (ΔCt) [46], normalized to an internal reference (Ubiquitin 3) and expressed as log-2 fold change relative to leaves infiltrated with an empty vector control. Three biological replicates were analyzed per gene construct, and results were represented as mean ± standard errors. Statistical analysis of overexpression was conducted using the FgStatistics package [47] with paired technical replicates and 5,000 bootstrap resampling cycles. Heatmap was performed with ChiPlot online tool (https://www.chiplot.online/heatmap.html).
4.5. Transcriptomic Meta-Analysis of Citrus GASA Gene Expression in Public RNA-seq Datasets
We retrieved ten publicly available BioProjects from the NCBI database that investigate gene expression in citrus under Huanglongbing (HLB) infection conditions: PRJNA348468, PRJNA417324, PRJNA574168, PRJNA629966, PRJNA640485, PRJNA645216, PRJNA739184, PRJNA739186, PRJNA755969, and PRJNA780217 (detailed in Supplementary Table 1). These datasets include multiple tissues, genotypes and time-points post-infection and were selected following the meta-analytic framework described by Machado et al. [48] for large-scale citrus HLB transcriptome integration.
FASTQ files were processed for quality control with FastQC and trimmed for adapters and low-quality sequences using Trimmomatic [49]. Filtered reads were aligned to the Citrus clementina genome (v1.0) using STAR v2.7.8a [50] and gene counts obtained with featureCounts v2.0.1 [51]. Read counts per sample were normalized using DESeq2 v1.34.0 [52] to correct for library size differences. Differential gene expression analyses (DESeq2) were run for each experimental comparison within each BioProject, and genes with adjusted p-value < 0.05 were considered differentially expressed.
To focus on the SNAKIN/GASA family, we filtered count data by the following C. clementina loci identifiers: Ciclev10017244m.v1.0 (GASA 1), Ciclev10022925m.v1.0 (GASA 2), Ciclev10023012m.v1.0' (GASA 3), Ciclev10033135m.v1.0 (GASA 4), Ciclev10033115m.v1.0 (GASA 5), Ciclev10002979m.v1.0 (GASA 6), Ciclev10002796m.v1.0 (GASA 7), Ciclev10002927m.v1.0 (GASA 8), Ciclev10002984m.v1.0 (GASA 9), Ciclev10013200m.v1.0 (GASA 10), Ciclev10012786m.v1.0 (GASA 11), 'Ciclev10013454m.v1.0 (GASA 12), Ciclev10029695m.v1.0 (GASA 13), Ciclev10006931m.v1.0 (GASA 14), Ciclev10006668m.v1.0 (GASA 15), Ciclev10006310m.v1.0 (GASA 16), Ciclev10006347m.v1.0 (GASA 17), Ciclev10006243m.v1.0 (GASA 18). Normalized counts of these virtual genes were extracted and visualized across genotypes, tissues and time-points via heatmaps, enabling assessment of induction, repression or constitutive expression trends under HLB challenge.
4.6. Transient Overexpression and Infection Assays in N. benthamiana
For Agrobacterium-mediated transient expression, the genes PtGASA6, PtGASA8, and PtGASA10 were cloned into the Gateway® binary vector pK2GW7, under the control of the CaMV 35S constitutive promoter. Constructs were verified by Sanger sequencing (UGB-INTA Castelar, Argentina) and transformed into Agrobacterium tumefaciens strain GV3101. Cultures were grown overnight at 28 °C with shaking (200 rpm) in liquid LB medium supplemented with the appropriate antibiotics (rifampicin 100 µg/mL, gentamicin 40 µg/mL, spectinomycin 100 µg/mL) and 100 µM acetosyringone. After centrifugation (10 min, 4,000 ×g), bacterial pellets were resuspended in MES buffer and adjusted to an optical density (OD₆₀₀) of 0.6. Fully expanded leaves of 2-month-old N. benthamiana plants were infiltrated using a needleless syringe. Infiltrations were performed in six marked positions per leaf to allow positional normalization of symptom development. For disease progression assay, the pathogenic strain Pseudomonas syringae pv. tabaci was used to challenge N. benthamiana plants. Bacterial cultures were grown overnight at 28 °C on King’s B solid medium (KBM), washed twice with 10 mM MgCl₂ and adjusted to a final OD₆₀₀ of 0.2, corresponding to approximately 2 × 10⁶ CFU/mL. A final inoculum mix was prepared by combining A. tumefaciens cultures (OD₆₀₀ = 0.6) with Pseudomonas syringae pv. tabaci at the above concentration. This mixture was used to co-infiltrate single leaves (one per plant), always targeting the same six leaf positions. Disease symptoms (necrosis) were recorded from 4 days post-inoculation (dpi) up to 6 dpi, blind to treatment. A Disease Index (DI) was assigned per leaf by averaging scores from the six infiltrated spots. Disease progression was quantified using the area under the disease progress curve (AUDPC).
For hypersensitive response (HR) assays, transiently infiltrated N. benthamiana leaves were challenged with Xanthomonas citri subsp. citri, a non-host pathogen. X. citri cultures were grown overnight at 28 °C on Dextrose Nutrient Agar (NAD), then transferred to 10 mM MgCl₂ and agitated for at least 2 h to disrupt biofilm and increase cell suspension homogeneity. The culture was washed twice (7000 rpm, 3 min) and adjusted to OD₆₀₀ = 0.218. For co-infiltration, A. tumefaciens GV3101 (OD₆₀₀ = 0.6) and Xcc (OD₆₀₀ = 0.109) were mixed in equal volumes and infiltrated into N. benthamiana leaves as described above. The HR response was scored 6–717 dpi using an HR index assigned to each of the six leaf positions and normalized per plant [53].
4.7. In Silico Protein Structure Prediction and Subcellular Targeting
5. Conclusions
This study provides a comprehensive pan-genomic characterization of the SNAKIN/GASA gene family in citrus rootstock species, identifying 67 novel genomic variants grouped into three conserved subfamilies. Expression profiling revealed tissue-specific patterns, with higher transcript abundance in juvenile and floral tissues of tolerant rootstocks. Functional assays demonstrated that transient overexpression of PtGASA6 and PtGASA10 in Nicotiana benthamiana significantly reduced disease progression caused by Pseudomonas syringae pv. tabaci and enhanced hypersensitive response against Xanthomonas citri, whereas PtGASA8 showed no consistent effect. Structural predictions indicated conserved helix-turn-helix motifs and differential subcellular targeting, suggesting distinct antimicrobial mechanisms among subfamilies. Collectively, these findings highlight PtGASA6 and PtGASA10 as promising candidates for potential breeding and biotechnological strategies aimed at improving broad-spectrum bacterial disease resistance in citrus. Future work should validate these genes in cultivars, explore dose-dependent responses, and assess genome editing approaches to optimize their expression and functional efficiency.
Supplementary Materials
The following supporting information can be downloaded at the website of this paper posted on Preprints.org, Table S1. List of BioProjects analyzed and description of their specific experimental conditions for gene expression. All filtered BioProjects correspond to citrus plants challenged with HLB under various conditions and comparative analyses. Extracted from the DDBJ, EMBL–EBI, and NCBI databases. Table S2: List of primers employed for the evaluation of gene expression by RT-qPCR for members of the SNAKIN/GASA gene family. Figure S1: Comparison of predicted amino acid sequences of GASA16, GASA17, and GASA18. Figure S2: Quantification of PtGASA6, 8 and overexpression in agroinfiltrated N. Figure S3. Statistical differences between GASA6 and 10 dynamic responses regarding disease and HR development.
Author Contributions
F.N.B., M.C., H.E.H. and G.C. planned, designed and supervised the research. F.N.B., M.C., R.M., N.F., L.P.G., N.A., and V.N. performed the experiments and curated bioinformatic data. F.N. B., M.C. R.M., H.E.H and G.C. analyzed the data, F.N.B., M.C., H.E.H. and G.C. wrote this manuscript. N.A., P.F., C.V.R., H.E.H., and G.C. directed and supervised different specific research experiments. The rest reviewed and validated this manuscript with the contribution of all authors. All authors have read and agreed to the published version of the manuscript.
Funding
This work was financially supported by a PhD fellowship to BK and RM from the National Scientific and Technical Research Council (Consejo Nacional de Investigaciones Científicas y Técnicas, CONICET) and by projects funded by Instituto Nacional de Tecnología Agropecuaria, University of Buenos Aires (UBACyT) and Agencia Nacional de Promoción Científica y Técnica.
Data Availability Statement
The original contributions presented in this study are included in the article. Further inquiries can be directed to the corresponding authors. All the data are publicly available. Germplasm accessions are available at INTA´s active germplasm banks of EEA INTA Bella Vista, Corrientes, Argentina or EEA INTA Concordia, Entre Ríos, Argentina. Additional related data not cited here can be found in Bekier, Florencia PhD thesis [56]
Acknowledgments
We thank Alberto Gochez, Dra. Blanca Canteros, MSc. Claudio Gomez and Dra. Giovana Joris for their field assistance in maintenance and multiplications at EEA INTA Bella Vista and EEA INTA Concordia.
Conflicts of Interest
The authors declare no conflicts of interest.
Abbreviations
The following abbreviations are used in this manuscript:
| AMP | Anti-Microbial Peptide |
| AUDPC | area under the disease progress curve |
| AUHRPC | area under the hypersensitive response progress curve |
| DI | Disease Index |
| GASA | Gibberellic Acid Stimulated in Arabidopsis |
| HR | Hypersensitive Response |
References
- Nahirñak, V.; Rivarola, M.; de Urreta, M.G.; Paniego, N.; Hopp, H.E.; Almasia, N.I.; Vazquez-Rovere, C. Genome-Wide Analysis of the Snakin/GASA Gene Family in Solanum Tuberosum Cv. Kennebec. American Journal of Potato Research 2016, 93, 172–188. [Google Scholar] [CrossRef]
- Raveh, E.; Goldenberg, L.; Porat, R.; Carmi, N.; Gentile, A.; La Malfa, S. Conventional Breeding of Cultivated Citrus Varieties. The citrus genome 2020, 33–48. [Google Scholar]
- Palacios, J. Citricultura; Tucumán, Argentina, 2005; ISBN 987-43-8326-7.
- Wu, T.; Cheng, C.; Zhong, Y.; Lv, Y.; Ma, Y.; Zhong, G. Molecular Characterization of the Gibberellin-Stimulated Transcript of GASA4 in Citrus. Plant Growth Regul 2020, 91, 89–99. [Google Scholar] [CrossRef]
- Xu, Q.; Chen, L.L.; Ruan, X.; Chen, D.; Zhu, A.; Chen, C.; Bertrand, D.; Jiao, W.B.; Hao, B.H.; Lyon, M.P.; et al. The Draft Genome of Sweet Orange (Citrus Sinensis). Nat Genet 2013, 45, 59–66. [Google Scholar] [CrossRef]
- Xu, Q.; Roose, M.L. Citrus Genomes: From Sequence Variations to Epigenetic Modifications. The Citrus genome 2020, 141–165. [Google Scholar]
- Nakandala, U.; Furtado, A.; Henry, R.J.; Jester B, U.T.J.D. Citrus Genomes: Past, Present and Future. Hortic Res 2025, 186, uhaf033. [Google Scholar] [CrossRef] [PubMed]
- Voorrips, R.E. MapChart: Software for the Graphical Presentation of Linkage Maps and QTLs. Journal of Heredity 2002, 93, 77–78. [Google Scholar] [CrossRef]
- Saitou, N.; Nei, M. The Neighbor-Joining Method: A New Method for Reconstructing Phylogenetic Trees. Mol Biol Evol 1987, 4, 406–425. [Google Scholar] [CrossRef] [PubMed]
- Nahirñak, V.; Almasia, N.I.; Lia, V.V.; Hopp, H.E.; Vazquez Rovere, C. Unveiling the Defensive Role of Snakin-3, a Member of the Subfamily III of Snakin/GASA Peptides in Potatoes. Plant Cell Rep 2024, 43, 1–19. [Google Scholar] [CrossRef] [PubMed]
- Wu, T.; Zhong, Y.; Chen, M.; Wu, B.; Wang, T.; Jiang, B.; Zhong, G. Analysis of CcGASA Family Members in Citrus Clementina (Hort. Ex Tan.) by a Genome-Wide Approach. BMC Plant Biol 2021, 21, 1–18. [Google Scholar] [CrossRef]
- Berrocal-Lobo, M.; Segura, A.; Moreno, M.; López, G.; García-Olmedo, F.; Molina, A. Snakin-2, an Antimicrobial Peptide from Potato Whose Gene Is Locally Induced by Wounding and Responds to Pathogen Infection. Plant Physiol 2002, 128, 951–961. [Google Scholar] [CrossRef]
- Gao, C.; Li, Z.; Zhang, H.; Li, C.; Sun, H.; Li, S.; Ma, N.; Qi, X.; Cui, Y.; Yang, P.; et al. Genome-Wide Identification and Characterization of the GASA Gene Family in Medicago Truncatula, and Expression Patterns under Abiotic Stress and Hormone Treatments. Plants 2024, 13. [Google Scholar] [CrossRef]
- Alves, M.N.; Lopes, S.A.; Raiol-Junior, L.L.; Wulff, N.A.; Girardi, E.A.; Ollitrault, P.; Peña, L. Resistance to ‘Candidatus Liberibacter Asiaticus,’ the Huanglongbing Associated Bacterium, in Sexually and/or Graft-Compatible Citrus Relatives. Front Plant Sci 2021, 11, 1–16. [Google Scholar] [CrossRef]
- Ramadugu, C.; Keremane, M.L.; Halbert, S.E.; Duan, Y.P.; Roose, M.L.; Stover, E.; Lee, R.F. Long-Term Field Evaluation Reveals Huanglongbing Resistance in Citrus Relatives. Plant Dis 2016, 100, 1858–1869. [Google Scholar] [CrossRef]
- Munir, S.; He, P.; Wu, Y.; He, P.; Khan, S.; Huang, M.; Cui, W.; He, P.; He, Y. Huanglongbing Control: Perhaps the End of the Beginning. Microb Ecol 2017, 76, 192–204. [Google Scholar] [CrossRef]
- Bouteraa, M.T.; Romdhane, W. Ben; Baazaoui, N.; Alfaifi, M.Y.; Chouaibi, Y.; Akacha, B. Ben; Hsouna, A. Ben; Kaˇ, M.; Garzoli, S.; Saad, R. Ben; et al. GASA Proteins: Review of Their Functions in Plant Environmental Stress Tolerance. 2023, 1–16. [CrossRef]
- Almasia, N.I.; Bazzini, A.A.; Hopp, H.E.; Vazquez-Rovere, C. Overexpression of Snakin-1 Gene Enhances Resistance to Rhizoctonia Solani and Erwinia Carotovora in Transgenic Potato Plants. Mol Plant Pathol 2008, 9, 329–338. [Google Scholar] [CrossRef]
- Conti, G.; Gardella, V.; Vandecaveye, M.A.; Gomez, C.A.; Joris, G.; Hauteville, C.; Burdyn, L.; Almasia, N.I.; Nahirñak, V.; Vazquez-Rovere, C.; et al. Transgenic Citrange Troyer Rootstocks Overexpressing Antimicrobial Potato Snakin-1 Show Reduced Citrus Canker Disease Symptoms. J Biotechnol 2020, 324, 99–102. [Google Scholar] [CrossRef] [PubMed]
- Darqui, F.S.; Radonic, L.M.; Trotz, P.M.; López, N.; Vázquez Rovere, C.; Hopp, H.E.; López Bilbao, M. Potato Snakin-1 Gene Enhances Tolerance to Rhizoctonia Solani and Sclerotinia Sclerotiorum in Transgenic Lettuce Plants. J Biotechnol 2018, 283, 62–69. [Google Scholar] [CrossRef] [PubMed]
- Das, K.; Datta, K.; Sarkar, S.N.; Datta, S.K. Expression of Antimicrobial Peptide Snakin-1 Confers Effective Protection in Rice against Sheath Blight Pathogen, Rhizoctonia Solani. Plant Biotechnol Rep 2021, 15, 39–54. [Google Scholar] [CrossRef]
- Segura, A.; Moreno, M.; Madueño, F.; Molina, A.; García-Olmedo, F. Snakin-1, a Peptide from Potato That Is Active against Plant Pathogens. Molecular Plant-Microbe Interactions 1999, 12, 16–23. [Google Scholar] [CrossRef] [PubMed]
- Weber, K.C.; Mahmoud, L.M.; Stanton, D.; Welker, S.; Qiu, W.; Grosser, J.W.; Levy, A.; Dutt, M. Insights into the Mechanism of Huanglongbing Tolerance in the Australian Finger Lime (Citrus Australasica). Front Plant Sci 2022, 13, 1–23. [Google Scholar] [CrossRef]
- Younas, M.; Wang, C.; Hassan, M.F.; Li, W.; Zheng, Z.; Bin, Y.; Wei, T.; Li, Y. Comprehensive Transcriptomic Profiling of Citrus Australasica Unveils Antimicrobial Peptides and Immune Pathways for Huanglongbing Tolerance. J Agric Food Chem 2025. [Google Scholar] [CrossRef] [PubMed]
- Chin, E.L.; Ramsey, J.; Saha, S.; Mishchuk, D.; Chavez, J.; Howe, K.; Zhong, X.; Flores-Gonzalez, M.; Mitrovic, E.; Polek, M.; et al. Multi-Omics Comparison Reveals Landscape of Citrus Limon and Citrus Sinensis Response to ‘ Candidatus Liberibacter Asiaticus’. PhytoFrontiersTM 2021, 1, 76–84. [Google Scholar] [CrossRef]
- Wei, X.; Mira, A.; Yu, Q.; Gmitter, F.G. The Mechanism of Citrus Host Defense Response Repression at Early Stages of Infection by Feeding of Diaphorina Citri Transmitting Candidatus Liberibacter Asiaticus. Front Plant Sci 2021, 12, 1–22. [Google Scholar] [CrossRef] [PubMed]
- Huang, C.Y.; Niu, D.D.; Kund, G.; Jones, M.; Albrecht, U.; Nguyen, L.; Bui, C.; Ramadugu, C.; Bowman, K.D.; Trumble, J.; et al. Identification of Citrus Immune Regulators Involved in Defence against Huanglongbing Using a New Functional Screening System. Plant Biotechnol J 2021, 19, 757–766. [Google Scholar] [CrossRef]
- Almasia, N.I.; Nahirñak, V.; Hopp, H.E.; Vazquez-Rovere, C. Potato Snakin-1: An Antimicrobial Player of the Trade-off between Host Defense and Development. Plant Cell Rep 2020, 39, 839–849. [Google Scholar] [CrossRef] [PubMed]
- Nahirñak, V.; Almasia, N.I.; Hopp, H.E.; Vazquez-Rovere, C. Snakin/GASA Proteins. Plant Signal Behav 2012, 7, 1004–1008. [Google Scholar] [CrossRef]
- Steinegger, M.; Söding, J. MMseqs2 Enables Sensitive Protein Sequence Searching for the Analysis of Massive Data Sets. Nat Biotechnol 2017, 35, 1026–1028. [Google Scholar] [CrossRef]
- Mirdita, M.; Schütze, K.; Moriwaki, Y.; Heo, L.; Ovchinnikov, S.; Steinegger, M. ColabFold: Making Protein Folding Accessible to All. Nat Methods 2022, 19, 679–682. [Google Scholar] [CrossRef] [PubMed]
- Kim, G.; Lee, S.; Levy Karin, E.; Kim, H.; Moriwaki, Y.; Ovchinnikov, S.; Steinegger, M.; Mirdita, M. Easy and Accurate Protein Structure Prediction Using ColabFold. Nat Protoc 2024, 1–23. [Google Scholar] [CrossRef] [PubMed]
- Rose, A.; Hildebrand, P. NGL Viewer: A Web Application for Molecular Visualization. Nucleic Acids Res 2015, 43. [Google Scholar] [CrossRef]
- Yeung, H.; Squire, C.J.; Yosaatmadja, Y.; Panjikar, S.; López, G.; Molina, A.; Baker, E.N.; Harris, P.W.R.; Brimble, M.A. Radiation Damage and Racemic Protein Crystallography Reveal the Unique Structure of the GASA/Snakin Protein Superfamily. Angewandte Chemie 2016, 128, 8062–8065. [Google Scholar] [CrossRef]
- Krogh, A.; Larsson, B.; Von Heijne, G.; Sonnhammer, E.L.L. Predicting Transmembrane Protein Topology with a Hidden Markov Model: Application to Complete Genomes. J Mol Biol 2001, 305, 567–580. [Google Scholar] [CrossRef]
- Liu, H.; Wang, X.; Liu, S.; Huang, Y.; Guo, Y.X.; Xie, W.Z.; Liu, H.; Tahir ul Qamar, M.; Xu, Q.; Chen, L.L. Citrus Pan-Genome to Breeding Database (CPBD): A Comprehensive Genome Database for Citrus Breeding. Mol Plant 2022, 15, 1503–1505. [Google Scholar] [CrossRef] [PubMed]
- Geer, L.Y.; Marchler-Bauer, A.; Geer, R.C.; Han, L.; He, J.; He, S.; Liu, C.; Shi, W.; Bryant, S.H. The NCBI Biosystems Database. Nucleic Acids Res 2010, 38, D492–D496. [Google Scholar] [CrossRef] [PubMed]
- Doyle, J.J.; Doyle, J.L. A Rapid DNA Isolation Procedure for Small Quantities of Fresh Leaf Tissue. Phytochemical bulletin 1987. [Google Scholar]
- Sievers, F.; Higgins, D.G. Clustal Omega for Making Accurate Alignments of Many Protein Sequences. Protein Science 2018, 27, 135–145. [Google Scholar] [CrossRef]
- Drozdetskiy, A.; Cole, C.; Procter, J.; Barton, G.J. JPred4: A Protein Secondary Structure Prediction Server. Nucleic Acids Res 2015, 43, W389–W394. [Google Scholar] [CrossRef]
- Tamura, K.; Stecher, G.; Kumar, S. MEGA11: Molecular Evolutionary Genetics Analysis Version 11. Mol Biol Evol 2021, 38, 3022–3027. [Google Scholar] [CrossRef]
- Zuckerkandl, E.; Pauling, L. Evolutionary Divergence and Convergence, in Proteins.
- Rombauts, S.; Déhais, P.; Van Montagu, M.; Rouzé, P. PlantCARE, a Plant Cis-Acting Regulatory Element Database. Nucleic Acids Res 1999, 27, 295–296. [Google Scholar] [CrossRef]
- Chen, C.; Wu, Y.; Li, J.; Wang, X.; Zeng, Z.; Xu, J.; Liu, Y.; Feng, J.; Chen, H.; He, Y. TBtools-II: A “One for All, All for One” Bioinformatics Platform for Biological Big-Data Mining. Mol Plant 2023, 16, 1733–1742. [Google Scholar] [CrossRef]
- Mafra, V.; Kubo, K.S.; Alves-Ferreira, M.; Ribeiro-Alves, M.; Stuart, R.M.; Boava, L.P.; Rodrigues, C.M.; Machado, M.A. Reference Genes for Accurate Transcript Normalization in Citrus Genotypes under Different Experimental Conditions. PLoS One 2012, 7. [Google Scholar] [CrossRef] [PubMed]
- Pfaffl, M.W. A New Mathematical Model for Relative Quantification in Real-Time RT-PCR. Nucleic Acids Res 2001, 29. [Google Scholar] [CrossRef]
- Di Rienzo, J.A. FgStatistics, Statistical Software for the Analysis of Experiments of Functional Genomics. 2009.
- Machado, R.; Moschen, S.; Conti, G.; González, S.; Rivarola, M.; Gómez, C.; Hopp, E.; Fernández, P. Exploring the Genetic Networks of Hlb Tolerance in Citrus : Insights Across Species and Tissues Exploring the Genetic Networks of HLB Tolerance in Citrus : Insights Across Species and Tissues. 2025, 0–24. [CrossRef]
- Bolger, A.M.; Lohse, M.; Usadel, B. Trimmomatic: A Flexible Trimmer for Illumina Sequence Data. Bioinformatics 2014, 30, 2114–2120. [Google Scholar] [CrossRef]
- Dobin, A.; Davis, C.A.; Schlesinger, F.; Drenkow, J.; Zaleski, C.; Jha, S.; Batut, P.; Chaisson, M.; Gingeras, T.R. STAR: Ultrafast Universal RNA-Seq Aligner. Bioinformatics 2013, 29, 15–21. [Google Scholar] [CrossRef]
- Liao, Y.; Smyth, G.K.; Shi, W. FeatureCounts: An Efficient General Purpose Program for Assigning Sequence Reads to Genomic Features. Bioinformatics 2014, 30, 923–930. [Google Scholar] [CrossRef]
- Love, M.I.; Huber, W.; Anders, S. Moderated Estimation of Fold Change and Dispersion for RNA-Seq Data with DESeq2. Genome Biol 2014, 15, 1–21. [Google Scholar] [CrossRef] [PubMed]
- Schandry, N. A Practical Guide to Visualization and Statistical Analysis of R. Solanacearum Infection Data Using R. Front Plant Sci 2017, 8. [Google Scholar] [CrossRef]
- Jumper, J.; Evans, R.; Pritzel, A.; Green, T.; Figurnov, M.; Ronneberger, O.; Tunyasuvunakool, K.; Bates, R.; Žídek, A.; Potapenko, A.; et al. Highly Accurate Protein Structure Prediction with AlphaFold. Nature 2021, 596, 583–589. [Google Scholar] [CrossRef]
- Hallgren, J.; Tsirigos, K.D.; Pedersen, M.D.; Almagro Armenteros, J.J.; Marcatili, P.; Nielsen, H.; Krogh, A.; Winther, O. DeepTMHMM Predicts Alpha and Beta Transmembrane Proteins Using Deep Neural Networks. biorxiv 2022, 2022–2024. [Google Scholar]
- Bekier, F.N. Análisis de La Inmunidad Específica y de Amplio Espectro: Caracterización y Evaluación Funcional de Genes Candidatos Para La Obtención de Cultivos Resistentes a Bacterias Fitopatógenas. Doctoral thesis, Universidad de Buenos Aires, Facultad de Ciencias Exactas y Naturales: Buenos Aires, Argentina, 2025.
- Arce-Leal, Á.P.; Bautista, R.; Rodríguez-Negrete, E.A.; Manzanilla-Ramírez, M.Á.; Velázquez-Monreal, J.J.; Santos-Cervantes, M.E.; Méndez-Lozano, J.; Beuzón, C.R.; Bejarano, E.R.; Castillo, A.G.; et al. Gene Expression Profile of Mexican Lime (Citrus Aurantifolia) Trees in Response to Huanglongbing Disease Caused by Candidatus Liberibacter Asiaticus. Microorganisms 2020, 8. [Google Scholar] [CrossRef] [PubMed]
- Liu, C.; Li, T.; Cui, L.; Wang, N.; Huang, G.; Li, R. OrangeExpDB: An Integrative Gene Expression Database for Citrus Spp. BMC Genomics 2024, 25, 1–7. [Google Scholar] [CrossRef]
Figure 1.
Multiple alignment of the predicted amino acid sequences of citrus GASA protein family performed using Clustal Omega and colored with Jalview software. (a) Conserved sequences of the SNAKIN/GASA domain are marked in blue and include the conserved characteristic array of 12 cysteines. Residues used to classify each member into a subfamily are shown in magenta, and putative signal peptide–associated sequences, according to Nahirñak et al. , are shown in violet. The vertical blue lines indicated with arrows represent variable regions that were hidden for illustrative purposes. (b) Highly conserved amino acids obtained from the ClustalO alignment in Jalview are shown and include the twelve cysteines, together with the final C-terminal KCP motif.
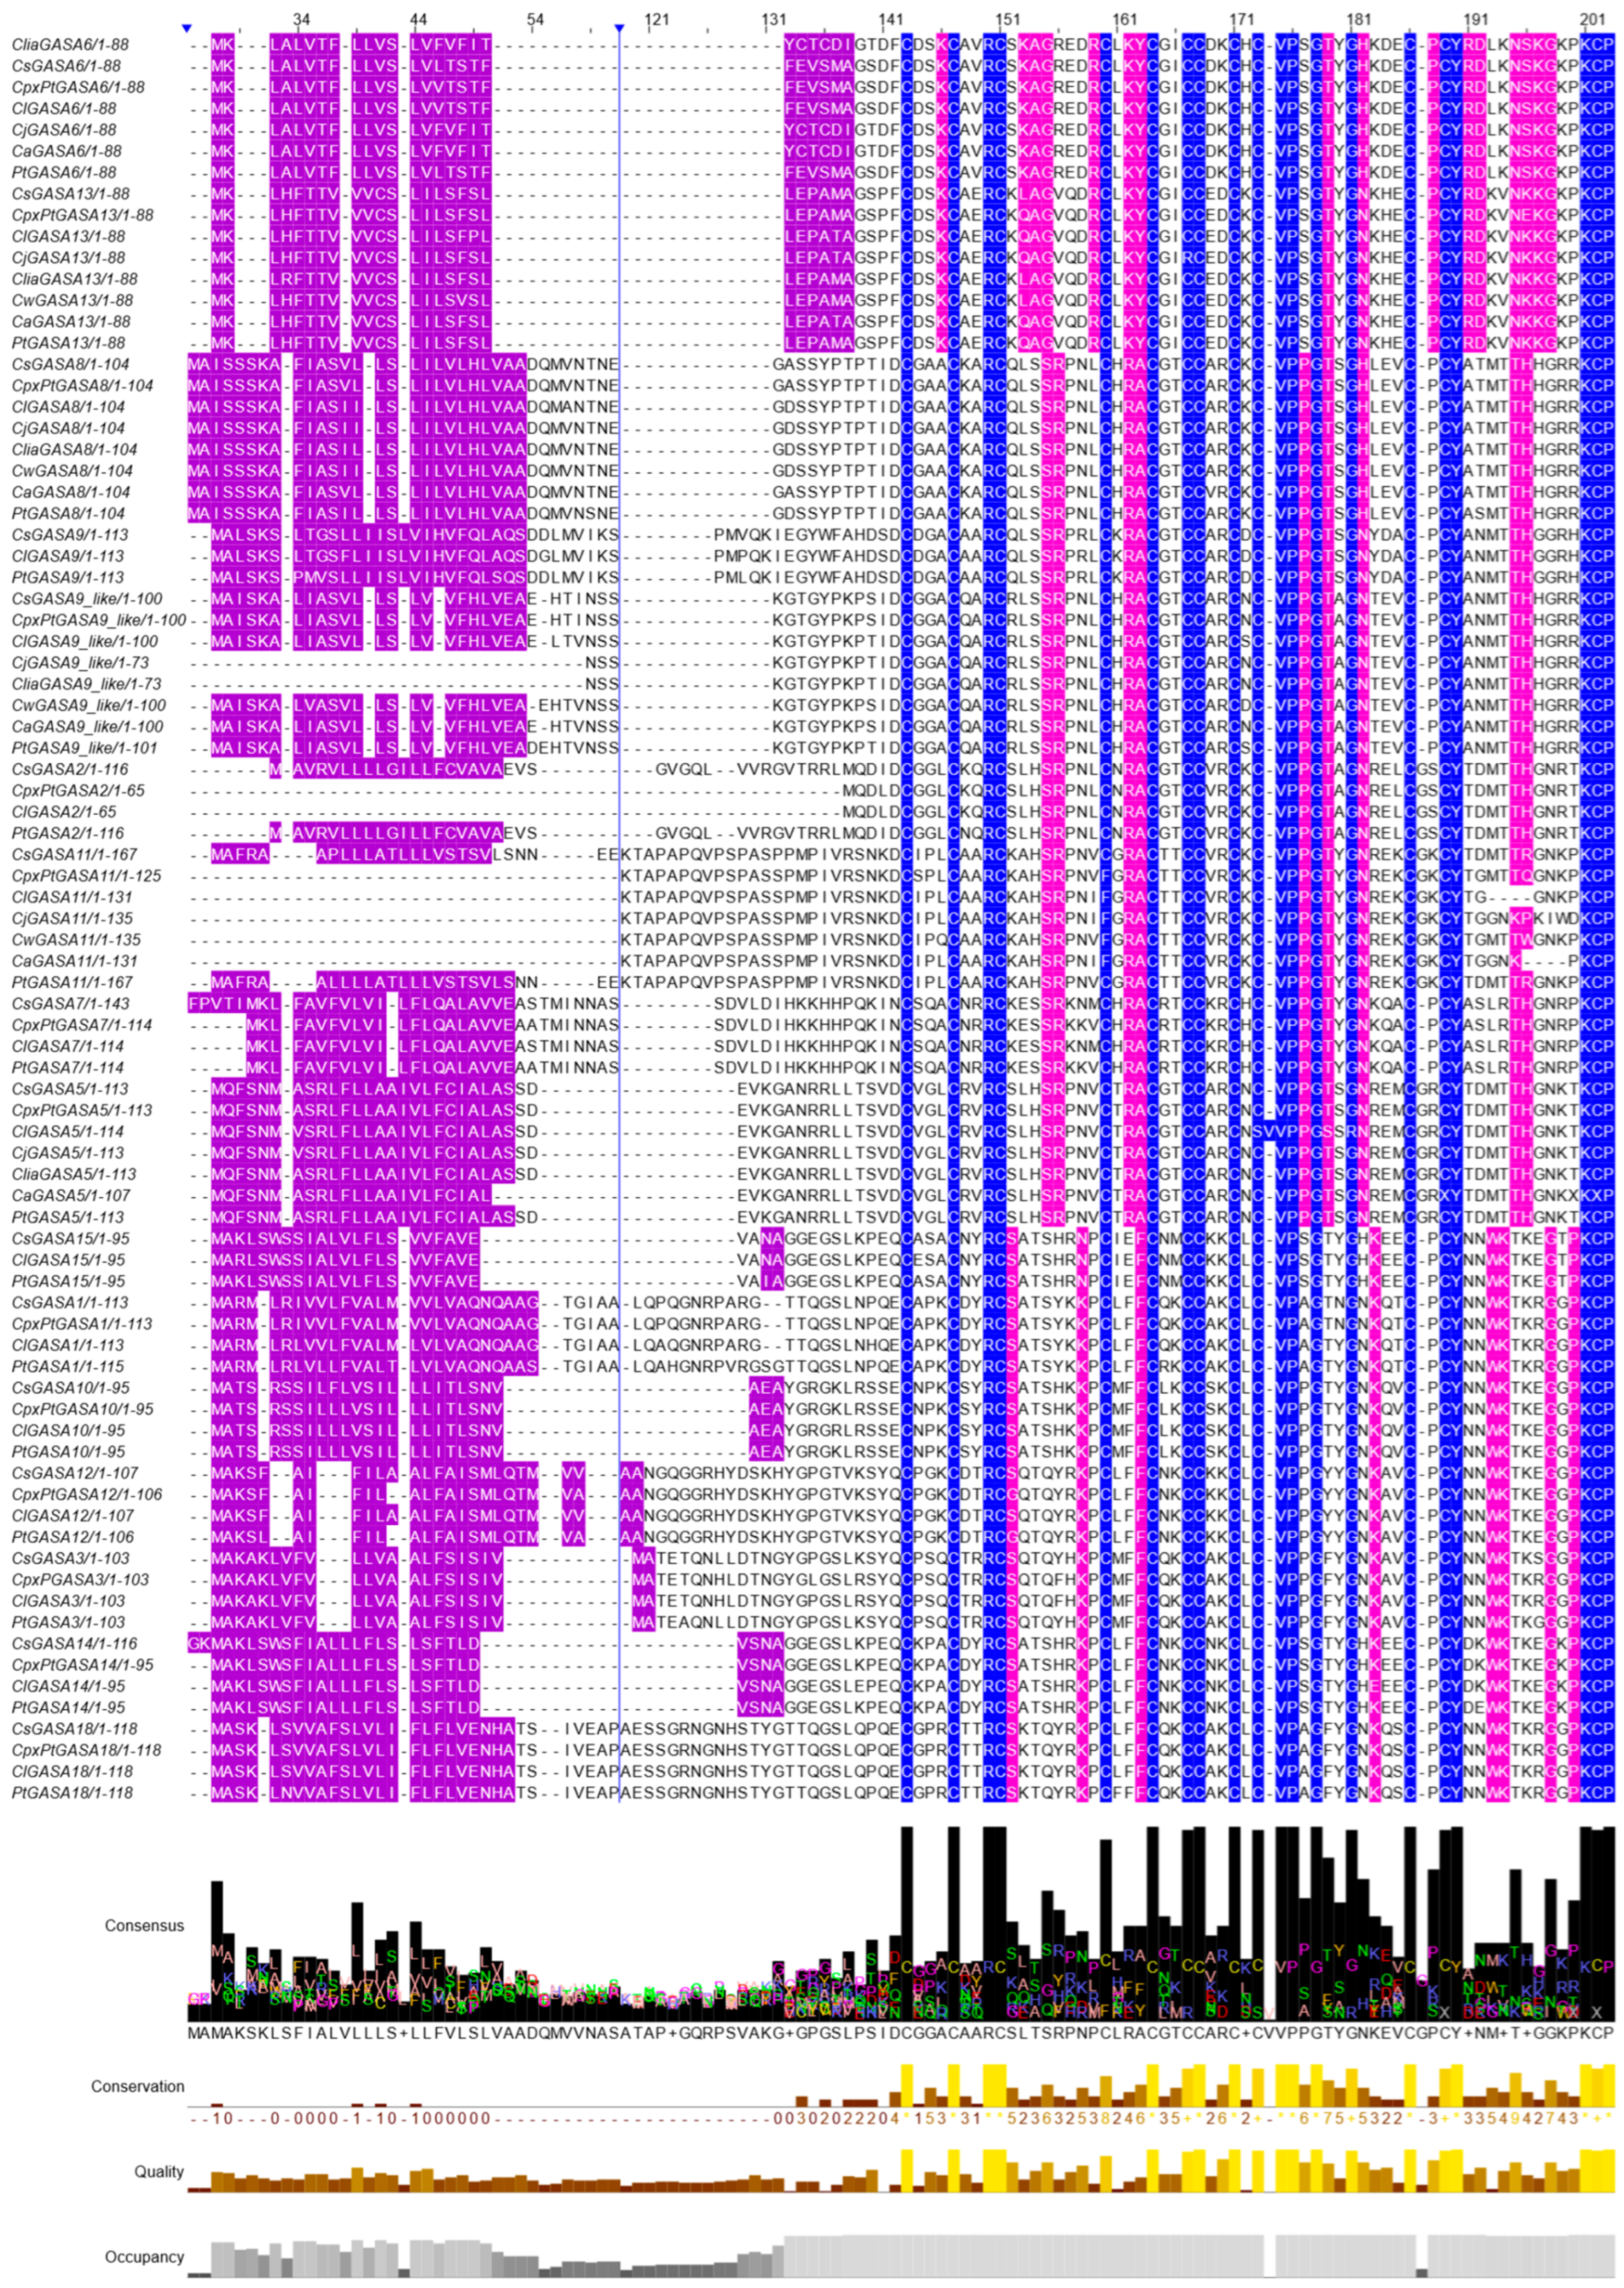
Figure 2.
Genomic distribution of GASA genes in chromosomes from P. trifoliata, C. limon and C. sinensis were performed using MapChart .
Figure 2.
Genomic distribution of GASA genes in chromosomes from P. trifoliata, C. limon and C. sinensis were performed using MapChart .
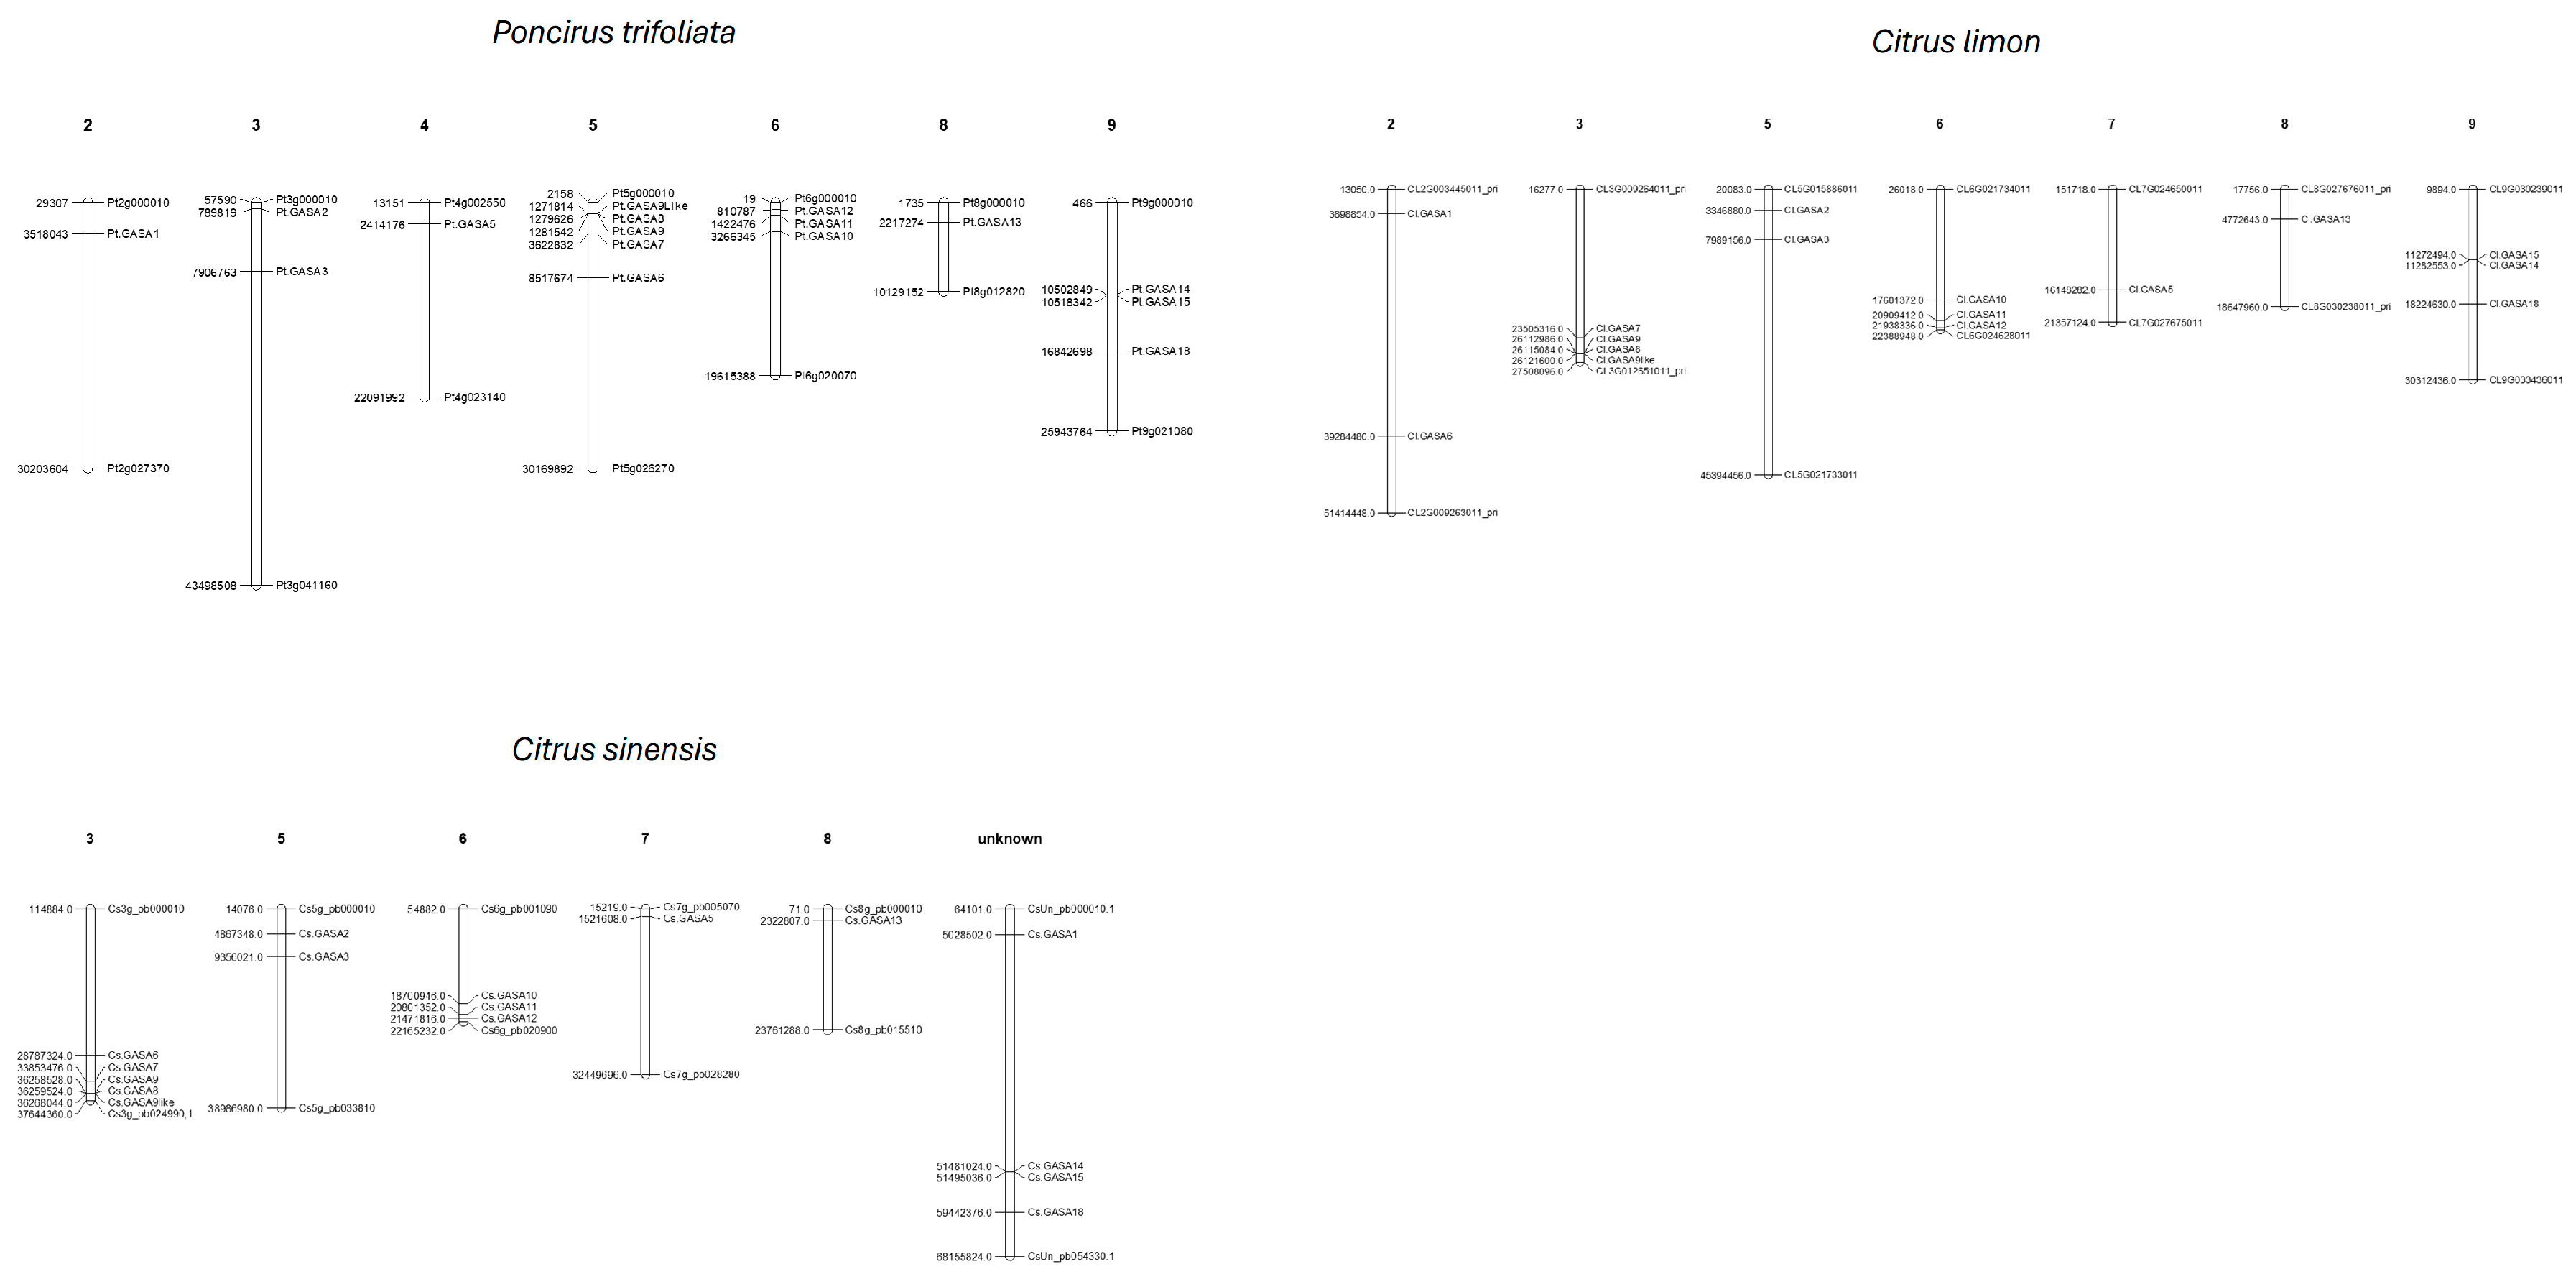
Figure 3.
Syntenic analysis of GASA family genes in Citrus sinensis, Citrus limon and Poncirus trifoliata. Genes displayed on circular bar-blocks indicate the chromosomal position: Citrus sinensis (red), Poncirus trifoliata (green), and Citrus limon (blue) chromosomes. Violet, yellow, and red color lines represent duplicated pairs.
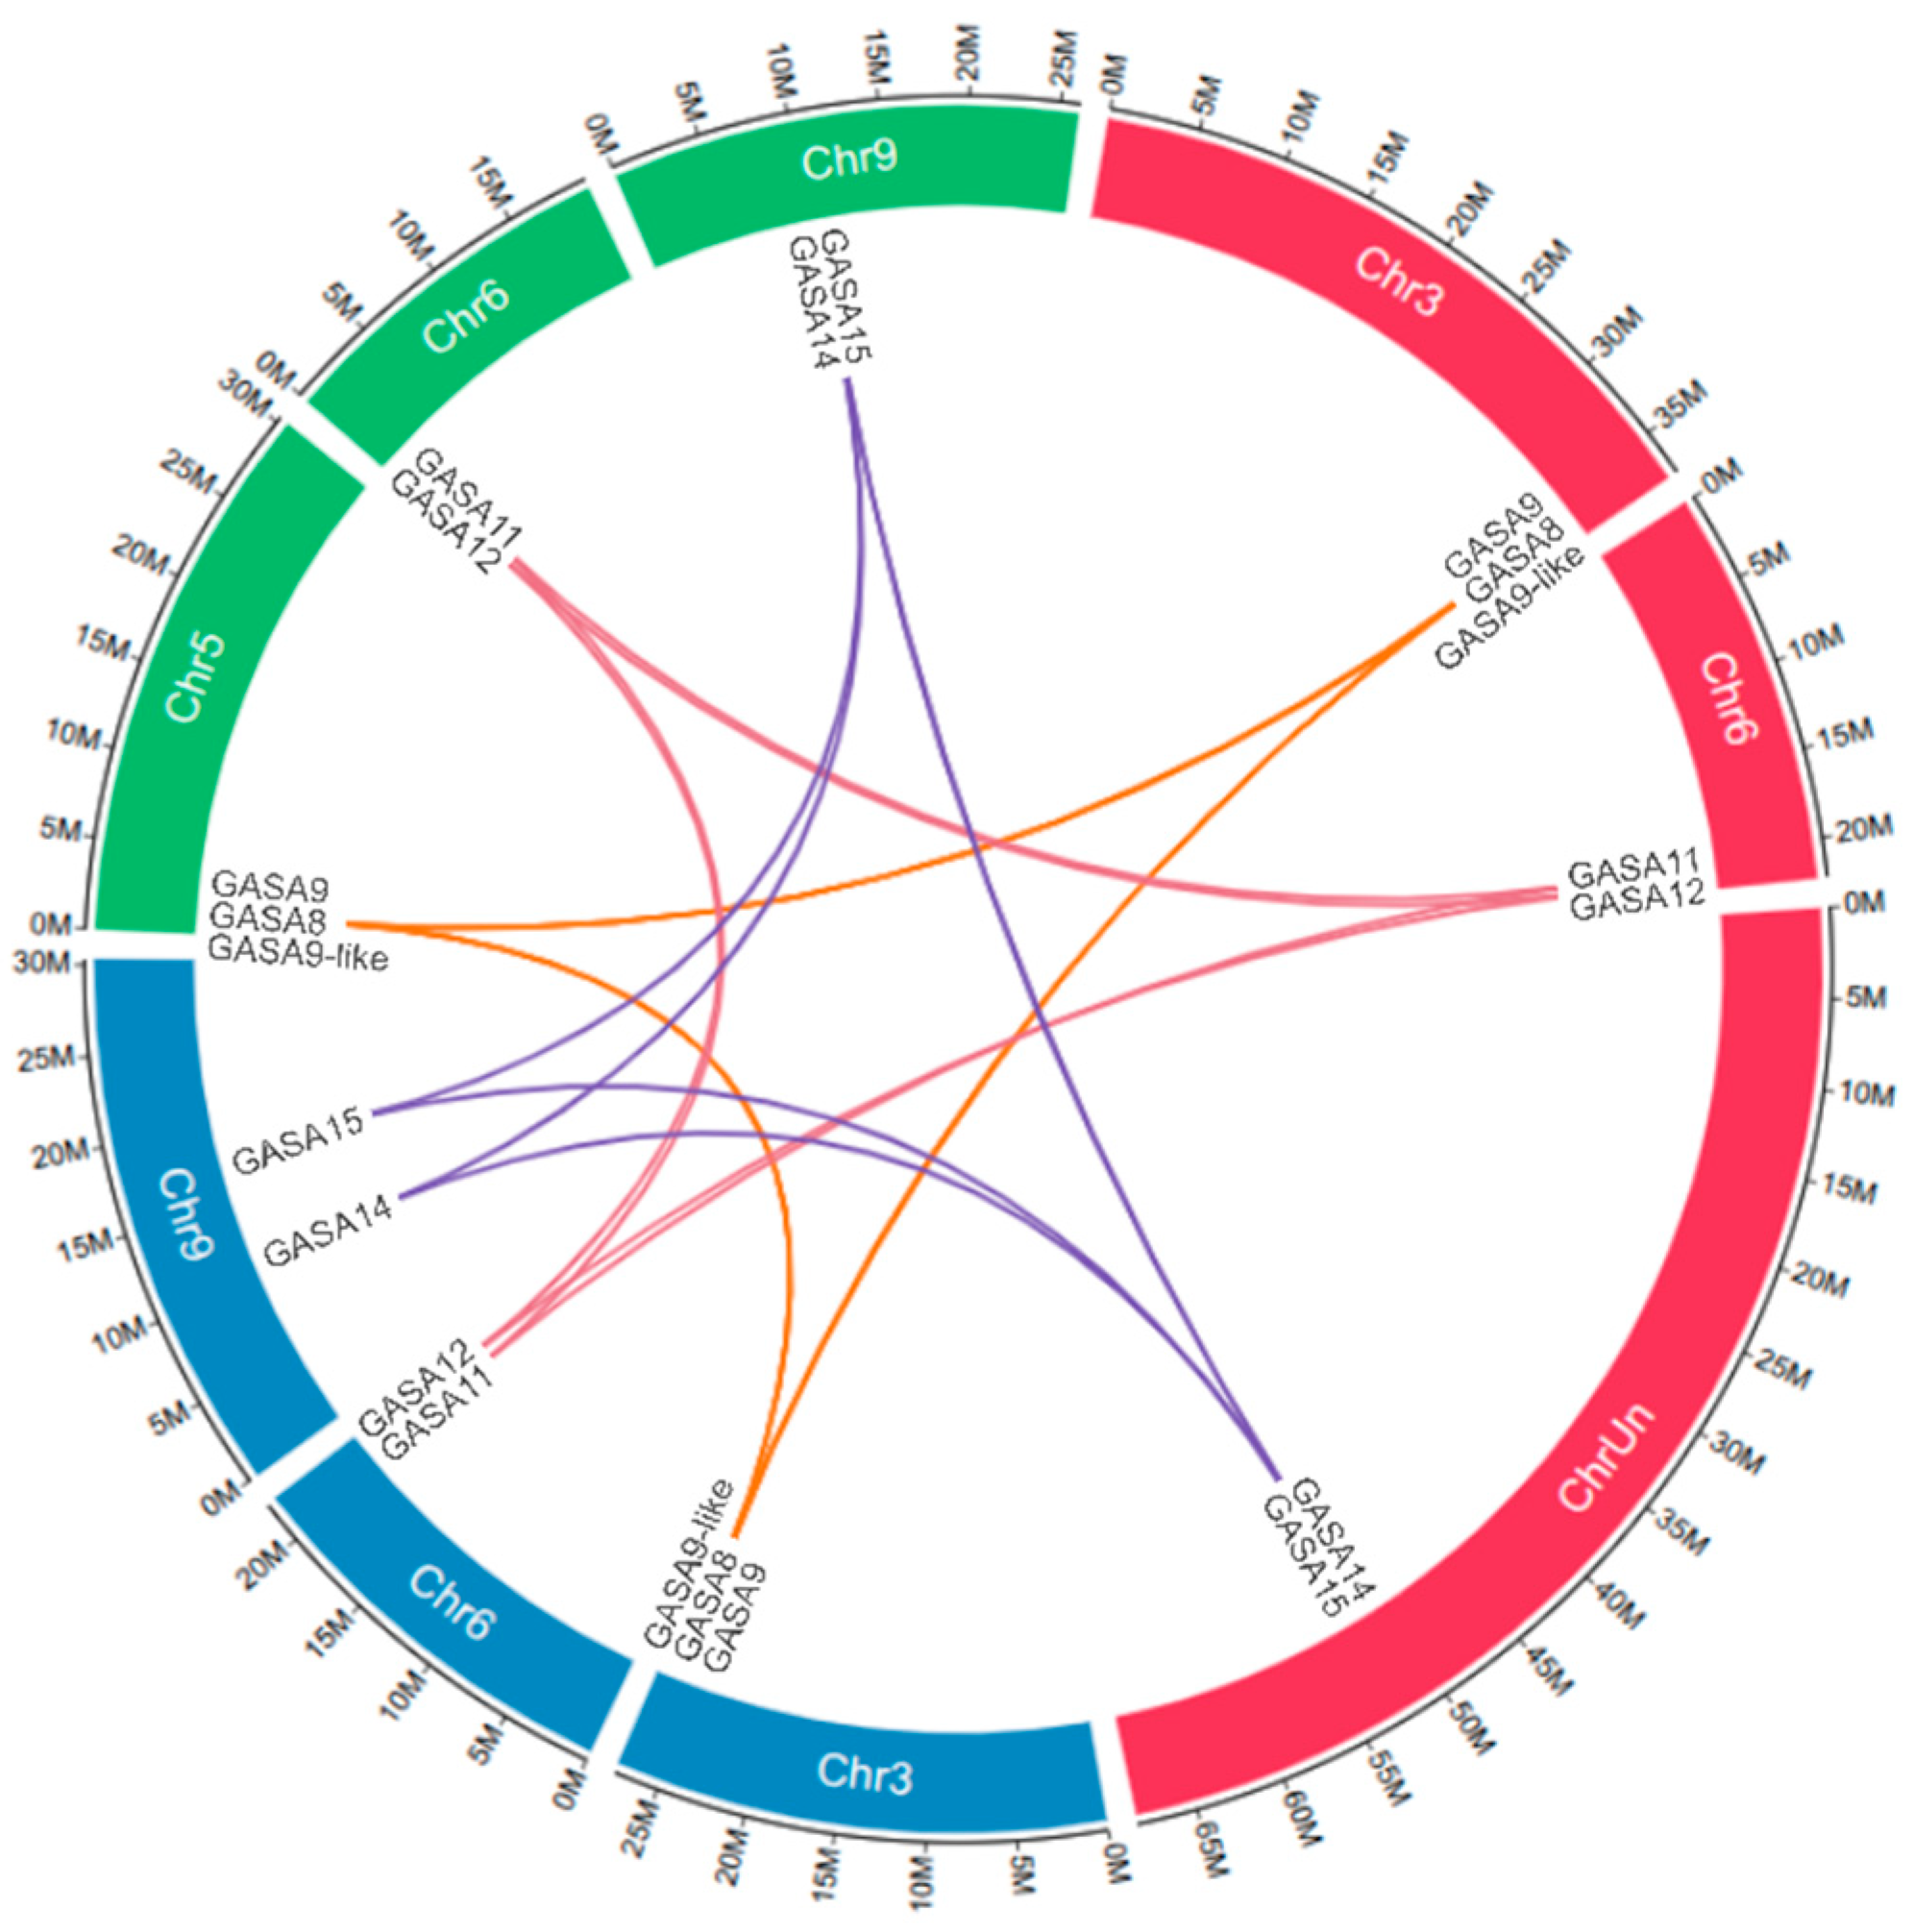
Figure 4.
Phylogenetic analysis of citrus GASA proteins generated using MEGA 11 with the Neighbor-Joining method and 1000 bootstrap replicates. A colored version was produced using the online tool ChiPlot tool. Subfamilies are indicated with colors: subfamily I in violet, subfamily II in magenta, and subfamily III in green. The varieties included in this analysis are: Cs, Citrus sinensis; Cp × Pt, Citrumelo (Citrus × paradisi × Citrus trifoliata); Cl, Citrus limon; Pt, Poncirus trifoliata; Cj, Citrus jhambiri; Clia, Citrus limonia; Cw, Citrus warburgiana; Ca, Citrus aurantium.
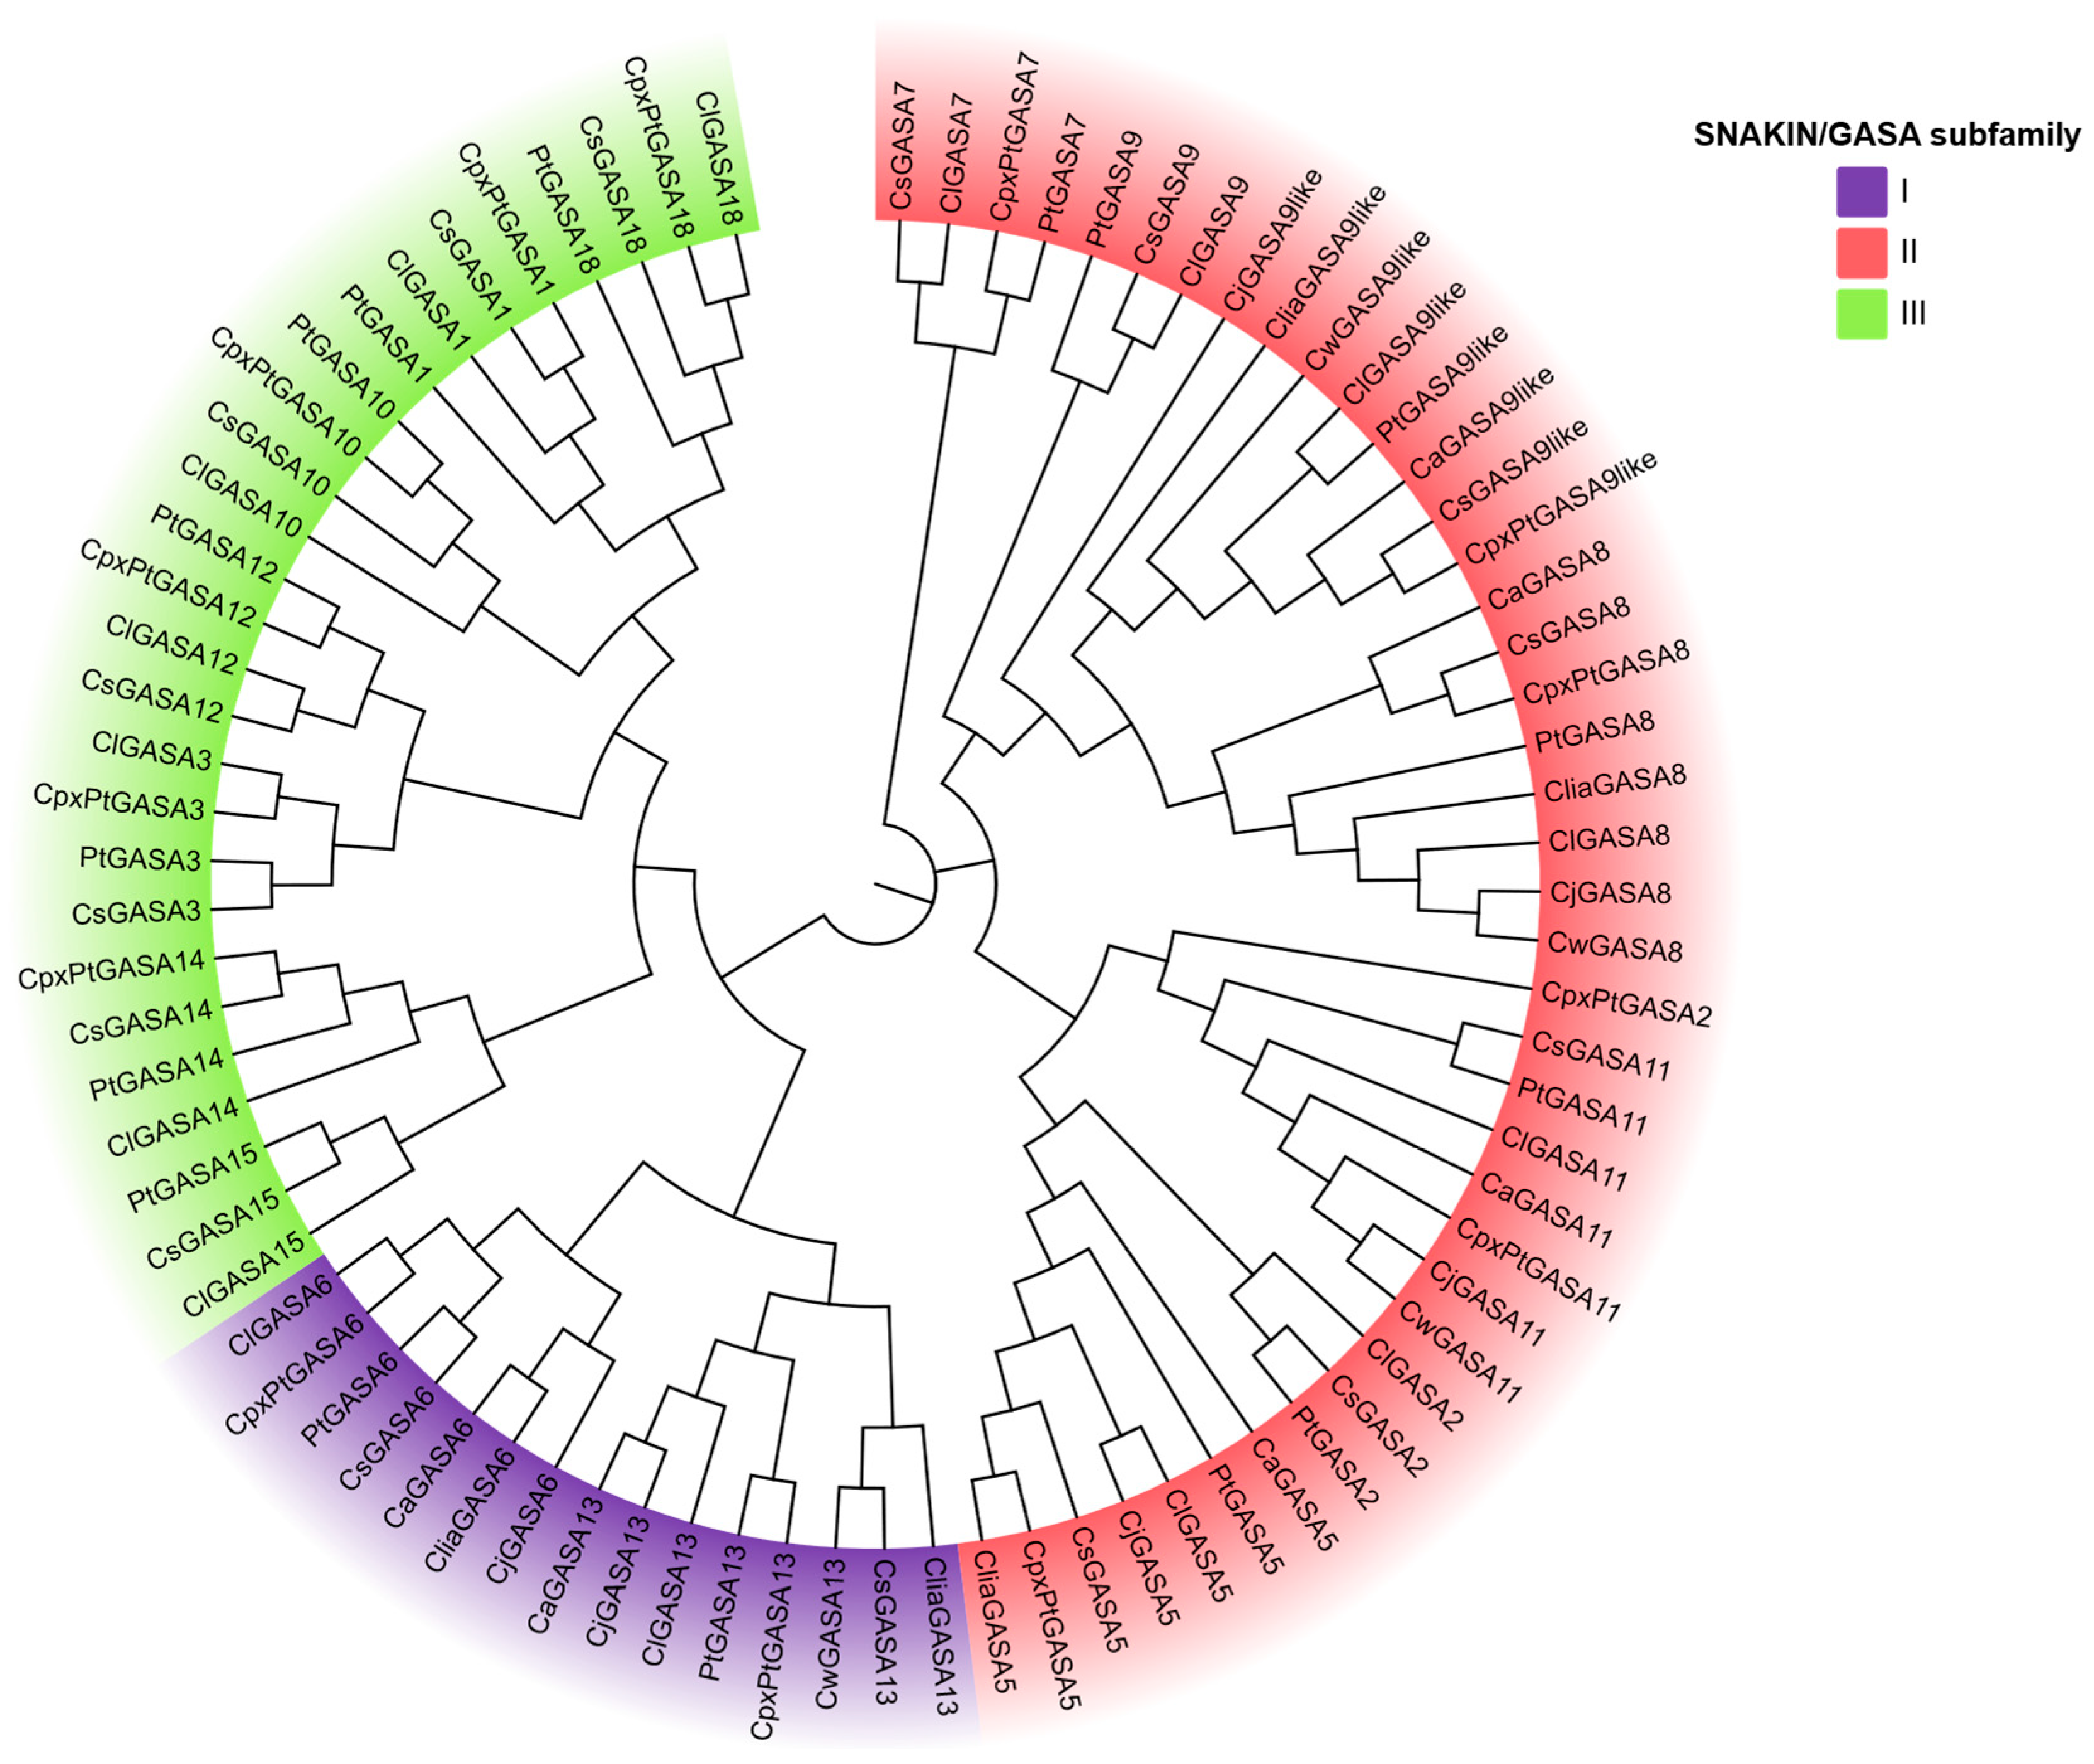
Figure 5.
Representative heatmap of gene expression obtained through absolute RT-qPCR from floral tissue (purple), juvenile (magenta), and mature leaf (green) of citrus cultivars C. reticulata var ‘Clemenule’, Citrus limon var. ‘Eureka’, Citrus limonia (Rangpur), Citrange Troyer, Poncirus trifoliata. The heatmap, generated using the Chiplot tool, employs a color scale ranging from dark blue, representing minimum expression, to dark red, representing maximum expression. On the left, the analyzed GASA genes are shown along with their corresponding subfamily classification (I, II, or III).
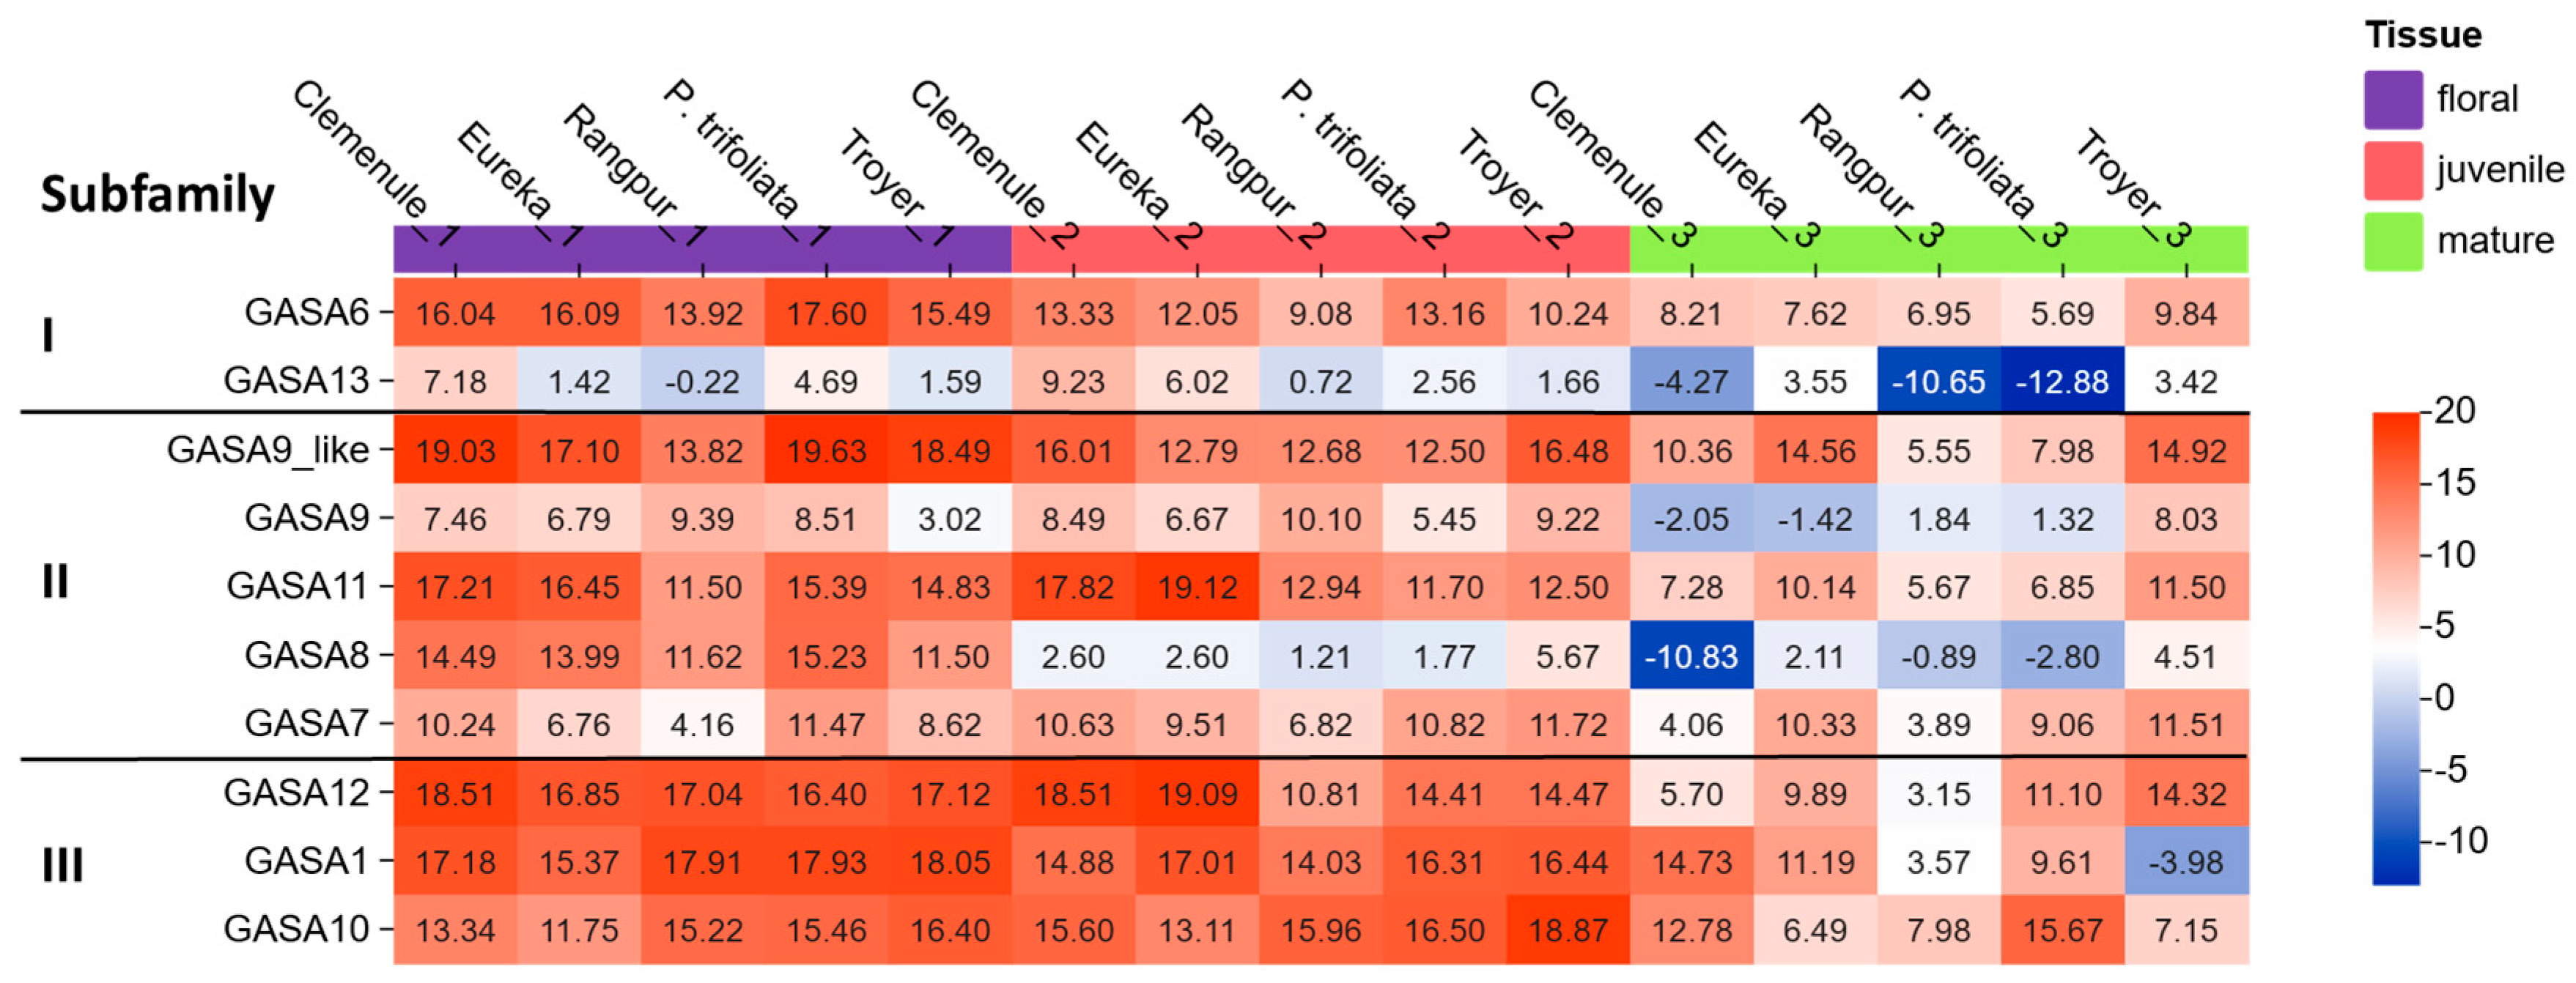
Figure 6.
Heatmap showing the log2 fold change of 18 citrus GASA genes across public HLB-related RNA-seq BioProjects. Each cell represents the log₂ fold change of a given GASA gene in a specific contrast. Red shades indicate GASA overexpression (positive log₂FC), blue shades indicate under-expression (negative log₂FC) and near-white cells correspond to little or no change. Empty cells reflect cases where the corresponding GASA gene was not detected in that dataset or lacked sufficient read support to generate a reliable log₂FC estimate. In Supplementary Table S1 there is a description of the experimental approach of each BioProject and their specific references. In Supplementary Figure S1, some specific methodological issues regarding bioinformatic gene annotations performed by individual Bioprojects for GASA16-18 are shown.
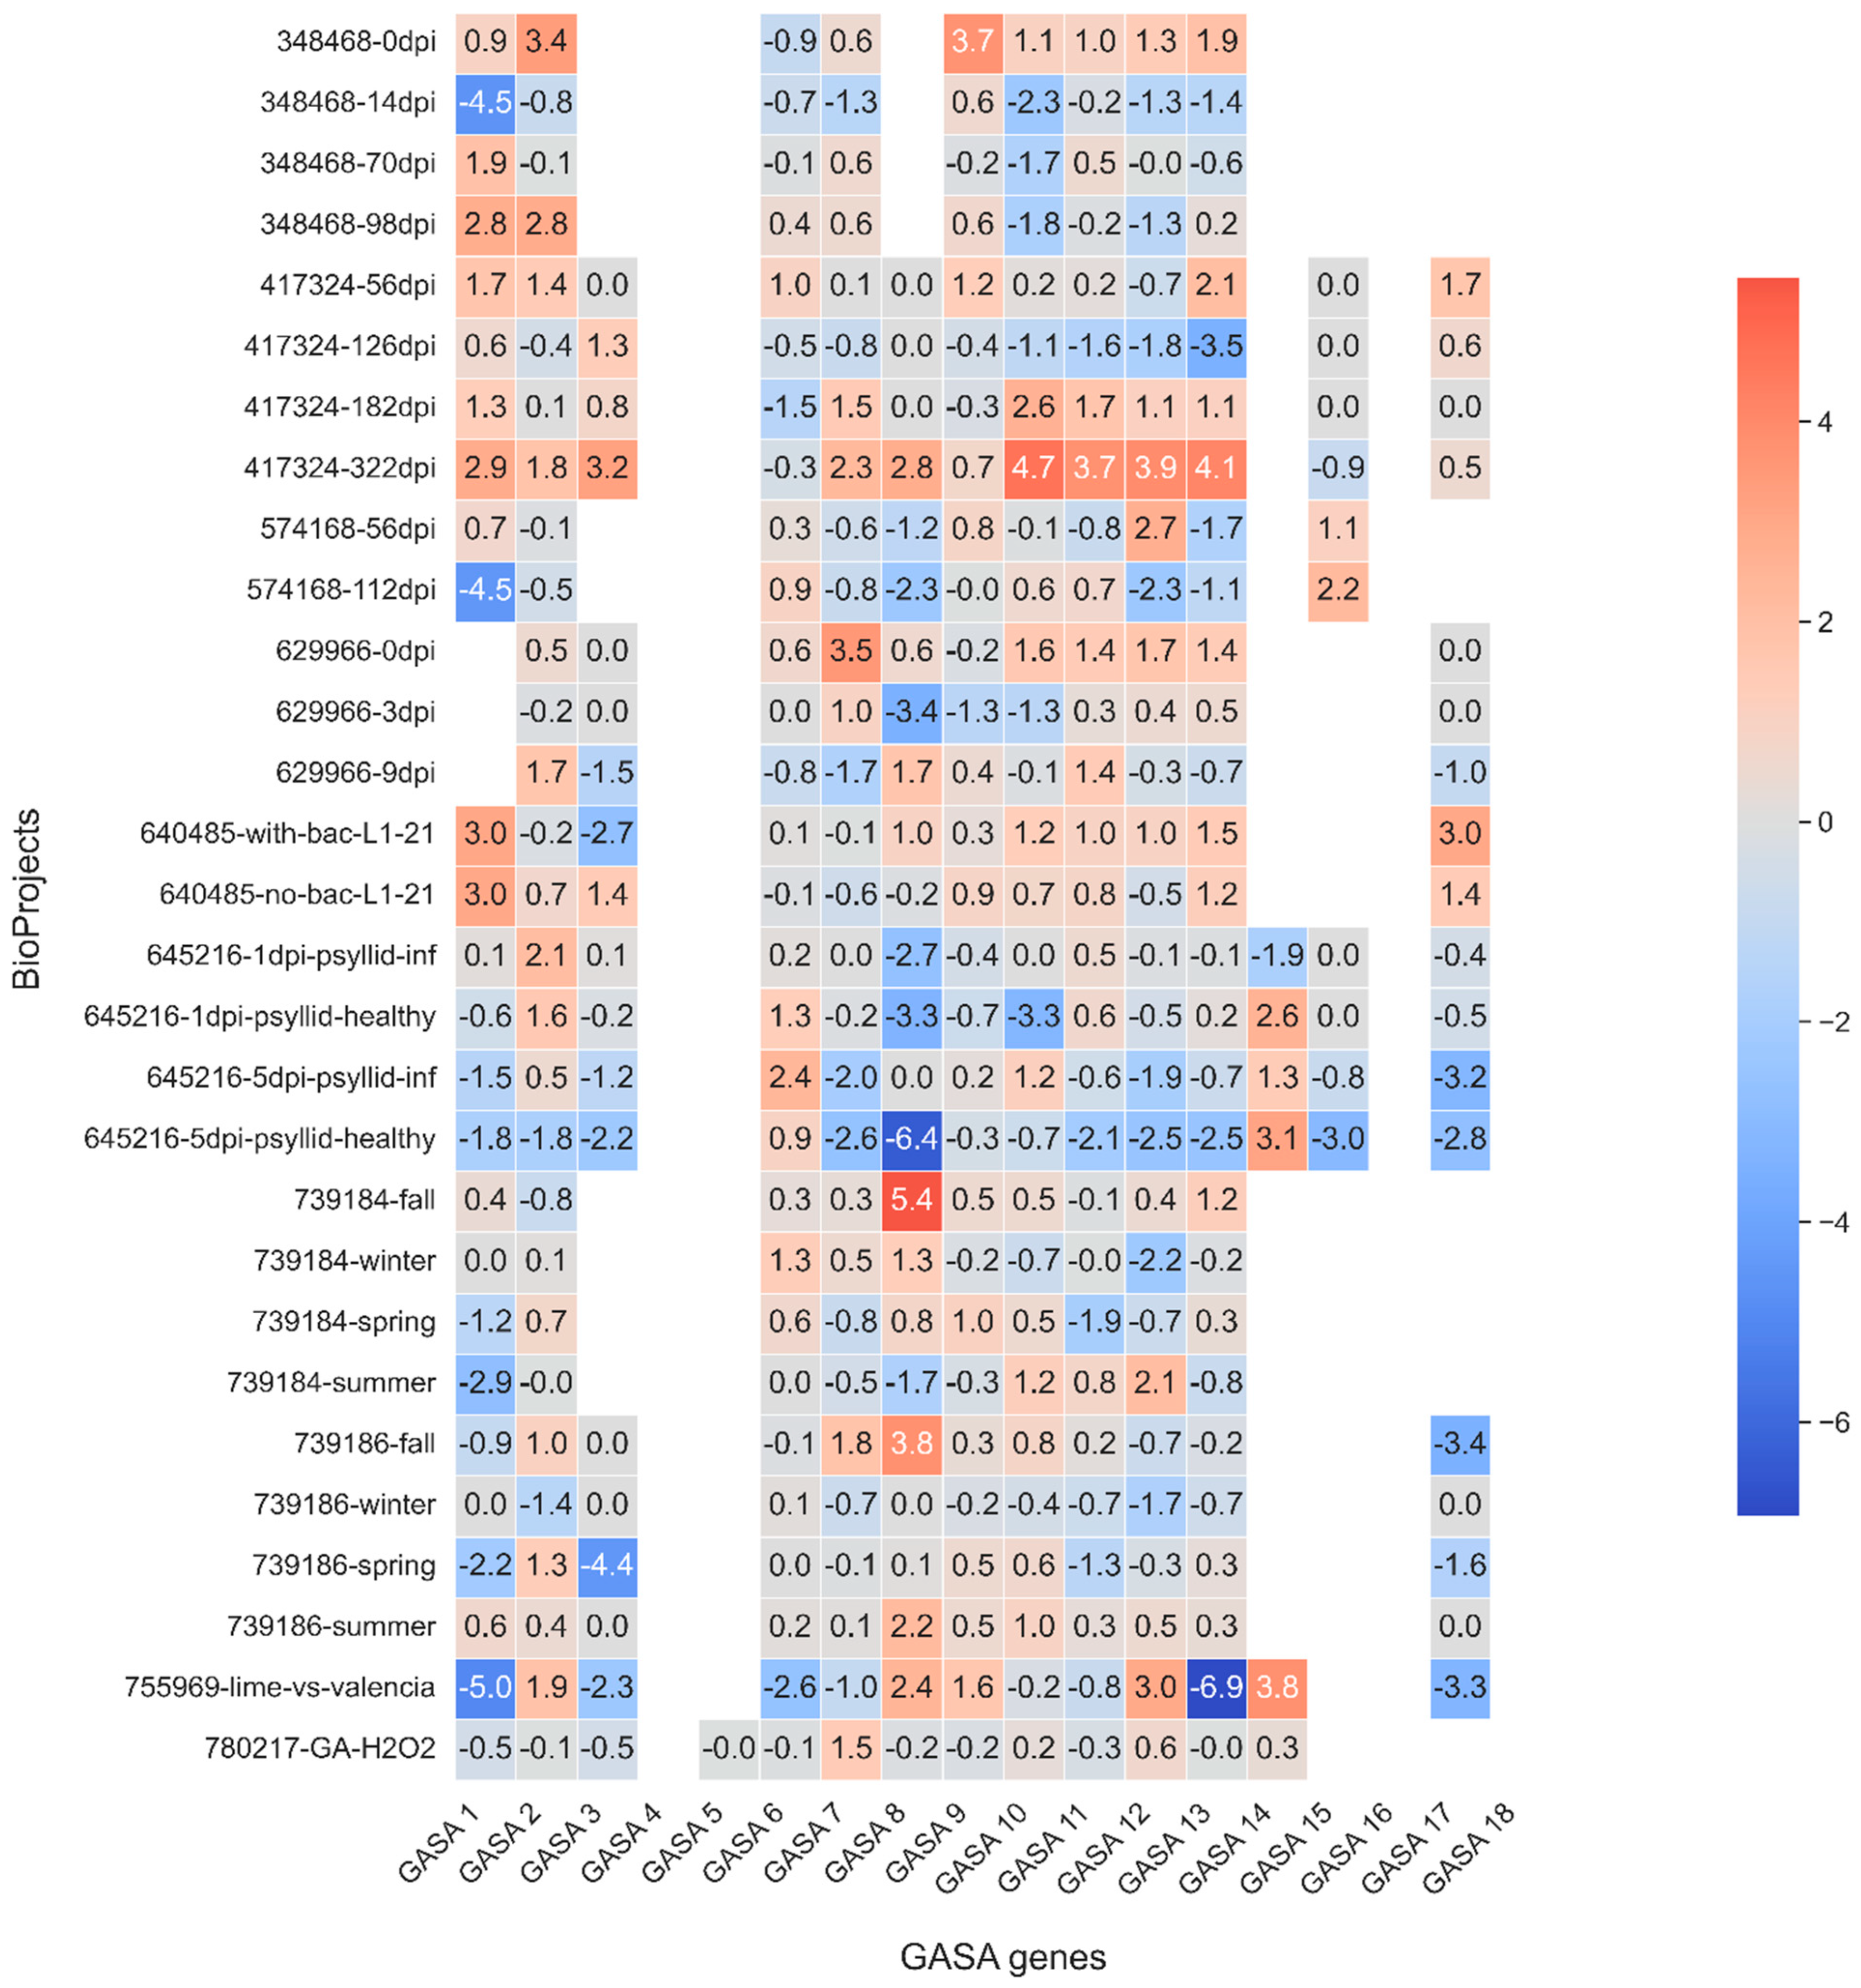
Figure 7.
Illustrative photo ensembles of individual representative leaves of N. benthamiana infected with Pseudomonas syringae pv. tabaci transiently overexpressing PtGASA6, PtGASA8, and PtGASA10 or the control at 6 (A), 8 (B), and 11 (C) post-infection. Each leaf was co-infiltrated in the same six positions with A. tumefaciens GV3101 expressing the indicated genes and the pathogen Pseudomonas syringae pv. tabaci.
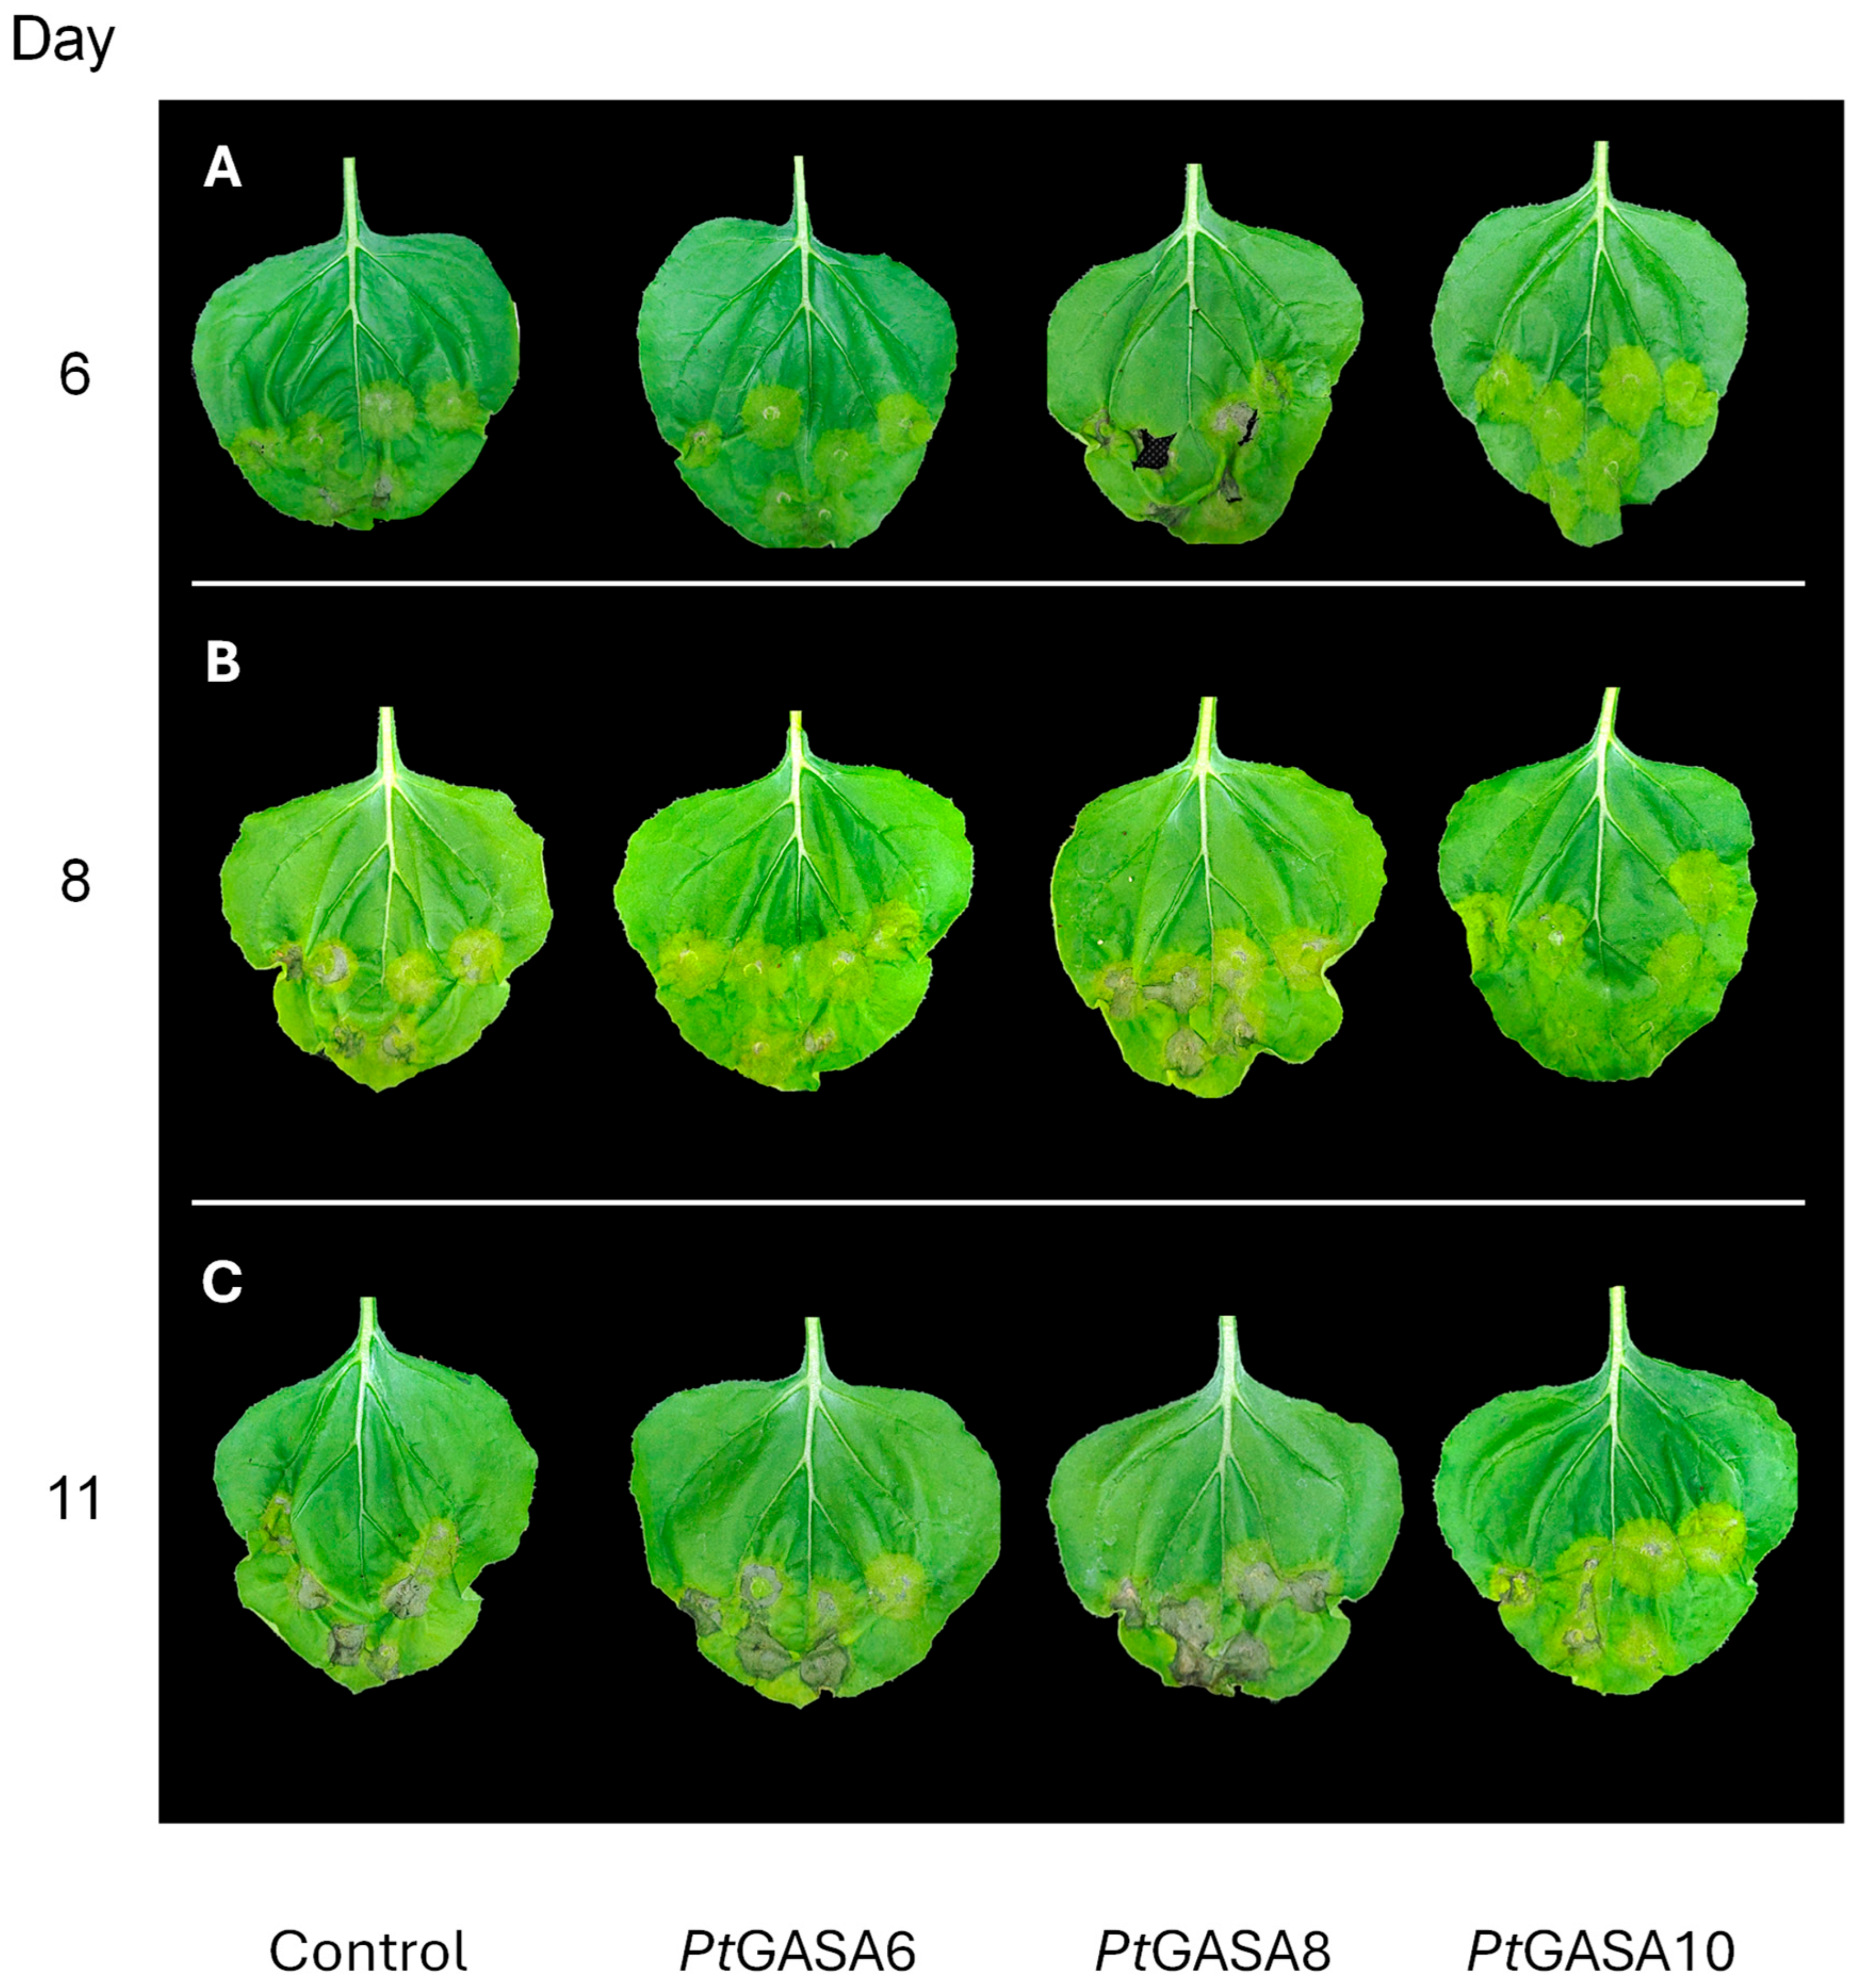
Figure 8.
Time course of disease index progression. Evaluation of disease development on days 4, 5, and 6 post-challenge with Pseudomonas syringae pv. tabaci in leaves overexpressing the genes PtGASA6, PtGASA8, and PtGASA10, or control. The non-parametric statistical analysis was performed using the Wilcoxon rank-sum test with continuity correction, adjusting p-values by the Bonferroni method relative to the control. Statistical significance is indicated by asterisks as follows: * p < 0.05, ** p < 0.01, *** p < 0.001.
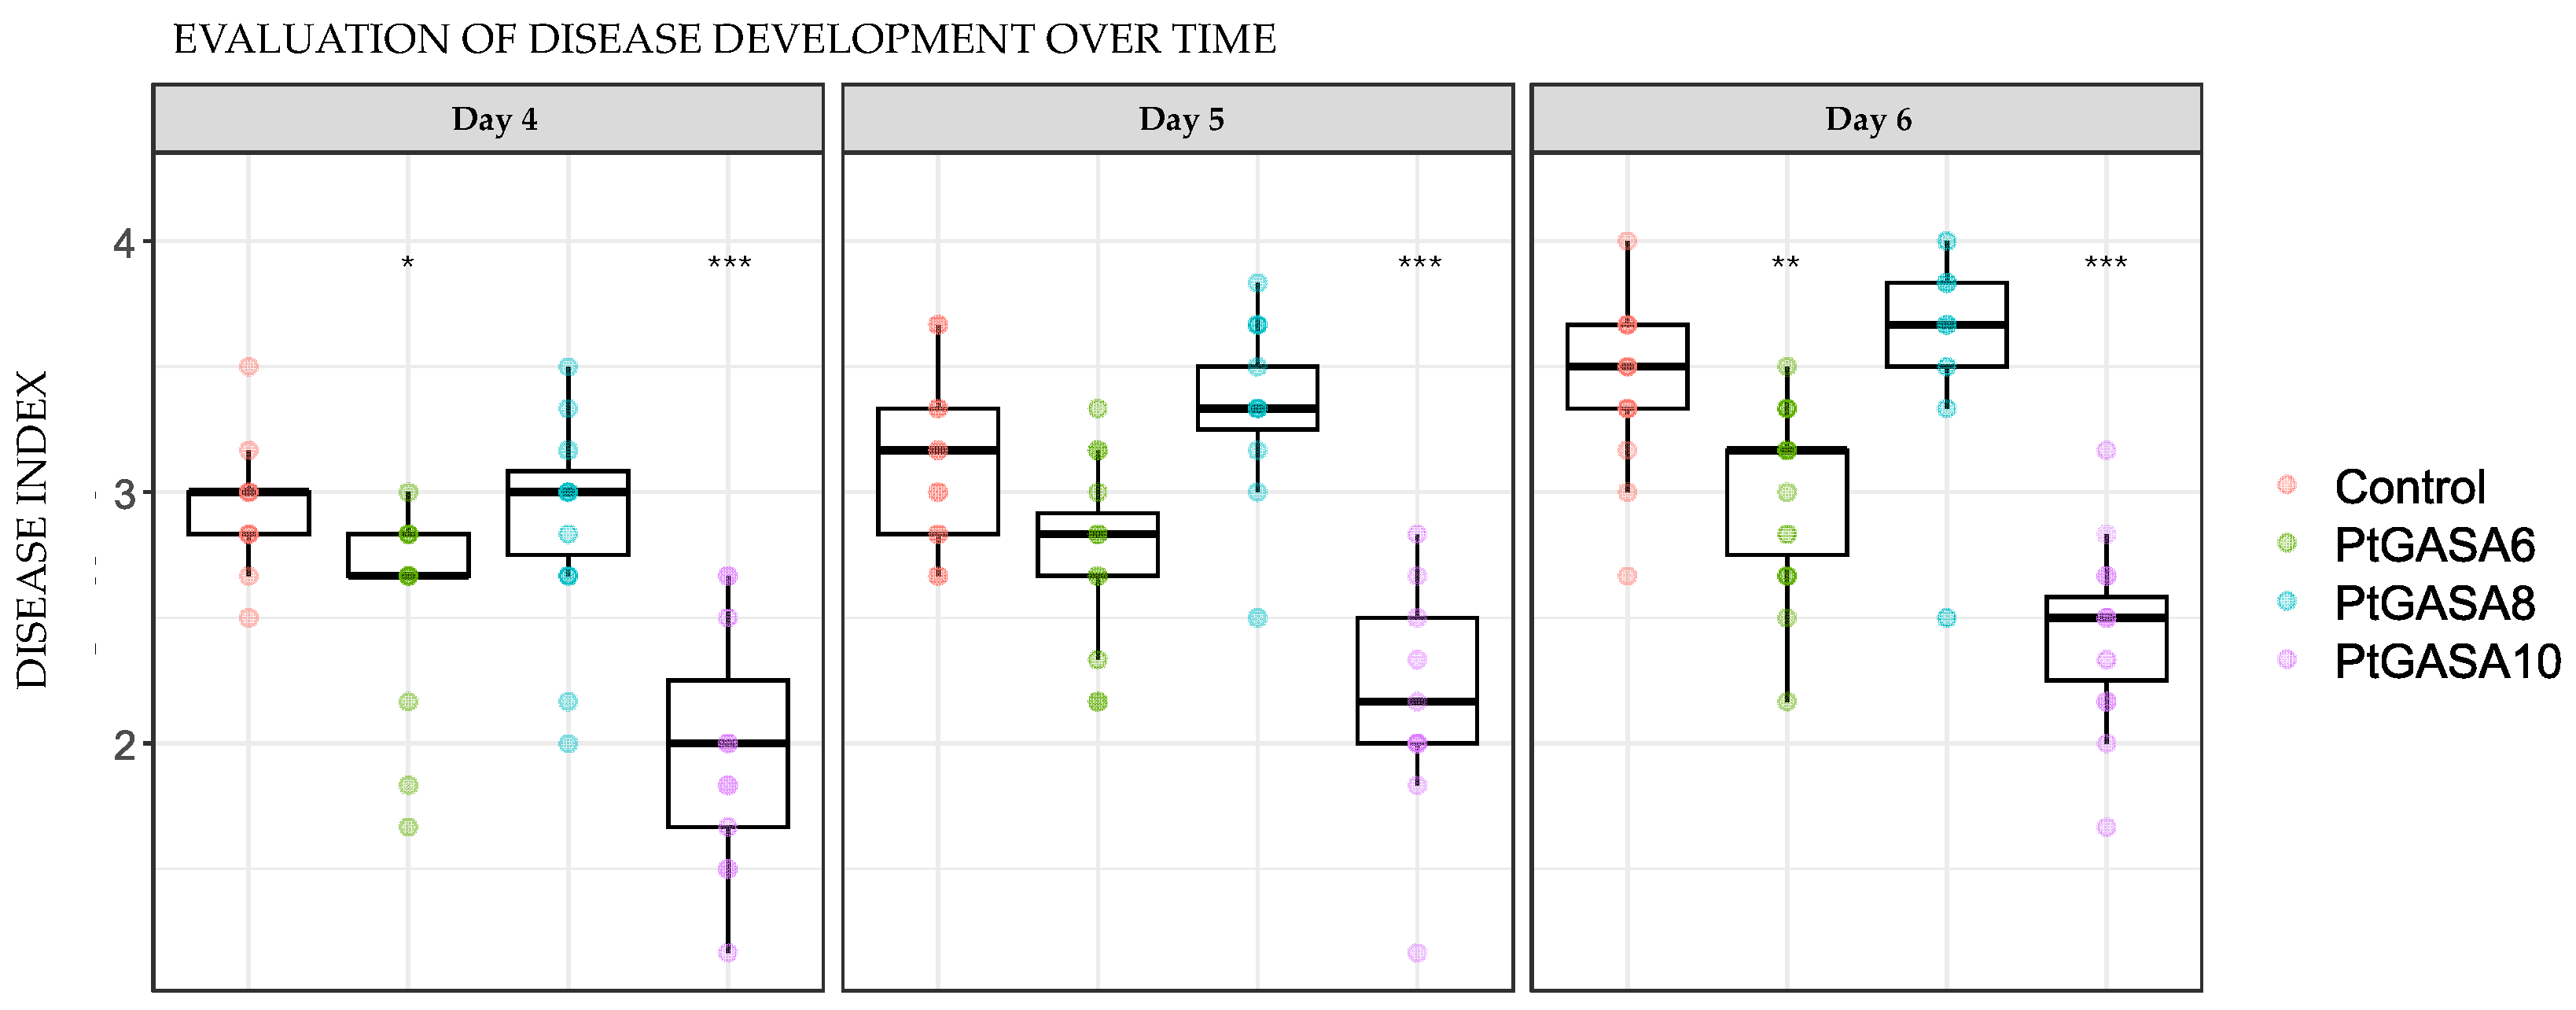
Figure 9.
Time course of disease AUDPC progression. Evaluation of disease development caused by Pseudomonas syringae pv. tabaci in leaves overexpressing PtGASA6, PtGASA8, and PtGASA10 or control. (A) Disease progression curves showing the disease index over time for PtGASA6, PtGASA8, PtGASA10 and control. It is represented in green, light blue, purple, and magenta, respectively. (B) Area Under the Disease Progress Curve for the control and PtGASA6 (upper panel), PtGASA8 and PtGASA10 (lower panel), respectively. Statistical analysis was performed using the non-parametric Wilcoxon rank-sum test with continuity correction and Bonferroni adjustment relative to the control. Significance levels are indicated by asterisks: * p < 0.05; *** * p < 0.001.
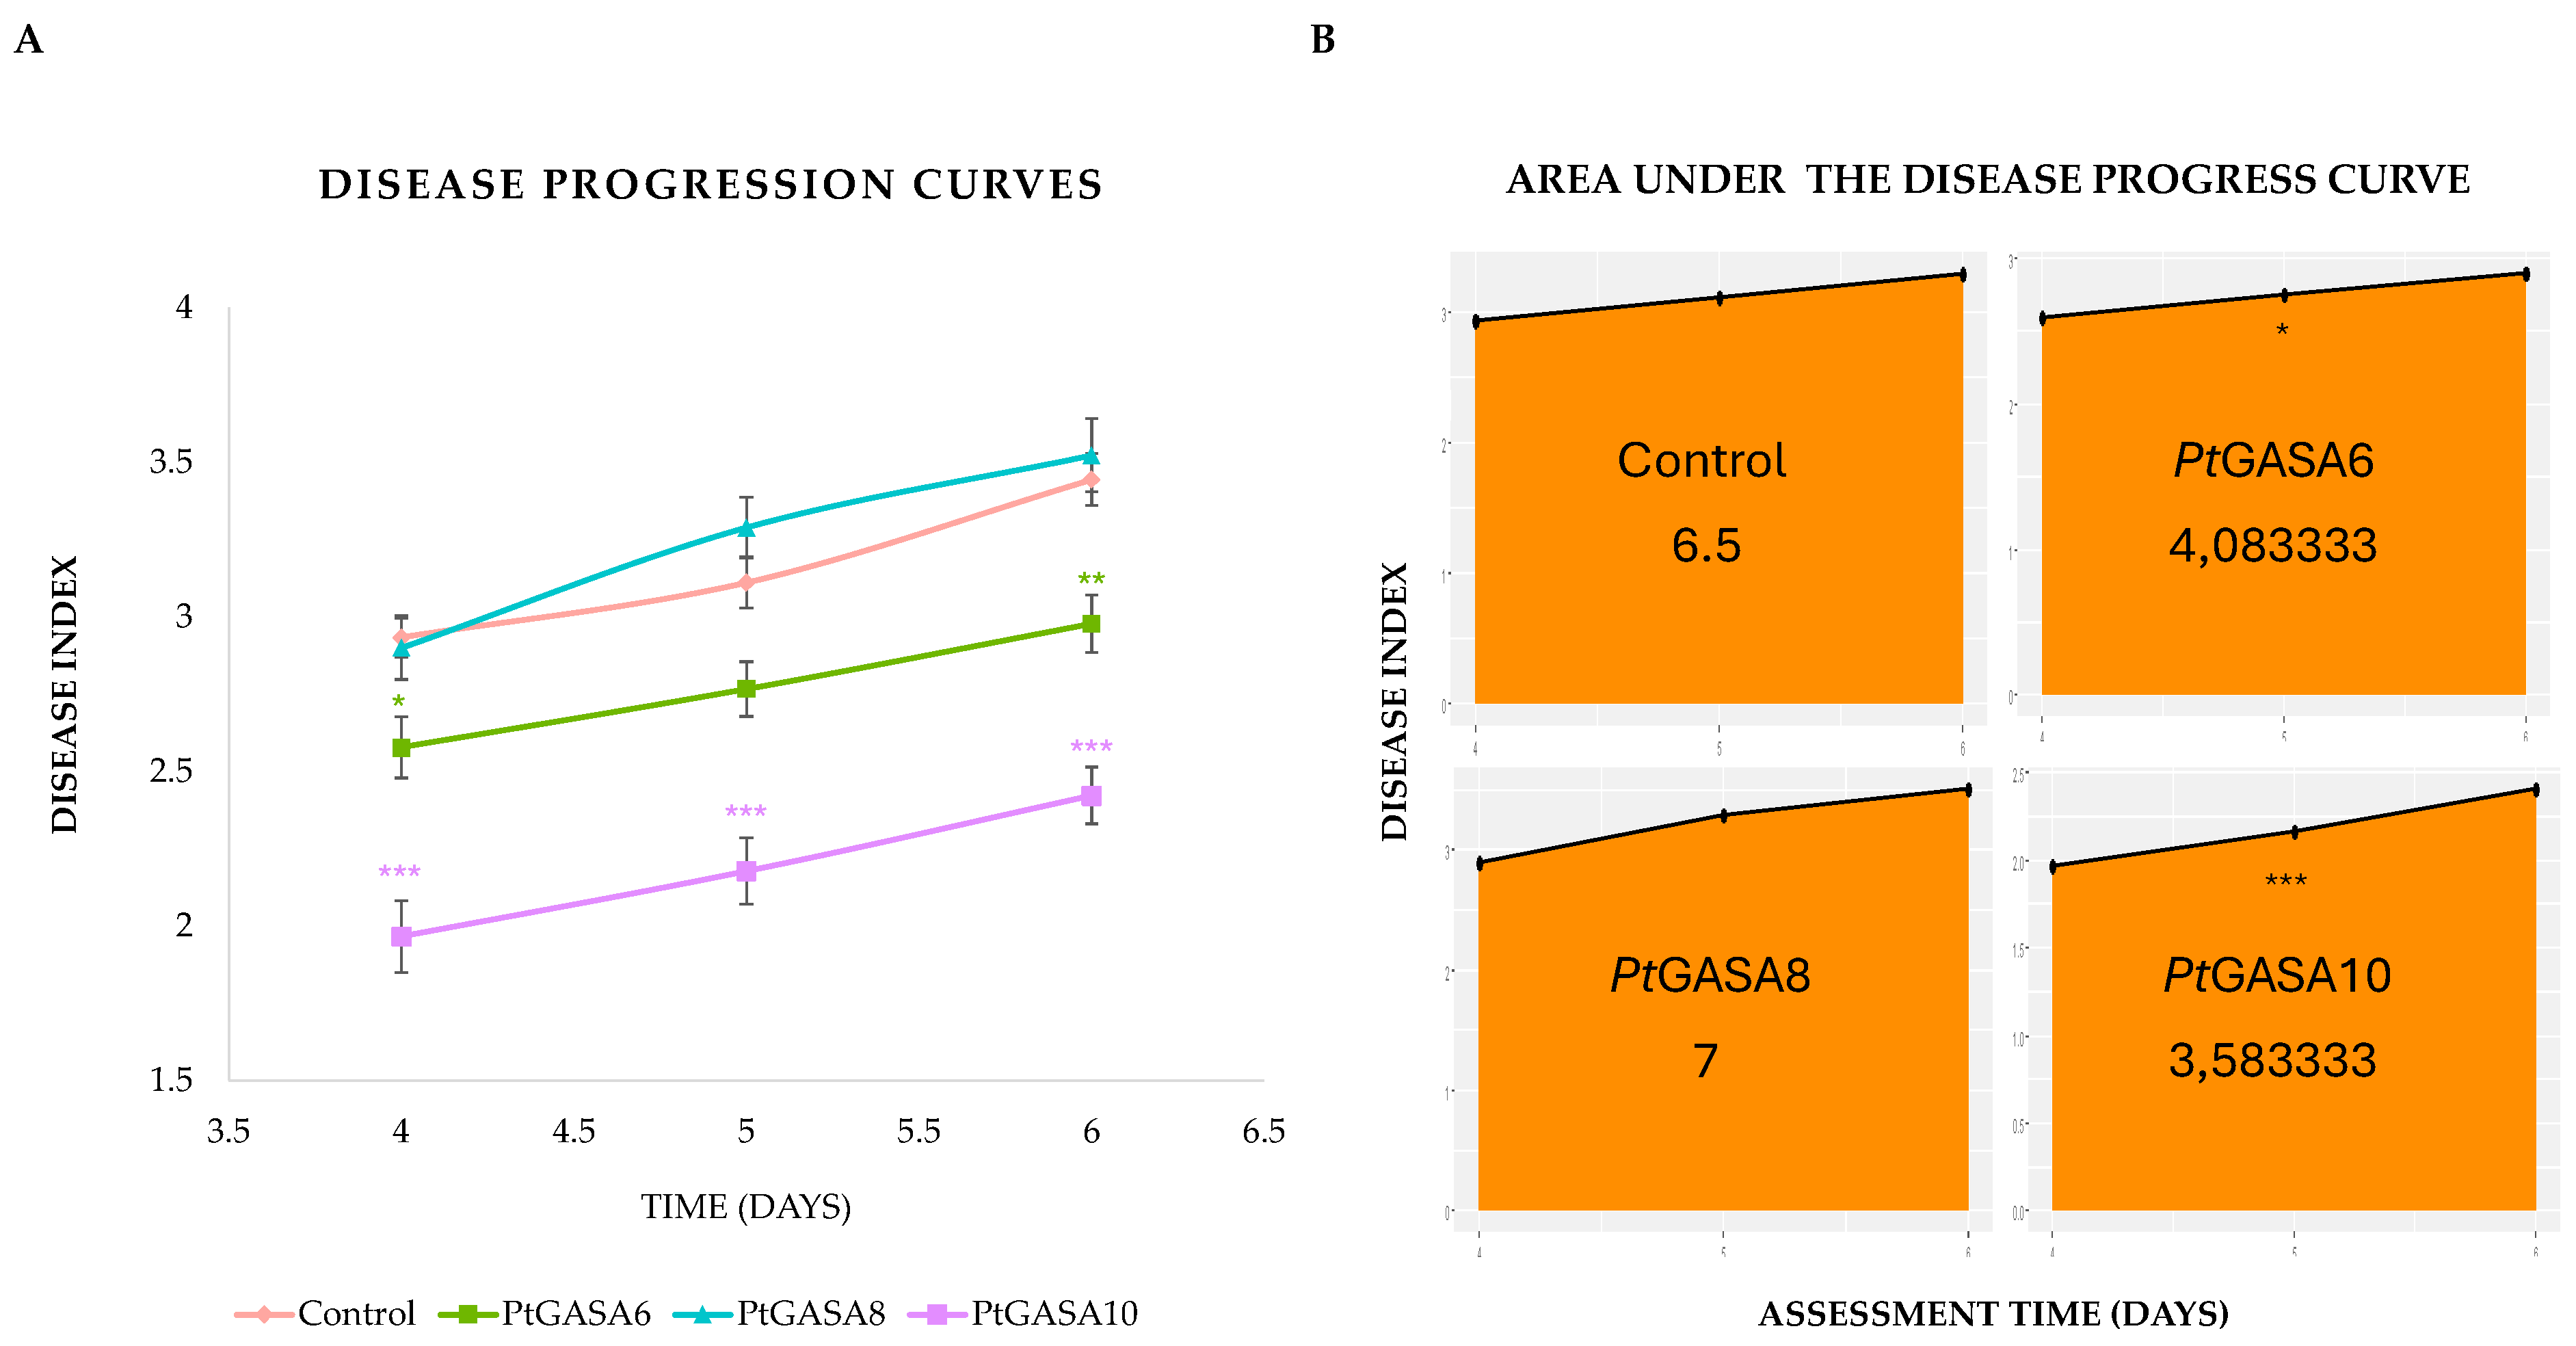
Figure 10.
Demonstrative photograph ensemble of representative individual leaves of N. benthamiana after transient overexpression of PtGASA6, PtGASA8, PtGASA10 (or the control) showing the hypersensitive response generated by challenging with Xanthomonas citri subsp. citri at (A), 4 (B), and 5 (C) days post-infection.

Figure 11.
Time course development of hypersensitive response, from days 6 to 17, post-challenge. The leaves overexpressing the genes PtGASA6, PtGASA8, and PtGASA10 or the control were inoculated with Xanthomonas citri subsp. citri. The overexpressing leaves and control are represented in green, light blue, purple, and magenta, respectively. The non-parametric statistical analysis was performed using the Wilcoxon rank-sum test with continuity correction, adjusting p-values by the Bonferroni method relative to the control. Statistical significance is indicated by asterisks as follows: * p < 0.05, ** p < 0.01, *** p < 0.001.
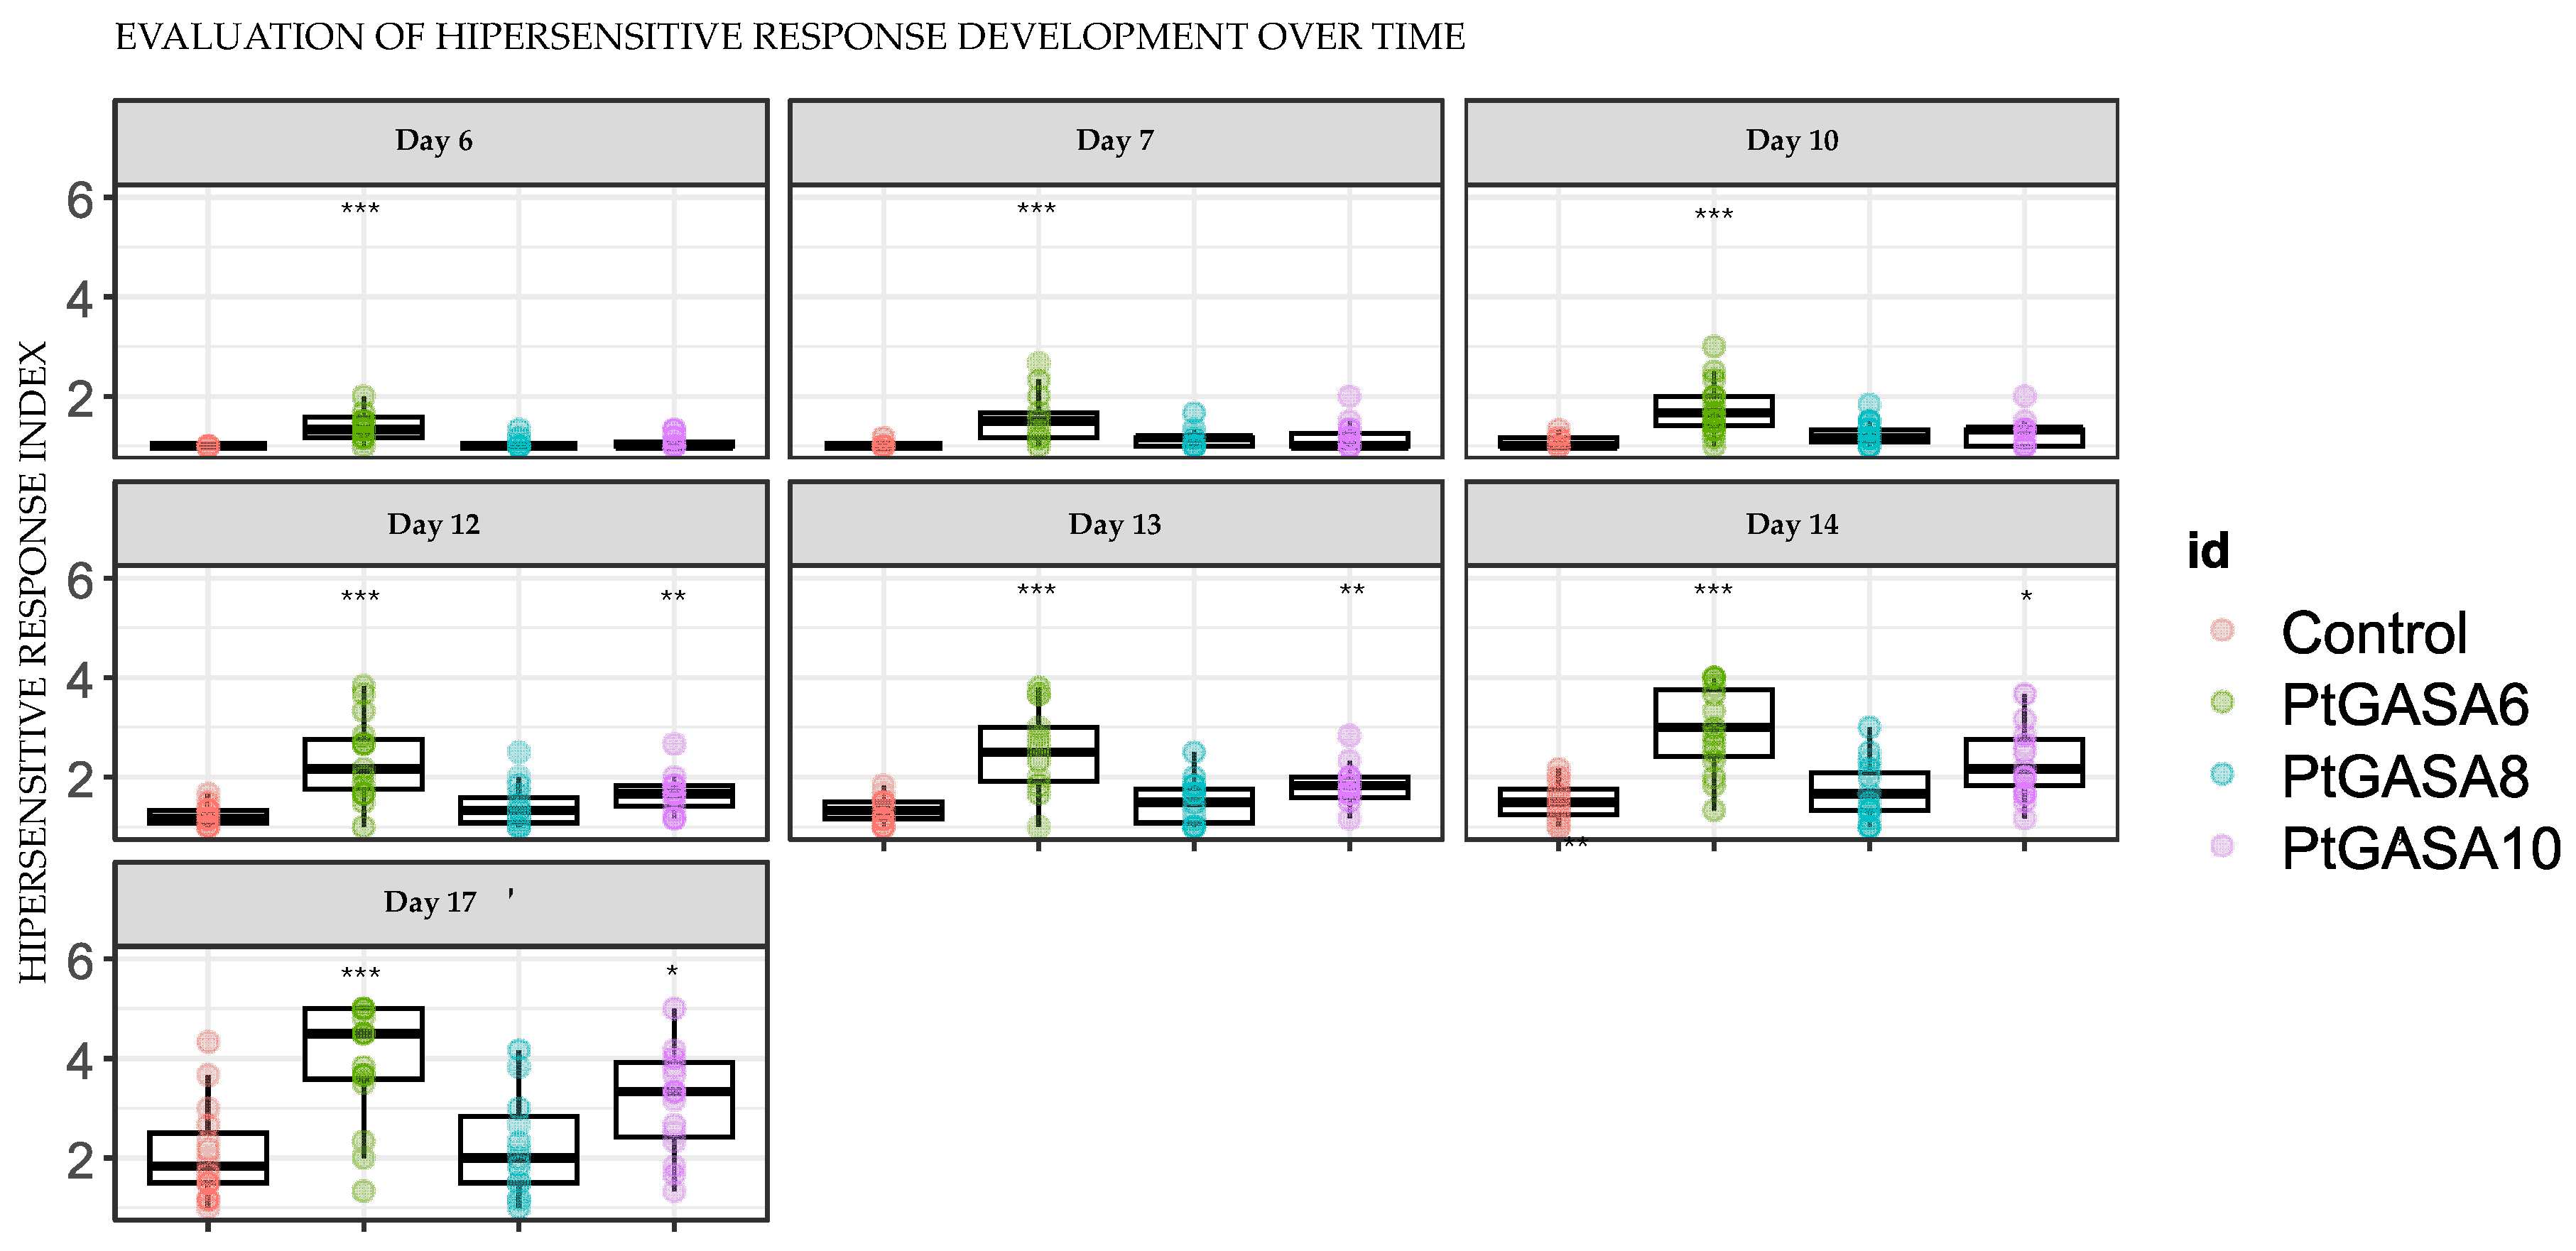
Figure 12.
Evaluation of hypersensitive response (HR) development caused by Xanthomonas citri susp citri in leaves overexpressing PtGASA6, PtGASA8, and PtGASA10 or control infected with (A) Hypersensitive response progression curve using the HR index (HRI) as a function of time. The overexpressing leaves and control are represented in green, light blue, purple, and pink, respectively. (B) Area Under the hypersensitive response progress curve (AUHRPC). Non-parametric statistical analysis was performed using the Wilcoxon rank-sum test with continuity correction, and p-values were adjusted by the Bonferroni method relative to the control. Statistical significance is indicated by asterisks as follows: * p < 0.05, ** p < 0.01, *** p < 0.001.
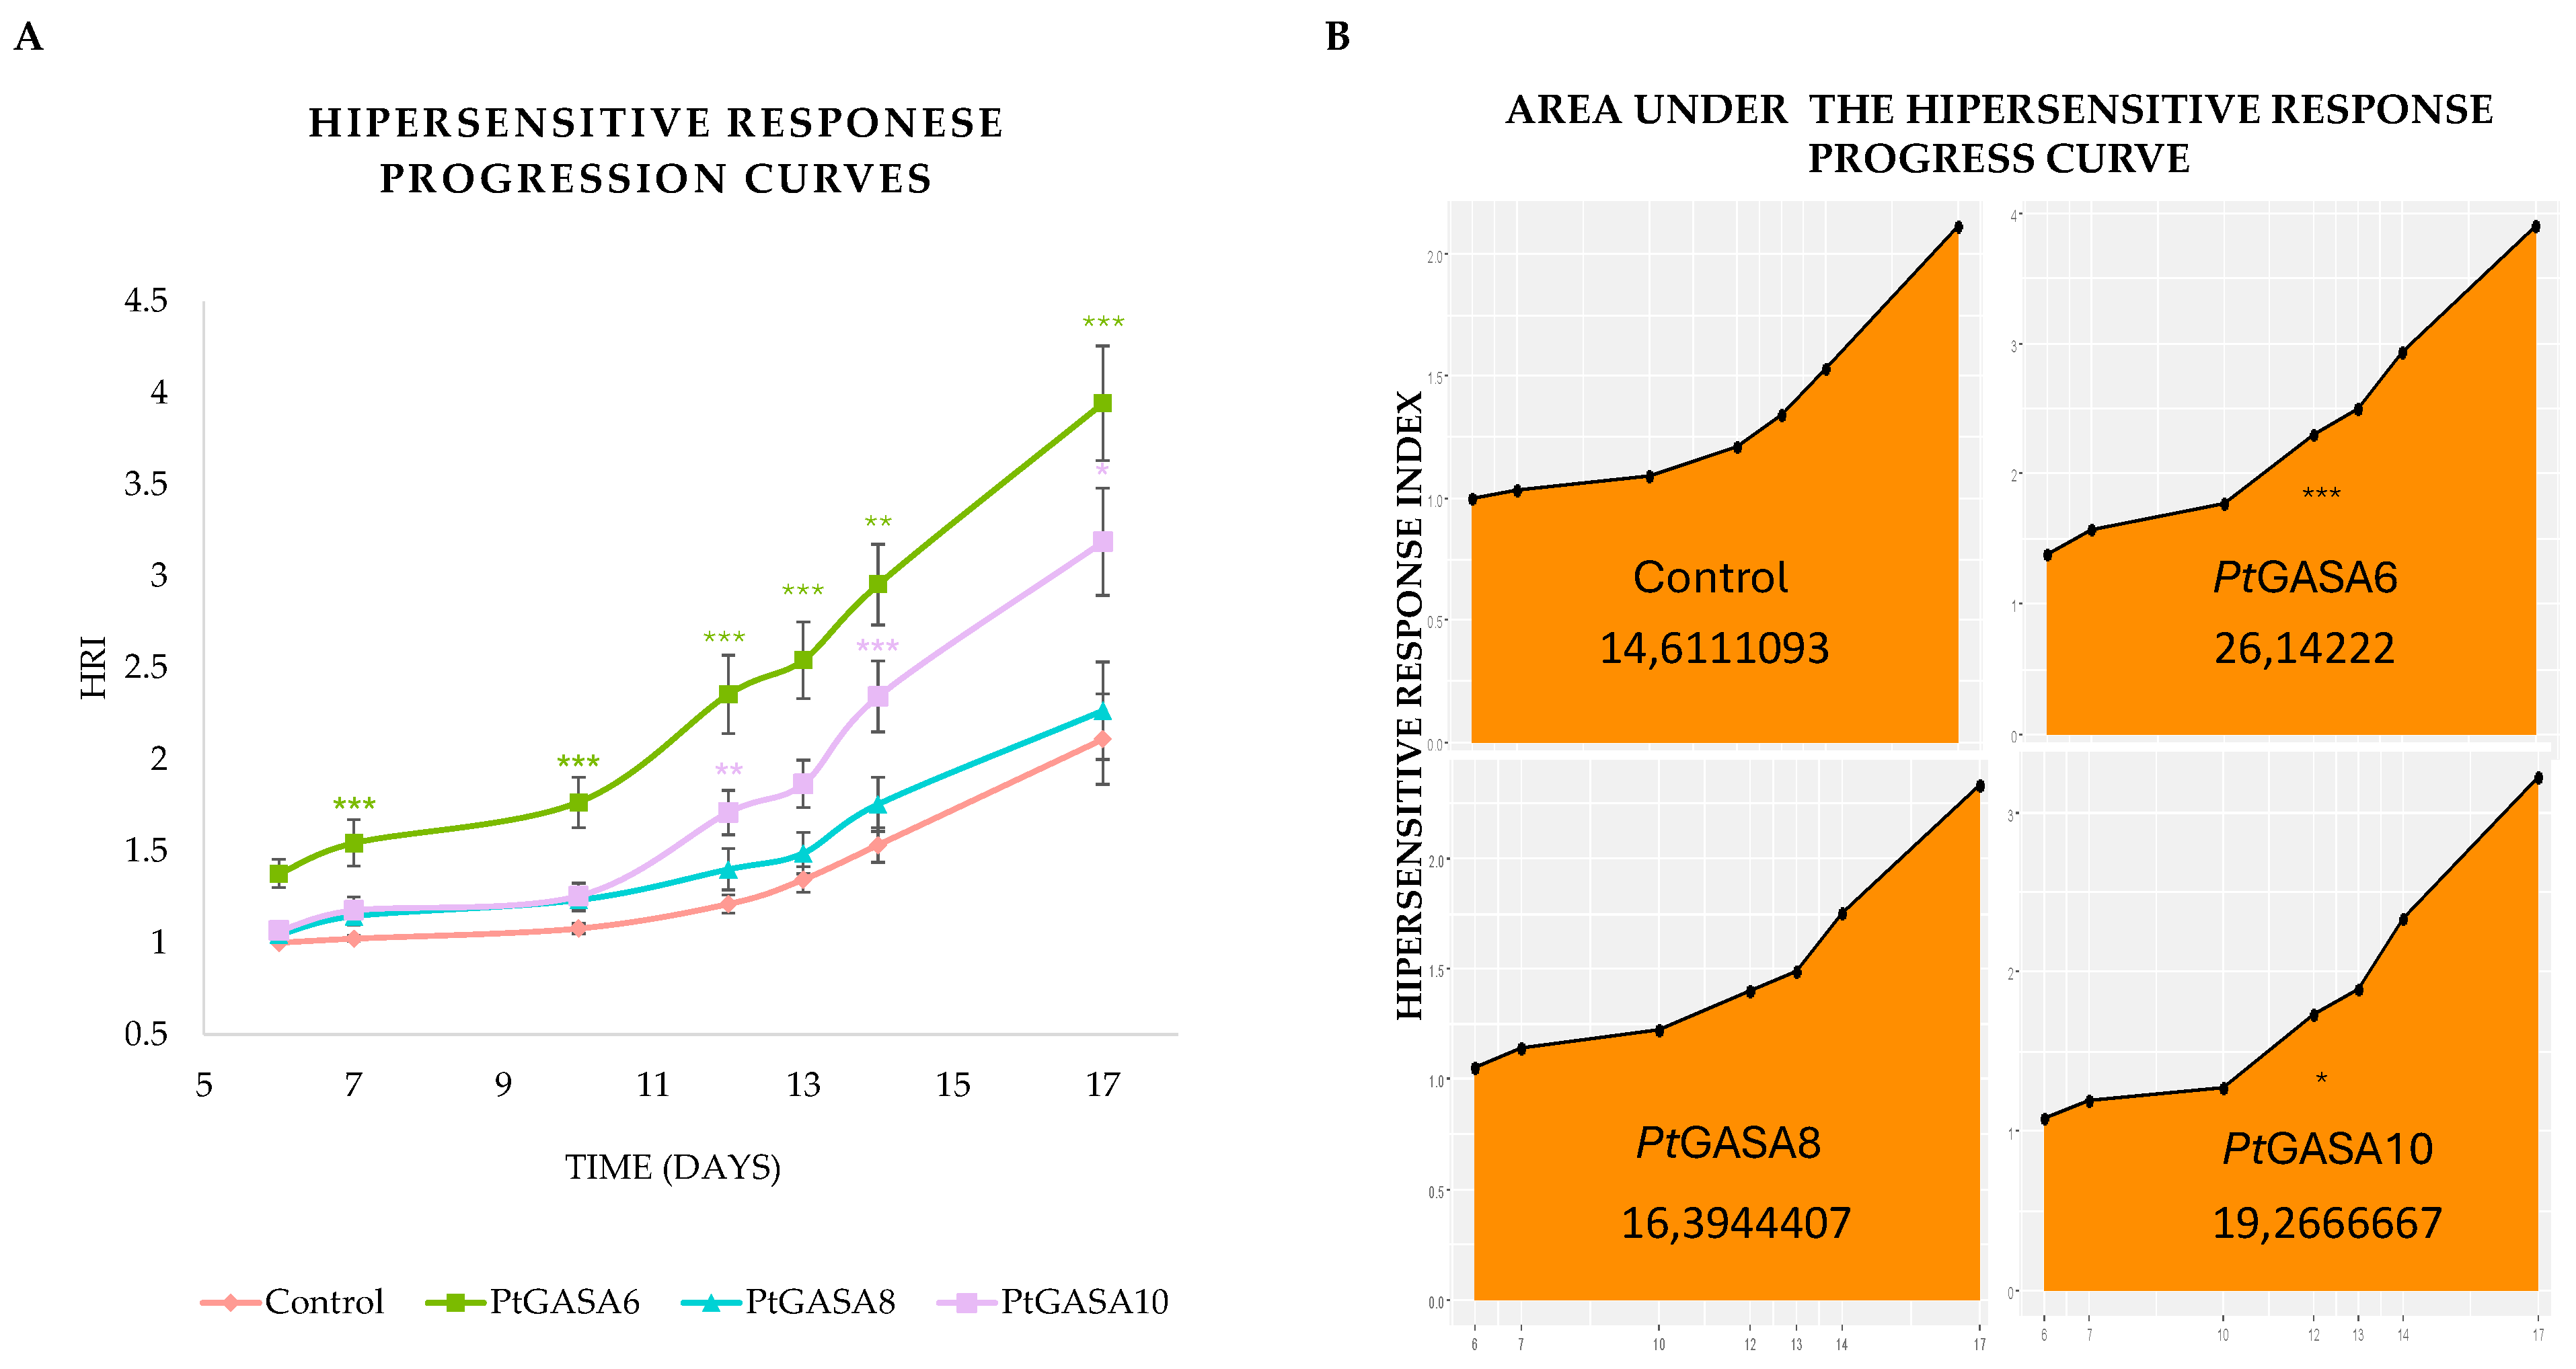
Figure 13.
An illustrative model representing the events observed during infections in which PtGASA6 and PtGASA10 were overexpressed under incompatible pathosystem with Xanthomonas citri subsp. citri (left panel) and compatible interaction with Pseudomonas syringae pv. tabaci (right panel). For both genes, an earlier hypersensitive response was observed, as well as a delayed onset of necrosis development because of the disease. A stronger enhancement was observed for PtGASA6 in advancing hypersensitive response and PtGASA10 in delaying disease.
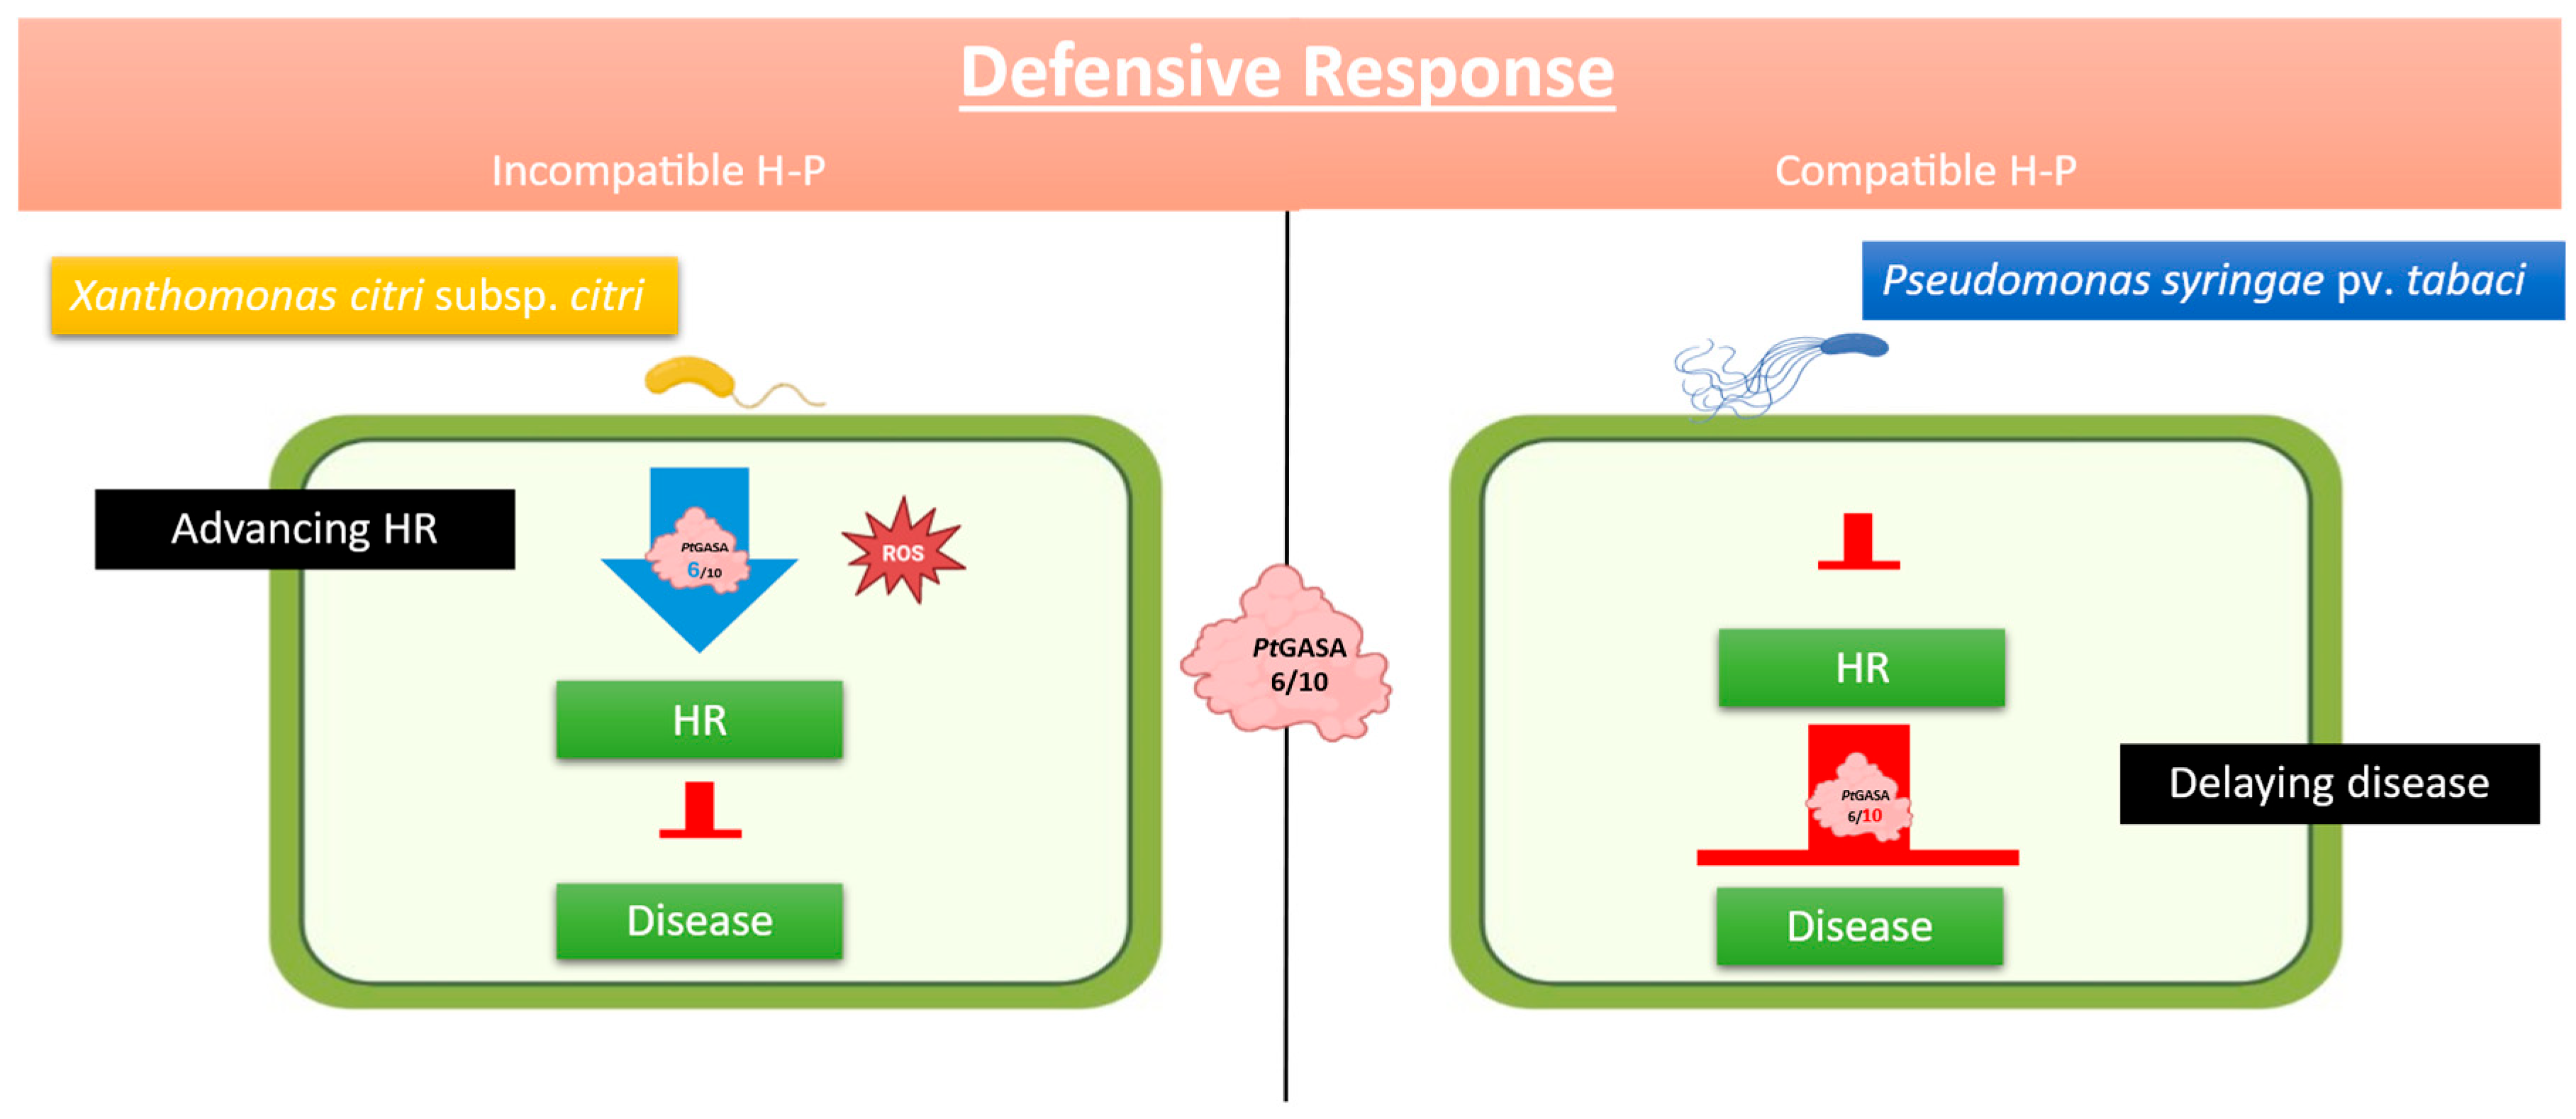
Figure 14.
Schematic representation of conserved motifs in subfamilies I, II, and III of the SNAKIN/GASA family from S. tuberosum (left) and P. trifoliata (right). The first row corresponds to subfamily I, comprising StSN1 and PtGASA6; the second to subfamily II, including StSN2 and PtGASA8; and the third to subfamily III, with StSN3 and PtGASA10. The motif common to all subfamilies and species (P. trifoliata and S. tuberosum) is indicated by a dotted line (·······). The motif characteristic of subfamily I, shown with a dash-dot line (--·--), confers a more compact arrangement with condensed α-helices. In contrast, the motifs present in subfamilies II and III, represented by a solid line (──), promote a looser structure with more separated α-helices.
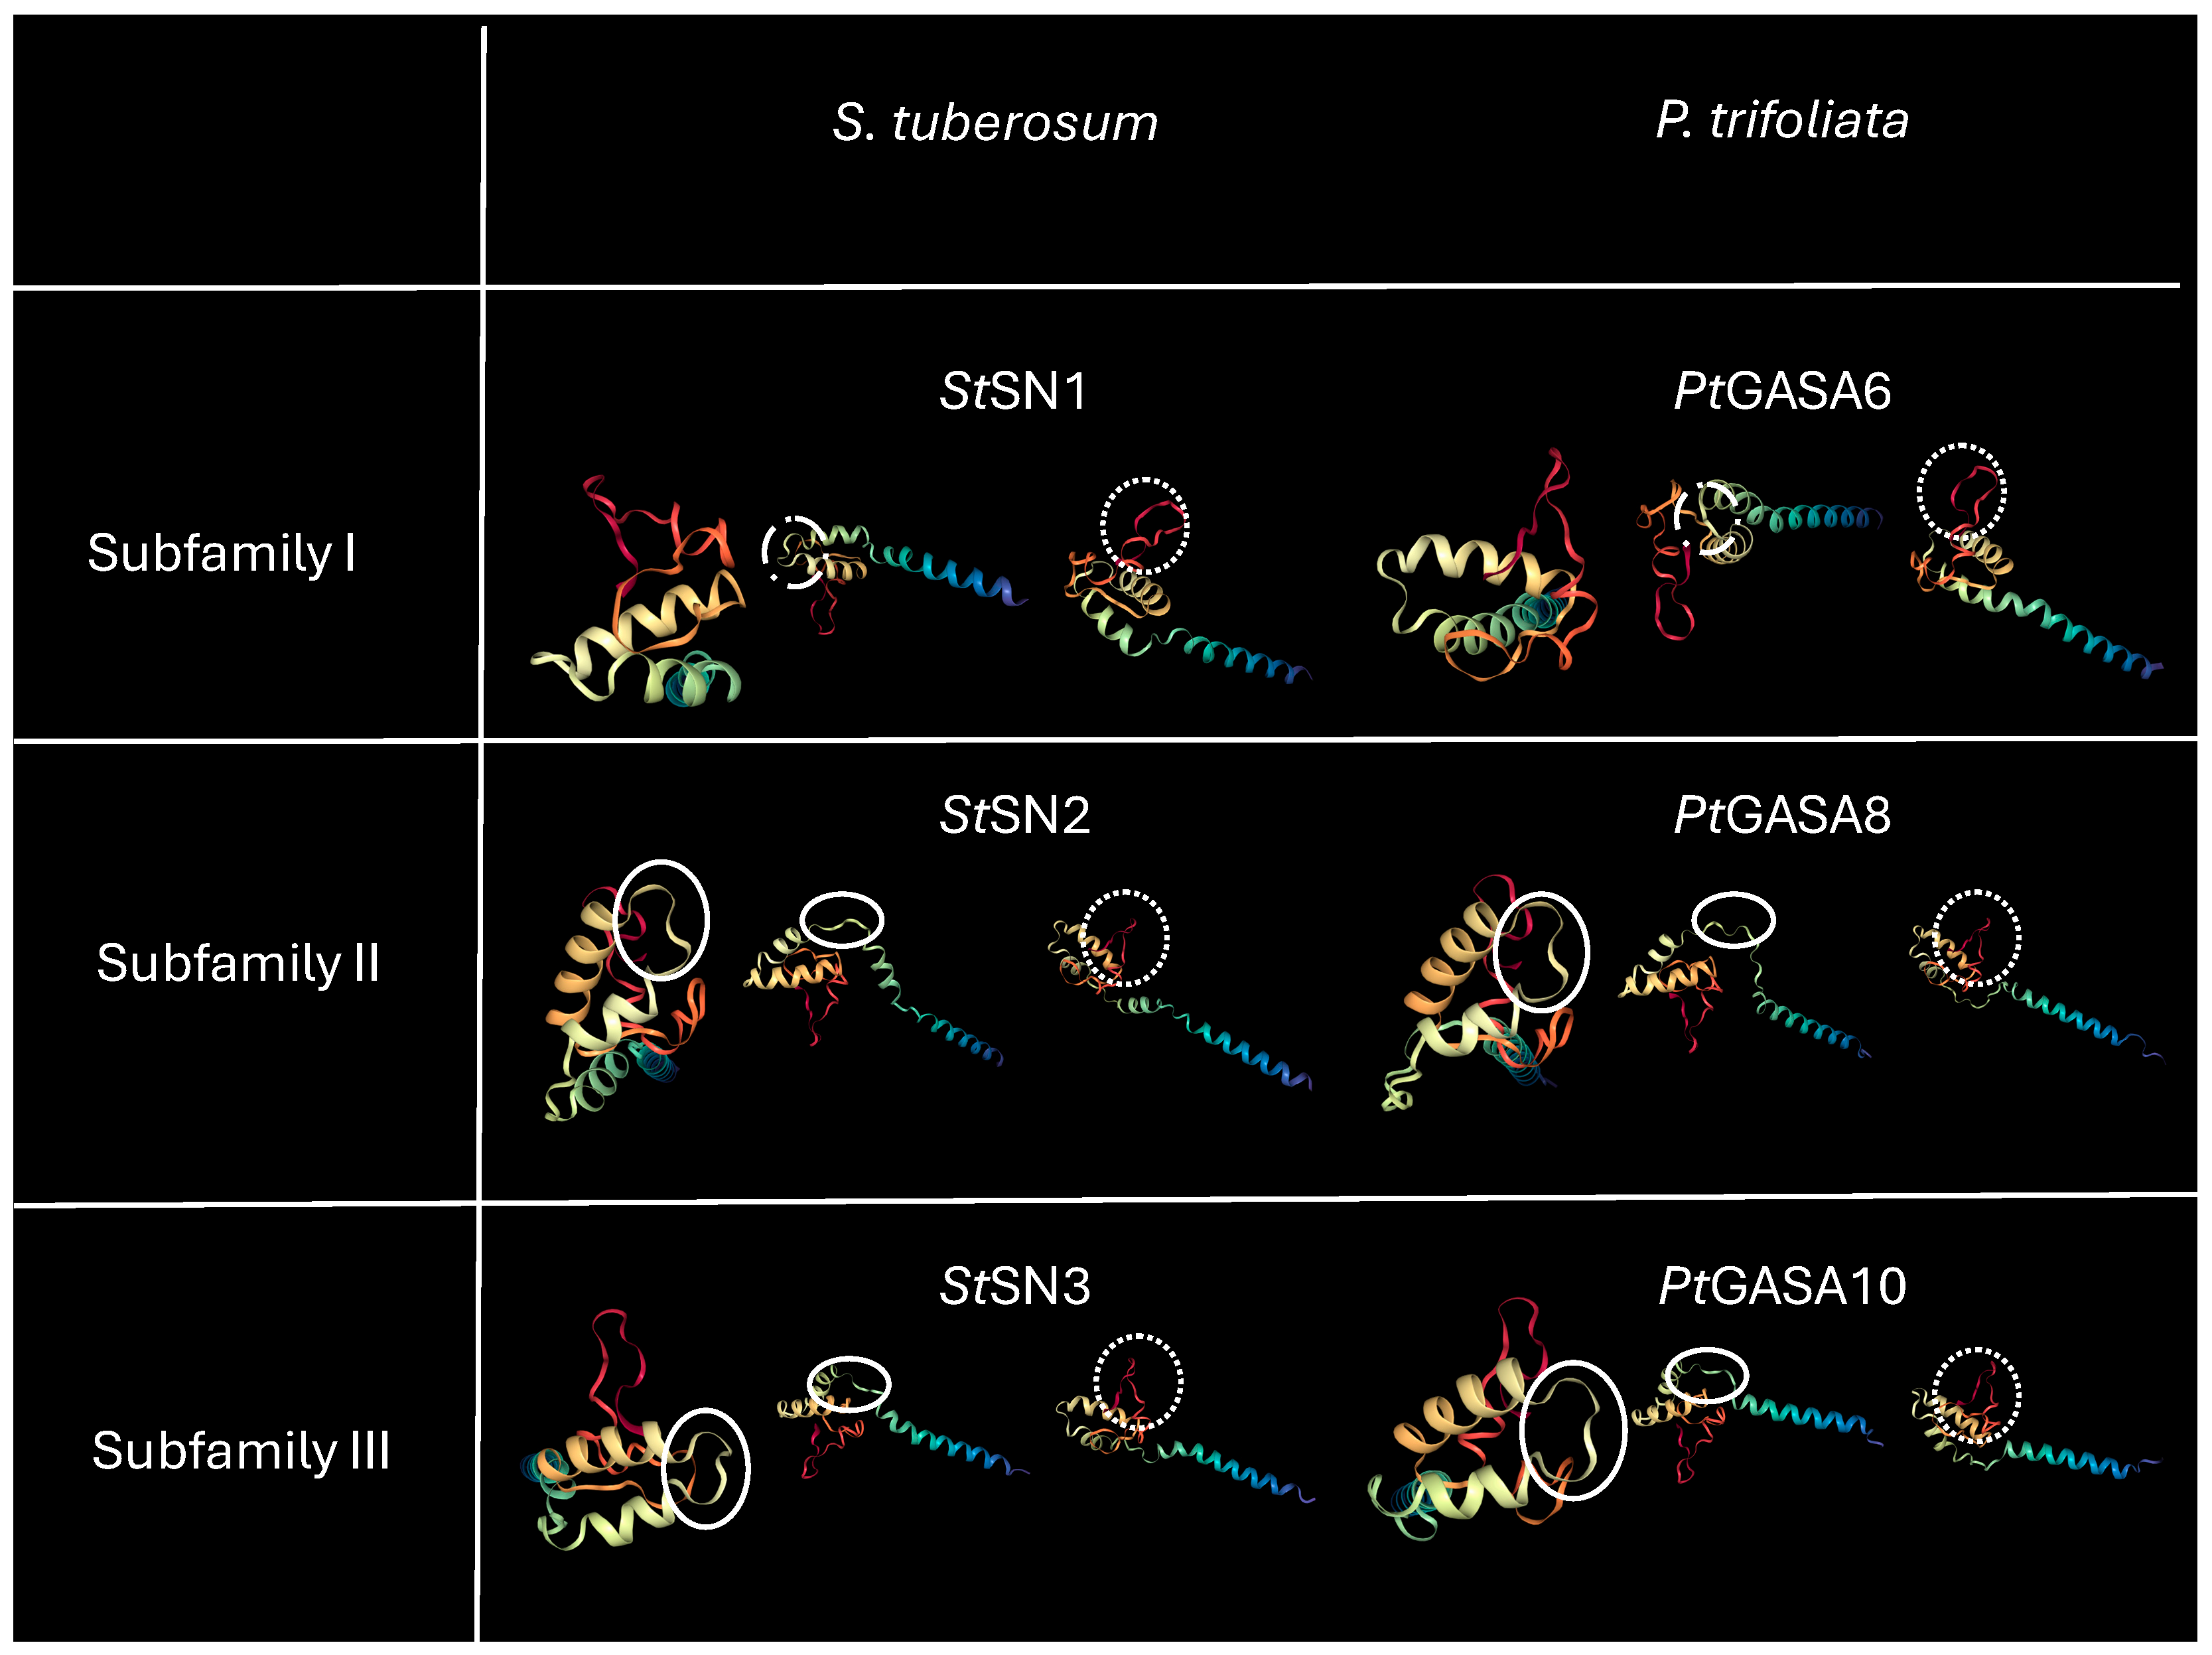
Figure 15.
Three-dimensional structure of PtGASA6 and PtGASA10. (A) The C-terminus and N-terminus and the location of the SNAKIN/GASA domain are indicated. (B) Positively charged amino acids (arginine, lysine or histidine) are shown in blue, mainly located within the HTH region. (C) Three-dimensional structure of PtGASA6 and (D) PtGASA10 showing the 6 in silico–disulfide bonds predicted. Cysteine residues are highlighted in yellow. The predicted bonds are indicated by white circles.
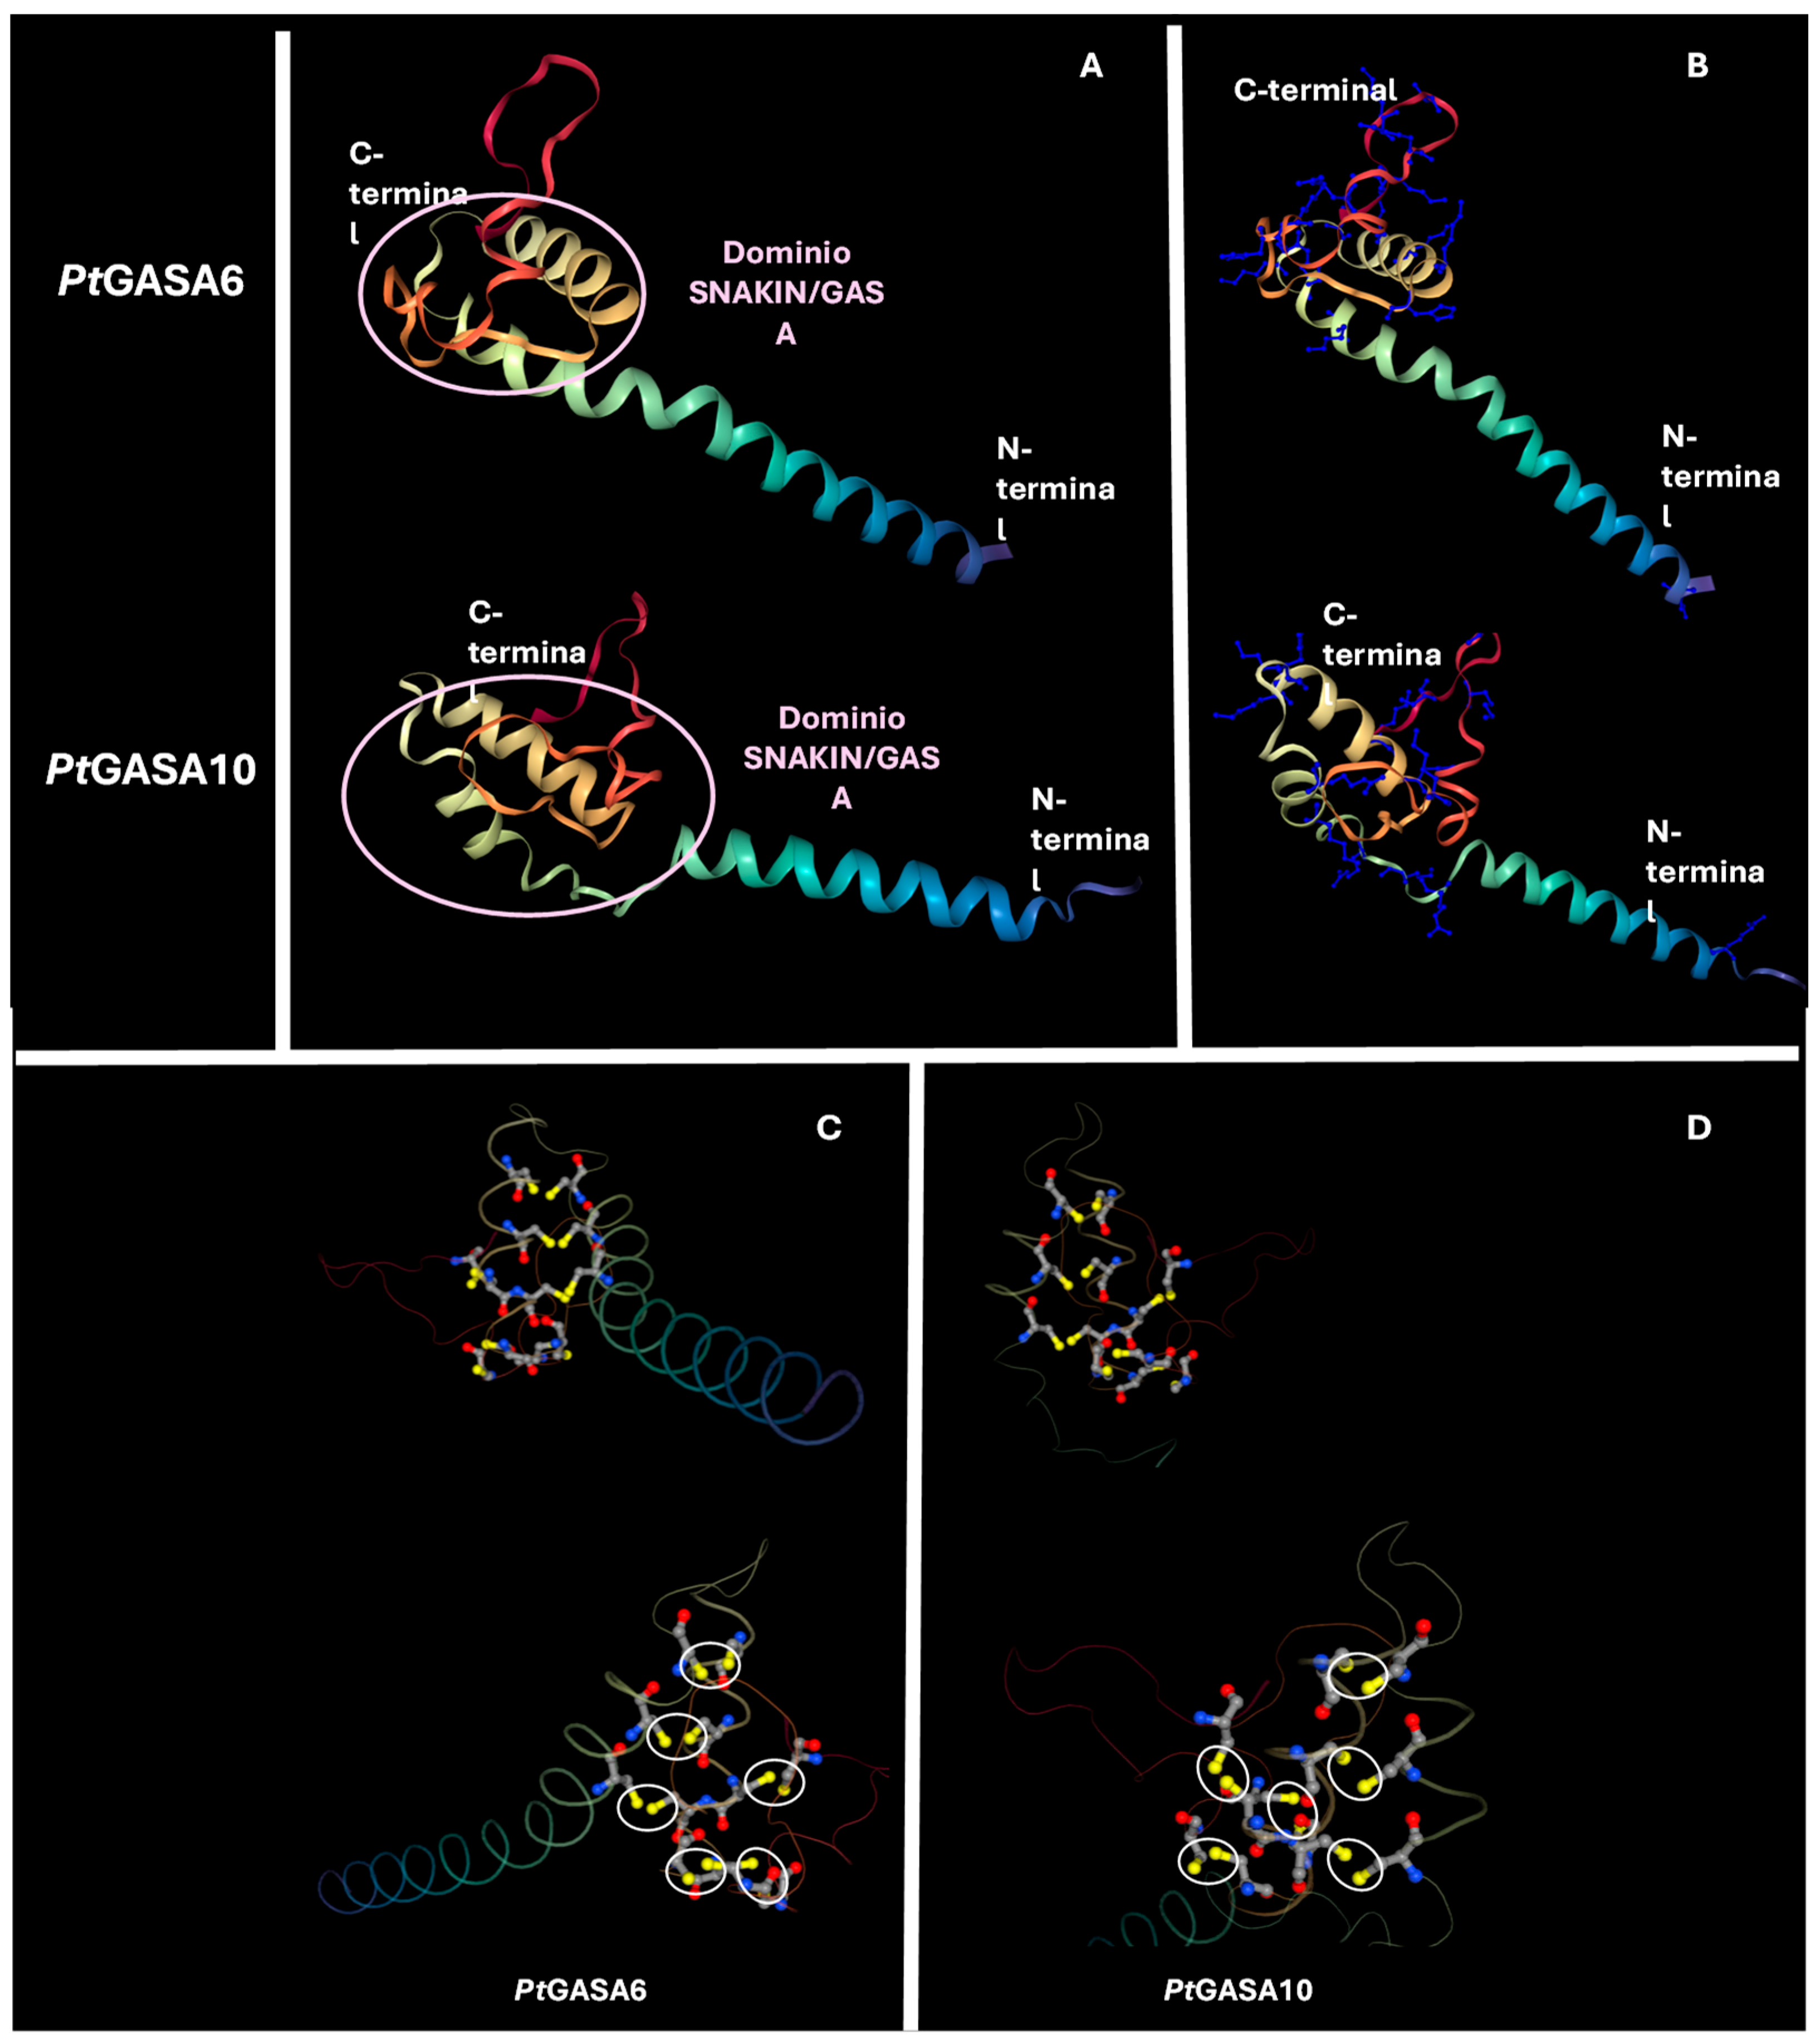
Figure 16.
Topology of proteins PtGASA6, PtGASA8, PtGASA10, StSN1, StSN2 and StSN3. The purple line indicates the probability that a segment corresponds to a transmembrane affinity region. The light blue line at the top of the plot represents the probability regions are oriented toward the cell interior (cytoplasmic). The yellow line marks the regions probably located on the outer side of the cell (extracellular). The predicted topology suggests that PtGASA8 and PtGASA10 may contain a membrane-anchoring site (transmembrane region).
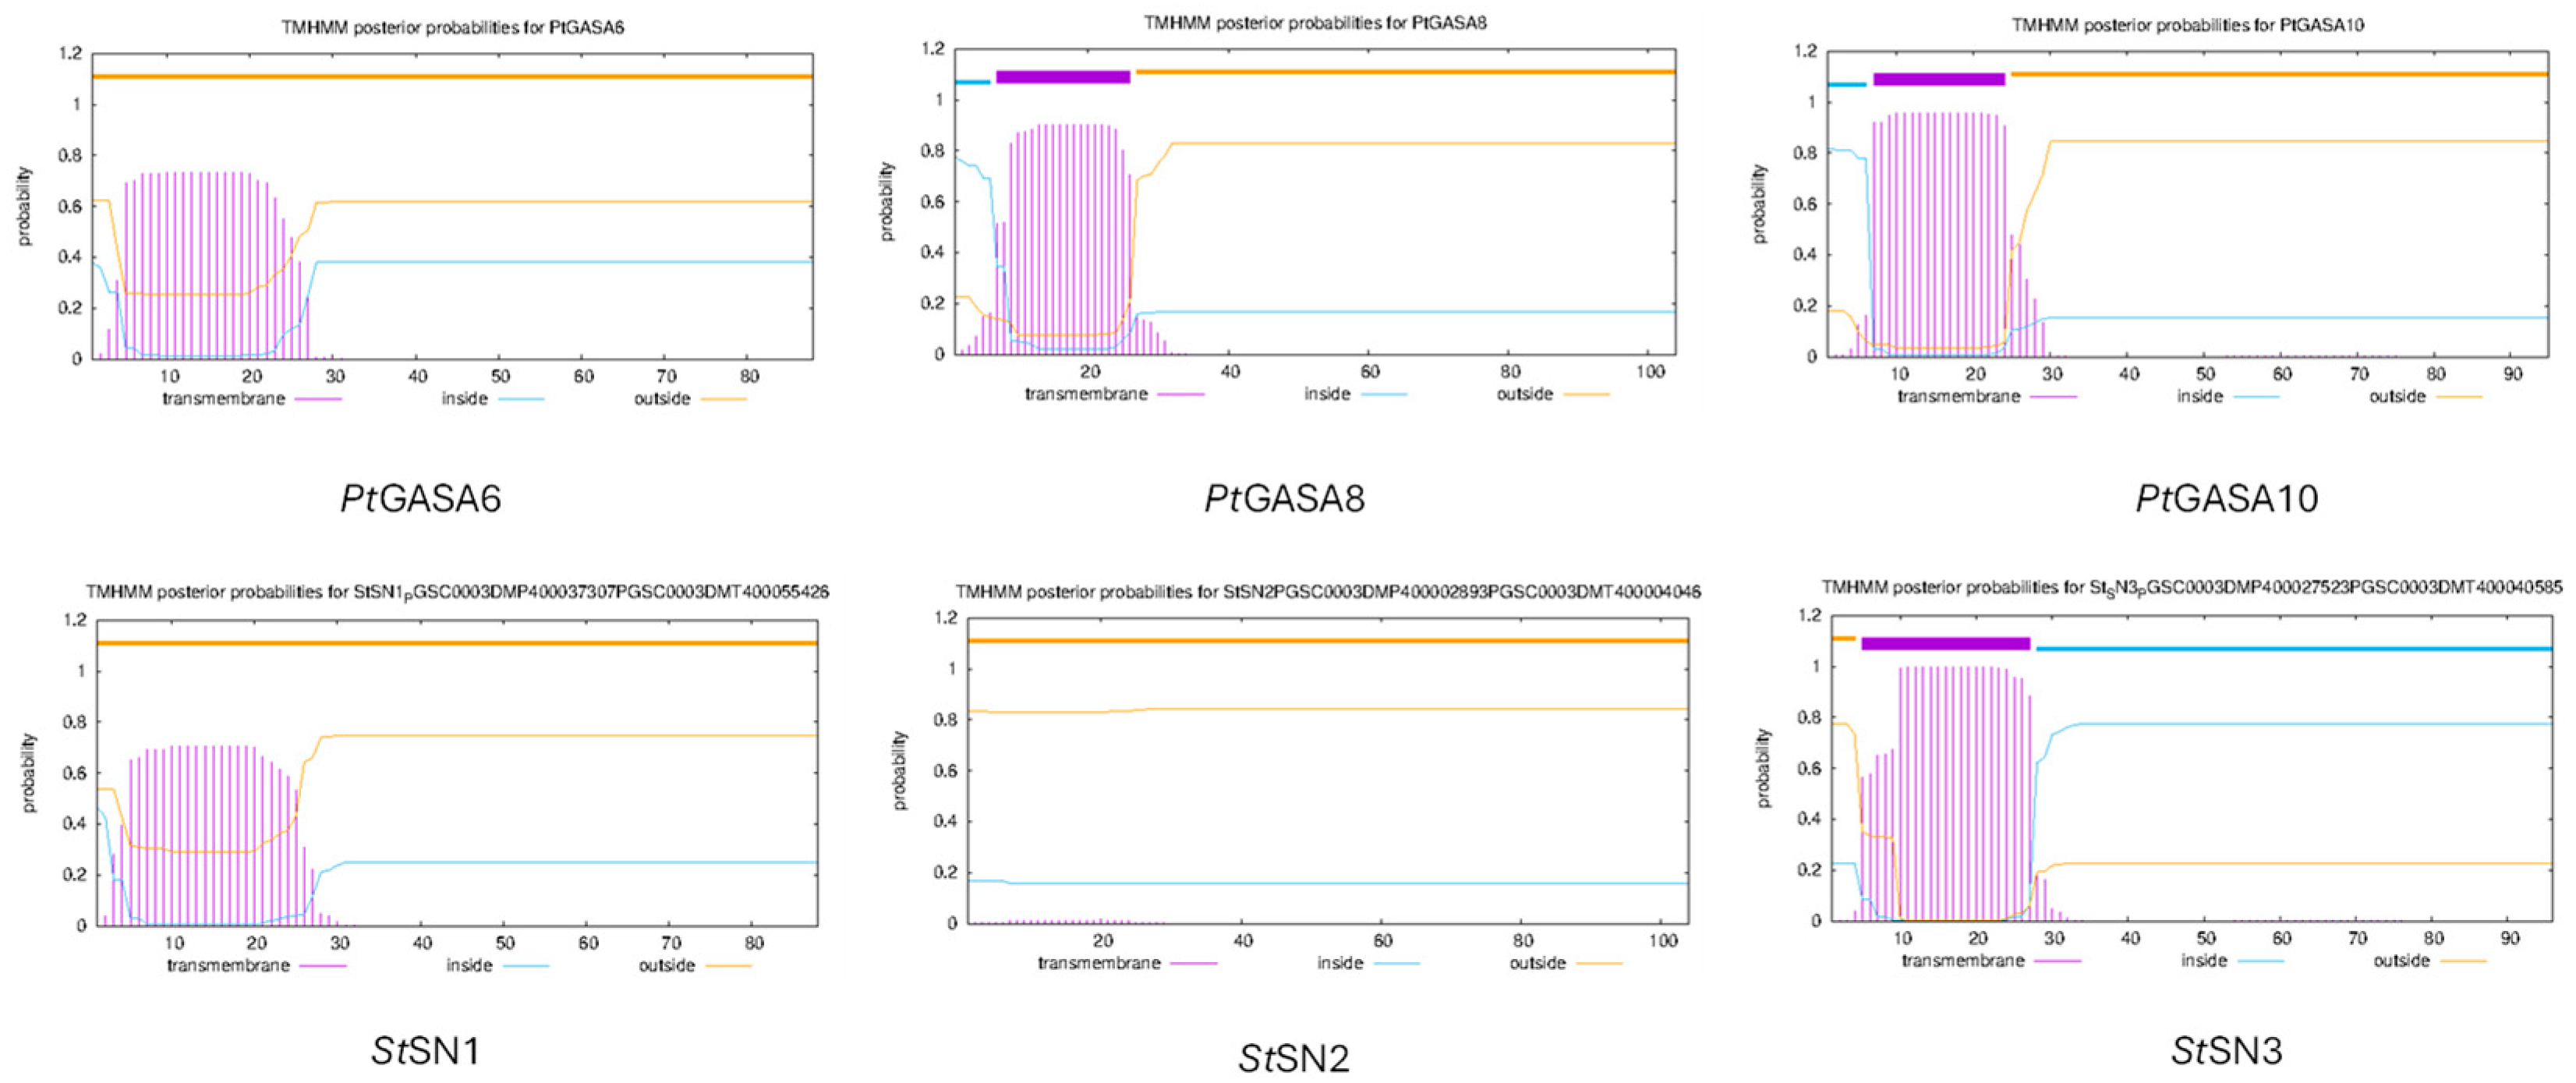

Table 1.
Identification and characterization of citrus GASA genes in 8 different citrus species: Cs (Citrus sinensis), CpxPt (Citrus paradisi x Poncirus trifoliata), Cl (Citrus limon), Cj (Citrus jambhiri), Clia (Citrus limonia), Cw (Citrus warburgiana), Ca (Citrus aurantium) and Pt (Poncirus trifoliata). CDS: coding sequence.
| Sequence Name | Gene ID | Exons | CDS (bp) |
Protein (aa) | |
|---|---|---|---|---|---|
| Subfamily I | CsGASA6 | LOC102614811 | 2 | 267 | 88 |
| CpxPtGASA6 | OP728331 | 2 | 267 | 88 | |
| ClGASA6 | OP728332 | 2 | 267 | 88 | |
| CjGASA6 | OP728333 | 2 | 267 | 88 | |
| CliaGASA6 | OP728334 | 2 | 267 | 88 | |
| CaGASA6 | OP728335 | 2 | 267 | 88 | |
| PtGASA6 | OP728336 | 2 | 267 | 88 | |
| CsGASA13 | LOC102619143 | 2 | 267 | 88 | |
| CpxPtGASA13 | OP791894 | 2 | 267 | 88 | |
| ClGASA13 | OP791895 | 2 | 267 | 88 | |
| CjGASA13 | OP791896 | 2 | 267 | 88 | |
| CliaGASA13 | OP791897 | 2 | 267 | 88 | |
| CwGASA13 | OP791898 | 2 | 267 | 88 | |
| CaGASA13 | OP791899 | 2 | 267 | 88 | |
| PtGASA13 | OP791900 | 2 | 267 | 88 | |
| Subfamily II | CsGASA8 | LOC102628220 | 3 | 315 | 104 |
| CpxPtGASA8 | OP947003 | 3 | 315 | 104 | |
| ClGASA8 | OP947004 | 3 | 315 | 104 | |
| CjGASA8 | OP947005 | 3 | 315 | 104 | |
| CliaGASA8 | OP947006 | 3 | 315 | 104 | |
| CwGASA8 | OP947007 | 3 | 315 | 104 | |
| CaGASA8 | OP947008 | 3 | 315 | 104 | |
| PtGASA8 | OP947009 | 3 | 315 | 104 | |
| CsGASA9 | LOC102627925 | 3 | 342 | 113 | |
| ClGASA9 | OP946990 | 3 | 342 | 113 | |
| PtGASA9 | OP946991 | 3 | 342 | 113 | |
| CsGASA9-like | LOC102628717 | 3 | 303 | 100 | |
| CpxPtGASA9-like | OQ053283 | 3 | 303 | 100 | |
| ClGASA9-like | OQ053284 | 3 | 303 | 100 | |
| CjGASA9-like | OQ053285 | 3 | 226 | 73 (partial CDS) | |
| CliaGASA9-like | OQ053286 | 3 | 226 | 73 (partial CDS) | |
| CwGASA9-like | OQ053287 | 3 | 303 | 100 | |
| CaGASA9-like | OQ053288 | 3 | 303 | 100 | |
| PtGASA9-like | OQ053289 | 3 | 306 | 101 | |
| CsGASA2 | LOC102628910 | 4 | 351 | 116 | |
| CpxPtGASA2 | OP946981 | 2 | 213 | 65 (partial CDS) | |
| ClGASA2 | OP946982 | 4 | 213 | 65 (partial CDS) | |
| PtGASA2 | OP946983 | 351 | 116 | ||
| CsGASA11 | LOC102631482 | 4 | 504 | 167 | |
| CpxPtGASA11 | OP946975 | 2 | 408 | 125 (partial CDS) | |
| ClGASA11 | OP946976 | 2 | 396 | 130 (partial CDS) | |
| CliaGASA11 | OP946977 | 2 | 396 | 135 (partial CDS) | |
| CwGASA11 | OP946978 | 2 | 408 | 135 (partial CDS) | |
| CaGASA11 | OP946979 | 2 | 396 | 130 (partial CDS) | |
| PtGASA11 | OP946980 | 4 | 504 | 167 | |
| CsGASA7 | LOC102625142 | 4 | 432 | 143 | |
| CpxPtGASA7 | OP947000 | 4 | 345 | 114 | |
| ClGASA7 | OP947001 | 4 | 345 | 114 | |
| PtGASA7 | OP947002 | 4 | 345 | 114 | |
| CsGASA5 | LOC102625142 | 3 | 324 | 113 | |
| CpxPtGASA5 | OP946984 | 3 | 324 | 113 | |
| ClGASA5 | OP946985 | 3 | 327 | 114 | |
| CjGASA5 | OP946986 | 3 | 324 | 113 | |
| CliaGASA5 | OP946987 | 3 | 324 | 113 | |
| CaGASA5 | OP946988 | 3 | 324 | 113 | |
| PtGASA5 | OP946989 | 3 | 324 | 113 | |
| Subfamily III | CsGASA15 | LOC102625588 | 3 | 286 | 95 |
| ClGASA15 | OP946995 | 3 | 285 | 95 | |
| PtGASA15 | OP946996 | 3 | 285 | 95 | |
| CsGASA1 | LOC102629636 | 4 | 342 | 113 | |
| CpxPtGASA1 | OQ053290 | 4 | 342 | 113 | |
| ClGASA1 | OQ053291 | 4 | 342 | 113 | |
| PtGASA1 | OQ053292 | 4 | 348 | 115 | |
| CsGASA10 | LOC102618255 | 3 | 288 | 95 | |
| CpxPtGASA10 | OP830506 | 3 | 288 | 95 | |
| ClGASA10 | OP830507 | 3 | 288 | 95 | |
| PtGASA10 | OP830508 | 3 | 288 | 95 | |
| CsGASA12 | LOC102611788 | 4 | 324 | 107 | |
| CpxPtGASA12 | OQ053280 | 4 | 321 | 106 | |
| ClGASA12 | OQ053281 | 4 | 324 | 107 | |
| PtGASA12 | OQ053282 | 4 | 321 | 106 | |
| CsGASA3 | LOC102626694 | 3 | 312 | 103 | |
| CpxPtGASA3 | OP946997 | 3 | 312 | 103 | |
| ClGASA3 | OP946998 | 3 | 312 | 103 | |
| PtGASA3 | OP946999 | 2 | 312 | 103 | |
| CsGASA14 | LOC102625321 | 3 | 351 | 116 | |
| CpxPtGASA14 | OP946992 | 3 | 286 | 95 | |
| ClGASA14 | OP946993 | 3 | 285 | 95 | |
| PtGASA14 | OP946994 | 3 | 285 | 95 | |
| CsGASA18 | LOC102630614 | 4 | 357 | 118 | |
| CpxPtGASA18 | OP830509 | 4 | 357 | 118 | |
| ClGASA18 | OP830510 | 4 | 357 | 118 | |
| PtGASA18 | OP830511 | 4 | 357 | 118 |
Table 2.
Predicted cis-regulatory elements in GASA6, 8 and 10 predicted promoter sequences from C. sinensis, C. limon and P. trifoliata.
Table 2.
Predicted cis-regulatory elements in GASA6, 8 and 10 predicted promoter sequences from C. sinensis, C. limon and P. trifoliata.
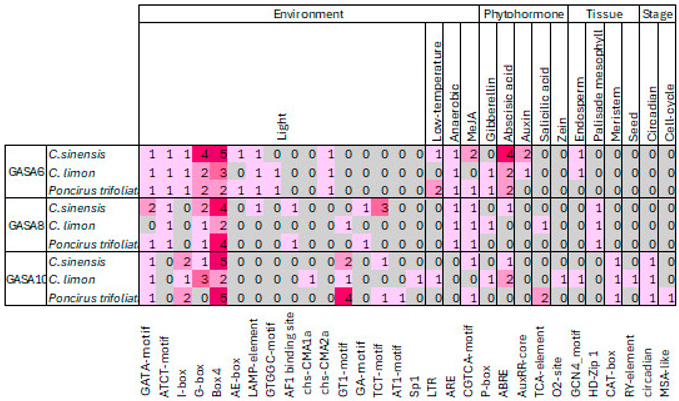 |
Disclaimer/Publisher’s Note: The statements, opinions and data contained in all publications are solely those of the individual author(s) and contributor(s) and not of MDPI and/or the editor(s). MDPI and/or the editor(s) disclaim responsibility for any injury to people or property resulting from any ideas, methods, instructions or products referred to in the content. |
© 2025 by the authors. Licensee MDPI, Basel, Switzerland. This article is an open access article distributed under the terms and conditions of the Creative Commons Attribution (CC BY) license (http://creativecommons.org/licenses/by/4.0/).
Copyright: This open access article is published under a Creative Commons CC BY 4.0 license, which permit the free download, distribution, and reuse, provided that the author and preprint are cited in any reuse.


