
Submitted:
27 November 2025
Posted:
28 November 2025
You are already at the latest version
Abstract
This research examines the feasibility of recovering and recycling condensate water, a waste byproduct generated by Atlas Copco ZR315 FF industrial air compressors utilizing oil-free rotary screw technology with integrated dryers. Given the growing severity of global water scarcity, finding alternative water sources is essential for sustainable industrial practices. This study specifically evaluates the potential of capturing and treating compressed air condensate as a viable method for water recovery. The investigation analyzes both the quantity and quality of condensate water produced by the ZR315 FF unit. It contrasts this recovery approach with traditional water production methods, such as desalination and atmospheric water generation (AWG) via dehumidification. The findings demonstrate that recovering condensate water from industrial air compressors is a cost-effective and energy-efficient substitute for conventional water production, especially in water-stressed areas like Morocco. The results show a significant opportunity to reduce industrial water usage and provide a sustainable source of process water. This research therefore supports the application of circular economy principles in industrial water management and offers practical solutions for overcoming water scarcity challenges within manufacturing environments.
Keywords:
condensate
; energy efficiency
; water recovery
; water reuse
; water scarcity
1. Introduction
In an era increasingly defined by escalating global water scarcity, industries across all sectors face mounting pressure to innovate and adopt more sustainable water management practices. The relentless and ever-growing demand for fresh water in myriad manufacturing processes, coupled with the escalating environmental and economic costs associated with traditional water sourcing, necessitates a fundamental shift towards alternative and unconventional water supplies. This pervasive challenge has spurred a diligent search for untapped water sources, often hidden within the very operational fabric of industrial facilities, thereby transforming what were once considered waste streams into profoundly valuable resources.
One such often-overlooked and underutilized resource is the condensate water generated during the process of air compression.
Industrial air compressors, which are integral to countless manufacturing activities, from powering pneumatic tools and controlling machinery to facilitating chemical processes and food production , produce significant volumes of water as a natural byproduct of cooling and drying the compressed air.
This research specifically investigates the largely untapped potential of condensate generated by Atlas Copco ZR315 FF oil-free industrial air compressors as a viable, sustainable, and economically attractive water source.
This comprehensive study aims to provide an in-depth and multifaceted analysis of the process involved in recovering and recycling this condensate water.
By meticulously evaluating its quality across various parameters (such as pH, conductivity, presence of dissolved solids, and potential contaminants), precisely quantifying the volume produced under different operational conditions, and determining the necessary treatment requirements to render it suitable for industrial reuse, this research will definitively establish its feasibility as a reliable source of process water.
Furthermore, the efficiency and cost-effectiveness of this water recovery method will be rigorously benchmarked against conventional water production technologies.
This comparative analysis will include energy-intensive and often costly methods such as desalination (which removes salt and other minerals from saline water) and atmospheric water generation (which extracts potable water from ambient air humidity).
Ultimately, this comprehensive investigation seeks to demonstrably illustrate how effectively harnessing compressor condensate can contribute significantly to the principles of a circular economy.
By doing so, it offers a practical, scalable, and environmentally responsible solution for industries to dramatically reduce their overall water footprint and substantially enhance their operational resilience, particularly in regions facing acute water stress.
This proactive approach not only mitigates environmental impact but also bolsters economic sustainability by reducing reliance on external, often expensive, water supplies.
2. Review of Desalination and Atmospheric Water Generation Methods
The pursuit of sustainable water management in industrial settings necessitates a thorough evaluation of existing water production technologies. While the recovery of condensate from compressed air systems presents a novel on-site solution, its viability is best understood when contextualized against established methods of water generation, namely desalination and atmospheric water generation (AWG).
These technologies, though effective, present distinct economic and environmental challenges that underscore the need for alternative sources like condensate recovery.

Table 1.
Characteristics of Waste Streams and Energy Consumption in the Compressed Air Process Compared to the two Water Production Methods (AWG and Desalination).
Table 1.
Characteristics of Waste Streams and Energy Consumption in the Compressed Air Process Compared to the two Water Production Methods (AWG and Desalination).
| Process | Main Function | Specific Energy Consumption | Waste Stream |
|---|---|---|---|
| Desalination | Removes salt and minerals from seawater or brackish water through reverse osmosis, distillation, or electrodialysis | 3-10 kWh/m³ of water produced [1,2,3] | Brine/Salt concentrate |
| AWG (Atmospheric Water Generation) | Extracts water from ambient air humidity using condensation, adsorption, or cooling methods | 0.3- 4 kWh/liter of water produced [4,5,6] |
Humid air discharge |
| Compressed Air | Used for process/safety control, cleaning and instrumentation | 0.1-0.2 kWh/m³ of air compressed | Condensate water |
2.1. Desalination
Desalination is a critical process for global water supply, especially in arid and coastal regions, as it removes salt and other minerals from saline water, producing concentrated brine as a primary by-product. Given the increasing pressure on global water resources, desalination, alongside wastewater recycling, has become a vital and rainfall-independent water source. Current global initiatives aim to provide fresh water cost-effectively, balancing the high energy demands of desalination against the rising costs and depletion of conventional surface and groundwater reserves worldwide. The two primary technologies used are reverse osmosis (RO) and thermal distillation (Figure 1).
Figure 1.
The two water Desalination Processes: Thermal and Reverse Osmosis (RO) [7].
Figure 1.
The two water Desalination Processes: Thermal and Reverse Osmosis (RO) [7].
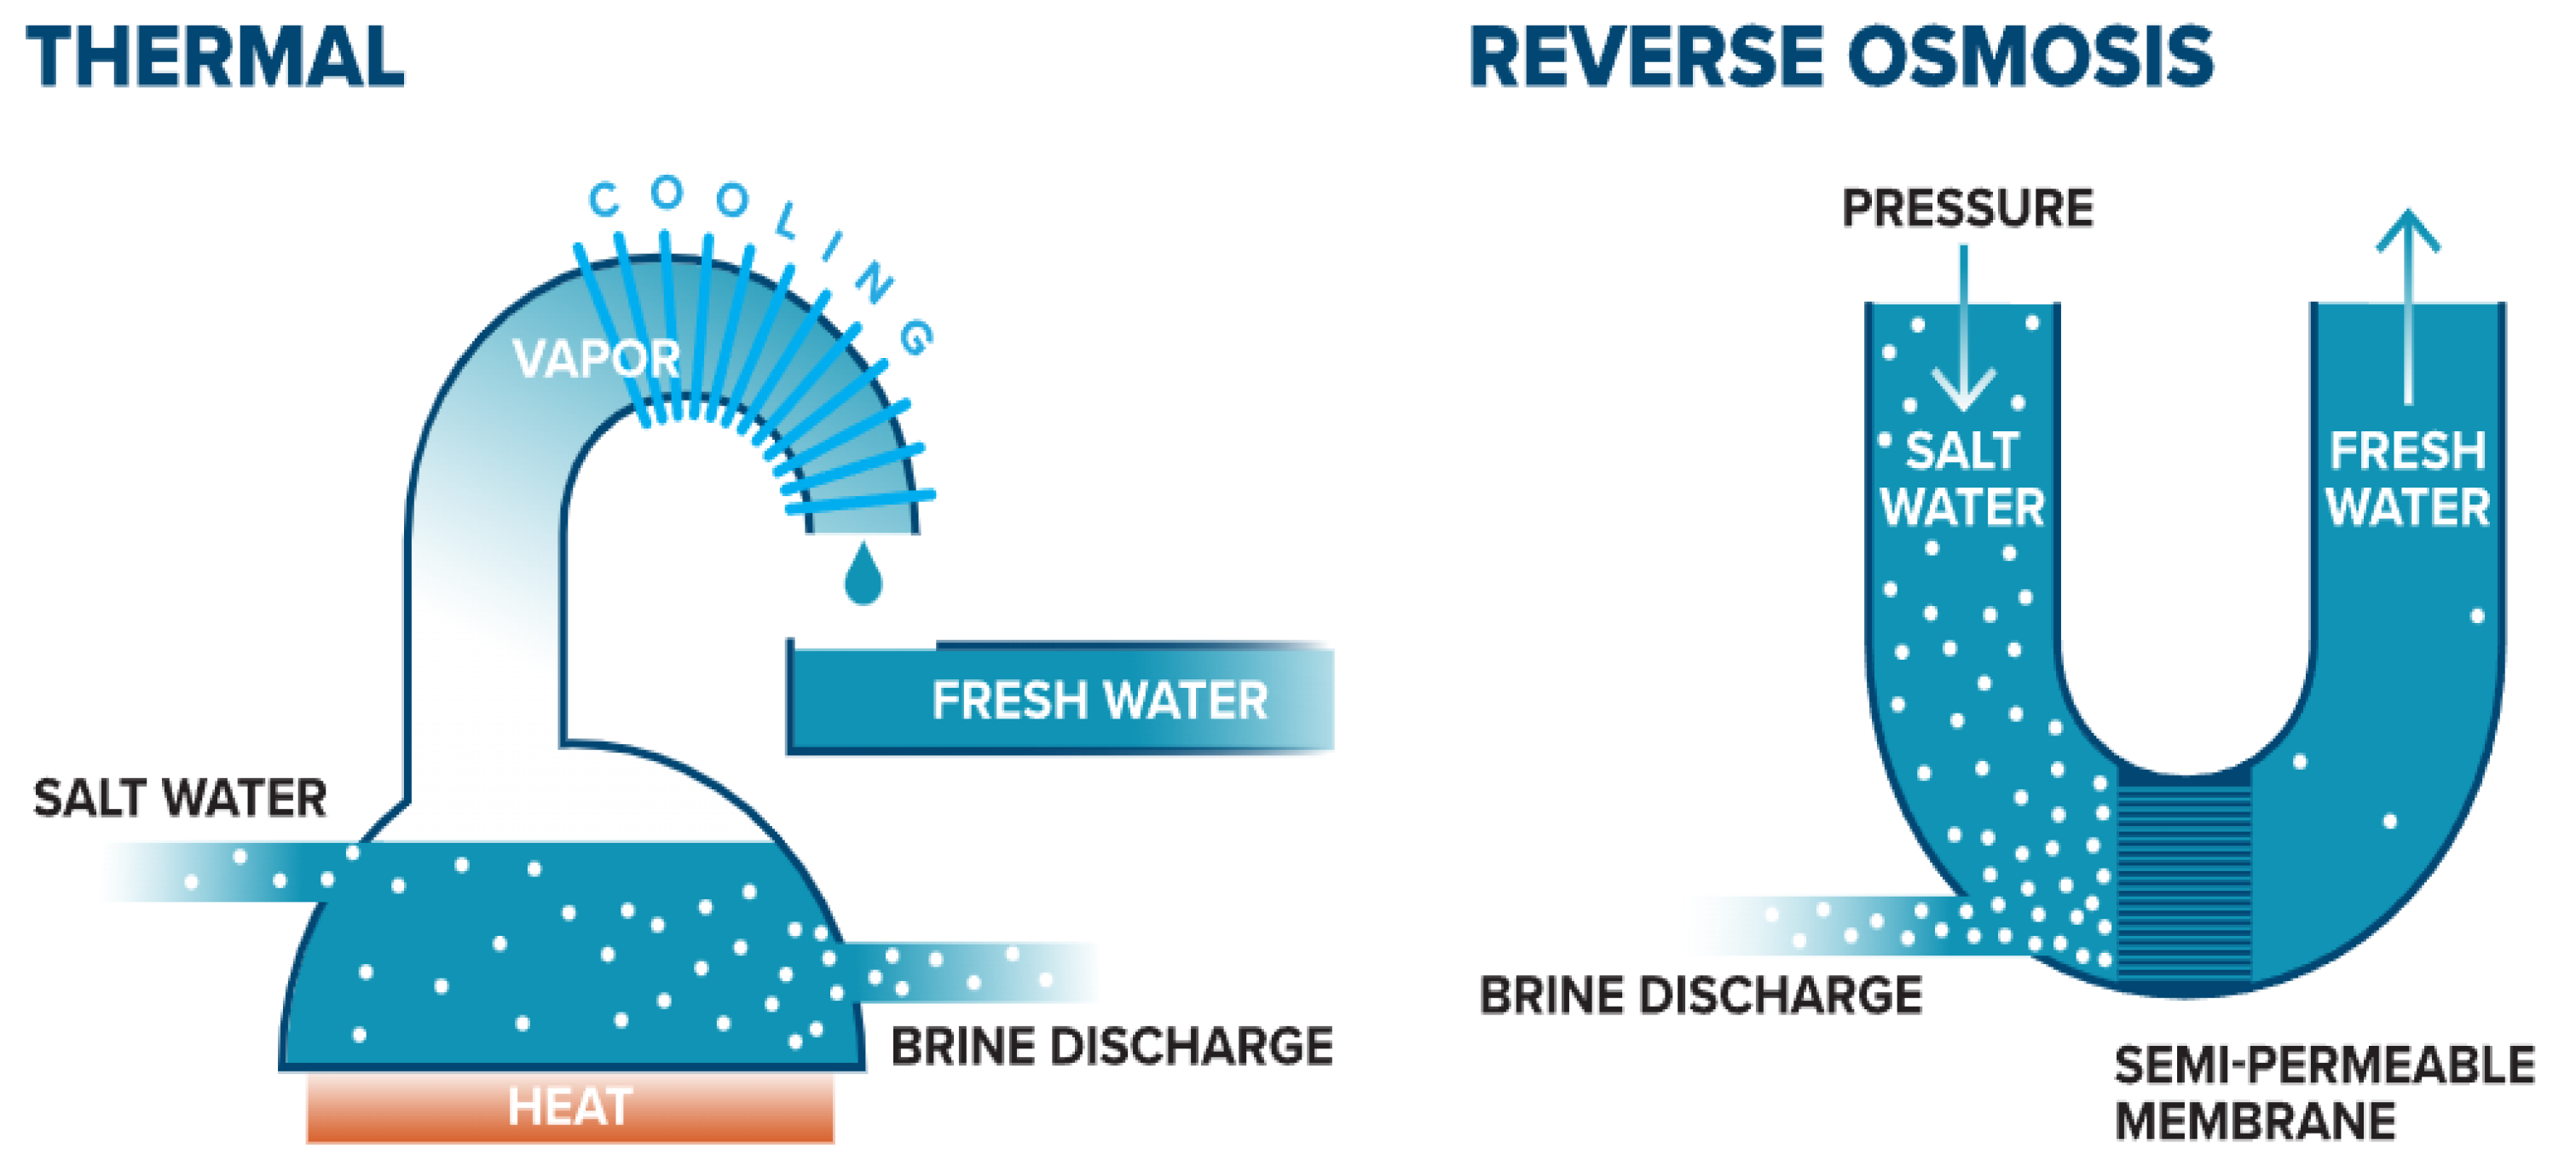
2.1.1. Reverse Osmosis (RO)
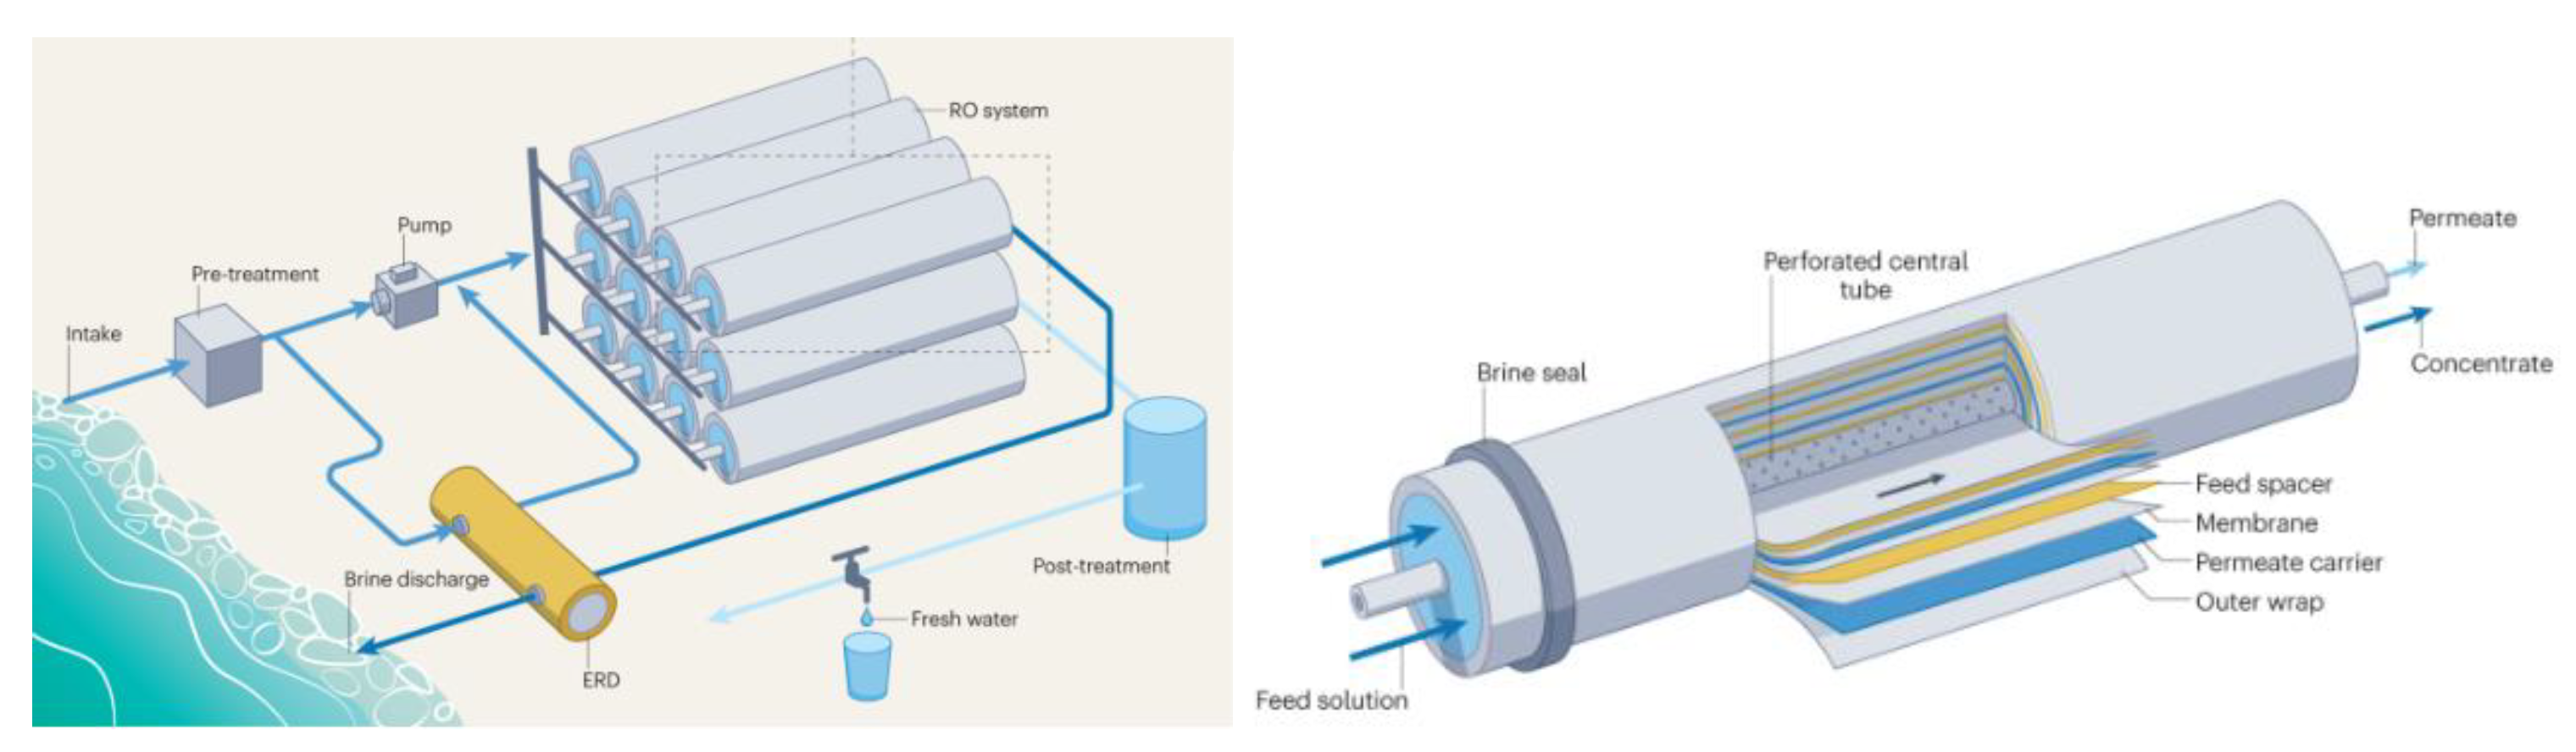
Reverse Osmosis (RO) is a widely adopted, pressure-driven membrane process and a leading global technology for desalination. It operates by applying high hydraulic pressure to a feed stream, which overcomes the solution’s natural osmotic pressure. This forces water molecules (permeate) through a semipermeable membrane (Figure 2) while effectively rejecting dissolved salts, minerals, and other solutes, which are retained in a concentrated brine stream. The continued advancements in membrane materials, energy recovery devices, and process optimization have solidified RO’s dominant position due to its increasing energy efficiency and cost-effectiveness.
Figure 2.
Schematic of a seawater reverse osmosis desalination plant and spiral-wound module [8].
Figure 2.
Schematic of a seawater reverse osmosis desalination plant and spiral-wound module [8].
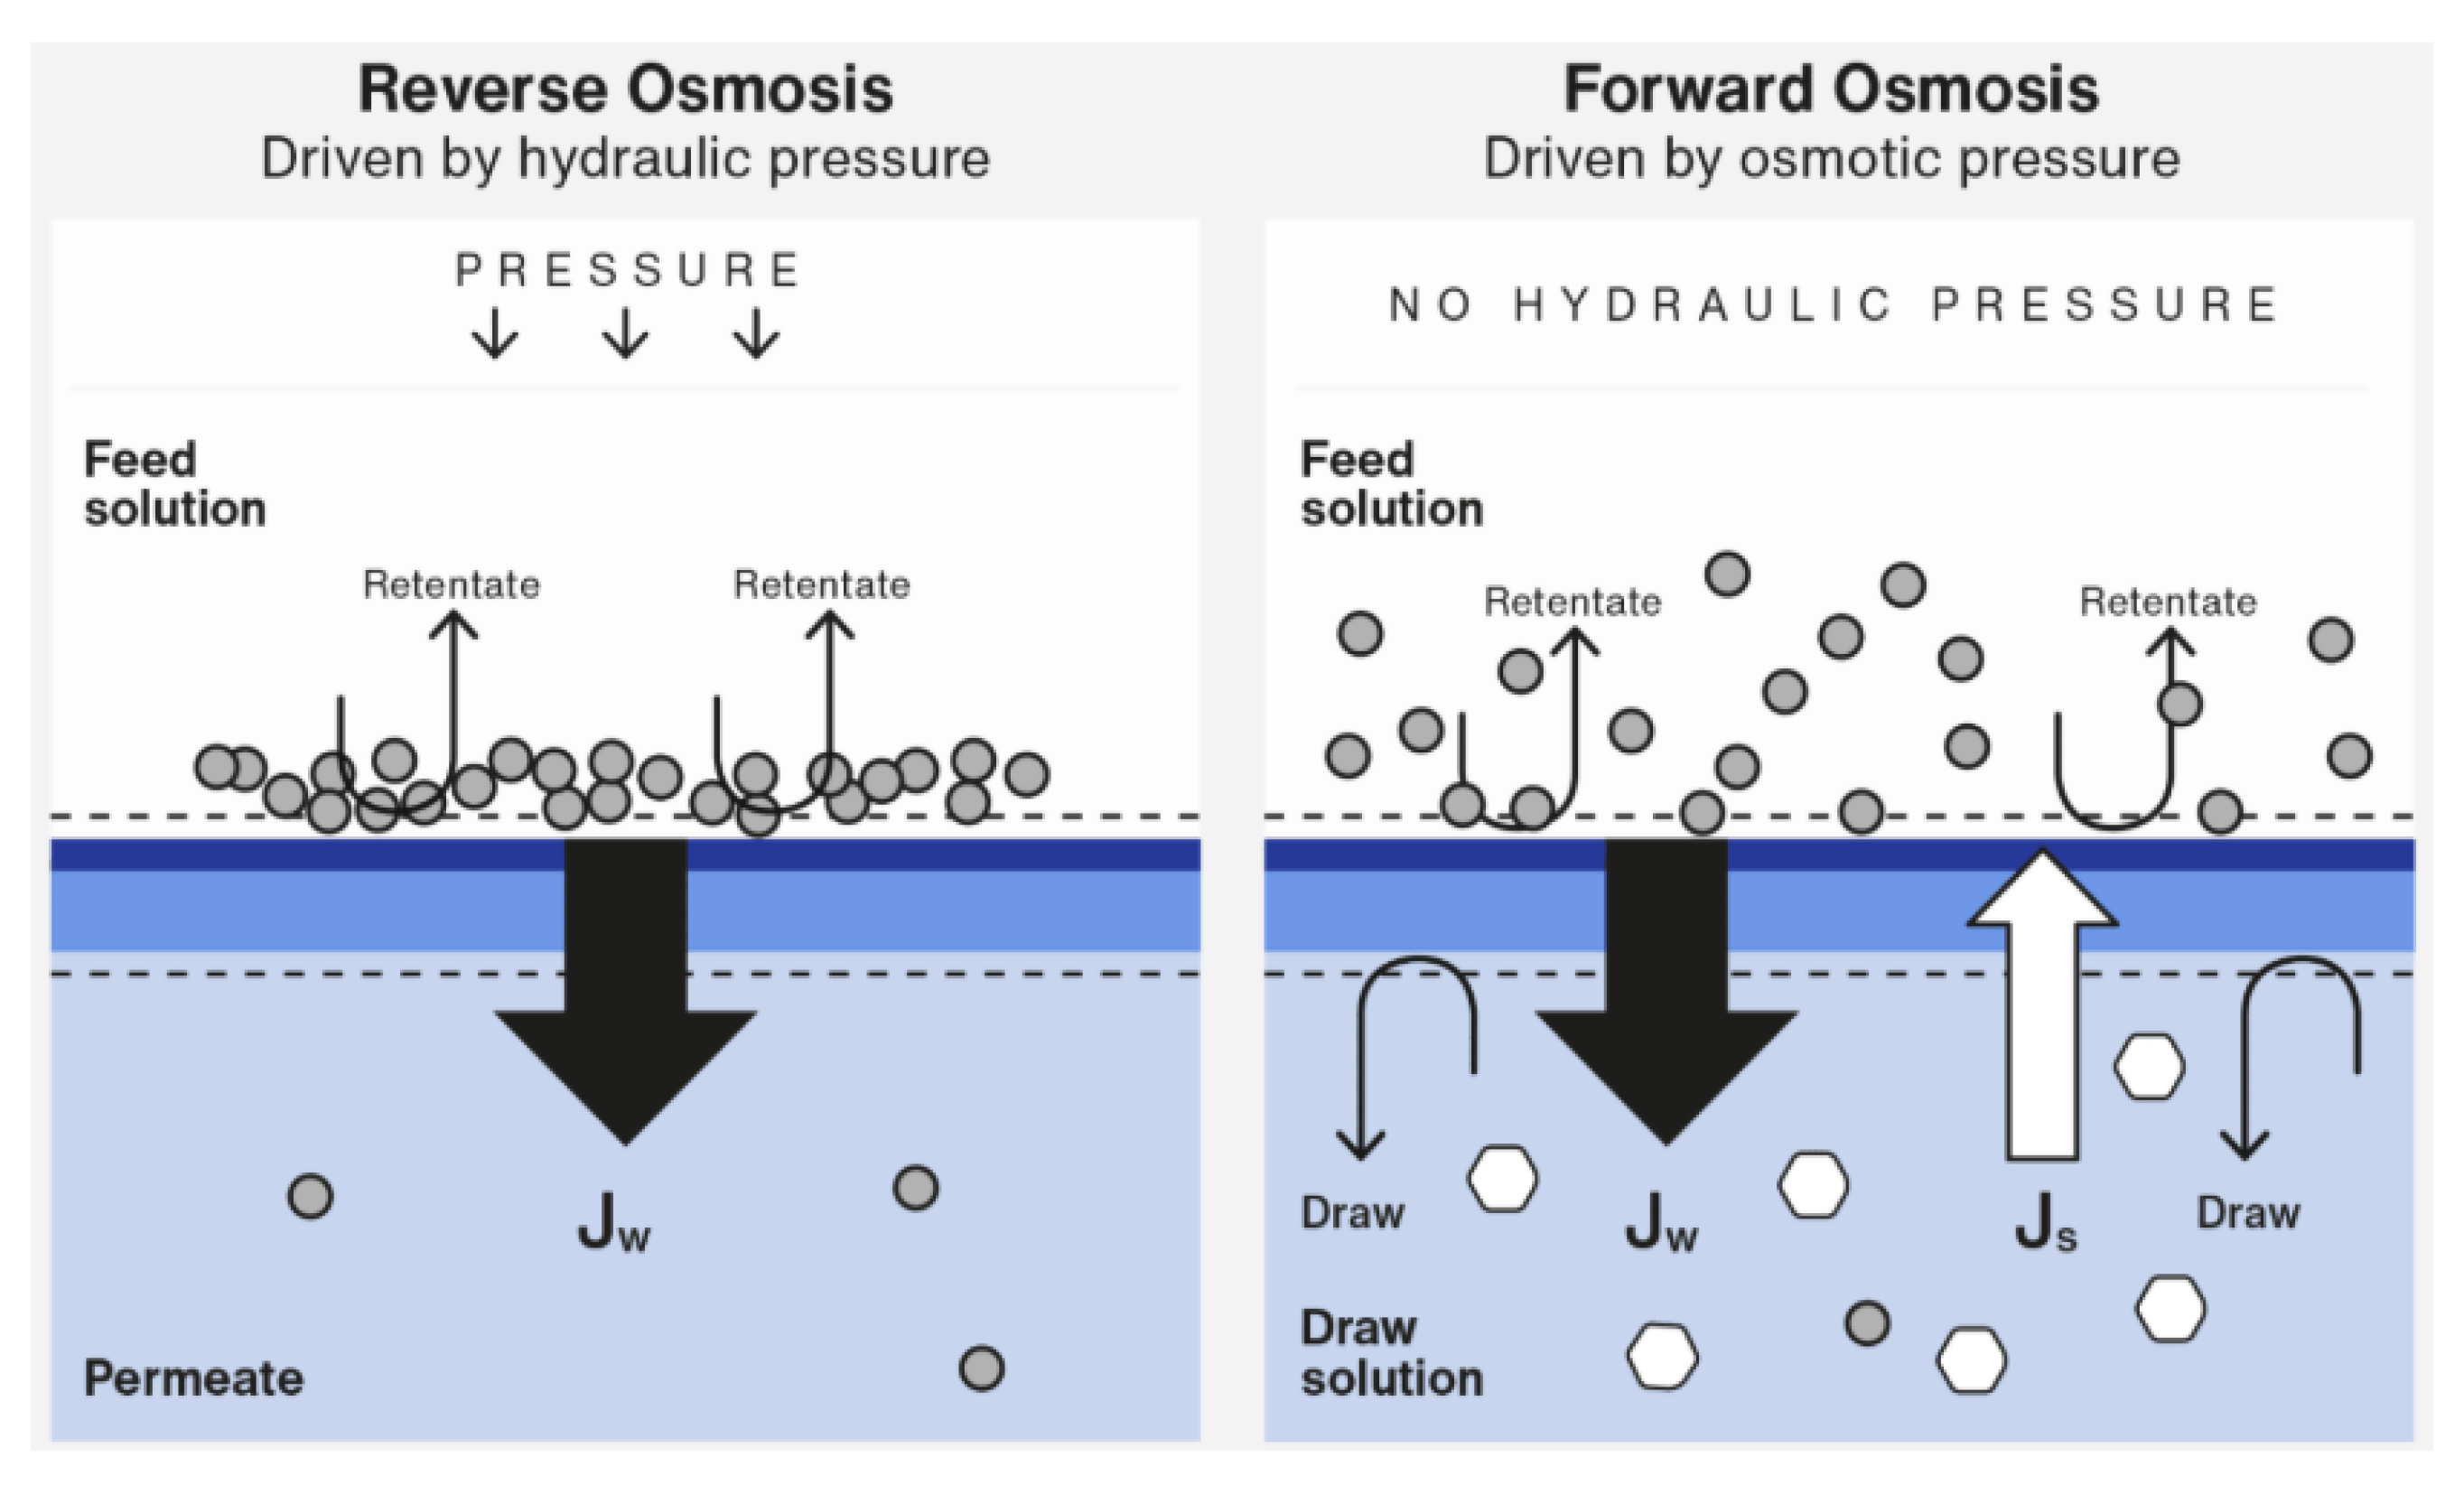
In contrast, Forward Osmosis (FO) operates on a different principle. FO is an emerging process that utilizes a natural osmotic gradient, rather than hydraulic pressure , to draw water across a semi-permeable membrane from a dilute solution (like feedwater) into a highly concentrated “draw” solution in this case both water flux (Jw) and some solute flux (Js) (Figure 3) occur through the membrane. While FO often demonstrates superior resistance to membrane fouling and has a lower intrinsic energy demand, its widespread commercial application is currently hindered by challenges related to the efficient and economical regeneration of the draw solution [9].
Figure 3.
The key distinction between forward and reverse osmosis lies in the direction of water flux (Jw). In reverse osmosis, applied pressure forces (Jw) against the natural osmotic gradient, whereas in forward osmosis, (Jw) flows naturally with the gradient [9].
Figure 3.
The key distinction between forward and reverse osmosis lies in the direction of water flux (Jw). In reverse osmosis, applied pressure forces (Jw) against the natural osmotic gradient, whereas in forward osmosis, (Jw) flows naturally with the gradient [9].
Membrane fouling remains the most significant operational challenge for Reverse Osmosis (RO) systems, impacting efficiency, energy consumption, permeate quality, and operating costs. This fouling, caused by the accumulation of particulate, colloidal, organic, or biological matter (biofouling), reduces permeate flow and demands higher operating pressure and more frequent chemical cleaning. Effective pre-treatment, such as ultrafiltration, microfiltration, and coagulation-flocculation, is therefore essential to ensure a long lifespan and optimal performance of the RO system, as highlighted in a 2019 review by Qasim et al. [10].
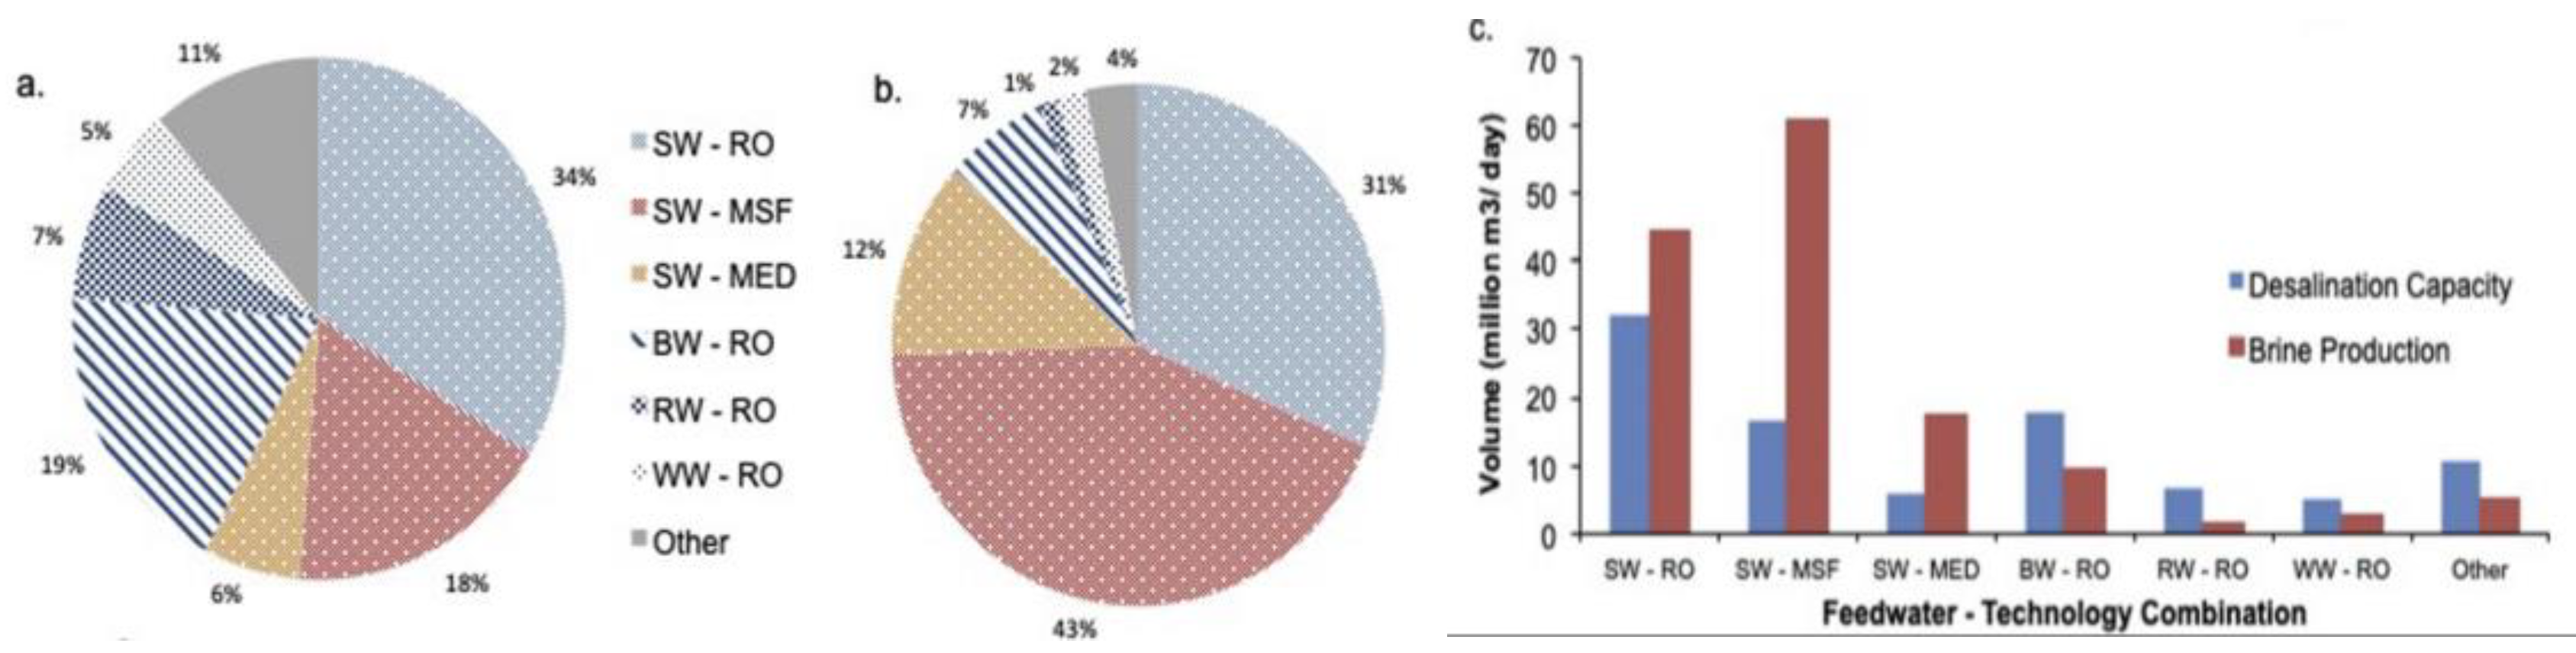
Globally, the desalination industry is substantial, with 15,906 operational plants producing about 95.37 million m³/day of desalinated water, according to Jones et al. [11]. The Middle East and North Africa account for 48% of this production. RO is the dominant technology, contributing 69% (65.5 million m³/day), while thermal methods Multi-Stage Flash (MSF) and Multiple Effect Distillation (MED) account for 18% and 7%, respectively. Seawater (SW) is the primary source (61%), followed by brackish water (BW) at 21%, and river water (RW) at 8%. A key environmental concern is the significant volume of brine produced, which is approximately 50% greater than the desalinated water output.
Figure 3.
Major desalination feedwater-technology combinations by (a) global share in the desalinated water production (%), (b) global share in brine production (%) and (c) total desalination capacity and volume of brine produced (million m3/day) [11].
Figure 3.
Major desalination feedwater-technology combinations by (a) global share in the desalinated water production (%), (b) global share in brine production (%) and (c) total desalination capacity and volume of brine produced (million m3/day) [11].
A significant environmental concern associated with Reverse Osmosis (RO) is the management and disposal of hypersaline brine concentrate, a byproduct containing rejected salts and impurities at concentrations much higher than the original feedwater. Discharging the resulting brine, particularly into marine or coastal environments, poses a significant threat to local aquatic ecosystems. This is primarily due to the increased local salinity, which disrupts the osmotic balance of marine life. This impact can be worsened by the presence of residual pre-treatment chemicals or thermal disparities.
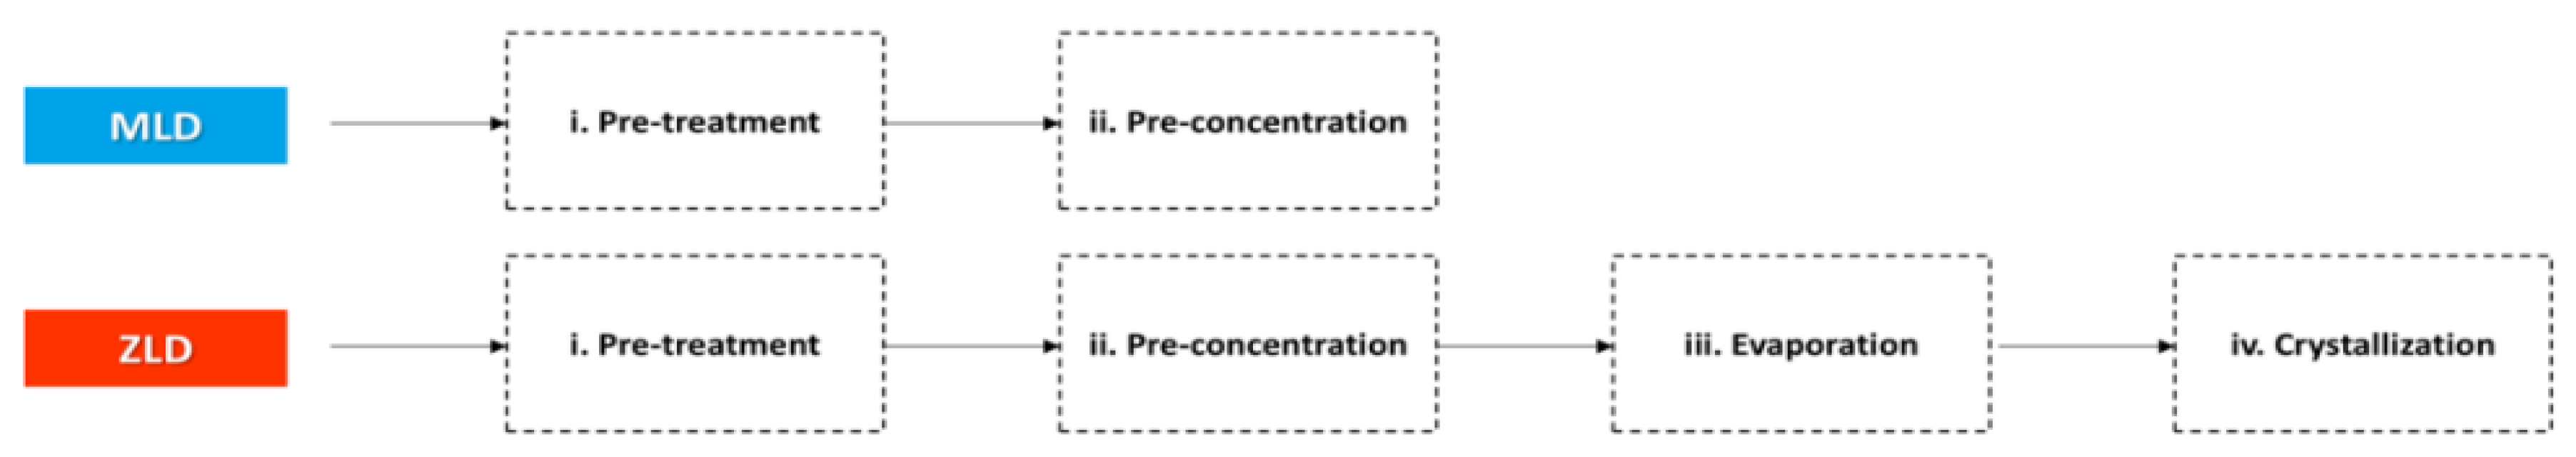
Consequently, adopting sustainable brine management strategies is essential. Current strategies include deep-well injection, utilizing evaporation ponds, or diluting the brine with other water outflows. More advanced, albeit high-cost, approaches aim for Zero Liquid Discharge (ZLD). These highly advanced systems, however, present distinct economic and technical challenges. The fundamental difference between Zero Liquid Discharge (ZLD) and Minimal Liquid Discharge (MLD) systems lies in their processes, requiring four steps and two steps, respectively, as illustrated in Figure 4.
Figure 4.
The main steps of ZLD and MLD configurations [12].
Figure 4.
The main steps of ZLD and MLD configurations [12].
Ongoing research is actively dedicated to creating more economical and ecologically friendly methods for brine disposal. A growing area of focus is also on recovering resources, such as minerals, from the concentrate [13,14,15,16].
2.1.2. Thermal Desalination Fundamentals (MSF and MED)
Thermal desalination, a process that produces pure water by heating saline water to create and then condense water vapor, primarily employs two methods: multi-stage flashing (MSF) and multi-effect desalination (MED). To enhance performance and optimize energy consumption, MED plants can integrate a compressor (either thermal or mechanical), resulting in processes known as MED-TVC (thermal vapor compression) and MED-MVC (mechanical vapor compression) [17].
Both MSF and MED systems operate on the principle of boiling point depression, achieved by operating under a partial vacuum. This low-pressure environment significantly reduces the seawater’s boiling point, thereby lowering the energy required for the phase change.
The water boiling temperature is determined by the Clausius-Clapeyron equation [18]:
T = T₀ / (1 - (R·T₀/ΔHᵥₐₚ)·ln(P/P₀))
T = boiling temperature at pressure P (in Kelvin)
T₀ = normal boiling point (373.15 K)
P = pressure (Pa)
P₀ = reference atmospheric pressure (101,325 Pa)
R = gas constant (8.314 J/(mol·K))
ΔHᵥₐₚ = enthalpy of vaporization (~40,660 J/mol for water)
For instance, while water boils at 100 °C at standard atmospheric pressure (1 atm), reducing the pressure to 0.25 bar lowers its boiling point to 65 °C.
Table 1.
Water boiling point using online engineering toolbox calculator [19].
Table 1.
Water boiling point using online engineering toolbox calculator [19].
| Absolute Pressure | 1 atm | 250 mbar | 100 mbar |
|---|---|---|---|
| Water boiling temperature | 100 °C | 65,1 °C | 45,6 °C |
Maintaining operational stability in thermal plants necessitates keeping seawater temperatures below 65 °C.
This critical measure allows plant operators to effectively control mineral scale formation and prevent severe issues arising from high-temperature heating.
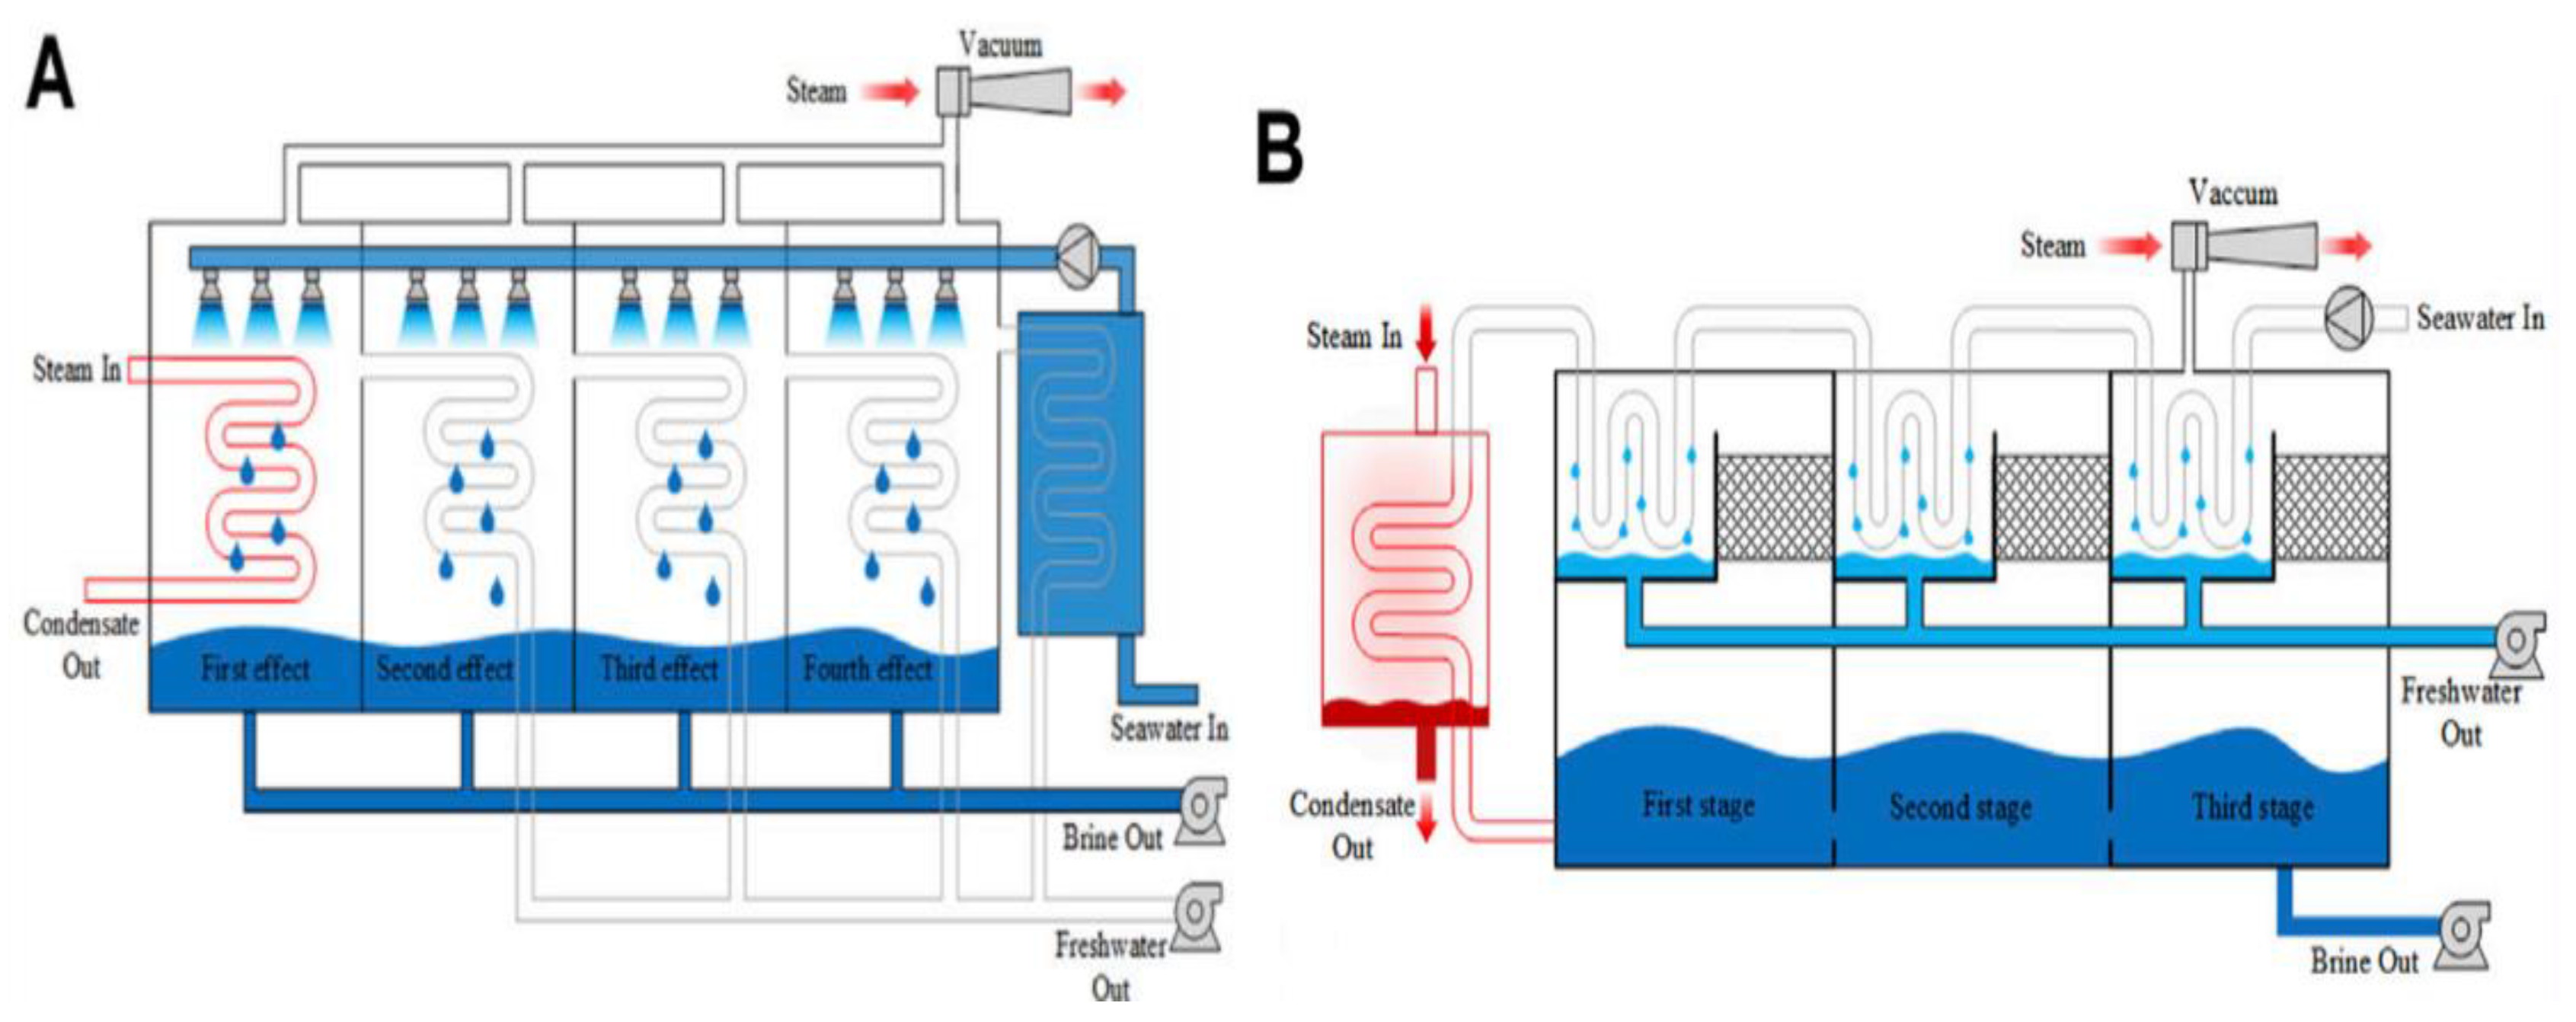
Figure 6 illustrates the two distinct distillation processes: Multi-Effect Distillation (MED) in panel A and Multi-Stage Flash (MSF) Distillation in panel B.
- -
- Multi-Effect Distillation (MED):
The MED process features four sequential effects (First, Second, Third, and Fourth), where steam passes through multiple stages. Each effect comprises evaporation chambers at the top and condensation occurring below. Steam input heats the first effect, and the vapor generated in each subsequent effect serves as the heating source for the next. This creates a cascading heat recovery system. Seawater enters from the right side, yielding both freshwater and brine outputs.
- -
- Multi-Stage Flash (MSF):
In contrast, the MSF process consists of three stages (First, Second, and Third) operating on a different principle. Seawater is preheated by steam in a heat exchanger (indicated in red on the left). It then flashes into vapor as it enters chambers maintained at progressively lower pressures. Each stage incorporates a mesh/grid structure for efficient vapor-liquid separation. The flashing occurs due to pressure reduction rather than direct heating in each stage. Steam input provides the initial heating, and the system also produces freshwater and brine.
The fundamental difference between these two methods is that MED utilizes multiple effects with direct heat transfer between stages, whereas MSF employs flash evaporation in chambers at decreasing pressures, driven by a single initial heat input.
Figure 6.
Schematic of the seawater desalination process: (A) MED, (B) MSF [20].
Figure 6.
Schematic of the seawater desalination process: (A) MED, (B) MSF [20].
Do Thi et al. [21] conducted a comprehensive comparison of three major desalination technologies: Multi-Stage Flash (MSF), Multi-Effect Distillation (MED), and Reverse Osmosis (RO). These technologies were evaluated based on their performance when powered by various energy sources, including fossil fuels, solar, wind, and nuclear energy. The key findings include:
- -
- Environmental Impact: RO technology, especially when combined with renewable energy sources, demonstrated superior environmental performance. It achieved significant reductions in environmental impacts, including ~93% in human health impacts and 96.5% in CO2 emissions, along with notable improvements in ecosystem quality and resource consumption compared to fossil fuel-powered operations.
- -
- Energy Consumption: Thermal technologies (MSF and MED) are more energy-intensive, consuming 13.5-25.5 kWh/m³ total electric equivalent, whereas RO consumes 5-9 kWh/m³.
- -
- Economic Viability: RO emerged as the most cost-effective solution, producing desalinated water at USD 0.52-0.56/m³. This is more economical than MED (USD 0.52-1.01/m³) and MSF (USD 0.52-1.75/m³).
- -
- Overall Ranking: Based on a Multi-Criteria Decision Analysis (MCDA) that prioritized environmental factors, RO was ranked as the optimal technology with a score of 1.00. MED followed with a score of 0.11 and MSF with 0.00.
- -
- Stability and Resilience: Thermal plants (MSF and MED) exhibit superior stability and resilience when processing feed water with very high salinity or complex contaminant profiles. This inherent stability allows them to achieve raw water recovery rates often exceeding 45%. In contrast, while state-of-the-art Seawater Reverse Osmosis (SWRO) systems are designed for 40% to 50% recovery, their efficiency and operational stability significantly decline under extreme feed water conditions.
| Desalination Technology | Specific Energy Consumption SEC (kWh/m3) |
Unit Product Cost (USD/m3) | Distillate Quality TDS (ppm) |
|---|---|---|---|
| Reverse Osmosis (RO) | 5 – 9 | 0.52–0.56 | 150–500 |
| Multi-Effect Distillation (MED) | 6.5 – 11 | 0.52–1.01 | ~10 |
| Multi-Stage Flash (MSF) | 13.5 – 25.5 | 0.52–1.75 | ~10 |
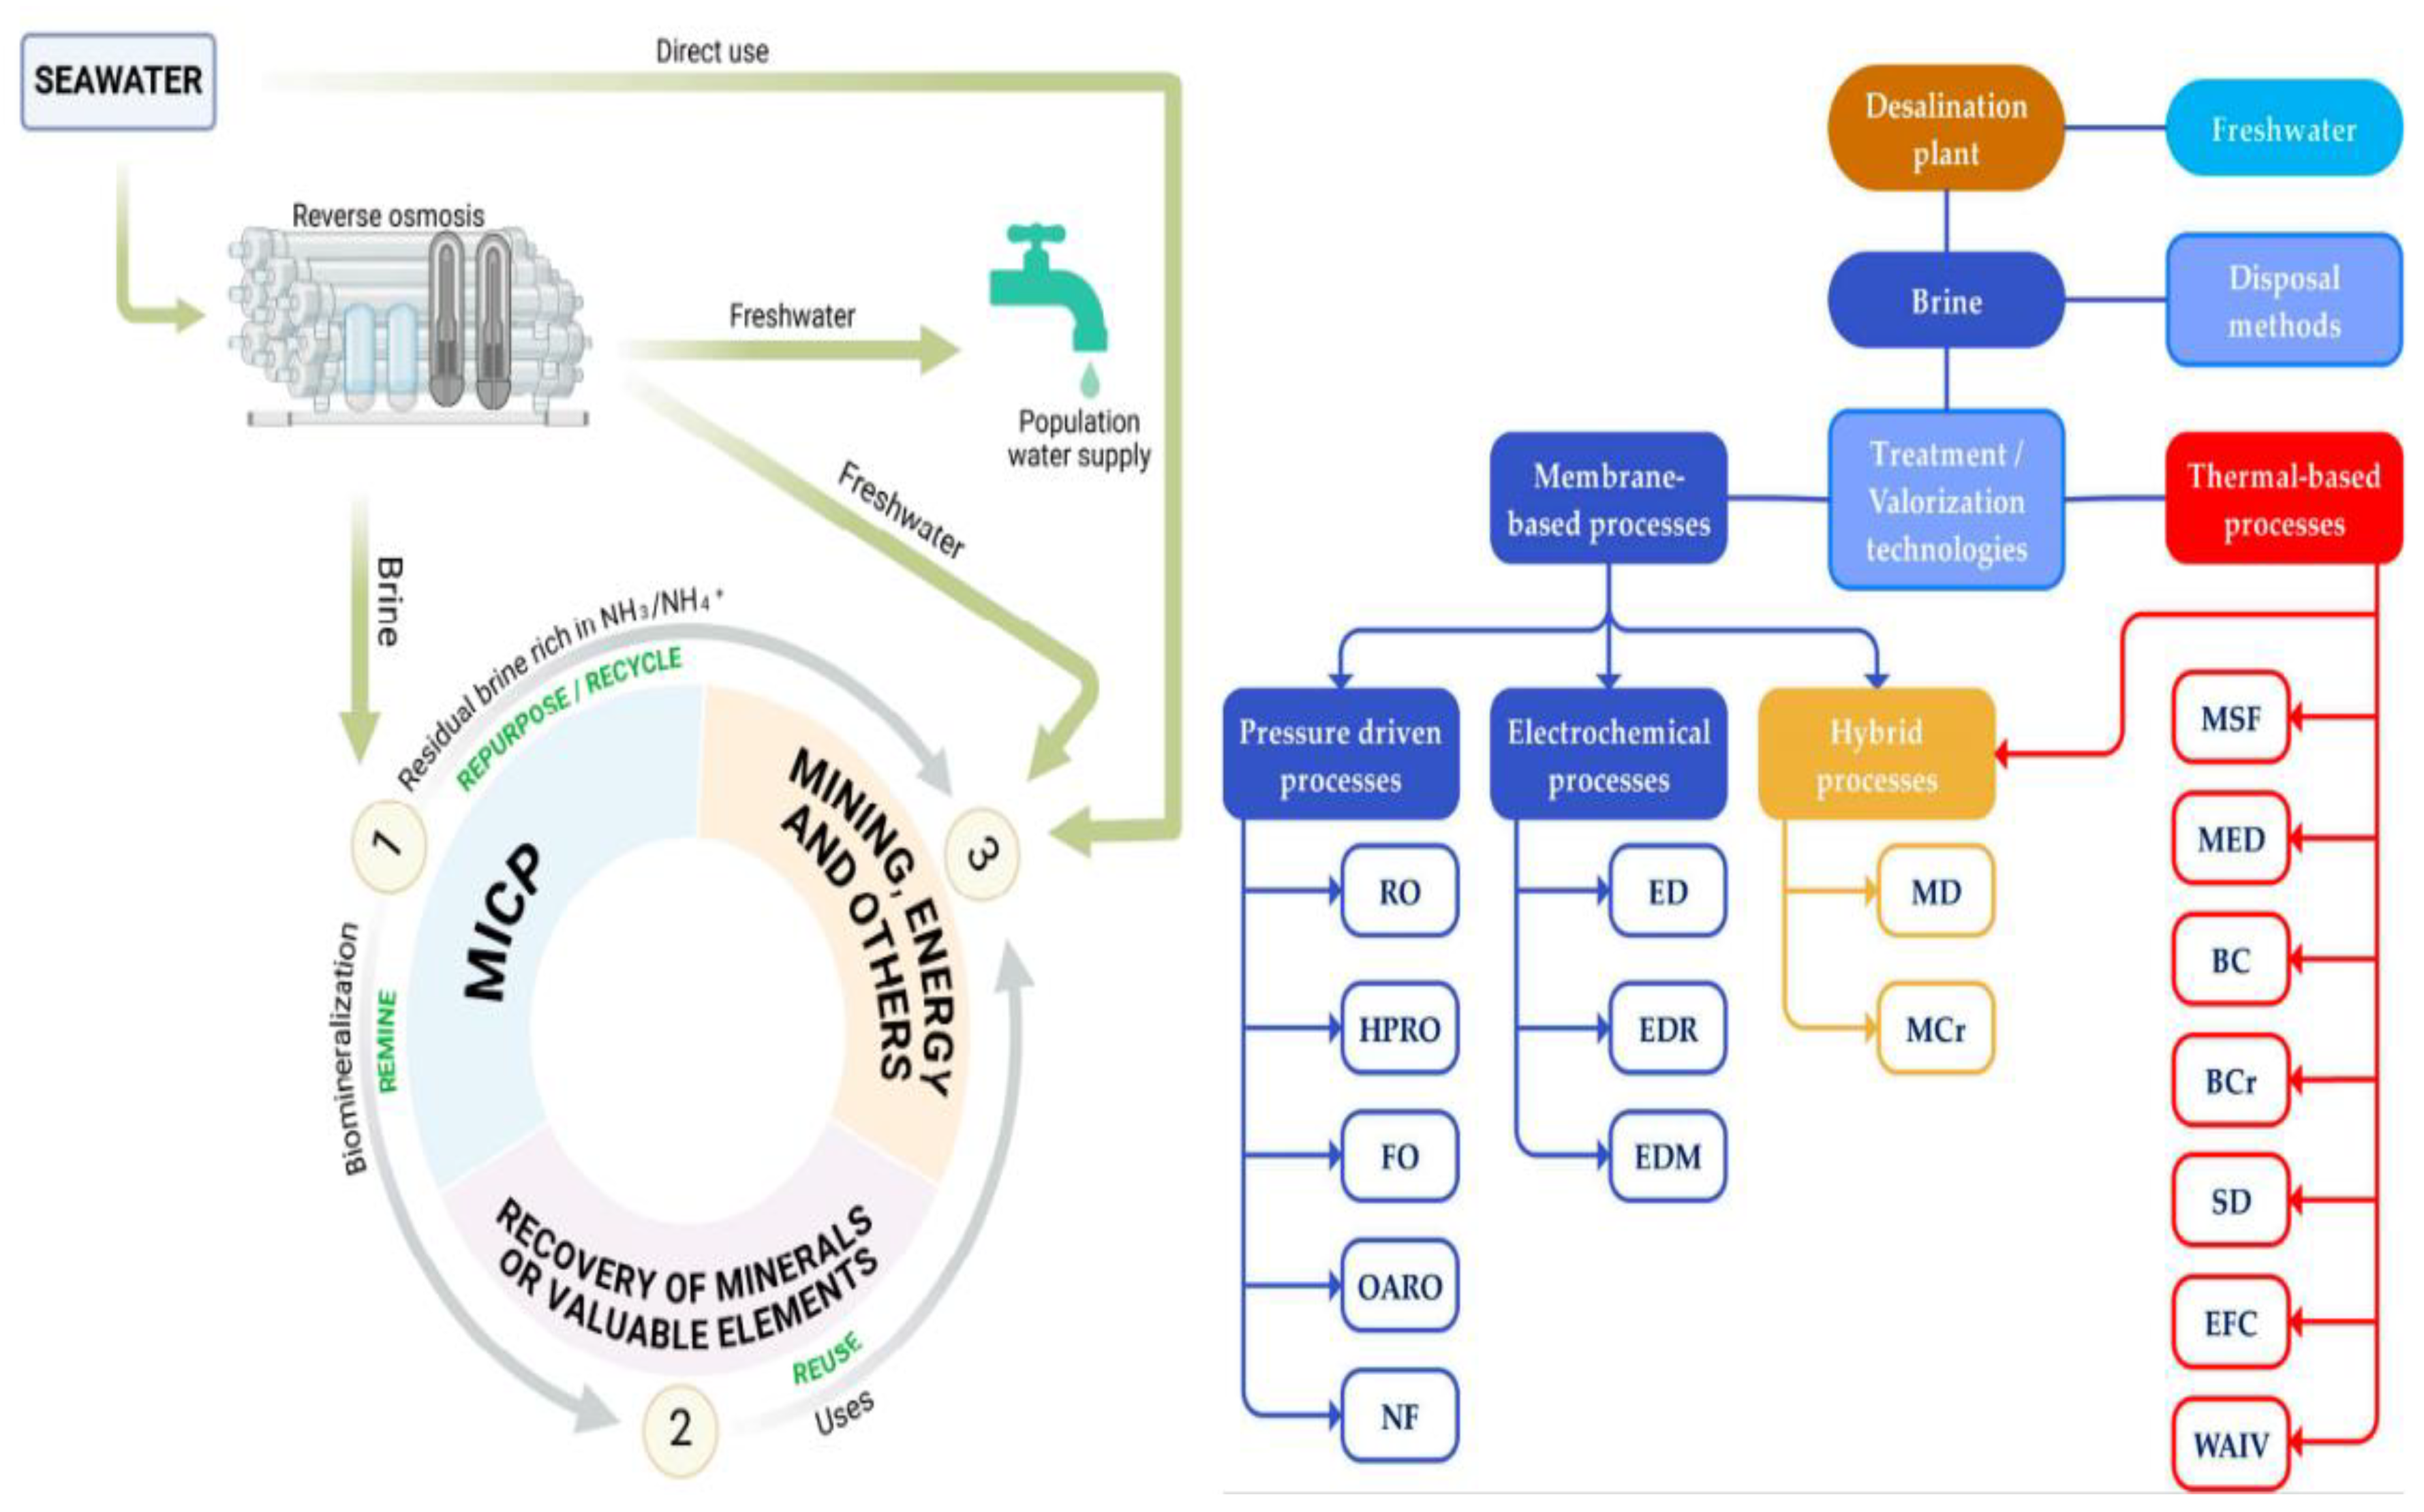
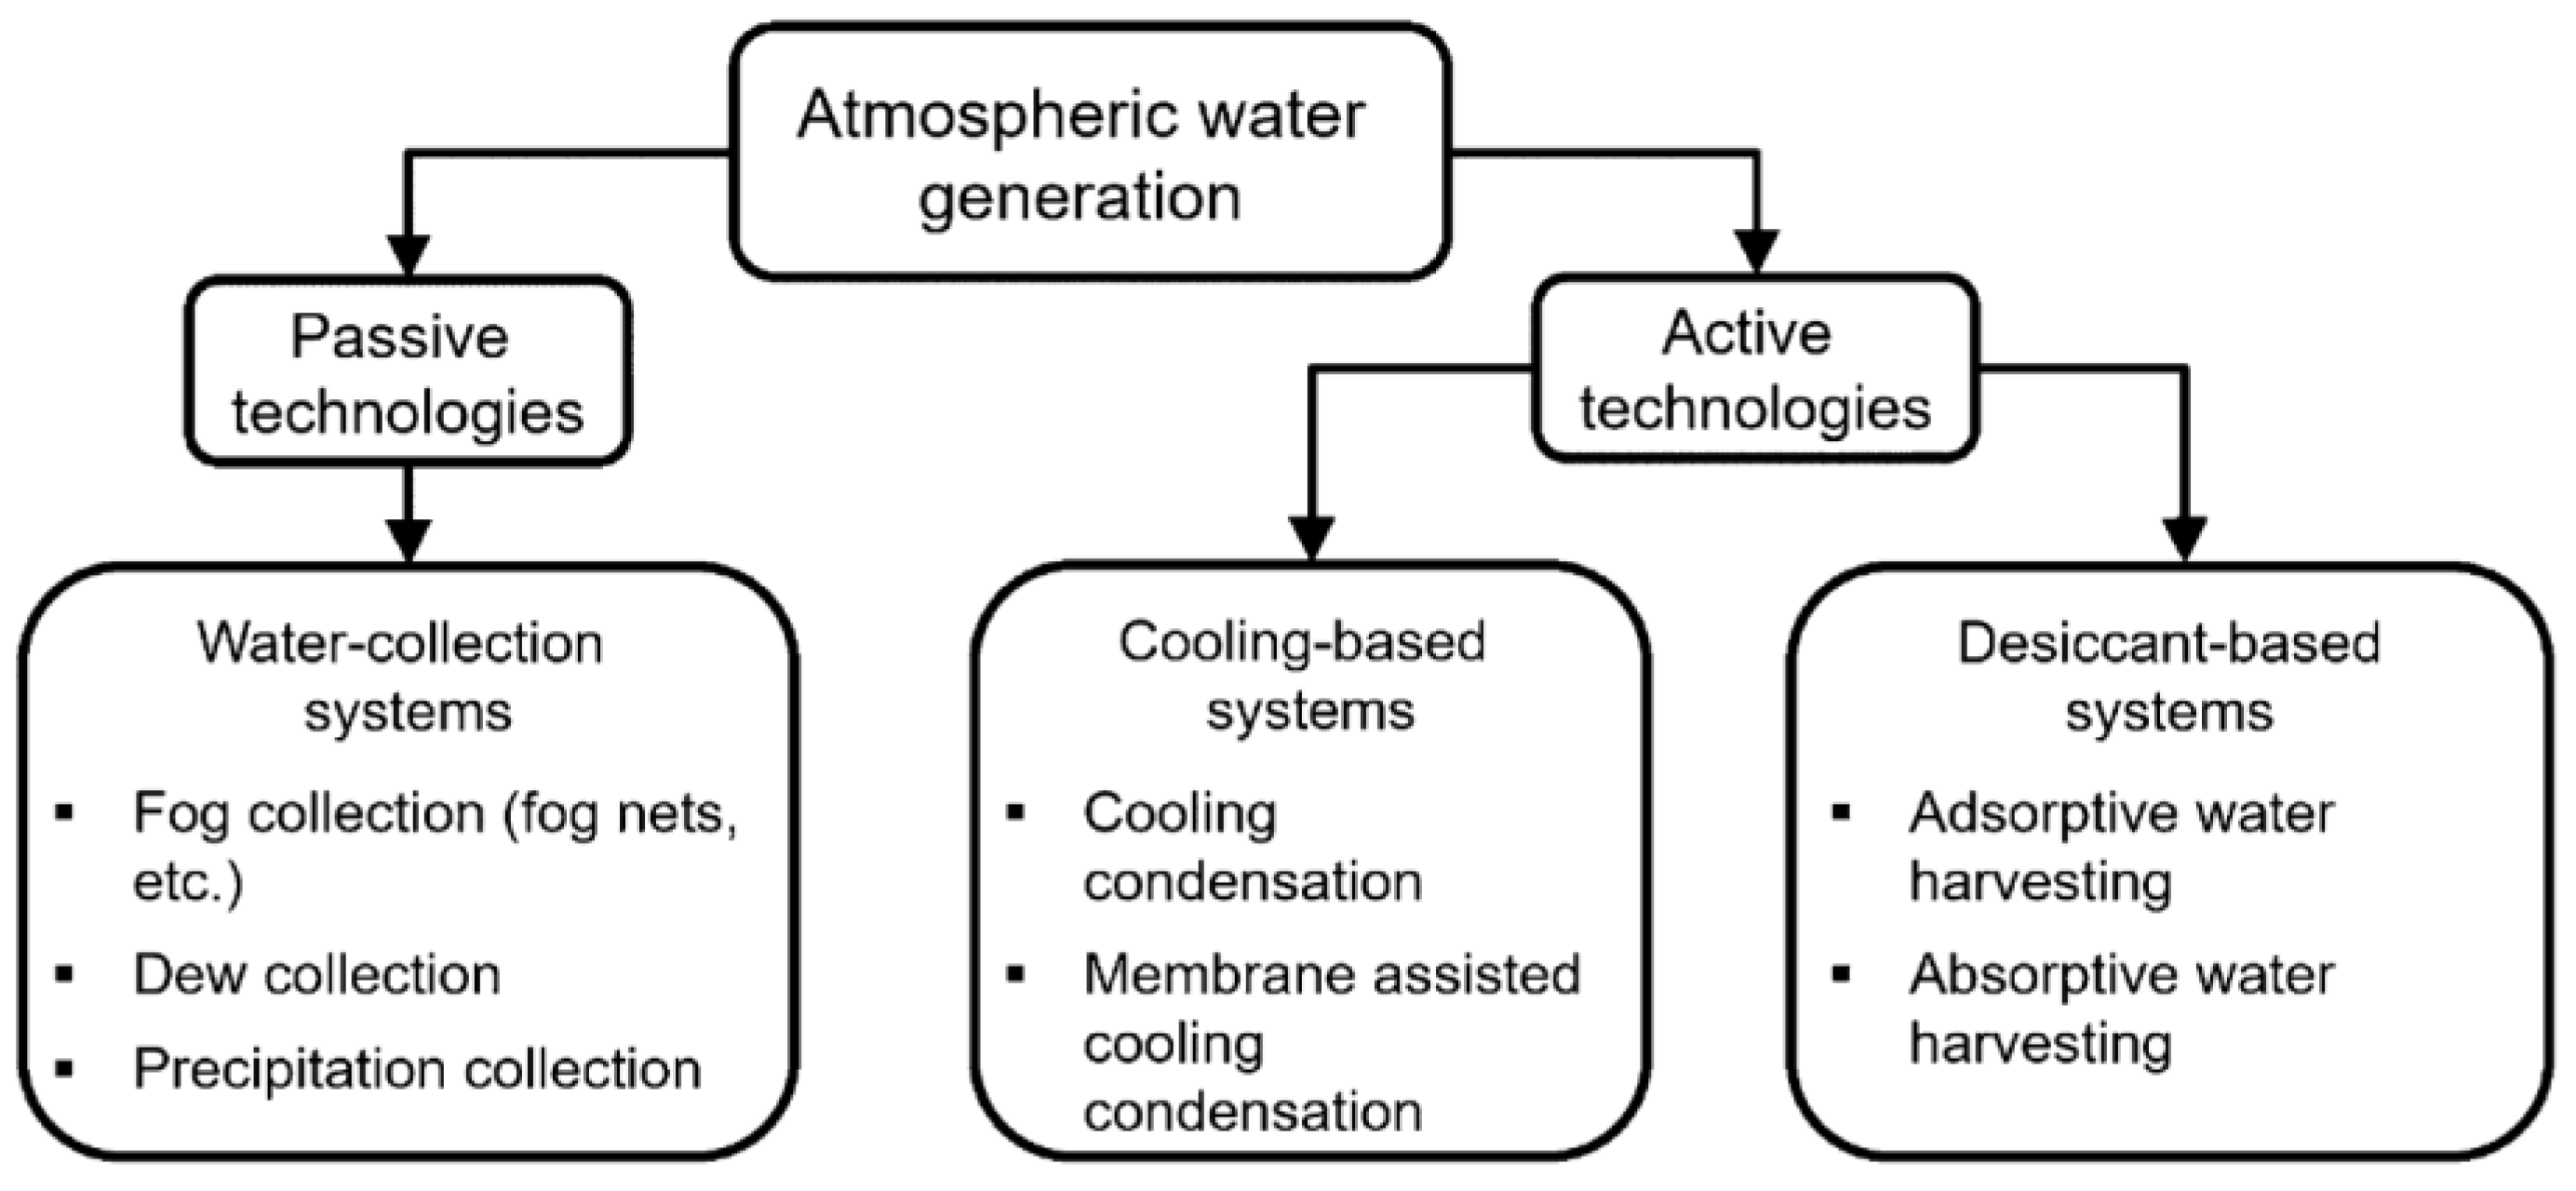
2.2. Atmospheric Water Generation (AWG)
Air-to-Water Generation (AWG) technologies, which are used to extract water from the air, utilize either active or passive cooling methods or desiccants to remove water vapor (as illustrated in Figure 7). The energy consumption of these technologies is a significant factor, varying considerably depending on the specific technology employed, along with the ambient temperature and humidity.
Potyka et al. [26] categorize water-from-air technologies into two main types: passive systems, which directly leverage natural energy sources such as solar energy, and active systems, which depend on the transformation of energy vectors.
Figure 7.
Categorization Overview of Atmospheric Water Generation (AWG) Technologies [26].
Figure 7.
Categorization Overview of Atmospheric Water Generation (AWG) Technologies [26].
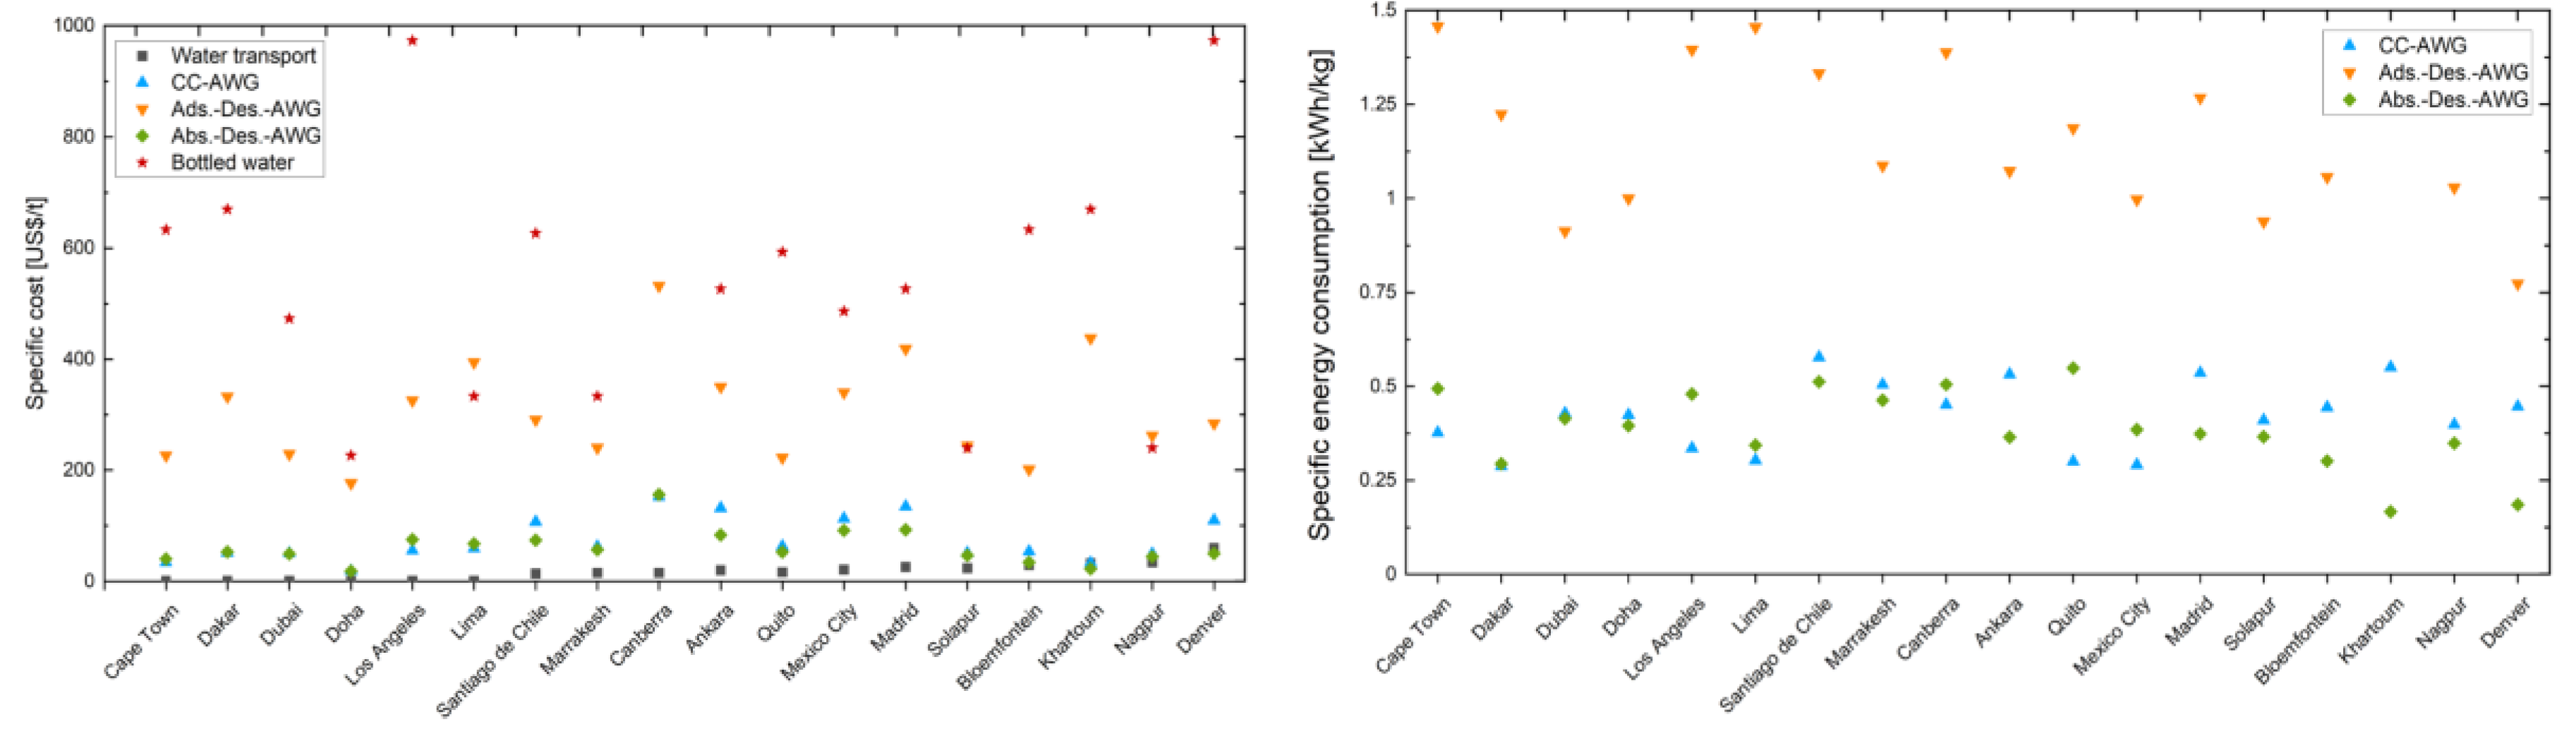
Potyka et al. [26] conducted a detailed analysis comparing the energetic and economic feasibility of three active atmospheric water generation (AWG) technologies: cooling condensation (CC-AWG), adsorption-desorption (ads.-Des.-AWG), and absorption-desorption (abs.-Des.-AWG). This involved thermodynamic modeling and location-specific economic comparisons against bottled water (Figure 8).
The study highlights that absorption systems are the most energy-efficient (0.38 kWh/kg), closely followed by CC-AWG (0.42 kWh/kg), while adsorption systems show the lowest efficiency (1.16 kWh/kg). Economically, AWG technologies are most competitive with conventional sources in inland regions (over 600 km from the coast) that benefit from low electricity costs (under 0.10 US$/kWh). Furthermore, AWG is generally competitive with bottled water prices, with the absorption-desorption AWG having the lowest operating costs. However, a major constraint is the high variability in water production across all AWG technologies. Consequently, despite the energy efficiency of absorption systems, which still require further development ,AWG technologies are best suited as a complementary, rather than a primary water supply.
Figure 8.
Cost and Energy Consumption of Water Production Using Various Atmospheric Water Generation (AWG) Technologies at Different Sites (Based on Potyka et al. [26]).
Figure 8.
Cost and Energy Consumption of Water Production Using Various Atmospheric Water Generation (AWG) Technologies at Different Sites (Based on Potyka et al. [26]).
Peeters et al. [27] reviewed atmospheric water generation (AWG) technologies, emphasizing their energy efficiency and climate dependence, quantified by specific water yield (L/kWh), the inverse of Specific Energy Consumption (SEC).
Despite atmospheric water vapor being an inexhaustible resource, AWG systems are notably energy-intensive, requiring over a hundred times more energy than seawater desalination, thus posing a significant water-energy nexus challenge that necessitates novel, energy-efficient concepts. Their analysis indicated that cooling condensation technologies achieve 1-4 L/kWh, best suited for hot, humid climates, while adsorption/desorption systems, typically yielding 0.1-1 L/kWh, are more appropriate for dry, arid regions. Recent advancements in desiccant materials, such as metal-organic frameworks (MOFs) and super moisture-absorbent gels (SMAG), show promise for enhanced efficiency, with SMAG achieving up to 9.28 L/kWh at 90% relative humidity. Complementing this, Cattani et al. [28] investigated a large-scale, integrated AWG system in a Dubai worker village, which simultaneously produced an average of 1,585 L/day of potable water, provided cooled and dehumidified air for HVAC, and thermal energy for domestic water heating.
This system demonstrated high Water Energy Transformation (WET) efficiency with less than 3% error, achieving substantial annual water production (825,543.5 liters), significant energy savings (e.g., 634,509.5 kWh for heating), and notable economic returns, including a 1.85-year simple payback and a Net Present Value exceeding 958,000 $ over 10 years. Furthermore, it offered environmental benefits by avoiding 11.4 metric tons of plastic waste annually and reducing transportation impacts, with water quality comparable to major bottled brands.
Despite potential energy savings from integrated designs, such as those demonstrated by Cattani et al. [28] which maximize thermodynamic cycle benefits, Atmospheric Water Generation (AWG) systems typically remain energy-intensive.
This high energy demand currently restricts their practical use primarily to residential or non-industrial settings.
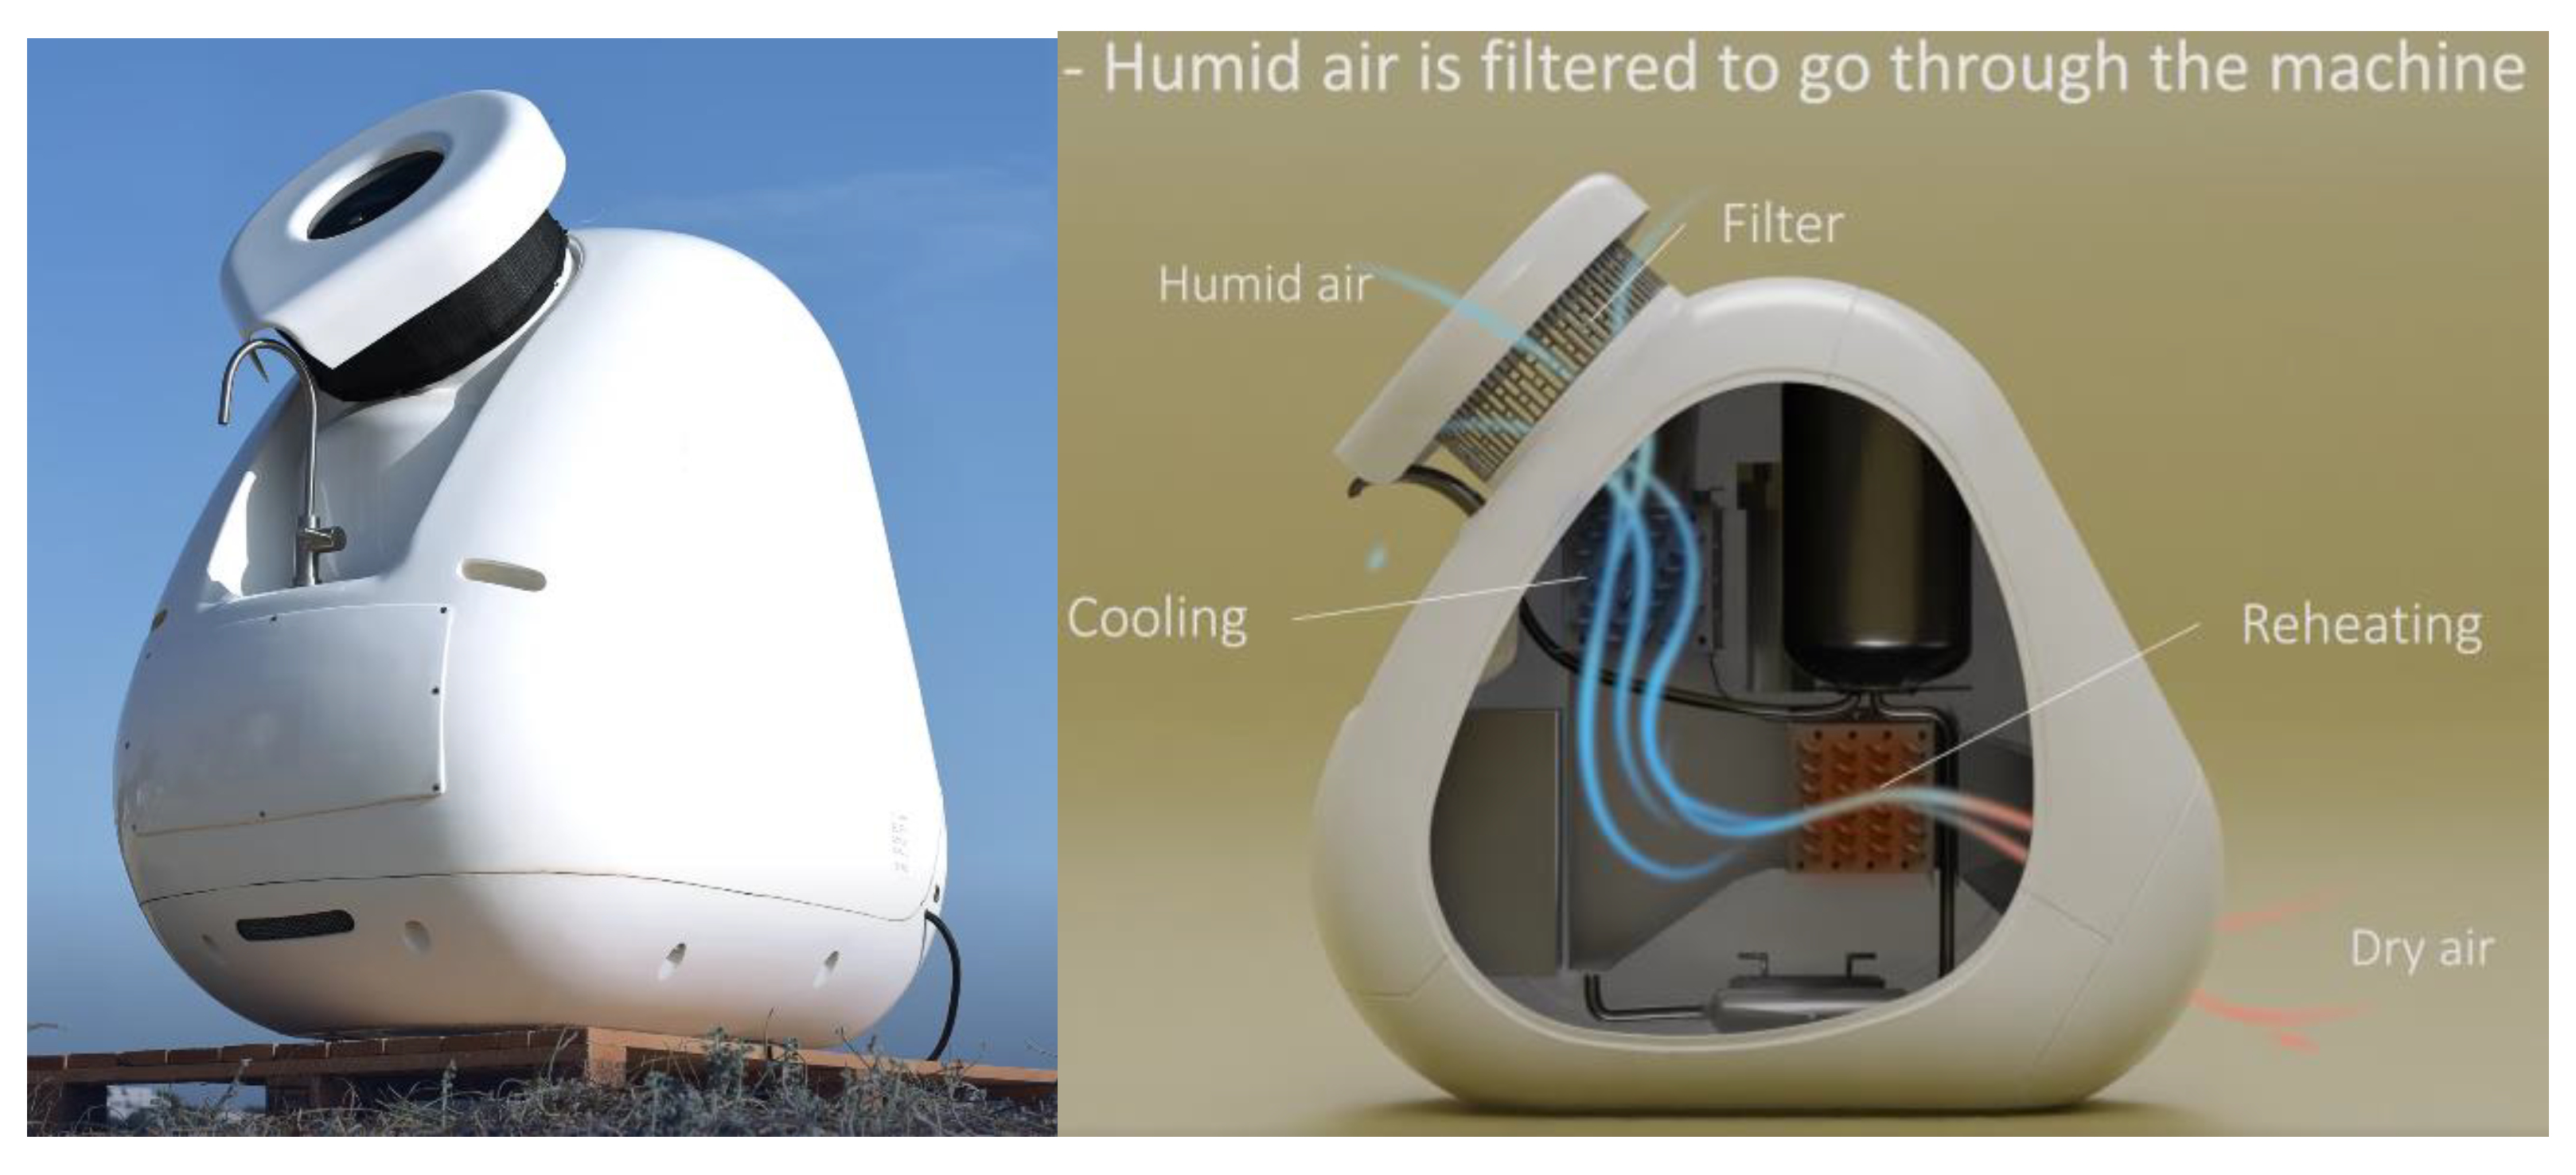
Commercial, compact solutions, such as those from the French startup Kumuls water (see Figure 9) [29], pose a significant obstacle to widespread implementation. These systems are often priced above 4,000 euros and suffer from a high Specific Energy Consumption (SEC) of 0.8 kWh per liter of water produced.
Figure 9.
Schematic and picture of the compact AWG (Atmospheric Water Generator) solution developed by the French startup Kumuls Water [29].
Figure 9.
Schematic and picture of the compact AWG (Atmospheric Water Generator) solution developed by the French startup Kumuls Water [29].
3. Water Generation Method from Condensate Recycling in Oil-Free Rotary Screw Air Compressors Atlas Copco ZR315 FF with Integrated Dryer
Our study focuses on an industrial plant equipped with four Atlas Copco ZR315 air compressors. These units annually produce approximately 70 million normal cubic meters (Nm3) of compressed air at 6.5 bar pressure. The energy consumption is nearly 9 GWh, resulting in a specific energy ratio of 128 Wh/Nm3 of compressed air.
The compressed air system serves two main functions:
- -
- Dry Air: Characterized by a dew point of -40 °C, this air is distributed across five branches (shown in red in Figure 10). Each of these dry air branches is monitored with a VA500 CS instruments Flow meter for dry air [30]. This dry air is crucial for controlling electropneumatic valves and various devices, including the compressed air pulsed blowing systems used to remove caked or accumulated material from boiler piping.
- -
- Humid Air: Sourced directly from the three standard compressors (N° 1, 2, and 3 in Figure 10), this air is utilized in two branches. These humid air branches are equipped with a VD500 CS instruments Flow meter for wet air [31] and are used for general applications such as cleaning.
Figure 10.
The Process Flow Diagram (PFD) for compressed air production in the studied plant using color-coding to show: Wet air (green), Dry air (red), and Water condensate (blue).
Figure 10.
The Process Flow Diagram (PFD) for compressed air production in the studied plant using color-coding to show: Wet air (green), Dry air (red), and Water condensate (blue).
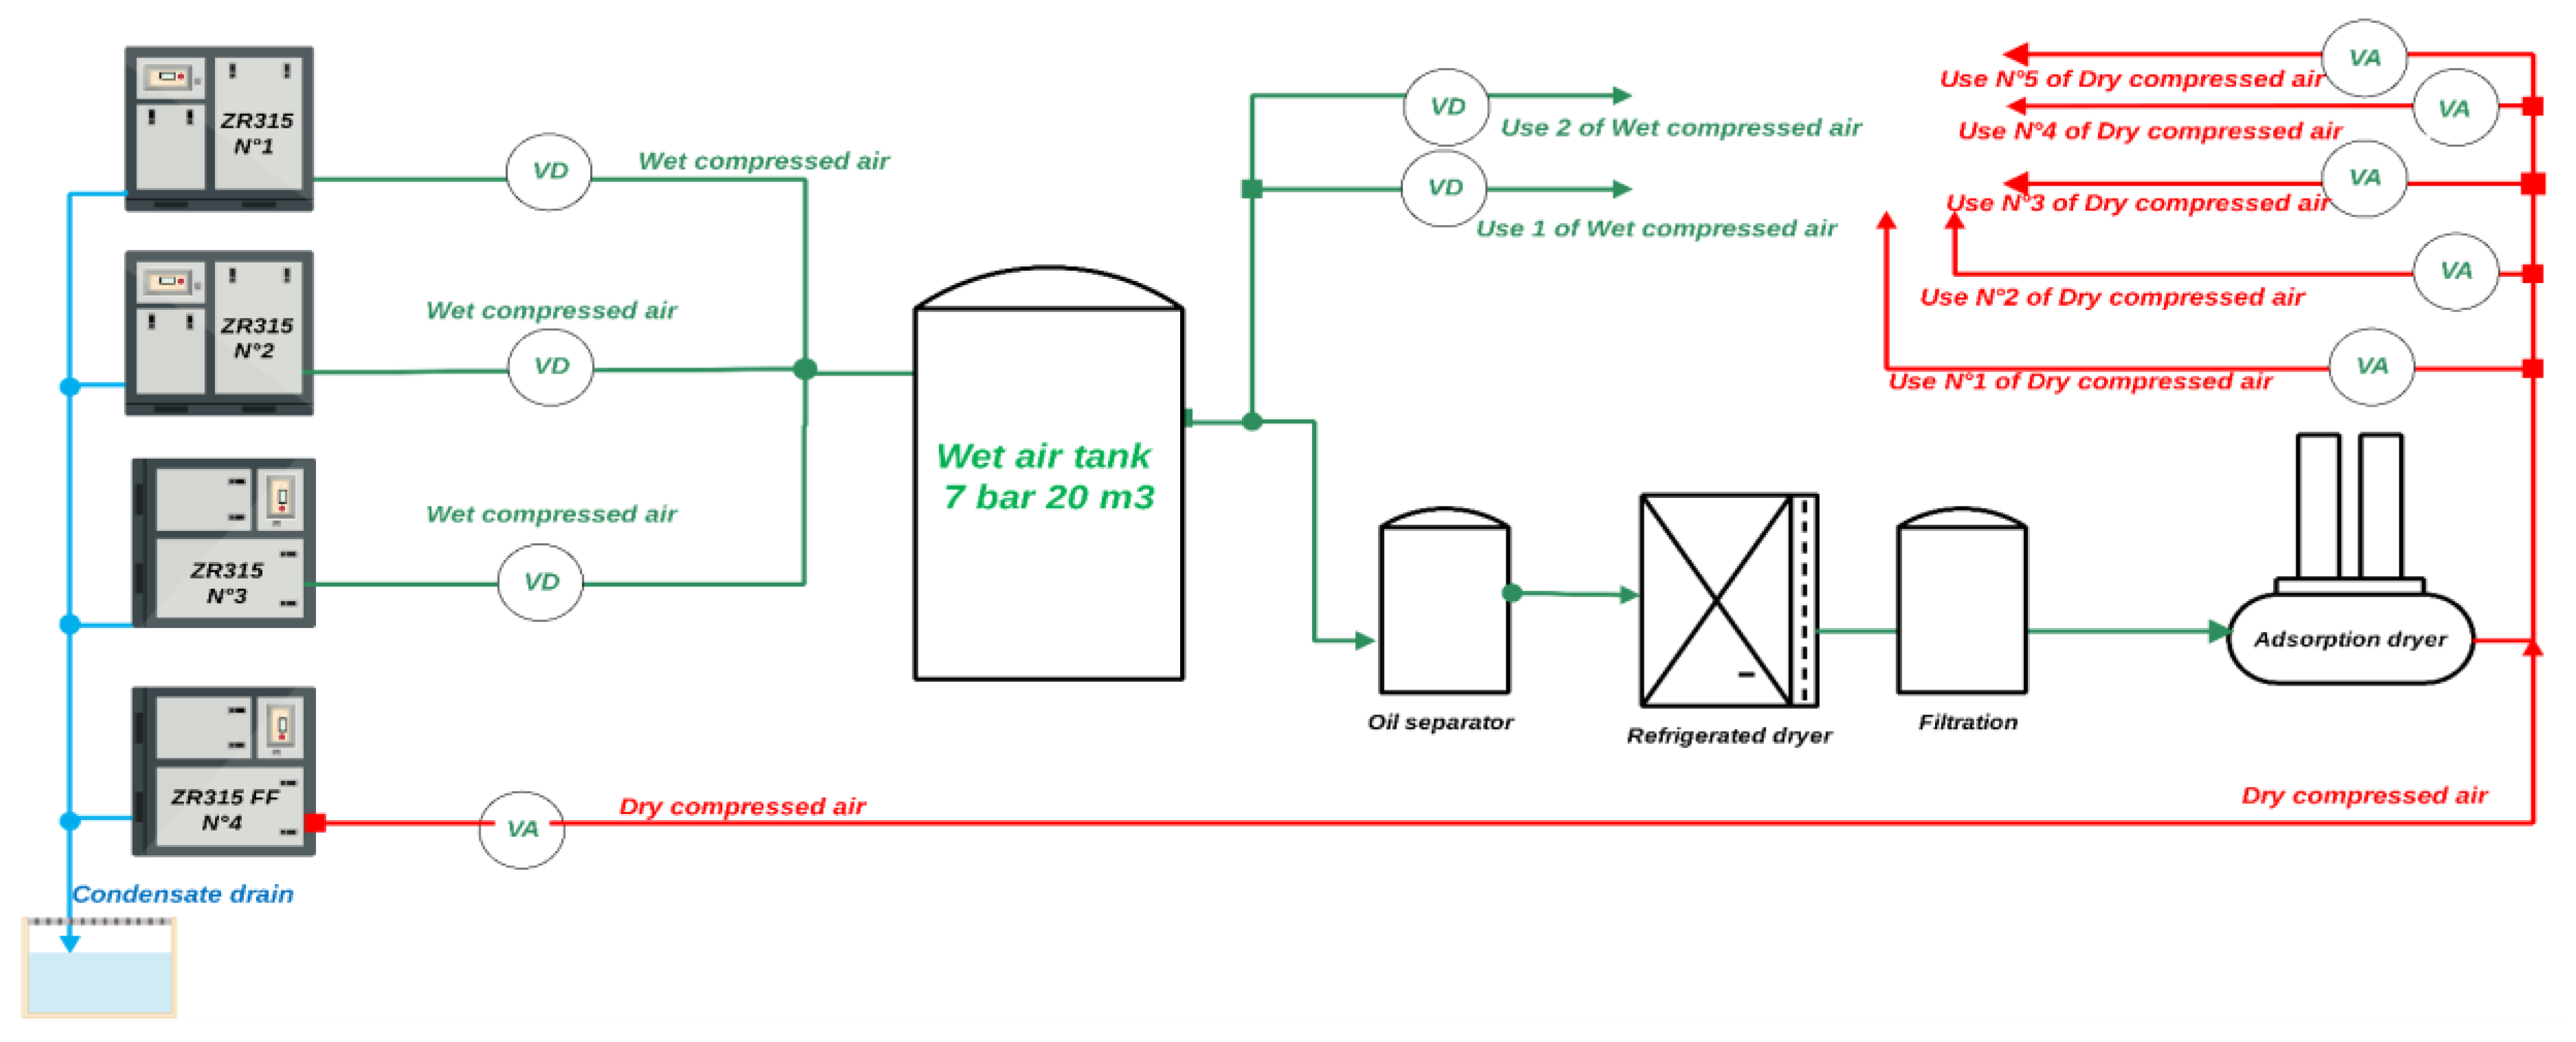
The specific compressor under investigation, Compressor N°4 in Figure 10, is a pivotal component in the system and is distinguished by its incorporation of both a Variable Speed Drive (VSD) and a specialized integrated dryer.
The inclusion of the VSD allows for dynamic adjustment of the motor speed to precisely match air demand, which is crucial for achieving significant energy savings and optimizing overall system efficiency. More importantly for this study, this particular unit is configured to harness the inherent heat waste generated during the compression cycle. This recovered thermal energy is strategically channeled and utilized as the primary heat source for the subsequent drying process within the integrated Dryer unit. This sophisticated heat recovery mechanism not only reduces the energy required for air drying but also serves as an effective method for minimizing the overall thermal rejection to the environment, thereby enhancing the sustainability and cost-effectiveness of the entire compressed air station operation.
The table below compares the four compressors using measured data (compressed air output flow and electrical power input).
Table 3.
Comparative data collected on 18/11/2025 for all four compressors. Compressors 2 and 4 utilize Variable Speed Drive (VSD) technology, whereas compressors 1 and 3 are fixed-speed units.
Table 3.
Comparative data collected on 18/11/2025 for all four compressors. Compressors 2 and 4 utilize Variable Speed Drive (VSD) technology, whereas compressors 1 and 3 are fixed-speed units.
| Compressor | Electrical Power in (kW) | Compressed Air Output Flow (Nm3/h) | Specific Energy Consumption (Wh/Nm3) |
|---|---|---|---|
| N°4 | 90.82 | 869.69 | 104.43 |
| N°1 | 314.75 | 2155.20 | 146.04 |
| N°2 | 223.95 | 1584.54 | 141.34 |
| N°3 | 320.03 | 2190.55 | 146.09 |
Compressor N°4 is the most energy-efficient unit, consuming only 104 Wh of electricity per 1 Nm3 of dry compressed air produced. This translates to a 28.5% energy saving compared to Compressors N°1 and N°3, which both require 146 Wh for 1 Nm³ of wet compressed air. Given its superior efficiency and the combined process of producing and drying compressed air, our evaluation will focus exclusively on Compressor N°4. The primary goal is to accurately determine the volume of condensate water generated as a by-product of its air production process.
3.1. Atlas Copco ZR315 VSD FF Compressor N°4 Specifications:
The Atlas Copco ZR315 VSD FF is a 315 kW, oil-free, water-cooled rotary screw air compressor. It utilizes Variable Speed Drive (VSD) technology, allowing the motor speed to automatically adapt to air demand, which can achieve energy savings of up to 35% compared to fixed-speed compressors [32]. This model delivers Class 0 certified oil-free compressed air, making it an excellent choice for purity-critical sectors such as food and beverage, pharmaceutical, electronics, and textile industries. Furthermore, its water-cooled (Full Feature) design offers potential for heat recovery.
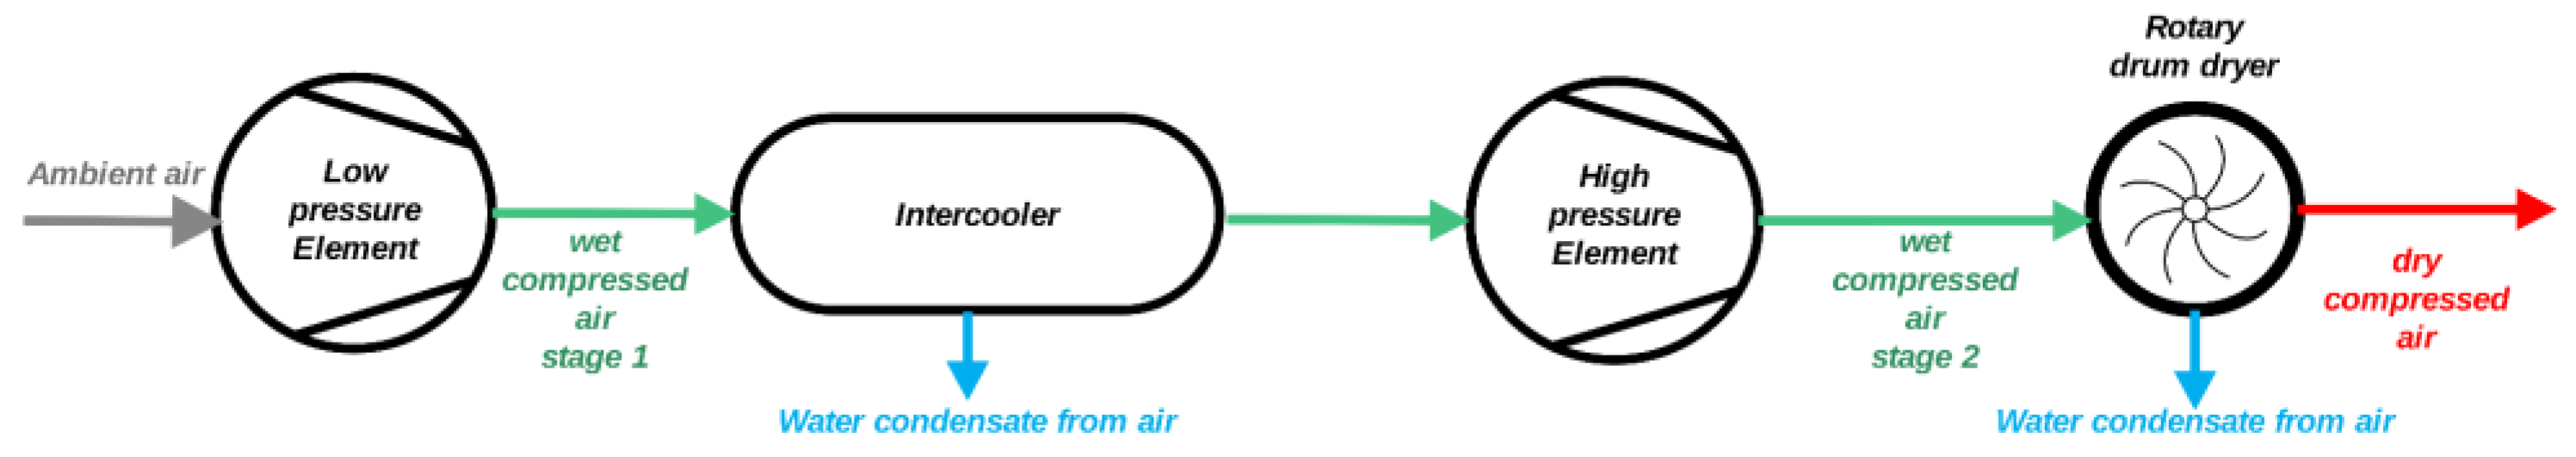
The compressed air drying process, illustrated schematically in Figure 11, is a two-stage system combining compression and heat exchange to remove moisture.
- -
-
Air Intake and Compression: Air enters the system and is processed through two modules:
- Module 1: Contains a low-pressure element, its associated heat exchanger, and an oil pump.
- Module 2: Contains a high-pressure element with similar components. Both modules compress the air, and the heat exchangers manage the resulting temperature increase, while oil pumps provide necessary lubrication and cooling.
- -
- Intercooling and Condensate Formation: The compressed air moves to an intercooler. Here, cooling water absorbs heat, causing water condensate to form and be expelled from the system.
- -
- Final Drying: The air then passes through a rotary drum dryer, which includes an additional heat exchanger. This stage achieves further moisture removal through a combination of heat exchange and mechanical drying, producing the final water condensate.
During the compression process, cooling water continuously circulates, entering the system at various points to dissipate the heat generated. This water absorbs thermal energy and exits, a process that ensures effective moisture removal, resulting in dry compressed air suitable for diverse industrial uses.
This study will focus on condensate water, a byproduct of the compression process. Our objective is to quantify its potential for reuse, aiming to convert this waste stream into high-quality demineralized water.
Figures 12, 13, and 14 present photographs and a 3D model of the Atlas Copco ZR315 FF compressor, highlighting its seven essential components: the low and high-pressure elements (1), the monitoring system (2), the electrical motor (3), the VSD module (4), the intercooler (5), the zero-loss drains (6), and the rotary drum dryer (10).
Figure 11.
The Process Flow Diagram (PFD) for compressed air production in Atlas Copco ZR315 FF compressor with 3 flows: Oil (yellow), air (light blue), and cooling Water (blue) [33].
Figure 11.
The Process Flow Diagram (PFD) for compressed air production in Atlas Copco ZR315 FF compressor with 3 flows: Oil (yellow), air (light blue), and cooling Water (blue) [33].
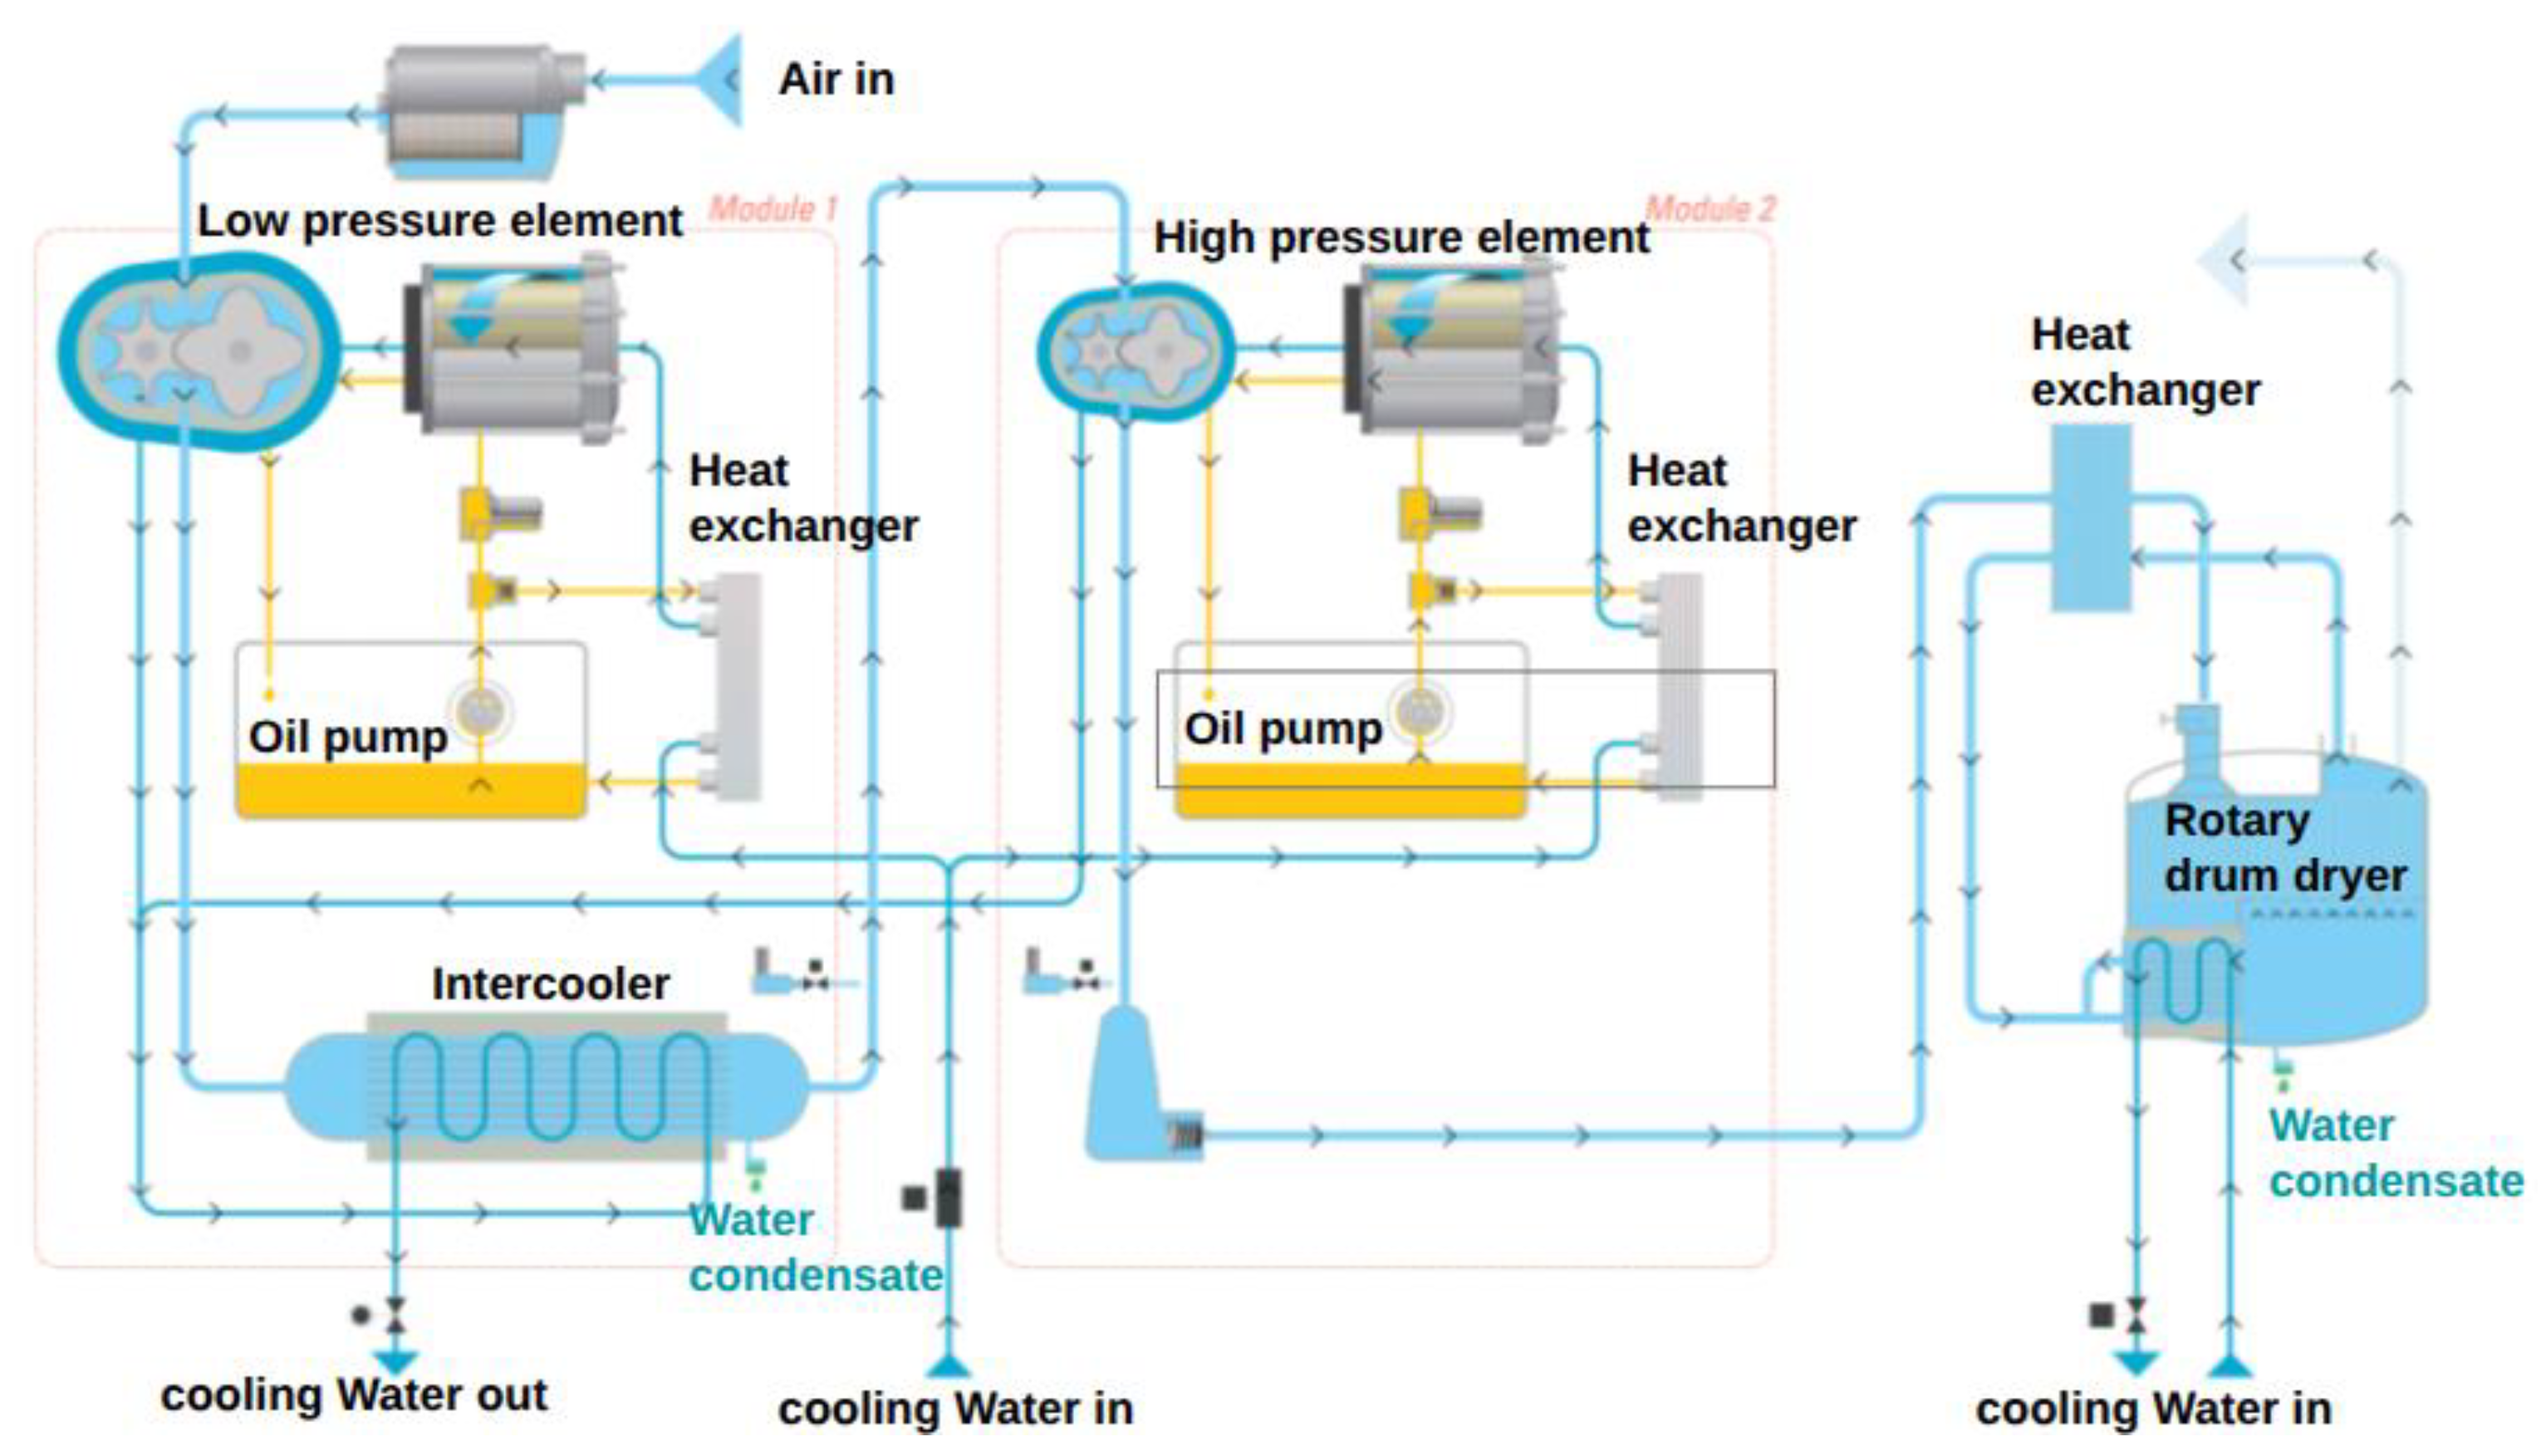
Figure 12.
The 3D model of an Atlas Copco ZR 200-355 VSD⁺ FF (iMDG) [33].
Figure 12.
The 3D model of an Atlas Copco ZR 200-355 VSD⁺ FF (iMDG) [33].
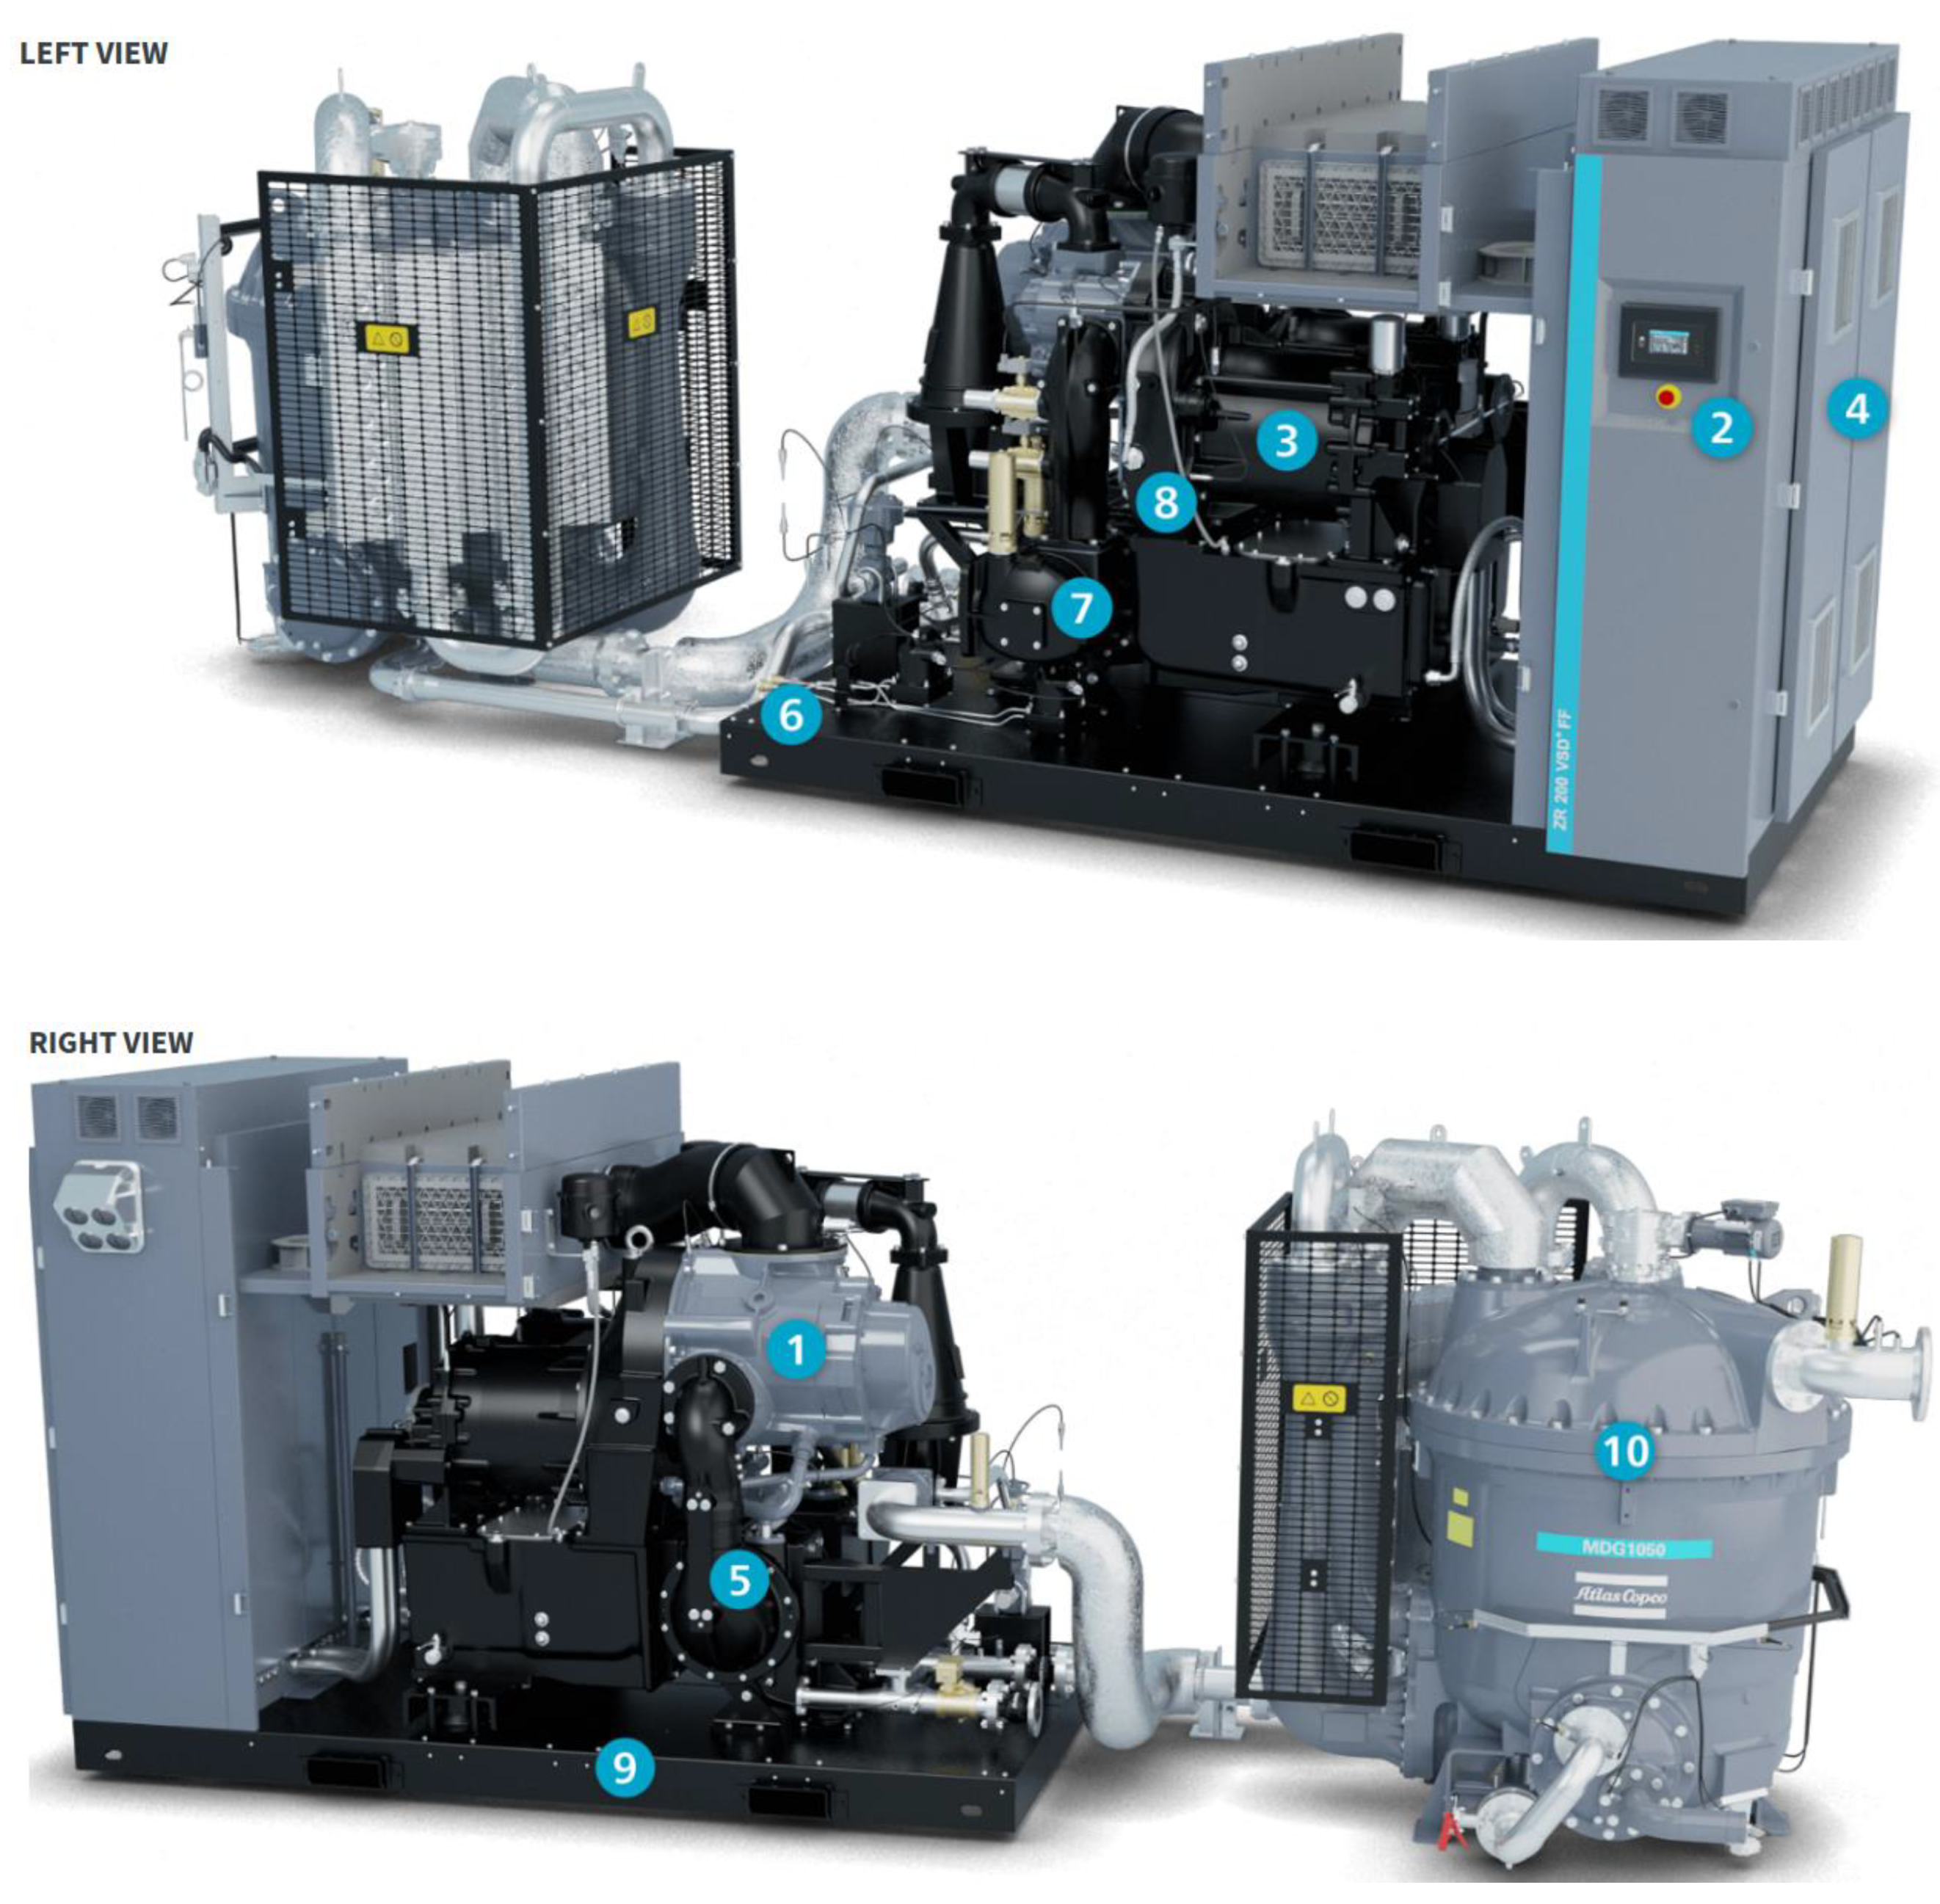
Figure 13.
Picture and schematic of the rotary drum dryer (N°10 in Figure 12) of compressor N° 4 during the annual maintenance in August 2025.
Figure 13.
Picture and schematic of the rotary drum dryer (N°10 in Figure 12) of compressor N° 4 during the annual maintenance in August 2025.
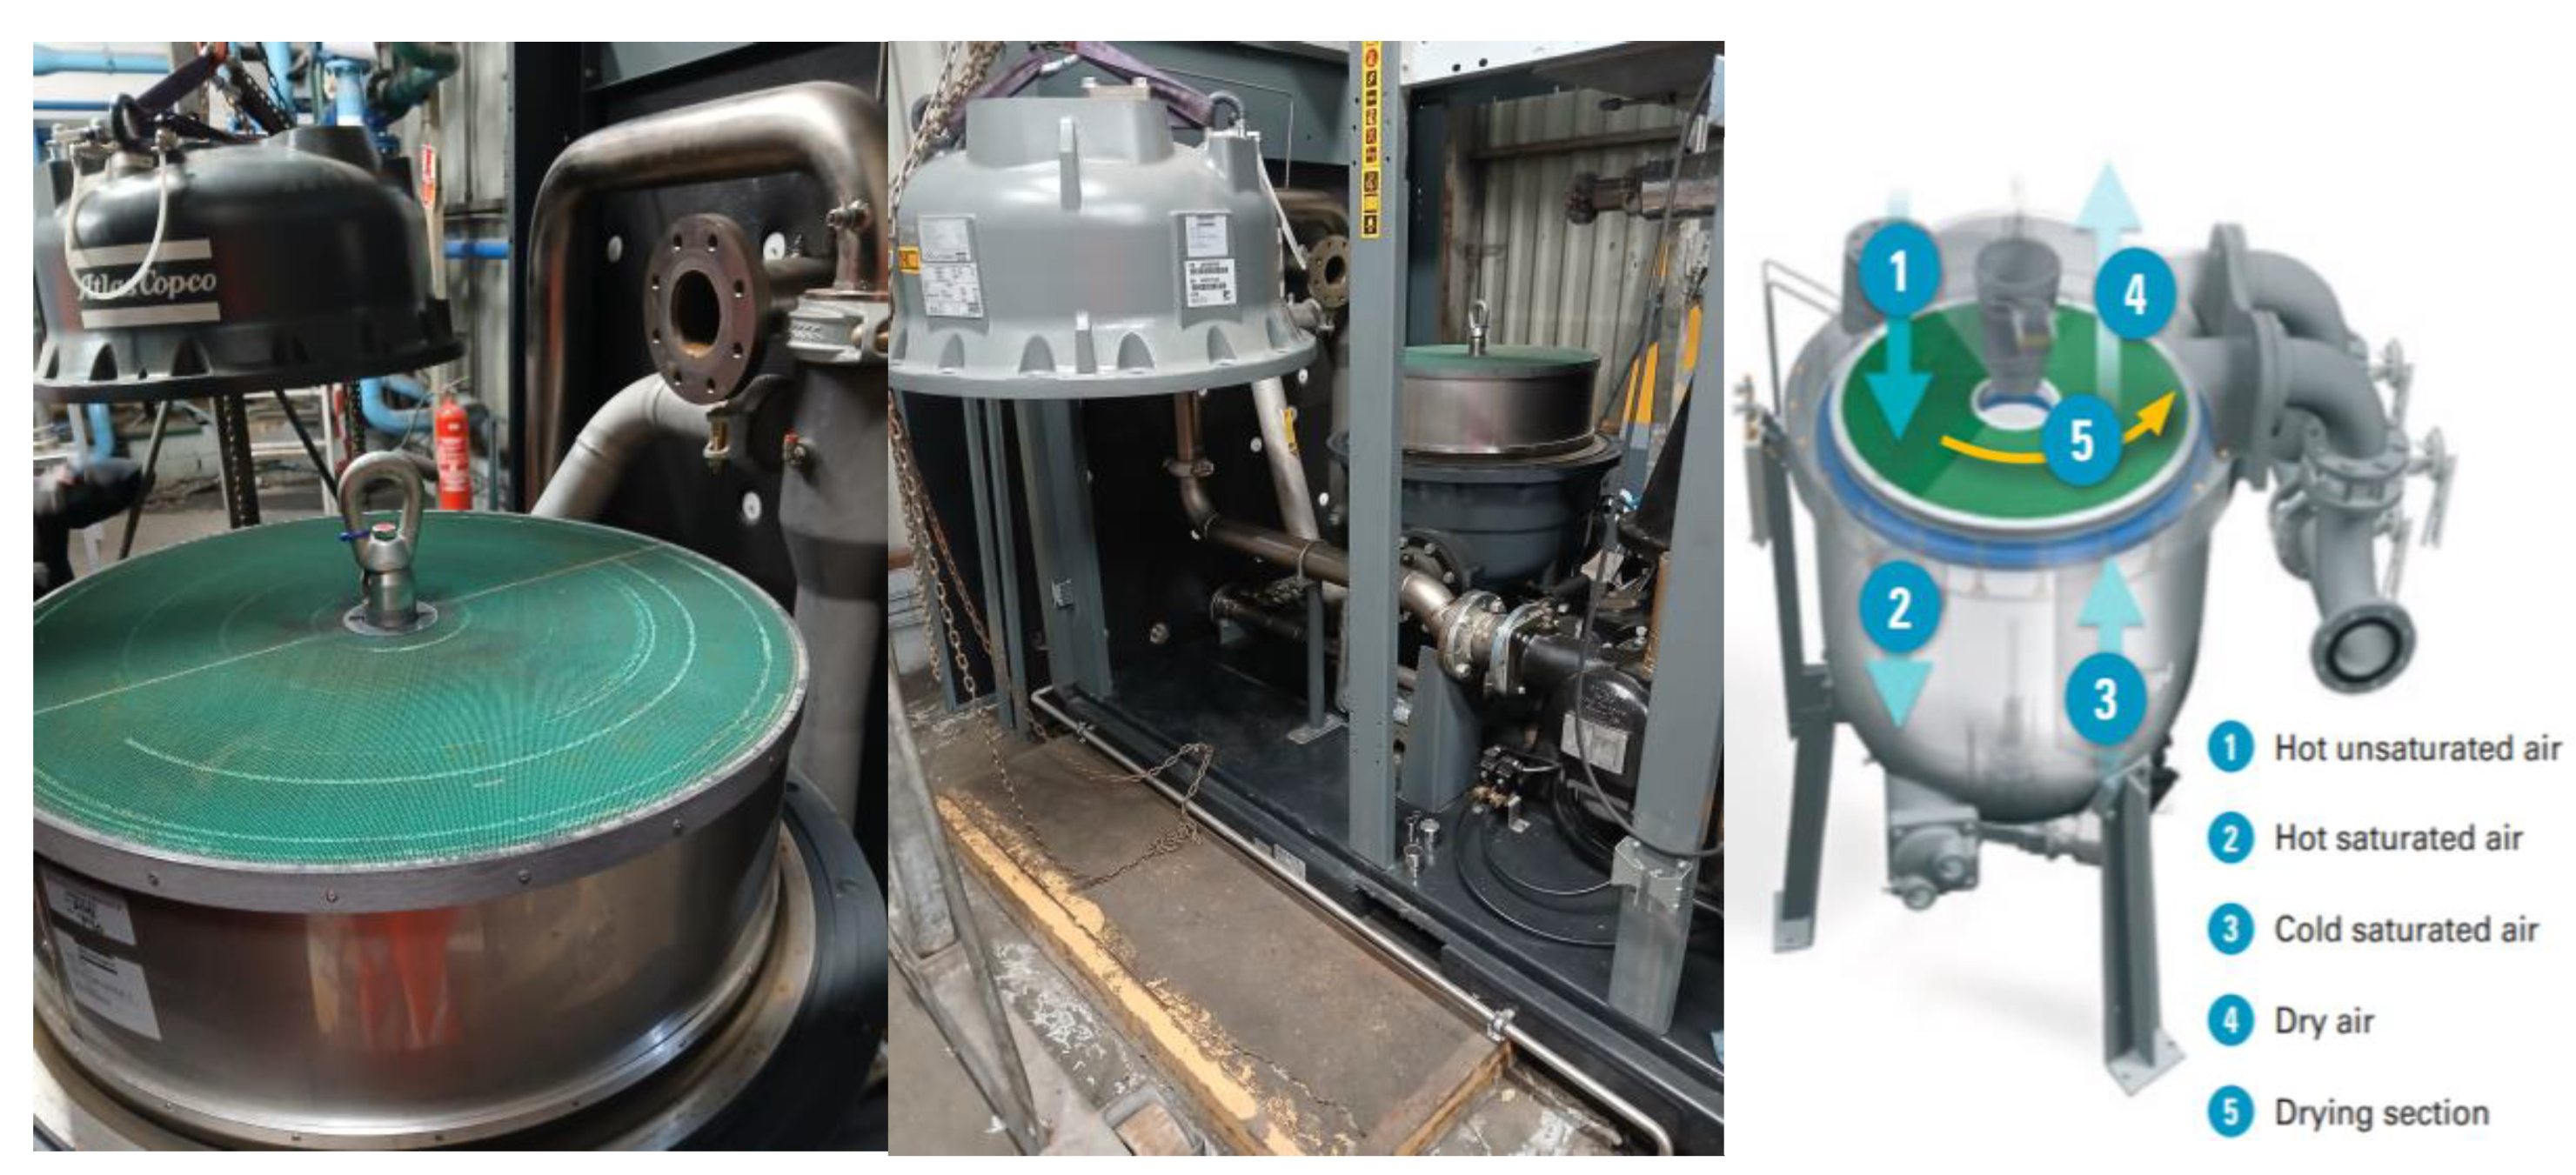
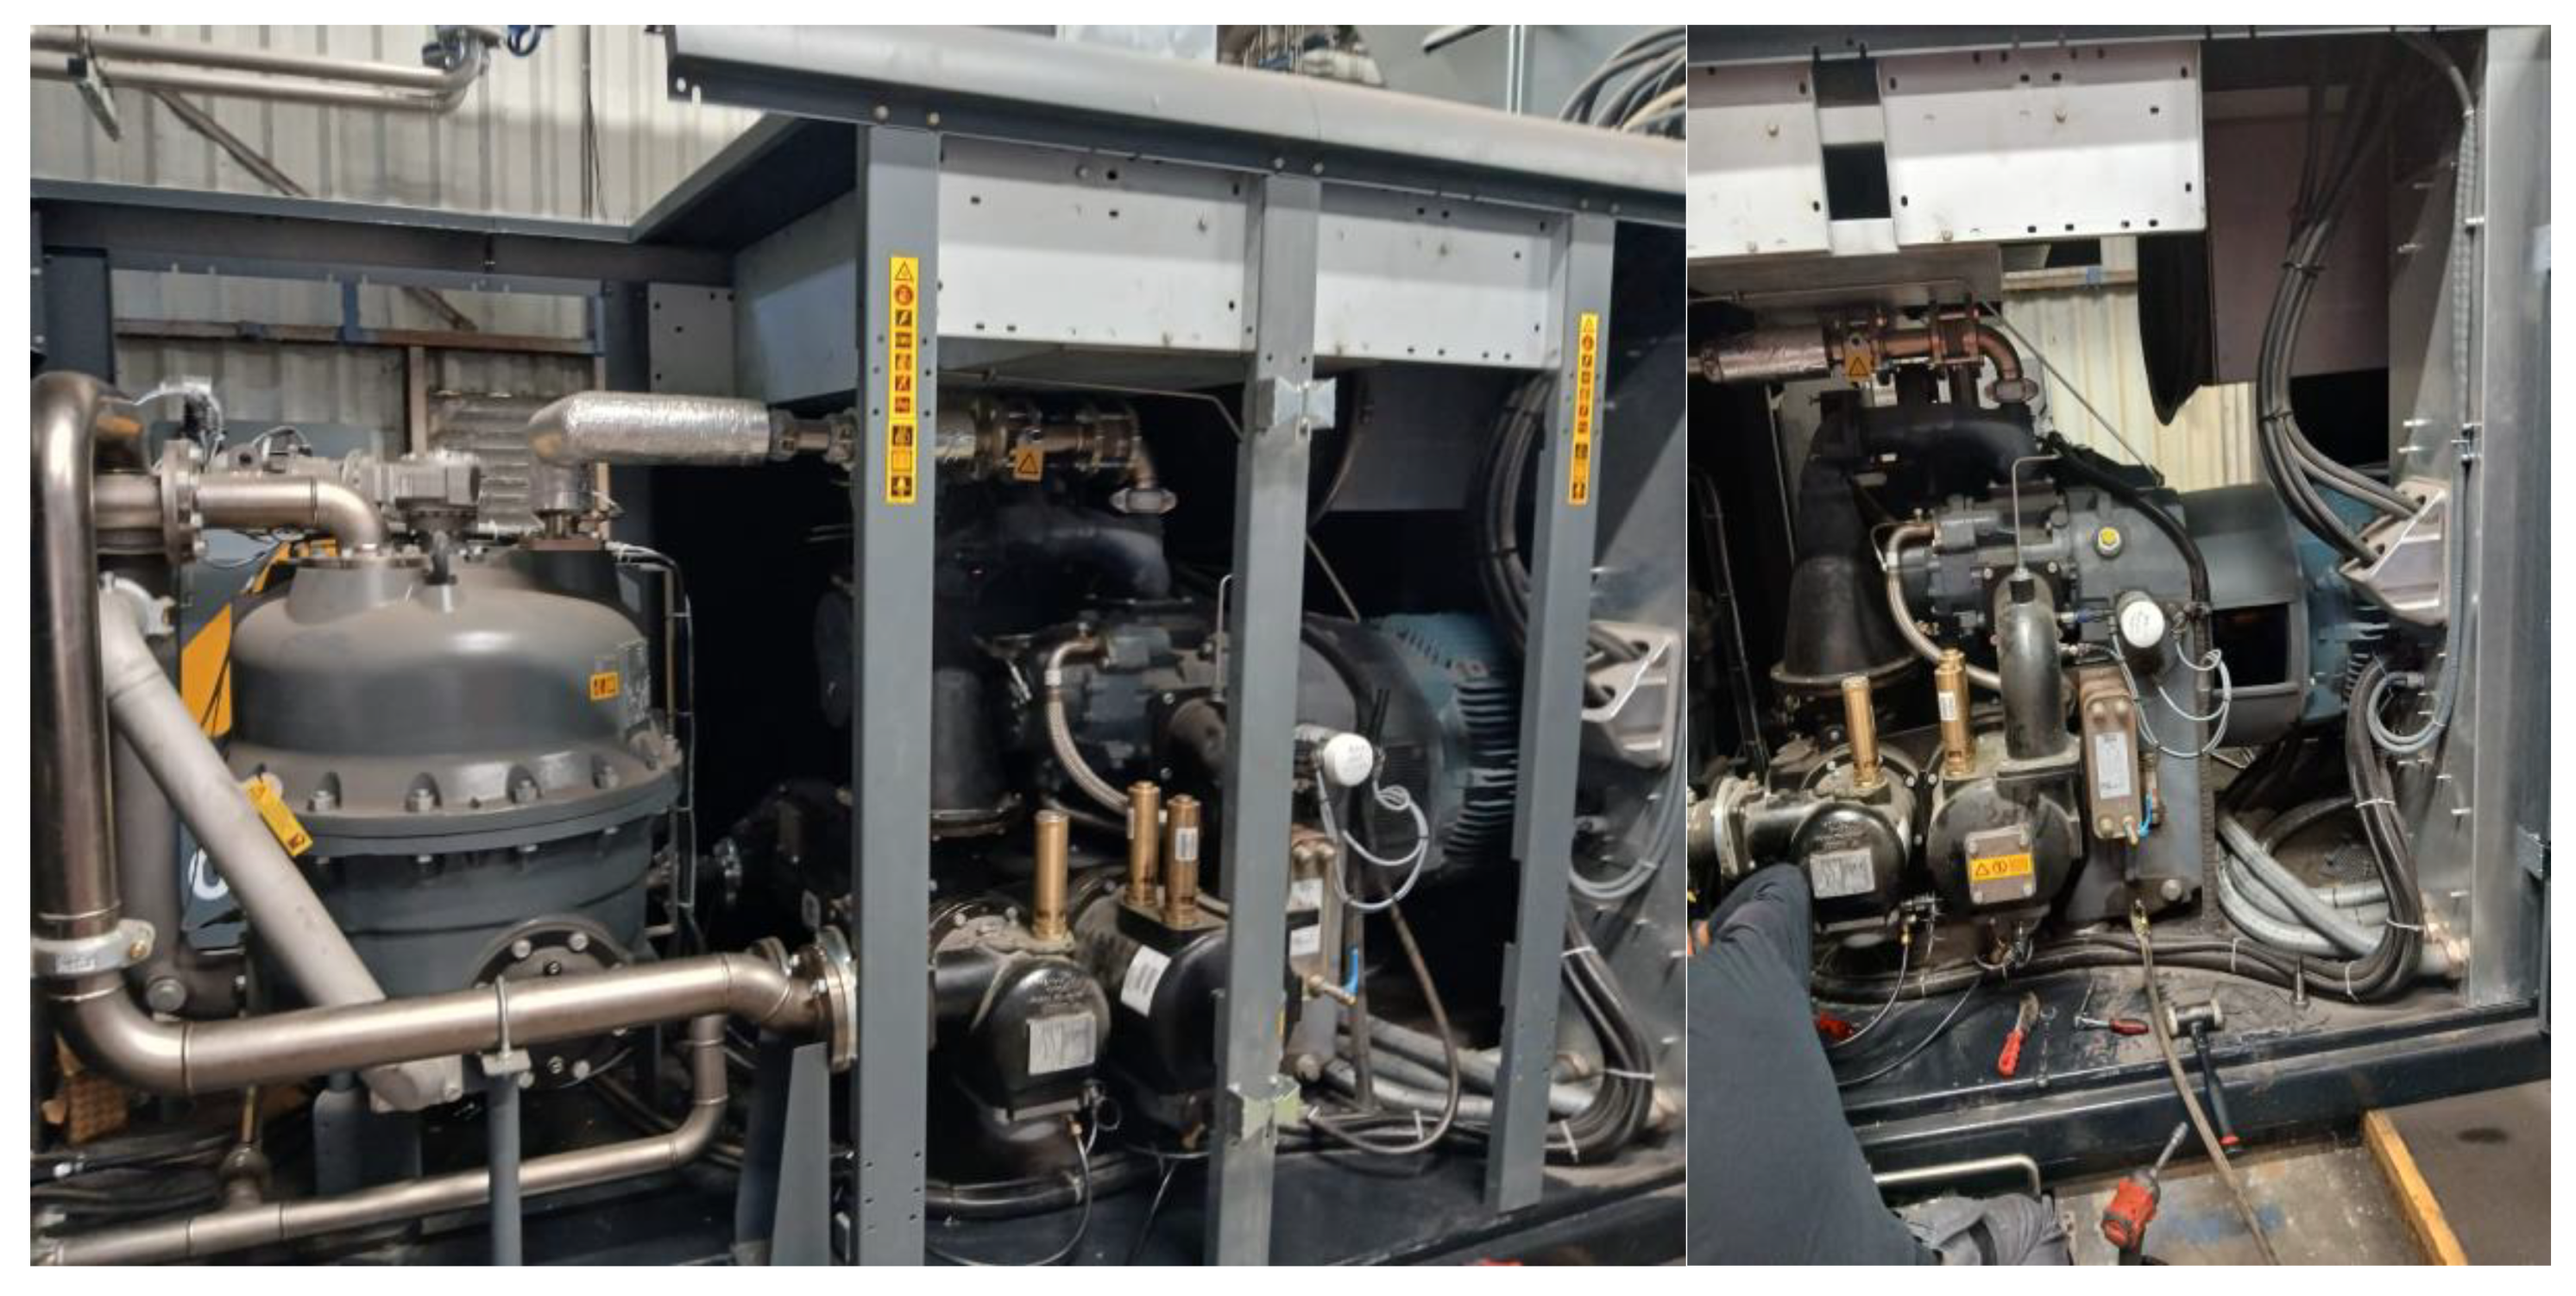
Figure 14.
Picture of the compressor N°4 with all components during the annual maintenance.
3.2. Assessment of Condensate Water Production: Quantity and Quality Analysis for the Atlas Copco ZR315 VSD FF Compressor
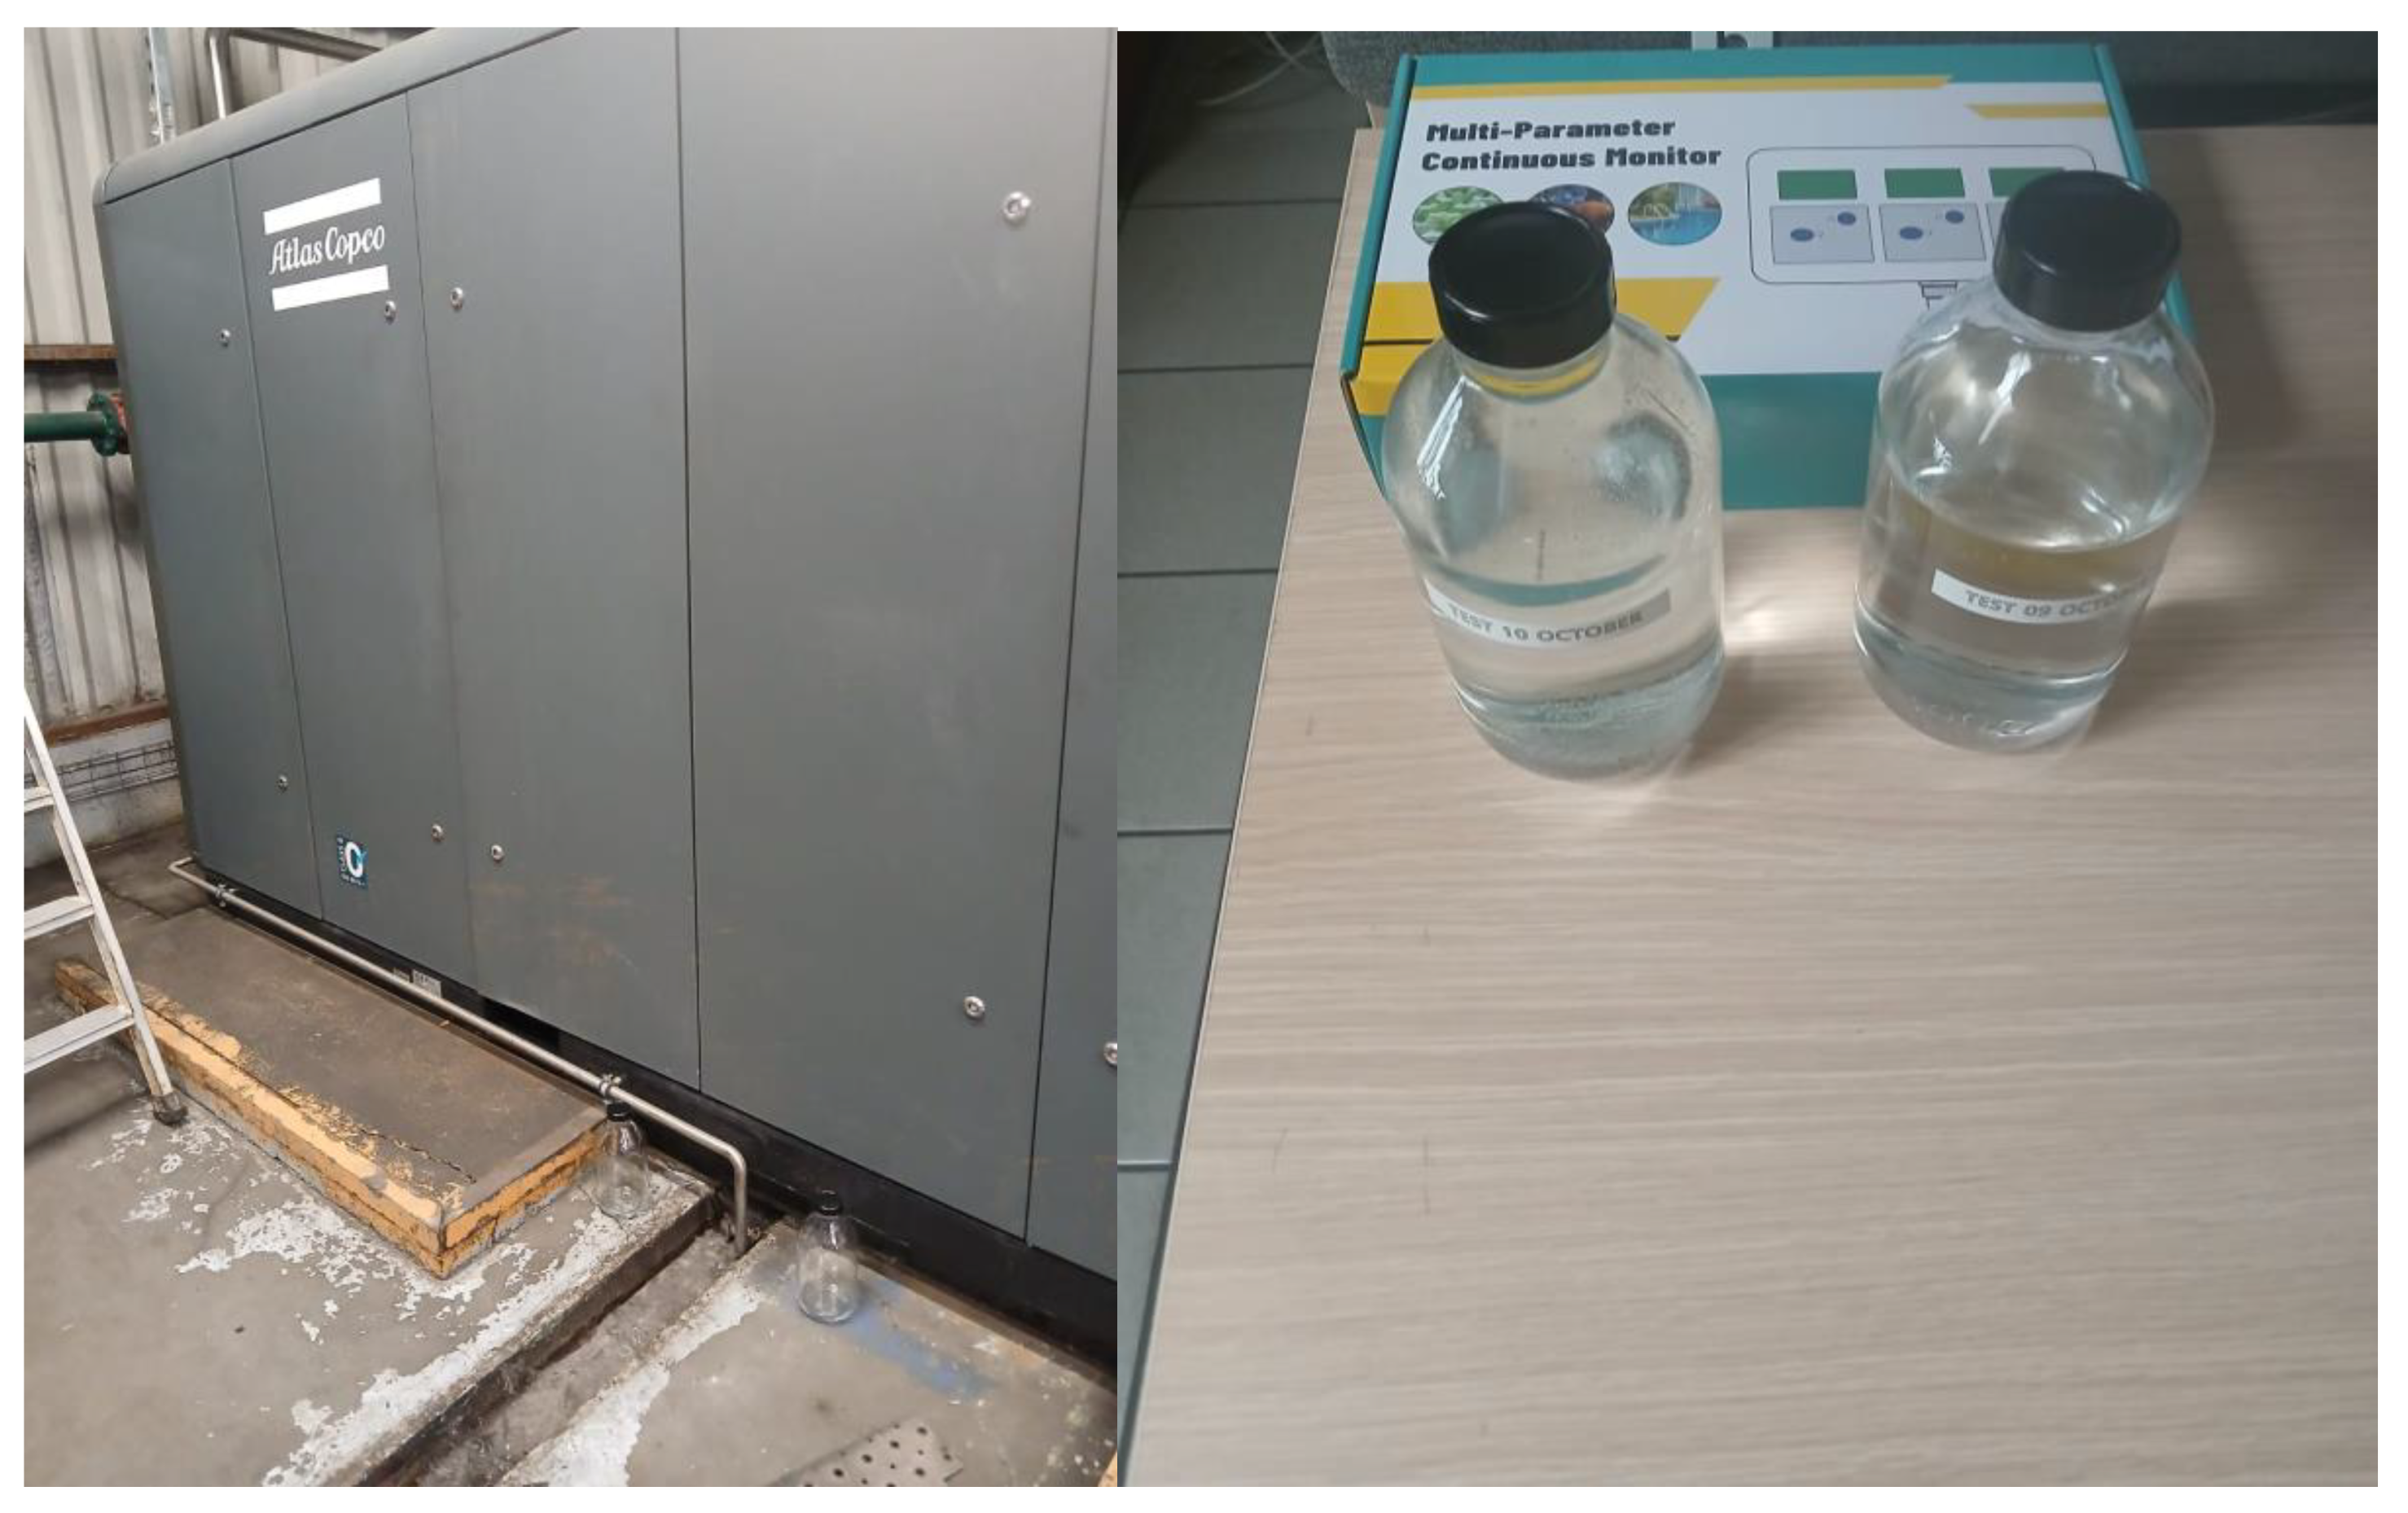
The Atlas Copco ZR315 VSD FF compressor (Unit N°4), which features an integrated dryer, generates water condensate at two separate points within the compressed air system: the intercooler and the rotary drum dryer (see Figure 15).
Figure 15.
Diagram of compressed air system with two condensate streams in compressor N°4.
To assess the volume and characteristics of this water condensate, three distinct measurement tests were performed on October 9th, October 10th, and November 20th (representing the colder period).
Figure 16.
Picture of the compressor N°4’s condensate drain and the two bottles used for separate field measurements on October 9th and 10th.
Figure 16.
Picture of the compressor N°4’s condensate drain and the two bottles used for separate field measurements on October 9th and 10th.
3.2.1. Quantity of Condensate Water Production
To establish a baseline for the study, the initial step involved contacting Atlas Copco’s technical service in France to acquire the manufacturer-reported condensate production quantity for the Atlas Copco ZR315 VSD FF air compressor. The provided data [34], which includes the condensate production rate, is summarized in Table 4 and visually represented in Figure 17. The figure identifies three distinct climate scenarios, each associated with a highly correlated tendency equation (R² > 0.996) for the condensate flow rate.
Figure 17.
Atlas Copco France product testing data compares the compressed air ZR 315 VSD load ratio with the condensate flow rate across three climate conditions [34].
Figure 17.
Atlas Copco France product testing data compares the compressed air ZR 315 VSD load ratio with the condensate flow rate across three climate conditions [34].
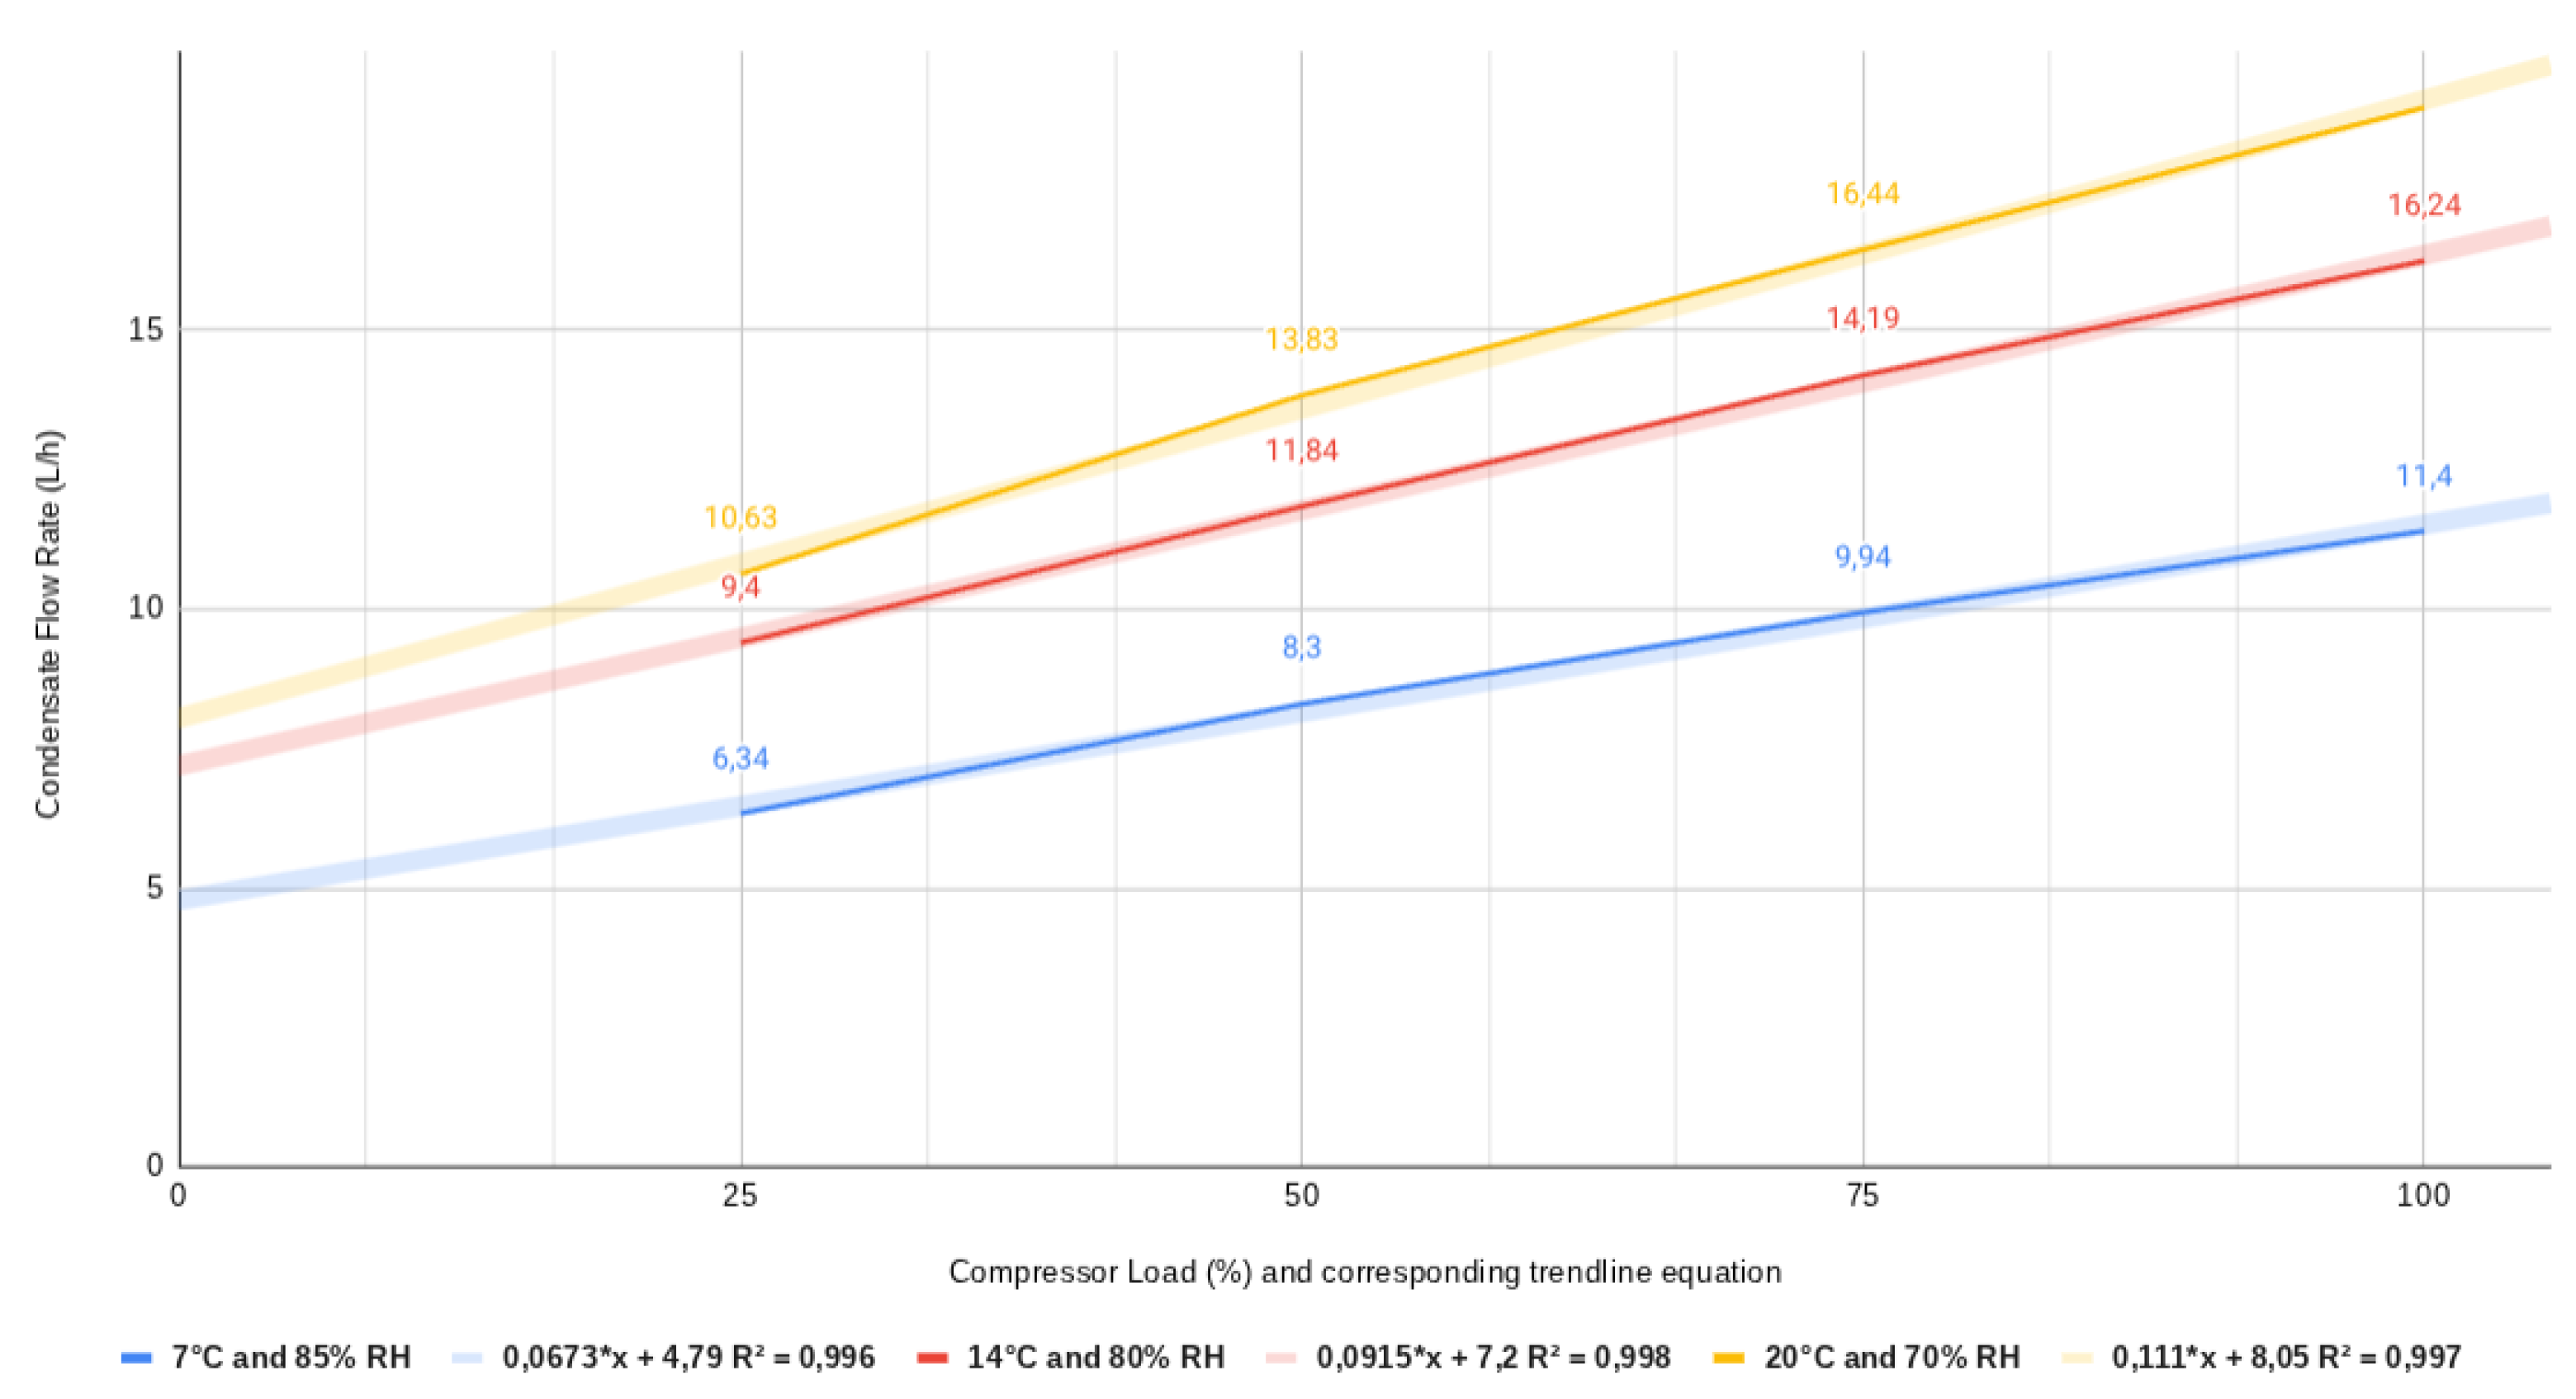
Table 4.
The product testing data from Atlas Copco France focuses on comparing the condensate flow rate of the ZR 315 VSD compressed air unit against its load ratio, specifically across three different climate conditions (7 °C , 85%), (14 °C, 80%) and (20 °C, 70%) [34].
Table 4.
The product testing data from Atlas Copco France focuses on comparing the condensate flow rate of the ZR 315 VSD compressed air unit against its load ratio, specifically across three different climate conditions (7 °C , 85%), (14 °C, 80%) and (20 °C, 70%) [34].
| ZR 315 VSD Compressor Load | Ambient Temperature | Relative Humidity | Flow Rate of the Condensate Water |
|---|---|---|---|
| 25% | 7 °C | 85% | 6.34 liters/hour |
| 50% | 7 °C | 85% | 8.3 liters/hour |
| 75% | 7 °C | 85% | 9.94 liters/hour |
| 100% | 7 °C | 85% | 11.4 liters/hour |
| 25% | 14 °C | 80% | 9.04 liters/hour |
| 50% | 14 °C | 80% | 11.84 liters/hour |
| 75% | 14 °C | 80% | 14.19 liters/hour |
| 100% | 14 °C | 80% | 16.24 liters/hour |
| 25% | 20 °C | 70% | 10.63 liters/hour |
| 50% | 20 °C | 70% | 13.83 liters/hour |
| 75% | 20 °C | 70% | 16.44 liters/hour |
| 100% | 20 °C | 70% | 18.99 liters/hour |
To assess the feasibility of recovering and recycling condensate water from Atlas Copco ZR315 FF industrial air compressors, a data collection campaign was carried out. This involved measuring the operational and chemical parameters of the condensate water.
Data was gathered across three testing days: October 9th (baseline), October 10th (confirmation), and November 20th (final confirmation). All results are compiled in Table 5. The measured flow rate was found to be consistent with the value correlated to the trendline equation, which is influenced by the test temperature (°C) and relative humidity (%).
Table 5.
Comparative measured data collected on three separate testing days: October 9th (baseline), October 10th (confirmation), and November 20th (final confirmation).
Table 5.
Comparative measured data collected on three separate testing days: October 9th (baseline), October 10th (confirmation), and November 20th (final confirmation).
| Testing Date | Ambient Temperature | Relative humidity | Compressor N°4 VSD Load (%) | Flow Rate of the Condensate Water | Value Calculated Based on Trendline from Figure 17 |
|---|---|---|---|---|---|
| - 09/10/2025 from 16 : 21 to 16 : 24 | 18.4 °C | 62% | 33% | 12 liters/hour | 11.71 liters/hour |
| - 10/10/2025 from 15 : 06 to 15 : 09 | 13.4 °C | 78% | 80% | 15 liters/hour | 14.52 liters/hour |
| - 20/11/2025 from 15 : 57 to 16 : 02 | 5.4 °C | 62% | 80% | 10 liters/hour | 10.17 liters/hour |
The Variable Speed Drive (VSD) compressor N°4 demonstrates peak efficiency within a moderate-to-high load band, typically between 40% and 80% of their maximum capacity, measured in terms of Specific Energy Consumption (Wh/Nm3).
This technology allows the motor speed and air output to precisely match current demand, unlike fixed-speed compressors, thereby maximizing energy savings.
The optimal operating point was determined to be a compressor load of 80% to maximize these energy savings. For instance, reducing the speed (N) by 20% (N2 = 80% N1) results in a power reduction (P) to approximately 51% of the original power (P2 = P1 * (N2/N1)³ = P1 * 0.8³), leading to nearly 49% energy saving.
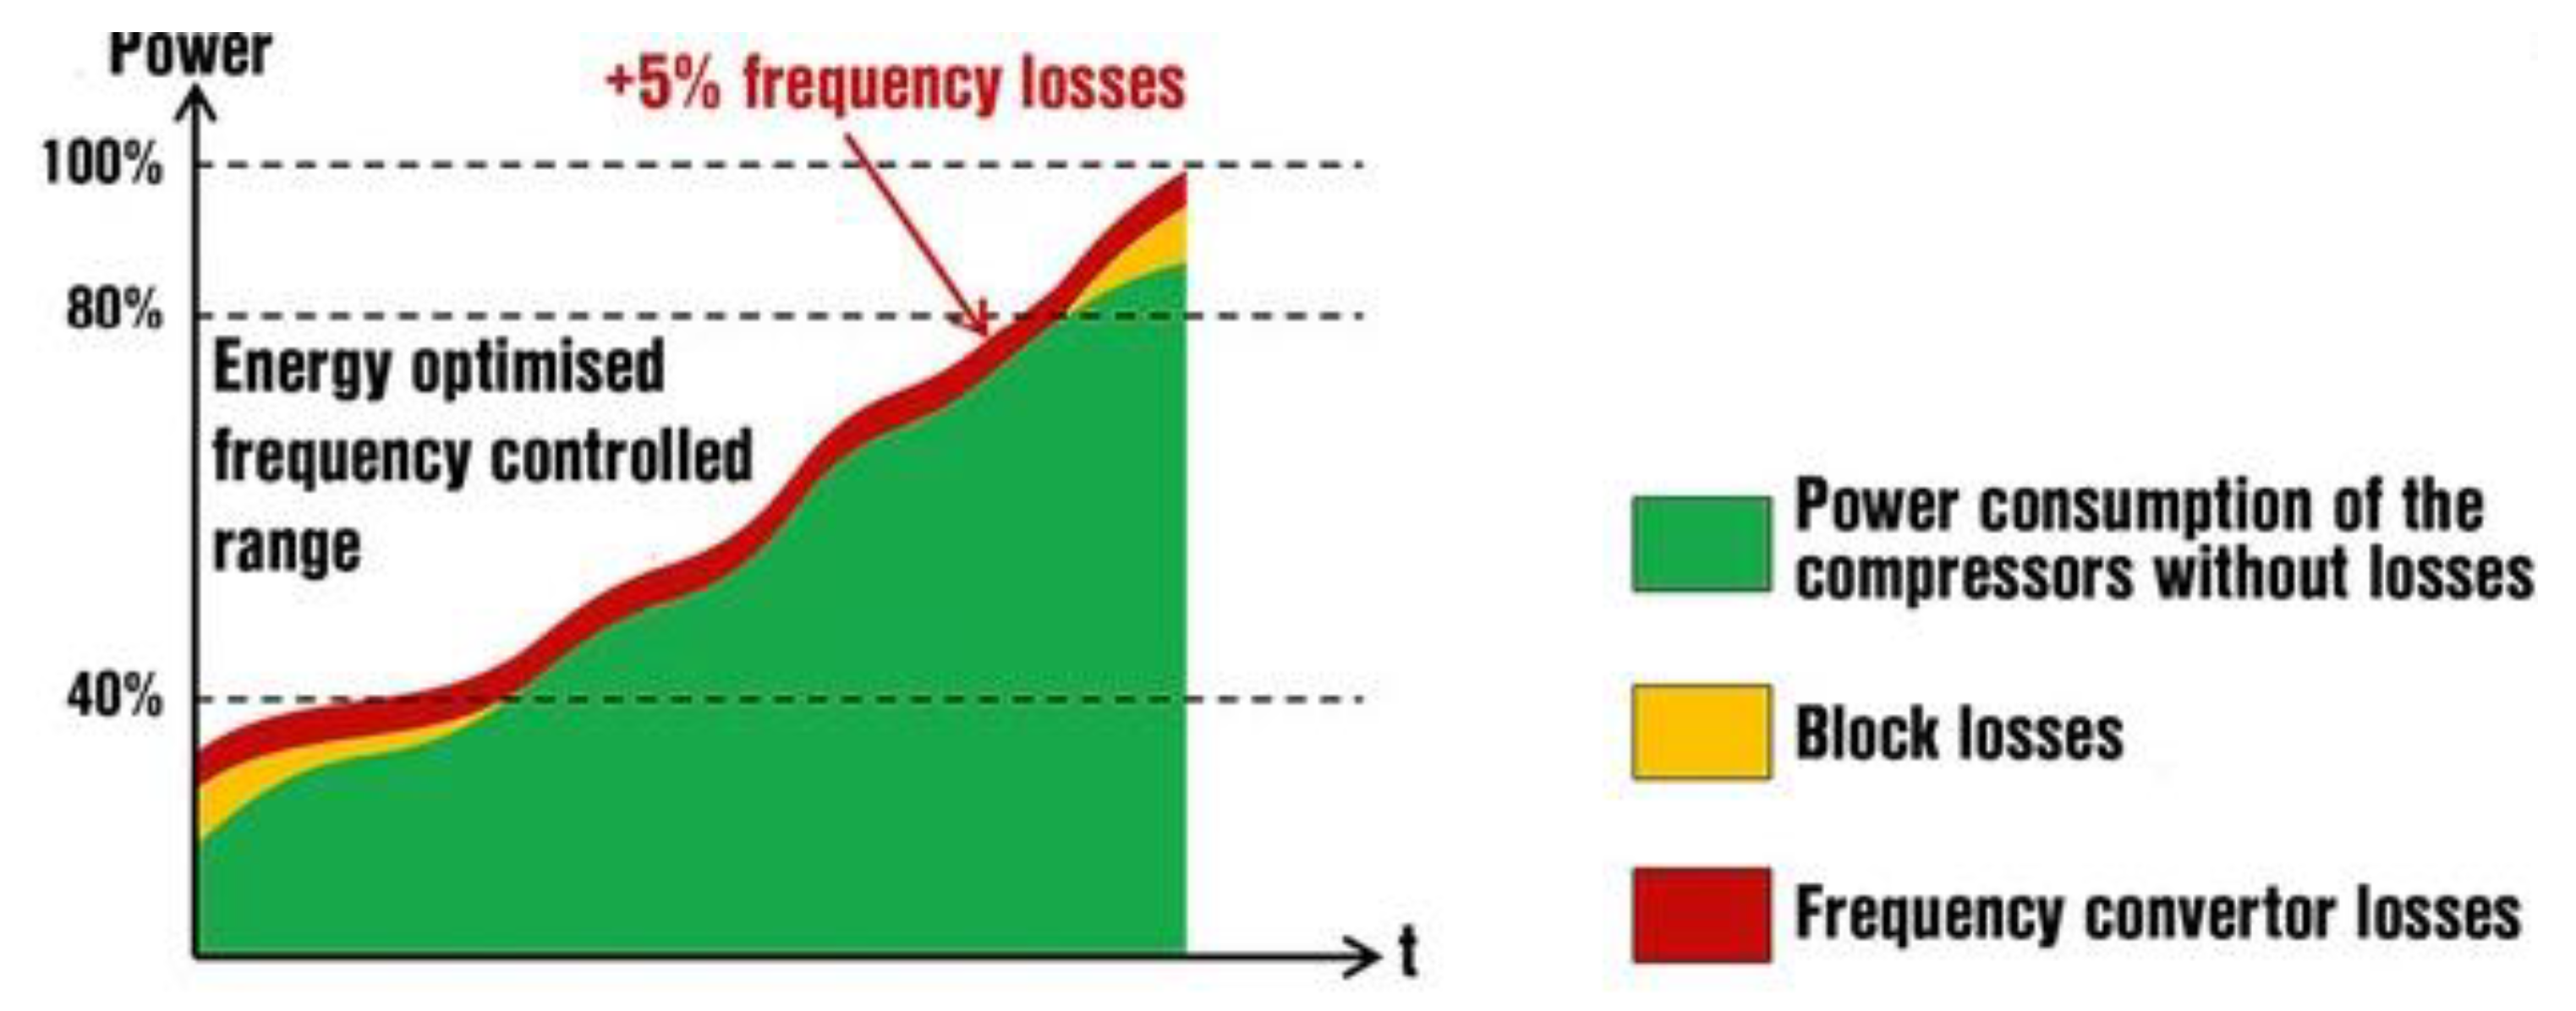
However, operating outside this optimal range compromises the VSD advantage. Below 40% load, the reduced motor and drive efficiency often negate the energy savings from the speed reduction. Conversely, above 80% load, the unit approaches maximum speed and behaves more like a less-efficient fixed-speed compressor [35]. This principle is visually confirmed by efficiency curves in Figure 18. Therefore, to realize the promised energy and cost savings, VSD compressors must be strategically utilized within their established, optimized loading ranges. Setting the target load at 80% places the operation firmly within this most efficient zone, effectively balancing high productivity with minimal electrical power consumption.
Figure 18.
VSD Compressors efficiency curves with three distinct zones: Green area: Power consumption of the compressors without losses (baseline efficiency); Yellow area: Block losses (mechanical and thermodynamic losses inherent to the compressor); Red area: Frequency converter losses (additional losses from variable frequency drive control) [35].
3.2.2. Quality of Condensate Water Production
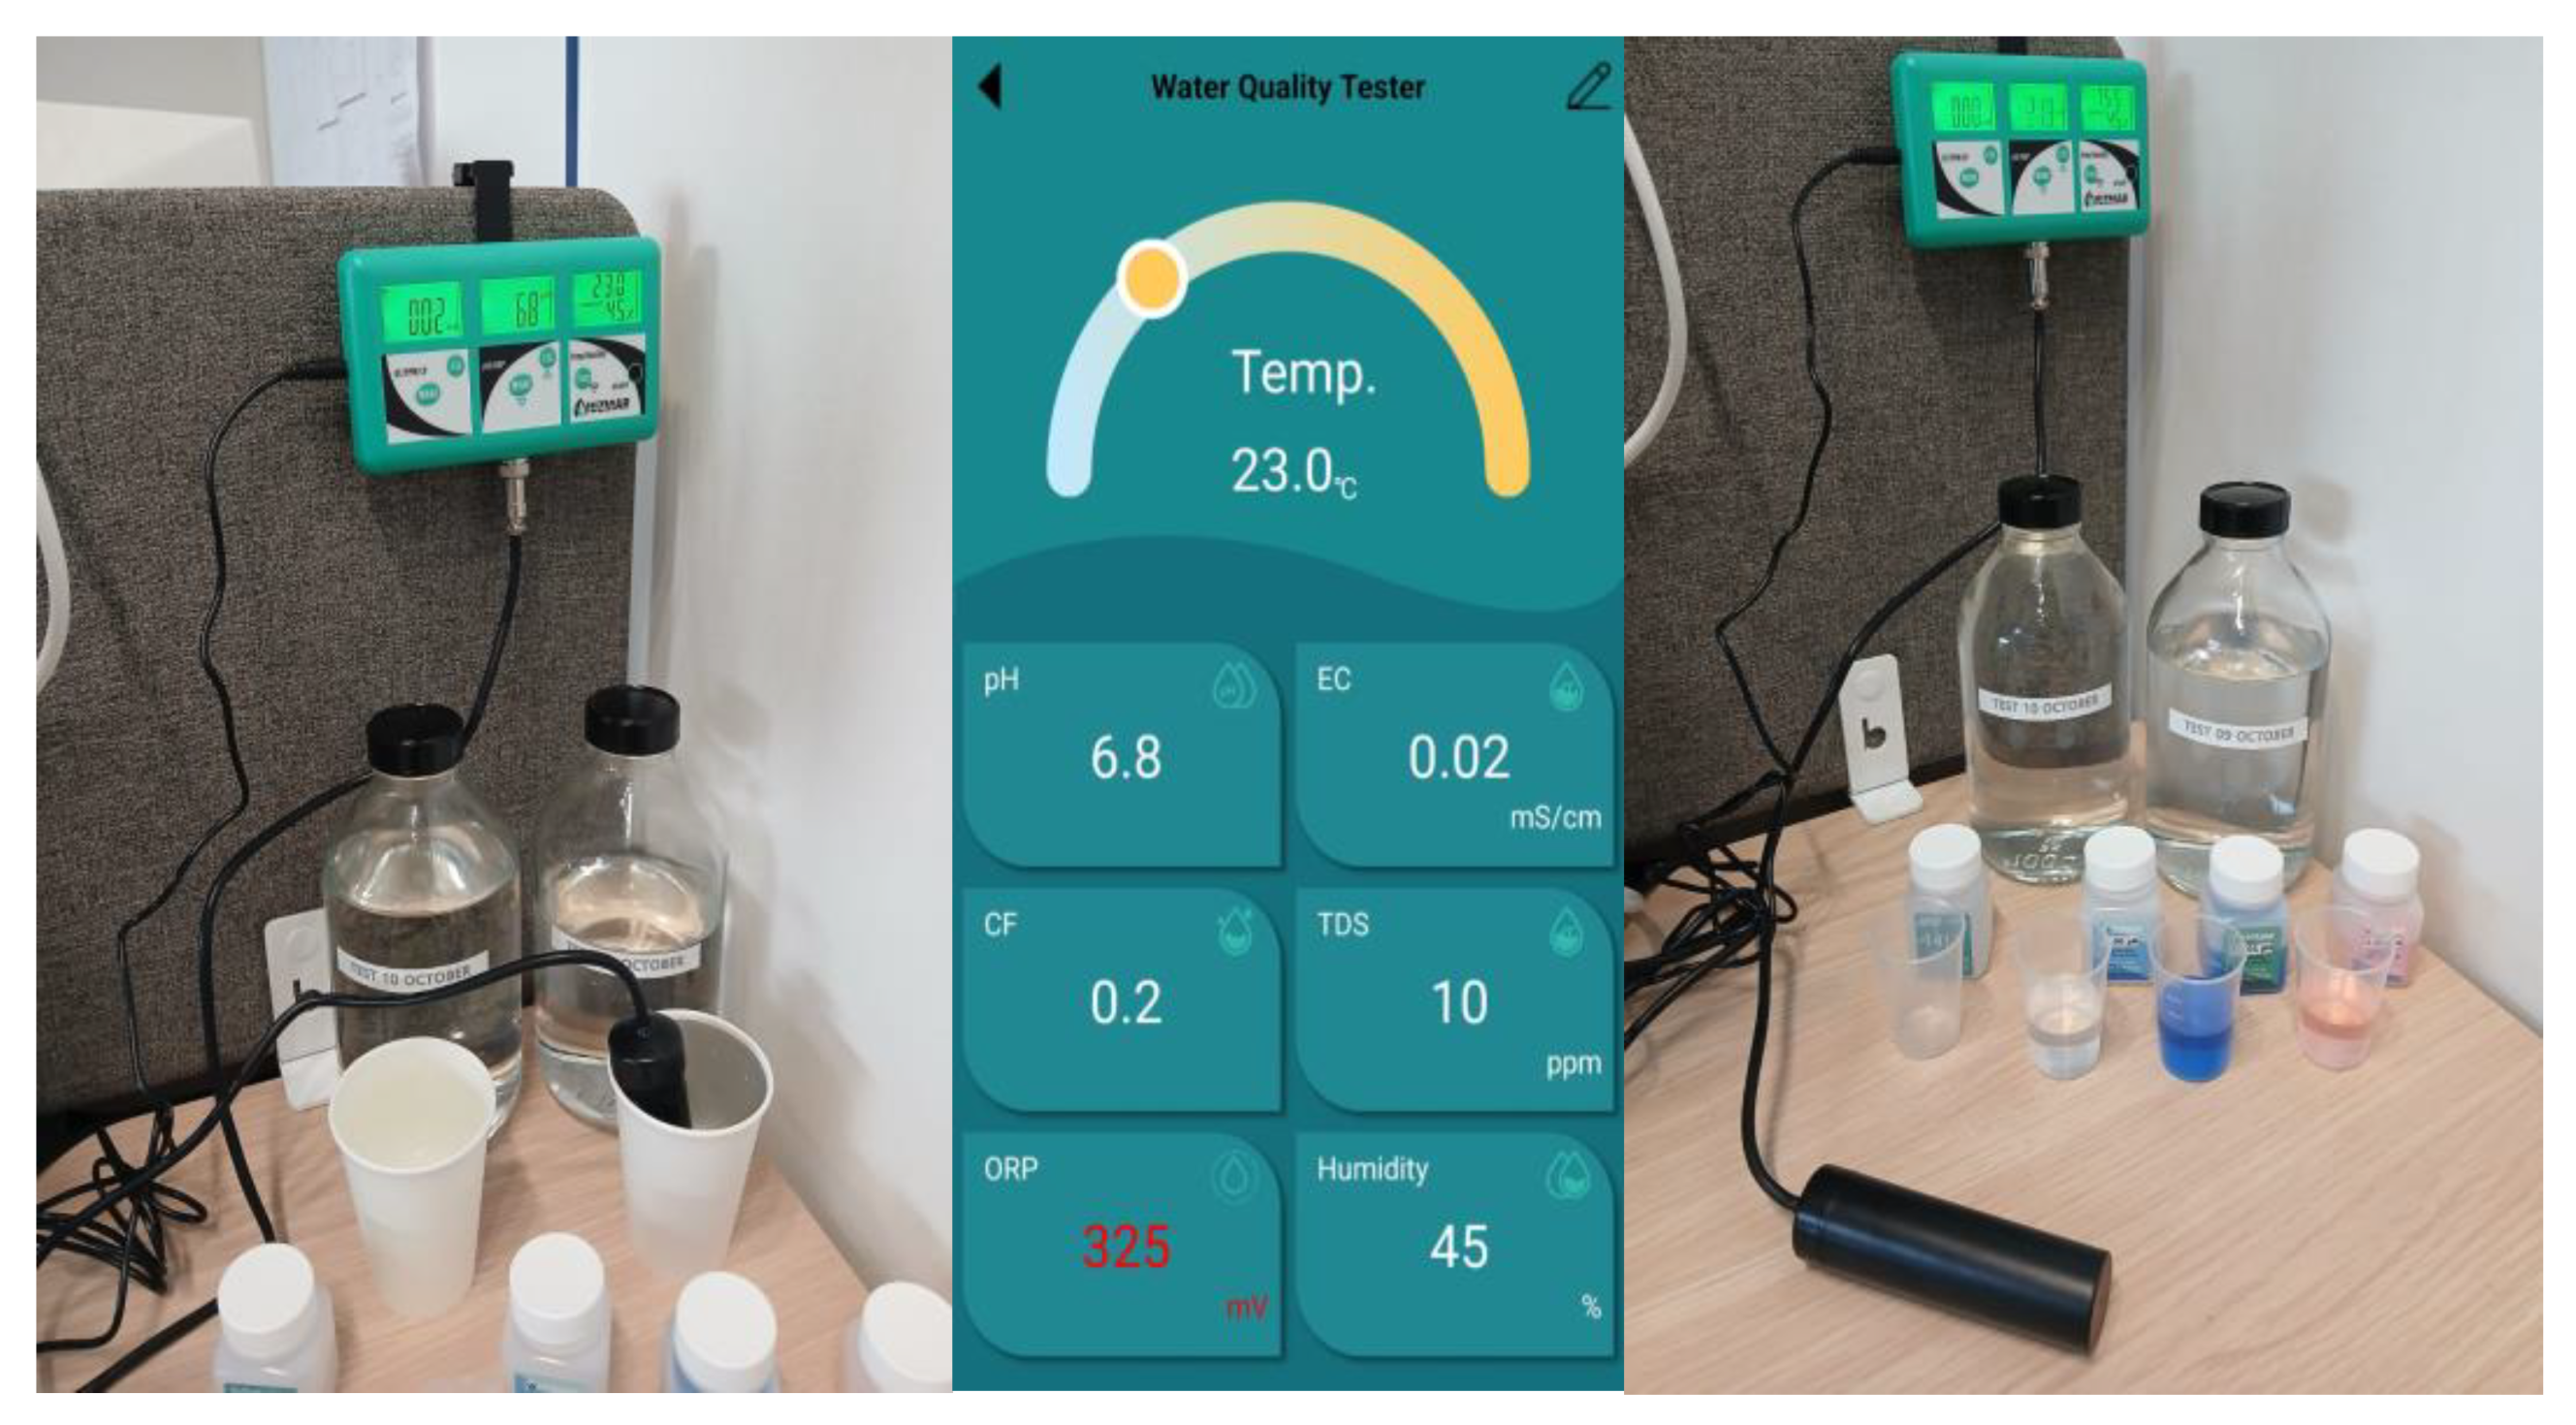
Condensate water from compressor N°4 was collected in two separate bottles (Figure 19) for subsequent analysis. A UIUZMAR 7-in-1 Monitor, which is designed for hydroponics and aeroponics control and includes 4 calibration toolkits (as shown in the right picture in the figure below), was used to test the samples. The analysis measured several parameters, including pH, Electrical Conductivity (EC), Total Dissolved Solids (TDS), Oxidation-Reduction Potential (ORP), Conductivity Factor (CF), temperature, and air humidity.
The Water Quality Tester device is displaying 7 parameters:
- -
- pH (6.8): The water is slightly acidic to near-neutral. This is typical for condensate water, which often contains dissolved CO2 forming carbonic acid. This pH level indicates mild corrosivity potential.
- -
- Electrical Conductivity (0.02 mS/cm) and TDS (10 ppm): These extremely low values indicate the condensate water is highly pure with minimal dissolved ions. This is expected for condensate from compressed air systems, as water vapor condenses without carrying dissolved solids.
- -
- Conductivity Factor (0.2): This low value confirms the high purity of the water sample.
- -
- ORP (325 mV - displayed in red): This positive ORP value indicates oxidizing conditions. The red display suggests this value may be outside the normal range, potentially indicating the presence of dissolved oxygen or other oxidizing agents in the condensate.
- -
- Temperature (23.0 °C) and Humidity (45%): These environmental conditions are within normal room temperature range and moderate humidity, providing stable testing conditions.
The quality test results indicate that the condensate water is highly pure, comparable to demineralized water required for boilers. The only parameter outside the normal range is the ORP (Oxidation-Reduction Potential) value.
Figure 19.
Pictures showing the analysis of the condensate drain measurement for compressor N°4, along with the two separate bottles used for field measurements taken on October 9th and 10th.
Figure 19.
Pictures showing the analysis of the condensate drain measurement for compressor N°4, along with the two separate bottles used for field measurements taken on October 9th and 10th.
Adjacent to the compressors building is a Reverse Osmosis (RO) water demineralization plant. This system produces feed water for the three boilers, meeting the following stringent quality requirements:
- -
- Conductivity: Less than <10 mS/cm at 25 °C. This low conductivity ensures minimal dissolved ion content.
- -
- Silica SiO₂: Less than <0.5 mg/l. This limit is necessary to prevent scaling and deposits within the boilers.
- -
- Iron: Less than <0.2 mg/l. Maintaining a low iron concentration is crucial for avoiding staining and corrosion.
- -
- Salinity (TDS): Less than < 10 mg/l. This Total Dissolved Solids limit signifies very high water purity.
The measured condensate water EC (20 µS/cm or 0.02 mS/cm) satisfies the required limit of <10 mS/cm. However, the TDS (10 mg/l or 10 ppm) is slightly above the required limit of <10 mg/l.
Despite these minor discrepancies, the results suggest that the condensate from compressor N°4 is likely suitable for standard discharge. Furthermore, with essential pre-treatment like softening and polishing, this condensate could be transformed into demineralized water. This offers a more economical alternative to the existing, costly reverse osmosis (RO) water supply.
4. Results and Discussion
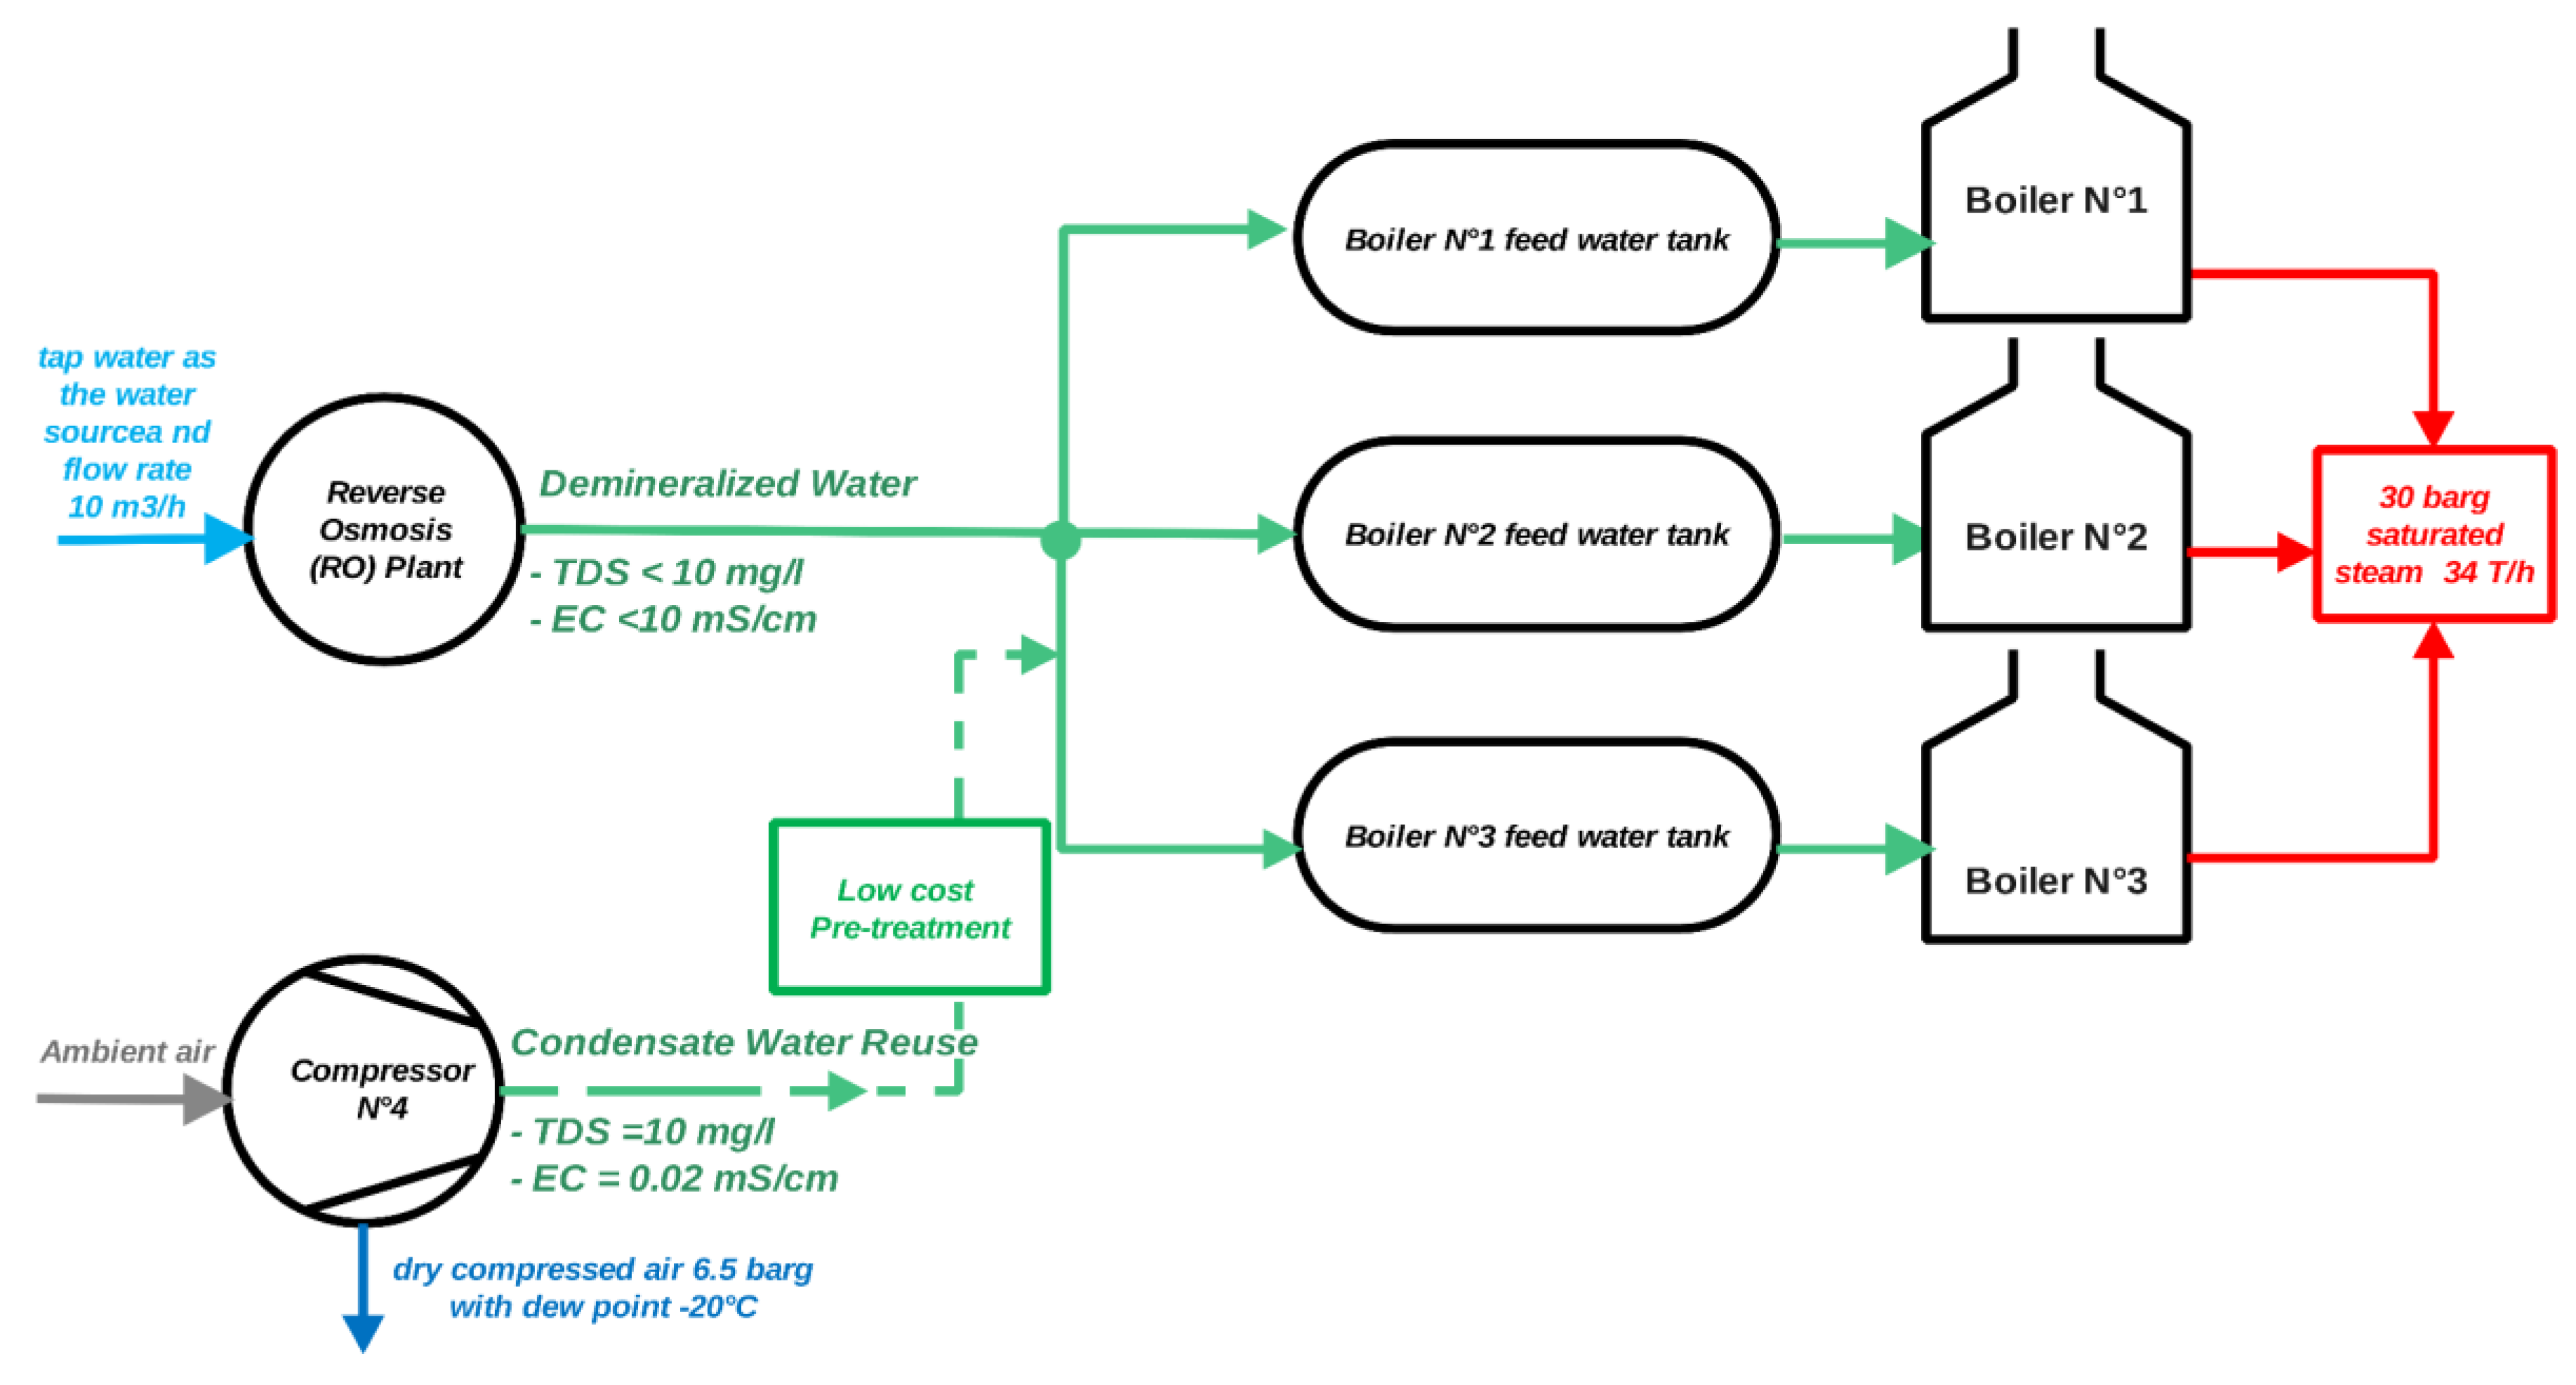
The analysis detailed in Section 3 confirms that the condensate from air compressor N°4 is a high-quality byproduct, ideally suited for recovery and reuse as demineralized water for the three on-site boilers. Under typical operating conditions (20 °C ambient temperature, 70% relative humidity, and 80%+ VSD compressor load), the flow rate is approximately 19 liters per hour. The excellent quality of this water (Total Dissolved Solids (TDS) = 10 mg/l; Electrical Conductivity (EC) = 0.02 mS/cm) allows it to directly supplement the boiler feed tank supply. Only a simple, low-cost pretreatment, as illustrated in Figure 20, is required.
Furthermore, replacing the remaining three compressors with the same technology would secure a continuous, significantly increased source of demineralized water. With all four compressors running for 8,700 hours per year, the total flow rate would reach 76 liters per hour, yielding a potential recovery of 661 m³ of demineralized water annually.
Figure 20.
The proposed idea is to reuse condensate water, specifically from Compressor N°4 (Atlas Copco ZR315 FF), by integrating a low-cost pre-treatment step with the existing demineralized water process for use as boiler feed.
Figure 20.
The proposed idea is to reuse condensate water, specifically from Compressor N°4 (Atlas Copco ZR315 FF), by integrating a low-cost pre-treatment step with the existing demineralized water process for use as boiler feed.
The potential for recovering and recycling condensate water from industrial air compressors is substantial, as highlighted by a study on an Atlas Copco ZR315 FF facility. This facility, with an installed electrical capacity of 1260 kW from four units, produces approximately 70 million Nm³ of compressed air annually. By implementing the same recovery technology used on Unit N°4 across all units, the facility could yield 661 m³ of demineralized water per year from the waste condensate.
This result translates to an impressive Energy-to-Water reuse Production Ratio of 0.525 m³ of demineralized water per kW of installed capacity annually.
Applying this potential to a broader industrial context, our field survey in the Jorf Lasfar industrial zone in Morocco identified a combined air compressor installed capacity of 19,400 kW across three plants. Given the region’s severe freshwater scarcity, which currently necessitates the use of a seawater desalination plant, reusing this condensate water offers a significant opportunity. The total recoverable demineralized condensate water from this capacity is estimated at 10,185 m³.
This recovered volume offers considerable economic and environmental benefits. Economically, it represents an annual saving of $20,370 to $50,925, based on typical industrial rates for demineralized water ($2-$5 per m³). Environmentally, recovering 10,185 m³ of water conserves the same amount of freshwater that would otherwise be required for boiler makeup and significantly reduces the volume of wastewater discharged.
A forthcoming, more comprehensive paper will expand on this initial assessment by analyzing the total air compressor installed capacity throughout Morocco.
The objective is to fully evaluate the potential of reusing this valuable condensate water source for both agricultural and industrial applications, directly addressing the national context of water scarcity.
5. Conclusions
This comprehensive study confirms the substantial potential for recovering and recycling condensate water from Atlas Copco ZR315 FF oil-free industrial air compressors as a sustainable and high-quality alternative water source. The analysis of Compressor N°4 demonstrated that the condensate is highly pure (Total Dissolved Solids (TDS) = 10 mg/l; Electrical Conductivity (EC) = 0.02 mS/cm), closely meeting the stringent quality requirements for boiler feed water. A simple, low-cost pre-treatment is a viable and cost-effective approach to repurpose this waste water, offering a superior alternative to energy-intensive and costly conventional methods like Reverse Osmosis (RO) and Atmospheric Water Generation (AWG).
Scaling this recovery solution across the four units in the studied facility could yield an annual recovery of 661 m³ of demineralized water, corresponding to an Energy-to-Water reuse Production Ratio of 0.525 m³ per kW of installed capacity. Extrapolating this to the 19,400 kW of installed capacity identified in the Jorf Lasfar industrial zone indicates a potential annual recovery of 10,185 m³ of demineralized water. This recovered volume offers significant economic benefits, estimated at $20,370 to $50,925 in annual savings, while simultaneously conserving a substantial amount of freshwater.
In conclusion, the recovery and recycling of air compressor condensate provides a practical, scalable, and environmentally responsible solution for industrial water management. This research strongly supports the adoption of circular economy principles, offering a direct and impactful strategy to enhance operational resilience and combat acute water scarcity, particularly in water-stressed regions such as Morocco. Further work is planned to fully evaluate the national potential of this resource for broader agricultural and industrial applications.
Author Contributions
Conceptualization, A.B. and Z.C.; methodology, A.B., Z.C., B.E. and M.R.; validation, Z.C., B.E. and M.R.; formal analysis, A.B.; investigation, A.B. and Z.C.; resources, Z.C.; writing—original draft preparation, A.B.; writing—review and editing, A.B., Z.C., B.E. and M.R.; visualization, A.B.; supervision, B.E. and M.R.; project administration, B.E. and M.R.
Funding
This research received no external funding.
Conflicts of Interest
The authors declare no conflicts of interest.
Abbreviations
The following abbreviations are used in this manuscript:
| AWG | Atmospheric Water Generation |
| RO | Reverse Osmosis |
| FO | Forward Osmosis |
| MSF | Multi-Stage Flashing |
| MED | Multi-Effect Desalination |
| SEC | Specific Energy Consumption ratio in kWh/m3 |
| TDS | Total Dissolved Solids in ppm or mg/l |
| EC | Electrical Conductivity |
| ORP | Oxidation-Reduction Potential |
| CF | Conductivity Factor |
| PH | Potential of Hydrogen measures the acidity or alkalinity (basicity) of a solution |
| RH | Relative Humidity in % of the ambient air |
| VSD | Variable Speed Drive of air compressor [36,37] |
| VSD FF | Full Feature model of Atlas Copco Air compressor [38] |
References
- A brief history of the energy intensity of desalination. Available online (accessed on 09 October 2025): A brief history of the energy intensity of desalination|Danfoss.
- Energy Requirements Of Desalination Processes. Available online (accessed on 09 October 2025): Energy Requirements of Desalination Processes.
- Marzooq, M.; Alsabbagh, M.; Al-Zubari, W. Energy Consumption in the Municipal Water Supply Sector in the Kingdom of Bahrain. Computational Water, Energy, and Environmental Engineering 2018, 7, 3. [Google Scholar] [CrossRef]
- How much electricity does a Kumulus solution use each day?. Available online (accessed on 09 October 2025): Our Impact|Kumulus CSR.
- Shafeian, N.; Ranjbar, A.A.; Gorji, T.B. Progress in atmospheric water generation systems: A review. Renewable and Sustainable Energy Reviews 2022, 161, 112325. [Google Scholar] [CrossRef]
- Correia, V.; Silva, P.D.; Pires, L.C. Energy Requirements and Photovoltaic Area for Atmospheric Water Generation in Different Locations: Lisbon, Pretoria, and Riyadh. Energies 2023, 16, 5201. [Google Scholar] [CrossRef]
- Texas Water Tour: Desalination. Available online (accessed on 09 October 2025): Texas Water Tour: Desalination.
- Liu, W.; Livingston, J.L.; Wang, L. Pressure-driven membrane desalination. Nature Reviews Methods Primers 2024, 4, 10. [Google Scholar] [CrossRef]
- Aquaporin. (n.d.). Difference between FO and RO. Available online (accessed on 09 October 2025): The difference between forward and reverse osmosis - Aquaporin.
- Qasim, M.; Badrelzaman, M.; Darwish, N. Reverse osmosis desalination: A state-of-the-art review. Desalination 2019, 459, 59–104. [Google Scholar] [CrossRef]
- Jones, E.; Qadir, M.; van Vliet, M.T.; Smakhtin, V.; Kang, S.-M. The state of desalination and brine production: A global outlook. Sci. Total. Environ. 2019, 657, 1343–1356. [Google Scholar] [CrossRef] [PubMed]
- Panagopoulos, A.; Michailidis, P. Membrane Technologies for Sustainable Wastewater Treatment: Advances, Challenges, and Applications in Zero Liquid Discharge (ZLD) and Minimal Liquid Discharge (MLD) Systems. Membranes 2025, 15, 64. [Google Scholar] [CrossRef] [PubMed]
- Al-Addous, M.; Bdour, M.; Rabaiah, S.; Boubakri, A.; Schweimanns, N.; Barbana, N.; Wellmann, J. Innovations in Solar-Powered Desalination: A Comprehensive Review of Sustainable Solutions for Water Scarcity in the Middle East and North Africa (MENA) Region. Water 2024, 16, 1877. [Google Scholar] [CrossRef]
- Arias, D.; Gallardo, K.; Saldana, M.; Galleguillos-Madrid, F. Urease-Driven Microbially Induced Carbonate Precipitation (MICP) for the Circular Valorization of Reverse Osmosis Brine Waste: A Perspective Review. Minerals 2025, 15, 543. [Google Scholar] [CrossRef]
- Avramidi, M.; Spyropoulou, C.; Loizou, C.; Kyriazi, M.; Novakovic, J.; Moustakas, K.; Malamis, D.; Loizidou, M. Adding Value to Reclaimed Water from Wastewater Treatment Plants: The Environmental Feasibility of a Minimal Liquid Discharge System for the Case Study of Larnaca. Sustainability 2023, 15, 14305. [Google Scholar] [CrossRef]
- Okampo, E.J.; Nwulu, N.; Bokoro, P.N. Economic and Reliability Assessment of Hybrid PRO-RO Desalination Systems Using Brine for Salinity Gradient Energy Production. Sustainability 2022, 14, 3328. [Google Scholar] [CrossRef]
- Veolia Thermal Desalination references. Available online (accessed on 30 October 2025): More Thermal Desalination references.
- The Clausius-Clapeyron Equation from the LibreTexts Chemistry website. Available online (accessed on 30 October 2025): Clausius-Clapeyron Equation - Chemistry LibreTexts.
- The Engineering ToolBox online calculator for Water - Boiling Points at Vacuum Pressure. Available online (accessed on 30 October 2025): Water - Boiling Points at Vacuum Pressure.
- Wang, J.; Huo, E. Opportunities and Challenges of Seawater Desalination Technology. Front. Energy Res. 2022, 10, 960537. [Google Scholar] [CrossRef]
- Thi, H.T.D.; Pasztor, T.; Fozer, D.; Manenti, F.; Toth, A.J. Comparison of Desalination Technologies Using Renewable Energy Sources with Life Cycle, PESTLE, and Multi-Criteria Decision Analyses. Water 2021, 13, 3023. [Google Scholar] [CrossRef]
- Washahi, M.A.; Gopinath, A.S. Techno Economical Feasibility Analysis of Solar Powered RO Desalination in the Sultanate of Oman. 9th IEEE-GCC Conference and Exhibition (GCCCE) 2017, 8448195; pp. 1–9. [CrossRef]
- Cherif, H.; Belhadj, J. Chapter 15-Environmental Life Cycle Analysis of Water Desalination Processes. Sustainable Desalination Handbook, 2018; 527–559. [Google Scholar] [CrossRef]
- Abdelkareem, M.A.; Assad, M.E.H.; Sayed, E.T.; Soudan, B. Recent progress in the use of renewable energy sources to power water desalination plants. Desalination 2018, 435, 97–113. [Google Scholar] [CrossRef]
- Al-Karaghouli, A.; Kazmerski, L.L. Energy consumption and water production cost of conventional and renewable-energy-powered desalination processes. Renew. Sustain. Energy Rev. 2013, 24, 343–356. [Google Scholar] [CrossRef]
- Potyka, J.; Dalibard, A.; Tovar, G. Energetic analysis and economic viability of active atmospheric water generation technologies. Discov. Appl. Sci. 2024, 6, 1–31. [Google Scholar] [CrossRef]
- Peeters, R.; Vanderschaeghe, H.; Rongé, J.; Martens, J.A. Energy performance and climate dependency of technologies for fresh water production from atmospheric water vapour. Environ. Sci. Water Res. Technol. 2020, 6, 2016–2034. [Google Scholar] [CrossRef]
- Cattani, L.; Cattani, P.; Magrini, A. Air to Water Generator Integrated System Real Application: A Study Case in a Worker Village in United Arab Emirates. Appl. Sci. 2023, 13, 3094. [Google Scholar] [CrossRef]
- Our Technology How It works. Available online: https://www.kumuluswater.com/solutions/amphore (accessed on 20 November 2025).
- CS Instruments VA 500 - Flow sensor for dry compressed air. Available online (accessed on 20 November 2025): Instruction manual Flow sensor VA 500.
- CS Instruments VD 500 - Flow sensor for dry compressed air. Available online (accessed on 20 November 2025): Instruction manual Flow sensor VD 500.
- VSD: DRIVING DOWN ENERGY COSTS page 10. Available online (accessed on 20 November 2025): ZR/ZT 110-275(FF)_ZR/ZT 132-315 VSD (FF)_EN.
- Oil-free rotary screw compressors ZR/ZT 200-355 VSD page 38. Available online (accessed on 20 November 2025): Oil-free rotary screw compressors.
- Atlas Copco’s technical service in France replied to provide the manufacturer-reported condensate production quantity for the Atlas Copco ZR315 VSD FF air compressor (Unit N°4): Atlas Copco France confirmation.pdfWater condensate AtlasCopco.
- The pros and cons of variable speed drive compressors. Available online (accessed on 20 November 2025): The pros and cons of variable speed drive compressors - KAESER Know How blog.
- Best practice guide for using the variable speed drive compressors. Available online (accessed on 20 November 2025): Air compressors with integral variable speed control.
- The CPD programme: Fundamentals of Variable speed drives. Available online (accessed on 20 November 2025): Variable speed drives.
- Full Feature model of Atlas Copco Air compressor. Available online: https://www.atlascopco.com/en-us/compressors/customerbenefit/energy-savings-manufacturer-milling-tools (accessed on 20 November 2025).
Disclaimer/Publisher’s Note: The statements, opinions and data contained in all publications are solely those of the individual author(s) and contributor(s) and not of MDPI and/or the editor(s). MDPI and/or the editor(s) disclaim responsibility for any injury to people or property resulting from any ideas, methods, instructions or products referred to in the content. |
© 2025 by the authors. Licensee MDPI, Basel, Switzerland. This article is an open access article distributed under the terms and conditions of the Creative Commons Attribution (CC BY) license (https://creativecommons.org/licenses/by/4.0/).
Copyright: This open access article is published under a Creative Commons CC BY 4.0 license, which permit the free download, distribution, and reuse, provided that the author and preprint are cited in any reuse.


