3. Results and Discussion
Before analyzing the electrochemical data, it is appropriate to note that, according to previously published findings [
17], the as-deposited electrocatalytic coating used in this study consists predominantly of the β-Ni(OH)
2 phase. It is also worth recalling that the high electrocatalytic activity of nickel hydroxide toward the urea oxidation reaction has long been recognized [
7,
8,
9,
10,
11], and its catalytic action is commonly interpreted in terms of two possible reaction pathways, referred to as the
direct and
indirect mechanisms [
24,
25,
26,
27,
28]. According to the direct mechanism (equations (4) and (5)), adsorbed urea molecules located at the active NiOOH sites interact with hydroxide ions, either those adsorbed on the electrocatalyst surface or those originating from the bulk alkaline solution, to form the final oxidation products. The active NiOOH sites are generated through the prior oxidation of Ni(OH)
2 (reaction (4)).
The indirect mechanism assumes that NiOOH chemically oxidizes the adsorbed CO(NH
2)
2 molecules (equation (6)), while the active NiOOH sites on the surface are regenerated through reaction (4).
Thus, in the direct mechanism, urea oxidation proceeds directly through the electrochemical step (5), whereas in the indirect mechanism it occurs via the chemical interaction described by reaction (6). Both the direct and indirect pathways may operate simultaneously on the electrode surface [
28].
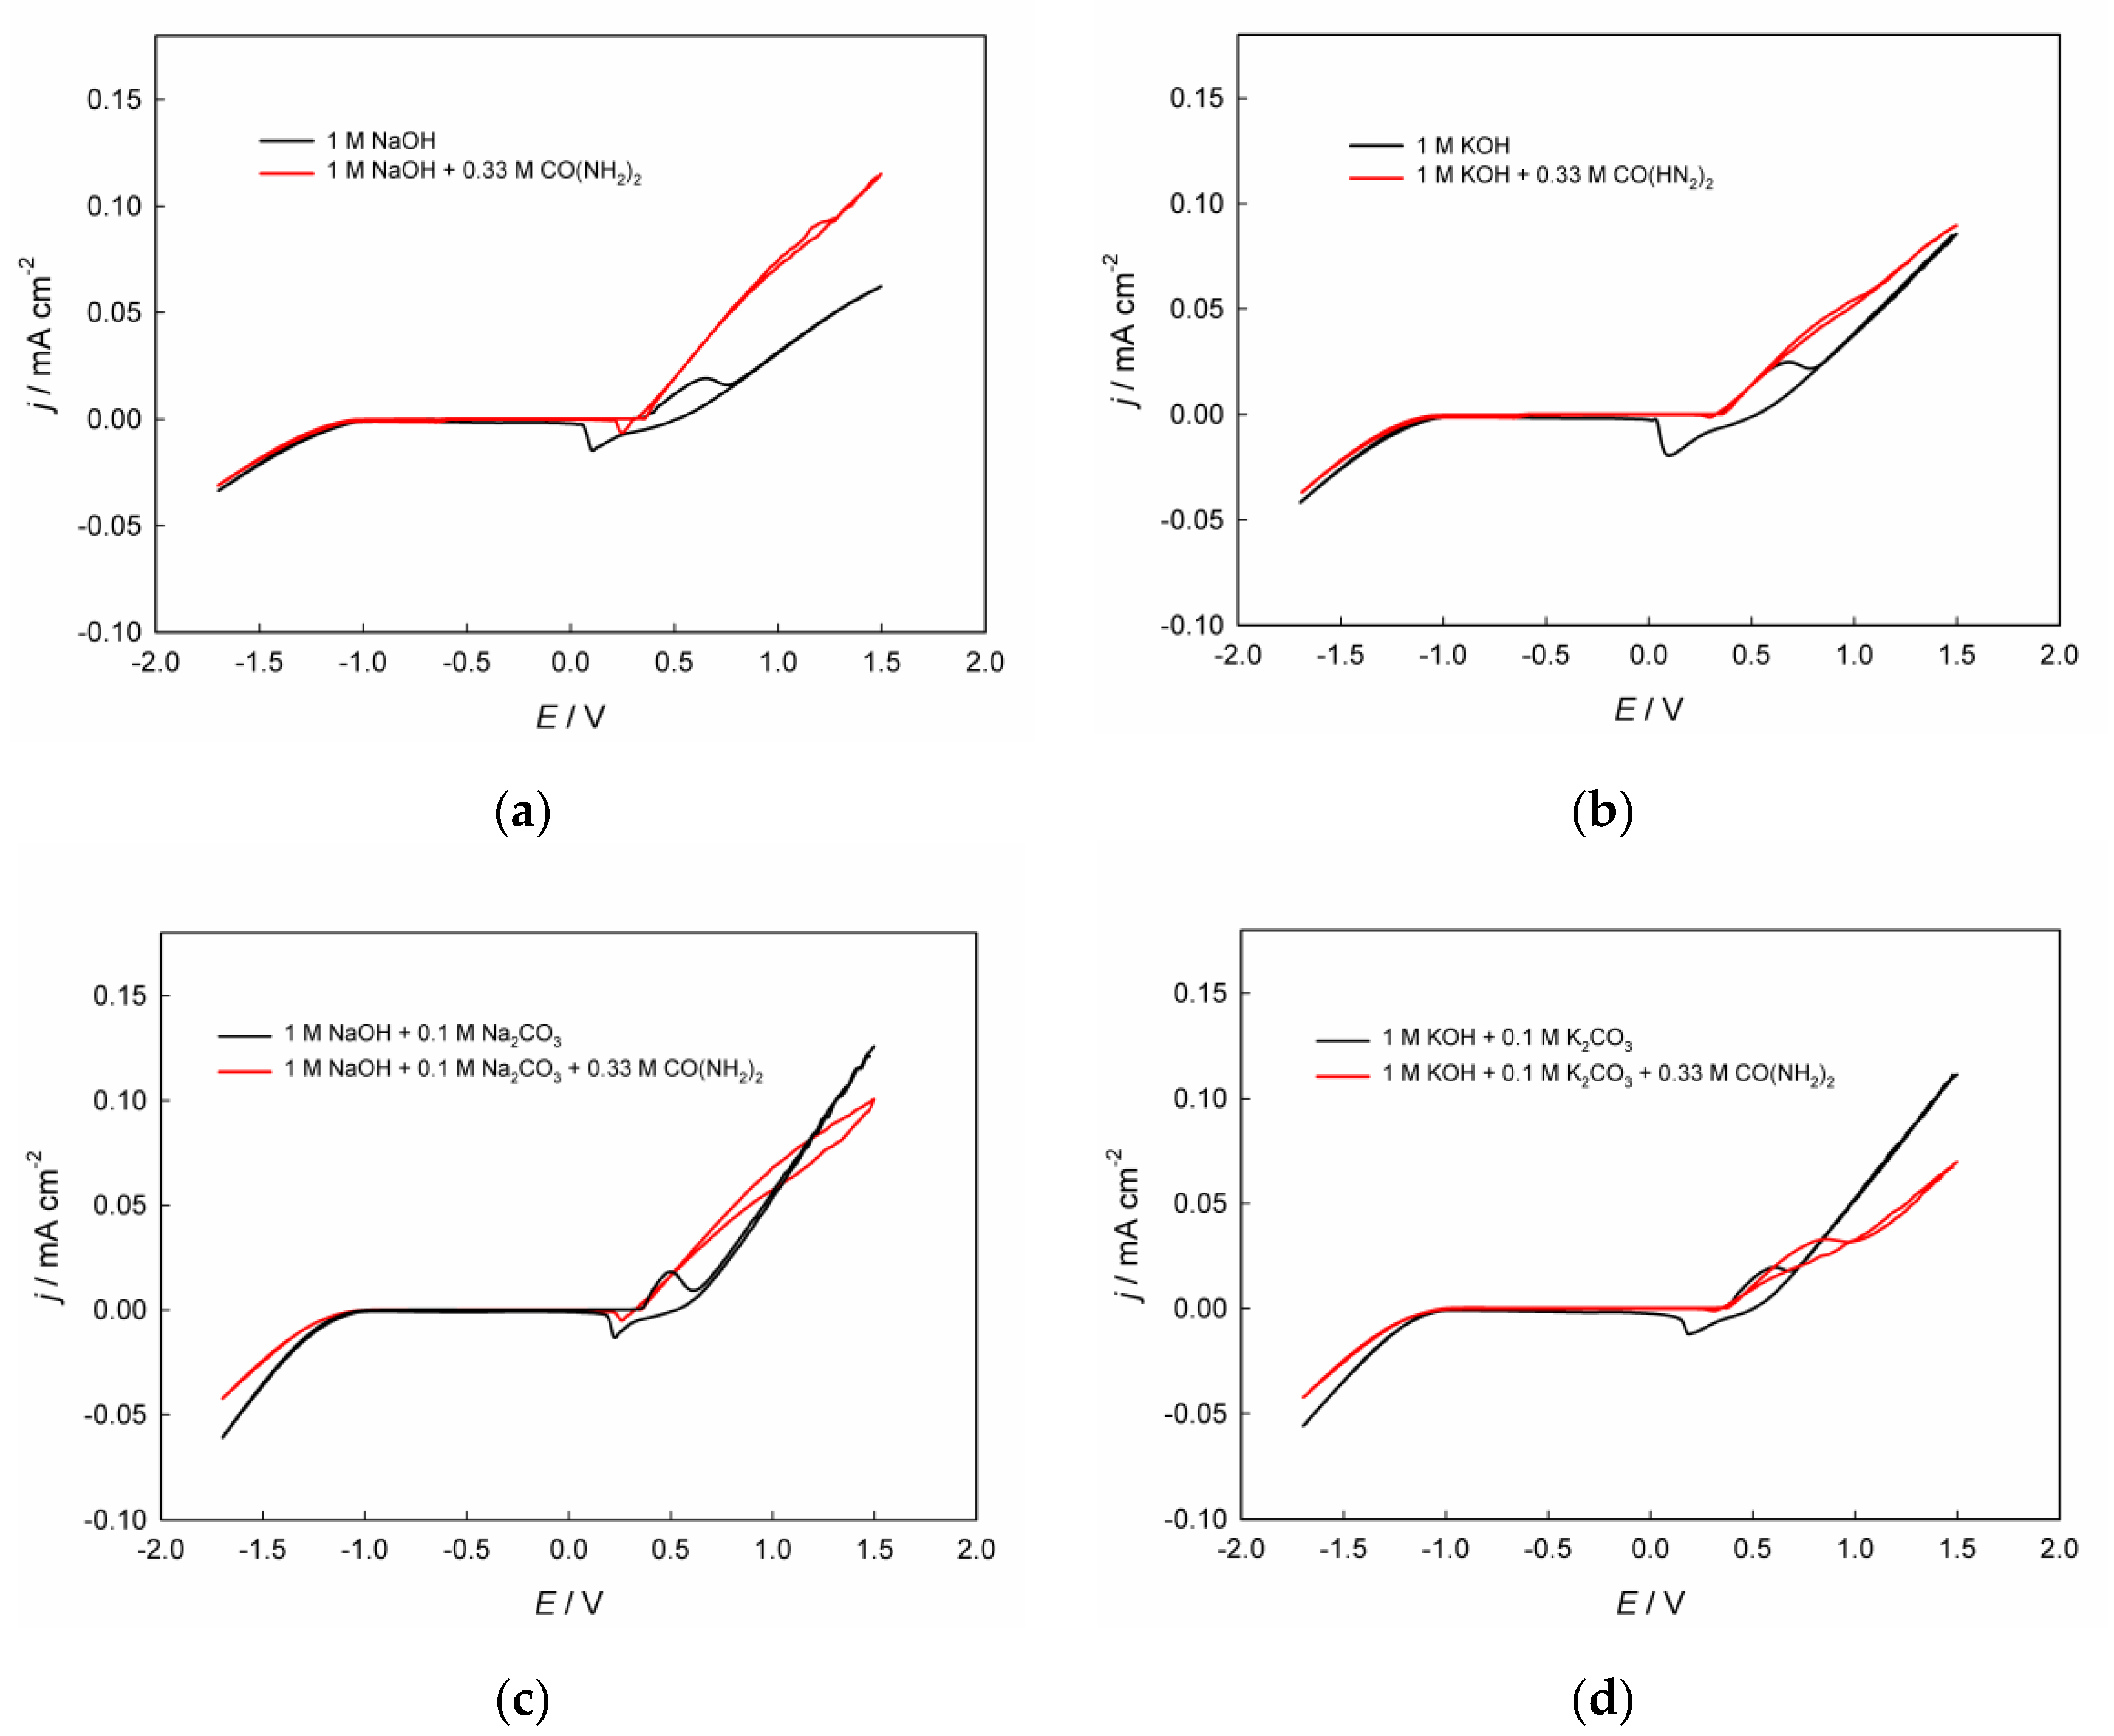
Figure 1 shows paired cyclic voltammograms (CVAs) recorded in the investigated alkaline solutions, both in the presence and absence of urea, with varying contents of inorganic components. In
Figure 2, for ease of comparison, the same curves are presented separately, grouped for solutions without CO(NH
2)
2 (
Figure 2a) and with its presence (
Figure 2b).
The cyclic voltammograms registered in alkaline solutions without urea exhibit several characteristic regions corresponding to specific electrochemical transformations. The cathodic region at E < –1.0 V corresponds to the hydrogen evolution reaction, while the anodic region at E > ≈0.7 V corresponds to the oxygen evolution reaction. The cathodic-anodic waves observed in the CVAs between approximately +0.2 and +0.7 V are known to be associated with the electrochemical transformations of the Ni(II)↔Ni(III) redox couple [
7,
17,
24,
25], which, in a first approximation, are represented by equation (4). In alkaline electrolytes containing dissolved urea, the UOR begins at electrode potentials greater than approximately 0.2–0.5 V.
It should be noted that the recorded CVAs exhibit virtually no noticeable hysteresis between the forward and reverse (anodic and cathodic) scans, apparently due to the surface-preparation procedure described above, which ensures sufficient stability of the electrocatalytic activity over a prolonged period [
17]. Noticeable hysteresis is observed only in the region corresponding to the urea oxidation reaction, likely as a result of certain diffusion limitations in the transport of CO(NH
2)
2 molecules and some evolution in the state of the electrocatalyst surface.
Next, it is appropriate to briefly describe the influence of the electrolyte composition on the kinetics of these main individual electrochemical processes in urea-assisted hydrogen production.
1) Hydrogen evolution reaction
Comparison of the cathodic regions in
Figure 2a indicates that the polarization of the hydrogen evolution reaction in 1 M KOH is lower than in 1 M NaOH. This effect can be explained by the weaker hydration of K
+ ions compared to Na
+ ions, which facilitates the discharge of water molecules and the subsequent formation of adsorbed hydrogen atoms on the cathode surface [
29]. In addition, the less ordered hydration shell of K
+ ions leads to the formation of a thinner electrical double layer and increases the activity of water molecules near the electrode–solution interface, thereby accelerating the kinetics of the hydrogen evolution reaction. Similar patterns have been reported previously in several studies, confirming that the HER overpotential decreases in the series LiOH > NaOH > KOH under comparable conditions [
29,
30,
31].
The experimental results also indicate that the addition of sodium or potassium carbonate to 1 M NaOH or 1 M KOH solutions, respectively, significantly reduces the polarization of the HER (
Figure 1c, d). This effect can be associated with the specific influence of carbonate ions on the structure of interfacial water and the electrical double layer. The presence of CO
32– ions weakens the hydration of alkali cations, increases the activity of water molecules near the electrode surface, and facilitates the Volmer discharge step. In addition, the CO
32–/HCO
3– equilibrium acts as a local buffer, stabilizing the interfacial pH and promoting more efficient hydrogen evolution, which is attributed to an additional pathway of HER, namely bicarbonate-mediated reduction [
32].
The presence of urea in alkaline electrolyte inhibits the hydrogen evolution reaction (
Figure 1). This inhibition may originate from molecular adsorption of urea on the electrode surface, which blocks active sites and alters the interfacial water structure [
33,
34]. The hydrogen-bonding interaction between urea and water decreases the activity of water molecules and hinders the Volmer step. Moreover, urea may modify the electrical double layer and increases the charge-transfer resistance, leading to a higher HER overpotential.
2) Oxygen evolution reaction
The oxygen evolution reaction on nickel hydroxide-based electrodes typically proceeds with lower polarization in 1 M KOH compared to 1 M NaOH (
Figure 2). Similarly to the HER, this effect is primarily attributed to the weaker hydration and higher mobility of K⁺ ions relative to Na⁺, which facilitate the interfacial transport of hydroxide ions and improve charge transfer kinetics at the NiOOH/electrolyte interface. Moreover, the larger ionic radius of K⁺ results in a less compact interfacial double layer and a weaker local electric field, both of which promote the formation and stabilization of active NiOOH species. This effect of the alkali-metal ion nature on alkaline oxygen evolution has already been described in the literature [
35,
36,
37].
The addition of carbonate ions to alkaline electrolytes such as 1 M KOH or 1 M NaOH markedly decreases the polarization of the oxygen evolution reaction on electrodes under study. This effect can be explained by several interrelated factors. First, the CO
32–/HCO
3– equilibrium provides a buffering effect that maintains a high local hydroxide ion concentration near the electrode surface, thus facilitating charge transfer. Second, carbonate ions can weakly adsorb on NiOOH surfaces, altering the interfacial electric field and stabilizing highvalent Ni
3+/Ni
4+ species that serve as the active centers for the OER. In addition, the presence of carbonate ions disrupts the strong hydration shells of alkali cations, improving the mobility of charge carriers and decreasing the interfacial resistance. Previously, it was noted [
38] that anions in the electrical double layer can disrupt the water network at the interface, thereby affecting the kinetics of oxygen evolution at the anode. These combined physicochemical effects lead to significantly enhanced OER kinetics in carbonate-containing alkaline solutions.
3)Ni(OH)2/NiOOH redox reaction
As mentioned above, the cathodic-anodic waves at electrode potentials of approximately +0.2 ... +0.7 V in alkaline media are associated with the redox transformation of reaction (4). The data show that the amount of charge consumed in these processes, as indicated by the area under the voltammetric curve, slightly increases when moving from NaOH to KOH solution. This effect can be attributed to the specific influence of K
+ cations on the electrochemical behavior of nickel hydroxide. Potassium cations with lower hydration energy are more easily adsorbed or possibly partially intercalated into the layered structure of NiOOH, stabilizing a phase with a larger interlayer spacing and promoting the participation of a greater number of Ni-containing sites in the redox processes. As a result, this causes an increase in the integral charge under the voltammetric peaks, i.e., the growth of the capacitance of the nickel-hydroxide electrode [
36].
Regarding the addition of carbonate ions to the alkaline solution,
Figure 2a shows that this decreases the potential difference between the cathodic and anodic peaks, indicating enhanced electrochemical reversibility of the process for both NaOH and KOH. This behavior can be explained by the specific interaction of carbonate anions with the layered Ni(OH)
2/NiOOH structures. Carbonate ions may adsorb or intercalate into the interlayer space of nickel hydroxides, stabilizing γ-type or mixed (α/γ) phases with larger interlayer spacing [
39,
40]. Simultaneously, the CO
32–/HCO
3– buffering system reduces pH fluctuations in the near-electrode region, promoting greater structural stability and increasing the reversibility of the Ni(OH)
2 ↔ NiOOH redox transformation.
4) Urea oxidation reaction
The data in
Figure 1 confirm numerous observations repeatedly reported in the literature [
7,
8,
9,
10,
11,
12,
16,
17,
27,
28,
41] that in alkaline solution, in the presence of added urea, the anodic current significantly increases immediately upon the formation potential of NiOOH being reached. Importantly, the recorded currents substantially exceed the corresponding peak currents of NiOOH formation in solutions without CO(NH
2)
2. This indicates a clear electrocatalytic effect in the urea oxidation reaction, proceeding according to equations (5) and/or (6). Ii should be observed that the cathodic peak of the NiOOH reduction to Ni(OH)
2 is noticeably smaller than in solutions without urea, which likely indicates partial consumption of NiOOH via the indirect mechanism.
The anodic portion of the CVAs corresponding to the UOR is significantly shifted to more negative potentials compared to the OER on the same catalyst in the same solution but without added urea. For example, in 1 M NaOH solution, at a current density of 0.05 mA cm–2, the oxygen evolution potential is approximately 1.27 V, whereas after adding 0.33 M CO(NH2)2, it decreases to 0.77 V, indicating a pronounced depolarization due to the replacement of the OER by UOR. This conclusion holds true for alkaline solutions regardless of the nature of the alkali metal cation (Na+/K+) and regardless of the presence of added carbonate ions. Thus, the possibility of significantly reducing the energy consumption of the anodic process is confirmed when using urea-assisted alkaline water electrolysis on the investigated nickel-containing electrocatalyst obtained via electrodeposition from a DES.
The pronounced hysteresis of the reverse CVA scan (in the cathodic direction corresponding to the UOR) at sufficiently high current densities is likely associated both with the evolution of the concentration and activity of the active sites during the reaction under potential scanning conditions and with the diffusion limitations of urea mass transport. Therefore, the electrocatalytic effect is most appropriately and accurately evaluated and compared for solutions of different compositions at relatively low urea oxidation current densities, where hysteresis effects in the forward and reverse CVA scans are practically absent. Accordingly,
Table 1 summarizes the urea oxidation current densities in solutions of different compositions at a potential of +0.45 V, chosen near the foot of the current wave, where mass transport limitations are expected to be minimal. Two important conclusions can be drawn from these data, both for theory and practical applications: (1) the electrocatalytic urea oxidation proceeds at a higher rate (i.e. higher anodic current density at a fixed potential) in NaOH-based solutions compared to KOH-based solutions under otherwise identical conditions; and (2) the presence of additional carbonate ions in the solution slightly hinders the urea oxidation process, as evidenced by lower observed current densities.
To explain the observed effects and gain a deeper understanding of the kinetics and mechanism of the urea electrooxidation reaction in solutions of different compositions, electrochemical impedance spectroscopy (EIS) was carried out. Impedance measurements were performed at a potential of +0.45 V, which, as noted above, allows for a correct assessment of the electrocatalytic activity and avoids complications arising from possible mass transport limitations.
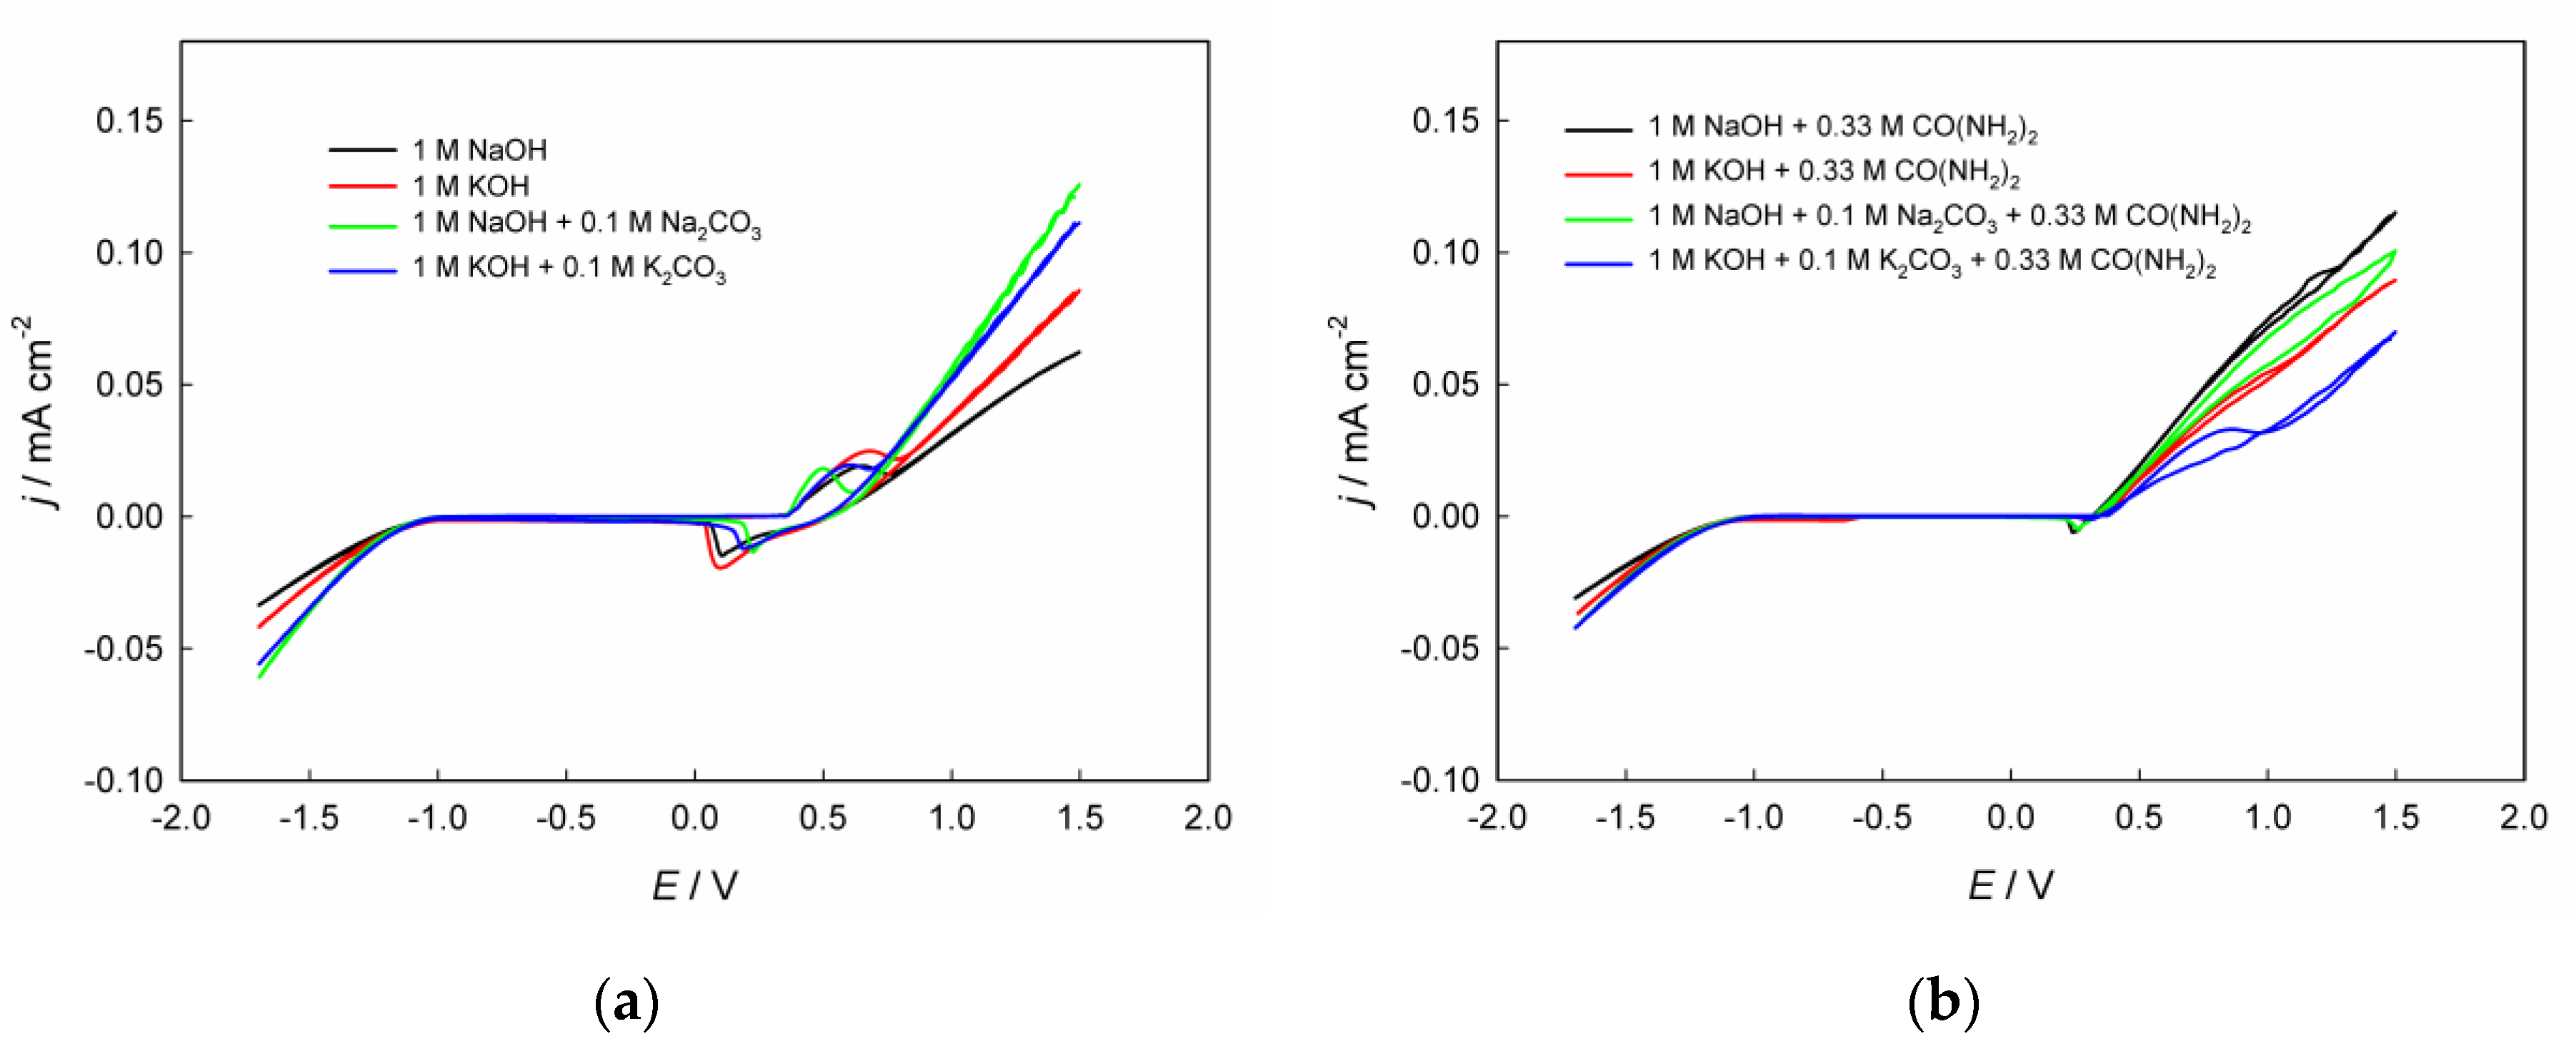
As seen in
Figure 3, the recorded Nyquist plots consist of a combination of two distorted (compressed) semicircles in the high- and low-frequency regions in alkaline solutions both without and with added urea. The semicircles in the Nyquist plots for solutions without CO(NH
2)
2 differ significantly in diameter: the high-frequency semicircle (i.e., the left semicircle in the plots) has a substantially smaller diameter than the low-frequency one (i.e., the right semicircle in the plots), which is highlighted in the inset of
Figure 3. As is well known, the presence of a semicircle in a Nyquist plot indicates a certain time constant, which generally corresponds to the slowed charge transfer of a particular electrochemical step, and the larger the semicircle diameter, the higher the electrode resistance to the current of the electrochemical reaction [
42,
43]. The high-frequency semicircle (on the left of the Nyquist plot) can likely be attributed to the charge transfer associated with the Ni(OH)
2 ↔ NiOOH redox conversion [
28]. On this semicircle, the point corresponding to the maximum value of the imaginary component of the complex impedance, known as the characteristic frequency
fpeak, can be clearly identified [
42]. Then, the time constant,
τ, associated with this semicircle can be calculated using the following equation:
The characteristic frequencies and the corresponding calculated time constants for the high-frequency semicircle in the Nyquist plots of alkaline solutions are summarized in
Table 2. As follows from the obtained data, switching from NaOH to KOH results in a slight increase in the time constant, with characteristic frequencies of several hertz. The addition of carbonate salts to the respective alkalis leads to a noticeable decrease in the time constant, with characteristic frequencies approaching ~70–100 Hz. When urea is added to the solution, the time constants in the high-frequency region for different solution compositions become leveled, being approximately ≈(1–2)×10
–2 s at the corresponding characteristic frequencies of 7–16 Hz.
In the low-frequency region, the second semicircle in the Nyquist diagrams (on the right side of the plot) for alkaline solutions without CO(NH2)2 has a considerably larger diameter than the first high-frequency semicircle, indicating a higher electrical resistance. This semicircle is likely associated with the adsorption of certain species, in particular hydroxide ions, on the electrode surface, which may participate in the electrochemical reaction. Since, within the frequency range used, the maximum of the imaginary part of the impedance for these semicircles could not be reached, the corresponding time constants were not determined. Nevertheless, a rough estimate suggests that these time constants probably exceed ~16 s. Regarding the second semicircle in the Nyquist plots for alkaline solutions containing CO(NH2)2, it corresponds to relatively large time constants (on the order of 3–4 s) with the corresponding characteristic frequencies of 0.03–0.05 Hz.
As is well known, a time constant reflects the characteristic relaxation time of a given electrochemical process to a new quasi-stationary state after a small external sinusoidal perturbation [
43]. In this context, the magnitude of the time constant can, in a first approximation, be used to identify the nature of the electrochemical process. The similarity of time constants (and the corresponding characteristic frequencies) in the high-frequency region for solutions with and without urea suggests that they are likely caused by the same charge-transfer process in the Ni(OH)
2 ↔ NiOOH redox reaction, which, in the case of added urea, is complicated by the indirect mechanism of its oxidation (reactions (4) and (6)). Regarding the second semicircle in the low-frequency region for solutions containing CO(NH
2)
2, it is reasonable to assume that oxidation proceeds via the direct mechanism (reactions (4) and (5)) involving adsorbed species, which accounts for the relatively long relaxation times [
28].
It should be noted that changes in the time constant in EIS can be caused by multiple factors, including variations in charge-transfer resistance, interfacial capacitance, adsorption processes, and so on, which may occur simultaneously; therefore, such changes cannot be interpreted unambiguously [
43]. For a more detailed and precise identification of the kinetics and mechanism of the investigated processes, a further analysis of Bode plots and modeling through the development of an equivalent circuit with the calculation of its individual quantitative parameters is required.
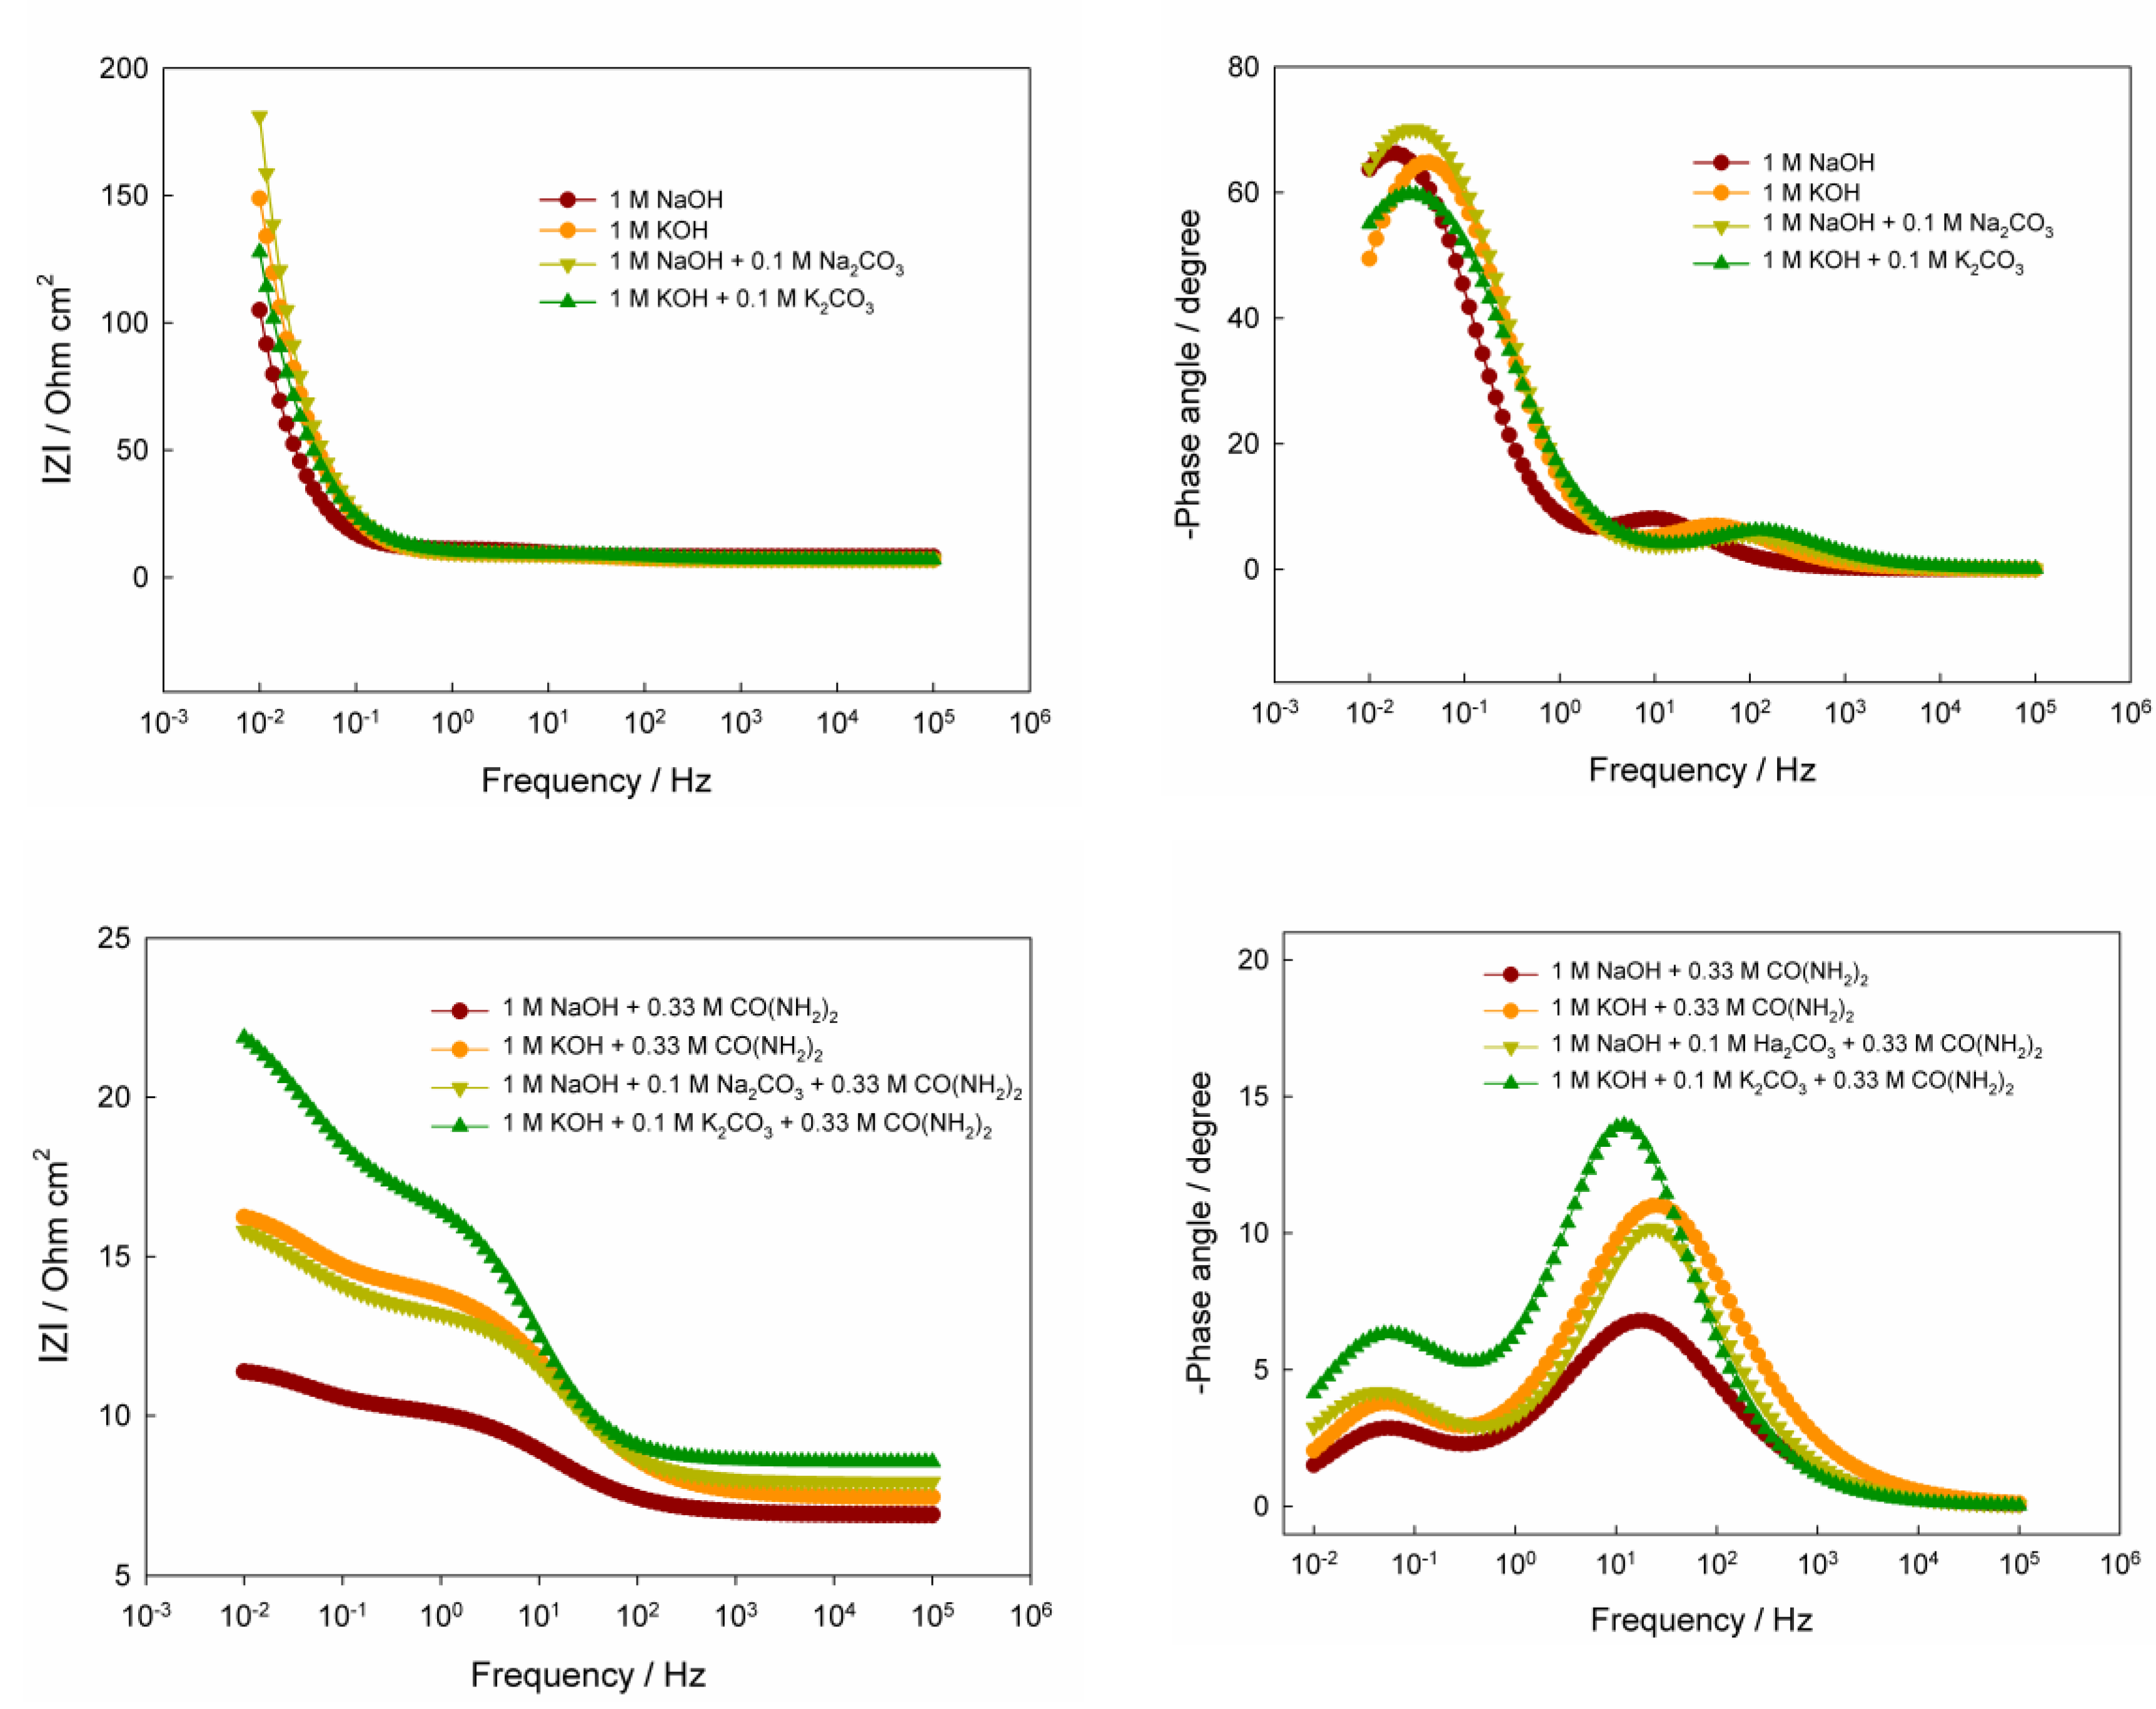
The obtained Bode plots for the DES-electrodeposited electrocatalyst in all eight investigated solutions exhibit a characteristic behavior, including a decrease in the impedance magnitude
with increasing frequency and the presence of two distinct phase-shift maxima (
Figure 4). In the high-frequency region,
in all cases falls to values close to the ohmic resistance, while the phase approaches zero, indicating a negligible contribution from capacitive components. Two phase angle maxima, reflecting relaxation processes, are observed in the mid- and low-frequency ranges. In the low-frequency region, for solutions without urea, the phase maximum is well pronounced and reaches large values of ≈60–70°; by contrast, in urea-containing solutions, the phase peaks are substantially smaller, only ≈3–7°. This indicates a change in the mechanism from predominantly capacitive control to a mainly ohmic behavior, an acceleration of relaxation stages (shift of characteristic frequencies toward higher frequencies), and a modification of the double layer due to urea adsorption. Together, these factors render the system markedly less "RC-like", manifested as a strong reduction of the phase angle maxima. In urea-containing solutions, the impedance magnitude
in the low-frequency range also increases substantially compared with solutions without urea, reflecting the influence of slow charge-transfer processes.
A more detailed analysis of the phase angle peaks shows that in "pure" alkaline solutions (1 M NaOH or 1 M KOH), the maximum phase shift reaches 66.2° at 0.019 Hz and 64.8° at 0.0427 Hz, respectively. This indicates that the relaxation process proceeds faster in KOH, which is consistent with the higher mobility of K+ and the potentially improved ion transport within the NiOOH layers. A similar trend is observed for systems containing carbonate ions: in 1 M NaOH + 0.1 M Na2CO3 the phase maximum is 70.1° at 0.0309 Hz, whereas in 1 M KOH + 0.1 M K2CO3 it is 59.8° at 0.0263 Hz. As seen, carbonate ions noticeably shift the phase angle maximum toward higher frequencies, suggesting the emergence of additional slow stages, most likely of adsorption-intercalation nature.
The introduction of urea fundamentally changes the system's behavior. In alkaline solutions containing CO(NH2)2, the phase angle maxima (at higher frequencies) become markedly lower: 6.8° at 16.6 Hz and 11.0° at 26.9 Hz for NaOH and KOH, respectively. Such a dramatic shift into the high-frequency region may indicate the emergence of rapid capacitance-controlled processes associated with the interaction of urea molecules with the surface of Ni-containing sites and with the modification of the interfacial layer at the atomic level. The phase shift decrease may also suggest partial destabilization or subtle structural changes in the NiOOH phase, making the surface reaction less "RC-like" and closer to the behavior of a system dominated by ohmic resistance.
The most complex frequency response is observed in mixed alkaline solutions containing both urea and carbonate ions. In these systems, the maximum phase shift reaches approximately 10.18° (22.9 Hz) and 13.95° (12.0 Hz). These values are intermediate between those of the pure "urea" and "carbonate" systems, yet they differ substantially in character: such parameters may indicate competition and mutual suppression between two types of processes, fast reactions involving CO(NH2)2 and slow surface rearrangements induced by CO32–.
Interestingly, in the solutions containing urea, the impedance modulus exhibits several inflection points and changes in slope on the Bode plot, unlike the solutions without added urea. The presence of two nearly linear regions in the frequency dependence of the impedance modulus correlates well with the corresponding maxima in the phase angle vs. frequency relationships. Such behavior indicates a multiprocess system with several distinct mechanisms, each dominating within its own frequency range. These results are fully consistent with the Nyquist diagrams and confirm that the modification of electrolyte composition is an effective tool for controlling electrode kinetics and the behavior of electrocatalysts in the urea oxidation reaction.
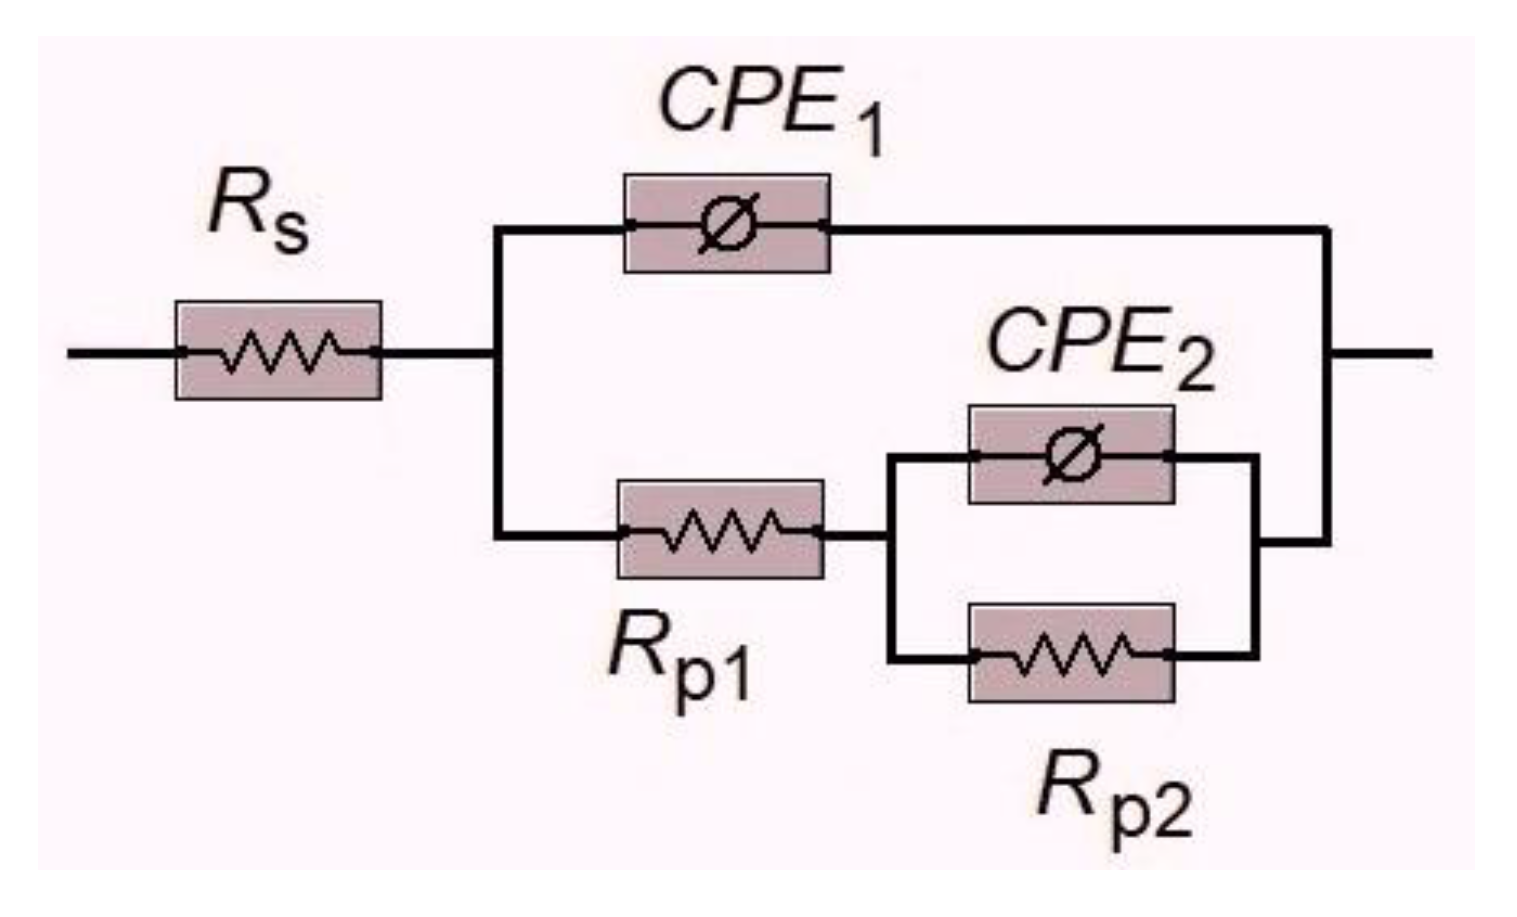
Based on the analysis of the features of the Nyquist and Bode plots, an equivalent circuit (
Figure 5), also known in the literature as the Armstrong–Henderson equivalent circuit [
43,
44], was proposed. This circuit has been previously used to interpret EIS measurements on oxidized nickel surfaces [
45,
46], including for the UOR occurring on such surfaces [
28,
47,
48,
49]. The equivalent circuit consists of the following elements:
1) the ohmic resistance of the solution (RS), which is localized in the electrolyte layer between the working electrode and the reference electrode. This parameter depends on the conductivity of the solution and the specific geometry of the electrochemical cell, and therefore does not characterize the kinetics of the studied electrochemical system;
2) an RC-like component consisting of a constant phase element (CPE1) connected in parallel with a polarization resistance (RP1);
3) an additional RC-like component consisting of a constant phase element (CPE2) connected in parallel with a polarization resistance (RP2), which is placed in series with RP1 in the electrical circuit.
It is worth noting that the polarization resistance
RP1(2) is typically associated with resistive behavior and corresponds to the electrochemical impedance according to the following equation:
where
Zreal is the real part of complex faradaic impedance value extrapolated to zero frequency.
The need to incorporate constant phase elements (CPEs) instead of "ideal" capacitive elements in the equivalent circuit is related to the geometric and energetic heterogeneity of the electrode surface [50, 51] and is diagnostically evident from the fact that the semicircles on the Nyquist plots are depressed (
Figure 3). Surface heterogeneity causes an uneven distribution of various properties across the electrode, such as surface capacitance, polarization resistance, and current distribution. As a result, the solid electrode surface deviates from the behavior of an ideal capacitor, for which the phase shift equals exactly –90°. The impedance of a constant phase element is usually described by the following equation:
where
Y is a parameter reflecting the capacitive behavior (non-ideal capacitor) with units of Ohm
–1 s
n cm
–2 (or F s
n–1 cm
–2);
is the imaginary unit;
is the angular frequency in rad s
–1 with
f being the frequency in hertz; and
n is a dimensionless empirical constant characterizing the phase deviation.
The value of
n can, in principle, vary from 0 to 1, determining the phase deviation as –90°×
n. If
n = 1, the electrode behaves as an ideal capacitor. If
n < 1, the phase deviation is less than 90° (in magnitude), indicating the presence of a constant phase element. The more heterogeneous the electrode surface becomes, the more
n deviates from unity [
42,
43], which is manifested as depressed (flattened) semicircles on the Nyquist plots.
In the employed equivalent circuit, the components
RP1 and
CPE1 correspond to the high-frequency region of the electrochemical impedance spectrum (i.e., the left semicircle in the plots of
Figure 3), whereas
RP2 and
CPE2 are associated with the low-frequency region of the spectrum (i.e., the right semicircle in
Figure 3). From the above, it follows that the
RP1 and
CPE1 elements of the equivalent circuit reflect the kinetic characteristics of the charge transfer process in the Ni(OH)
2 ↔ NiOOH redox reaction in alkaline media, whereas in solutions containing urea, they characterize the
indirect mechanism of urea oxidation. On the other hand, the
RP2 and
CPE2 elements (at lower frequencies) are responsible for adsorption processes on the nickel hydroxide surface in solutions without added CO(NH
2)
2 and, in urea-containing solutions, represent the kinetics of the
direct urea oxidation mechanism. The quantitative parameters of the individual elements of the adapted equivalent circuit, calculated using the Gamry Elchem Analyst software package, are summarized in
Table 3.
The obtained equivalent circuit parameters allow a quantitative assessment of the contribution of individual stages of the electrode processes to the overall impedance response. In particular, the values of the ohmic resistance RS for all studied solutions range from approximately 6.8 to 8.5 Ω, confirming the absence of significant changes in the conductivity of the medium or the geometry of the cell. A slight tendency toward lower RS values in KOH compared to NaOH is consistent with the somewhat higher ionic mobility of potassium ions; however, this effect is minor and does not determine the kinetics of the surface processes.
The behavior of the high-frequency block elements (RP1 and CPE1) is considerably more indicative. In "pure" alkaline solutions, the polarization resistance RP1 is lower in KOH than in NaOH, indicating faster charge transfer and more facile primary redox transformations in the Ni(OH)2/NiOOH system. The addition of carbonate further decreases RP1 in both systems, which may suggest a certain modification of the surface hydroxide phases or a change in the local structure of the double layer, facilitating the involved electron-ion transfers. In contrast, the introduction of urea has a fundamentally different effect: in NaOH, its presence only slightly increases RP1, whereas in KOH, RP1 rises sharply – almost threefold compared to pure KOH. This difference indicates that the interaction of urea with the active NiOOH sites strongly depends on the nature of the cation. It is likely that in KOH, adsorption or partial complexation of urea with the active surface sites leads to stronger blockage of the electrode surface, particularly in regions where fast charge transfer processes occur.
The CPE1 parameters support this conclusion. In "pure" alkaline solutions, the n1 values are close to ≈0.9, indicating pseudo-capacitive behavior approaching ideality and a relatively structurally homogeneous surface. In the presence of urea, n1 decreases to ≈0.67–0.68, regardless of the cation, reflecting increased heterogeneity of the surface states and the emergence of a more distributed pseudo-capacitance, likely due to the formation of a heterogeneous layer of adsorbed UOR intermediate products or partial restructuring of the NiOOH surface oxide. The increase in the capacitance parameter Y1 (especially in the NaOH + urea solution) may correspond to the accumulation of surface intermediates and an increase in the effective pseudo-capacitance at high frequencies.
The behavior of the low-frequency block, which represents the slow stages associated with adsorption phenomena and the direct pathway of urea oxidation, is entirely different. In "pure" NaOH and KOH solutions, the RP2 values are very high (mostly hundreds of Ω cm2), reflecting extremely slow electrochemical rearrangements within the hydroxide film. Notably, carbonate ions significantly increase RP2 (most markedly in NaOH), indicating strong inhibition of the slow stages, likely due to CO32– adsorption on NiOOH or incorporation of carbonate into the hydroxide-oxide structure. In contrast, urea induces a radically different effect: in NaOH + urea and KOH + urea solutions, RP2 sharply decreases to values on the order of a few Ω cm2. This behavior indicates a substantial facilitation of the processes dominating the low-frequency range and is consistent with the rapid oxidation of urea on NiOOH via direct mechanism when a sufficient number of surface active sites are available. Together with the increase in Y2 in these systems, this suggests the formation of a large number of adsorbed intermediate species and the activation of the pseudo-capacitive component, reflecting the multistep nature of UOR.
The combined effect of urea and carbonates is particularly noteworthy. In such systems, RP2 rises to intermediate values, while the CPE2 parameters remain elevated, indicating a competitive adsorption between urea and carbonate on the NiOOH surface sites. Consequently, the presence of carbonate partially counteracts the activating effect of urea in the low-frequency range, which is consistent with the reported blocking role of carbonates in alkaline Ni–UOR systems.
Thus, the analysis of the equivalent circuit model clearly demonstrates the distinct contributions of the individual solution components. Potassium ions accelerate the high-frequency charge-transfer processes in the Ni(OH)
2/NiOOH system, whereas urea strongly activates the low-frequency pathway associated with the direct mechanism of UOR. Carbonate ions, in contrast, inhibit processes in the low-frequency range, and in combined systems (simultaneous presence of CO(NH
2)
2 and CO
32–) their effect competes with the activating influence of urea. The observed trends are consistent with the Bode plot behavior (
Figure 4) and CVA analysis (
Figure 1 and
Figure 2), confirming that the electrode kinetics in Ni–urea systems are governed by the balance between fast surface NiOOH redox processes and slower adsorption-catalytic steps, which are sensitive to the nature of the electrolyte.
From a practical perspective, the obtained results are important for optimizing electrolytes intended for water electrolysis involving the urea oxidation process. In conventional alkaline electrolyzers operating via the HER/OER scheme, potassium hydroxide solutions are generally considered more favorable due to their higher ionic conductivity, which reduces the cell voltage and lowers energy consumption. However, in systems where urea oxidation replaces the oxygen evolution reaction, our results reveal a different scenario. In particular, the equivalent circuit parameters indicate that in NaOH + urea, RP1 values increase only slightly, whereas RP2 drops sharply to a few ohm cm2, reflecting the effective activation of the low-frequency channel of electrochemical transformations and accelerated progression of the key UOR steps. This suggests that in sodium-based electrolytes, urea does not block active sites in the high-frequency regime, while simultaneously significantly enhancing the direct oxidation mechanism.
In contrast, in KOH + urea, a pronounced increase in RP1 is observed, indicating inhibition of the fast NiOOH redox processes at the initial stages, while the increase in structural heterogeneity (decrease in n1) points to stronger disorganization of the surface layer. This effect may be associated with the specific interaction of K+ with hydrated urea molecules and surface Ni-containing sites. As noted above, K+ ions significantly influence the structure of the aqueous environment and the stability of adsorbed OH–; in the presence of organic molecules, it can form more stable solvation-adsorption clusters that hinder the progression of fast charge-transfer steps. Therefore, for UOR systems, sodium-based alkaline media prove to be a more effective matrix, providing an optimal balance between the availability of surface NiOOH active sites and sufficient hydration to facilitate the urea oxidation pathway.
Equally important is the effect of carbonate accumulation. In practical electrolyzers operating over extended periods with urea, carbonate content inevitably builds up due to the chemical and electrochemical decomposition of CO(NH2)2 molecules. Our results clearly demonstrate that the presence of CO32– substantially increases the low-frequency resistance RP2 (especially in KOH), hindering the slow stages and effectively "closing" the catalytic channel that would otherwise be available for UOR in purely alkaline solutions. This behavior is consistent with the probable intercalation or strong adsorption of carbonates on NiOOH phases, which limits hydroxide mobility and blocks reactive sites. In systems containing both urea and carbonate, competitive adsorption likely occurs, partially mitigating the activating effect of urea and indirectly highlighting the importance of controlling CO32– concentration in the electrolyte.
For practical electrolysis, this implies that carbonate accumulation is undesirable, as it gradually decreases UOR efficiency and promotes a return to kinetics characteristic of the slower OER. This can be mitigated through several approaches: periodic electrolyte regeneration (partial or complete replacement), maintaining a low-CO2 protective atmosphere, carbonate removal via precipitation (e.g., with Ca(OH)2 or Ba(OH)2), and optimizing the anode potential and hydrodynamic conditions to limit carbonate buildup. In long-term industrial processes, a two-pronged strategy may be most effective: employing NaOH as the primary electrolyte and performing periodic carbonate removal, which would help sustain high UOR rates while preventing catalytic activity degradation.
In a broader context, the obtained results demonstrate that the choice of electrolyte for UOR cannot be based solely on criteria established for conventional OER electrolysis. Interactions among the cation, the organic substrate molecule, and the surface NiOOH phases are complex, revealing that sodium-based media provide a more favorable combination of kinetics and stability, whereas potassium-based systems, although effective for OER, exhibit impaired performance under UOR conditions. Similarly, carbonate ions, which are often considered inert in OER systems, show a clearly detrimental effect in UOR. This highlights the need for specifically optimized electrolytes for urea-assisted hydrogen systems and opens opportunities for further research on additives that could selectively suppress carbonate adsorption or, conversely, stabilize favorable surface electrocatalytic sites.