
Submitted:
26 November 2025
Posted:
27 November 2025
You are already at the latest version
Abstract
Background/Objectives: Fermented foods are integral to European diets, yet compre-hensive data on their consumption patterns remain scarce. This study aimed to char-acterise fermented food intake across four European regions and examine demographic influences on consumption behaviour.
Methods: Cross-sectional data were collected from 12,646 adults in 53 countries (2023–2024) using the validated Fermented Food Frequency Questionnaire (3FQ) under the PIMENTO COST Action (CA 20128). Weighted analyses accounted for regional popu-lation distributions, sex, and age. Intake was assessed across 15 fermented food cate-gories, with prevalence and quantity estimates derived from frequency and portion-size data.
Results: Among all fermented food groups, fermented dairy products were consumed almost universally (94.1–95.6%) with median daily intakes of 66.7–80.1 g/day. Coffee and fermented cereals were also highly prevalent (78.4–84.1% and 89.9–95.9%, respectively), with median intakes of 60.0–73.1 g/day for coffee and 44.0–77.1 g/day for cereals. Choc-olate showed a weekly intake (76.0–138.8 g/week) with prevalence exceeding 90% in all regions. In contrast, fermented vegetables and legumes had low intakes (4.4–8.4 g/day and 4.5–9.0 g/week, respectively), and plant-based alternatives were consumed by up to 72.8% in Western Europe, but with a negligible intake (median 25.5 g/week). Alcoholic beverages varied regionally: wine ranged from 12.5 to 25.0 g/day, and beer/cider from 25.0 to 50.0 g/day. Fermented non-alcoholic beverages had low prevalence (18.3–49.3%) but relatively higher weekly intake among consumers (18.7–49.8 g/week). Across cate-gories, a clear discordance emerged between high prevalence and modest intake.
Conclusions: This Europe-wide mapping of fermented food consumption revealed substantial regional heterogeneity and modest overall intake. These findings help es-tablish baseline data for nutritional epidemiology research and evidence-based dietary guidelines, although they also support that region-specific rather than pan-European dietary guidelines may be required. Future research should integrate microbiome and other approaches to elucidate their combined health implications comprehensively.
Keywords:
fermented foods
; intake
; prevalence
; dietary paĴerns
; Europe
1. Introduction
Fermented foods and beverages have been part of traditional diets across the globe for centuries. People have long relied on them not only for preserving food but also for their distinctive flavours and cultural significance [1]. In recent years, they have attracted renewed scientific and public health interest due to their potential nutritional and health benefits [2,3,4]. Those are primarily attributed to functional compounds produced during microbial fermentation, such as organic acids, bioactive peptides, bacteriocins, exopolysaccharides, short-chain fatty acids, amino acid derivatives and vitamins [5,6,7]. These foods, produced by the metabolic activity of microorganisms, can enhance nutrient bioavailability, support gut and metabolic health, and mental health [8]. Moreover, they may introduce live microbes that may exert probiotic-like effects [9,10,11]. Emerging evidence also suggests that fermented foods may contribute to gut microbiome diversity, immune modulation, and metabolic regulation, although mechanistic insights and clinical validation remain limited [12,13].
The global diversity of fermented products is well documented, ranging from dairy and cereal-based foods to fermented vegetables, legumes, and beverages [13,14], reflecting their cultural and nutritional significance. These differences represent not only the culinary heritage but also the influence of local agricultural systems, further highlighting the nutritional and socio-cultural importance of fermented foods [15,16]. European fermented food traditions demonstrate substantial regional diversity with marked variation in product types, preparation methods, consumption frequency, and portion sizes [17,18,19].
Despite their prevalence, comprehensive data on the consumption patterns of fermented foods across Europe remain scarce. Existing studies typically concentrate on specific food types or on the consumption patterns of individual countries [19,20,21,22,23], limiting the ability to assess broader trends and demographic influences. Moreover, the lack of standardised definitions, variation of serving sizes, and regulatory frameworks for fermented foods complicates research reproducibility and consumer transparency [24]. Large-scale European studies, such as the European Prospective Investigation into Cancer (EPIC) InterAct study [25], apply standardised dietary assessment methods but, to date, have captured only limited characteristics of fermented foods required for a comprehensive classification across all major food groups. This gap hinders efforts to develop evidence-based dietary guidelines and to conduct robust nutritional epidemiology research exploring associations between fermented food intake and health outcomes.
Traditional food frequency questionnaires (FFQs) and national nutrition surveys often fail to capture the full diversity of fermented products or omit, for example, less conventional but increasingly relevant plant-based alternatives [26]. Moreover, many previous studies have relied on FFQs with limited definitions of fermented foods, potentially overlooking major food items consumed by the target populations. For instance, a recent study in Japan [27] demonstrated the complexity of identifying and quantifying fermented foods, including partially fermented products, highlighting their substantial contribution to energy and nutrient intake. Overall, these findings indicate the need for a more comprehensive and standardised approach to assessing fermented food consumption.
To address this critical gap, we have recently developed the Fermented Food Frequency Questionnaire (3FQ) under the Promoting Innovation of Fermented Foods [28] COST Action (CA20128) [29]. The 3FQ is the first validated tool specifically designed to assess habitual consumption of a broad range of fermented food categories across multiple European countries, enabling standardised comparisons, while accounting for local food environments. Thus, this tool could offer a strong foundation for advancing research and informing evidence-based policy. Using the 3FQ, consumption prevalence and intake of the fermented food groups studied, were collected across four European regions [30,31]. The present study aims to characterise fermented food consumption patterns among European populations and assess regional differences across major food groups.
2. Materials and Methods
Study Population and Data Collection
The current study is based on cross-sectional survey data collected using an online version of the 3FQ from adults residing in European countries between October 2023 and May 2024, conducted under the PIMENTO COST Action CA20128 framework. The questionnaire was initially developed in English by experts in food science and technology, nutrition, nutritional epidemiology, and consumer science. It was translated into 27 other languages by National Contact Points (NCPs) from participating countries using a standardised back-translation methodology. The study received approval from the Ethics Committee of the Agricultural University of Athens (27/05.05.2023) and adheres to the principles of the Declaration of Helsinki regarding research with human participants [32]. The study targeted to obtain representative samples per European region, with a minimum estimate of 1,536 per European region, as per STEP process (total N=6,144), stratified by sex and age group (18-49.9 years and ≥50 years). The European regions targeted included: Western Europe: Austria, Belgium, France, Germany, Ireland, Liechtenstein, Luxembourg, Andorra, Monaco, Netherlands, United Kingdom, Switzerland; Northern Europe: Estonia, Finland, Faroes, Iceland, Latvia, Lithuania, Norway, Denmark, Sweden; Central and Eastern Europe: Albania, Armenia, Azerbaijan, Georgia, Hungary, Poland, Romania, Bulgaria, Belarus, Bosnia and Herzegovina, Croatia, Kosovo, North Macedonia, Montenegro, Moldova, Slovakia, Czechia, Russia, Serbia, Slovenia and Ukraine; Southern Europe: Gibraltar, Greece, Italy, Malta, Portugal, San Marino, Türkiye, Holy See, Cyprus, Spain as defined by the EuroVoc [31]. All participants were asked to provide an informed consent via a General Data Protection Regulation (GDPR)-compliant platform (Conjointly, https://conjointly.com/ ) prior to data collection. The data used in the current analysis were fully anonymised, as no IP addresses were included and no other contact details were included in the database. The details of the development, implementation, and validation of the 3FQ have been previously reported [29,30]. Briefly, the core study sample comprised 12,646 participants from 53 countries, distributed across the four European regions: Northern Europe (n=9), Southern Europe (n=10), Central and Eastern Europe (n=22), and Western Europe (n=12).
Assessment of the Consumption of Fermented Foods
The 3FQ was developed to map the frequency and quantity of fermented food consumption across European regions, covering a diverse range of food categories, including 15 primary groups with multiple subcategories for each main group. These groups included plant-based meat and/or dairy alternatives; fermented dairy products; fermented pulses and legumes; fermented meat and/or fish products; fermented vegetable products; fermented cereal products; chocolate; fermented non-alcoholic beverage products; vinegar; coffee; fermented tea; cocoa beverages; beer or cider; wine and strong spirits. A screening, yes/no consumption question was primarily asked for each main fermented food group. If the response was positive, details on the frequency and quantity of subcategories within each food group followed. The screening question was used for two reasons: (i) to decrease response burden and move to the next food group, if one was not consumed, and (ii) to assess participants’ awareness of actual fermented foods per food group, using specific examples. Frequency of consumption for each food group was defined using predetermined categories ranging from “Never” to “Daily, more than two times” to standardise responses across individuals. To increase accuracy and consistency in dietary reporting, the questionnaire incorporated portion-validated food pictures, enabling participants to visually estimate and select the portion sizes that most closely represent their usual intake. Images were selected in consultation with nutrition professionals and, where possible, were aligned with data population intakes from national surveys. Each image was catalogued in a database linking visual cues to specific portion weights and standard household measures. Participants were asked to indicate the portion size most representative of their typical consumption, thereby minimising measurement errors and improving data reliability. Details of the 3FQ derivation can be viewed in the published protocol [30].
Demographic, Anthropometric and Health Data
The first part of the 3FQ collected general demographic information and self-reported anthropometric data. The participants’ educational levels were categorised according to international education standards (International Standard Classification of Education - ISCED). These included 4 categories: Primary (>6 years); Secondary (≥6-12 years); Bachelor’s University; and Postgraduate (MSc/PhD). Employment status was classified according to the Eurostat/International Labour Organization (ILO) labour force status standards. Specifically, participants were categorised as: employed full-time, employed part-time, not employed but a student, retired, unemployed, or a homemaker. Reported information on weight and height was used to calculate participants’ weight status using the Body Mass Index (BMI = weight in kilograms/height in meters. Participants were then categorised according to the World Health Organisation criteria [33]. (BMI < 18.5 indicates underweight; BMI 18.5–24.9 indicates normal weight; BMI ≥ 25.0 indicates overweight; BMI ≥ 30.0 indicates obesity). Information on marital and smoking status was also collected, along with questions about their health status (any chronic conditions and comorbidities), as these factors may affect knowledge and behaviour regarding fermented food consumption.
Participants were also asked to report whether they had a background in nutrition or food science. Sensitivity analyses were conducted to assess differences in consumption patterns between the total population and the population after excluding participants with a background in nutrition or food science.
Data Analysis
The population sample for the current study was adjusted to match the actual population sizes in each European region, with post-stratification weights across European regions, sex, and age groups to achieve comparability with the population structure. Observations were excluded from the analysis when regional population data were missing, preventing the assignment of weights. Socio-demographic characteristics and data on individual health conditions, as well as fermented foods consumption data, were presented using survey design analysis weighted by European region, as determined by the sampling structure and the latest population census. Categorical variables were presented proportionally to each region’s population. Pearson χ2 tests were performed to determine differences in regional distributions. Continuous variables were checked via P-P and k-density plots to determine whether they follow normal or skewed distribution and are presented as mean ± standard deviation (SD) and as median and range (25th, 75th percentiles), respectively. Between-group differences were tested using Analysis of variance (ANOVA) or the Kruskal-Wallis test for parametric and non-parametric continuous variables, respectively. Heatmaps were generated to portray consumption patterns and low-moderate and high response prevalence with corresponding intakes were derived and compared. Significance for all analyses was set at p<0.05. Database cleaning and statistical analysis were performed using Stata 18.0 (StataCorp, Texas Ltd.).
3. Results
Study Population Demographics
The socio-demographic and anthropometric characteristics of the study population by European Region are summarised in Table 1. Detailed characteristics of the study population by sex and age group are presented in Supplementary Materials, Tables S1 and S2, respectively. The total sample comprised 12,646 participants from 53 European countries across the four EuroVoc regions: Northern Europe (n = 2,315), Central-Eastern Europe (n = 5,185), Western Europe (n = 2,577) and Southern Europe (n = 2,569). Weighted values were applied to derive all results, and statistical analyses indicated significant differences between regions for all socio-demographic and health variables reported (Table 1). The median age ranged from 39 to 45 years, with the lowest median observed in Central-Eastern Europe and the highest in Northern Europe. Despite variations in sex distribution, women were the most prevalent respondents across all regions.
In terms of body weight, the Western Europe sample had the highest prevalence of normal weight (65.8%) and the lowest obesity rate (7.8%), whereas participants from Northern Europe exhibited the highest obesity prevalence (18.2%). Educational attainment was highest in Western Europe participants, with 54.6% holding postgraduate qualifications, followed by Southern Europe (39.9%), compared to 30.3% in Central-Eastern Europe.
Prevalence of Fermented Foods Consumption by European Region
Before answering questions on frequency and intake, respondents first specified for each fermented food category whether they consumed fermented foods from the specific product categories. Significant regional differences in the prevalence of fermented food consumption were observed across 14 of 15 categories (p<0.001 for all; Table S3, Figure 1). Fermented dairy products were the most widely consumed fermented foods across all regions (prevalence of 94.1% to 95.6%) and were the only category without significant regional variation, although a potential trend was observed (p = 0.059). Other highly consumed categories included fermented cereal products (89.9% to 95.9%) and coffee (78.4% to 84.1%). Heatmap visualisation (Figure 1) revealed three distinct consumption tiers: i) High prevalence of consumption (≥75%), which included fermented dairy products, chocolate, fermented cereals, fermented vegetables, and coffee, which were consistently consumed across regions; ii) Moderate prevalence of consumption (50–75%) including fermented meat/fish products, vinegar, wine, fermented pulses/legumes, and beer or cider that demonstrated intermediate consumption with notable regional variation; iii) Low prevalence of consumption (<50%) comprising of fermented non-alcoholic beverages, plant-based meat/dairy alternatives, cocoa beverages, and fermented tea that exhibited the lowest prevalence, with pronounced disparities. For instance, the prevalence of plant-based alternative consumers was substantially higher in Western Europe (72.8%) than in other regions (<52%), whereas the prevalence of fermented non-alcoholic beverage consumers was the lowest in Southern Europe (18.3%). Details of population-derived 95% CIs are provided in Supplementary Materials Table S3. The lowest consumption prevalence was observed for fermented tea (33.8% in Northern Europe to 44.3% in Central-Eastern Europe), while the most significant regional disparities were observed for plant-based meat/dairy alternatives (44.4% in Central-Eastern Europe vs. 72.8% in Western Europe) (Figure 1). Western Europe reported high consumption prevalence across most categories, except for strong spirits, cocoa beverages (moderate), fermented non-alcoholic beverages, plant-based alternatives, and fermented teas (low prevalence). Fermented pulses and legumes were highly consumed only in Western Europe (80.5%) but moderately in other regions (59.4%–67.6%). Similar patterns were observed for vinegar, wine, beer/cider, and plant-based alternatives. Fermented meat/fish products showed a moderate reported consumption prevalence in Southern Europe (62.5%), but were higher in the other regions, ranging from 75.5% in Western Europe to 83.2% in Central and Eastern Europe.
Intake Amounts of Fermented Foods Among Consumers
Among consumers, intake amounts varied substantially across regions and food groups (Table 2, Figure 2). Three main intake tiers were identified: (i) Low (0 to 50 g/day); (ii) Moderate (51 to 100 g/day); and (iii) High (>101 g/day). No fermented food category exceeded 101 g/day among daily consumers. Moderate daily intake was observed for fermented dairy and coffee across all regions, and for cereals only in Northern, Southern and Western Europe. Specifically, fermented dairy products had the highest median daily intake (66.7 g/day in Central-Eastern Europe to 80.1 g/day in Western Europe; p<0.001). Fermented yoghurt and milk ranged from 44–55.7 g/day, while cheese ranged from 5–20 g/day.
Coffee intake ranged from 60.0 ml/day in Southern and Central-Eastern Europe to 73.1 ml/day in Northern Europe (p<0.001). Fermented cereals ranged from 44.0 g/day in Central-Eastern Europe to 77.1 g/day in Northern Europe (p<0.001). Among alcoholic beverages, wine intake was highest in Western Europe (25.0 ml/day) compared to 12.5 ml/day in Central-Eastern Europe (p<0.001). Beer/cider ranged from 25.0 ml/day in Central-Eastern Europe to 45 and 50.0 ml/day in Northern and Western Europe, respectively (p<0.001).
Lastly, fermented vegetables showed one of the lowest daily intakes among groups, ranging from 2.1 g/day in Southern Europe to 8.4 g/day in Central-Eastern Europe.
For weekly consumption, chocolate showed the highest intake, with Western and Central-Eastern Europe reaching 138.8 g/week vs. 76.0 g/week in Northern Europe (p<0.001). Cocoa beverage consumption was consistent across regions (~66.4 ml/week; p<0.001). Plant-based alternatives had low weekly intake despite high prevalence, with only Western Europe showing measurable intake (25.5 g/week; others = 0; p<0.001). Fermented non-alcoholic beverages varied widely (18.7 ml/week in Southern Europe to 49.8 ml/week in Western Europe; p<0.001). Fermented meat/fish and vegetables also had low intakes: meat/fish ranged from 5.6 g/week in Southern Europe to 23.5 g/week elsewhere. Pulses/legumes were minimal (4.5 to 9.0 g/week), and fermented tea was negligible (0 in Western Europe to 16.6 g/week in Southern Europe; p<0.001).
Sensitivity analyses confirmed that regional differences persisted for most categories (e.g., cereals, vegetables, coffee, wine, beer/cider, chocolate), with most p-values remaining significant (<0.001). Some categories showed attenuated significance, such as fermented meat and fish, and some teas and beer, although differences remained.
Relationship Between Consumption Prevalence and Intake Amounts
A notable discordance was observed between consumption prevalence and actual intake amounts across several fermented food categories. Despite a near-universal consumption of fermented dairy products (94–96%), median daily intake remained moderate (66–80 g/day), suggesting frequent, small portions rather than large servings. Similarly, plant-based meat/dairy alternatives showed high prevalence of consumers in Western Europe (72.8%), but a negligible weekly intake (median 25.5 g/week), indicating sporadic or minimal consumption. Conversely, chocolate was widely consumed (91–96%) with a substantial weekly intake (76–139 g/week), particularly in Western and Central-Eastern Europe. In contrast, fermented non-alcoholic beverages displayed the opposite trend: a low prevalence of consumption (18–49%) but relatively higher weekly intake among consumers (19–50 g/week), suggesting that while few people consume these products, those who do tend to do so regularly and in larger quantities.
Discussion
The study aimed to provide a comprehensive, Europe-wide mapping of fermented food consumption patterns across regions, an essential step toward understanding the emerging knowledge of health-beneficial roles of these foods. The study conducted a systematic examination of 15 distinct fermented food categories across four European regions, with a weighted sample of 12,646 participants, to map both the self-reported prevalence of fermented food consumption and estimated intakes using validated survey methodology with population-representative sampling and the validated 3FQ tool [29,30]. The findings showed significant regional heterogeneity in fermented food consumption, highlighting the importance of region-specific nutritional interventions. Furthermore, a key observation was a mismatch between high reported consumption prevalence and low actual intake levels across many fermented food categories. This observation emphasises the complexity of dietary assessment and suggests that frequency-based measures alone may overestimate population-level intake of fermented foods, as participants may often misperceive their consumption.
Substantial regional variations were observed across most fermented foods, other than fermented dairy, confirming the distinctive nature of European fermented food traditions, which have been reported sporadically to date [14,18]. Distinct consumption patterns were identified across European regions, warranting further studies on fermented-food practices and bacterial communities. However, the regular and universal consumption of fermented dairy products (94 to 96% prevalence) at moderate levels (66 to 80 g/day) makes fermented dairy the primary contributor to fermented food intake across Europe, suggesting that fermented dairy products are culturally accepted. These findings warrant further research on optimal intakes of dairy-based probiotic fermented functional foods, given their observed health-promoting properties linked to gut microbiome diversity [2].
Although few studies have reported on fermented food intake patterns, the presented findings align with previous national and cohort-based evidence, which suggests that a limited set of fermented foods dominates European diets, particularly coffee, bread, yoghurts/cheeses, beer, and wine, with wide variation in less common categories (e.g., kombucha, water kefir, kvass) across countries. In the Dutch NQplus cohort, approximately 16–18% of consumed foods were classified as fermented, with an additional 9–14% consisting of dishes containing a fermented ingredient [22]. Specifically, the high contributors to fermented food intake included coffee (~453 g/day), yoghurts (~88 g/day), beer (~84 g/day), wholegrain bread (~81 g/day), wine (~65 g/day), and cheese (~32 g/day), comparable with the findings of the current study. The authors reported similar fermented food consumption patterns in Switzerland, with coffee at 251.9 g/d, bread products at 114.1 g/d, beer and cider at 103.3 g/d, yoghurt & fresh cheese at 71.9 g/d, and cheese consumption (including hard and soft cheeses) at around 43.9 g/d [23]. In a non-European context, a previous study in Japan reported that fermented foods contributed 438 g per person per day, accounting for approximately 17% of total food weight. The main sources were beer, coffee, bread, and yoghurt, confirming the importance of our findings in a global context [27].
One of the key findings of our study was that high self-reported consumption of fermented foods does not necessarily translate into actual consumption. Approximately 70% of respondents in Western Europe reported consuming plant-based alternatives, whereas intake in other regions was negligible or absent. This finding relates to the documented limitations of traditional FFQs in capturing the full diversity of fermented products [24]. Additionally, it supports calls for more detailed characterisation to classify fermented foods across major food groups, as highlighted in large-scale European studies such as EPIC InterAct [25].
Regarding other fermented foods, the low intake of traditional fermented vegetables and legumes/pulses warrants closer examination. Consumption was low, despite the potential health benefits of fermented vegetables and legumes as dietary sources of live microorganisms and their role in the gut microbiome diversity [1,10,34], highlighting a substantial gap between expected benefits and actual intake. A similar low intake of fermented vegetables (0.8 g/day) was also reported among Swiss adults [23]. This gap between expected benefits and real-world intake may reflect current market practices, in which vinegar-based pickled vegetables dominate European shelves because they have a long shelf life and can be mass-produced without refrigeration until opened. In contrast, traditional consumption patterns in other regions, such as Asia, include fermented vegetables as dietary staples. Cultural factors and taste preferences appear to play a significant role in limiting their adoption in Western countries [35].
When interpreting consumption patterns, it is essential to consider the diversity of fermentation practices across Europe. Traditional methods often rely on spontaneous fermentation and local microbial communities, while industrial processes may use standardised starter cultures and post-fermentation treatments such as pasteurisation, which can reduce microbial viability. These practices influence not only the nutritional and functional properties of fermented foods but also consumer perception and intake behaviour. For example, many unfermented pickles, whether salt-stock preserved in concentrated brine or vinegared with acetic acid, that are typically pasteurised, are often perceived as fermented, yet they lack the functional qualities of true fermented products like sour pickles, which develop lactic acid through natural fermentation and typically contain live microorganisms [36].
In this study, we applied the definition of fermented foods proposed by the International Scientific Association for Probiotics and Prebiotics (ISAPP) which defines them as “foods made through desired microbial growth and enzymatic conversions of food components.”[37] This definition provides a clear framework for distinguishing fermented foods from those that are acidified or stabilised by non-fermentative methods. Importantly, ISAPP emphasises that not all fermented foods contain live microorganisms at the time of consumption, particularly when post-fermentation methods such as pasteurisation are used. There are some small-to-midsize randomised clinical trials with postbiotics (i.e., microbial products or metabolic byproducts, such as peptides, organic acids, polysaccharides, cell wall fragments), and paraprobiotics (i.e., inactivated probiotics) that show promising health benefits to the host, such as mood [38], immune modulation, and gut health [39]. However, most trials are small, strain- or product-specific, and thus, more large, independent randomised controlled trials are needed. This distinction may have significant implications for dietary assessment, public health messaging, and the interpretation of the functional benefits of fermented food, although more research is required.
Moreover, the level of processing, including additives and/or heat treatment, can affect whether a food is classified as truly fermented, especially in the context of health-promoting live microbes. Indeed, the concept of characterising live microbes in foods in an epidemiological context was recently developed by Marco et al., who classified fermented and unfermented foods in the NHANES dataset based on their estimated microbial content, as low, medium, and high [40]. This study supported the classification of foods in the Swiss menuCH study, which applied detailed food characterisation, identifying 186 microorganisms across six taxonomic levels in the fermented foods consumed [23]. This approach established a comprehensive cartography of the microbial species ingested with fermented foods, while explicitly addressing viability based on the classification of live microorganism levels. Future studies should aim to characterise fermentation and processing methods alongside intake data to better understand dose–response relationships and the functional potential of fermented foods.
These results provide essential baseline data to understand the contribution of fermented foods to European diets and offer critical insights for public health nutrition policy, particularly given the growing interest in their potential health benefits and their role in sustainable food systems. Beyond the strengths of this study, several limitations warrant consideration. Firstly, the cross-sectional design precludes causal inference and is vulnerable to recall and social desirability biases, which affect all FFQs. Furthermore, as in most large European dietary surveys (including EPIC), convenience sampling with broad regional targets was used, aiming to achieve a specific number of participants by European region and sex or age group in each case, calculated using the STEPS design. Post-stratification analyses were applied using weights appropriate to each analysis dimension, yielding eight strata in each case. This widely used approach reduces potential bias in sample-based estimates and corrects imbalances that can occur between the sample design and the target population when response rates differ between subgroups [41].
Moreover, while the developed 3FQ tool distinguishes subcategories and portion sizes, it cannot differentiate among specific products per country, nor capture variations in brand, processing level, or post-fermentation treatments (e.g., pasteurisation). Additionally, in fermented products containing live microorganisms, viable microbial counts at the point of consumption were not evaluated, a parameter likely to modulate biological effects and vary across markets.
Conclusions
Overall, the results provide estimates of fermented food consumption across Europe by systematically examining 15 distinct categories of fermented food intake across European regions, using a standardised methodology, and provide the baseline data necessary for robust nutritional epidemiology research. This approach moves beyond simple prevalence measures by capturing actual intake levels and specific fermented-food subtypes. This could enable investigations into health associations and provide a foundation for evidence-based dietary guidelines, as emphasised by the PIMENTO initiative.
Looking ahead, integrating the 3FQ with multi-omics approaches, gut microbiome profiling, and detailed product characterisation, including viable microbial counts (probiotic effects) and metabolite profiles, may enable future studies to progress from descriptive exposure assessments to understanding dose–response relationships.
From a policy perspective, although no specific recommendations currently exist, several countries are considering dietary guidance that includes fermented foods. Our results suggest that population-level intake is modest across most categories, with significant regional differences, indicating that region-specific guidance and food environment strategies may be more feasible than a pan-European recommendation. Clarifying nomenclature and labelling, for example, indicating whether a fermented product contains live microbes at the time of consumption, could enhance consumer transparency and research reproducibility, in line with ISAPP recommendations.
Supplementary Materials
The following supporting information can be downloaded at the website of this paper posted on Preprints.org, Table S1. Socio-demographic & Anthropometric characteristics in the study population by European Region & Sex as depicted by the 3FQ1; Table S2. Socio-demographic & Anthropometric characteristics in the study population by European Region & Age Group as depicted by the 3FQ; Table S3. Prevalence of Fermented Food consumption in the study population by European Region
Author Contributions
Conceptualization, MS. and E.M.; methodology, E.M; formal analysis, T.S, E.M., M.S.; investigation, all authors.; data curation, T.S, E.M, C.P, N.M, M.S.; writing—original draft preparation, M.S and E.M.; writing—review and editing, all authors visualisation, M.S and E.M.; supervision, M.S and E.M.; project administration, M.S and E.M; funding acquisition, C.C. All authors have read and agreed to the published version of the manuscript.
Funding
The authors declare that financial support was received for the research and/or publication of this article. PIMENTO CA20128 is supported by COST (European Cooperation in Science and Technology; www.cost.eu). This article is based upon work from COST Action PIMENTO CA20128, supported by COST (European Cooperation in Science and Technology. Other sources also supported data collection: Igor Pravst acknowledges the Slovenian Research and Innovation Agency (ARIS P3-0395). Zuzana Ciesarova acknowledges the Slovak Research and Development Agency (APVV 23-0169).
Institutional Review Board Statement
The study was conducted in accordance with the Declaration of Helsinki and was approved by the Ethics Committee of the Agricultural University of Athens. Protocol number: 29/05.05.2023. Date of approval: 10/05/2023
Informed Consent Statement
Informed consent was obtained from all subjects involved in the study.
Data Availability Statement
The original contributions presented in this study are included in the article/supplementary material. Further inquiries can be directed to the corresponding author(s).
Acknowledgements
The authors sincerely thank all members who helped with the translation, dissemination and data collection for the questionnaire: J. Rajić, A. Kostić, D. Milinčić, S. Stanojević (SRB), Tagli Pitsi (EST), E. Hillesheim, J. J. Kristin Lüthi (CH), L. Hoxha (ALB), M. Beglaryan (ARM), M. Gandia (ESP), Taner Sar (SWE), M. Deschasaux (FRA), L. Ove Dragsted (DNK), L. Ozola (LV), M. Wronkowska (POL), A. Kušar, E. Hafner (SVN). The authors also thank the administrative team of PIMENTO for their support, particularly Nadège Picard and Elena Gerbaud (INRAE). This article/publication is based upon work from COST Action PIMENTO CA20128, supported by COST (European Cooperation in Science and Technology).
Conflicts of Interest
The authors declare no conflicts of interest. The funders had no role in the design of the study; in the collection, analyses, or interpretation of data; in the writing of the manuscript; or in the decision to publish the results.
References
- Tamang, J.P.; Cotter, P.D.; Endo, A.; Han, N.S.; Kort, R.; Liu, S.Q.; Mayo, B.; Westerik, N.; Hutkins, R. Fermented foods in a global age: East meets West. Compr Rev Food Sci Food Saf 2020, 19, 184-217. [CrossRef]
- Kaur, H.; Kaur, G.; Ali, S.A. Dairy-Based Probiotic-Fermented Functional Foods: An Update on Their Health-Promoting Properties. Fermentation 2022, 8, 425. [CrossRef]
- Valentino, V.; Magliulo, R.; Farsi, D.; Cotter, P.D.; O’Sullivan, O.; Ercolini, D.; Francesca. Fermented foods, their microbiome and its potential in boosting human health. Microbial Biotechnology 2024, 17. [CrossRef]
- Todorovic, S.; Akpinar, A.; Assunção, R.; Bär, C.; Bavaro, S.L.; Berkel Kasikci, M.; Domínguez-Soberanes, J.; Capozzi, V.; Cotter, P.D.; Doo, E.-H., et al. Health benefits and risks of fermented foods—the PIMENTO initiative. Frontiers in Nutrition 2024, 11. [CrossRef]
- Leeuwendaal, N.K.; Stanton, C.; O’Toole, P.W.; Beresford, T.P. Fermented Foods, Health and the Gut Microbiome. Nutrients 2022, 14, 1527. [CrossRef]
- Şanlier, N.; Gökcen, B.B.; Sezgin, A.C. Health benefits of fermented foods. Crit Rev Food Sci Nutr 2019, 59, 506-527. [CrossRef]
- Keyvan, E.; Adesemoye, E.; Champomier-Vergès, M.-C.; Chanséaume-Bussiere, E.; Mardon, J.; Nikolovska Nedelkoska, D.; Palamutoglu, R.; Russo, P.; Sarand, I.; Songre-Ouattara, L., et al. Vitamins formed by microorganisms in fermented foods: effects on human vitamin status—a systematic narrative review. Frontiers in Nutrition 2025, 12. [CrossRef]
- Balasubramanian, R.; Schneider, E.; Gunnigle, E.; Cotter, P.D.; Cryan, J.F. Fermented foods: Harnessing their potential to modulate the microbiota-gut-brain axis for mental health. Neuroscience & Biobehavioral Reviews 2024, 158, 105562. [CrossRef]
- Marco, M.L.; Heeney, D.; Binda, S.; Cifelli, C.J.; Cotter, P.D.; Foligné, B.; Gänzle, M.; Kort, R.; Pasin, G.; Pihlanto, A., et al. Health benefits of fermented foods: microbiota and beyond. Curr Opin Biotechnol 2017, 44, 94-102. [CrossRef]
- Rezac, S.; Kok, C.R.; Heermann, M.; Hutkins, R. Fermented Foods as a Dietary Source of Live Organisms. Frontiers in Microbiology 2018, 9. [CrossRef]
- Shah, A.M.; Tarfeen, N.; Mohamed, H.; Song, Y. Fermented Foods: Their Health-Promoting Components and Potential Effects on Gut Microbiota. Fermentation 2023, 9, 118. [CrossRef]
- Rul, F.; Béra-Maillet, C.; Champomier-Vergès, M.C.; El-Mecherfi, K.E.; Foligné, B.; Michalski, M.C.; Milenkovic, D.; Savary-Auzeloux, I. Underlying evidence for the health benefits of fermented foods in humans. Food & Function 2022, 13, 4804-4824. [CrossRef]
- Tamang, J.P.; Watanabe, K.; Holzapfel, W.H. Review: Diversity of Microorganisms in Global Fermented Foods and Beverages. Frontiers in Microbiology 2016, 7. [CrossRef]
- Cuamatzin-García, L.; Rodríguez-Rugarcía, P.; El-Kassis, E.G.; Galicia, G.; Meza-Jiménez, M.D.L.; Baños-Lara, M.D.R.; Zaragoza-Maldonado, D.S.; Pérez-Armendáriz, B. Traditional Fermented Foods and Beverages from around the World and Their Health Benefits. Microorganisms 2022, 10, 1151. [CrossRef]
- Lee, C.-H.; Ahn, J.; Son, H.-S. Ethnic fermented foods of the world: an overview. Journal of Ethnic Foods 2024, 11. [CrossRef]
- Santa, D.; Huch, M.; Stoll, D.A.; Cunedioglu, H.; Priidik, R.; Karakaş-Budak, B.; Matalas, A.; Pennone, V.; Girija, A.; Arranz, E., et al. Health benefits of ethnic fermented foods. Frontiers in Nutrition 2025, 12. [CrossRef]
- Baschali, A.; Tsakalidou, E.; Kyriacou, A.; Karavasiloglou, N.; Matalas, A.-L. Traditional low-alcoholic and non-alcoholic fermented beverages consumed in European countries: a neglected food group. Nutrition Research Reviews 2017, 30, 1-24. [CrossRef]
- Van Reckem, E.; Geeraerts, W.; Charmpi, C.; Van Der Veken, D.; De Vuyst, L.; Leroy, F. Exploring the Link Between the Geographical Origin of European Fermented Foods and the Diversity of Their Bacterial Communities: The Case of Fermented Meats. Frontiers in Microbiology 2019, 10. [CrossRef]
- Ashaolu, T.J.; Varga, L.; Greff, B. Nutritional and functional aspects of European cereal-based fermented foods and beverages. Food Res Int 2025, 209, 116221. [CrossRef]
- Praagman, J.; Dalmeijer, G.W.; Van Der Schouw, Y.T.; Soedamah-Muthu, S.S.; Monique Verschuren, W.M.; Bas Bueno-De-Mesquita, H.; Geleijnse, J.M.; Beulens, J.W.J. The relationship between fermented food intake and mortality risk in the European Prospective Investigation into Cancer and Nutrition-Netherlands cohort. British Journal of Nutrition 2015, 113, 498-506. [CrossRef]
- Ashaolu, T.; Reale, A. A Holistic Review on Euro-Asian Lactic Acid Bacteria Fermented Cereals and Vegetables. Microorganisms 2020, 8, 1176. [CrossRef]
- Li, K.J.; Brouwer-Brolsma, E.M.; Burton, K.J.; Vergères, G.; Feskens, E.J.M. Prevalence of fermented foods in the Dutch adult diet and validation of a food frequency questionnaire for estimating their intake in the NQplus cohort. BMC nutrition 2020, 6. [CrossRef]
- Pertziger, E.; von Ah, U.; Bochud, M.; Chatelan, A.; Haldemann, J.; Hillesheim, E.; Kaiser, M.; Vergères, G.; Burton-Pimentel, K.J. Classification and Estimation of Dietary Live Microorganisms and Fermented Foods Intake in Swiss Adults. J Nutr 2025, 155, 2717-2728. [CrossRef]
- Caffrey, E.B.; Perelman, D.; Ward, C.P.; Sonnenburg, E.D.; Gardner, C.D.; Sonnenburg, J.L. Unpacking Food Fermentation: Clinically Relevant Tools for Fermented Food Identification and Consumption. Advances in Nutrition 2025, 16, 100412. [CrossRef]
- Sluijs, I.; Forouhi, N.G.; Beulens, J.W.; van der Schouw, Y.T.; Agnoli, C.; Arriola, L.; Balkau, B.; Barricarte, A.; Boeing, H.; Bueno-de-Mesquita, H.B., et al. The amount and type of dairy product intake and incident type 2 diabetes: results from the EPIC-InterAct Study. Am J Clin Nutr 2012, 96, 382-390. [CrossRef]
- Park, S.; Bae, J.H. Fermented food intake is associated with a reduced likelihood of atopic dermatitis in an adult population (Korean National Health and Nutrition Examination Survey 2012-2013). Nutr Res 2016, 36, 125-133. [CrossRef]
- Fujihashi, H.; Sasaki, S. Identification and estimation of the intake of fermented foods and their contribution to energy and nutrients among Japanese adults. Public Health Nutrition 2024, 27, 1-27. [CrossRef]
- PIMENTO. Promoting Innovation of ferMENTed fOods (PIMENTO)-CA20128. Availabe online: https://www.cost.eu/actions/CA20128/ (accessed on October 15 2023).
- Magriplis, E.; Smiliotopoulos, T.; Myrintzou, N.; Burton-Pimentel, K.J.; Adamberg, S.; Adamberg, K.; Agagündüz, D.; Atanasova-Pancevska, N.; Beglaryan, M.; Brolsma, E.M.B., et al. Validation of the fermented food frequency questionnaire to assess consumption across four European regions: a study within the promoting innovation of fermented foods cost action. Frontiers in Nutrition 2025, 12. [CrossRef]
- Magriplis, E.; Kotopoulou, S.; Adamberg, S.; Burton-Pimentel, K.J.; Kitryte-Syrpa, V.; Laranjo, M.; Meslier, V.; Smiliotopoulos, T.; Vergères, G.; Vidovic, B., et al. Fermented Food Consumption Across European Regions: Protocol for the Development and Validation of the Web-Based Fermented Foods Frequency Questionnaire (3FQ). JMIR Res Protoc 2025, 14, e69212. [CrossRef]
- European Union. EuroVoc. Availabe online: https://eur-lex.europa.eu/browse/eurovoc.html?params=72,7211#arrow_1088 (accessed on April 20).
- Shrestha, B.; Dunn, L. The Declaration of Helsinki on Medical Research involving Human Subjects: A Review of Seventh Revision. J Nepal Health Res Counc 2020, 17, 548-552. [CrossRef]
- WHO. Global Health Observatory. Availabe online: .http://www.who.int/gho. (accessed on November 6).
- Park, I.; Mannaa, M. Fermented Foods as Functional Systems: Microbial Communities and Metabolites Influencing Gut Health and Systemic Outcomes. Foods 2025, 14, 2292. [CrossRef]
- Thierry, A.; Madec, M.-N.; Chuat, V.; Bage, A.-S.; Picard, O.; Grondin, C.; Rué, O.; Mariadassou, M.; Marché, L.; Valence, F. Microbial communities of a variety of 75 homemade fermented vegetables. Frontiers in Microbiology 2023, 14. [CrossRef]
- Behera, S.S.; El Sheikha, A.F.; Hammami, R.; Kumar, A. Traditionally fermented pickles: How the microbial diversity associated with their nutritional and health benefits? Journal of Functional Foods 2020, 70, 103971. [CrossRef]
- Marco, M.L.; Sanders, M.E.; Gänzle, M.; Arrieta, M.C.; Cotter, P.D.; De Vuyst, L.; Hill, C.; Holzapfel, W.; Lebeer, S.; Merenstein, D., et al. The International Scientific Association for Probiotics and Prebiotics (ISAPP) consensus statement on fermented foods. Nature Reviews Gastroenterology & Hepatology 2021, 18, 196-208. [CrossRef]
- Mutoh, N.; Kakiuchi, I.; Kato, K.; Xu, C.; Iwabuchi, N.; Ayukawa, M.; Kiyosawa, K.; Igarashi, K.; Tanaka, M.; Nakamura, M., et al. Heat-Killed L. helveticus Enhances Positive Mood States: A Randomized, Double-Blind, Placebo-Controlled Study. Brain Sciences 2023, 13, 973. [CrossRef]
- Salminen, S.; Collado, M.C.; Endo, A.; Hill, C.; Lebeer, S.; Quigley, E.M.M.; Sanders, M.E.; Shamir, R.; Swann, J.R.; Szajewska, H., et al. The International Scientific Association of Probiotics and Prebiotics (ISAPP) consensus statement on the definition and scope of postbiotics. Nature Reviews Gastroenterology & Hepatology 2021, 18, 649-667. [CrossRef]
- Marco, M.L.; Hutkins, R.; Hill, C.; Fulgoni, V.L.; Cifelli, C.J.; Gahche, J.; Slavin, J.L.; Merenstein, D.; Tancredi, D.J.; Sanders, M.E. A Classification System for Defining and Estimating Dietary Intake of Live Microbes in US Adults and Children. J Nutr 2022, 152, 1729-1736. [CrossRef]
- Henry, K.; Valliant, R. 1 Methods for Adjusting Survey Weights When Estimating a Total. 2012.
Figure 1.
Heatmap of fermented food consumption in the study population by European region. Values are weighted by population distribution and living area within the Primary Sampling Unit (PSU) for the European region. Weighted percentages (%) are depicted for the total population and percentages by variable of interest.
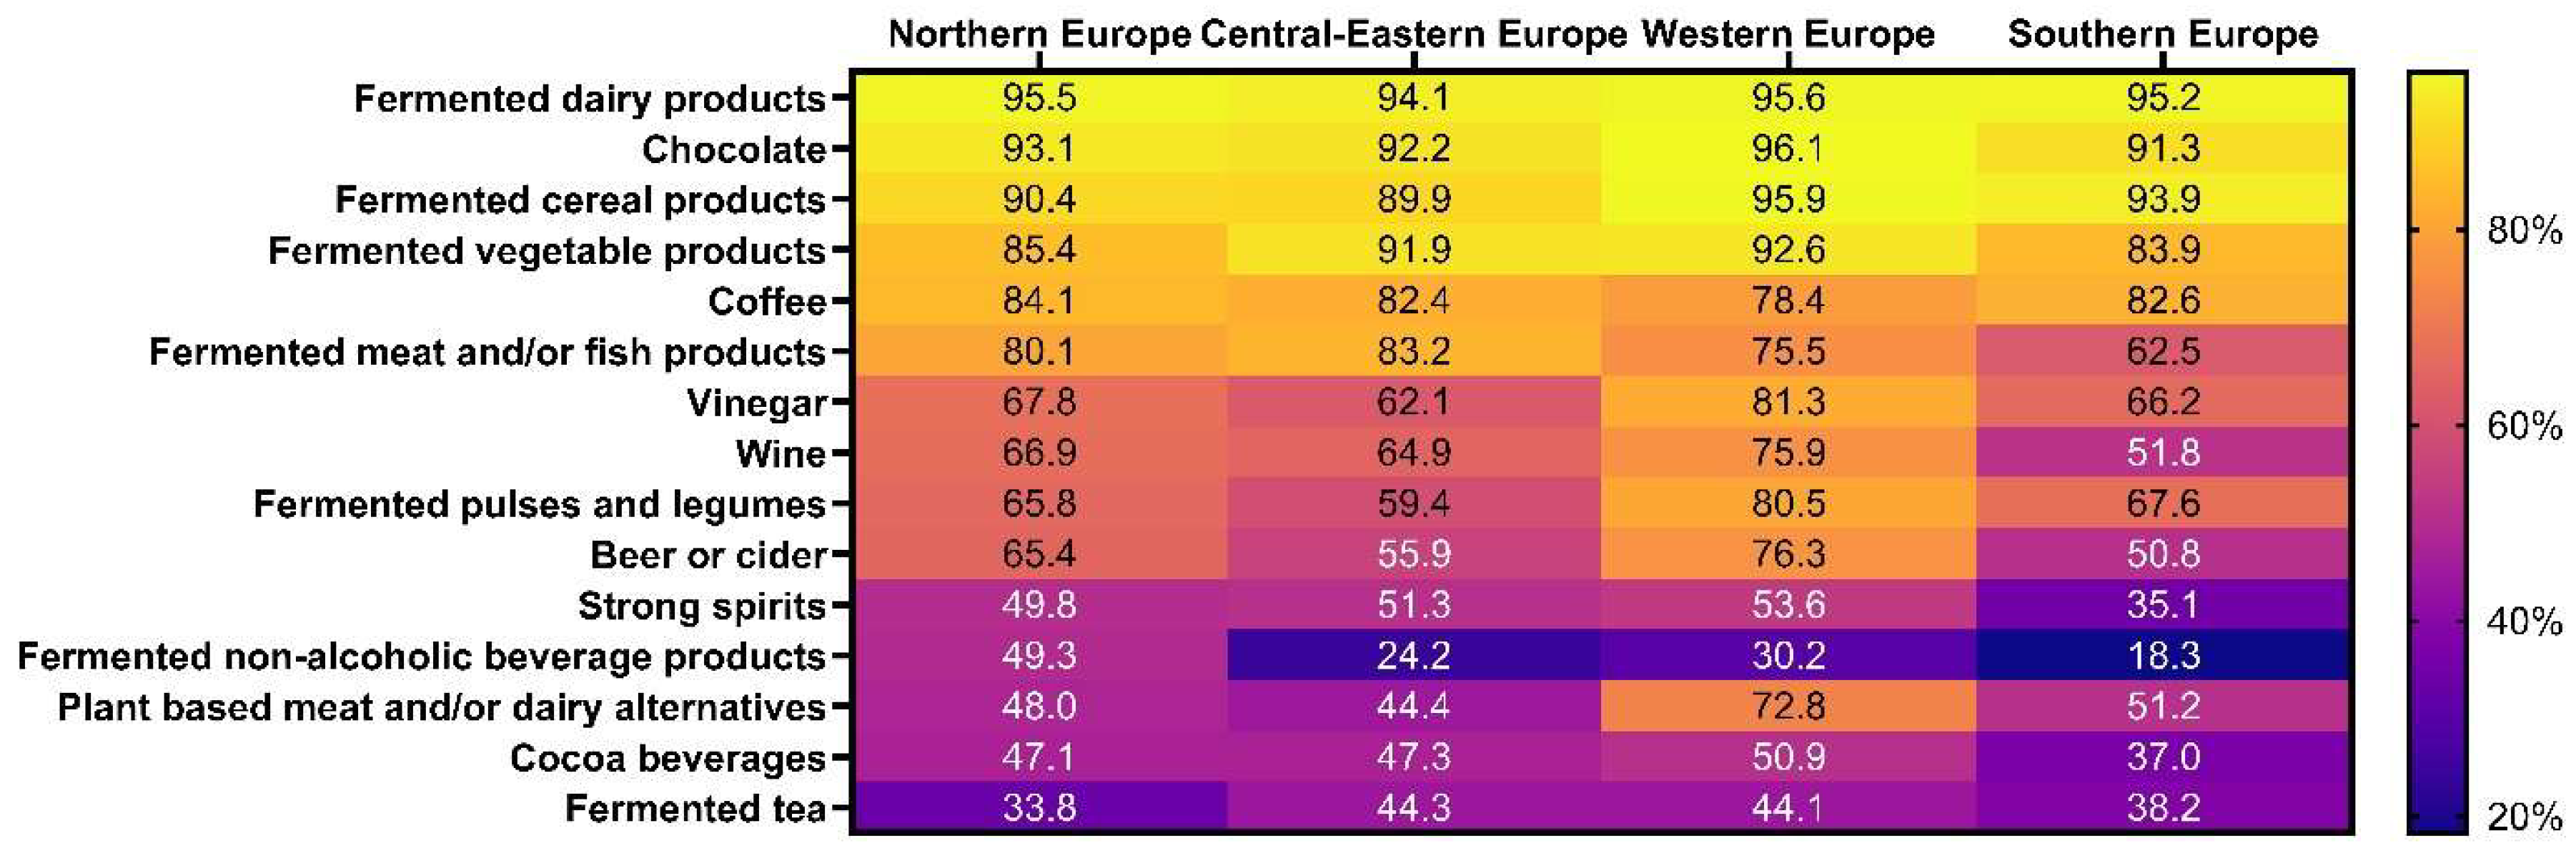
Figure 2.
Heatmap of regional differences in fermented food intake (g or ml/day) in the study population, as assessed by the 3FQ. Categories marked with * are reported in g/week.
Figure 2.
Heatmap of regional differences in fermented food intake (g or ml/day) in the study population, as assessed by the 3FQ. Categories marked with * are reported in g/week.
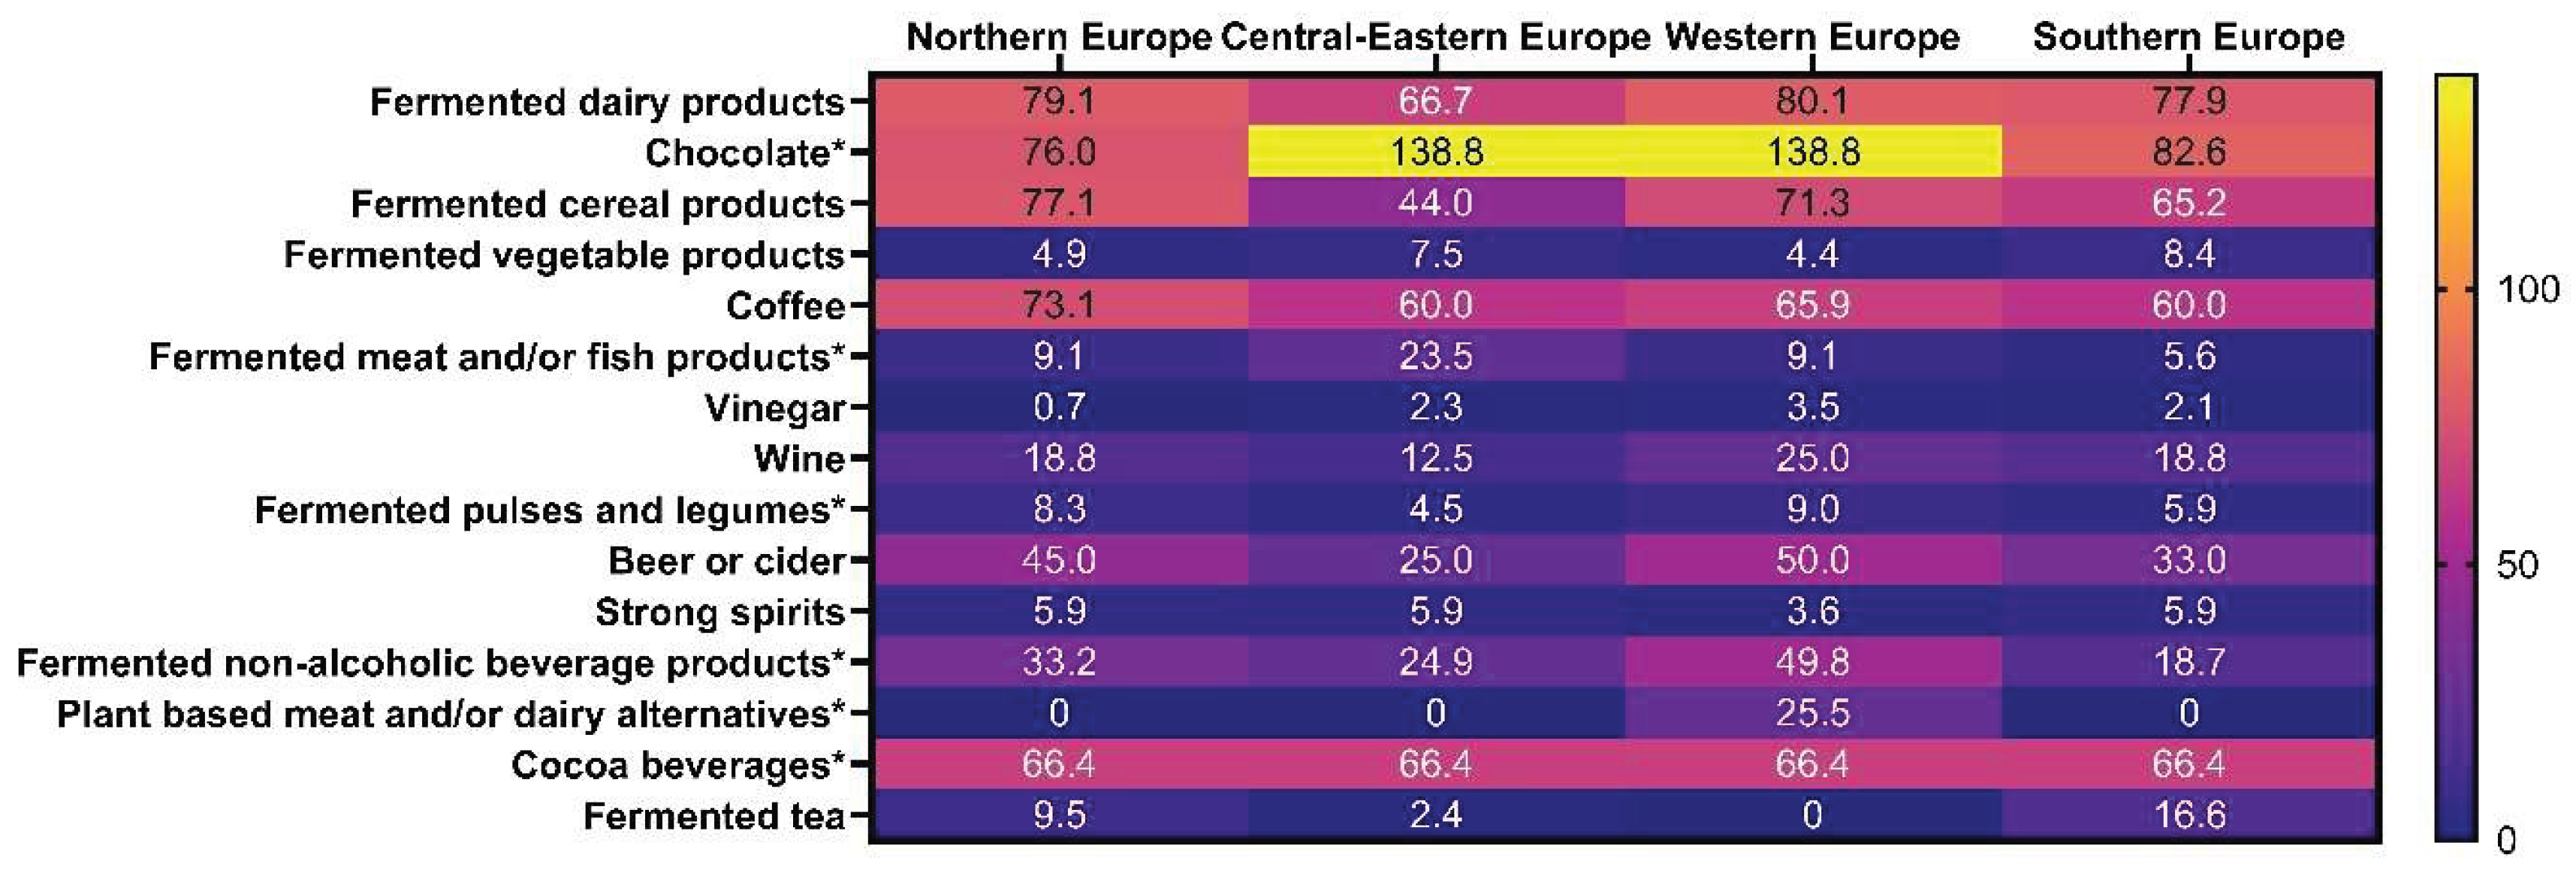

Table 1.
Socio-demographic and anthropometric characteristics in the study population by European region, as depicted in the 3FQ1.
Table 1.
Socio-demographic and anthropometric characteristics in the study population by European region, as depicted in the 3FQ1.
| Characteristic | European region | p-value | |||||||
| Northern Europe | Central-Eastern Europe | Western Europe | Southern Europe | ||||||
| (n=2,315) | (n=5,185) | (n=2,577) | (n=2,569) | ||||||
| % | CI | % | CI | % | CI | % | CI | ||
| n2=12,646 | 4.2% | - | 22.1% | - | 35.3% | - | 38.5% | - | |
| Age 3 | 45 (34, 56) | - | 39 (26, 50) | - | 38 (28, 52) | - | 40 (27, 52) | - | <0.001 |
| Sex | <0.001 | ||||||||
| Female | 65.9% | (63.97 - 67.84) | 70.6% | (69.37 - 71.86) | 68.7% | (66.87 - 70.47) | 65.7% | (63.79 - 67.47) | |
| Male | 34.1% | (32.16 - 36.03) | 29.4% | (28.14 - 30.63) | 31.3% | (29.53 - 33.13) | 34.4% | (32.53 - 33.17) | |
| Age group | <0.001 | ||||||||
| Age 18-50 | 61.5% | (59.53 - 63.50) | 75.8% | (74.64 - 76.97) | 73.2% | (71.43 - 74.86) | 71.9% | (70.07 - 73.57) | |
| Age 50+ | 38.5% | (36.50 - 40.47) | 24.2% | (23.03 - 25.36) | 26.8% | (25.14 - 28.57) | 28.1% | (26.43 - 29.93) | |
| BMI4 | <0.001 | ||||||||
| Underweight | 3.5% | (2.72 - 4.37) | 3.3% | (2.76 - 3.84) | 5.2% | (4.32 - 6.23) | 4.5% | (3.72 - 5.53) | |
| Normal weight | 49.7% | (47.45 - 51.93) | 56.4% | (54.89 - 57.89) | 65.8% | (63.77 - 67.82) | 53.6% | (51.47 - 55.79) | |
| Overweight | 28.7% | (26.70 - 30.75) | 28.9% | (27.53 - 30.27) | 21.2% | (19.51 - 23.01) | 28.6% | (26.68 - 30.60) | |
| Obesity | 18.2% | (16.52 - 19.97) | 11.5% | (10.54 - 12.46) | 7.8% | (6.70 - 9.00) | 13.2% | (11.83 - 14.76) | |
| Educational level | <0.001 | ||||||||
| Primary level or less | 1.0% | (0.68 - 1.52) | 0.8% | (0.60 - 1.10) | 0.6% | (0.33 - 0.93) | 6.6% | (5.66 - 7.60) | |
| Secondary level | 30.5% | (28.61 - 32.41) | 31.4% | (30.14 - 32.70) | 15.6% | (14.24 - 17.07) | 21.7% | (20.17 - 23.39) | |
| Bachelor’s/University level | 31.0% | (29.09 - 32.90) | 37.5% | (36.21 - 38.88) | 29.2% | (27.50 - 31.04) | 31.8% | (29.99 - 33.62) | |
| Postgraduate (MSc/PhD) level | 37.5% | (35.57 - 39.56) | 30.3% | (29.00 - 31.54) | 54.6% | (52.67 - 56.54) | 39.9% | (38.03 - 41.84) | |
| Employment Status | <0.001 | ||||||||
| Employed (full-time) | 65.4% | (63.44 - 67.38) | 67.1% | (65.82 - 68.43) | 58.1% | (56.19 - 60.02) | 59.2% | (57.26 - 61.10) | |
| Employed (part-time) | 12.5% | (11.15 - 13.89) | 5.1% | (4.52 - 5.75) | 22.9% | (21.30 - 24.57) | 7.3% | (6.37 - 8.41) | |
| Student | 6.9% | (5.96 - 8.07) | 16.2% | (15.15 - 17.20) | 12.1% | (10.9 - 13.46) | 18.8% | (17.31 - 20.37) | |
| Retired | 9.0% | (7.87 - 10.24) | 4.5% | (3.96 - 5.11) | 4.5% | (3.75 - 5.37) | 5.7% | (4.85 - 6.67) | |
| Unemployed | 4.4% | (3.63 - 5.34) | 5.5% | (4.92 - 6.19) | 1.8% | (1.33 - 2.37) | 2.6% | (2.03 - 3.29) | |
| Homemaker | 1.8% | (1.31 - 2.42) | 1.6% | (1.28 - 1.97) | 0.6% | (0.36 - 0.98) | 6.4% | (5.52 - 7.44) | |
| Marital Status | <0.001 | ||||||||
| Single | 26.6% | (24.83 28.50) | 36.5% | (35.09 - 37.82) | 30.6% | (28.84 - 32.45) | 40.5% | (38.61 - 42.46) | |
| Married/Living with spouse | 63.4% | (61.38 - 65.38) | 56.1% | (54.70 - 57.51) | 64.2% | (62.28 - 66.03) | 55.1% | (53.11 - 57.01) | |
| Divorced/Separated/Widowed | 10.0% | (8.79 - 11.28) | 7.4% | (6.73 - 8.22) | 5.2% | (4.41 - 6.15) | 4.4% | (3.67 - 5.29) | |
| Smoking Status | |||||||||
| Current smoker | 16.5% | (15.00 - 18.03) | 22.0% | (20.91 - 23.17) | 7.9% | (6.96 - 9.05) | 18.8% | (17.31 - 20.34) | <0.001 |
| E-cigarette/vaping only | 3.9% | (3.20 - 4.79) | 3.2% | (2.80 - 3.77) | 2.1% | (1.65 - 2.78) | 3.0% | (2.41 - 3.75) | |
| Ex-smoker | 13.0% | (11.70 - 14.46) | 8.7% | (7.99 - 9.53) | 11.9% | (10.71 - 13.22) | 9.2% | (8.10 - 10.34) | |
| Non-smoker | 66.6% | (64.65 - 68.51) | 66.0% | (64.70 - 67.29) | 78.0% | (76.36 - 79.57) | 69.1% | (67.23 - 70.82) | |
| Scientific Background on Food Science, Nutrition | <0.001 | ||||||||
| No | 72.4% | (70.50 - 74.17) | 72.2% | (70.96 - 73.45) | 64.3% | (62.46 - 66.18) | 62.3% | (60.40 - 64.18) | |
| Yes | 27.6% | (25.83- 29.50) | 27.8% | (26.55 - 29.04) | 35.7% | (33.82 - 37.54) | 37.7% | (35.82 - 39.60) | |
| Any Chronic Condition Diagnosed | <0.001 | ||||||||
| No | 58.4% | (56.35 - 60.41) | 73. 0% | (71.74- 74.19) | 74.0% | (72.24 - 75.66) | 66.3% | (64.39 - 68.08) | |
| Yes | 41.6% | (39.59- 43.65) | 27.0% | (25.81 - 28.26) | 26.0% | (24.34 - 27.76) | 33.7% | (31.92 - 35.61) | |
| Multimorbidity Status | <0.001 | ||||||||
| No chronic conditions | 58.4% | (56.35- 60.41) | 73.0% | (71.74 - 74.19) | 74.0% | (72.24 - 75.66) | 66.3% | (64.39 - 68.08) | |
| One chronic condition | 28.1% | (26.23 - 29.94) | 21.2% | (20.07 - 22.32) | 20.3% | (18.76 - 21.90) | 25.1% | (23.47 - 26.85) | |
| Two chronic conditions | 9.1% | (7.94 - 10.31) | 4.4% | (3.89 - 5.03) | 4.5% | (3.72 - 5.34) | 6.3% | (5.44 - 7.35) | |
| Three or more chronic conditions | 4.5% | (3.72 - 5.44) | 1.4% | (1.13 - 1.79) | 1.3% | (0.90 - 1.78) | 2.3% | (1.78 - 2.96) | |
| Any Cardiometabolic Condition Diagnosed | <0.001 | ||||||||
| No | 72.9% | (71.01 - 74.67) | 81. 8% | (80.70 - 82.83) | 88.1% | (86.82 - 89.34) | 78.6% | (76.96 - 80.16) | |
| Yes | 27.1% | (25.33 - 28.99) | 18.2% | (17.17 - 19.30) | 11.9% | (10.66 - 13.18) | 21.4% | (19.84 - 23.04) | |
Values are weighted by population distribution and living area within the Primary Sampling Unit (PSU) for the European region. Weighted percentages (%) are shown for the total population and for each variable of interest. P-values are based on Pearson’s chi-square tests for within-group total differences. An adjusted Wald test was performed for the within-group difference of age as a continuous variable.; 1 3FQ, Fermented Food Frequency Questionnaire; 2 n: study sample population; 3 Variables are presented as percentages assigned to each category, except for age, which is presented as median and quartiles 50 (25 - 75) according to each region’s distribution; 4 BMI: Body Mass Index, calculated as weight (kg) divided by height squared (m2).
Table 2.
Fermented Food Intake of the study population by European Region, as depicted by the 3FQ1.
| European region | ||||||||||
| Northern Europe | Central-Eastern Europe | Western Europe | Southern Europe | |||||||
| Characteristic | (n=2,315) | (n=5,185) | (n=2,577) | (n=2,569) | p-value | p-value* | p-value1 | p-value2 | p-value3 | p-value4 |
| Plant-based cheese (g/week) | 0 ( 0, 0 ) | 0 ( 0, 5.7 ) | 0 ( 0, 10.5 ) | 0 ( 0, 5.7 ) | 0.019 | 0.009 | 0.565 | <0.001 | 0.062 | 0.009 |
| Plant-based meat (g/week) | 0 ( 0, 5.8 ) | 0 ( 0, 0 ) | 10.5 ( 0, 37.5 ) | 0 ( 0, 0 ) | <0.001 | <0.001 | 0.474 | 0.029 | 0.048 | 0.744 |
| Plant-based yoghurt (g/week) | 0 ( 0, 14 ) | 0 ( 0, 0 ) | 0 ( 0, 28 ) | 0 ( 0, 0 ) | <0.001 | <0.001 | 0.393 | 0.003 | 0.170 | 0.104 |
| Total Plant-based meat or dairy products (g/week) | 0 ( 0, 28 ) | 0 ( 0, 10.5 ) | 25.5 ( 0, 110.3 ) | 0 ( 0, 19.4 ) | <0.001 | <0.001 | 0.287 | <0.001 | 0.028 | 0.032 |
| Hard Cheese (g/day) | 1 ( 0.4, 4.2 ) | 1 ( 0.4, 4.2 ) | 4.2 ( 1, 12.8 ) | 1 ( 0, 8.2 ) | <0.001 | <0.001 | 0.025 | 0.056 | 0.130 | 0.051 |
| Semi-hard cheese (g/day) | 8.2 ( 1, 20 ) | 2 ( 0.4, 8.2 ) | 4.2 ( 1, 12.8 ) | 1 ( 0, 8.2 ) | <0.001 | <0.001 | 0.976 | <0.001 | 0.324 | <0.001 |
| Semi-hard cheese (g/day) | 1 ( 0, 4.2 ) | 0.4 ( 0, 1 ) | 0.4 ( 0, 1 ) | 0 ( 0, 0.8 ) | <0.001 | <0.001 | <0.001 | 0.0285 | 0.361 | 0.019 |
| Soft and/or Fresh cheese (g/day) | 1 ( 0.4, 4.2 ) | 1 ( 0.4, 8.2 ) | 4.2( 1 , 8.2 ) | 4.2 ( 0.4, 20 ) | <0.001 | <0.001 | 0.044 | <0.001 | 0.044 | 0.094 |
| Soft and/or Fresh cheese (g/day) | 0.4 ( 0, 1 ) | 0.4 ( 0, 1 ) | 1 ( 0.4, 4.2 ) | 0.4 ( 0, 1 ) | <0.001 | <0.001 | 0.685 | 0.007 | 0.659 | 0.393 |
| Total Fermented cheese (g/day) | 10.2 ( 1.6, 28.1 ) | 5 ( 1, 19.4 ) | 20 ( 6.9, 41 ) | 12.8 ( 2.6, 26 ) | <0.001 | <0.001 | <0.001 | <0.001 | 0.073 | <0.001 |
| Fermented Yoghurt (g/day) | 42 ( 5, 128 ) | 42 ( 5, 128 ) | 42 ( 10, 128 ) | 42 ( 10, 128 ) | <0.001 | <0.001 | 0.233 | <0.001 | <0.001 | 0.006 |
| Fermented milk (ml/day) | 9.4 ( 0.7, 69.3 ) | 5 ( 0, 23.1 ) | 0 ( 0, 3.3 ) | 2 ( 0, 21 ) | <0.001 | <0.001 | 0.005 | 0.001 | 0.721 | 0.770 |
| Total Fermented milk and yoghurt (g/day) | 55.7 ( 10.6, 160 ) | 45.3 ( 10, 136.3 ) | 44 ( 10, 128 ) | 55.7 ( 10, 130.2 ) | <0.001 | <0.001 | 0.004 | <0.001 | <0.001 | 0.005 |
| Total Fermented dairy products (g/day) | 79.1 ( 24.1, 200.4 ) | 66.7 ( 20.3, 168.7 ) | 80.1 ( 32.2, 174.2 ) | 77.9 ( 27, 163.4 ) | 0.004 | 0.01 | 0.001 | <0.001 | <0.001 | 0.001 |
| Fermented chickpeas (g/week) | 3.1 ( 0, 7.7 ) | 3.08 ( 0, 7.7 ) | 0 ( 0, 4.3 ) | 0 ( 0, 14.9 ) | <0.001 | <0.001 | 0.025 | 0.039 | 0.206 | 0.005 |
| Fermented beans (g/week) | 0.7 ( 0, 2.1 ) | 0.7 ( 0, 2.1 ) | 0.7 ( 0, 2.1 ) | 0 ( 0, 1.7 ) | 0.501 | 0.22 | 0.723 | 0.643 | 0.006 | 0.001 |
| Fermented pulses-legumes sauce (g/week) | 5.2 ( 0.7, 10.4 ) | 0.7 ( 0, 5.2 ) | 5.2 ( 1.7, 21.7 ) | 0.7 ( 0, 5.2 ) | <0.001 | <0.001 | 0.094 | 0.145 | 0.119 | 0.605 |
| Total Fermented pulses and legumes (g/week) | 8.3 ( 3.1, 23.5 ) | 4.5 ( 0.7, 14.9 ) | 9 ( 2.1, 26.2 ) | 5.9 ( 0.7, 26.2 ) | <0.001 | <0.001 | 0.004 | 0.014 | 0.029 | 0.026 |
| Fermented meat (g/week) | 5.6( 2.2 , 23.5 ) | 23.5 ( 5.6, 71.7 ) | 5.6 ( 5.6, 23.5 ) | 5.6 ( 2.2, 23.5 ) | <0.001 | <0.001 | 0.187 | 0.297 | 0.361 | 0.461 |
| Fermented fish (g/week) | 11.3 ( 11.3, 11.3 ) | 11.3 ( 11.3, 11.3 ) | 11.3 ( 0, 11.3 ) | 11.3 ( 0, 11.3 ) | 0.003 | 0.004 | 0.283 | 0.299 | 0.973 | 0.069 |
| Fermented meat or fish sauce (g/week) | 0.7 ( 0, 1.7 ) | 0 ( 0, 0 ) | 0.7 ( 0, 1.7 ) | 0 ( 0, 0.7 ) | <0.001 | 0.043 | 0.270 | 0.452 | 0.960 | 0.150 |
| Total Fermented meat or fish (g/week) | 9.1 ( 5.2, 29.8 ) | 23.5 ( 5.6, 71.7 ) | 9.1 ( 5.6, 25.6 ) | 5.6 ( 2.2, 23.5 ) | <0.001 | <0.001 | 0.547 | 0.354 | 0.390 | 0.259 |
| Olives (g/day) | 1 ( 0.4, 3.5 ) | 2 ( 0.8, 8.4 ) | 2 ( 0.8, 4.2 ) | 6.3 ( 1.4, 20 ) | <0.001 | <0.001 | 0.325 | <0.001 | 0.119 | 0.001 |
| Fermented cabbage (i.e., Sauerkraut) (g/day) | 1.4 ( 0.3, 3.5 ) | 1.4 ( 0.3, 3.5 ) | 0.7 ( 0.3, 1.4 ) | 0.3 ( 0, 0.7 ) | <0.001 | <0.001 | 0.007 | 0.882 | 0.439 | 0.126 |
| Other fermented vegetables (g/day) | 2.1 ( 0.3, 6.4 ) | 2.92 ( 0.7, 10 ) | 0.7 ( 0, 2.9 ) | 0.28 ( 0, 2.1 ) | <0.001 | <0.001 | 0.092 | 0.382 | 0.799 | 0.040 |
| Total Fermented vegetables (g/day) | 4.9 ( 1.6, 18 ) | 7.5 ( 2, 20.4 ) | 4.4 ( 2, 9.6 ) | 8.4 ( 2, 22.3 ) | <0.001 | <0.001 | 0.003 | <0.001 | 0.538 | <0.001 |
| White bread (g/day) | 16.7 ( 3.2, 62.1 ) | 25 ( 2, 72.2 ) | 8.3 ( 1.8, 48.3 ) | 27.5 ( 3.8, 79.4 ) | <0.001 | <0.001 | 0.618 | 0.974 | 0.059 | 0.001 |
| White sourdough bread (g/day) | 7.9 ( 1.8, 32.6 ) | 1 ( 0, 4.6 ) | 2.6 ( 0.6, 11.3 ) | 1.8 ( 0, 8.8 ) | <0.001 | <0.001 | 0.058 | 0.323 | 0.302 | <0.001 |
| Total White or white sourdough bread (g/day) | 30.1 ( 6.9, 79.4 ) | 25.4 ( 3.2, 76.3 ) | 16.7 ( 3.2, 64.5 ) | 35.9 ( 7.3, 94 ) | <0.001 | <0.001 | 0.639 | 0.777 | 0.043 | 0.176 |
| Whole grain bread (g/day) | 16.7 ( 4, 61.3 ) | 4 ( 0.8, 25.4 ) | 19.7 ( 4, 72.2 ) | 5.3 ( 0.8, 30.1 ) | <0.001 | <0.001 | 0.192 | 0.005 | 0.694 | <0.001 |
| Whole grain sourdough bread (g/day) | 6.1 ( 1.8, 28.1 ) | 0.4 ( 0, 3.4 ) | 2.9 ( 0.7, 13.9 ) | 0.7 ( 0, 3.5 ) | <0.001 | <0.001 | 0.447 | 0.137 | 0.850 | <0.001 |
| Total Whole grain,whole grain sourdough bread (g/day) | 26.5 ( 6.4, 79.7 ) | 5.9 ( 0.8, 25.9 ) | 28.8 ( 6.7, 91.3 ) | 7.7 ( 0.9, 35.7 ) | <0.001 | <0.001 | 0.096 | 0.005 | 0.793 | <0.001 |
| Total Bread (g/day) | 75.9 ( 26.1, 168.2 ) | 42 ( 15.8, 106.1 ) | 71.9 ( 25.4, 164.6 ) | 60.9 ( 25, 129.7 ) | <0.001 | <0.001 | 0.189 | 0.086 | 0.299 | 0.091 |
| Trahana (g/day) | 0 ( 0, 0 ) | 0 ( 0, 0.7 ) | 0 ( 0, 0 ) | 0 ( 0, 2.8 ) | <0.001 | <0.001 | 0.220 | 0.166 | 0.711 | <0.001 |
| Total Fermented cereals (g/day) | 77.1 ( 27.3, 169.3 ) | 44 ( 16.2, 111.3 ) | 71.3 ( 25, 164.3 ) | 65.2 ( 25.7, 133.9 ) | <0.001 | <0.001 | 0.140 | 0.061 | 0.311 | 0.191 |
| Milk chocolate (g/week) | 33 ( 6.6, 138.8 ) | 69.4 ( 16.5, 211.5 ) | 33 ( 6.6, 138.8 ) | 33 ( 6.6, 138.8 ) | <0.001 | <0.001 | 0.370 | 0.342 | 0.246 | <0.001 |
| Dark chocolate (g/week) | 16.5 ( 6.6, 69.4 ) | 16.5 ( 6.6, 69.4 ) | 69.4 ( 16.5, 208.2 ) | 16.5 ( 6.6,138.8) | <0.001 | <0.001 | 0.029 | 0.297 | 0.190 | 0.066 |
| White chocolate (g/week) | 6.6 ( 0, 13.2 ) | 6.6 ( 0, 16.5 ) | 6.6 ( 0, 6.6 ) | 0 ( 0, 6.6 ) | <0.001 | <0.001 | 0.411 | 0.282 | 0.208 | 0.564 |
| Total Chocolate (g/week) | 76 ( 33, 211.5 ) | 138.8 ( 39.7, 422.9 ) | 138.8 ( 46.3, 330.4 ) | 82.6 ( 33, 257.7 ) | <0.001 | <0.001 | 0.804 | 0.150 | 0.730 | 0.089 |
| Kombucha (ml/week) | 12.5 ( 0, 31.2 ) | 0 ( 0, 24.9 ) | 24.9 ( 12.5, 62.3 ) | 8.3 ( 0, 31.2 ) | 0.007 | 0.007 | 0.925 | 0.158 | 0.048 | 0.925 |
| Cereal drinks (i.e., Amazake) (ml/week) | 24.9 ( 0, 62.3 ) | 12.5 ( 0, 24.9 ) | 0 ( 0, 8.3 ) | 0 ( 0, 12.5 ) | <0.001 | <0.001 | 0.253 | 0.003 | 0.042 | 0.512 |
| Water kefir (ml/week) | 0 ( 0, 0 ) | 0 ( 0, 8.3 ) | 0 ( 0, 24.9 ) | 0 ( 0, 8.3 ) | <0.001 | <0.001 | 0.645 | 0.694 | 0.031 | 0.258 |
| Total Fermented non-alcoholic beverages (ml/week) | 33.2 ( 20.8, 87.2 ) | 24.9 ( 8.3, 62.3 ) | 49.8 ( 24.9, 130.8 ) | 18.7 ( 0, 62.3 ) | <0.001 | <0.001 | 0.871 | 0.708 | 0.002 | 0.616 |
| Apple vinegar (g/day) | 0.3 ( 0.1, 1 ) | 0.7 ( 0.1, 3.2 ) | 0.3 ( 0.1, 1.5 ) | 0.3 ( 0.1, 1 ) | <0.001 | <0.001 | 0.246 | 0.085 | 0.537 | 0.054 |
| Grape vinegar (g/day) | 0.1 ( 0, 0.3 ) | 0.1 ( 0, 1 ) | 0.3 ( 0, 1 ) | 0.3 ( 0.1, 1.5 ) | <0.001 | <0.001 | 0.814 | 0.084 | 0.411 | 0.250 |
| Balsamic vinegar (g/day) | 0.3 ( 0.1, 0.74 ) | 0.1 ( 0, 1 ) | 1 ( 0.3, 3.2 ) | 0.3 ( 0.1, 3.1 ) | <0.001 | <0.001 | 0.214 | 0.116 | 0.040 | 0.580 |
| Other vinegar (g/day) | 0.1 ( 0, 0.3 ) | 0 ( 0, 0.3 ) | 0.1 ( 0, 0.6 ) | 0 ( 0, 0.1 ) | 0.002 | 0.002 | 0.923 | 0.366 | 0.322 | 0.213 |
| Total Vinegar-all types (g/day) | 0.7 ( 0.3, 3.1 ) | 2.3 ( 0.4, 9.5 ) | 3.5 ( 1, 9.9 ) | 2.1 ( 0.5, 6.3 ) | <0.001 | <0.001 | 0.135 | 0.312 | 0.171 | 0.085 |
| Espresso coffee (ml/day) | 1.2 ( 0, 31.5 ) | 12.8 ( 1.2, 38.4 ) | 19.2 ( 0.6, 60 ) | 12.6 ( 0, 60 ) | <0.001 | <0.001 | 0.009 | 0.171 | 0.58 | 0.002 |
| Arabic coffee (ml/day) | 0 ( 0, 1.2 ) | 6.3 ( 0, 60 ) | 0 ( 0, 0.6 ) | 1.2 ( 0, 12.6 ) | <0.001 | <0.001 | 0.170 | 0.005 | 0.373 | 0.038 |
| Filter coffee (ml/day) | 49.8 ( 2.4, 379.2 ) | 0 ( 0, 4.7 ) | 4.7 ( 0, 151.7 ) | 2.4 ( 0, 49.8 ) | <0.001 | <0.001 | <0.001 | 0.024 | 0.014 | 0.228 |
| Instant coffee (ml/day) | 1.6 ( 0, 11.9 ) | 4.7 ( 0, 75.8 ) | 0 ( 0, 4.7 ) | 4.7 ( 0, 49.8 ) | <0.001 | <0.001 | 0.160 | 0.069 | 0.884 | 0.302 |
| Total Coffee (ml/day) | 73.1 ( 12.6, 241.7 ) | 60 ( 20, 150 ) | 65.9 ( 29.6, 240 ) | 60 ( 13.8, 156.2 ) | <0.001 | <0.001 | 0.388 | 0.008 | 0.079 | 0.018 |
| Puer tea (ml/day) | 4.7 ( 0, 24.9 ) | 0 ( 0, 11.9 ) | 0 ( 0, 4.7 ) | 11.9 ( 0, 237 ) | <0.001 | <0.001 | 0.969 | 0.592 | 0.833 | <0.001 |
| Anhui tea (ml/day) | 0 ( 0, 0 ) | 0 ( 0, 0 ) | 0 ( 0, 0 ) | 0 ( 0, 0 ) | 0.423 | 0.804 | 0.145 | 0.461 | 0.343 | 0.094 |
| Guangxi tea (ml/day) | 0 ( 0, 0 ) | 0 ( 0, 0 ) | 0 ( 0, 0 ) | 0 ( 0, 0 ) | 0.009 | 0.124 | <0.001 | 0.372 | 0.442 | 0.788 |
| Hubei tea (ml/day) | 0 ( 0, 2.4 ) | 0 ( 0, 2.4 ) | 0 ( 0, 0 ) | 0 ( 0, 0 ) | 0.015 | 0.101 | 0.032 | 0.246 | 0.818 | 0.431 |
| Fuzhuan tea (ml/day) | 0 ( 0, 0 ) | 0 ( 0, 0 ) | 0 ( 0, 0 ) | 0 ( 0, 0 ) | 0.382 | 0.602 | 0.020 | 0.340 | 0.940 | 0.127 |
| Sichuan tea (ml/day) | 0 ( 0, 0 ) | 0 ( 0, 0 ) | 0 ( 0, 4.7 ) | 0 ( 0, 0 ) | <0.001 | 0.019 | 0.067 | 0.289 | 0.518 | 0.122 |
| Total Fermented Tea (ml/day) | 9.5 ( 1.6, 39.3 ) | 2.4 ( 0, 21.3 ) | 0 ( 0, 14.2 ) | 16.59 ( 0, 237 ) | <0.001 | <0.001 | 0.298 | 0.506 | 0.843 | <0.001 |
| Sweetened cocoa beverages (ml/week) | 33.2 ( 33.2, 83 ) | 33.2 ( 16.6, 83 ) | 33.2 ( 33.2, 83 ) | 33.2 ( 16.6, 83 ) | 0.511 | 0.662 | 0.729 | 0.046 | 0.261 | 0.236 |
| Unsweetened cocoa beverages (ml/week) | 33.2 ( 0, 33.2 ) | 33.2 ( 0, 41.5 ) | 16.6 ( 0, 33.2 ) | 33.2 ( 0, 83 ) | 0.053 | 0.092 | 0.103 | 0.993 | 0.164 | 0.888 |
| Total Cocoa beverages (ml/week) | 66.4 ( 33.2, 116.1 ) | 66.4 ( 33.2, 174.2 ) | 66.4 ( 33.2, 116.1 ) | 66.4 ( 33.2, 165.9 ) | 0.508 | 0.439 | 0.444 | 0.099 | 0.076 | 0.454 |
| Beer (ml/day) | 16.5 ( 6.6, 69.3 ) | 16.5 ( 6.6, 69.3 ) | 25 ( 10, 105 ) | 23.1 (8.25, 69.3 ) | <0.001 | 0.007 | 0.003 | 0.070 | 0.054 | 0.139 |
| Alcohol-free beer (ml/day) | 6.6 ( 0, 16.5 ) | 0 ( 0, 6.6 ) | 5.67 ( 0, 16.5 ) | 0 ( 0, 6.6 ) | <0.001 | <0.001 | 0.041 | 0.540 | 0.004 | 0.338 |
| Cider (ml/day) | 10 ( 3.3, 25 ) | 3.3 ( 0, 10 ) | 10 ( 3.3, 16.5 ) | 0 ( 0, 10 ) | <0.001 | <0.001 | 0.012 | 0.230 | 0.447 | 0.47 |
| Alcohol-free cider (ml/day) | 0 ( 0, 10 ) | 0 ( 0, 0 ) | 0 ( 0, 0 ) | 0 ( 0, 0 ) | <0.001 | <0.001 | 0.096 | 0.046 | 0.235 | 0.832 |
| Total Beer or cider (ml/day) | 45 (16.5, 115.5 ) | 25 ( 10, 75.9 ) | 50 ( 23.1, 130 ) | 33 ( 16.5, 102.3 ) | <0.001 | <0.001 | <0.001 | 0.056 | 0.049 | 0.168 |
| White wine (ml/day) | 6.3 ( 2.5, 26.3 ) | 6.3 ( 2.5, 17.5 ) | 6.3 ( 2.5, 26.3 ) | 6.3 ( 2.5, 26.3 ) | 0.473 | 0.348 | 0.781 | 0.840 | 0.002 | 0.782 |
| Red wine (ml/day) | 6.3 ( 4.2, 26.3 ) | 6.3 ( 2.5, 12.5 ) | 12.5 ( 5, 31.3 ) | 6.3 ( 4.2, 31.3 ) | <0.001 | <0.001 | 0.427 | 0.054 | 0.030 | 0.830 |
| Rose wine (ml/day) | 5 ( 2.5, 12.5 ) | 2.5 ( 2.5, 6.3 ) | 5 ( 2.5, 6.3 ) | 5 ( 2.5, 12.5 ) | 0.066 | 0.099 | 0.876 | 0.033 | 0.156 | 0.270 |
| Alcohol free wine (ml/day) | 5 ( 2.5, 5 ) | 2.5 ( 1.7, 5 ) | 2.5 ( 2.5, 5 ) | 2.5 ( 0, 2.5 ) | 0.772 | 0.592 | 0.695 | 0.147 | 0.491 | 0.342 |
| Total Wine-all types (ml/day) | 18.8 ( 7.5, 52.5 ) | 12.5 ( 5.8, 31.3 ) | 25 ( 10.4, 61.3 ) | 18.8 ( 7.5, 55.8 ) | <0.001 | <0.001 | 0.704 | 0.446 | 0.002 | 0.708 |
| Strong spirits (ml/day) | 5.9 ( 2.4, 17.8 ) | 5.9 ( 2.4, 24.9 ) | 3.6 ( 2.4, 8.9 ) | 5.9 ( 2.4, 17.8 ) | <0.001 | <0.001 | 0.344 | 0.081 | 0.295 | 0.032 |
Values are weighted by population distribution and living area within the Primary Sampling Unit (PSU) for the European region. Weighted percentages (%) are depicted for the total population and percentages by variable of interest. P-values are based on the Adjusted Wald test for within-group difference for continuous variables. P-value* indicates the results of the sensitivity analysis conducted to test whether the aforementioned results differ if we exclude participants who have a scientific background in nutrition. Additionally, p-values 1-4 show the results of the sensitivity analysis, testing whether there are statistically significant differences in FF intake across European regions when comparing total participants versus participants without a scientific background in nutrition. P-value1: Northern Europe, P-value2: Central-Eastern Europe, P-value3: Western Europe and P-value4: Southern Europe. 1 3FQ, Fermented Food Frequency Questionnaire; 2 n: study sample population; 3 Variables are presented as median and quartiles 50 (25 - 75) according to the skewed distribution of intakes.
Disclaimer/Publisher’s Note: The statements, opinions and data contained in all publications are solely those of the individual author(s) and contributor(s) and not of MDPI and/or the editor(s). MDPI and/or the editor(s) disclaim responsibility for any injury to people or property resulting from any ideas, methods, instructions or products referred to in the content. |
© 2025 by the authors. Licensee MDPI, Basel, Switzerland. This article is an open access article distributed under the terms and conditions of the Creative Commons Attribution (CC BY) license (http://creativecommons.org/licenses/by/4.0/).
Copyright: This open access article is published under a Creative Commons CC BY 4.0 license, which permit the free download, distribution, and reuse, provided that the author and preprint are cited in any reuse.


