
Submitted:
27 November 2025
Posted:
28 November 2025
You are already at the latest version
Abstract
Soil, with 30,000 Gt SOC (Gigatonnes of Soil Organic Carbon), is the greatest global store of active carbon as well as being source and sink of most atmospheric CO2. Soil respiration/decay (~220 Gt C/yr) is twenty times Fossil Fuel (FF) emissions (~10 Gt C/yr). Soil supports >99.9% of species biodiversity (mainly microbes), provides ~99% of human food, and filters100% of our drinkable freshwater (via earthworm burrows). Soil is yet the most neglected biome as are its main monitors and mediators, the resident earthworms. These are silently dying, just as soil is being eroded and degraded at irreplaceable rates, to our, and all other species’, detriment. Land use changes (LUC) release carbon from deforestation and soil erosion/poisoning at rates about twice that of FF emissions, themselves twice the CO2 increase (5 Gt C/yr). Knowing all this provides a ready solution to Climate, to Food Security as well as the most pressing of issues: The rapid and irreversible species extinction. Based upon proper scientific context and urgent triage priority, the imperative is to redirect all our efforts and funding to restore topsoil. The simplest remedies, available to anyone, are to vermi-compost, to demand or support 100% organic food (thus protecting earthworms), and to reduce excess red-meat. In this way rich soil humus is revived, deforestation is reduced and toxic poisoning of our air, water, soil and food is resolved. Organic husbandry within broader Permaculture design principles allows practical and proven solutions to the ecologically interlinked problems.
Keywords:
organic carbon
; food health
; CO2
; productivity
; climate
; worms
; Rothamsted
1. Introduction
The Special Issue concerns “Climate Change and Food Security: Mechanisms, Practices, and Policies to Advance Soil Carbon Sequestration.” Consequently, this review and synthesis will be divided into two main topics: Climate and Food. Providing a status quo of the current state of knowledge, the major issues are identified as are the best methods to remedy these (i.e., in context with triage). The immediate answer for soil carbon sequestration is to reduce deforestation and soil erosion allowing the land to recover. This is quite simple to achieve: Firstly, reduce excessive red-meat consumption; secondly, restore Organic farming; and thirdly, practice Permaculture. Obstacles to progress are primarily our ignorance of soil data due to compromised Science which has become both banal and venal and sadly partisan. Lack of proper scientific investigation of key soil issues is a major underlaying problem preventing appropriate policy. From this, people may make poor diet choices allowing destructive agricultural practices to persist. A contrary view is taken by Moinet et al. (2023) who argue that soil is not the only solution but, understandably, they too lack a full catalogue of soils stocks, losses and capacities.
Farming is most responsible for clearing of forests (mainly for meat), for loss of vital topsoil, and for toxic pollution of our air, water, soils as well as the food produced. This leads to atmospheric CO2 excess, irreversible species extinctions, and human ill-health.
This report will show that, rather than just Fossil Fuel (FF) emissions, the loss of topsoil due to land use change (LUC) mainly for agriculture has contributed much more CO2 over the same time periods. This is supported by three key factors: Firstly, total soil respiration with seasonal fluxes being twenty times greater than FF emissions (ratio 96:4%); secondly, CO2 increases correlating more with forest clearance than with FF use; and thirdly, while deforestation was unabated, 2020-2021 COVID shutdown of industry and transport reduced FF use by up to 26% with zero effect on rising CO2. Such conclusions are obvious if terrestrial carbon stocks and fluxes are properly studied and fully reported.
Further evidence is UNEP (2025: Figures ES.2 and 2.3) finding LUC as the greatest single contributor to excess CO2 in 2024. Despite misreporting LUC as net rather than cumulative and excluding it from most totals, this proves subordinance of FF use alone.
Final sections interlink the three factors of Soil, Climate and Food presenting a suite of examples (e.g., Rothamsted and organic Haughley) with cogent arguments for reducing meat and for restoration of more natural, organic husbandry with vermi-composting, all based upon factual Science. Oversight of such options is because IPCC and other environmental bodies focus on Oceans or Atmosphere, often ignoring soils. The few soil workers tend to specialize rather than being broad ecologists, and no single Soil Institute exists anywhere comparable to myriad Ocean/Aquatic or Atmosphere/Space research facilities. Consequently, few data compilers, if any, have affinity with Soil, fewer research Organics. This is a substantive deficit in basic understanding of how the Earth functions.
For true progress to be made, honest Science must regain relevance and purposefulness.
2.1. Soil Carbon and Climate Carbon
The official references for carbon and climate are the UN’s periodic IPCC reports using data from annual Global Carbon Budget (GCB) published in ESSD Copernicus. The latest GCB (2025) is highly biased citing “ocean” 400 times, “atmosphere” 300, “soil” just 8, “organic” only once. IPCC suffers from similar bias, barely mentioning soil, as noted later.
The latest IPCC (2021) AR6 report, drawing on GCB data, is summarized in Figure 1.
Two major and fatal factual errors in IPCC’s figure data are under-reporting of terrestrial carbon stocks/fluxes and misrepresentation of anthropogenic Land Use Change (LUC).
2.1.1. Land Metrics Under-Reported
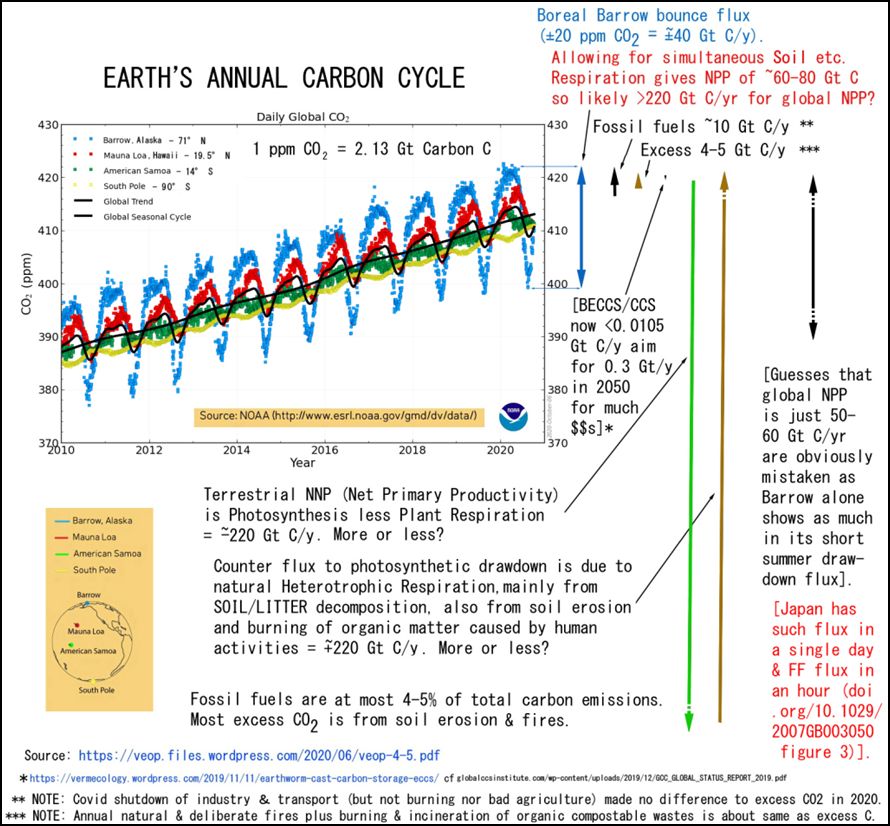
Gross Primary Productivity (GPP) is shown as Gross photosynthesis at (113 + 29 =) 142 Gt C/yr representing ~71 Gt C/yr Net Primary Production (NPP) from the standard formulas of: NPP ≈ GPP – PR (Plant Respiration) ≈ SR (Soil Respiration/Decomposition plus Fire). Ideally, GPP/2 = PR = NPP = SR; in an ecologically stable system SR nearly balances NPP.
Recently, Liang et al. (2023) found: “The terrestrial gross flux is quantified to be 550 ± 60 PgC/year, falling in the range reported in the literature, 200–660 PgC/year.” This may imply Land’s NPP in a range of 100-330 Gt C/yr, supporting higher terrestrial NPP/SR of >220 Gt C/yr as determined by Blakemore (2018, 2024), as will be discussed in more detail below.
IPCC’s active carbon recycle rate on land (~142 Gt) plus passive Ocean “gas exchange” (~80 Gt) combined total of 222 Gt C/yr suggesting a residence time of all 870 Gt C in atmospheric CO2 at (870/222 Gt =) 4 years, or more properly (870/142 =) 6 years. However, consideration of these two recent studies indicates all atmospheric CO2 is recycled, mainly via vegetation and soil, at two or three times this rate in just 1–2 years. Specifically, Liang et al. (2023) report a globally averaged turnover time, τ, of 1.5 ± 0.2 yrs and Blakemore (2024) gives similar time for recycling atmospheric CO2 in just 2 years.
Terrestrial gross flux which IPCC has at ~142 Gt C/yr is thus 3–4 times underestimated.
Current GPP values are about 440 Gt C/yr for Land and just 40–50 Gt C/yr for Ocean, as justified by Blakemore (2024) while Liang et al. (2023) say their derived global GPP “is insensitive to the partitioning between the terrestrial and oceanic components” which permits sinking their ocean GPP to a lower value. IPPC’s Ocean GPP of 40 Gt C/yr indicates an NPP of just 20 Gt C/yr that may be within bounds. Also important is that Liang et al.’s carbon exchanges are not entirely related to GPP as they note that “The oxygen isotopic variation of leaf and soil water is controlled by evapotranspiration, influenced by atmospheric relative humidity.” Nevertheless, they also advocate for upping estimates of land NPP, and for this to achieve 220 Gt C/yr, its GPP would be around 440 Gt C/yr which is less than their rate – on land alone – of 550 Gt C/yr. They say: “terrestrial net ecosystem exchange (NEE) is better studied but gross primary production (GPP) processes (such as photosynthesis) comprising > 3/4 of the total carbon fluxes in the carbon cycling budget”. This implies Land’s GPP is (550 x 0.75 =) 412 Gt C/yr, hence a modest 206 Gt C/yr NPP.
The summary data from Liang et al. (2023) are presented in Table 1.
Koren et al. (2019: Figures 1 and 4) also reported importance of terrestrial Carbon Cycle with Air-Leaf flux (FLA) of -514 Gt C/yr, but their rather arbitrary starting point was: “The magnitude of global GPP in our model is taken from SiBCASA and is −133 PgC/year for 2011”. If terrestrial GPP were raised to more realistic levels, then their carbon cycle rate raises too.
2.1.2. Soil Respiration (SR) and Fire
IPPC’s soil respiration and fire emissions data also appear rather contrived: “The corresponding emissions by total respiration and fire are those required to match the net land flux, exclusive of net land-use change emissions which are accounted for separately.” These LUC are earlier stated as: “Estimated as residual from the mass balance budget of fossil fuel CO2 emissions minus atmospheric CO2 growth and the ocean CO2 sink, the global net land CO2 sink (including both land CO2 sink and net land-use change emissions).” In other words, LUC is not independently derived, it is the contrived balance of total FF emissions minus atmospheric CO2 and a supposed Ocean Sink. No allowance is made for Land to be the major source of CO2 – which it is clearly shown to be in the current report and in earlier studies (e.g., see Blakemore 2024: Figure 9).
IPPC do admit a terrestrial greening or fertilizer effect due to CO2 rising – and greater nitrogen deposition (from excess N fertilizers), warmer temperatures, and longer seasons also contribute – but all this appears more than offset by greater rates of soil loss. Concomitant with CO2 and N excesses, increases in plant growth (NPP) in models are: “global CO2 fertilization effect on photosynthesis of 30% since 1900, or 47% for a doubling of Ca [Carbon in atmospheric CO2] above the pre-industrial level” (Haverd et al. 2020). But as just noted, this increase in NPP is overwhelmed by a “Red Queen effect” of higher net forest loss (-35%) and > 50% topsoil erosion and/or poisoning due to bad agriculture causing inexorable CO2 rise, which will be explained in further detail below.
2.1.3. Terrain Upped for Soil to Full Depth
To adequately compare Soil to other carbon cycle stores – such as above-ground Vegetation, air, or Ocean – full rather than partial inventories are required. The issue of neglected terrain is discussed by Blakemore (2018b, 2024) arguing for doubling of land surface area in most cases. Currently, calculations are based upon an unrealistic mirror-flat Earth, hence almost all are mistaken. Moreover, for convenience, USDA arbitrarily set a maximum depth of 2 m, or less, in reporting of SOC and other soil characteristics. Yet depth to bedrock is now known to average 13.1 m (plus ~8 m in friable saprock adds up to ~21 m). Siberian Permafrost is recorded down to 1.64 km and mineral soils in USA to bedrock at 3.12 km. Details of new soil depth calculations are in Blakemore (2024, 2025).
Soil with full 21 m depth being ten to twenty times over standard 20 cm or 2 m samples, is realized as by far the greatest C store and C source, exceeding all trees, air and Ocean.
2.1.4. Permafrost (that extends to >1.6 km deep)
IPCC’s Permafrost value of 1,200 Gt C (ambiguous to inclusion of boreal peat) is a vast underestimation, now raised over seven-fold to 8,500 Gt C. This from 5,000 Gt C in Blakemore (2024) plus most recent subsea upgrading by Strauss et al. (2024), raised five-fold from previous estimate of 560 Gt C to 2,822 Gt C. Likely with +25% glomalin further increases this to >3,500 Gt C. This revision may thus total (5,000 + 3,500 =) 8,500 Gt C.
Surprisingly, IPCC omitted an earlier citation of Shelef et al. (2017) who said: “SOC mass stored in perennially frozen hill toe deposits alone vary from few percents to more than double of current SOC estimates”, they gave a maximal uncertainty of >2,000 Gt C. Importantly, their study somewhat validates the rationale to double soil samples for both depth and terrain, and for use of sigmoid curves rather than linear for slope calculations. Recent and rapid thawing and erosion of Permafrost/peat adds inordinate amounts of atmospheric carbon, also of ancient origin and depleted in isotopes as are FF emissions.
2.1.5. Peat
IPCC AR6 (2021) does not provide a separate estimation of the world’s peat carbon. Typical values ranged from 200 to 600 Gt C, but Blakemore (2024) showed that proper inventory (without terrain factor for waterlogged bogs and mires) amounted to 3,000 Gt C and, if underlying lignite is included, as much as 6,000 Gt C. Some slight support is provided by (Widyastuti et al. 2025) with newly reported range of 630–1,254 Gt C although this study ignores Blakemore (2024) and, amongst other omissions, fails to mention glomalin. It is important to avoid double-counting of peatlands and there is often overlap with Permafrost intergrades, nevertheless Peat is a major carbon store with ~3,000 Gt C.
2.1.6. Soil (That May Extend to >3.1 km)
For total Soil, IPCC’s data source was partly Jackson et al. (2017) who had 3,270 Gt SOC >3 m, whereas IPCC total is lower at (1,200 permafrost + 1,700 soil =) 2,900 Gt C to 2 m. Lin et al. (2024) had a SOC summary of 1,873 Gt C (range 1,086–2,678) to just 1 m while a new Preprint estimate is around 2,822 Gt SOC in the top metre (Crézé et al. 2025). Interestingly, this is almost exactly twice that claimed by French 4p1000.org (reviewed by Rothamsted’s Poulten et al. 2018) as their starting point of a total global 1,417 Gt SOC they schemed to increase. However, since Rolando et al. (2021) found soil up to 5 m deep had on average five times greater SOC, we may then arrive at a total at least (1,873 x 5 =) 9,365 Gt that is easily doubled again for combinations of glomalin (20–30%), full depth (of up to 21 m), and terrain (doubling most soil results) to arrive at a new sum from Lin et al.’s low data to now total >18,000 Gt SOC.
This tends to endorse estimate in Blakemore (2024) for (5,000 Permafrost + 3,000 Peat + 10,000 Soil =) 18,000 Gt C, reported to full depth, as indeed are Atmosphere and Ocean inventories. Depth at least doubles IPCC’s total to about 6,000 Gt C and neglected terrain double this to 12,000 Gt C, plus some 25–30% glomalin would total >15,000 Gt SOC. This may be doubled again for neglected components such as Dissolved Organic and Soil Sediments as per Blakemore (2024: Table 2) to >30,000 Gt SOC, as is stated in the Abstract.
Despite previous misinterpretations that Ocean is Earth’s greatest carbon store (viz. ~38,000 Gt C) this value is for mainly Dissolved Inorganic Carbon (DIC), while the ocean Dissolved Organic Carbon (DOC) is just 700–1,000 Gt. Soil, now known with >30,000 Gt SOC, has about 30 times more organic carbon in all its forms than are found in the Ocean.
2.1.7. Vegetation (with Tree Roots Down to >100 m Depth, Mycorrhiza Adding to This)
Vegetation biomass (range of seven estimates) IPCC has from Erb et al. (2018) which claims full stocks yet is ambiguous as they make no mention of “roots” and have one estimate “assuming 20% belowground biomass for estimates of AGB [Above-ground estimates] only”. Other authors are explicit this is for aboveground biomass, as discussed by Blakemore (2018b). For example, Crowther et al. (2019) with 560 Gt C “Aboveground” biomass in their figure shown in Figure 2, with their values corrected by Blakemore (2019).
For “Vegetation” IPCC’s 450 Gt C may similarly be doubled for below ground roots and fungal symbionts to around 900 Gt C, also doubled again for terrain to about 1,800 Gt C. A total vegetation value in Blakemore (2024) is 2,400 Gt C which agrees with the earlier full-depth value from data in Rodin et al. (1975) of 2,400 Gt dry mass (halved for carbon content but doubled again for terrain, etc. to give the same, 2,400 Gt C biomass total). Realizing Rodin et al. may refer to original biomass, terrain and doubled roots still apply.
Soil samples routinely sieve out roots to report separately, but handling and analysis misses as much as 100–160% below-ground biomass (as discussed in Blakemore 2024).
2.1.8. Land Use Change (LUC) as Major Carbon Contributor Is Underestimated
Approximately 50% of both Soil and Vegetation was lost due to human activity since the Neolithic agricultural expansion era, most rapidly in recent crop/pasture intensifications.
An unsettling factor is that on page 699 of IPCC Report, directly above Figure 5.12 and Table 5.1, they give cumulative LUC of about 240 Gt C (or strictly 240 ± 70) in total from 1750, yet their figure only shows -25 Gt C. This net LUC value compares to their total cumulative Fossil Fuel (FF) emissions shown as -445 Gt C in their Table 5.1 and Figure 5.12. If the vegetation LUC of 240 were properly presented in Figure 5.12 this would be more than a third of the total anthropogenic contributions, i.e., 240 LUC vs 445 FF. It is not clear why the LUC value from Erb et al. (2018) of 466 Gt C LUC in vegetation alone is excluded. That alone would exceed their cumulative FF emissions. Yet LUC losses have two components: Vegetation and Soil (SOC). About half original topsoil is lost due to combined effects of farming and deforestation that itself ultimately adds to SOC loss.
IPCC (2021: pg. 688) defines net LUC: “It consists of gross emissions (loss of biomass and soil carbon in clearing or logging, harvested product decay, emissions from peat drainage and burning, degradation) and gross removals (CO2 uptake in natural vegetation regrowing after harvesting or agricultural abandonment, afforestation).” Then on page 689 they present values of 116 Gt C soil carbon loss (from Sanderman et al. 2017) and for vegetation they strangely have just 447 Gt C (from Erb et al. 2018) to total 563 Gt C. This is indicative as there are likely overlaps in accounting of clearing and erosion of soils. However, LUC total from both sources are underestimations for reasons explained below.
A major error in IPCC’s data is this misreporting of Land Use Change (LUC) as just -25 Gt C, rather than -240 as in their table or likely -563 Gt as just noted. If human-induced clearing (LUC) loss of Land’s vegetation and soil erosion has halved stocks as suggested, then their current IPCC values around 450 Gt C and 1,700 Gt SOC, assuming depletion by up to 50%, would presumably be -2,150 Gt C albeit mainly the surface topsoil is lost. It is also inconsistent for IPPC to present Ocean’s largely irrelevant inorganic carbon +173 Gt C increase as finite, but not to give all other fluxes, including Land’s gross Vegetation and Soil losses, regardless of how uncertain or difficult these are to calculate accurately.
Independently, Wedderburn-Bisshop (2003, 2024b) reported net cumulative LUC emissions of 734 Gt CO2 and a gross cumulative LUC emission figure of 2,027 Gt CO2 for 1750–2020. This equates to a total of approximately (2,027 Gt CO2 x 0.27 =) 550 Gt C LUC.
In a more recent report, Wedderburn-Bisshop (2025) estimated about double, 1,000 Gt C LUC, but also noted cumulative LUC totals were conservative due to source data from Houghton & Castanho (2023) using net deforestation thereby excluding re-clearing and other underestimations of forest loss, perhaps four times greater in extent than previous assessments. Additionally, two other major reasons for his modest LUC are that the study was limited to 1750–2021, ignoring ~400 Gt C deforestation prior to 1750; and, secondly, carbon from farming fires supress forest regrowth, which is typically excluded but, if included, would double agricultural carbon emissions. This implies his estimates may be two to four times higher for these factors. Moreover, when terrain and deeper soil and all root losses are fully considered, many of these factors may be doubled again. Thus, newly reported cumulative LUC total is plausibly still only a half to a quarter fully complete. The best “guesstimate” high value ~2,000 Gt C total cumulative LUC may itself be too modest.
2.1.9. Summary of IPCC Deficiencies and Corrections
All the IPCC (2021) terrestrial values are substantially underestimated with Gross photosynthesis shown as just 142 Gt C/yr, now in the range of 440 – 550 Gt C/yr, or four times greater. For organic stocks listed as Permafrost, Vegetation and Soils (totalling 3,350 Gt C) these are now >32,500 Gt C or nearly ten time greater. Most concerning is their Land Use Change (LUC) uniquely reported as net values of 1.6 Gt C/yr and -25 Gt C total, whereas a cumulative total LUC is not shown, unlike for the Fossil fuels emission (-445 Gt C). A good LUC total, if also cumulative, is similar with at least -450 Gt C and likely much higher in the order of -1,000–2,000 Gt C which would be forty to eighty-times above that reported. Oceanic inorganic carbon is shown with +173 Gt C added, but anthropogenic changes of neither organic nor inorganic soil carbon are reported, ditto for Vegetation losses which are substantial (estimated up to -50% in the last few centuries).
A summary of issues regarding IPCC’s underestimation of soil are presented in Table 3.
Ocean biomass is 3 Gt C (just 0.1% vs. Land’s >99%). Ocean’s Gross productivity is likely overestimated at 40 Gt C/yr to give about 20 Gt C/yr NPP, both just one tenth of Land’s.
An updated global carbon metrics graphic summary is Blakemore (2024: Figure 9) (Figure 5).
Such inadequacies and underreporting of Soil losses explain why all climate models fail.
2.2. Deforestation (Part of LUC) Correlates Closely with IPCC CO2 Carbon Increase
Mo et al. (2023) say: “So far, humans have removed almost half of Earth’s natural forests, and we continue to lose a further 0.9–2.3 Gt C each year.” Forest loss is mostly in the tropics with agricultural products exported (https://ourworldindata.org/deforestation).
Approximately 50% of Earth’s habitable land is used for farming and most of this from clearing of the forests since the Neolithic (starting 10,000 years ago). Due to perpetual regrowth or replanting, a net loss is now reported as about one-third of forests gone since the last ice age regrowth, half of that loss occurring in the last century. The primary driver is agricultural crop expansion with grazing now the leading cause of deforestation.
A strong correlation is between rate of deforestation, itself an index of accompanying soil organic carbon loss, and atmospheric CO2 accumulation. This is shown in the following two graphs with a third conventional graph of CO2 vs. FF emissions (Figure 6, Figure 7 and Figure 8).
The increase in FF emissions, albeit relatively minor compared to natural fluxes on land, seem to have been accommodated by these land processes up to the 1960s when CO2 accumulated. Thus, a CO2 curve matches several other phenomena as much as it does FF use, such as deforestation rates, nuclear tests, agrichemical uses and accompanying soil acidification with effects on nutrients in food. These relationships are complex, but proper comparison of total cumulative CO2 is with total emissions, both of FF and LUC.
2.2.1. Current Status of Forests
FAO (2025: page xv) Global Forest Resources Assessment for total forest biomass estimated carbon stock, including all carbon pools, at 714 Gt C, or 172 tonnes per ha. Forty-six percent (nearly 50%) of the forest carbon stock is in soil (225 Gt SOC), 44% in living biomass (247 Gt C above-ground and supposedly 66 Gt C below-ground in roots, etc., which is likely a massive underestimation), and 10% in litter (41 Gt C) or deadwood (30 Gt C). All these forest values can presumably be doubled for terrain and some for depth considerations. A root component is also increased as often only a fraction of the rootstock and fungal hyphae are recorded. A probable reasonable sum is now about double the FAO value, therefore with at least 1,428 Gt C total in all standing forest areas (this implies the remaining 1,000 of 2,400 Gt C global Vegetation is in other ecosystems).
Estimates vary for deforestation with net 33–50% clearance following the Neolithic Revolution, or up to 1,428 Gt C lost if 50% of an initial 2,856 Gt C for the current 50% remainder noted earlier. A significant fraction (~35%) of the world’s forests loss is since 1750, and likely about 500 Gt C of this lost in the last century. Thus, a reasonable estimate is between 500–1,500 Gt total forest carbon lost to erosion or to the atmosphere due to LUC, albeit with some regrowth or other lower carbon conversion uses post-clearance.
Wildfires also destroy forests and 2024 was particularly bad with record events, causing up to 40% of total forest losses (https://www.wri.org/insights/global-trends-forest-fires).
Deforestation rates provide a proxy for loss of vegetation and soil erosion that together contribute much more to atmospheric CO2 excess than do cumulative FF emissions.
2.3. Soil Erosion (Also LUC) Related to CO2 (and Fossil Fuel Emissions)
“Half of the topsoil on the planet has been lost in the last 150 years” (https://www.worldwildlife.org/threats/soil-erosion-and-degradation). As noted above, IPCC claimed that since 1750 to date, LUC (or “LULUCF”) has released approximately 240 Gt of carbon through the clearing of forests and other ecosystems, with a significant portion of this loss coming from changes in soil carbon stocks and a reduction in Vegetation’s ability to sequester carbon. A much higher value of cumulative carbon emissions caused by anthropogenic land cover change before 1850 were estimated at 325–357 Gt C (Kaplan et al. 2010). Simply doubling IPPC data for terrain gives cumulative LUC up to 500 Gt C in total to date, or likely closer to 1,000–2,000 Gt C as noted above.
In a natural setting, soil formation exceeds erosion as manifest in the amount of ancient atmospheric carbon accumulated in terrestrial systems (>30,000 Gt). However, current soil erosion is orders of magnitude above its natural formation due partly to increasing LUC effects, especially deforestation and the ubiquitous poisoning of soils overwhelming their ecological processes co-evolved over aeons. Pimental (2006) says soil loss at 10 to 40 times its rate of renewal is a major global food security issue. Ancient soil’s eroded carbon is deleted in isotopes as are FFs. Use of the depleted carbon isotope argument to constantly justify the sole role of FFs in the CO2 excess is no longer a feasible reason.
Theoretically, it may take about 100 years or more to form 1 cm of topsoil, but rate of agricultural induced erosion is much greater, estimated to average nearly 1 cm loss from the land surface each year (Zang et al. 2021). An example is excessive rates of topsoil loss is in cultivated fields in parts of Australia that commonly range from 1 up to 50 t/ha/yr (https://www.dpi.nsw.gov.au/__data/assets/pdf_file/0008/270881/saving-soil-complete.pdf). While organic farming preserves topsoil, transformative Permaculture aims to restore degraded or depleted soils in short timescales under prevailing climates.
For erosion rates, Lal (2006: Figure 3.2, Table 3.4–3.5) had SOC loss as ~5 Gt C/yr with most (~70%) redistributed over the landscape or buried, ~20% lost to the atmosphere, with the remaining ~10% flowing to the ocean via rivers. This is shown graphically in Figure 9. Along with massive coastal erosion each year, Ocean’s carbon budgets largely relate to rates of soil transportation.
Note that IPCC (2021: Figure 5.12) has natural and anthropogenic transfers of carbon from soils to freshwater systems significant at 2.4–5.1 Gt C/yr, and via outgassing from lakes, rivers and estuaries at about 1.5 Gt C/yr. Their Ocean transport rate is lower at 0.8 Gt C/yr.
Traditionally dredging was used for fertilizing fields or paddy, but sediments now accumulate runoff toxins. Blakemore (2024) estimated sediments with ~2,500 Gt SeOC. Owens (2020) provides a comprehensive summary of deposition rates and toxins in sediments with an interesting figure of Phosphate use and nucleotide peaks (Figure 10).
Despite increased biomass production due to CO2 fertilization and lengthening growing seasons, there has been an overall net global decrease in global soil carbon stocks, hence a net release of CO2 to the atmosphere according to Kopittke et al. (2024), although their values are underestimated. For cumulative loss of topsoil, a 1984 estimate was 538 Gt SOC lost, or 27% of prehistoric superficial soil carbon stocks (Buringh 1984). A later study had 136 Gt SOC loss to the atmosphere alone since 1750 (Dinahkran et al. 2014), another estimate was 108–188 Gt C since 1850 (Houghton 2010). This latter concluded: “From 1850 to 2000, land use and land-use change released an estimated 108–188 PgC to the atmosphere, or about 28–40% of total anthropogenic emissions of carbon (274 PgC from fossil fuels)”. Doubled for terrain, this latter is 216–376 with median near 300 Gt SOC loss that, notably, exceeds both FF use and IPCC’s current +279 Gt C net CO2 increase.
An average for the last 150 years is about +2 Gt SOC/yr, but rates have progressively increased. Houghton (2010) calculated: “The net flux from land use and land-use change over the recent period 1950–2005 is estimated to have ranged between 0.8 and 1.6 PgC yr−1.” Doubled for terrain, this is 1.6–3.2 Gt C/yr (median +2.4 Gt C/yr). Although erosion estimates gain little from soil depth, this terrain doubling of net soil losses alone plausibly accounted for CO2 increases above any lesser Ocean or FF contributions.
Yet the rate of +2.4 Gt C/yr SOC loss from soil erosion is an underestimation of cumulative LUC losses directly from SOC (including litter) and indirectly from Vegetation (including by fire) that combined total about 1,000–2,000 Gt C. Much of this was in the last few decades but averaged over the last century would give between 10–20 Gt C/yr SOC loss. This implies that Soil respiration (SR) exceeds annual NPP at ~220 Gt C/yr, and Vegetation loss plus Fires are neither balanced nor conserved by regrowth and/or reforestation.
In Figure 5, Land Use Change emissions (LUC, possibly overlapping with some other deficits?) are estimated at 12.4 Gt C/yr; another 4–8 Gt Gt C/yr of litter/humus and vegetation is likely lost to peat/forest fires and stubble burning. This gives total terrestrial LUC emissions, about twice annual FF emissions (9.4 Gt C/yr), at around 16–20 Gt C/yr.
Bai et al. (2025) infer a similar rate: “if 1 % of the annual SOC fluctuates, the loss or gain would be 24 Gt C, which is more than the anthropogenic C release to the atmosphere”.
2.4. Summary of Soil and Carbon/Climate
In summary, there is an undeniable increase in FF emissions, but also a similar increase in rate of deforestation (with accompanying release of ancient soil SOC). A “global greening” effect has taken up much of the extra CO2 as a natural ecological process. That there is excess CO2 is due almost entirely to the loss of topsoil (SOC) that reduces the plant growth potential. SOC loss is mainly due to mismanagement when agriculture is treated as a chemical process rather than as proper ecological systems. Remedy is thus in restoration of natural, Organic farming. Agriculture and food production are the major causes of both forest destruction and the associated soil loss and the major driver of the increasingly rapid loss of these two essential life-support systems is mainly meat production greed. Effects of extravagant meat-eating is considered in the next section.
3.3. Imperative to Reduce Red Meat – Chews Wisely
How best to stop CO2 emissions is answered simply by reducing excessive red-meat.
Forest clearing is mainly for agriculture and mostly directed towards meat production. The carbon footprints of different food systems and diets are commonplace, advocating for reduction of excessive meat eating. Consensus data show the most wasteful use of land is for sheep (and goats) which are responsible for establishing and extending degraded lands in a marginal state. Plants are unable to regrow, nor soils restore due to over-grazing. Beef is directly responsible for most clear-felling of pristine, climax forests.
The following three figures (Figure 11, Figure 12 and Figure 13) show land use with itemized components of carbon costs across the whole food supply chain (mainly LUC or on-farm emissions). Specific sources matter e.g., Brazil beef is ten time more costly than Dutch or Irish beef.
These charts undeniably demonstrate that excessive meat is most destructive and is particularly damaging in places like Brazil where rainforests are cleared and burned. As an alternative, OWiD show: “If the world adopted a plant-based diet, we would reduce global agricultural land use from 4 to 1 billion hectares” with various diet options graphically presented in the following figure (Figure 14).
Of these diets, as with most other human endeavours, moderation and compromise are often best policies. Thus, the completely Vegan diet is ill-advised as well as being quite unhealthy unless the food is 100% organic (due to critical nutrient depletion issue as well as carcinogen and other pollutants from overuse of toxic chemicals on all other farms).
If environmental issues of common concern are insufficient incentives, possibly personal health costs of over-indulging in meat may help people chose their best diet. The next two charts are trends of meat consumption versus cancer rates (Figure 15 and Figure 16).
Australians are the most overindulgent in meat (120 kg/yr per person or about twice the average human bodyweight in some states). These charts show that excess meat consumption is not essential (compare US to China’s 60 kg/y or India’s 5 kg/yr), rather it is a cultural issue (compare US to Japan that is as affluent but has a more mixed seafood diet). A reasonable compromise is for up to 50% meat reduction to, at very most, 60 kg/yr.
Health consequences of excess meat related to goals to reduce or halve cancer cases. As genetics propensity for cancer may vary little between countries, ill-health as revealed by cancer rates is assumed to relate either to external environmental issues or is related to diet and lifestyle. Medical costs of poor diet and unhealthy food are a penalty in addition to significant environmental costs of chemical farming that supplies most meat.
3.1. Soil and Food Security
To define the scope of the issue, total Land Area, as in the chart below, require correction to allow for topography, terrain and microrelief rugosity that, in a combination of overlays, quadruple Land’s surface area ratio of ~65% Land : 35% Ocean. Although other apportioning of land areas are increased, relative % proportions change little (Figure 17).
About half habitable land is farmed, over 80% of this is for livestock that, depending upon choice of diet, provides a relatively small proportion of food (17% calories and 38% protein). Thus, most human food Is already plant-based with relatively efficient land use (38% calories, 62% protein). Footnoted is Ocean contribution to food at <2% of: “fish and seafood from aquaculture production which uses land for feed. If wild fish catch is included, animal products would provide 18% of calories and 40% of protein.” I.e., proportionally 99% of our total food is from the Soil, only about 1% from Ocean fisheries. Pimental (2006) had a lower estimate of just 0.3% of human food from aquatic sources.
Because almost all calculations of terrestrial productivity, biomass or carbon stocks, and rates of erosion, etc. are based upon planimetrically flat models, these are inherently wrong (Blakemore 2018b, 2024). Correction may make models more workable when based upon global terrain versus planimetric areal data. Overall area difference is about quadruple at finer scales appropriate for solar radiation or microbial biodiversity, but a more conservative doubling is applied to most other data depending upon its source.
In addition to terrain, the established Leaf-Area Index (LAI) increases the biotic surface area for photosynthesis and gas-exchanges, plus there is superficial biocrust and cryptogams (lichens and moss, etc.). Mean singe side LAI is 4.5 m2/m2 from Asner et al. (2003) which multiplied by the topographic soil-bearing land is (~50 Gha x 4.5 =) 230 Gha. Whitman et al. (1998: 6580) assumed a forest LAI of 10 m2/m2 (unstated whether single-sided or not) that may again double reactive surface area on Land up to about 500 Gha.
Comparably Ocean’s flat insolation/gas-exchange area is just 36 Gha (or 6% of total). Corollary is with amount of the photosynthetic energy enzyme Rubisco recently raised on land to about 1.4 Gt (98%) vs. 0.03 Gt (2%) in marine environments (Blakemore 2024).
An obvious underestimation example, therefore, is for terrestrial GPP/NPP where the isotope and other indicators show global productivity much higher than that extrapolated from per unit area productivity. To correct this requires doubling, either of all these local data, or of Land’s total surface area (as applied to baseline data herein). Confirmation that manifestly hilly land and bumpy soil area should be considered as a factor in models is also confirmed since a mirror-flat Earth has yet to be convincingly proven at any scale.
Roughly 14% of land surface is shown as desert or degraded, this often instigated or exacerbated by fire (e.g., firestick farming, slash and burn, firewood), or cultivation and overgrazing from pre-industrial times to date, while about 10% is covered in ice. Of the potentially habitable land remaining, about 50% has been cleared and converted for agriculture with the majority laid down as pasture. Land degradation due to this is estimated at between 20-40% (median 30%) of total according to the UN Land Outlook Report (2021) whose lead author stated: “Modern agriculture has altered the face of the planet, more than any other human activity. We need to urgently rethink our global food systems, which are responsible for 80% of deforestation, 70% of freshwater use and the single greatest cause of terrestrial biodiversity loss.” The latest 2024 UN Desert Report (https://www.unccd.int/sites/default/files/2024-12/aridity_report.pdf) claims drylands are rapidly expanding so they “cover more than 40 per cent of global land (excluding Antarctica).” The report also cogently argues for more sustainable agriculture systems.
Ultimately the best and only way to drawdown excess atmospheric CO2 is via Organics.
3.2. Imperative to End Agrichemical Farming – A Farewell to Farms?
Chemical agriculture, also known as “conventional”, gradually expanding from 1900s has been more widely implemented since 1960s, has now mostly run its course. Synthetic Superphosphate (contaminated with Cd) was extracted from fossilized coprolites by Rothamsted institutions in 1840s. Synthetic nitrates were a by-product of the munitions industry needing disposal (for profit) following the 1914-1918 war. Biocides were developed at the same time as poison gasses for trench warfare, their use as pesticides gradually expanded following WW2 in the 1940s and following the agrichemical inspired Green Revolution of the 1960s. The following two charts (Figure 18 and Figure 19) show extent of the synthetic chemical deluge with time compared to yields and irrigation increase, etc.
Much of this increased crop yield is for stock-feed and, as will be shown below, is an illusion (or delusion?) at the true cost of the nutritional quality and safety of our food, as well as incurring intolerable destruction and irresponsible extinction of the Natural world.
Due especially to observable declines in flying insects and bird as a consequence of the increasingly toxic environment, are issues of poor soil/food health and soil erosion. Thus, it is becoming increasingly obvious that chemical farming has largely failed and must be curtailed. What increases in crop yields there have been require greater chemical inputs to maintain, and these are accompanied by massive soil erosion and toxic poisoning of the environment and our food, now also depleted in nutrients. Due to overuse, several pest plants and insects are resistant to biocides requiring yet more toxic mixes, and similarly intensive stock rearing has promoted antimicrobial resistance. Other issues are irresponsible and uncontrollable spread of GMOs with their ability to reproduce and spread, more pernicious than toxic chemical pollution that may, eventually, dissipate.
Symptomatic of critical insect collapse, a recent European study reported a -99.3% orb-weaving spider decline in recent years (Nyffeler & Bonte 2020). At such extinction rates, the biodiversity heritage remaining to be passed on to future generations will be severely depleted. This is reminiscent of the message in Carson’s (1963) Silent Spring.
Should the agrichemical industry repay all its extinction and health costs, profits would nullify. Thus, rationale for chemicals now makes neither ecological nor economic sense.
Organic methods preserve Nature, offering safe, healthy and abundant foods whilst also conserving humus and earthworms in soils that may have 25% greater soil moisture than their conventional/chemical neighbours which is equivalent to extra rainfall or less irrigation. This before deliberate moisture retention tactics are employed, such as Yeoman’s Keyline system as advocated by Permaculture (Mollison 1988). Permaculture offers Design for Nature systems aiming to achieve self-sustaining food and energy having minimum input (work or chemicals), less waste, and zero pollution. It too focused mostly on the foundational aspects of preserving, restoring or rebuilding healthy topsoils.
3.4.1. Imperative to Restore Soils with 100% Organic Farming/Permaculture
A summary of the progress and benefits of organic is provided by Gomiero et al. (2011).
Offering solutions, there remain many problems with the current state of Organic husbandry and farming. The impression is given that Organic competes with Conventional/Chemical, but it only occupies about 2% of farmlands with over half of this in arid or marginal lands in Australia where the massive properties are too large to spray chemicals anyway. The total area of “organic and cultural land” in Australia is about 35 million ha out of about 372 million ha farmland. Just one company, Hewitt, operates over 2.2 million ha of cattle and sheep stations with a single property, Narwietooma in the desert NW of Alice Springs in the Northern Territory (NT), spanning 1.1 million ha with a herd of 35,000 stock or >30 ha/head. It may be questioned how such operations can be classed Organic if not prioritizing preservation or restoration of healthy soils. In comparison, Sikkim in India has become the first wholly organic State with its 75,000 ha of farmland (10% of area) now farmed organically. This is just half the size of the NT farm.
To imply Organic, truly only 1% of total farmed area, competes with Conventional Chemical farming is quite misleading. Currently it is a marginal fringe activity at best. Organic regulatory bodies are often also remiss or negligent to allow hydroponics (quite detached from soil), as are false organic premium produce claims from chemical or “Regen” farms and other lapses such as unregulated “Organic” imports. Although some practitioners are well intentioned in trying to adopt relatively recent promotion of Regeneration, or Regen, this is already kidnapped or co-opted by agrichemical industry.
3.4.2. The Contentious Issue of “Regen” vs Real 100% Organic
The term Regenerative or “Regen” as a synonym for reviving organic farming was first proposed by the pioneer organic Rodale Institute in the 1980s - https://web.archive.org/web/20250917214317/https://rodaleinstitute.org/why-organic/organic-basics/regenerative-organic-agriculture/. Widely promoted in recent years it has simultaneously been corrupted from its organic origins, mainly by corporate interests or by researchers who only know chemical agronomy. True organic farming has a clear definition to avoid synthetic poisons, sewage or GMOs striving for healthy soils, plants, food and humans; Regen is open for interpretation with ill-defined and easily exploitable boundaries. This is summarized in Rodale Institute’s figure (Figure 20).
Difference is now eroded between Conventional/chemical farming and the kidnapped term “Regen”. However well-intentioned and well-meaning the practitioners hope to be, they are misled by industry incentives (i.e., marketing, advertising hype, profit motive and lack of any accountability for pollution nor responsibility for human or animal ill-health). Only clearly stated organic practices avoid all synthetic chemicals, GMOs, use of sewage sludge and the routine dousing or injection of livestock with antibiotics or synthetic growth hormones. Permaculture goes further and, unlike many industries or institutes with profit motives, has stated ethics. These are three reasonable and moral ideals of Earth Care, People Care, and Fair Share. One step further is to reduce cruelty of red-meat.
That the term Regen been “kidnapped” and greenwashed by chemical industry is shown in support by profit-motivated agrichemical giants that actively oppose true organic farming and are often the direct or indirect sponsors and controllers of academic research publications: e.g., Bayer/Monsanto, the promoter of GMO genetically modified crops, and biocides (especially glyphosate/Roundup)- https://web.archive.org/web/20250925225938/https://www.bayer.com/en/agriculture/regenerativeag ; or Syngenta/ChemChina manufacturer of toxic Paraquat and Atrazine - https://web.archive.org/web/20251004010213/https://www.syngentagroup.com/regenerative-agriculture#can-regenerative-agriculture-feed-the-world .\
The definition and implementation of Organic farming must be clarified not corrupted, and proper, unbiased, scientific scrutiny is required for confirmation of its cost-benefits. Ecological comparisons should compare chemical, in all its forms, to 100% real organic. Degraded land can indeed be regenerated: By implementing proper organic husbandry.
4.1. Examples of Organic Yields and SOC (Rothamsted and Haughley Experiments)
An existing system cannot be criticized without the provision of practical alternatives. In this section the compelling and multiple benefits of organic farming – in terms of yield, carbon sequestration and biodiversity preservation – are demonstrated as being entirely achievable without the penalties of pollution and destruction of the soil and environment. Examples are from Rothamsted and from organic Haughley experiment details of which may be found elsewhere. Evidence of farming in this area of UK since prehistoric times (6,000 yrs), and during the Roman occupation of Britain (2,000 yrs), had sustained these soils for millennia prior to the experiment being overlain. At the plot, field, or whole farm scale, each have compared organic vs. chemical regimes as follows.
4.2. Rothamsted’s Broadbalk Wheat Experiment from 1839
Broadbalk field at Rothamsted Research in the UK is the world’s longest-running scientific field experiment starting in 1839. Since 1843 it has continuously grown winter wheat to test effects of different fertilizers and manures. The experiment’s purpose is to study crop yield and soil chemistry, and it has been modified over time to remain relevant. Control plots include both an original organic manure fertilizer, and zero or “Nil” fertilizer.
Details of this trial and results several comparisons of organic vs. chemical/conventional in global settings, including Haughley, Broadbalk and other Rothamsted experiments are provided in Blakemore (2018: Table 17). Overall, yields of crops or milk were on average +17.8% in favour of Organic production where benefits of soil health were also manifest.
4.2.1. Broadbalk Yields Equivalent (Despite Only Partial Organic Practices)
Latest data from Broadbalk (Figure 21), presented with unbiased critique of key findings.
Rothamsted yields data prove organic FYM (Farm-Yard Manure) plots as consistently equivalent, or above, synthetic chemical N-P-K plots. Moreover in 1968 the re-introduction of crop rotations (a standard organic practice in the 1840s) doubled the test crop yields. Often these data are misleadingly published only that chemical NPK greatly increased yields over Nil fertilizer (an impractical control concept). As well as ignoring the FYM yields, the destructive and detrimental effects of chemical fertilizers and biocides compared to any organic practices are regularly downplayed or ignored in some reports.
As with other chemical interventions, in order to maintain yields at Broadbalk, the amounts of fertilizers have had to continually increase. Nitrogen alone went from 48, 96, 144, 192, 240, up to 288 kg N/ha/yr. That the experiment has run its course is shown by re-introduction of original standard Rotation sequences to replace monoculture crops.
4.2.2. Broadbalk Soil Organic Carbon (SOC = Humus) -60% Lower
Depletion of soil organic carbon (SOC) with organic FYM compared to artificial NPK is reduced from ca. 85 to 35 tC/ha or -60% in their most recent data (Figure 22). Often this data is misreported as an increase in NPK plots over Nil fertilizer plots from 25 to 35 tC/ha or +40%; with the FYM plots (+240% in their form of reckoning) being completely ignored.
SOC shows a very interesting story as from the starting point in 1884 this field had been “run down” through four previous years, starting in 1839, of crop rotations without fertilizers. Fertilizer used prior to this would have been organic compost materials; thus, the original carbon level would have been higher, likely around 50-60 Gt C. This is important as the chemical NPK plots have retained the depleted soil carbon levels, around 30 Gt C, barely above the zero-fertilizer plot. Perhaps not unsurprisingly, the FYM plots that best preserve the original soil conditions had higher earthworms or, rather, the NPK plots were depleted in both carbon and earthworms (by up to 90% as noted below).
Often just these depleted NPK plots that are compared in their proportions of artificial fertilizers that are recommended in the most recent agrichemical advocacy papers, e.g., (Tang et al. 2025) claimed “plots receiving nitrogen and phosphorus fertilisers contained up to 28% more soil organic carbon than those left unfertilised”. Rothamsted also claim: “Across dozens of long-term fertilisation trials worldwide, nitrogen and phosphorus were associated with average soil carbon increases of 21% and 13%, respectively.” (https://www.rothamsted.ac.uk/news/fertiliser-boosts-soils-ability-lock-away-carbon-0). Truly all these plots were depleted in C when more properly compared to FYM plots.
A similar situation occurs when claims of no-till carbon and earthworms are said to be enhanced when, in actual reality, the relative values may be raised slightly, but from massively depleted proper values. This was clearly demonstrated at Haughley where the soil carbon and earthworms were both reduced by around 80% in organic compared to chemical (or a compromise organic with chemical fields equating to FYM+NPK plots at Rothamsted). Thus 20% remaining, if doubled, still only represents 40% of the original.
Misplaced logic also applies to carbon subsidies that exclude Organic farms on the false argument that they are already sequestering carbon to its limit. If such subsidies were seriously applied, these would reward existing or transitioning Organic farmers, valuing their experience in offering working models for reformed chemical farmers to emulate.
4.2.3. Broadbalk Rewilding Woodland (Wilderness) as an Upper Control and Exemplar
Nature’s ability to revive and thrive when left alone is shown at Broadbalk in a particularly useful experiment of an additional section which is rarely reported on, that of Wilderness section divided into two for forest or stubble. This was fenced in 1881 and left to regrow.
Compared to the best organic plots on Broadbalk, the carbon content is naturally higher in the rewilded Wilderness section, that all had similar starting C t/ha levels (Figure 23).
The soil carbon content at 23 cm depth starts about the same level as other depleted plots but gradually increased to more than double at >100 t/ha organic C. These are the most modest totals as the soil to the full depth of the roots may hold much greater carbon as indeed the roots and their mycorrhizae may too. Often the roots are about similar to the above-ground vegetation. In the total inventory the Broadbalk Wilderness may have about double the 450 value to about 900 or 1,000 t/ha organic C which would represent the amount of carbon potentially lost from these soils on initial forest clearing (that is classed as Land Use Change or LUC) now reduced to just 30-90 t/ha organic C. Conversely, this clearly demonstrates potential and achievable rates for SOC restoration.
Abandoned or set-aside farmland, if fenced to prevent stock over-grazing, may naturally regrow to its ecological optimum. While replanting is part of Permaculture (with saplings or seed-balls), another common practice is to simply set up perches and let the bird droppings work naturally and for free. Wilderness plot at Rothamsted regrew naturally.
4.2.4. Broadbalk Grain Nutrient Depletions
It is timely here to introduce perhaps the most alarming evidence of collapse of chemical farming with the widespread and catastrophic loss of nutrients, minerals and vitamins in their products. The example from Rothamstead is also from Broadbalk (Figure 24).
Data for other plots and other minerals (viz. Cu, Mg, Ca, K, S and P) that had similar declines, and several other plots were tested but not reported. Harvest Index (HI) is the grain to straw ratio (hence the lower yielding control plots have low grain yield but same HI when “dwarf” seeds were introduced in 1968, this cancelling yield dilution as a causal factor). In FYM grain, minerals were increasing since 1840 but collapsed at the same date as the others, albeit their declines were not as pronounced. Unfortunately, what effect adding NPK to the FYM in plot 2.1 since 1968 had on the grains from that plot compared to FYM only in plot 2.2 are unreported. Note that the 2000s data in the chart show Iron (Fe) in FYM plot at 30 mg/kg and in NPK plot at 20 mg/kg, or a +50% difference.
The graphs document critical nutrient declines, widespread across produce and regions, that commenced in the 1960s and have progressively worsened. Exact reasons or combination of factors are unclear, but the results may contribute to similar decline in plant, insect, animal and human health. This key subject requires greater investigation.
Causes of this nutrient decline from the 1960s Rothamsted attributed only to introduction of chemically-dependant dwarf wheat varieties developed for the Green Revolution (Fan et al. 2008). This is immediately rejected as a theory as similar and synchronous declines are reported for other crops, including fruits and vegetables without “dwarf varieties”, from many other countries and climatic regions of the world. There must be some overriding cause. What the Rothamsted reports fail to evaluate is that “Herbicides” were also introduced along with the new wheat dwarf varieties. Their report says this is MCPA (e.g., ref - https://croplifefoundation.wordpress.com/wp-content/uploads/2012/07/2-broadbalk.pdf). They also use fungicides, and this alone may be responsible for nutrient declines in plants if it interferes with the mycorrhizal associations that are largely responsible for plants’ ability to take up minerals from soil.
If partly true, the dwarf seed argument for nutrient depletion adds yet more argument for organic produce. These “dwarf” varieties higher grain yields cost is in greatly reduced straw stock (this a valuable cover mulch or compost ingredient). Rothamstead states “New seed was bought each year up to 1963. From 1963 saved seed from the previous Broadbalk crop (bulked from several plots and well mixed) was sown.” This is reminiscent of infamous contractual obligation of Monsanto’s “Roundup Ready” clients forced to buy new seed annually. This is contrary to common-sense, best practice, and the heritage of organic farmers passed down over millennia to keep and replant or share heirloom seed with neighbours. Seed saving and sharing is also routinely practiced on all organic farms to this day. Most crops that we rely upon today were domesticated in precisely this way.
The transition date noted in synthetic chemical uses in the figures presented above is interesting as it corresponds to the onset in1961 of nutrient decline in the wheat grain at Rothamsted. Rothamsted themselves had to increaser fertilizer rates from 144, up to 240 or then to 288 kg N/ha to maintain yields. Thus, excess fertilizer may be a partial cause of nutrient declines, not just seed varieties as they claim. Other possible causes of food nutrient declines are excess CO2 (with possible effects of nuclear testing changing carbon isotope ratios?), soil acidification and N deposition from acid rain, or other drifting biocides where use of these expanded greatly from the 1960s. Supporting evidence for the causes and remedies for this nutrient decline are, for example, by Garvin et al. (2006) and Thomas (2007) from USA and more widespread by Myer et al. (2017) or Bhadwaj et al. (2024). A recent review of organic nutrients is by Rahmen et al. (2024).
The possible contribution of acidification to the nutrient decline from combined effects of N deposition and rising CO2 are difficult to determine as the situation on Rothamsted is complicated by liming or marling required to maintain a balanced pH on some chemical fields after their initial rapid and critical pH drop. The broader global issue of critical soil acidification will be addressed in more detail below. Another contender in some reports is warming aspects of climate change, however the following chart argues against this, at Rothamsted at least, as rather than in the 1960s when nutrients declined, the increased temperature trend started later, after 1980s now +2 °C (Figure 25).
At the moment the cause, or combinations of causes, of widespread food nutrient declines are unclear, but will be investigated in a forthcoming paper on soil and health. A summary with citations of the food nutrient issues is in a 2023 report - https://vermecology.wordpress.com/2023/08/29/critical-decline-of-minerals-nutrients-in-agrichemical-vs-100-organic-foods/.
In trying to answer the question whether Organic food has escaped this nutrient decline is attempted in a comprehensive review (Holden 2001). This concluded (on pages 30 and 63) that mineral content of Organic produce may, on balance, be the same or higher than chemical but the toxic residues are much lower, as would be expected. This adds support for transitioning back to Organic foods.
Mayer et al. (2022) recently reviewed Organic food with higher mineral nutrients and dry matter (higher moisture may associate with supposed yield hikes). They concluded: “For a range of reasons, agroecological farming should be supported in the context the global climate emergency and loss of biodiversity. The limited evidence that compares nutritional value of organic versus conventionally grown F&Vs [Fruit & Veggies] adds an extra reason to switch from industrial to agroecological farming.”
Much more investigation is needed in the underlying causes of food nutritional declines.
4.2.5. Broadbalk’s Catastrophic Biodiversity Collapse
As well as soil carbon and crop nutrient declines, there have been large loss of biodiversity. Blakemore (2018a) reports on Rothamsted Insect Survey (RIS) that plotted a decline over a 30-year period (1973–2002) in one of four UK sites noted rapid agricultural intensification from the 1950s caused a collapse before monitoring commenced in the 1970s, a characteristic of broader and critical extinction issues on a global scale.
However, it is more insidious and with greater disingenuous obfuscation as the collapse of insects and other soil fauna was already reported from Rothamsted in the 1920s – about one Century ago or about 80 years after its inception – in the surveys by Morris (1922, 1926). Morris (1922: 303) had Rothamsted’s Broadbalk earthworm counts of about one million in manured arable plots and 0.46 million per acre in Nil “control” equivalent to 250 m–2 and 113 m–2 or a decline of about –55%). On other fields the insects and invertebrates were reduced up to 90% and earthworms were depleted too, being completely annihilated (i.e., reduced to zero) in N or Superphosphate plots (Figure 26).
Morris’s study showed soil-dwelling Oligochaeta (earthworms) completely annihilated in Nitrate and Superphosphate plots; their highest counts were in the FYM “Dung “plots. Only in organic plots did nature survive and thrive with no penalties in yields, as noted.
4.2.6. Rothamsted N Deposition and Soil Acidification Reflects a Global Issue
Goulding et al. (1998), nearly 30 years ago, concluded that artificial N deposition from the air was a significant problem, changing ecosystems through eutrophication and acidification. Incredibly they reported: “Our research has shown acidification resulting from atmospheric deposition, including N, under woodland as well as grassland. Soil pH has decreased from 7 to 4 or less in 110 yr, mobilizing aluminium and toxic metals.” This extreme >3 pH points change is an acidification increase of 100,000%! Comparatively, the Ocean Acidification of pH -0.1 in 200 years is claimed as just 30% is a distraction. Nitrogen deposition to winter cereals at Rothamsted were stated as c. 45 kg N ha/yr and deposition to woodland c. 100 kg N ha/yr or more. The authors make the remarkable statement that: “Such an amount of ‘ free’ N would greatly benefit organic and other low input farming systems.” Yet most organic growers would balk at this as they try to avoid all synthetic pollution that acidifies soil and stimulates microbes to consume humus.
This N benefit argument seems negated by the Zero N control flat-lining at Broadbalk, getting no apparent extra yield from massive increase in N deposition since the 1960s.
Adding Superphosphate to soils was recognized early on to directly increase acidity. An example of pH change on a relatively remote Australian site where acidification in a native pasture control was mainly from acid rain compared to the P fertilizer plots (Figure 27)
This study found that treated soil is more acidic over time, and in some cases, exchangeable Aluminium (Al) concentrations approached levels impacting production.
Globally, soil acidification from excess N and C deposition in acid rain is a major, but mostly ignored, issue that requires more scrutiny. Soil acidification is catastrophic to soil biota and also to micronutrient availability plus negative effects of Aluminium release.
4.2.7. Broadbalk Soil Bulk Density (BD) (Required for Total Carbon Calculation)
Reflecting that the whole experimental field had been allowed to “run down” for four years before testing, BD in 23 cm topsoil stayed compacted in NPK plots from 1840s but lessened from 1.25 to 1.10 g/cm3 (-12.5% or +13.6%) in the FYM plots. Wilderness is lower yet at about 0.9 g/cm3. This decompaction is primarily due to higher humus carbon content and aeration actions of extra earthworm activities. Total SOC calculation requires BD data. Sourced from - https://www.era.rothamsted.ac.uk/info/rbk1/soilphys.
4.2.8. Broadbalk Soil Moisture -33% Reduction
Data for soil moisture from Clark et al. (2012: Table 1) show 32% in FYM (plot 2.2) and mean of 26% for NPK plots (a point reduction of -16%) which was about the same for the Nil plot. Wilderness woodland was much higher at 41% soil moisture. Another report had 16% in Nil plots (presumably similar to NPK) and 24% in FYM plots, which is +50% more or, rather, -33% lower (https://files.core.ac.uk/download/pdf/162100858.pdf: Table III).
4.2.9. Broadbalk’s Fungi Collapse by -80%, and Rhizosphere Bacterial by -40%
The glomalin proxy for fungi showed generally low activity but five-fold greater levels in both FYM plots and Woodland compared to NPK plots, or with an -80% decline (Young et al. 2020: Figure 2B https://www.sciencedirect.com/science/article/abs/pii/S0038071711003671). Nitrifying bacterial counts ranged 0-18000/g of dry soil, the maximum number being found in the Broadbalk FYM plot (Soriano & Walker 1973). Rhizosphere bacterial taxonomic units (OTUs) differed in the FYM plot (2.2) compared to NPK plots from around 1,880 to as low as 1,100 OTUs, a -40% reduction (Kavamura et al. 2018). This confirms microbes greatly enhanced in organic fields in general (e.g., Lori et al. 2017).
4.2.10. Broadbalk’s Earthworms Collapse by –94%
Sizemur et al. (2017) as in Blakemore (2018: Table 12) found earthworms depleted from 400/m2 and 109 g/m2 in FYM to 70/m2 and 6 g/m2 in NPK plots or with a catastrophic -94.4% loss. This confirms earlier studies by Morris’s (1922, 1927) showing agrichemicals devastate earthworms, this alone heralded demise of chemical farming from inception.
4.3. Rothamsted Compared to Organic Haughley
The Haughley Experiment was established in 1930s by Lady Eve Balfour in the UK to test and compare the results of organic and non-organic methods on a whole farm scale with a design approved by Rothamsted and yields independently assessed by Cambridge University. Three sections of the same farm were operated independently as either wholly Organic with all produce recycled and excess (crops or milk) sold off; or a Stockless section using prevailing practices of chemical farming. A third section was Mixed – a compromise of the two. Details are provided by Blakemore (2000, 2018). In summary, crops were as high or higher in the organic sections (by +7.7%) and the soil had about 25% extra moisture and about double both the carbon content and earthworms. Or, more correctly, the chemical fields had -6% lower crop or milk yields, -29% lower moisture, -56% SOC humus, and -44% lower earthworm abundance with -48% less vermi-biomass.
Near equivalency of yields, but also depletions of carbon and earthworms, as reported from Rothamsted, e.g., in their Broadbalk trials with FYM compared to NPK, closely resembled Haughley’s Mixed section with soil as poor as in the chemical Stockless fields.
The conclusion from all the above data is that the Rothamsted experiments proved from their earliest days that retaining organic fertilizers maintains yields, biota and soils while chemical fertilizers (and other synthetic biocides) are inordinately destructive not just on the actual farm, but to the whole of the wider ecosystems at a global scale. Further information on the success and failures on Rothamsted are available here - https://vermecology.wordpress.com/2023/11/11/roth-rebu/. Finally, despite all evidence from their trials, a 2009 Rothamsted article dismissed organic as a viable option (unless meat consumption is reduced) https://research.wur.nl/en/publications/can-organic-farming-feed-the-world-a-contribution-to-the-debate-o/ . Another 2021 study argued that Europe could feed itself with organic farming - https://doi.org/10.1016/j.oneear.2021.05.008. Other countries too could be self-sufficient if organic and Permaculture principals were followed and chemicals reduced.
4.4. To Plough or Not to Plow?
The benefits on organic farms or plots of cultivation, e.g., ploughing and harrowing, need to be balanced with alternative methods of weed control and seed bed preparation. A recent trend for conservation of reduced tillage or direct-drill (sowing seeds behind narrow tines that rip the soil) assumes that cultivation harms soil and that spraying a farm with glyphosate or some other biocide has benefit. The inappropriate comparison within and between chemical farms or fields alone, show these techniques as damaging compared to overall outcomes on organic farms. Moreover, organic farming has many options for weed control (e.g., cover crops, mulching, rotation to reduce seed banks, and manual or mechanical methods) other than ploughing as appropriate. Certain “weeds” are tolerated as green-mulch or host plants for life- stages of pest predatory insects.
It should also be noted that the Rothamsted Broadbalk plots were fallowed in the 1920s which involved ploughing and harrowing several times, yet the slightly depressed carbon levels soon recovered. This also pertained to the organic Haughley plots that were traditionally ploughed before sowing which seemingly had almost negligible effect on the carbon and earthworm counts, these both being significantly higher than in the chemical fields. The conclusion is that cultivation is not necessarily detrimental and is a valid weed control method itself preferable to blanket herbicide spray for zero-till and direct-drill. This is endorsed in a 2025 report - https://sustainablefoodtrust.org/news-views/its-not-the-plough-but-the-how/.
As disingenuous as reporting chemical yield increases or carbon storage compared to zero fertilizer crops or just the relative amounts of chemical applied, is the comparison of cultivation effects. Both Rothamsted and Haughley results show that cultivation does not decrease SOC nor earthworms in the long term, rather it is the overriding issue of inorganic fertilizer and toxic chemicals applied that deplete both of these. Ploughing (or plowing), as an established practice for controlling weeds and preparing seedbeds, is not as deleterious as portrayed. However, a common practice of spraying glyphosate in lieu of cultivation does have profound consequences in contamination and toxicity to fungi, earthworms and farmworkers as well as the general public consuming the produce.
4.5. Other Innovative Interventions CCS/BECCS vs S/ECCS
In this report so far, beneficial aspects of organic are proven in humus (carbon capture and sequestration) as well as the interlinked effect shown by an earthworm abundance.
Carbon Capture and Storage (CCS) or Biomass Energy and CCS (BECCS) at their most ambitious claims are relatively trivial compared to other practical and proven (i.e., natural) carbon removal options. Relative and proportional importance is reported on in Project Drawdown and shown in carbon cycle figure (Blakemore 2024: Figure 14) (Figure 28).
The recent highly promoted and marketed “Biochar” or pyrolysis schemes are a very minor part of the broader CCS activities, themselves almost irrelevant. (Also, as an agricultural amendment these “chars” offer zero advantage over proven composts). At their most extravagant the best expectation for all unproven CCS is still only a miniscule 0.1 Gt C/yr sequestration at enormous and quite unjustifiable costs (Kazlou et al. 2024). Organic farms and earthworms alone offer best proven remedy and are practically free.
Referencing that Organic farms are only about 1% and that biomass of earthworms (and other soil biota) declines are around >80% with the majority agrichemicals compared to wholly Organic farms as reported by Blakemore (2018) translates to likely large losses. A relatively simple solution is to preserve earthworms and to attempt to restore the depleted agrichemical and woodland populations to their optima. Several earthworm species remove concentrated atmospheric CO2 from their burrows via their calciferous glands, secreting “inorganic” calcium carbonates (CaCO3) conservatively estimated at about 1 Gt C/yr as earthworm calcite as noted below. Restoration of the 80% depleted populations would presumably increase secretions five-fold (5 Gt C/yr) at least in farmland and some woodland biomes. Such options are reported as Soil/Earthworms CCS, or S/ECCS here - https://vermecology.wordpress.com/2019/11/11/earthworm-cast-carbon-storage-eccs/. Further work is needed to determine merits of more S/ECCS.
Production of CaCO3 is actually possibly much higher, it is reported up to 261 kg C/ha/year in some species (Versteegh et al. 2014). Taking agricultural land at 10 Gha (already doubled for terrain) gives about 2.6 Gt C/yr; to include forests presumably doubles this rate. Other estimates are of up to 2.24 t C/ha/yr which, for 10 Gha farmland, would be about 20 Gt C/yr extracted from atmospheric CO2 and potentially stabilised for thousands of years (Lampkin et al. 2011; Versteegh et al. 2013).
Tellingly, the modest 1 Gt C/yr earthworm calcite is more than all the solid CaCO3 produced in the shells of all marine organisms, estimated at just 0.7 Gt C/yr (IPCC TAR-3, 2001: 198 - https://www.ipcc.ch/site/assets/uploads/2018/02/TAR-03.pdf). Coral reefs thriving in warm water contribute a tiny fraction at 0.084 Gt C/yr CaCO3 production.
4.6. Permaculture “Greening the Desert” Project
A practical demonstration site is found in Jordan where an essential, initial step was to fence the property to exclude goats as such livestock, despite contrary claims by global Savory Institute, denude remaining vegetation in marginal lands thereby expanding deserts. This link provides details - https://www.greeningthedesertproject.org/. The project celebrated the return of fungi and earthworms as key indicators of its success. Similar de-desertification is entirely possible in other regions, such as Australia or Africa.
5. Discussion
5.1. On Soil (and Worms), Climate, and Food
Despite their fundamental importance to all aspects of life on Earth, the scope, state and status of soils remain remarkably poorly resolved. Michaelangelo’s comment from 1500 still rings true that we know more about the celestial bodies (and the “boasted glories” of the oceans) than we do of the soil directly beneath our feet. Case in point, and reflecting the remark about increasing desertification, is that Gibbs & Salmon (2015: Table 2) showed degraded land estimates may vary from less than 1 billion ha (1 Gha) to over 6 billion ha, a massive six-fold variation. But they considered the higher figures having most weight.
IPCC’s Seventh Assessment Report (AR7) is expected to be completed by late 2029. Some of their data, as noted in the Introduction, is provided by the Global Carbon Budget (2024 - https://globalcarbonbudget.org/fossil-fuel-CO2-emissions-increase-again-in-2024/) that in the latest report had emissions of 37.4 billion tonnes of CO₂ (10.1/yr Gt C) from Fossil Fuels (FF) and 4.2 billion tonnes of CO₂ (1.1 Gt C/yr) from Land-use change (LUC), a ratio of 90% to 10%. Proper accounting shows gross FF emissions unchanged but similar gross Land emissions of around 440 Gt C/yr with real ratio around 2% to 98%.
A recent review found that Land sink is overestimated by 23% and the Land Use Change emissions are increased by 14% (Dorgeist et al. 2024). These give support to the current study but are themselves underestimations: Land is no longer a sink and LUC is higher.
The inability of a massive Land sink to fully absorb the entire 450 Gt C/yr of CO₂ released is due to critical LUC from deforestation and soil erosion/toxicity causing its failure to compensate. The resulting net excess of 2.8 ppm atmospheric CO₂ is equal to 5.96 Gt C (gigatonnes of carbon, or less than 1.4% of Land’s absorption rate also of 440 Gt C/yr). This excess is equal to half the net LUC shown in the revised global Carbon Cycle figure of ~12.4 Gt C/yr indicating a need to aim for a 50% reduction of LUC. The two main policies of 50% reduction in red meat over-consumption, and 100% Organic farming would increase land’s capacity to absorb this excess by greater photosynthesis for SOC.
This is not at all an unrealistic objective as rationally there are no other practical options. According to Gibbs & Salmon (2015) the FAO TerraSTAT interpretation of GLASOD had determined that over 6 Gha, or 66 percent of the world’s land, had been affected by degradation, leaving roughly only a third of Land’s surface in good condition. The UN’s Land Outlook Report (2021) concluded: “Land is the operative link between biodiversity loss and climate change, and therefore must be the primary focus of any meaningful intervention to tackle these intertwined crises. Restoring degraded land and soil provides the most fertile ground on which to take immediate and concerted action.”
Conversely, Anderson et al. (2019) reported that Natural climate solutions are not enough and decarbonization of industry and fossil fuels must be reinforced. This too seems the main theme of IPCC in all its manifestations, including the latest (IPCC 2021 and COP30). There are two major flaws in both latter arguments: Firstly, that all terrestrial calculations are based upon extrapolations that simplistically report land as being planimetrically flat, whereas in reality land is hilly and soil is bumpy, to at least double the true surface area and hence many, if not all, of these soil losses and models for restoration. Secondly, reducing industrial and energy outputs by up to 26% was already tested on a global scale during the 2019-2022 COVID shutdowns that had no noticeable effect on NOAA’s CO2 charts. The COVID shutdown effects are summarized here as: “Daily global CO2 emissions decreased by –17% (–11 to –25% for ±1σ) by early April 2020 compared with the mean 2019 levels, just under half from changes in surface transport. At their peak, emissions in individual countries decreased by –26% on average” (Le Quéré et al. 2020). This clearly indicates that resolution is to be found mainly in soil as is presented herein.
While not arguing against reducing fossil fuels emissions, this report shows it should be a much lower priority than restoring soils. Energy resource conservation is essential for agricultural and industrial equipment, but there are other options for energy supply and efficiency provided for by Permaculture. Examples are solar-passive building designs, terrestrial heat-pumps, and Geothermal energy, or compressed-air Trompe systems. Geothermal energy is readily available and obvious in Japan, but is possible in any region.
This report shows how soil metrics are very poorly known, being both understudied and underreported. Nevertheless, the context of global issues have been condensed to nine or ten boundaries of concern – a type of Ecological triage - by Rockstrom et al. (2009). These are shown below, updated and revised with spurious Ocean Acidification replaced by Soil Acidification. The contributions of poor agricultural practices are also represented (in light green) as being major contributors to most of these nine areas. Of note is Climate Change not given top priority; mostly pressing are soil issues and extinctions (Figure 29).
Authors of a the initial review (Rockström et al. 2009) identified both “rate of biodiversity loss” and synthetic N-P fertilizer overuse as most severe and pressing of global problems, more so than climate change, solutions for which they suggest as an immediate 25% reduction in N fertilizers and: “Agricultural systems that better mimic natural processes (e.g., complex agro-ecosystems)”, in other words: A call for 100% Organic agriculture.
In response to these environmental crises, consequential social and economic issues are claimed to be addressed in the UN’s SDGs of their Agenda 2030. However, because soil, which is fundamental to issues of species extinction, climate and food security are almost completely ignored (SDG’s mention “soil” only twice in passing!) all other derived issues and solutions will inevitably fail. Thus, a complete overhaul and revision of SDGs is needed to properly appreciate the soil foundation upon which all other issues sit. The graphic below represents a revision for more ecologically realistic ambitions (Figure 30).
5.2. Practical Solutions in Context
Considering the problems and solutions in relative proportions, Project Drawdown compiled a type of context and triage system (as advocated by this current report) with practical and prioritized suggestions for remedies to issues. Their conclusions support those advocated by this current report with recommendations weighted for effectiveness at international policy levels and also at a personal or household level (Figure 31 and Figure 32).
Based upon GCB data, the “Blue Carbon” in seagrasses, tidal marshes, and mangroves are estimated to total ~32 Gt organic carbon (Walden et al. 2024). This is just 0.1% of the total terrestrial carbon, mainly in Soil, at >33,000 Gt organic carbon. The relatively low importance of Ocean or CCS are clearly demonstrated in the chart and this report. Appropriate policy would be to redirect all the massive funds from irrelevant Marine projects or speculative CCS and to actually confront the triple issues of extinction, climate and food security, by reallocating these to researching soil and Organic farming.
The seemingly low value of just 1.0 Gt for issue of “Address Wastes & Diets” (at household level) does not represent its disproportionate synergy because this would be the major driver for the other Land cures. Indeed, this is reflected in the relative merits for individual actions that are defined with primary emphasis precisely on Waste and Diet in Figure 32.
As well as this plant-based diet (i.e., meat reduction), further conversion to Organic restores soil carbon lost from chemical farms while providing food security in terms of escape from agrichemical and GMO dependencies thereby lessening need for irrigation or pollution control. Penalties for Organic production are higher labour requirements, but these can be considered positives where they reduce rapid urbanization and unemployment whilst also providing healthy activities in Nature. The need for personal protective equipment to distribute, mix or spray toxic agrichemicals (assuming complex dilution, dates, rates and handling advice are followed) indicate their inherent dangers.
Regarding pollution, although Organic farming now disavows human sewage often contaminated with pharmaceuticals, heavy metals and other long-term pollutants, this had traditional use. Rice traditionally used humanure and canal sediment dredgings to maintain paddy fertility. Rice husk residues are still burned today adding some extra charcoal. None of these practices are considered sensible with current toxins and pollutants in food, pharmaceuticals and pollution. Yet the importance of temporary anaerobic conditions for SOM accumulation is underlined by results from wet rice-cropping in paddy soils, which show a profound enrichment of SOM over 2,000 years (Kalbitz et al., 2013). Organic rice farming in Thailand had significantly higher SOC stock increases (1,107.6 kg C/ha/year) compared to conventional rice (625 kg C/ha/year).
Organic rice in Philippines, and other crops like sugar cane, were described by Blakemore (2016) that provides model for reducing pollution in Australia’s Great Barrier Reef that receives up to a billion dollars per year for conservation, but little or none of this goes towards the greatest issue, that of the source soil pollution (see Appendix A). In this regard, of note is that whilst hundreds of soil organisms are recorded extinct, not a single coral species nor wholly marine fish is yet reported (and just one marine mammal in 250 yrs).
Complete environmental collapse may be avoided if scientific information and government policies report on and rectify the enormous costs of indulgent meat eating. At a personal level to avoid hypocrisy, anyone sincerely advocating for environmental (or ethical) issues must reduce or eschew their own meat consumption. As well as reducing deforestation, this also allows resource redirection of crop production for direct human consumption, rather than inefficient nutrition via animals. Egg production or dairy are not as destructive, both can operate on pasture or fallow synergistically as part of regular, Organic, crop-rotation. Grazing and foraging can be readily intermeshed with silviculture or orchards with some livestock. Just one small example is an organic farm in Canberra with cattle and a flock of 4,000 a free-range chickens protected from predation by a small number of Maremma Italian-sheepdogs, the farm selling some of its produce at the gate.
Perversely, rather than meat moderation, some people advocate for greater meat consumption. Allied to this issue is the work of Allan Savory and his anecdotal “Holistic” pasture management alleged to combat desertification by moving more stock into marginal lands. This idea of taking cattle or other stock into deserts to restore them has immediate flaws as, by definition, arid lands lack sufficient food, or water, and a cow or bullock may drink up to 100 litres per head per day. Having goats in arid or Mediterranean climates are often, literally, the final straw. The broader argument also implies need for more meat rather than viewing the amount of global deforestation required being wholly unjustifiable just to satiate this spurious demand. Furthermore, most if not all of supposed Holistic management is already a part of Agroecology, although neither are currently considered wholly organic management. Most of the recently promoted practices such as strip-grazing and fallow rotations as modified for cell grazing were already in common use in classical organic husbandry, e.g., Dr André Voisin. A critical review is by Hawkins et al. (2022). In contrast to Alan Savory’s meat promoting esotery is an holistic rationale of a scientific approach towards agroecology by Widdowson (1987).
This supports the many reports, such as Rothamsted’s, showing that long-term addition of organic matter improves crop yield, water holding capacity, porosity, and water stable aggregation and decreases bulk density and surface crusting, and the incorporation into the soil matrix of surface litter. All of these effects may be attributed to the natural activities and synergistic stimulation of earthworms which of themselves increases, or at the very least, maintains SOC. No chemical or physical interventions can mimic this.
Corollary of Regen is Rothamsted that may claim FYM is organic and soil restorative but, as noted herein, the issue of healthy and uncontaminated food is unresolved. Certainly, their organic fertilizer has benefits, but the need is to properly compare to 100% Organic. To remain relevant, Rothamsted may embrace their success but must admit failure of chemical farming, then start to demonstrate restoration of Organic from chemical production. Rothamsted may then become an exemplar for proper Organic conversions.
6. Conclusions
In conclusion, it is fair and reasonable to state that just as the Rothamsted experiment has run its course and rather than proving the benefits and needs of a wholly chemical approach it is demonstrated the opposite: Organic management, albeit improperly applied there, have been clearly proven as superior by all metrics. Similarly, there remains little justification for continuing to destroy fundamental life support systems – such as healthy food, soils, air, water and a vibrant biodiversity – with destructive chemical farming. Making no ecological sense, should the hidden costs be realized (to health and the environment as well as to climate), were reparation applied and subsidies removed, then it makes no economic sense either. The restoration of proven but improvable Organic husbandry does make sense in all its aspects. There are few penalties or disbenefits. Yields are as high or higher, food quality is better, soils are healthier, and carbon sequestration is an integral part. Concepts are simple and scalable: To simply recycle organic “wastes” as composts, and to avoid toxic synthetics.
In an introduction to the book Harnessing the Earthworm, Lady Eve Balfour wrote: “When the question is asked, ‘Can I build top-soil?’ the answer is ‘Yes’, and when the first question is followed by a second question, ‘How?’ the answer is ‘Feed earthworms’”. This prescience insight is a path we should perhaps now follow to restore our soils and health.
Finally, the paramount importance of preserving and restoring earthworms as key drivers of soil health in most situations is restated as represented in the photo below (Figure 33).
Multiple benefits of earthworms on plants, litter, soil and other soil biota are irreplaceable by mechanical or chemical means. From a fresh weight ‘vermi-mass’ of 4–8 Gt, doubled for terrain relief a massive 8–16 Gt (with carbon content up to 4 Gt) if earthworms process approximately their body weight per day, then these values per year are in the region of 10 x 366 = 3,660 Gt soil and perhaps most NPP production each year.
Restoring organic husbandry with earthworms validates Darwin (1881) who noted: “I am led to conclude that all the vegetable mould [humus or SOC].. has passed many times through, and will again pass many times through, the intestinal canals of worms.” Interestingly, one of his descendants now living in Sydney has come to similar conclusions to those presented in the current report – the need to reduce red-meat eating (see - https://www.thedarwinchallenge.org/).
That the present report is speculative in regard to some crucial areas of loss and restoration of topsoils, is due to lack of resources allocated to investigate these key issues, in particular want of a Soil Ecology Institute to research them. This is urgently required, and costs are deferred if resources currently misappropriated on less crucial Marine issues are redirected. In particular boasted claims justifying the Ocean are diminished, and most of their issues solvable in soils, thus resource and funding reallocation is most appropriate. These are presented in more detail in an Appendix A.
Funding and Conflicts of Interest
None.
Acknowledgements
Dr Alexandra Elbakyan founder of Sci-hub that allows free access to expensively paywalled publications surmounting this obstacle to scientific research. Freya Mulvey gave editorial hints; Gerard Wedderburn-Bisshop commented positively.
Appendix A
By R.J. Blakemore PhD, VermEcolology, Japan; IUCN; Email: rob.blakemore@gmail.com.
The report this Appendix is attached to documents that the surface area of Earth has been doubled for topography, terrain and soil rugosity – thus Life on Earth is also doubled. It also provides a solution to Climate Change, Extinctions, and causes of human Cancer. This is being modest… the actual surface area of Earth is likely tripled or quadrupled, and most of the other causes of species’ extinction and human ill-health are also resolved through Soils. Here more insight is provided into institutional deficiencies and policy biases as the main cause of our failure to fix many of the problems from human excesses.
Institutional Bias and Soil Oversight
The 2,409-page IPCC (2021) report is highly biased as “Ocean” is cited 7,337 times but “Soil” only gets 1,061 hits, or just one seventh, this despite soils being key to climate and food. “Land” gets about half the number of hits as Ocean at 4,428, but Land is arguably a thousand times more relevant and important in terms of carbon cycle, biodiversity and food security. IPCC references “soil organic carbon” just five times, while there are whole chapters on spurious “Ocean Acidification”. Soil acidification is not mentioned at all.
The IPCC team had 198 Coordinating Lead Authors, 36 Review Editors (total 234) with an additional 615 Contributing Authors (total 850). Of these, several belong to major Marine, Meteorological or Atmospheric Institutes, but I cannot find anyone affiliated with a dedicated Soil Ecology Institute. This is hardly surprising as none exists anywhere.
A search AI Overview says: “There is no single “soil ecology research institute” but many research groups and institutions worldwide that focus on the subject, such as the National Centre for Soil Ecology (NCSE) in the Netherlands, a virtual platform which connects Dutch soil ecologists, and the Institute of Soil Biology and Biogeochemistry in the Czech Republic. Other examples include the James Hutton Institute in the UK, the ZHAW Institute of Natural Resource Sciences in Switzerland, and the Soil Ecology and Ecotoxicology Lab at the University of Coimbra (CFE) in Portugal.” None of these compete in the scale and staffing of the many Marine facilities. This deficiency, or rather disparity, needs to be urgently addressed with proper priority and resource reallocation.
Bias is not only with IPCC, it is much more pernicious. As another example, ESSD 2025 - https://essd.copernicus.org/articles/17/965/2025/essd-17-965-2025.pdf cites Ocean 450 times but Soil only gets a dozen mentions while, of the 88 institutions the authors are affiliated with, not one has mention of Soil in their title. Surely time for a “Sea Change”.
There is no shame in making honest errors in Science, but there is in failing to correct them. Throughout this report there are blatant omissions in reporting the importance of soil. Also clearly shown is how relatively immaterial are the boasted glories of Oceans.
Justification for Marine research usually involves hackneyed claims that Ocean occupies 70% of the Earth’s surface (truly just about 30% when terrain is properly considered), has up to 90% of biodiversity (truly 0.001% or less), provides food for half the world (actually 1%) and, most perverse, that Ocean supplies 50-85% of the oxygen we need to breathe. In the same breath, Marine researchers, without irony, will claim the Ocean is becoming anoxic due partly to catastrophic acidification that will dissolve the precious coral reefs.
It is difficult to fathom why these falsehoods are widely accepted without challenge. Especially lapse are the few soil researchers who from cursory study know marine claims are quite false. Yet they do not feel obliged to speak out to correct these errors. Why not?
Fossil Fuel Fallacy
Deforestation is not directly related to net carbon loss to the atmosphere, it is the accompanying depletion of the litter layer and topsoil, and eventually subsoils, to decomposition and erosion that does. The Broadbalk example shows that immediate release of carbon due to felling of above-ground trees and other vegetation – most incinerated – which is shortly followed by greater than 50% loss of topsoil carbon. This then is the major source of atmospheric CO2, both historically and currently. The argument by IPCC that the reduced proportion of ancient carbon isotopes demonstrates this is ancient carbon, i.e., fossil fuel sources, is misconstrued. Ancient soils, some thousands or millions of years old, are similarly depleted in these isotopes. Q.E.D.
Failures of Scientific Enquiry
A starting point is with the basics of Life on Earth dependent upon Photosynthesis.
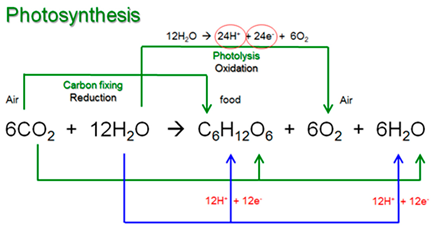
Requirements are for atmospheric CO2, soil based freshwater H2O, and sunlight, all three of which are sufficient and freely available. Those attempting to add fertilizers to this must accept that Evolution is based upon these essentials being in gaseous form (CO2 in the atmosphere), liquid (in rainfall) and in commodious range of solar insolation; all being “just right” under our planetary range of temperatures, pressures and irradiation. However, for photosynthetic plants to grow and reproduce and evolve, they rely entirely upon the Soil that has abundant supplies of essential nutrient stores. Is this also abundant and free? It is taken for granted, but soil is the basis supporting all Life on Earth.
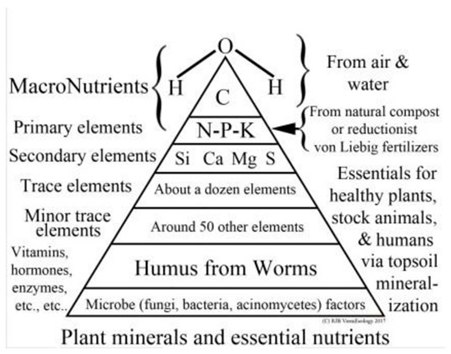
Basic photosynthesis equation shows CO2 is source of all organic carbon, not humus. Whereas terrestrial plants take in and recycle the entire atmospheric stock within two years, marine plants use ~40 Gt C/yr (from about 700 Gt C?) of dissolved CO2 thus are not directly involved in active uptake nor direct recycling of atmospheric carbon dioxide.
Balanced stoichiometry for respiration and combustion (decomposition/fire) is the reverse: , using O2 and recycling CO2 and water/steam.
Ecology is defined as the interaction between living organisms and their environment, both vital and inert (i.e., biological, physical or chemical). Biology is thus part of Ecology. Biological symbioses and antagonisms are a fundamental part of Ecology, as are plant and animal behaviours, while chemistry is of lesser concern. Farming is ecological too.
Unfortunately, most academic agronomists and agrichemical representatives promote agriculture as a mere chemical enterprise, yet the growing of crops is entirely ecological, much more complex than a few simple elemental reactions. Agricultural colleges typically conduct chemical or GMO trials using single plants in a soil that is sterilized (usually with chemicals or heat) in order to avoid the inconvenience of natural biological variation, for example the presence in a pot or a plot of a worm. The results of the treatment effects are then reported compared to the controls as if this is the definitive outcome. In reality, the ecological complexities of Nature are often outside the remit or realization of such narrow confines of a mere chemist or biochemical “engineer”. Proper and practical ecological outcomes may be better sought on adjacent fields on operational farms under different regimes, such as full chemical versus 100% organic.
Government Policy and Public Funding
Policy needs are, firstly, for open and honest scientific reporting and critical analysis of factual soil and biotic baseline data and any changes in these along with practical and beneficial remedies. This implies a need for independent researchers without commercial or other vested interests. A model for this is in the many Marine research facilities mostly having government support. With the proper context and urgency of triage, as in the current report, there is an imperative to redirect funding appropriately.
In this way the establishment of essential Soil Ecology Institutes would be cost free and, moreover, would be of real benefit to the taxpaying funders in terms of natural health.
There is concomitant need to demand 100% organic food as it is now well established that the continued poisoning of the environment with artificial and toxic chemicals is immoral and suicidal. The trope that more food is needed and this is only achievable with yet more synthetic input is false when the true yields, nutrient content and environmental benefits of natural food are properly studied and reported independently.
Government subsidies removed from agrichemical and meat producers can similarly be re-directed to organic producers. This may involve encouraging of domestic and municipal composing. Trucks delivering food to cities should return to the farms with the market left-overs and other food or garden wastes for recycling via composts.
Commercial entities and the companies responsible for deforestation, poisoning of the environment and food should recompense. At present the polluters often do not pay.
The argument that because organic farmers’ fields already have increased soil carbon and higher biodiversity they should not be entitled to carbon credits or other beneficial incentives as paid to Regen farmers need to be reevaluated. More properly, organic farmers or Permaculture practitioners may be held as deserving models for emulation and instruction to those farmers in transition or to rehabilitate chemical farmers.
Over-Expenditure on Ocean
It is undeniable that coral reefs are interesting with great diversity, for an Ocean habitat, but they cannot be argued to have much value to fisheries (providing less than 1% of human food), nor threat of extinction since no coral is yet reported extinct. Moreover, the justification for massive government subsidies for their research seem misplaced. For example, the Great Barrier Reef in NE Australia has received $billions in funding starting from 1960s. How much of this has gone towards supporting sugarcane farmers to convert to organic to help fix the reefs’ pollution problems? The State of Queensland has around 350,000 ha of land used to provide 95% of Australia’s sugarcane, and just a tiny fraction of 55 ha operated by Bundaberg Sugar is certified organic or in conversion as of early 2024, on currently available information. Yet a preliminary study in 2013 found that organic sugar cane in Philippines had higher yields, more carbon and much greater soil biodiversity that conventional, chemical neighbours (Blakemore 2016, 2018). Rational argument is that supporting organic growers, rather than yet more marine misinformation, resolves soil issues whence the problems of the Sea mainly originate.
From 2000 to 2010 a $1 billion Census of Marine Life project determined that there are only 230,000 organisms in all Oceans, including microbial life, and speculated a total of 2 million. Thus, a similar diversity to all the World’s Oceans may be found in a handful of healthy soil. Yet there is very little support for soil biodiversity such are earthworm research compared, for example, to fully supported Polychaeta marine worm research that is of zero benefit thus must be exceedingly difficult to justify the expense and effort in a time of multiple crises. Such rationale and funding disparity needs correction, not least for self-preservation concerns of Climate, Food and the extensive extinction of Soil.
Support for the coral reef is predicated on the main claim that climate change is the major problem which may result is sea level rise and warmer waters – despite corals relying on both of these – while mainly failing to accept that any chance to address climate or pollution can only be achieved by fixing the Soil, on land and on farms or in our food.
The Table below shows how Context and Triage are essential for making rational choices.

Table A1.
Summary of Disparities in Relative Importance of Three Major Realms of Life: viz. Land/Soil, Ocean and Freshwater, often mis-represented as having equal merit.
Table A1.
Summary of Disparities in Relative Importance of Three Major Realms of Life: viz. Land/Soil, Ocean and Freshwater, often mis-represented as having equal merit.
| Ecological Realm | Soil/Land (% of total) | Ocean | Freshwater |
| Earth’s surface area (+ terrain) Gha | 64 Gha (~65%) | 36 (~35%) | 0.5 (~1%) |
| Biodiversity/Species totals | ~2.1x 10^24 (>99.9%) | 10^10 | <10^10 |
| Total species known (Spp % Approx) | <0.00001% | >10% | ~70%? |
| Extinctions on IUCN Redlist Spp | >910 (>90%) | 2-4 (0.2%) | ~100 (9%) |
| Living Biomass/Carbon Gt C | ~2,500 (>99%) | 3 | 0.3? |
| Organic carbon store Gt C | 30,000 (>90%) | <1,000 | 2,500 (soil) |
| Productivity NPP Gt C/yr | 220-270 (~90%) | 15-30 | 1.3 |
| Human food Calories % | >98% | >1.5% | <1.5% |
| Freshwater store % | >70% | 0% | <30% |
| O2 release from NPP/yr % | >99% | 0-1% | <1% |
| Ecological Services value $T/yr (%) | 150 (>98%) | 3 | <0.3? |
| Floods/Fires, etc. events/yr (%) | >400 (100%) | - | - |
| Urban/infrastructure area % | ~1-2% | - | - |
| Agriculture (on habitable area) % | ~50% | - | - |
| Land/soil degraded due to human activities | 30-66% (33% untouched) | - | - |
| Organically farmed area | 1-2% | - | - |
| Recent Acidification pH (% change) | -0.24 - 2.0 (>10,000%) | -0.1 (30%) | -0.3 (90%) |
| Plastic pollution Mt/yr | 82 (>90%) | 1.7 (0.5%) | 7 (9%) |
| Dedicated Eco Research Institutes | 0 (0%) | ~900 | 90 |
| Ecological Research funding $$/yr | 1%? | 90%? | 9%? |
Information in this Table may be sourced or checked; comments/corrections welcomed.
References
- Anderson, C. M., DeFries, R. S., Litterman, R., Matson, D. C., Nepstad, D. C., Pacala, S., Rastetter, E., & Field, C. B. (2019). Natural climate solutions are not enough. Science, 363(6430), 933-934. [CrossRef]
- Asner, G. P., Scurlock, J. M. O., & Hicke, J. A. (2003). Global synthesis of leaf area index observations: implications for ecological and remote sensing studies. Global Ecology and Biogeography, 12(3), 191–205.
- Bai, Lulu; Duan, Jinxiao; Shi, Peng; Xiao, Jun; Li, Zhanbin; Li, Peng (2025). Erosion-deposition processes drive soil organic carbon mineralization through aggregate breakdown and buildup. CATENA, 260. [CrossRef]
- Bhardwaj RL, Parashar A, Parewa HP, Vyas L. (2024). An Alarming Decline in the Nutritional Quality of Foods: The Biggest Challenge for Future Generations’ Health. Foods. 13(6):877. [CrossRef]
- Blakemore, R.J. (2000). Ecology of earthworms under the “Haughley Experiment” of organic and conventional management regimes. Biol. Agric. Hortic. 18, 141–159. Available online: http://orgprints.org/30000/ .
- Blakemore, R.J. (2016). Veni, Vidi, Vermi… II. Earthworms in Organic Fields Restore SOM & H2O and Fix CO2. Veop: 2 (2): 1-26. [Online – https://veop.wordpress.com/wp-content/uploads/2016/09/vvv-ii.pdf].
- Blakemore, R. J. (2018a). Critical Decline of Earthworms from Organic Origins under Intensive, Humic SOM-Depleting Agriculture. Soil Systems, 2(2), 33. [CrossRef]
- Blakemore, R. J. (2018b). Non-Flat Earth Recalibrated for Terrain and Topsoil. Soil Systems, 2(4), 64. [CrossRef]
- Blakemore (2019). https://www.science.org/doi/abs/10.1126/science.aav0550.
- Blakemore, R. J. (2024). Biomass Refined: 99% of Organic Carbon in Soils. Biomass, 4(4), 1257-1300. [CrossRef]
- Blakemore RJ (2025). Biodiversity restated: > 99.9% of global species in Soil Biota. ZooKeys 1224: 283-316. [CrossRef]
- Buringh, P. (1984). The Role of Terrestrial Vegetation in the Global Carbon Cycle. In: Remote Sensing. Ed. G. M. Woodwell. 1984 SCOPE (No. 232). Wiley & Sons. Pp. 91 – 109. https://scope.dge.carnegiescience.edu/SCOPE_23/SCOPE_23_3.1_chapter3_91-109.pdf.
- Clark IM, et al. (2012). Impacts of nitrogen application rates on the activity and diversity of denitrifying bacteria in the Broadbalk Wheat Experiment. Philos Trans R Soc Lond B Biol Sci. 5;367(1593):1235-44. [CrossRef]
- Crézé, C., Saatchi, S., Kwon, N., Yang, Y., and Li, S. (2025). High-resolution global map (100 m) of soil organic carbon reveals critical ecosystems for carbon storage, Earth Syst. Sci. Data Discuss. [preprint], in review, 2025. https://essd.copernicus.org/preprints/essd-2025-294/essd-2025-294.pdf. [CrossRef]
- Crowther, T.W., et al. (2019). The global soil community and its influence on biogeochemistry. Science, 365(6455): 772-773. https://www.science.org/doi/abs/10.1126/science.aav0550. [CrossRef]
- Darwin, C. (1881). The formation of vegetable mould, through the action of worms, with observations on their habits. London: John Murray.
- Dinakaran, J., Hanief, M., Meena, A., Rao, K. S. (2014). The chronological advancement of soil organic carbon sequestration research: a review. Proceedings of the National Academy of Sciences, India Section B: Biological Sciences, 84(3), 487‒504.
- Dorgeist, L., et al. (2024). A consistent budgeting of terrestrial carbon fluxes. Nat Commun. 15, 7426. [CrossRef]
- Erb, KH., et al. (2018). Unexpectedly large impact of forest management and grazing on global vegetation biomass. Nature 553, 73–76. [CrossRef]
- Fan MS, Zhao FJ, Fairweather-Tait SJ, Poulton PR, Dunham SJ, McGrath SP. (2008). Evidence of decreasing mineral density in wheat grain over the last 160 years. J Trace Elem Med Biol. 22(4):315-24. [CrossRef]
- FAO (2025) Global Forest Resources Assessment, Rome. [CrossRef]
- Garvin, D.F., Welch, R.M., Finley, J.W. (2006). Historical shifts in the seed mineral micronutrient concentration of U.S. hard red winter wheat germplasm. Journal of the Science of Food and Agriculture. 86:2213-2220.
- Gibbs, H.K and Salmon, J.M (2015). Mapping of the world’s degraded lands. Applied Geography. 57: 12-21. https://www.sciencedirect.com/science/article/pii/S0143622814002793. [CrossRef]
- Gomiero, T., Pimentel, D., Paoletti, M.G. (2011). Environmental Impact of Different Agricultural Management Practices: Conventional vs. Organic Agriculture. Critical Reviews in Plant Sciences, 30(1–2), 95–124. [CrossRef]
- Goulding, K. W. T., Bailey, N. J., Hanley, B., Murphy, D. V., Poulton, P. R., & Webster, C. P. (1998). Microbial nitrification of redeposited NH₃ causes acidification of soil and water. New Phytologist, 140(1), 79-92. [CrossRef]
- Haverd, V., Smith, B., Canadell, J. G., Cuntz, M., Mikaloff-Fletcher, S., Farquhar, G., Woodgate, W., Briggs, P. R., and Trudinger, C. M. (2020). Higher than expected CO2 fertilization inferred from leaf to global observations, Glob. Chang. Biol. 26, 2390–2402. [CrossRef]
- Hawkins, H-J., Venter, Z.S., & Cramer, M.D. (2022). A holistic view of holistic management: What do farm-scale, carbon, and social studies tell us? Agriculture, Ecosystems and Environment, 323: 107702. [CrossRef]
- Holden, P. (2001). Organic farming, food quality and human health: a review of the evidence. Soil Association-Organic Standard. 88p. https://www.soilassociation.org/media/4920/policy_report_2001_organic_farming_food_quality_human_health.pdf.
- Houghton, R.A. (2007). Balancing the Global Carbon Budget. Annual Review of Earth and Planetary Sciences, 35, 313-347. [CrossRef]
- Houghton, R.A. (2010). How well do we know the flux of CO2 from land-use change? Tellus B: Chemical and Physical Meteorology, 62(5), 337–351. https://onlinelibrary.wiley.com/doi/epdf/10.1111/j.1600-0889.2010.00473.x. [CrossRef]
- Houghton, R.A., Castanho, A. (2023). Annual emissions of carbon from land use, land-use change, and forestry from 1850 to 2020, Earth Syst. Sci. Data, 15, 2025–2054. [CrossRef]
- IPCC (2021). Climate Change 2021: The Physical Science Basis. Contribution of Working Group I to the Sixth Assessment Report of the Intergovernmental Panel on Climate Change [Masson-Delmotte, V., P. Zhai, A. Pirani, S.L. Connors, C. Péan, S. Berger, N. Caud, Y. Chen, L. Goldfarb, M.I. Gomis, M. Huang, K. Leitzell, E. Lonnoy, J.B.R. Matthews, T.K. Maycock, T. Waterfield, O. Yelekçi, R. Yu, and B. Zhou (eds.)]. Cambridge University Press, Cambridge, United Kingdom and New York, NY, USA, 2391 pp. [CrossRef]
- Jackson, R. B., Lajtha, K., Crow, S. E., Cotrufo, M. F., Kramer, M. G., Piñeiro, G. (2017). The ecology of soil carbon: Pools, vulnerabilities, and biotic and abiotic controls. Annual Review of Ecology, Evolution, and Systematics, 48, 419-446.
- Kalbitz, K., et al. (2013). The carbon count of 2000 years of rice cultivation. Global Change Biology, 19(11), 3360-3373. [CrossRef]
- Kaplan, J. O., Krumhardt, K. M., Ellis, E. C., Ruddiman, W. F., Lemmen, C., Klein Goldewijk, K. (2010). Holocene carbon emissions as a result of anthropogenic land cover change. The Holocene, 21(5), 775–791. [CrossRef]
- Kavamura VN, Hayat R, Clark IM, Rossmann M, Mendes R, Hirsch PR and Mauchline TH (2018) Inorganic Nitrogen Application Affects Both Taxonomical and Predicted Functional Structure of Wheat Rhizosphere Bacterial Communities. Front. Microbiol. 9:1074. [CrossRef]
- Kazlou, T., Cherp, A., Jewell, J. (2024). Feasible deployment of carbon capture and storage and the requirements of climate targets. Nat. Clim. Chang. 14, 1047–1055. [CrossRef]
- Kopittke, P.M., Dalal, R., McKenna, B.A., Smith, P., Wang, P., Weng, Z., van der Bom, F. J. T., Menzies, N.W. (2024). Soil is a major contributor to global greenhouse gas emissions and climate change. SOIL, 10, 873–885. https://soil.copernicus.org/articles/10/873/2024/. [CrossRef]
- Koren, G., et al. (2019). Global 3-D Simulations of the Triple Oxygen Isotope Signature Δ¹⁷O in CO₂: Spatiotemporal Gradients and Sensitivities to the Terrestrial Carbon Cycle, Journal of Geophysical Research: Atmospheres, 124, 6087–6106. [CrossRef]
- Lal, R. 2006. Influence of Soil Erosion on Carbon Dynamics in the Wold. Chapter 3. In: Science in Soil Science SOIL EROSION AND CARBON DYNAMICS Edited by Eric J. Roose et al. Pp 23-35. Online: https://library.oapen.org/bitstream/20.500.12657/41645/1/9781135460556.pdf.
- Lambkin, D. C., Gwilliam, K. H., Layton, C., Canti, M. G., Piearce, T. G., Hodson, M. E. (2011). Production and dissolution rates of earthworm-secreted calcium carbonate. Pedobiologia, 54(SUPPL.), S119-S129. [CrossRef]
- Le Quéré, C., Jackson, R.B., Jones, M.W. et al. (2020). Temporary reduction in daily global CO2 emissions during the COVID-19 forced confinement. Nat. Clim. Chang. 10, 647–653. [CrossRef]
- Liang, MC, Laskar AH, Barkan E, Newman S, Thiemens MH, Rangarajan R. (2023). New constraints of terrestrial and oceanic global gross primary productions from the triple oxygen isotopic composition of atmospheric CO2 and O2. Sci Rep. 13(1):2162. https://pmc.ncbi.nlm.nih.gov/articles/PMC9905602/. [CrossRef]
- Lin, Z., Dai, Y., Mishra, U., Wang, G., Shangguan, W., Zhang, W., and Qin, Z. (2024). Global and regional soil organic carbon estimates: Magnitude and uncertainties. Pedosphere, 34(4), 2024. [CrossRef]
- Lori M, Symnaczik S, Mäder P, De Deyn G, Gattinger A (2017) Organic farming enhances soil microbial abundance and activity—A meta-analysis and meta-regression. PLoS ONE 12(7): e0180442. [CrossRef]
- Mayer, A.B., Trenchard, L., Rayns, F. (2022). Historical changes in the mineral content of fruit and vegetables in the UK from 1940 to 2019: a concern for human nutrition and agriculture. Int J Food Sci Nutr.;73(3): 315-326.
- Mo, L., Zohner, C. M., Reich, P. B., et al. (2023). Integrated global assessment of the natural forest carbon potential. Nature, 624(7990), 92–101. [CrossRef]
- Moinet, G. Y. K., Hijbeek, R., van Vuuren, D. P., & Giller, K. E. (2023). Carbon for soils, not soils for carbon. Global Change Biology, 00, 1–15. [CrossRef]
- Mollison, B. (1988). Permaculture: A Designers’ Manual; Tagari Publications: Sisters Creek, Australia.
- Morris, H.M. The insect and other invertebrate fauna of arable land at Rothamsted. Ann. Appl. Biol. 1922, 9, 282–305. [Google Scholar] [CrossRef].
- Morris, H.M. The insect and other invertebrate fauna of arable land at Rothamsted. Part II. Ann. Appl. Biol. 1927, 14, 442–464. [Google Scholar].
- Myers S.S., Smith M.R., Guth S., Golden C.D., Vaitla B., Mueller N.D., Dangour A.D., Huybers P. (2017). Climate change and global food systems: Potential impacts on food security and undernutrition. Annu. Rev. Public Health. 38:259–277. [CrossRef]
- Nyffeler, M., Bonte, D. (2020). Where Have All the Spiders Gone? Insects, 11(4), 248. [CrossRef]
- Owens, P.N. (2020). Soil erosion and sediment dynamics in the Anthropocene: a review of human impacts during a period of rapid global environmental change. J Soils Sediments 20, 4115–4143. [CrossRef]
- Pimentel, D. (2006). Soil Erosion: A Food and Environmental Threat. Environ Dev Sustain 8, 119–137 (2006). [CrossRef]
- Poulton P, Johnston J, Macdonald A, White R, Powlson D. (2018). Major limitations to achieving “4 per 1000” increases in soil organic carbon stock in temperate regions: Evidence from long-term experiments at Rothamsted Research, United Kingdom. Glob Chang Biol. 24(6):2563-2584. [CrossRef]
- Rahman A, Baharlouei P, Koh EHY, Pirvu DG, Rehmani R, Arcos M, Puri S. (2024). A Comprehensive Analysis of Organic Food: Evaluating Nutritional Value and Impact on Human Health. Foods. 13(2):208. [CrossRef]
- Rockström, J.; Steffen, W.; Noone, K.; Persson, Å.; Chapin, F.S., III; Lambin, E.F. (2009). A safe operating space for humanity. Nature. 461, 472–475. [CrossRef]
- Rockström, J., et al. (2023). Safe and just Earth system boundaries. Nature, 619(7968), 102-111. [CrossRef]
- Rodin, L.E.; Bazilevich, N.I.; Rozov, N.N. (1975). Productivity of the world’s main ecosystems. In Productivity of World Ecosystems; Reichle, D.E., Franklin, J.F., Goodall, D.W., Eds.; National Academy of Sciences: Washington, DC, USA. Pp. 13–26. Available online: https://nap.nationalacademies.org/read/20114/chapter/3.
- Rolando, J.L.; Dubeux, J.C.B.; de Souza, T.C.; Mackowiak, C.; Wright, D.; George, S.; Pires, T.; Santos, E. (2021). Organic carbon is mostly stored in deep soil and only affected by land use in its superficial layers: A case study. Agrosyst. Geosci. Environ. 4, e20135. https://acsess.onlinelibrary.wiley.com/doi/full/10.1002/agg2.20135.
- Sanderman J, Hengl T, Fiske GJ. Soil carbon debt of 12,000 years of human land use. (2017). Proc Natl Acad Sci U S A. 114(36):9575-9580. [CrossRef]
- Schefe CR, Barlow KM, Robinson NJ, Crawford DM, McLaren TI, Smernik RJ, Croatto G, Walsh RD, Kitching M. (2015). 100 Years of superphosphate addition to pasture in an acid soil—current nutrient status and future management. Soil Research 53, 662–676. [CrossRef]
- Shelef, E.; Rowland, J.C.; Wilson, C.J.; Hilley, G.E.; Mishra, U.; Altmann, G.L.; Ping, C. (2017). Large uncertainty in permafrost carbon stocks due to hillslope soil deposits. Geophys. Res. Lett. 44, 6134–6144.
- Sizmur, T.; Martin, E.; Wagner, K.; Parmenteir, E.; Watts, C.; Whitmore, A.P. (2017). Milled cereal straw accelerates earthworm (Lumbricus terrestris) growth more than selected organic amendments. Appl. Soil Ecol. 113, 166–177.
- Soriano, S., Walker, N. (1973). The Nitrifying Bacteria in Soils from Rothamsted Classical Fields and Elsewhere, Journal of Applied Bacteriology. 36(3) 523–529. [CrossRef]
- Strauss, J. et al. (2024): Organic matter storage and vulnerability in the permafrost domain. Elsevier, ISBN: 9780443299971. https://epic.awi.de/id/eprint/60122/1/final_3-s2.0-B9780323999311001641-main.pdf. [CrossRef]
- Tang, S., Pan, W., Yang, Y. et al. (2025). Soil carbon sequestration enhanced by long-term nitrogen and phosphorus fertilization. Nat. Geosci. 18: 1005–1013. [CrossRef]
- Thomas, D. 2007. The Mineral Depletion of Foods Available to US as A Nation (1940–2002) – A Review of the 6th Edition of McCance and Widdowson. Nutrition and Health. 19(1-2): 21-55.
- UNEP Emissions Gap Report (2025) - https://www.unep.org/resources/emissions-gap-report-2025.
- UN Land Outlook Report (2021) (GLO2) - https://www.unccd.int/resources/global-land-outlook/glo2-summary-decision-makers.
- Versteegh, E. A.A., Black, S., Canti, M. G. and Hodson, M. E. (2013) Earthworm-produced calcite granules: a new terrestrial palaeothermometer? Geochimica et Cosmochimica Acta, 123. pp. 351-357. ISSN 0016-7037 doi: 10.1016/j.gca.2013.06.020. [CrossRef]
- Versteegh E.A.A., Black S., Hodson M.E. (2014): Environmental controls on the production of calcium carbonate by earthworms. Soil Biology and Biochemistry, 70: 159–161.
- Walden, L. et al. (2023). Multi-scale mapping of Australia’s terrestrial and blue carbon stocks and their continental and bioregional drivers. Commun. Earth Environ. 4:189.
- Wedderburn-Bisshop 2023) https://www.preprints.org/manuscript/202310.1863/v1.
- Wedderburn-Bisshop (2024a) https://www.preprints.org/manuscript/202310.1863/v1.
- Wedderburn-Bisshop, G. 2024b. Deforestation—a call for consistent carbon accounting. Environ. Res. Lett. 19 111006; https://iopscience.iop.org/article/10.1088/1748-9326/ad7d21/pdf. [CrossRef]
- Wedderburn-Bisshop G. 2025. Increased transparency in accounting conventions could benefit climate policy. Environ. Res. Lett. 20 044008. [CrossRef]
- Whitman WB, Coleman DC, Wiebe WJ. (1998). Prokaryotes: the unseen majority. Proc Natl Acad Sci U S A. 95(12):6578-83. [CrossRef]
- Widdowson, R.W. (1987). Towards Holistic Agriculture: A Scientific Approach. Pergamon: London. ISBN 9780080342115.
- Widyastuti, M. T., Minasny, B., Padarian, J., et al. (2025). Digital mapping of peat thickness and carbon stock of global peatlands. CATENA, 258: 109243. [CrossRef]
- Zhang, L., Huang, Y., Rong, L. et al. Effect of soil erosion depth on crop yield based on topsoil removal method: a meta-analysis. Agron. Sustain. Dev. 41, 63 (2021). [CrossRef]
Figure 1.
IPCC Carbon budget with anthropogenic factors in puce. All land data needs correction. Source - https://www.ipcc.ch/report/ar6/wg1/figures/chapter-5/figure-5-12.
Figure 1.
IPCC Carbon budget with anthropogenic factors in puce. All land data needs correction. Source - https://www.ipcc.ch/report/ar6/wg1/figures/chapter-5/figure-5-12.
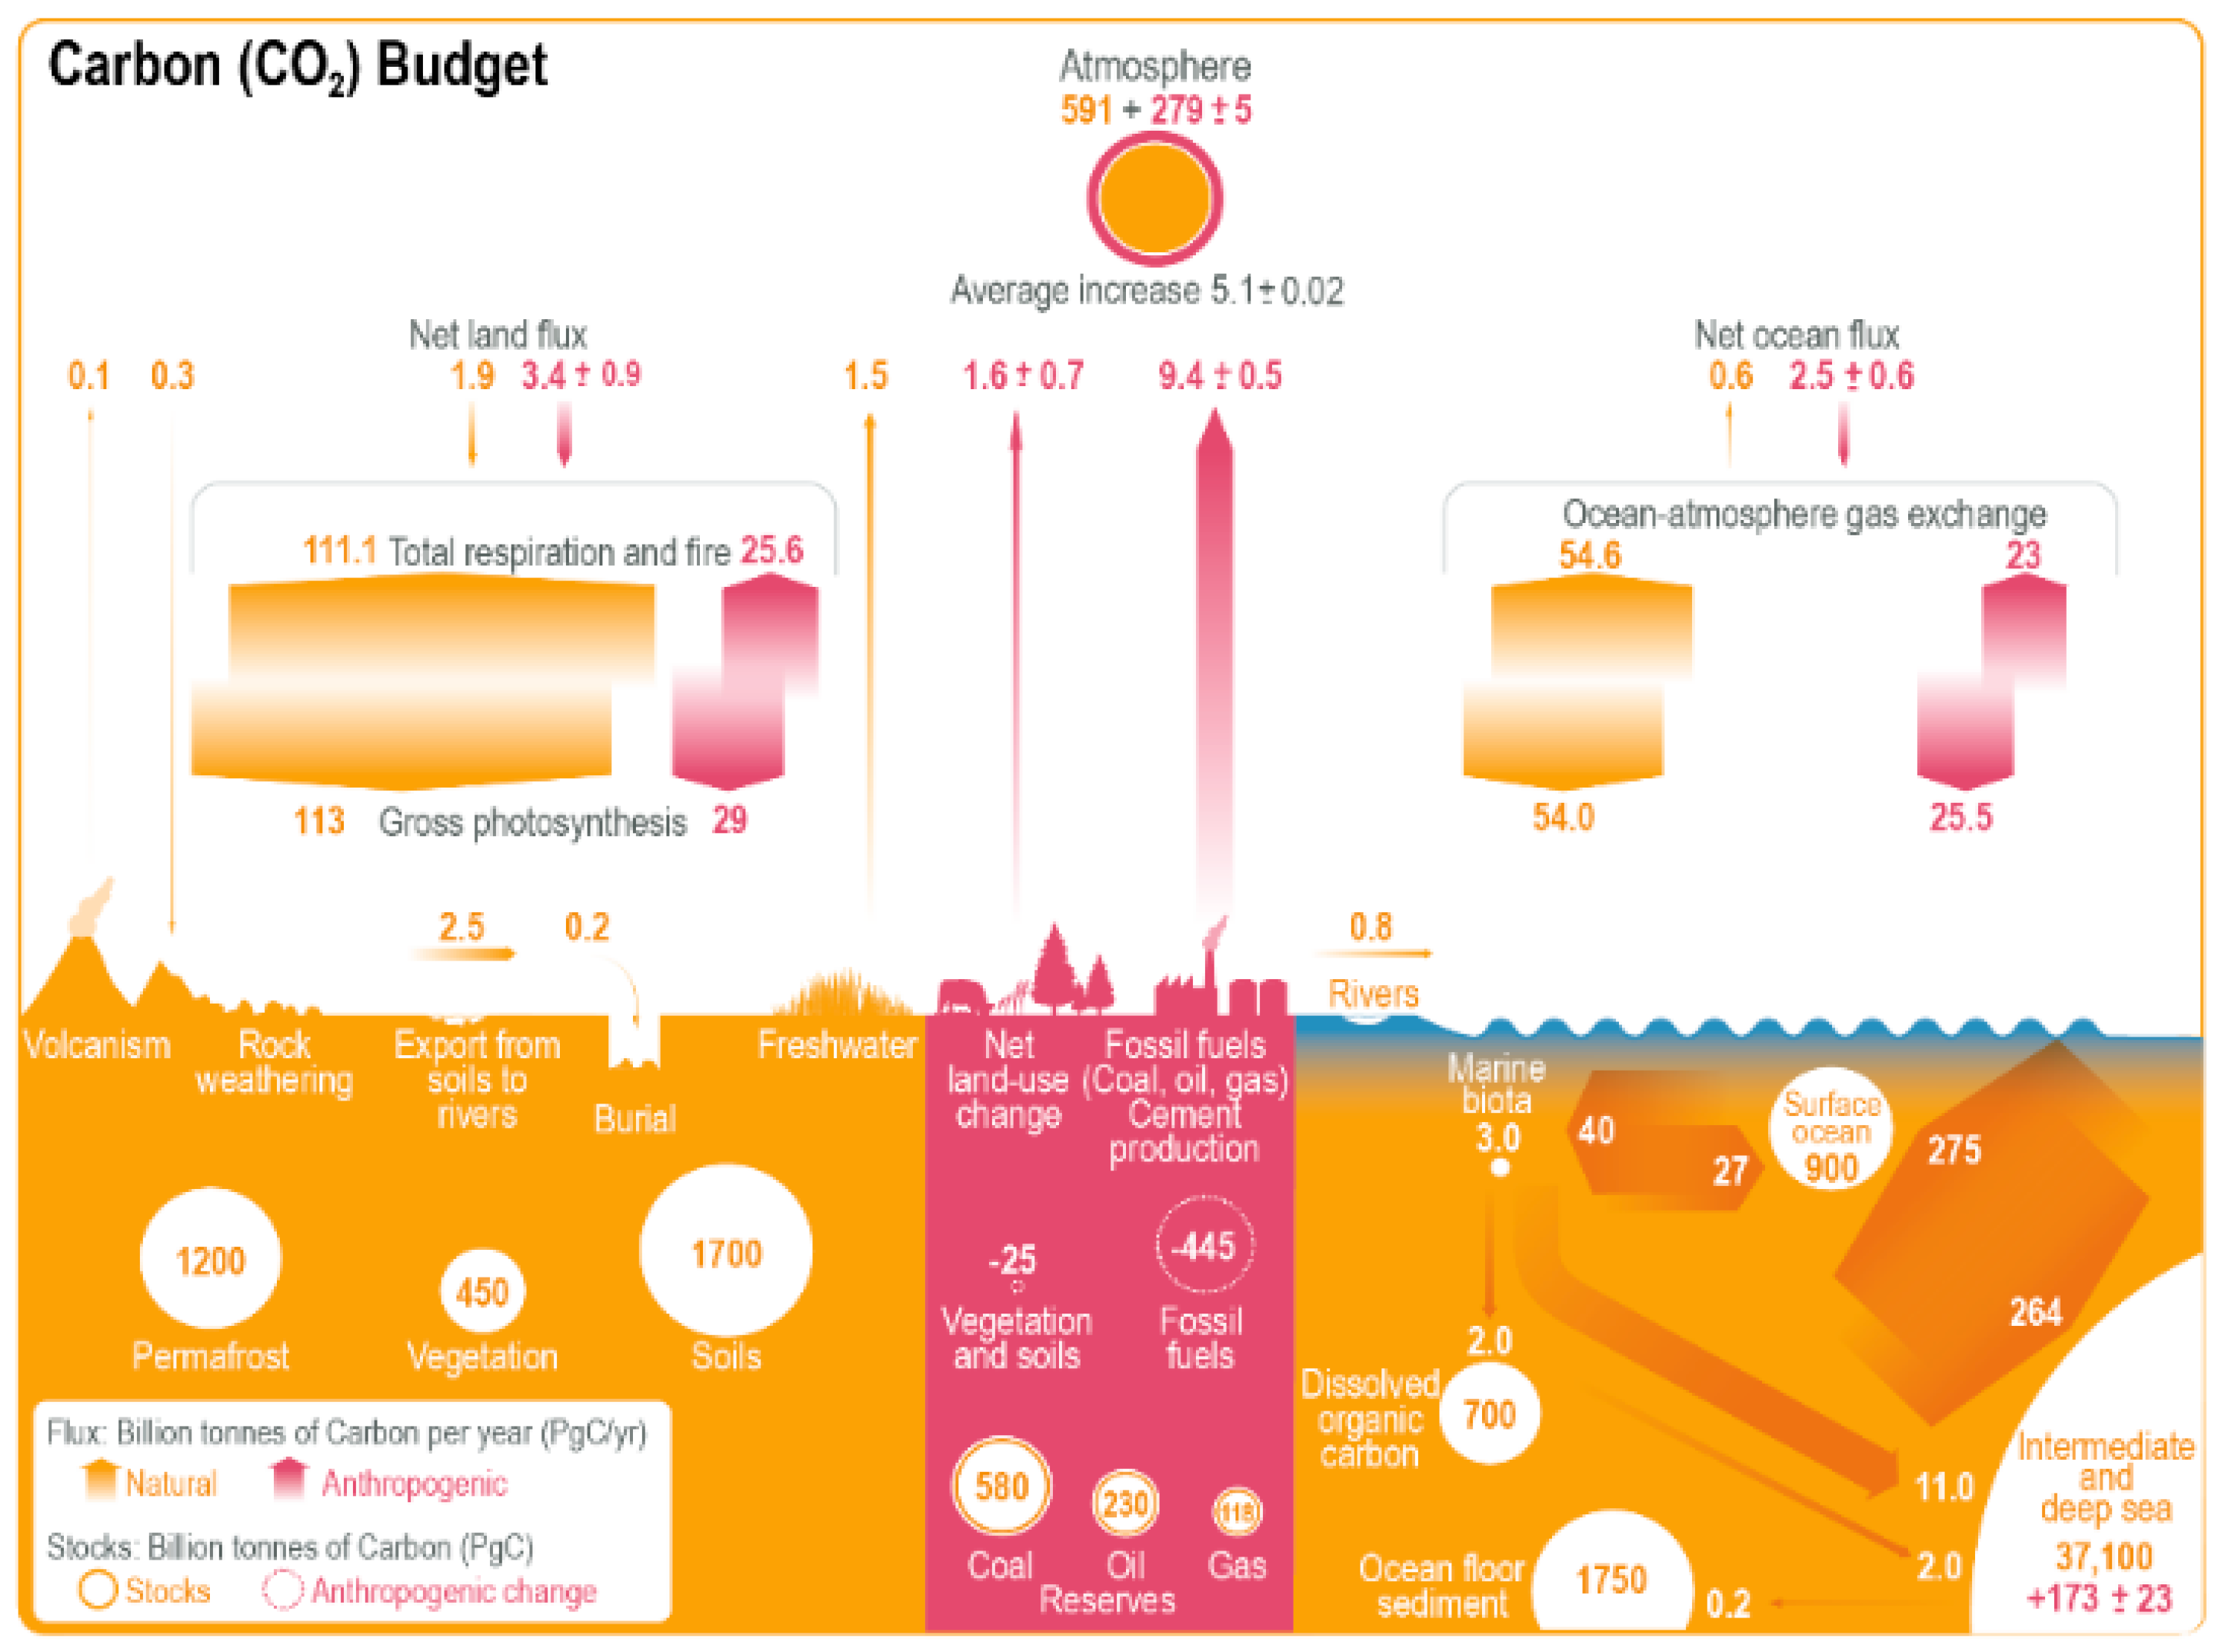
Figure 2.
Adapted from Crowther et al. (2019: Figure 2C) with SOC at least ten times greater than above-ground biomass (i.e., ratio 10:1). Their sum total from SoilGrids data is ~4,595 Gt SOC carbon to just 2 m depth, here doubled for terrain/depth. Dotted line indicates potential extent of SOC loss or, conversely, scope for its full restoration in arid deserts, or other degraded areas. Source - https://veop.wordpress.com/2020/06/12/volume-4/.
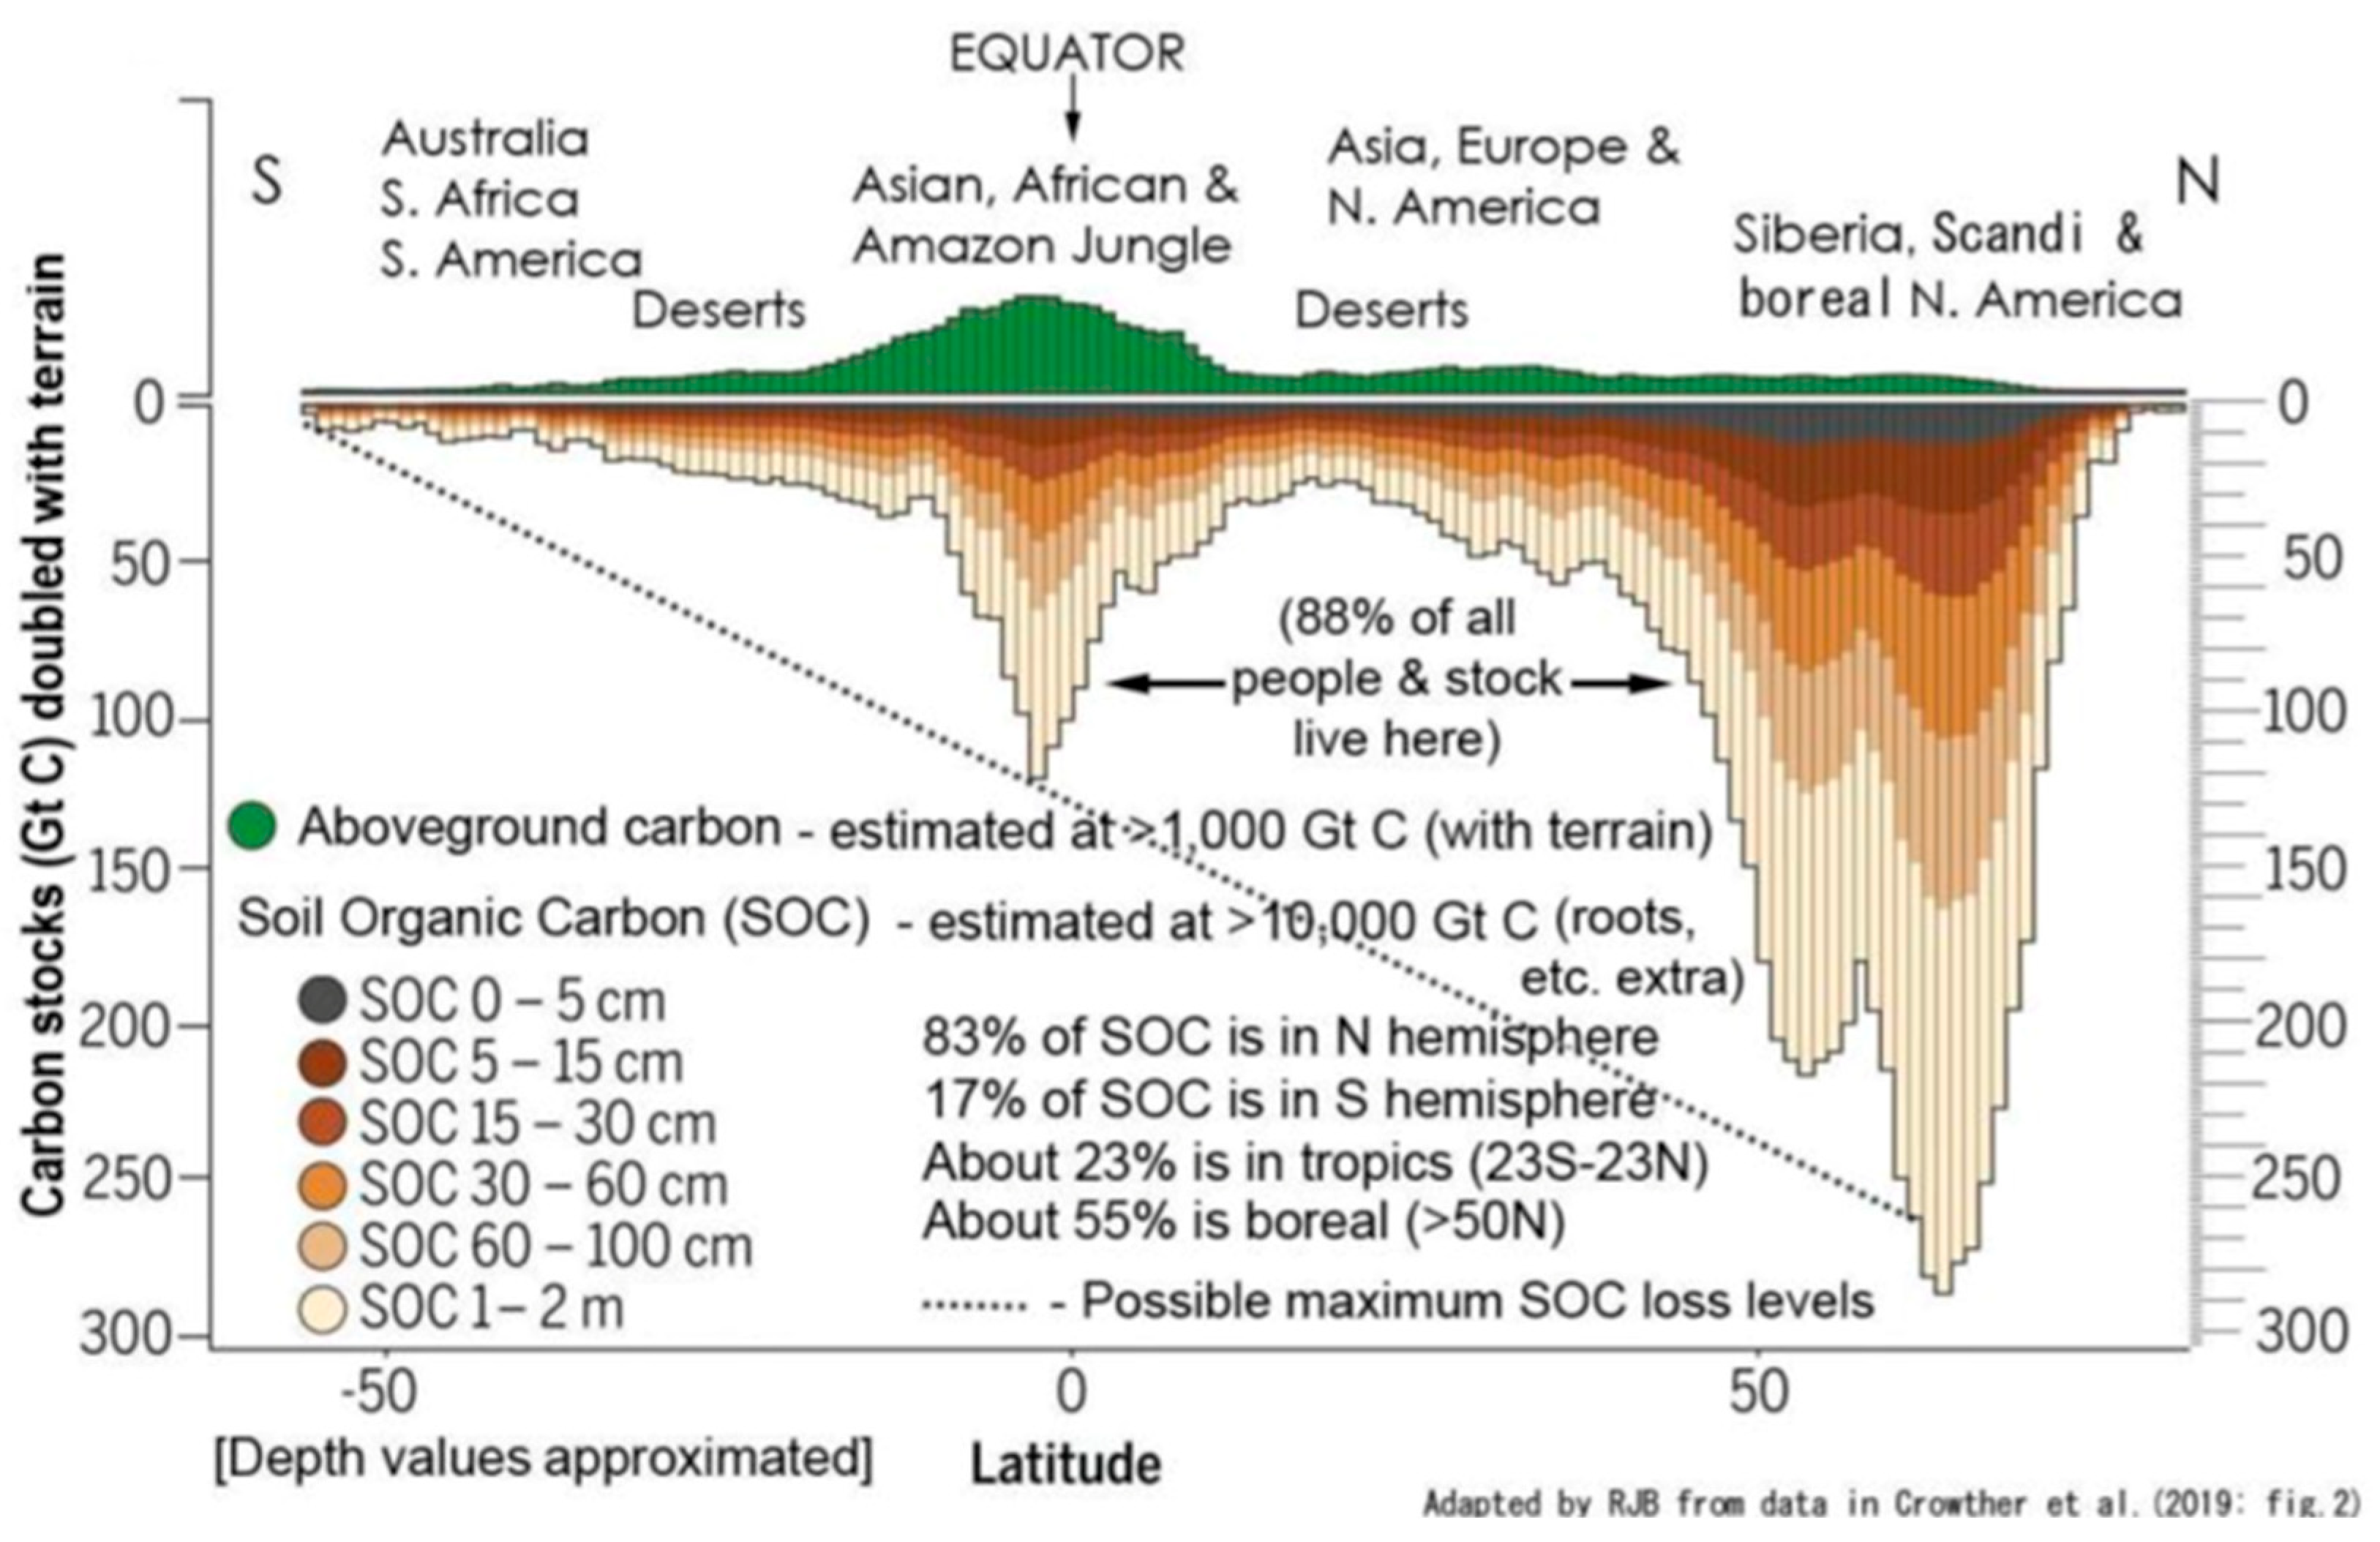
Figure 3.
Atmospheric CO2 levels compared to CO2 FF emissions. Souce - https://skepticalscience.com/CO2-emissions-correlation-with-CO2-concentration.htm .
Figure 3.
Atmospheric CO2 levels compared to CO2 FF emissions. Souce - https://skepticalscience.com/CO2-emissions-correlation-with-CO2-concentration.htm .
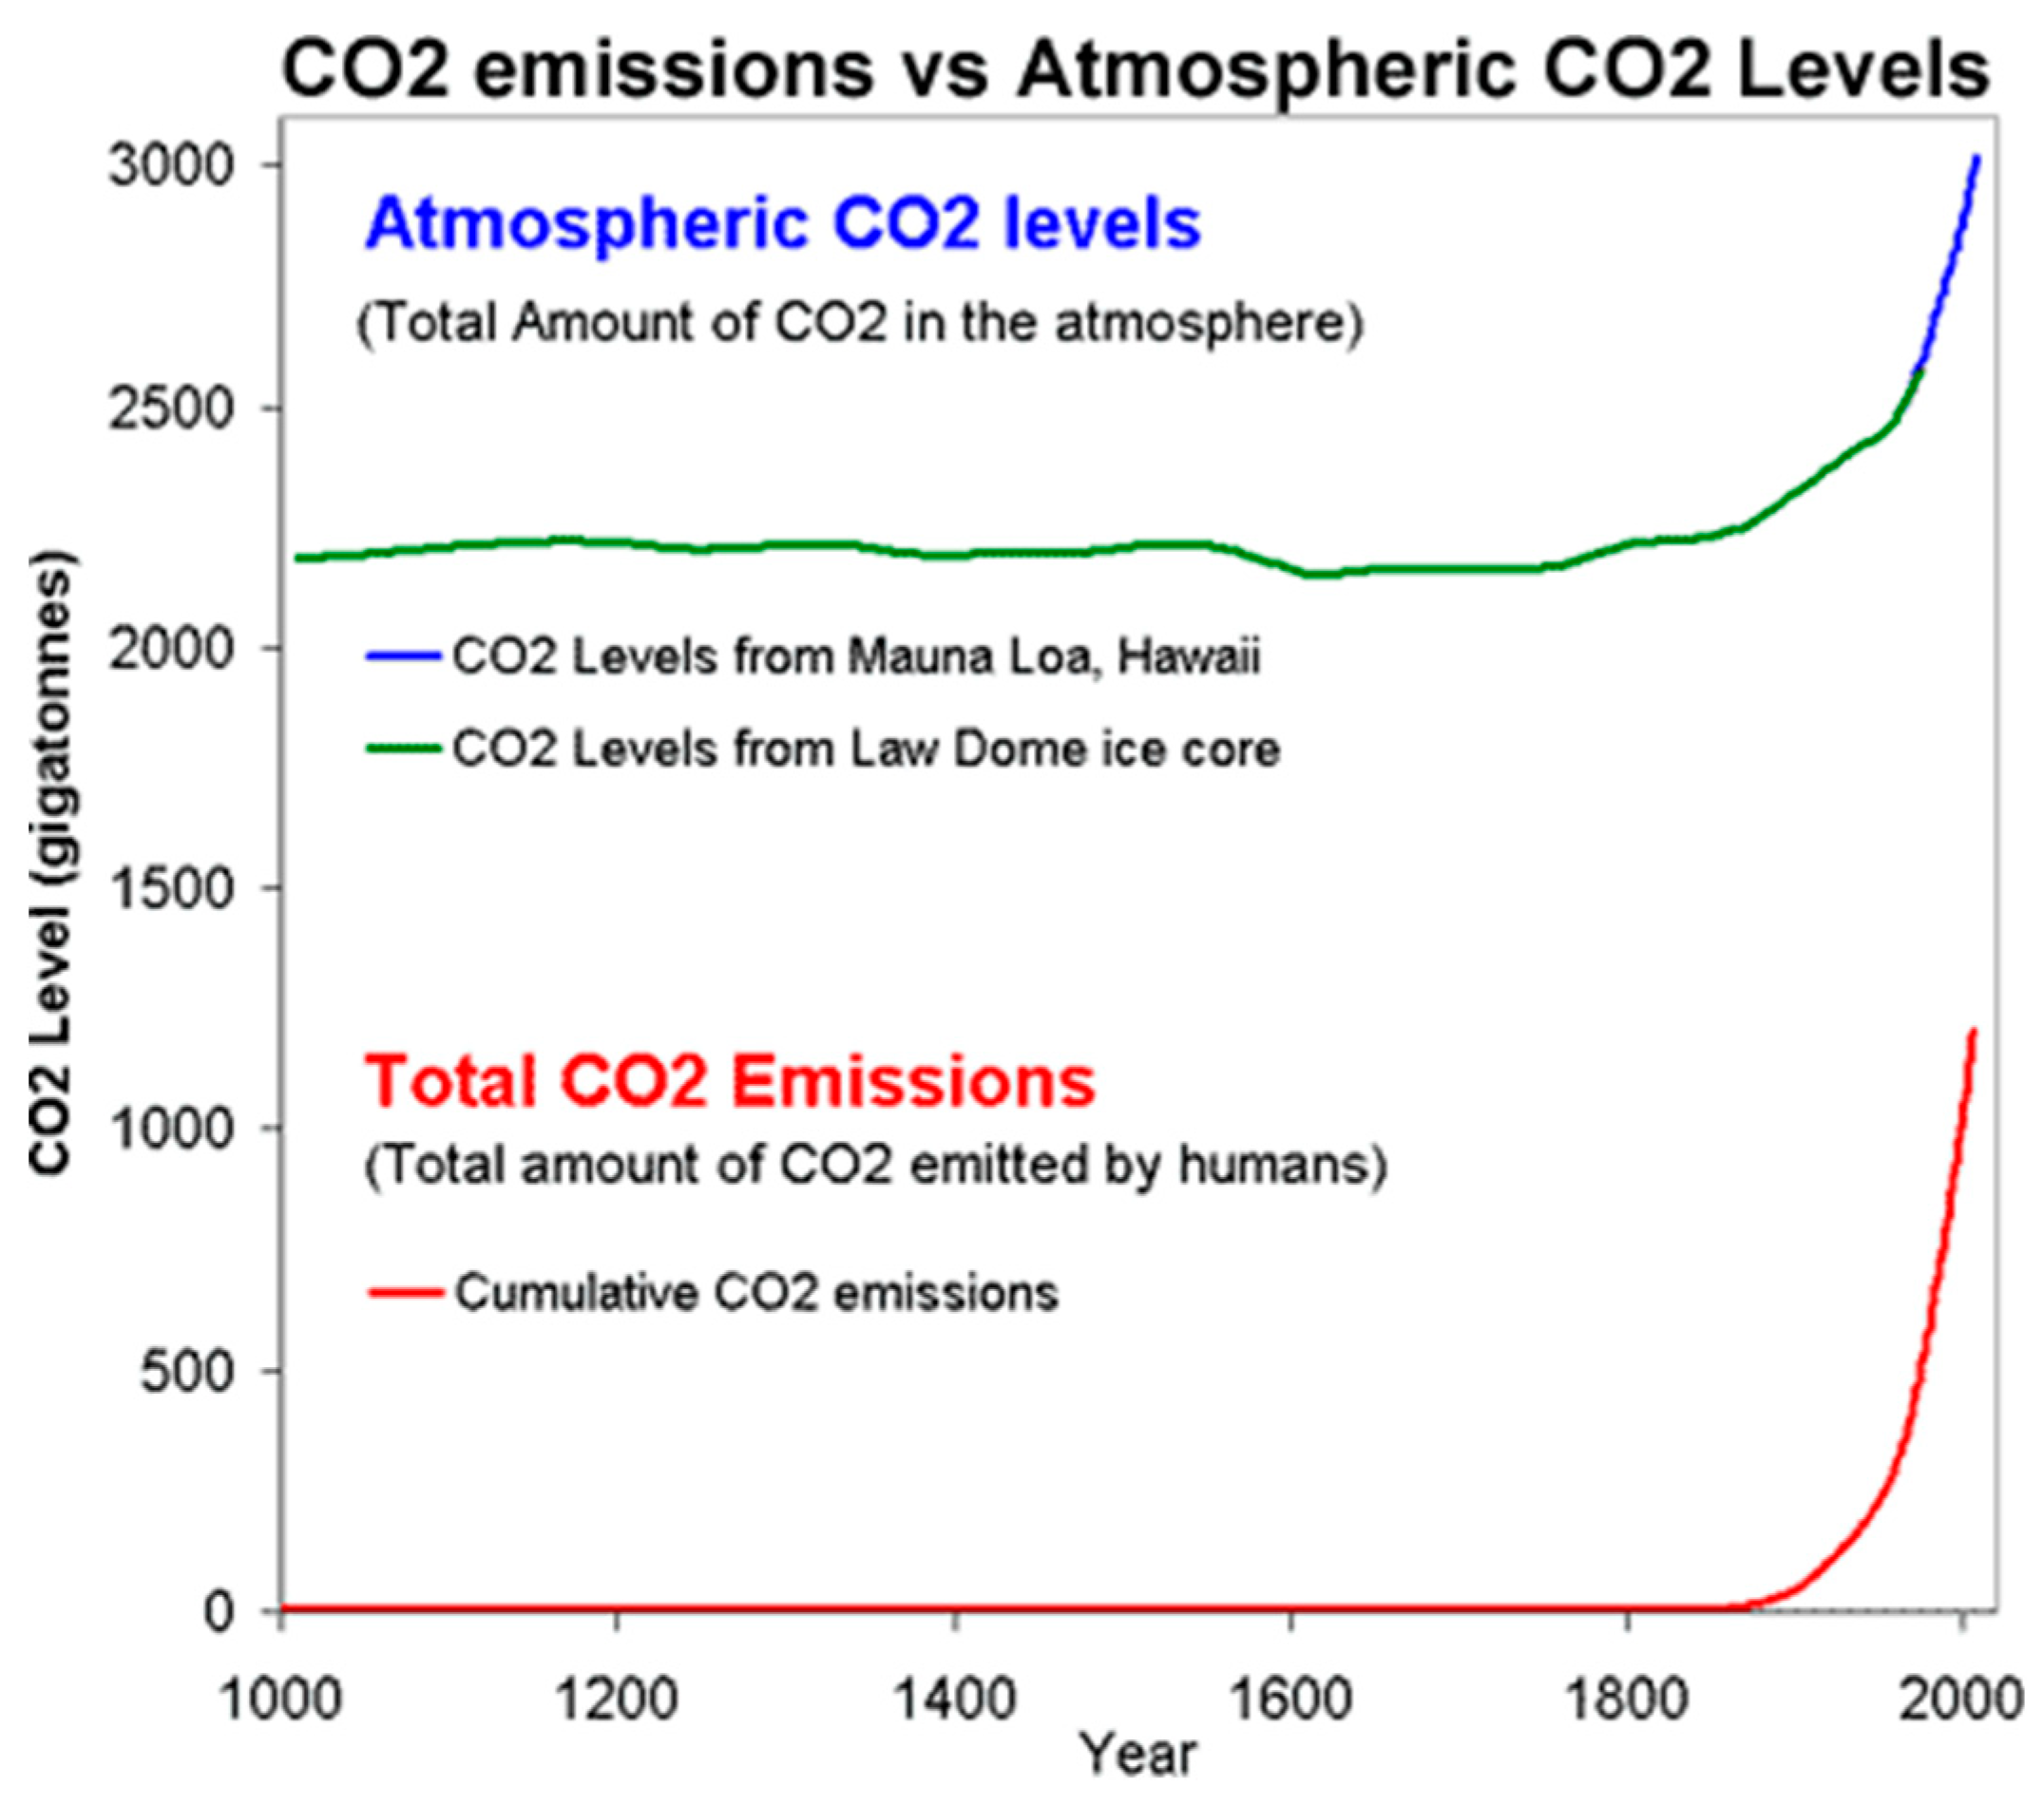
Figure 4.
(A) Conventional IPCC with data from GCB (2024) and (B) Corrected CO2 accounting. From Wedderburn-Bisshop (2024a) -https://www.preprints.org/manuscript/202310.1863/v1.
Figure 4.
(A) Conventional IPCC with data from GCB (2024) and (B) Corrected CO2 accounting. From Wedderburn-Bisshop (2024a) -https://www.preprints.org/manuscript/202310.1863/v1.
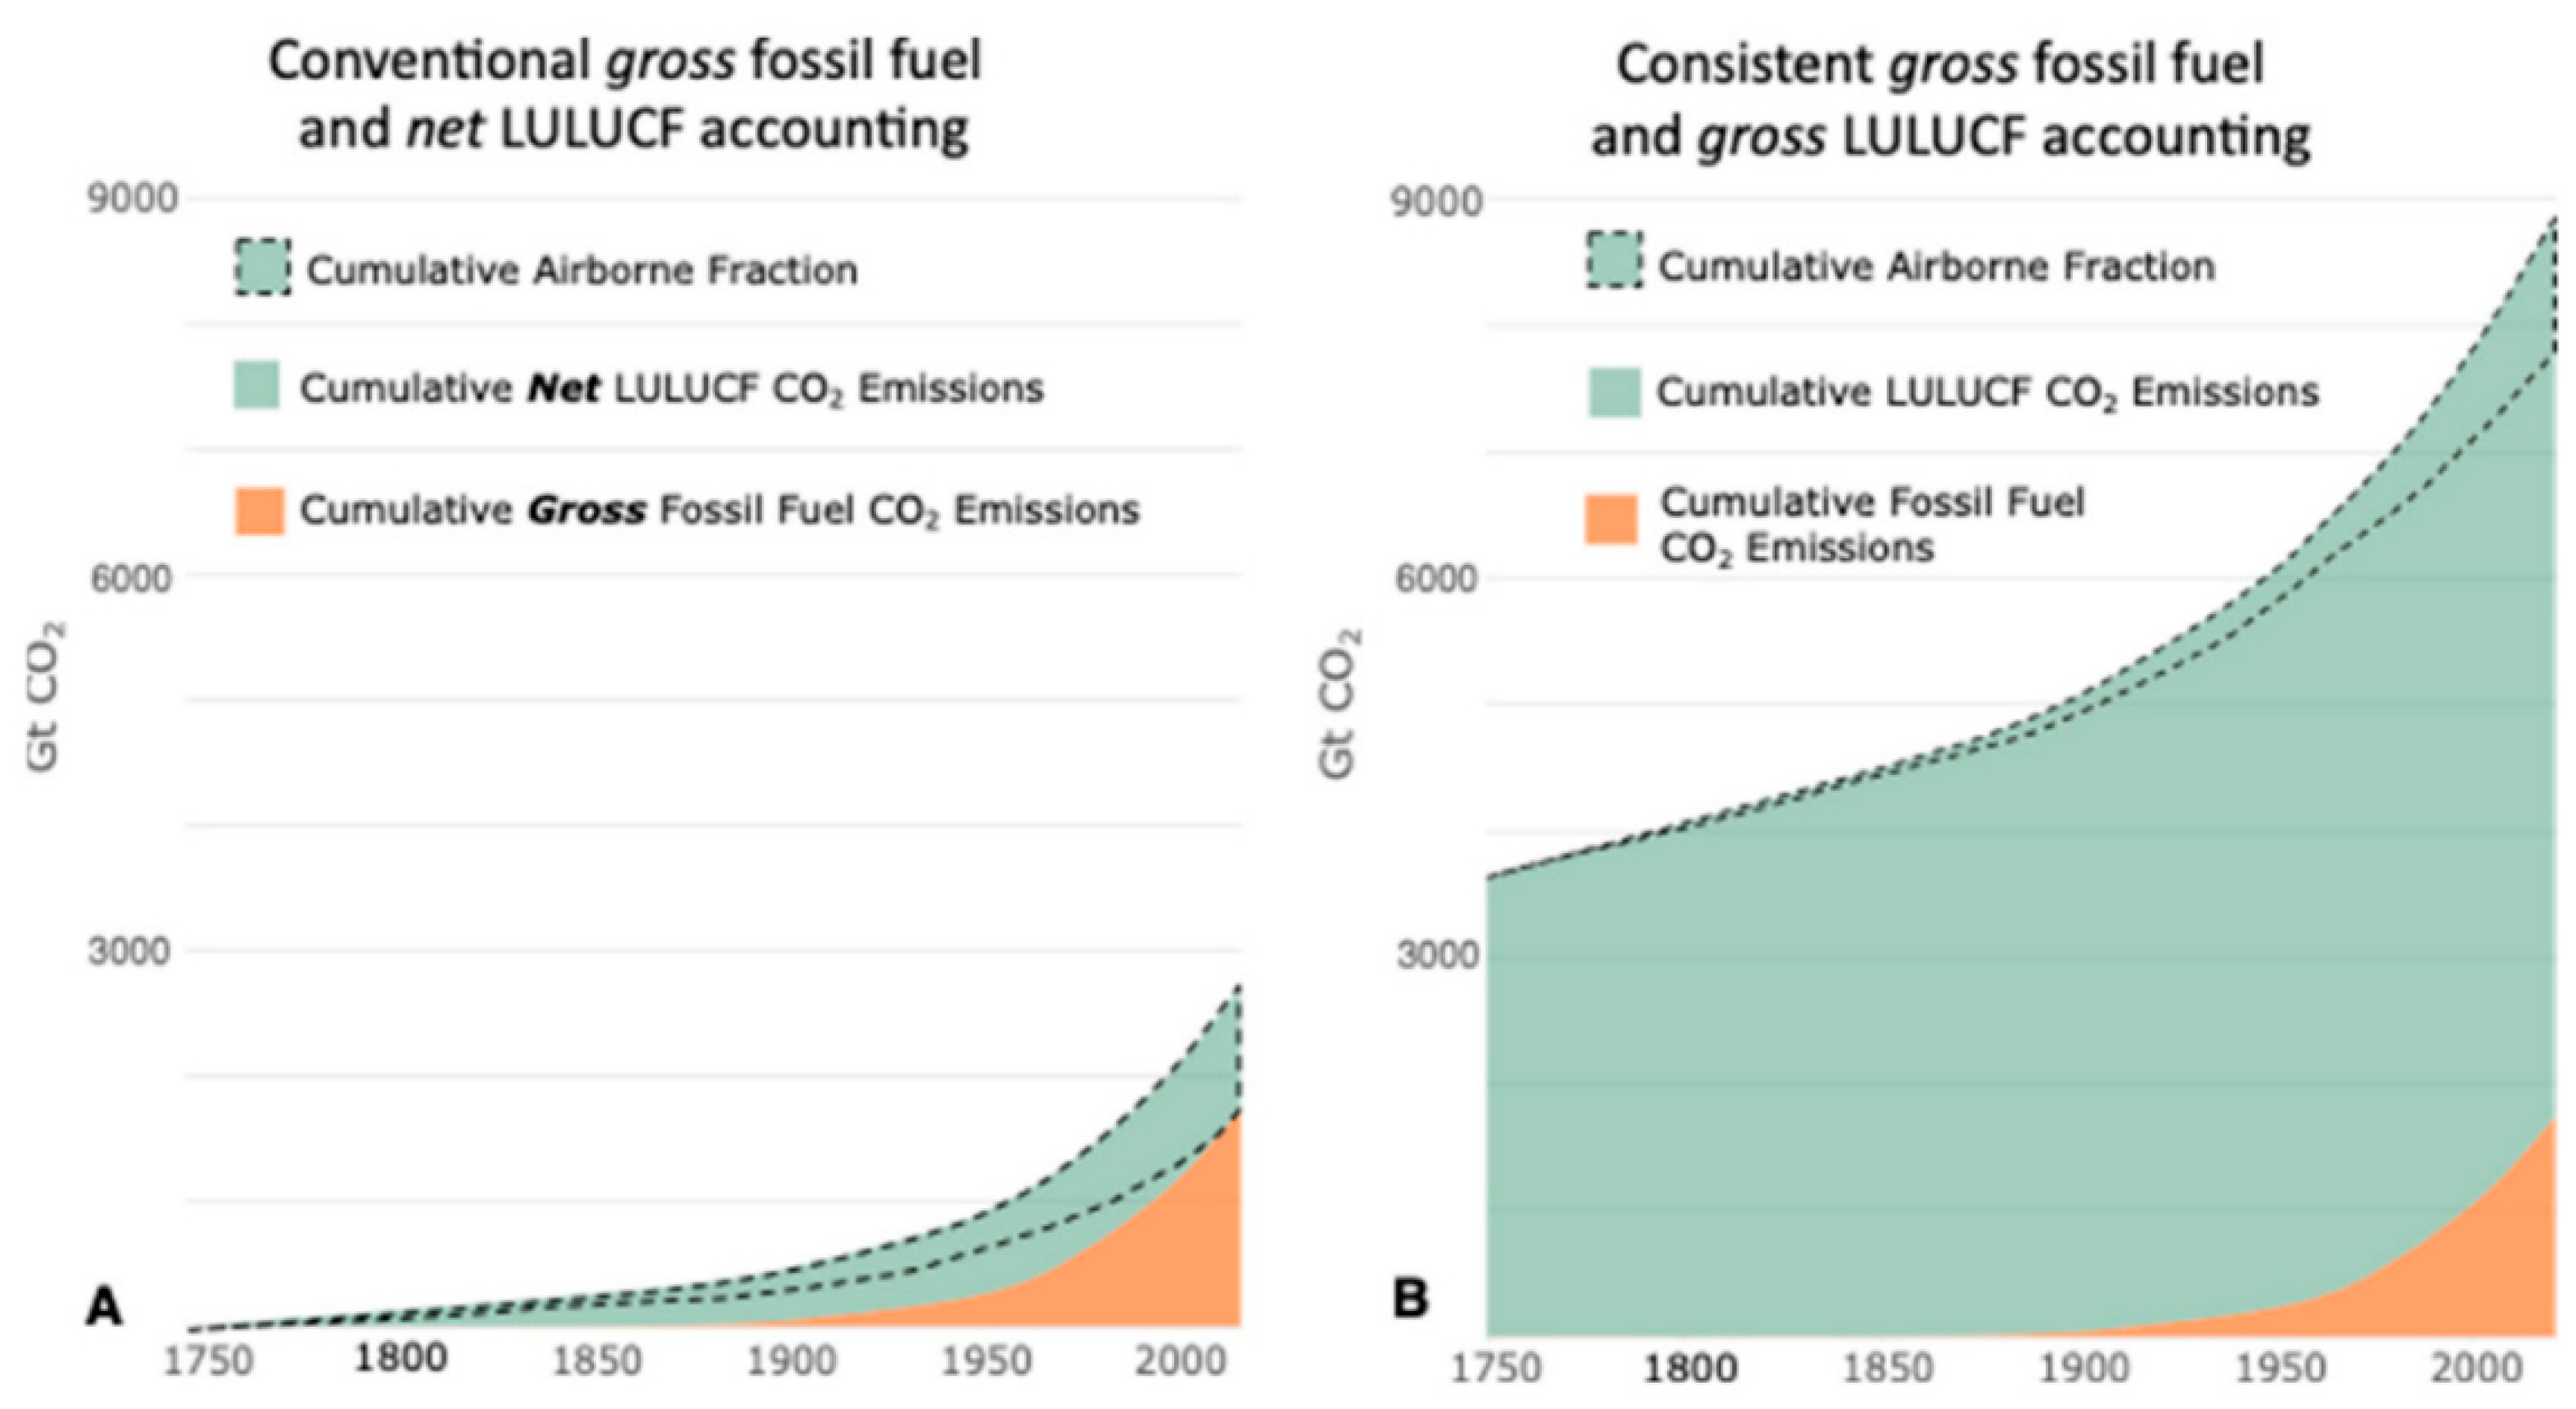
Figure 5.
Global carbon cycle compared to IPCC’s with raised GPP and Land stocks; proportional net LUC losses of about ~20 Gt C/yr are double FF emissions of 9 Gt C/yr. IPCC (2021) figure of ~9.4 Gt C/yr FF is from about -445 Gt C FF emissions, averaging about (455/9.4 =) ~50 years; LUC emissions of -1,000 Gt C for 50 yrs is about 20 Gt C/yr. LUC values are derived from -1.6 Gt C/yr plant loss from Houghton (2007: Figure 1), and Buringh (1984: Table 3.8) who had “release of soil carbon to the atmosphere” of -4.6 Gt C/yr as a “Realistic estimate” mainly due to destruction and conversion of forests to crop or pasture land. These older references possibly when Science was less compromised. Double for terrain is (1.6 + 4.6 = 6.2× 2 =) 12.4 Gt C/yr. For Fire / “Combustion” IPCC (2001: Figure 3.1) had 4 Gt C/yr and IPCC (2019a) had 2.2 Gt C/yr that, doubled for terrain, ranges 4.4–8 Gt C/yr. Note that IPCC AR6 (2021) does not budget fire while Buringh (1984) reported that “Approximately 50 per cent of all the forest trees cut down annually in the world are used as fuel”, his Table 3.8 listed 0.75 Gt C loss of soil carbon from “Fuel wood, fire”; most other accounts give values for vegetation/wood carbon loss. Source Blakemore (2024: Figure 9 - https://www.mdpi.com/biomass/biomass-04-00070/article_deploy/html/images/biomass-04-00070-g009.png; also https://vermecology.wordpress.com/2020/01/16/solum-solace/).
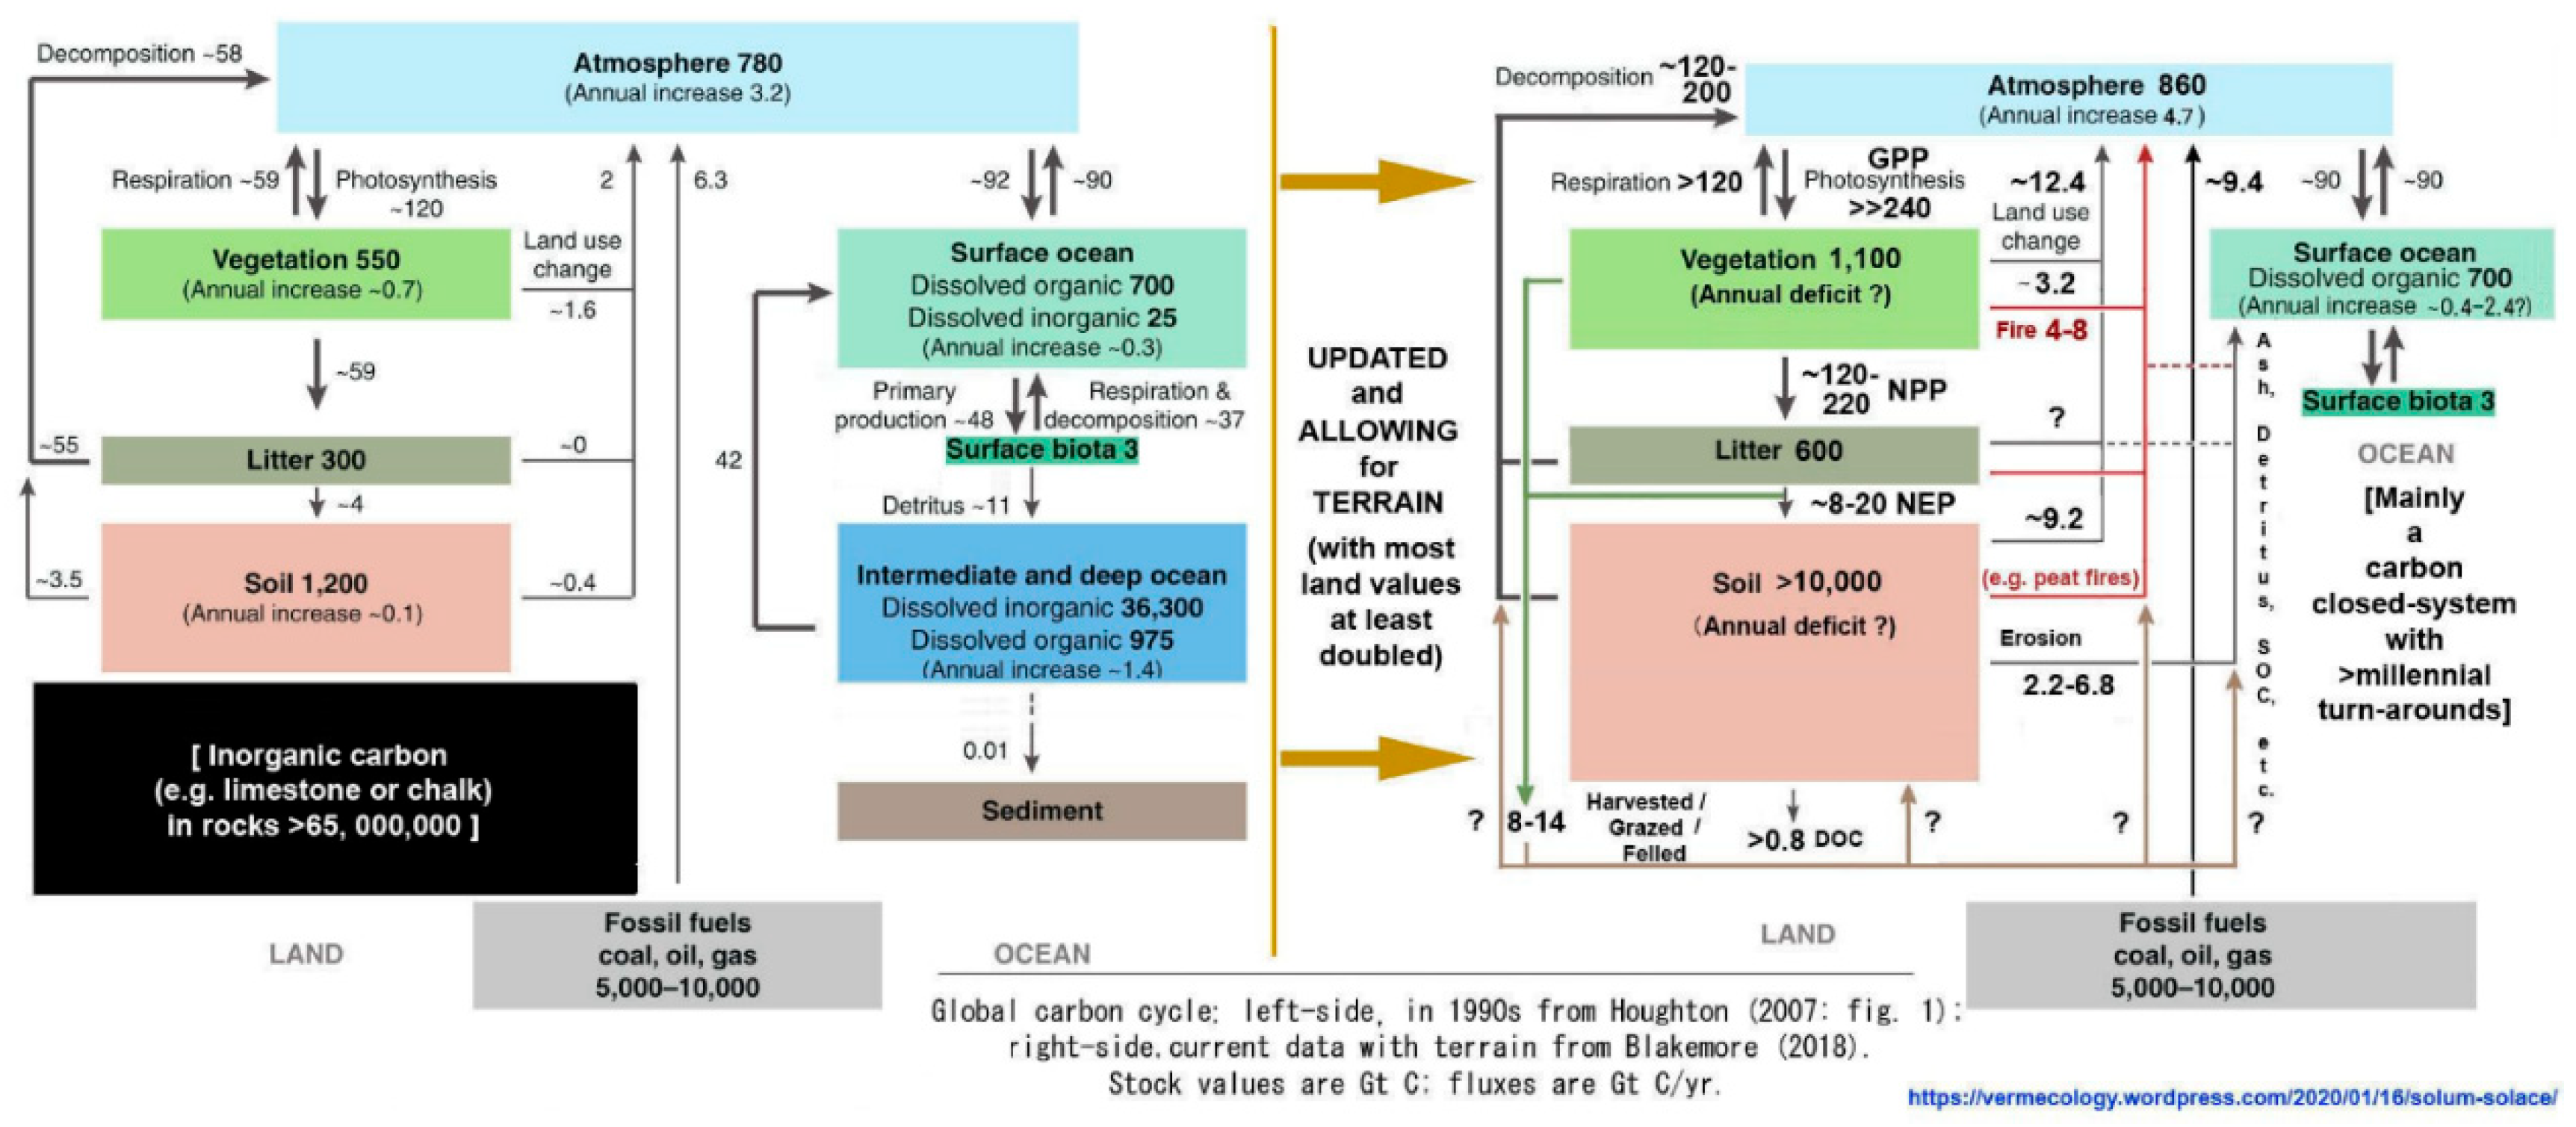
Figure 6.
The forest area reduction from 50 to 40 million km2 is about -20% loss. Other reports are of 30–50% loss. Source - https://euanmearns.com/ Energy Matters website.
Figure 6.
The forest area reduction from 50 to 40 million km2 is about -20% loss. Other reports are of 30–50% loss. Source - https://euanmearns.com/ Energy Matters website.
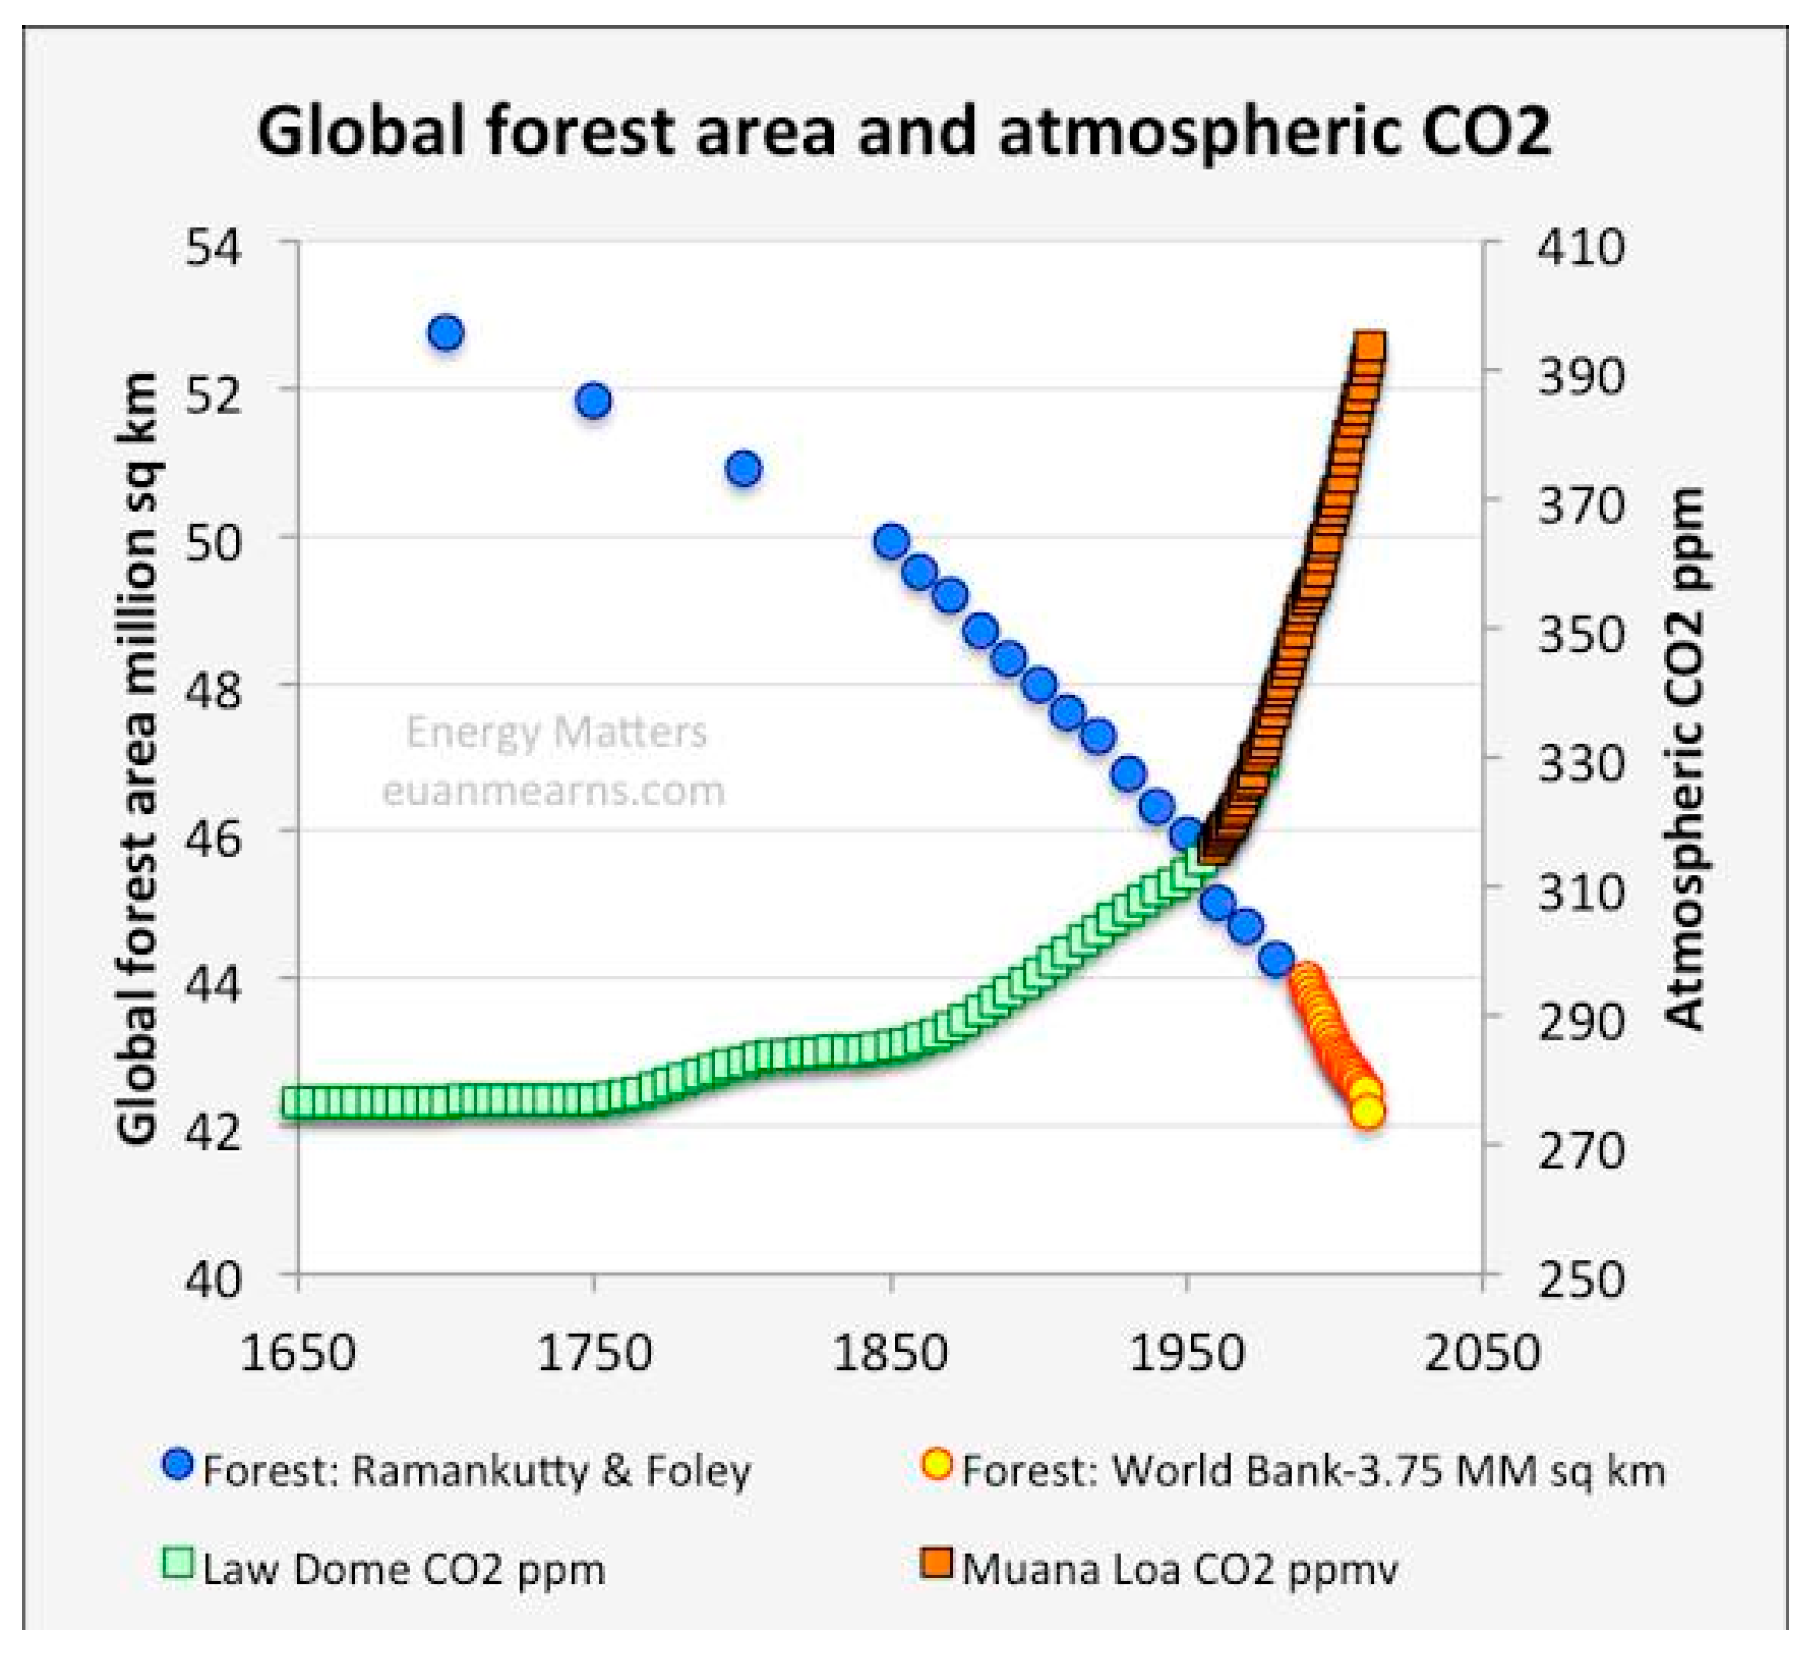
Figure 7.
Source - https://vermecology.wordpress.com/2022/07/13/kantan/ .
Figure 7.
Source - https://vermecology.wordpress.com/2022/07/13/kantan/ .
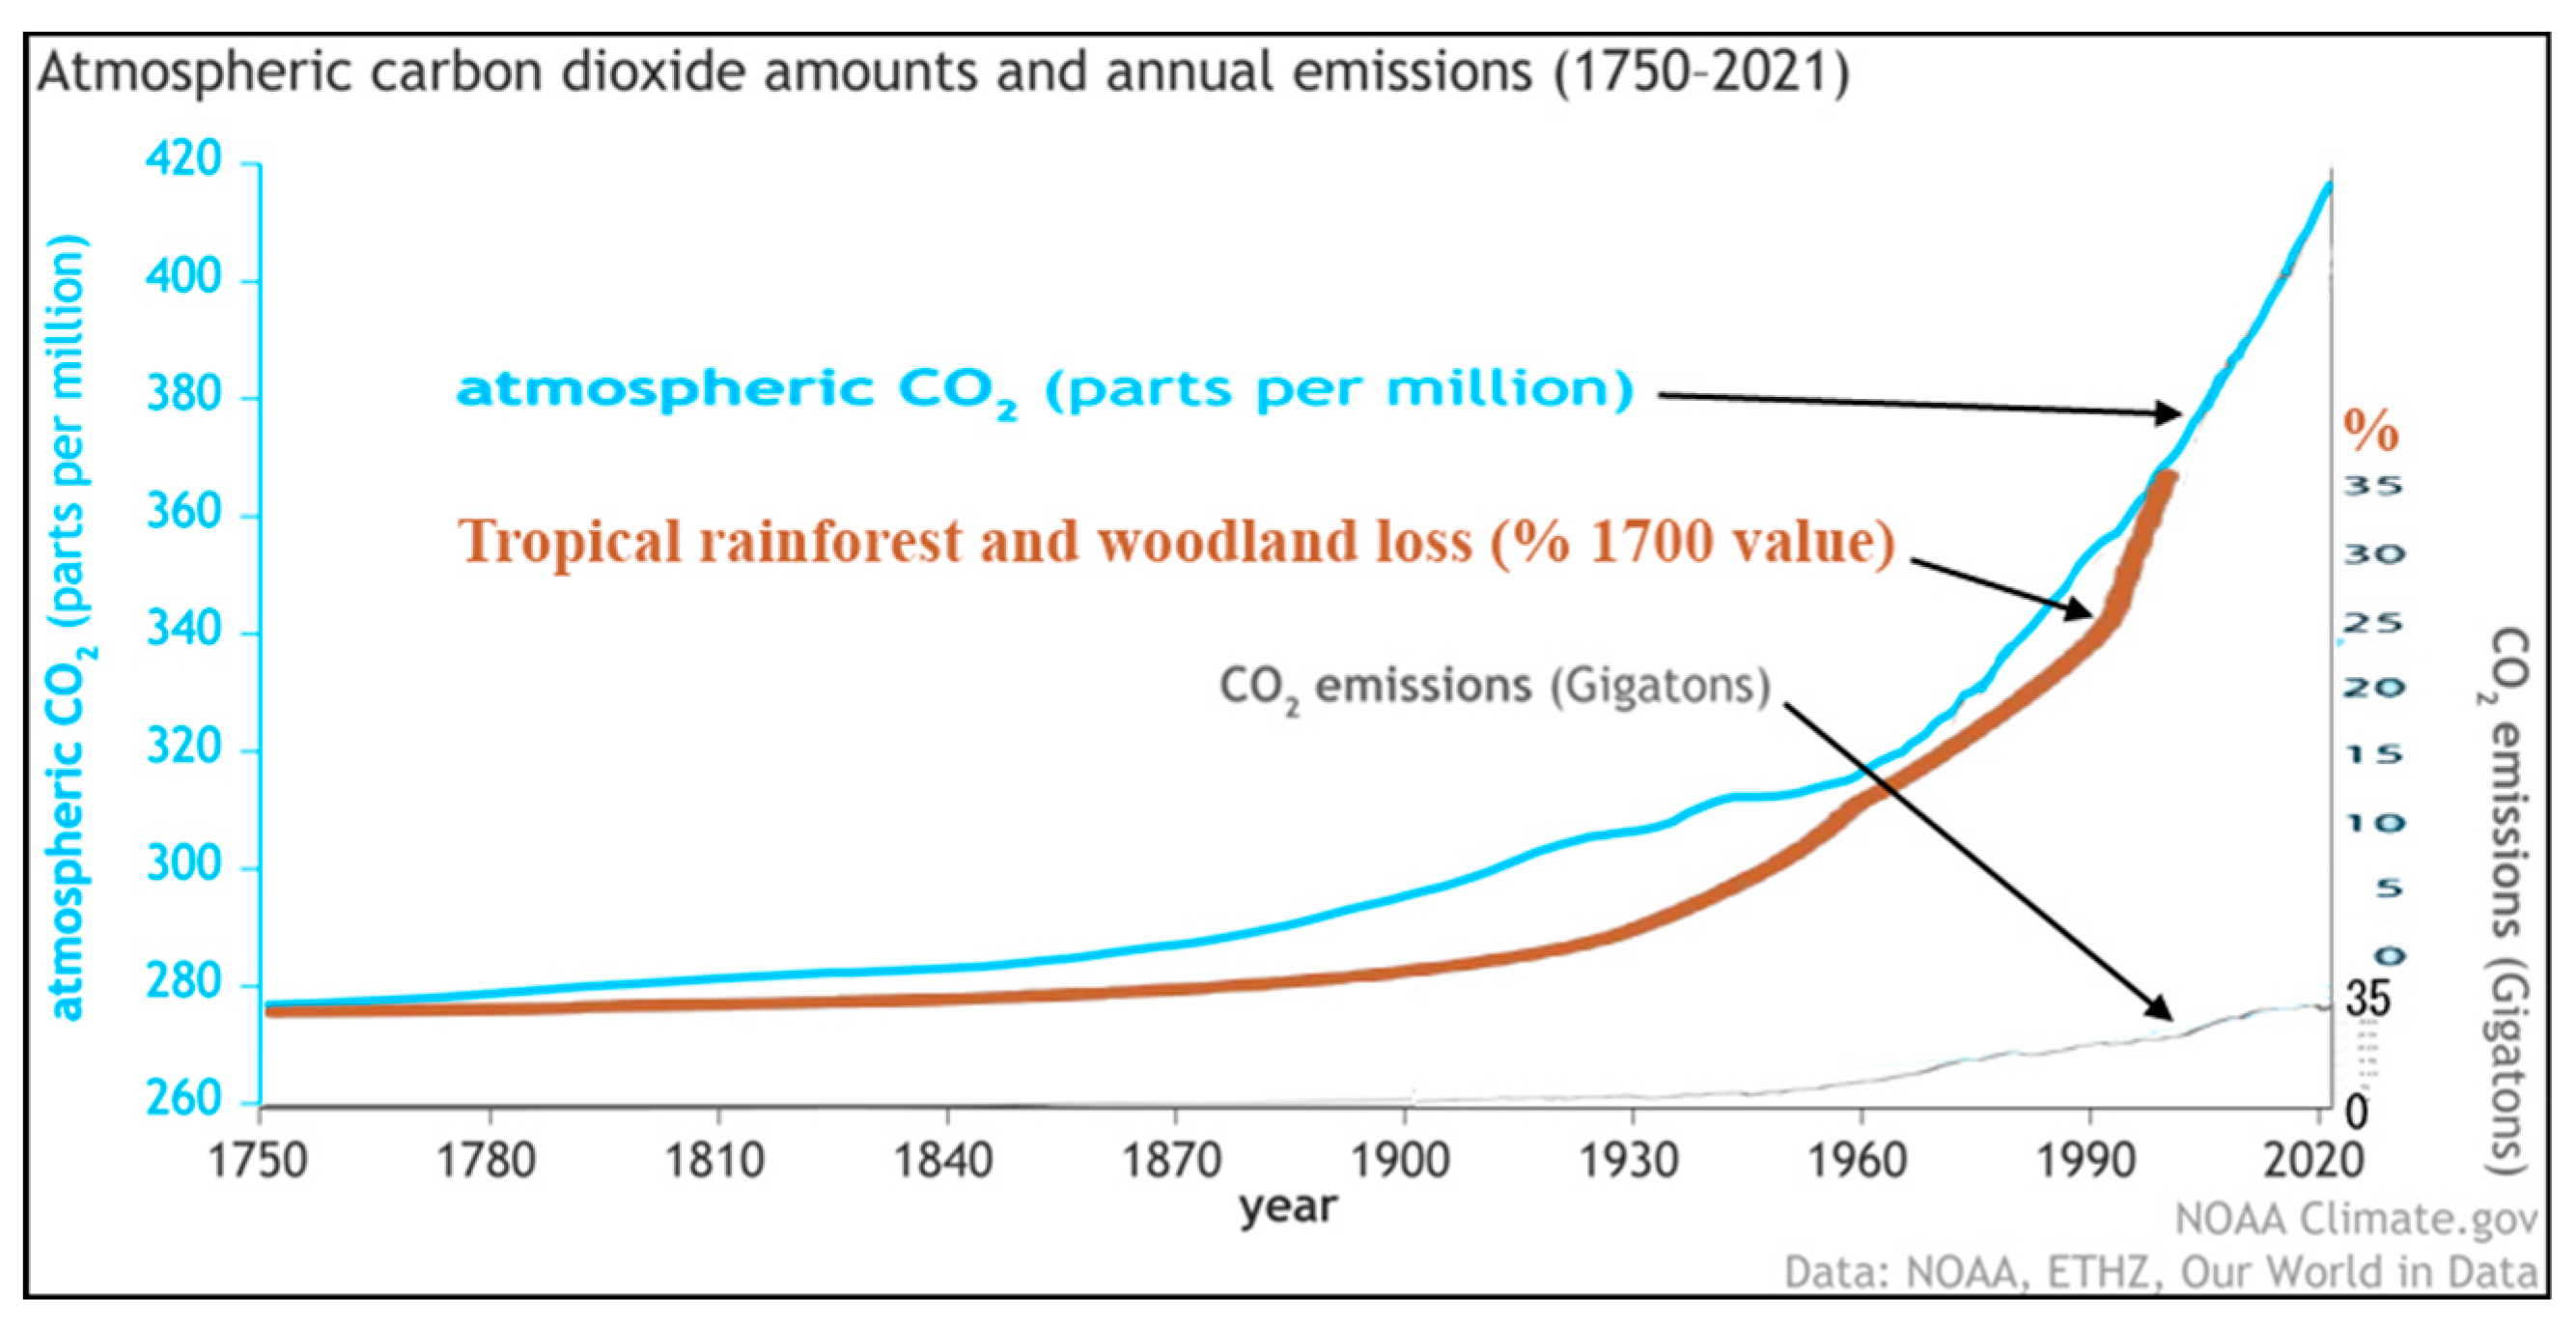
Figure 8.
“Official” NOAA (https://www.climate.gov/media/14596) chart of Carbon dioxide (CO₂) and emissions from fossil fuels (FF) and industry, ignoring Land-use change (LUC) (cf. Figures 3, 4, 6 and 7). Source - https://ourworldindata.org/CO2-emissions.
Figure 8.
“Official” NOAA (https://www.climate.gov/media/14596) chart of Carbon dioxide (CO₂) and emissions from fossil fuels (FF) and industry, ignoring Land-use change (LUC) (cf. Figures 3, 4, 6 and 7). Source - https://ourworldindata.org/CO2-emissions.
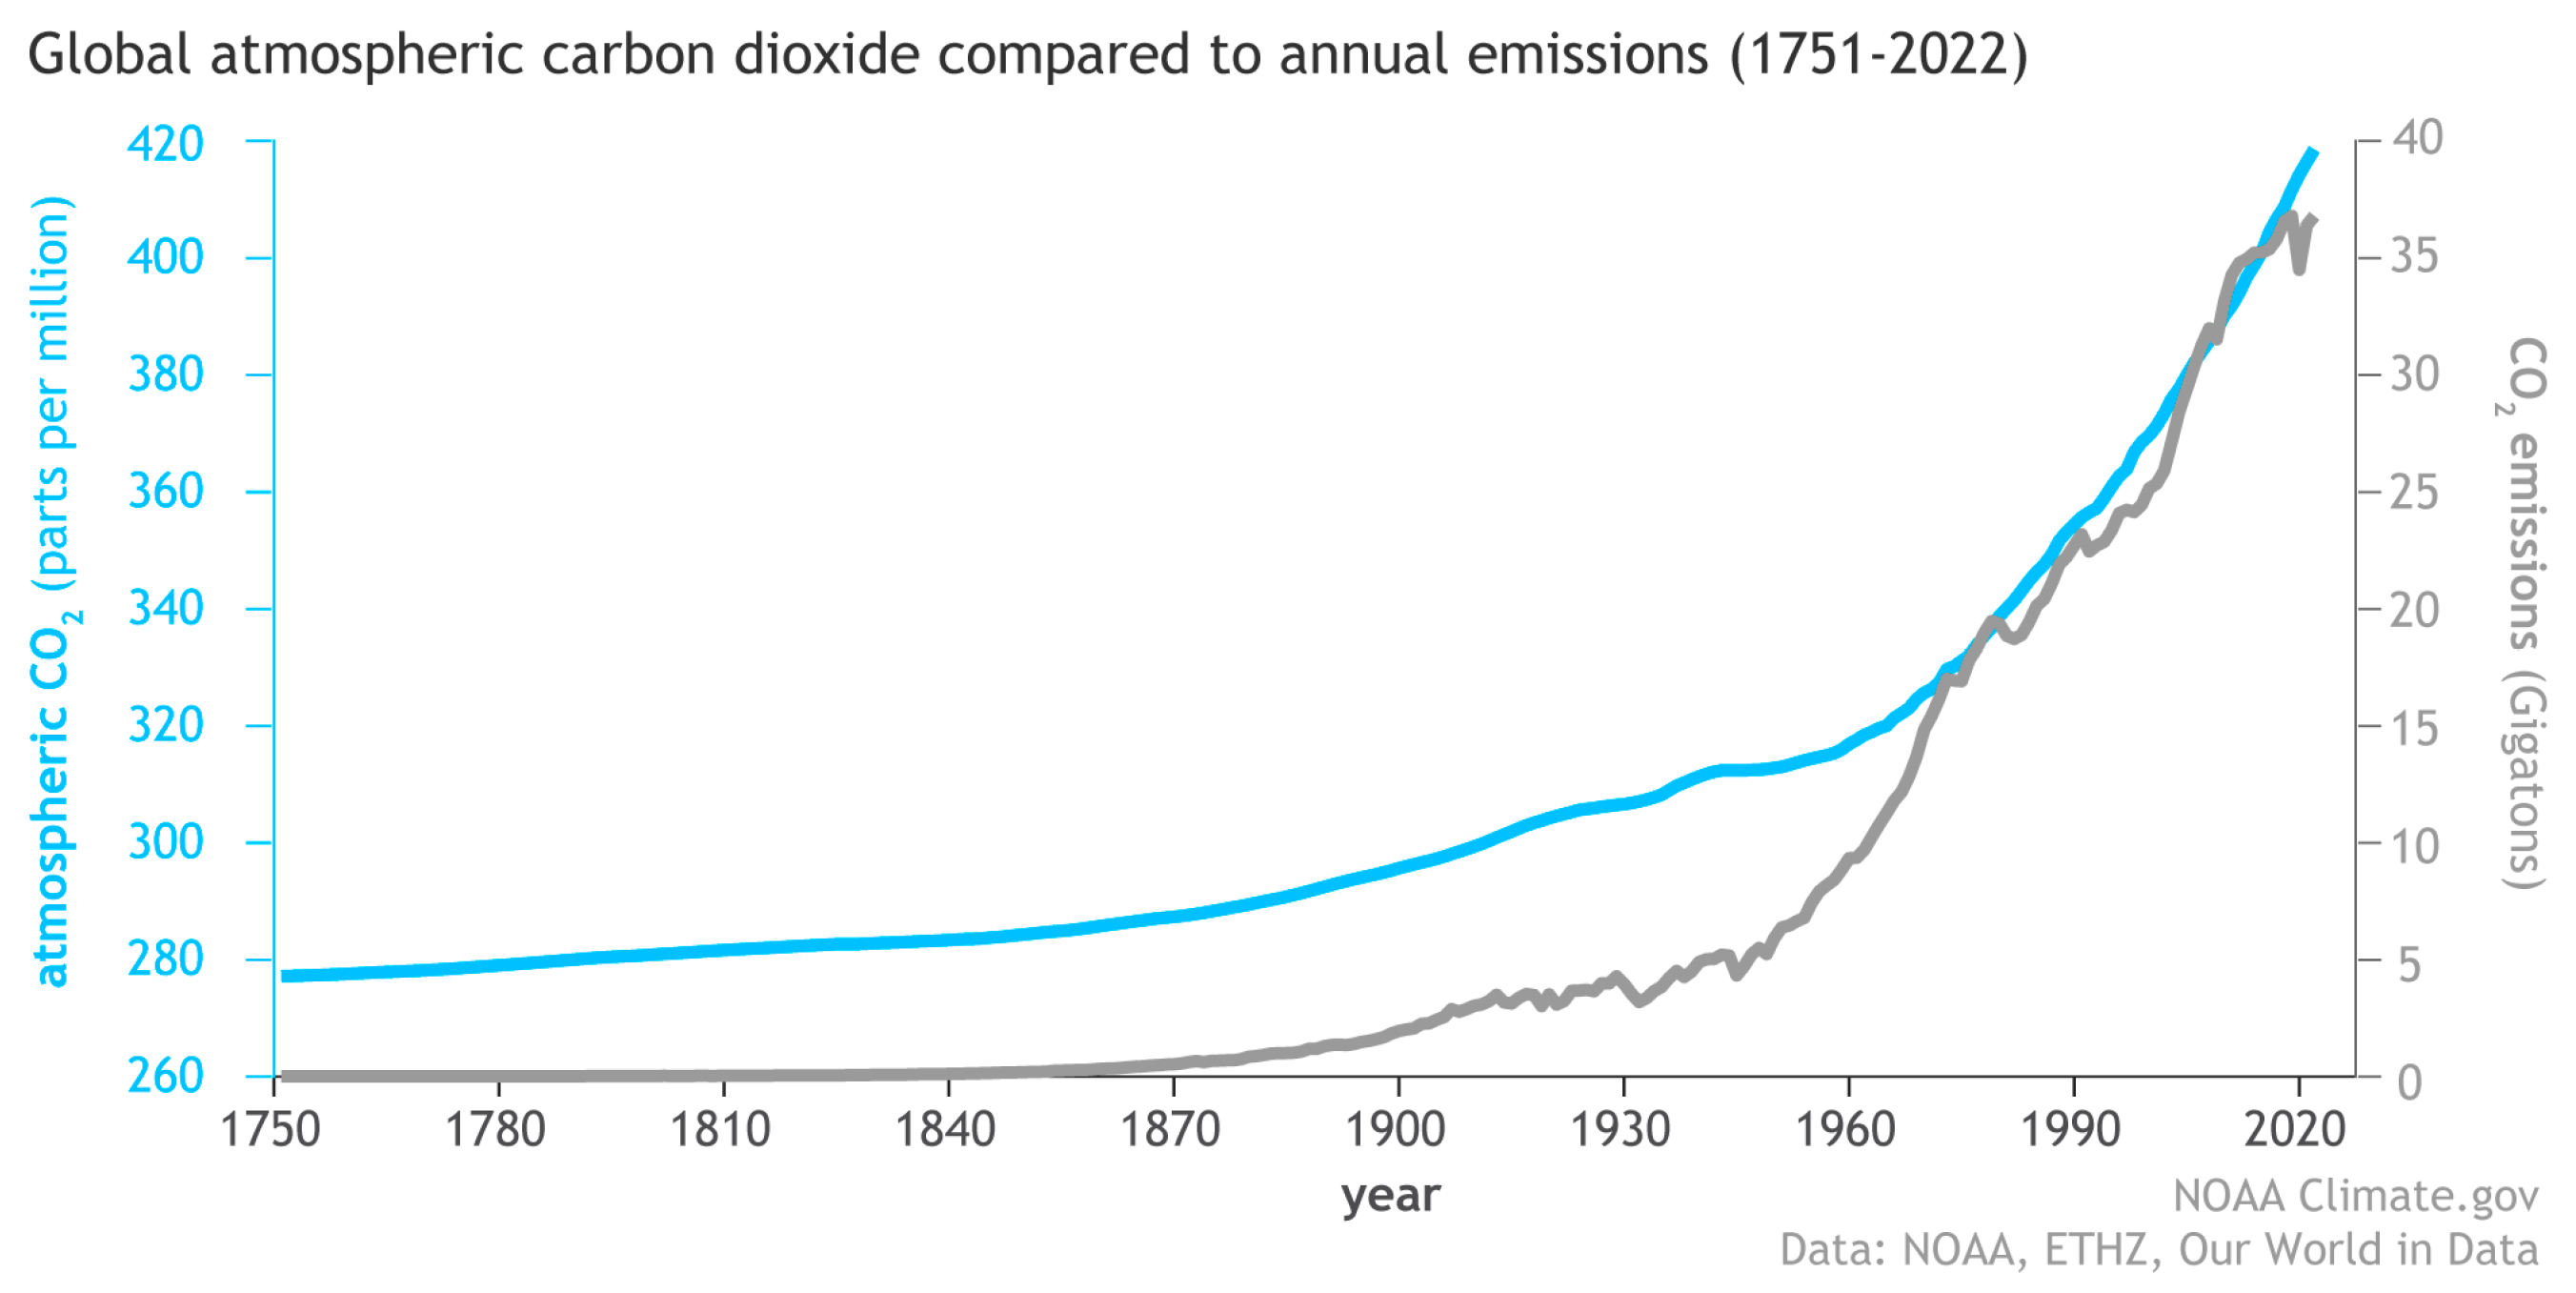
Figure 9.
Soil erosion with rates doubled (in red) to allow for terrain, updated from Lal (2006: Figure 3.2). Source - https://www.preprints.org/manuscript/202212.0258/v2.
Figure 9.
Soil erosion with rates doubled (in red) to allow for terrain, updated from Lal (2006: Figure 3.2). Source - https://www.preprints.org/manuscript/202212.0258/v2.
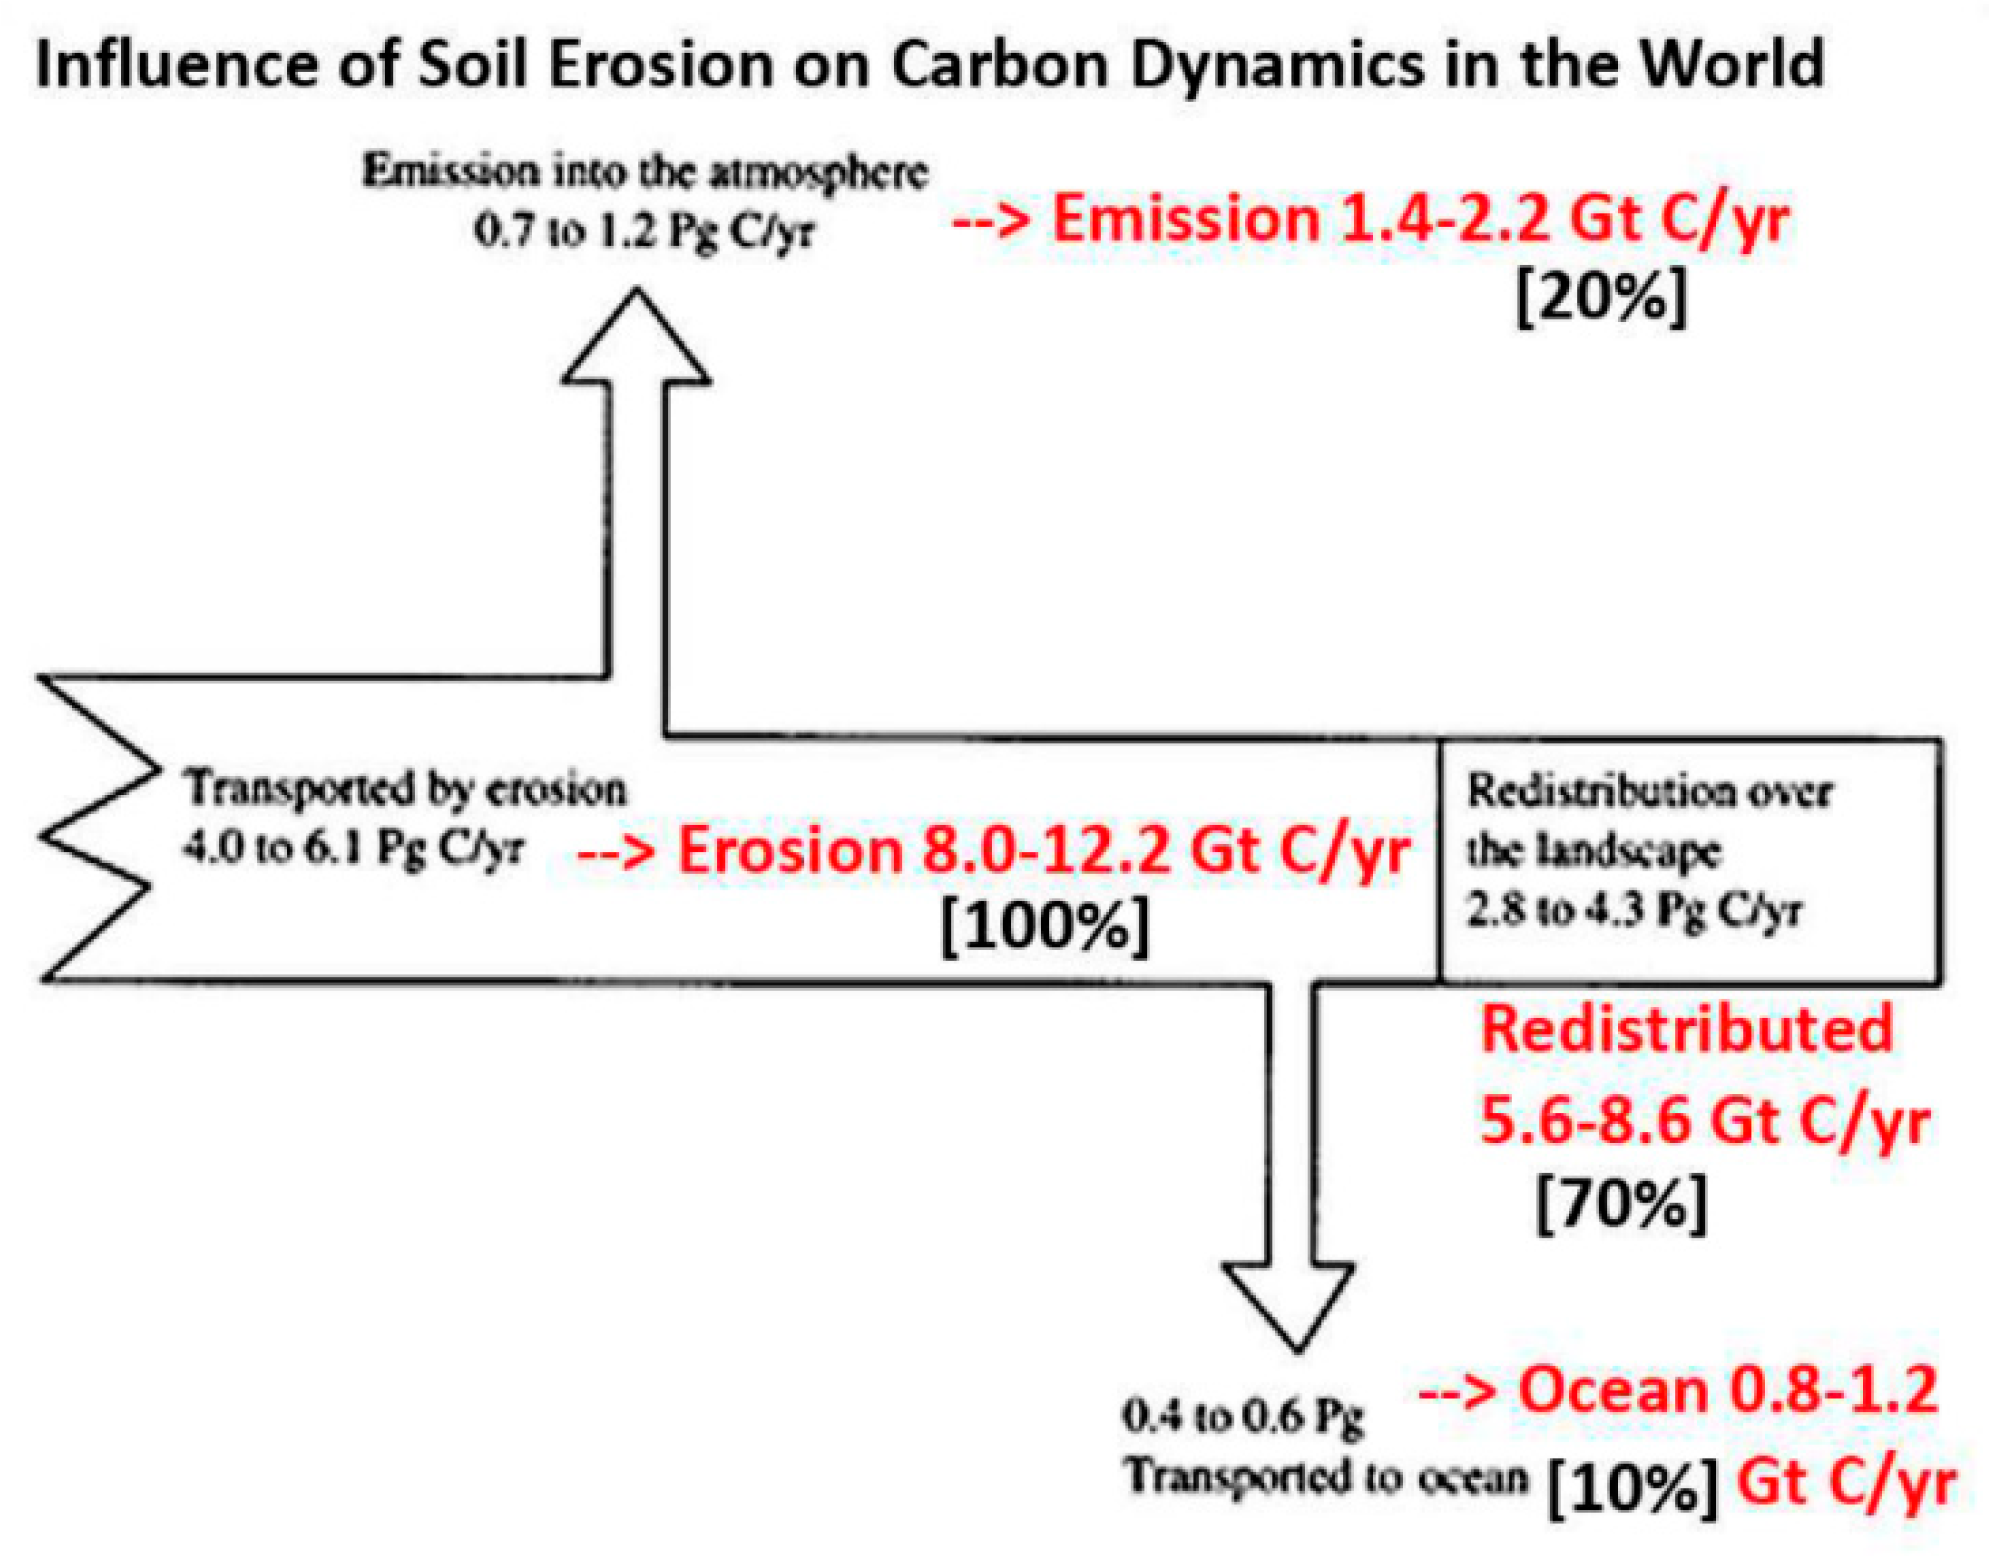
Figure 10.
Synthetic Phosphate fertilizer use (as promoted by Rothamsted) increased five or six-fold since 1960s. Nucleotide fallout was from atom-bomb tests also in 1960s. Pharmaceuticals, heavy metals and biocides dates noted. Source – Owens (2020: Figure 8).
Figure 10.
Synthetic Phosphate fertilizer use (as promoted by Rothamsted) increased five or six-fold since 1960s. Nucleotide fallout was from atom-bomb tests also in 1960s. Pharmaceuticals, heavy metals and biocides dates noted. Source – Owens (2020: Figure 8).
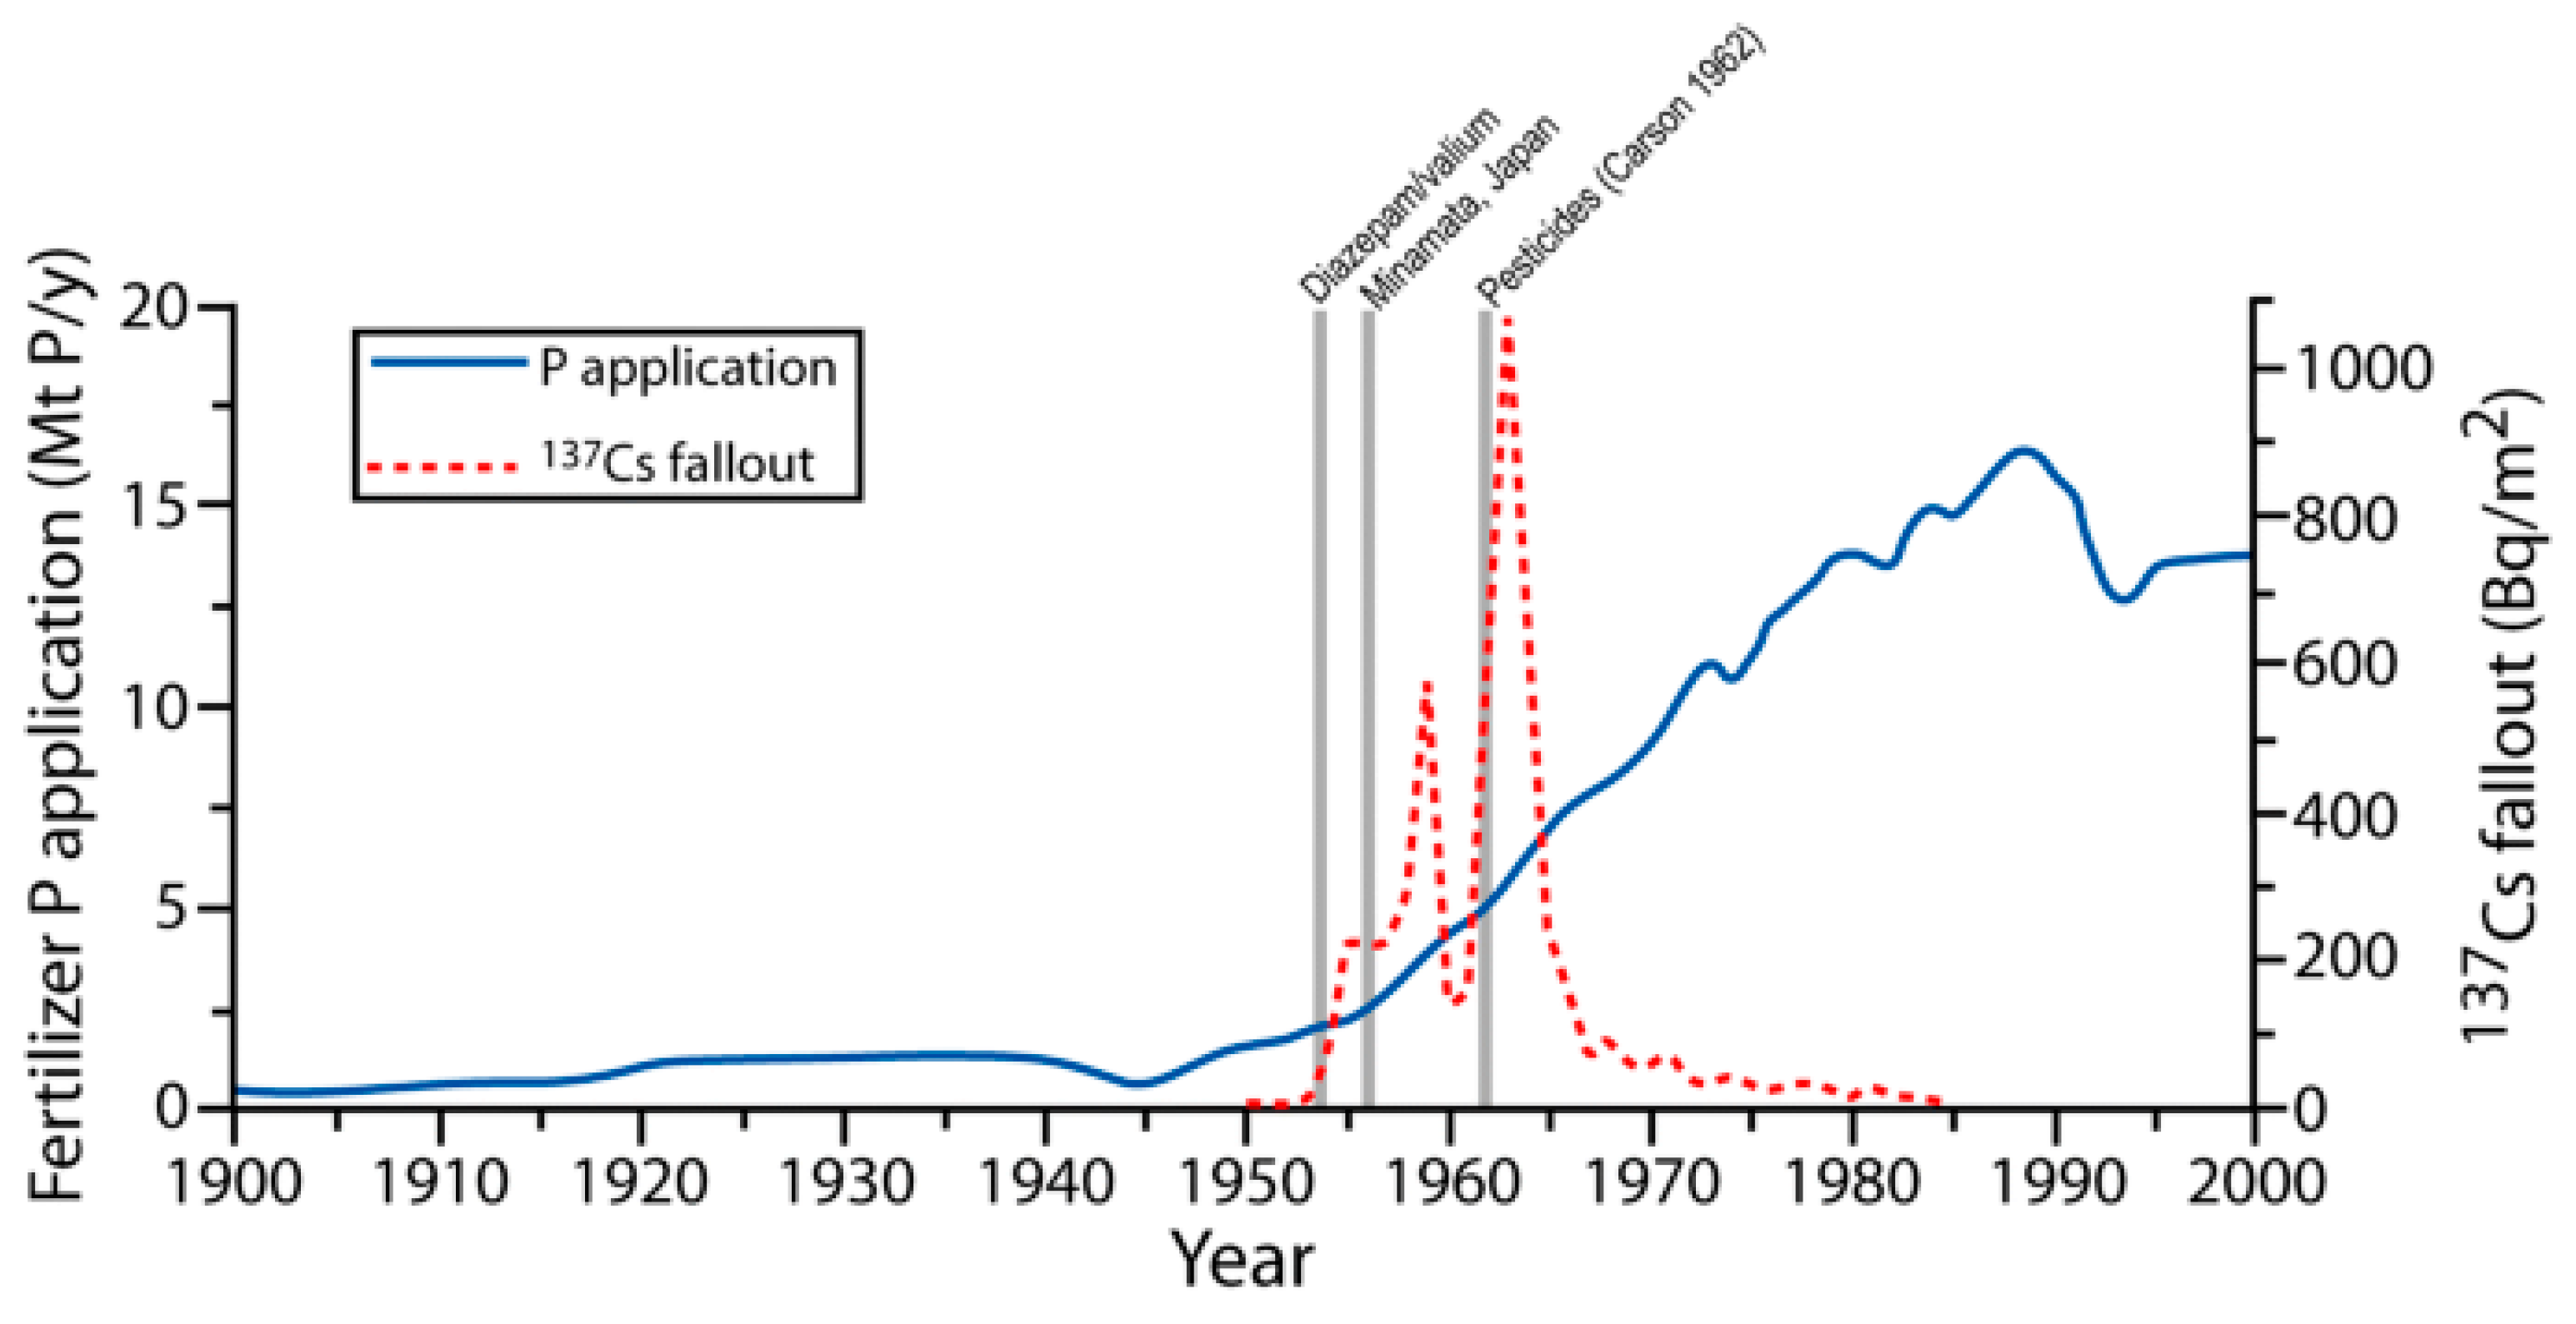
Figure 11.
Source - https://ourworldindata.org/grapher/land-use-protein-poore.
Figure 11.
Source - https://ourworldindata.org/grapher/land-use-protein-poore.
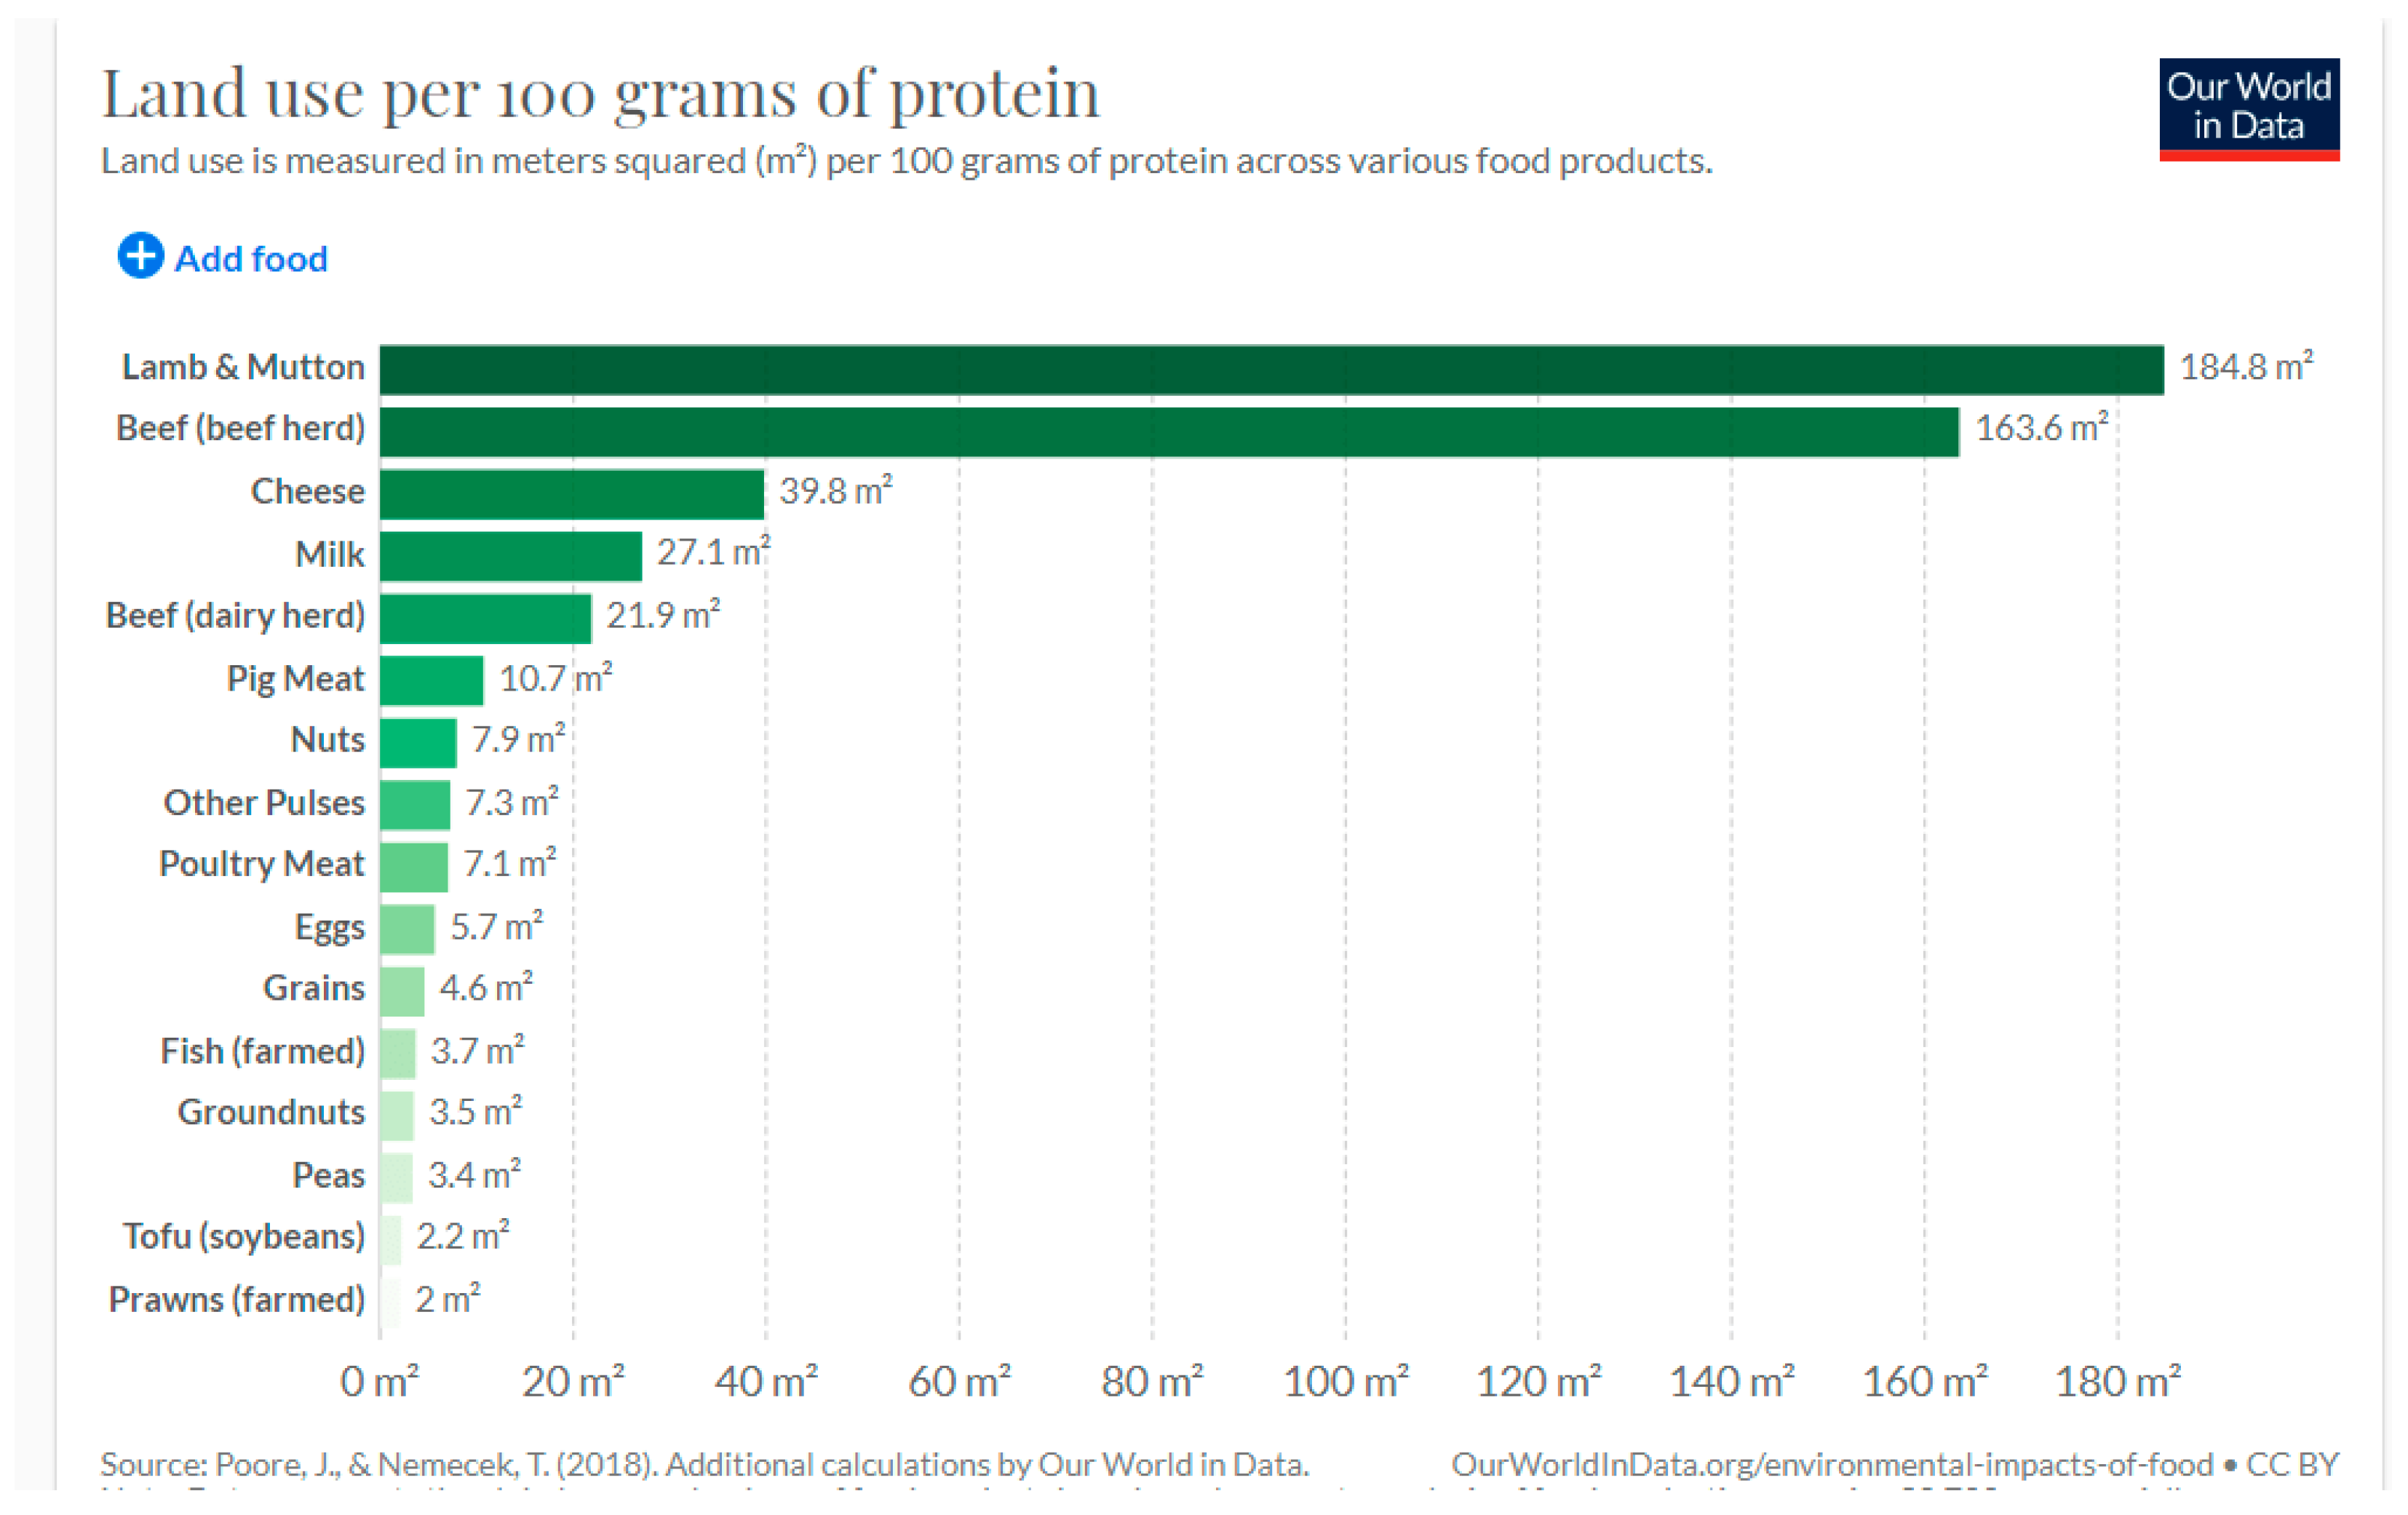
Figure 12.
Source - https://ourworldindata.org/food-choice-vs-eating-local note that transportation (in red) is a minor proportion of total food costs. See also - https://ourworldindata.org/grapher/food-emissions-supply-chain that shows when food losses are included nearly 100 kg CO2e is required to produce 1 kg of beef.
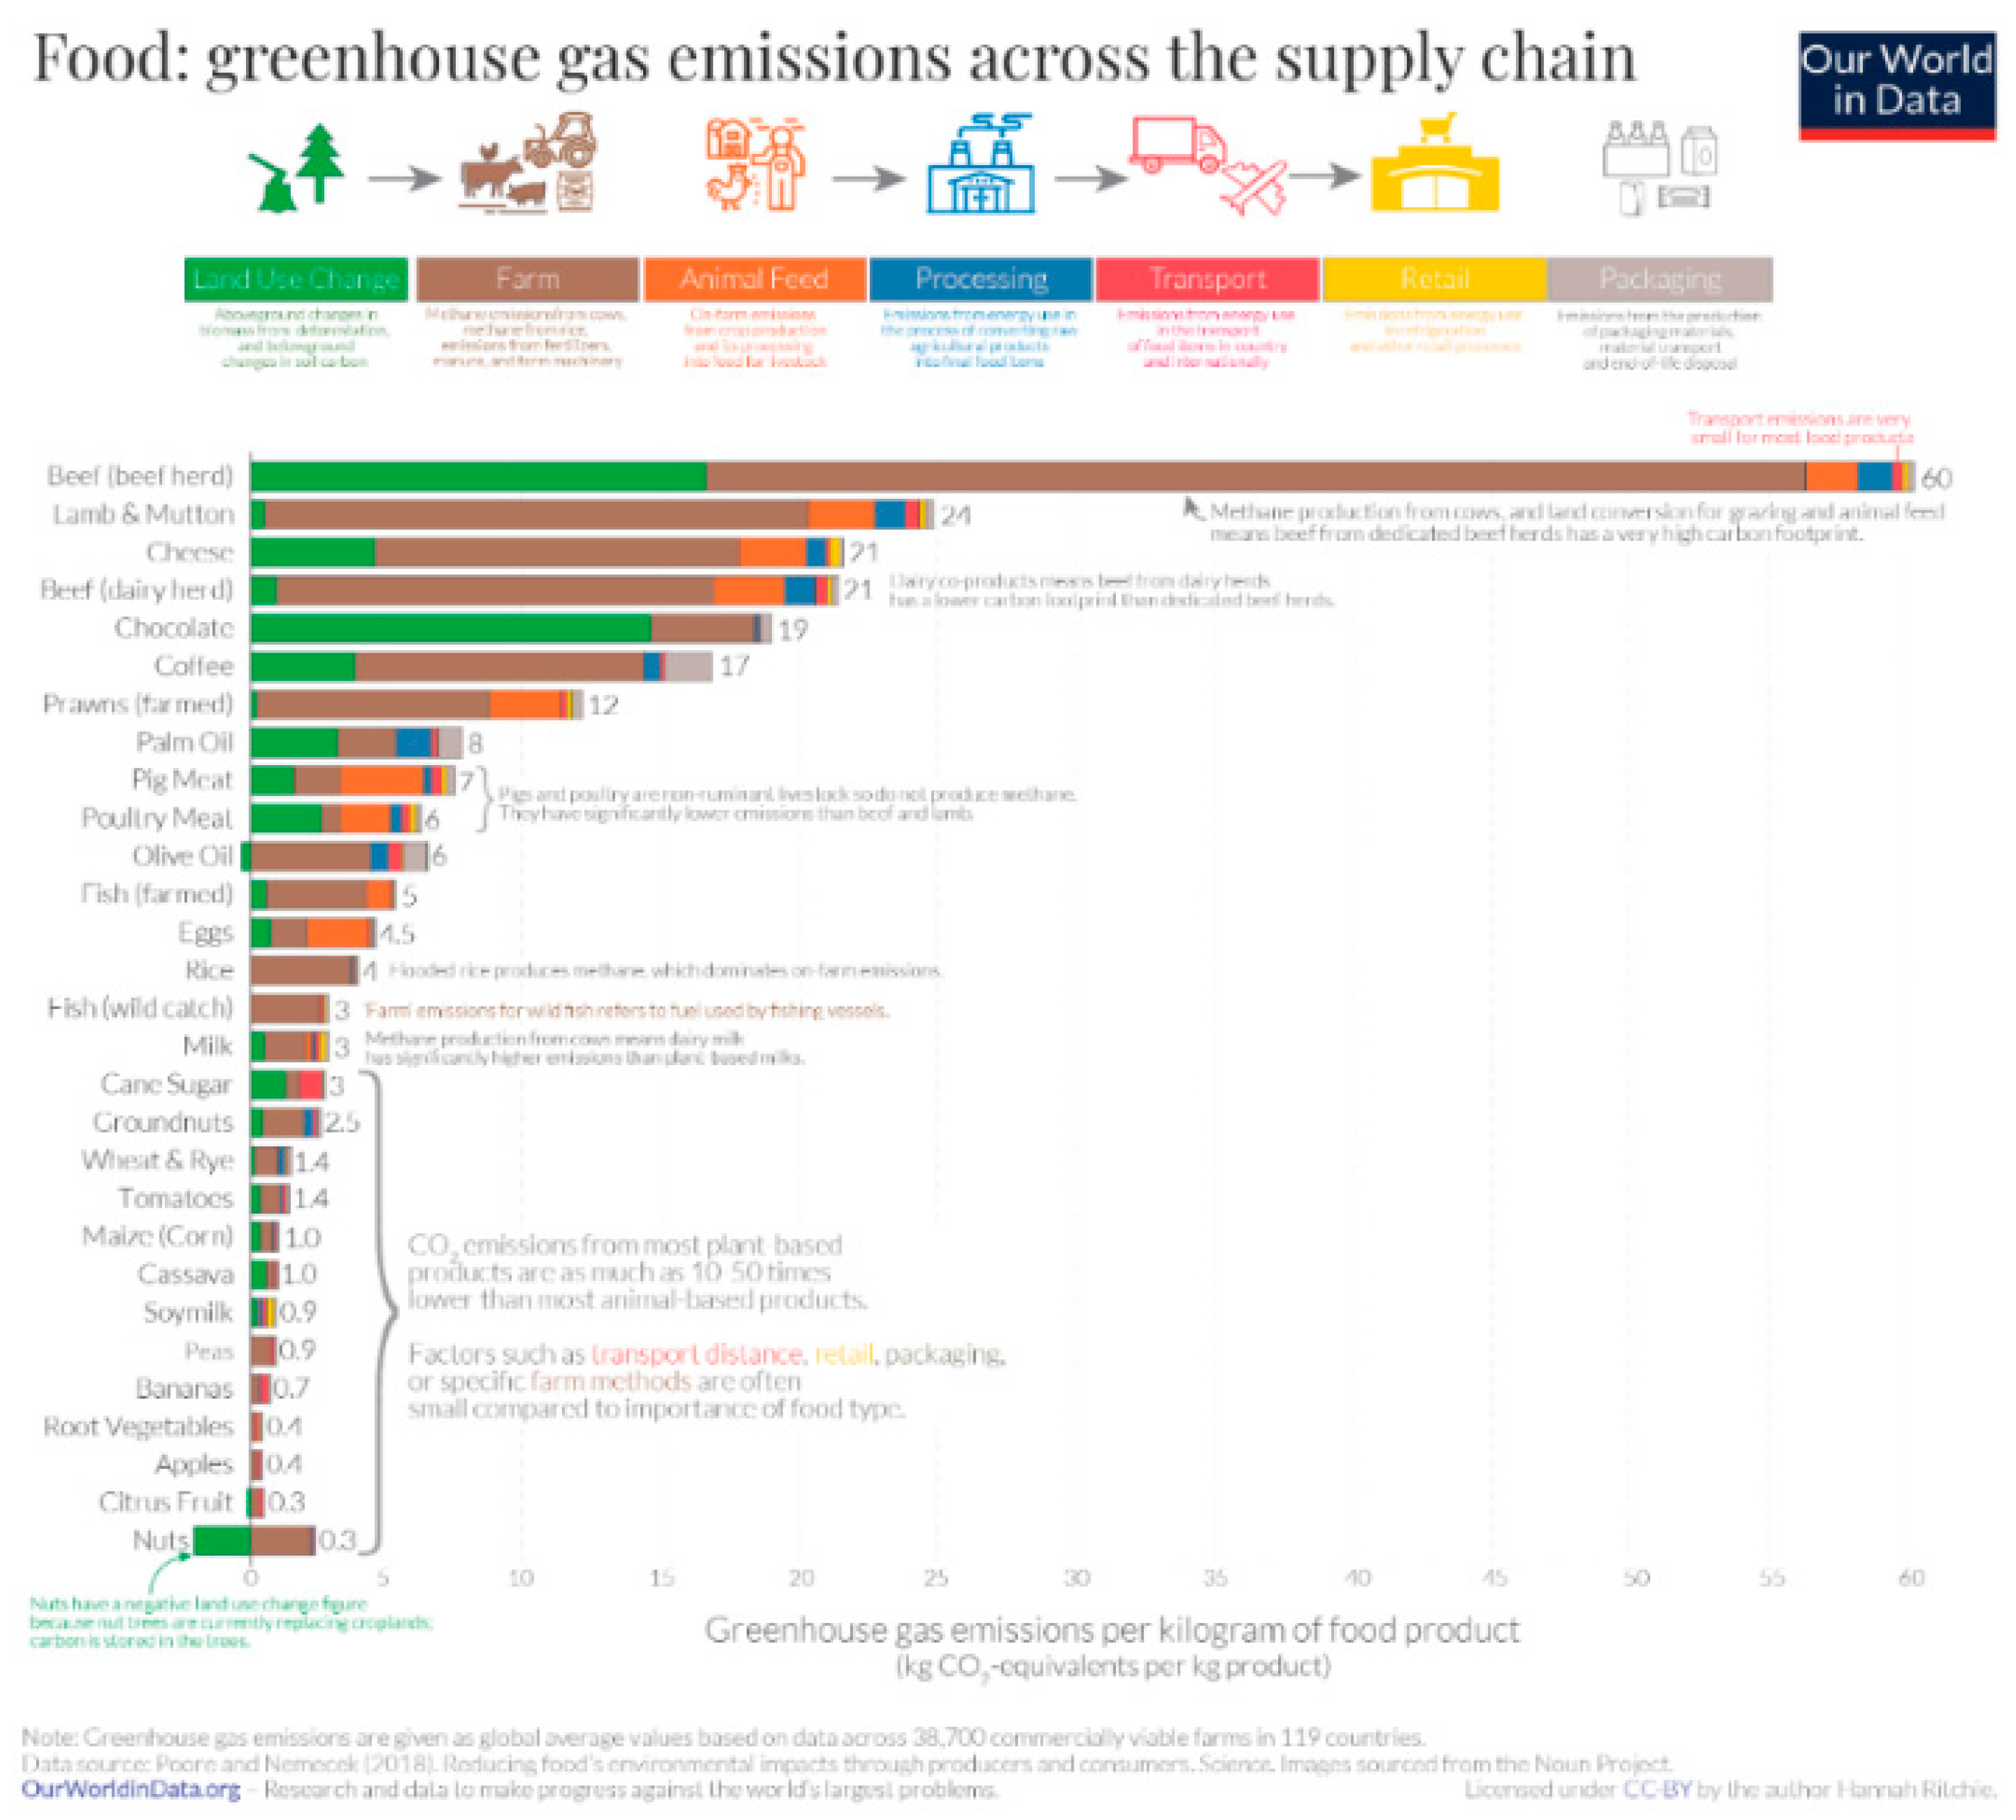
Figure 13.
Source - https://ourworldindata.org/carbon-opportunity-costs-food.
Figure 13.
Source - https://ourworldindata.org/carbon-opportunity-costs-food.
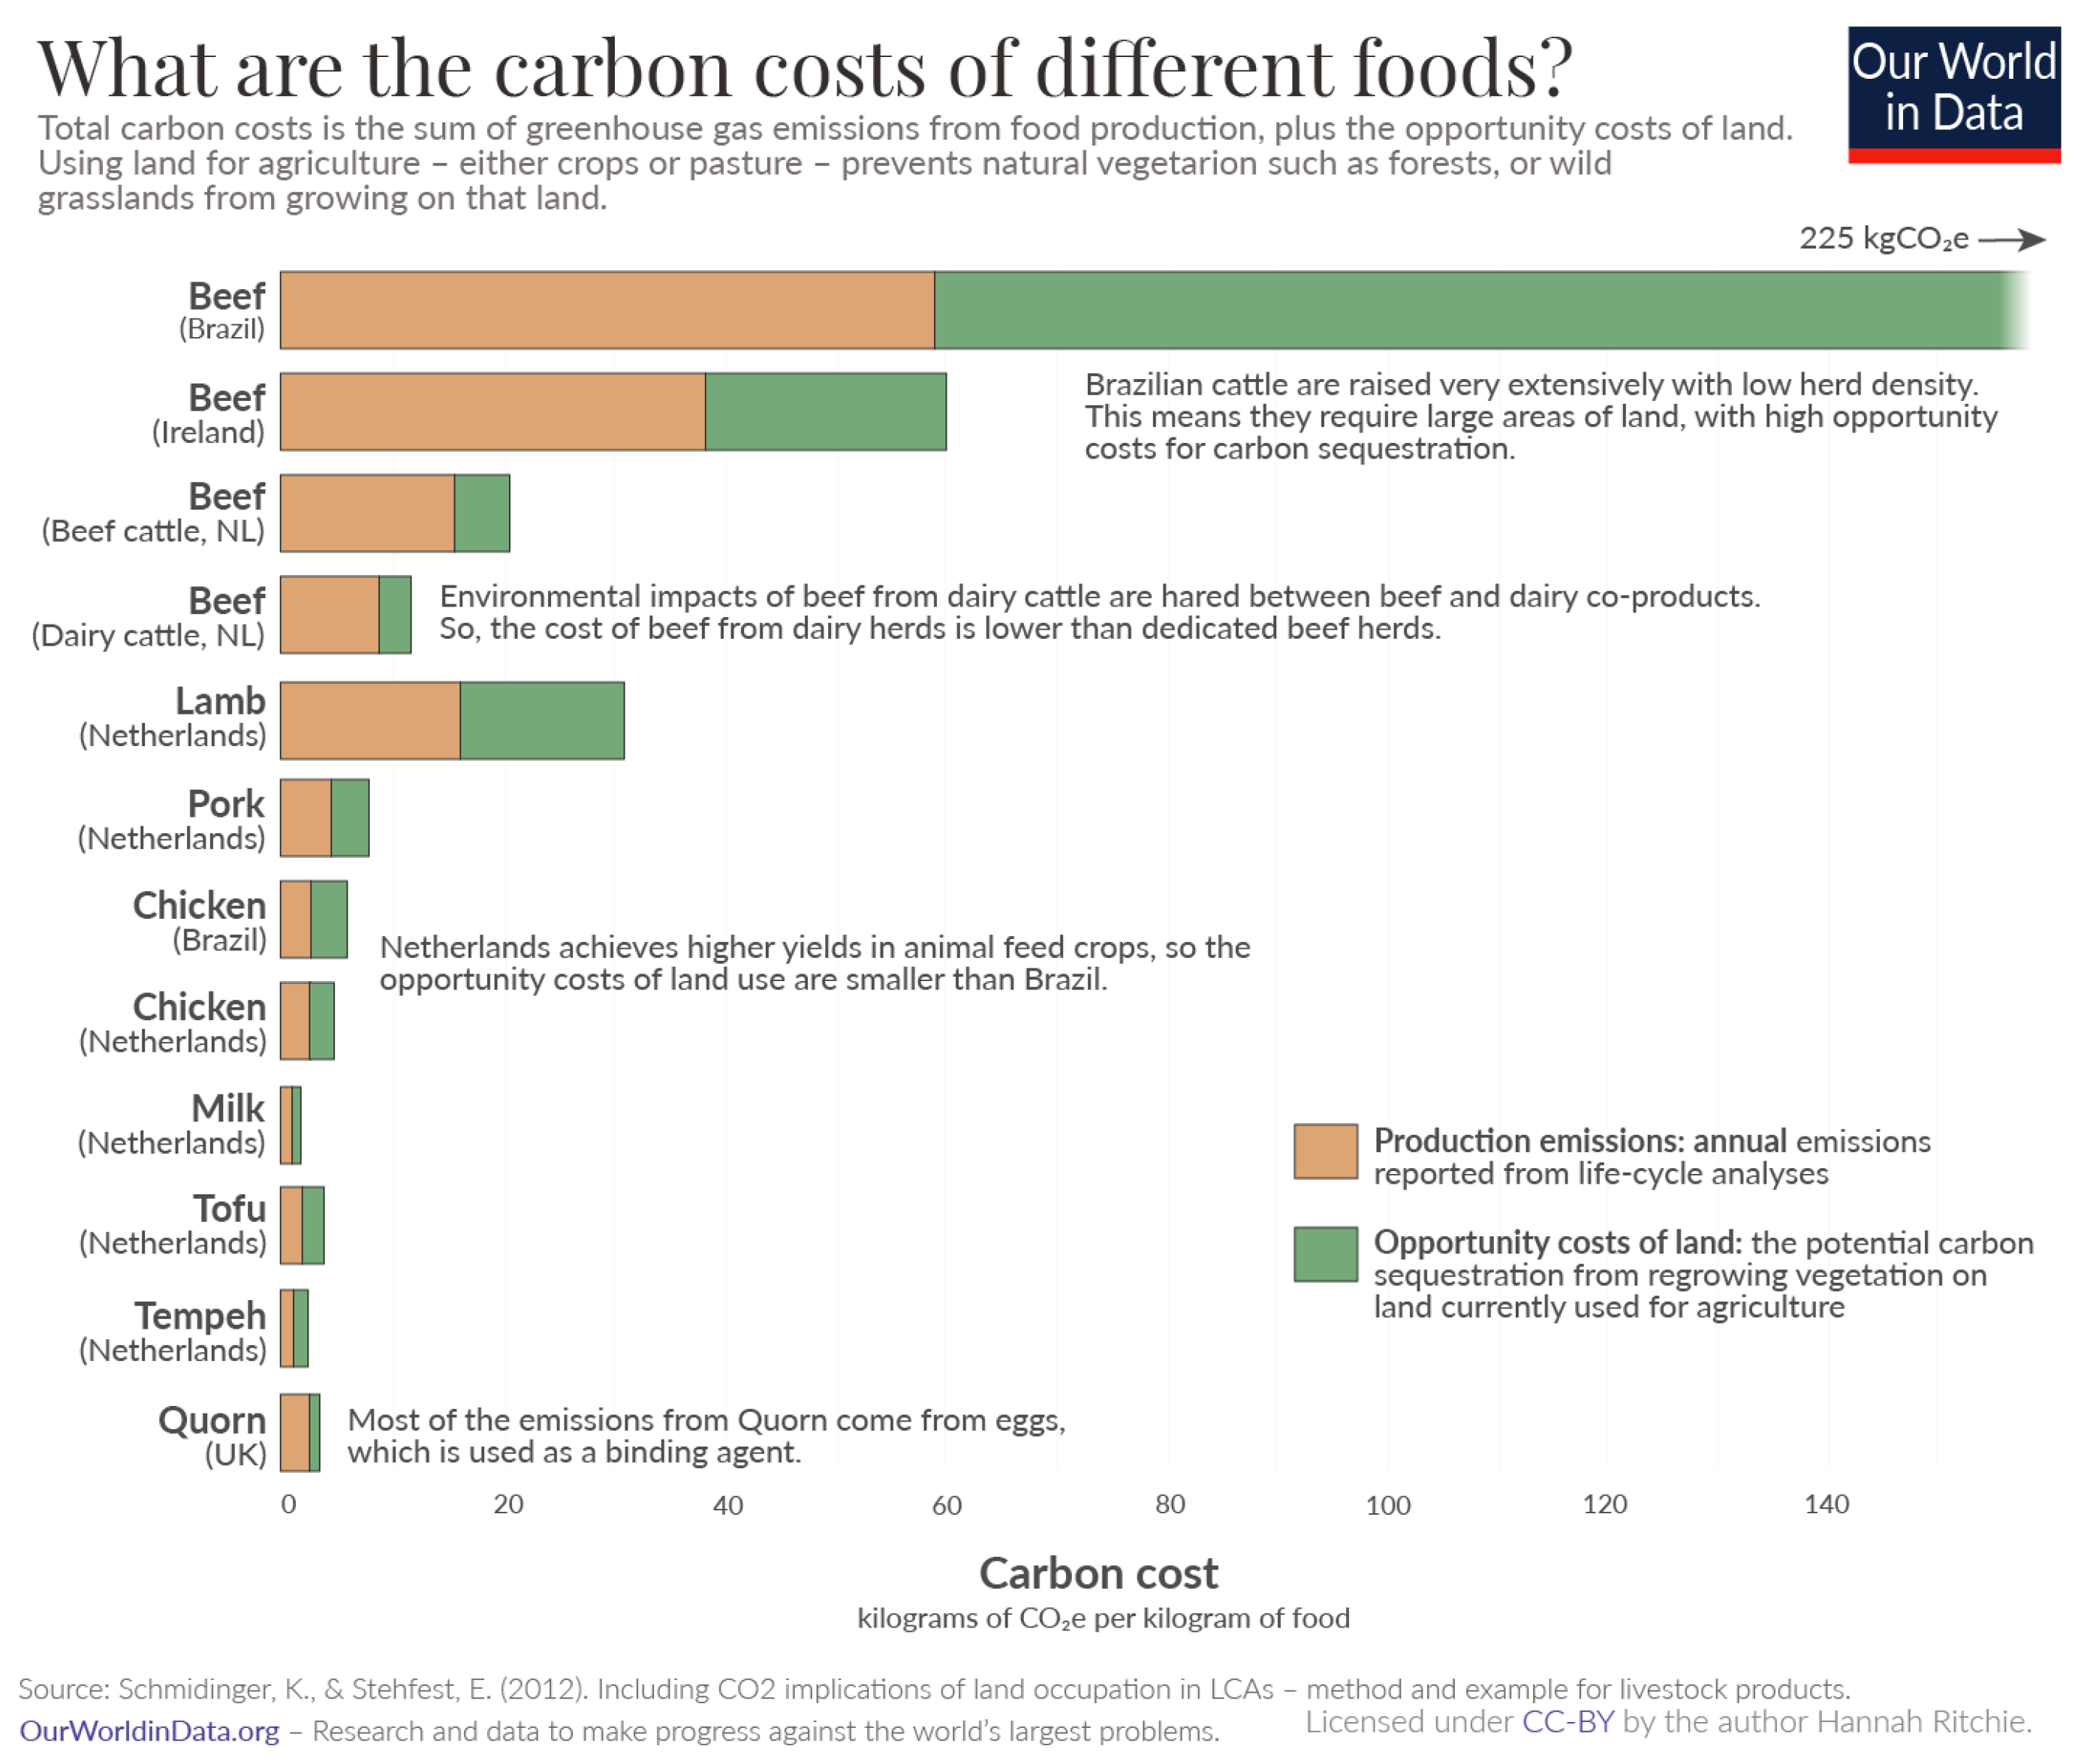
Figure 14.
Refined diet choices. Source - https://ourworldindata.org/land-use-diets.
Figure 14.
Refined diet choices. Source - https://ourworldindata.org/land-use-diets.
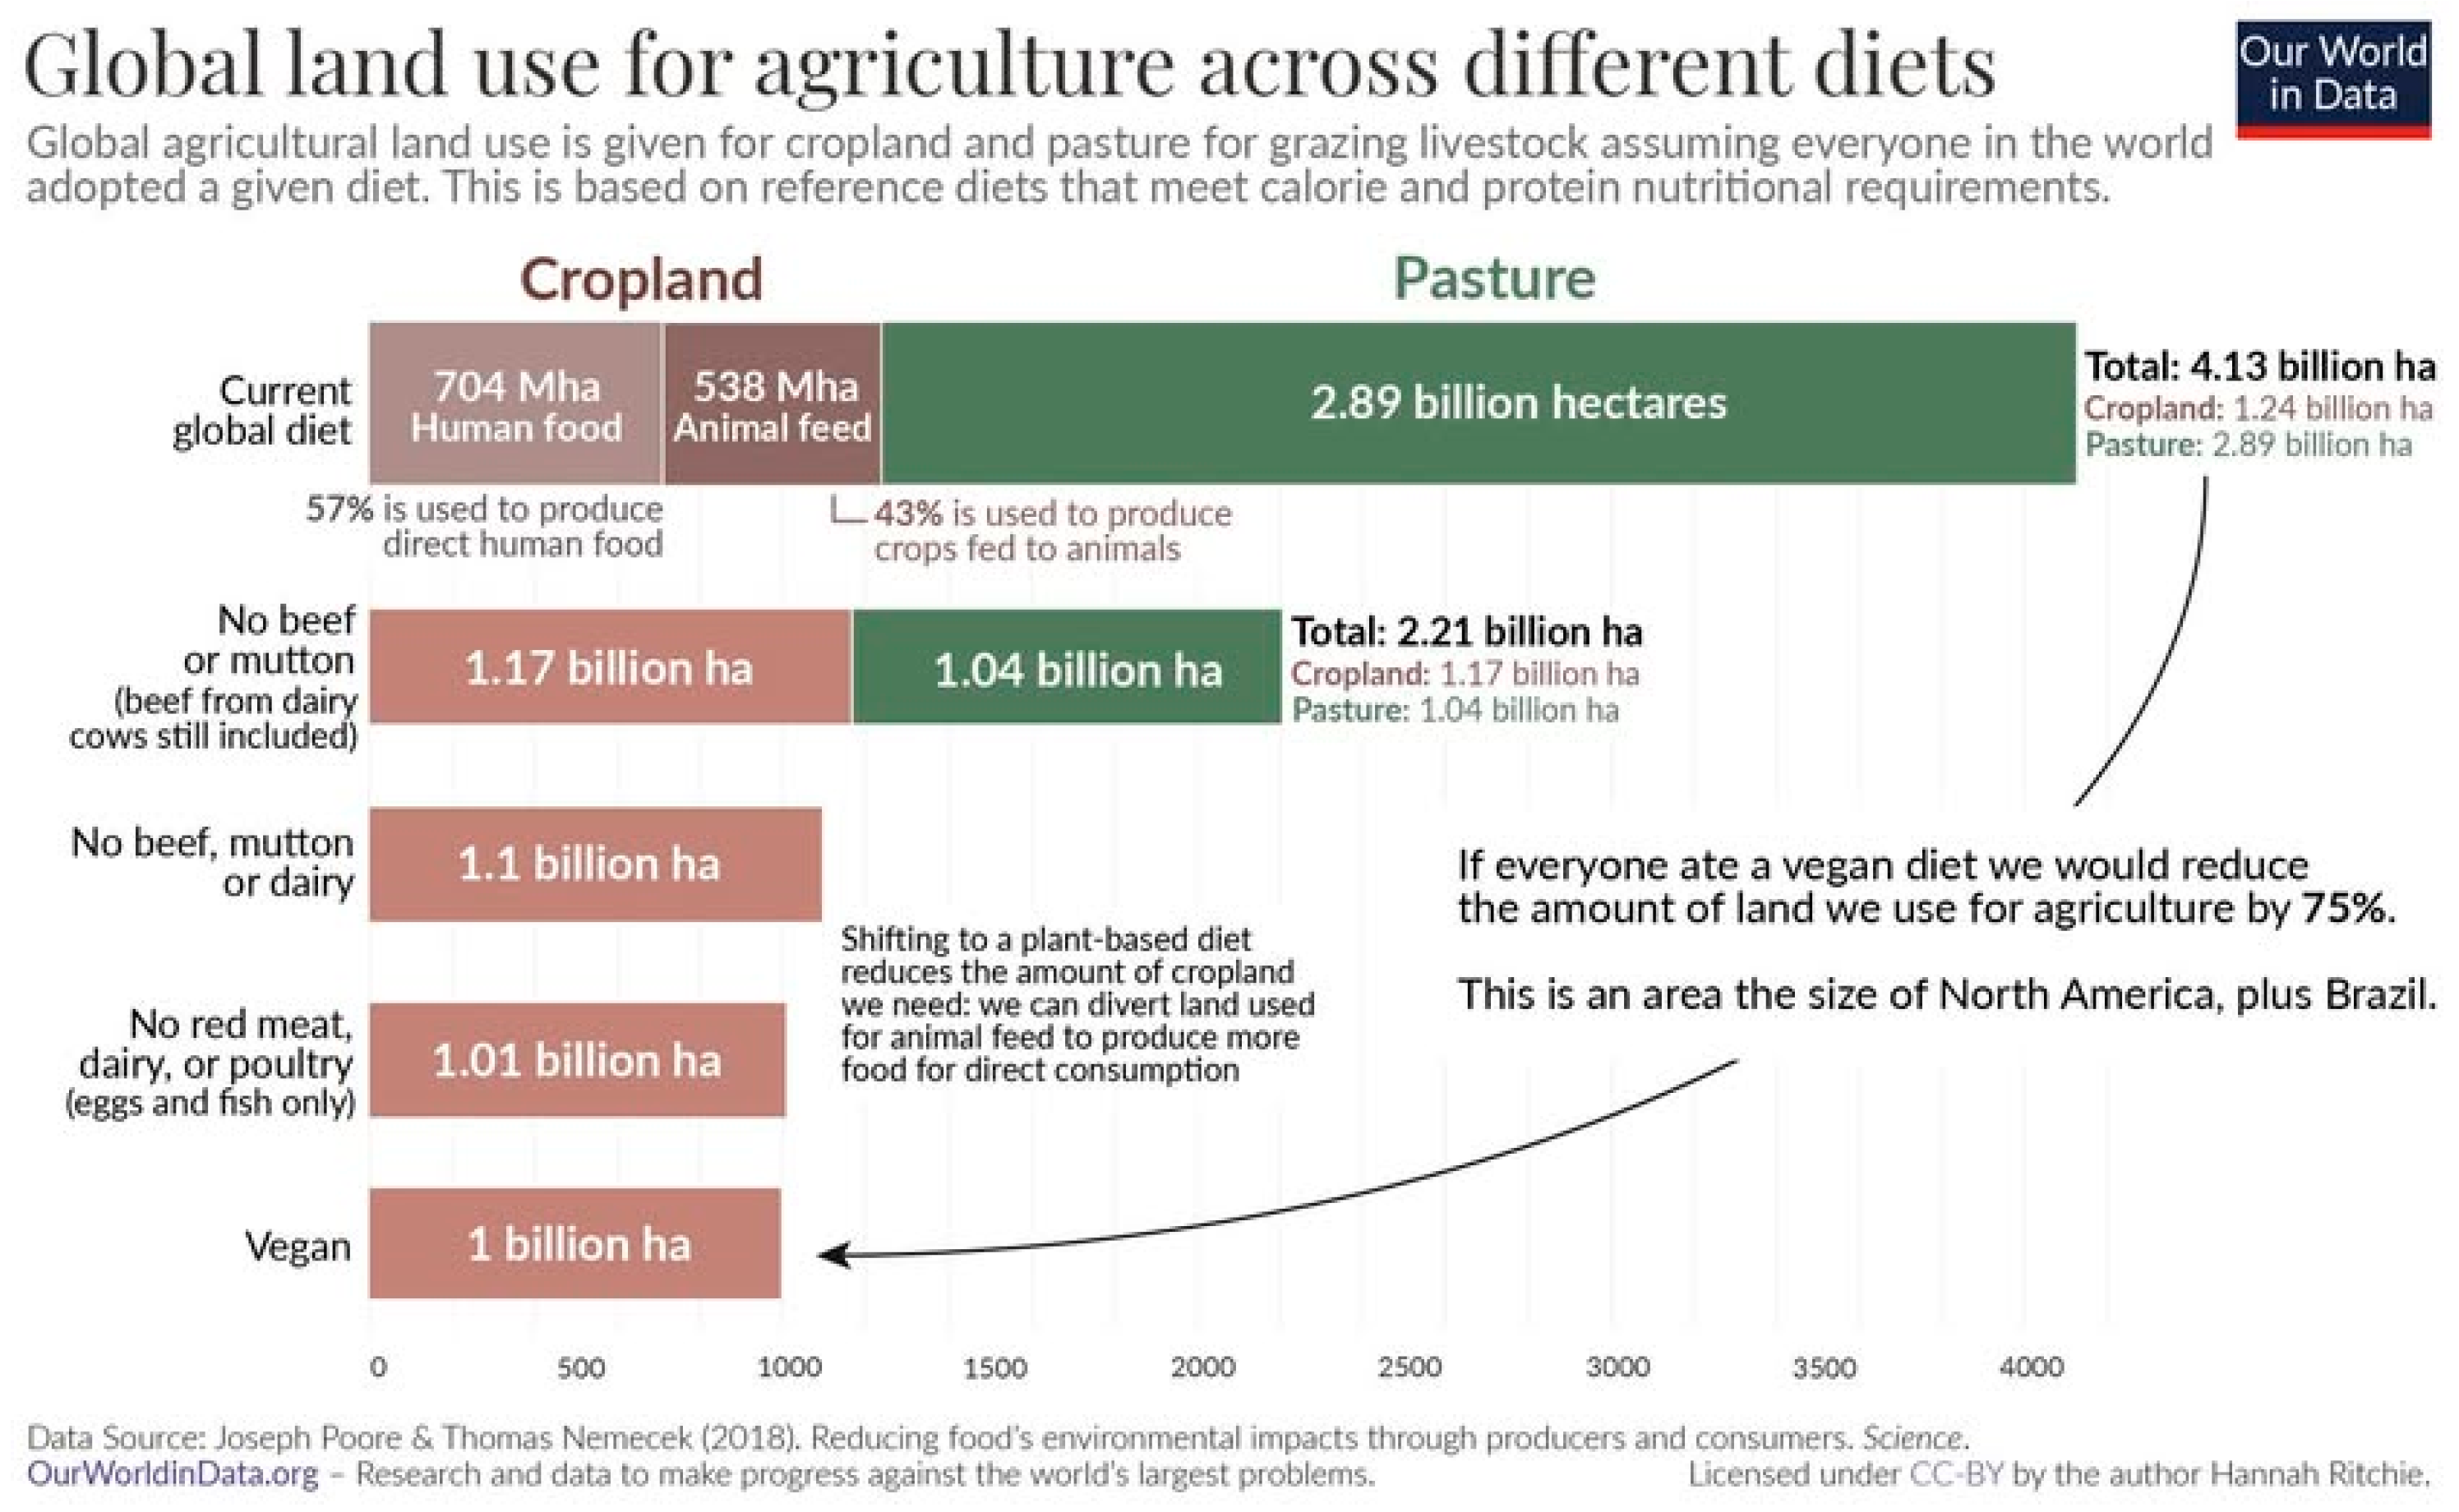
Figure 15.
Meat consumption from OWiD. Source - https://vermecology.wordpress.com/2020/05/27/realms-of-the-soil/.
Figure 15.
Meat consumption from OWiD. Source - https://vermecology.wordpress.com/2020/05/27/realms-of-the-soil/.
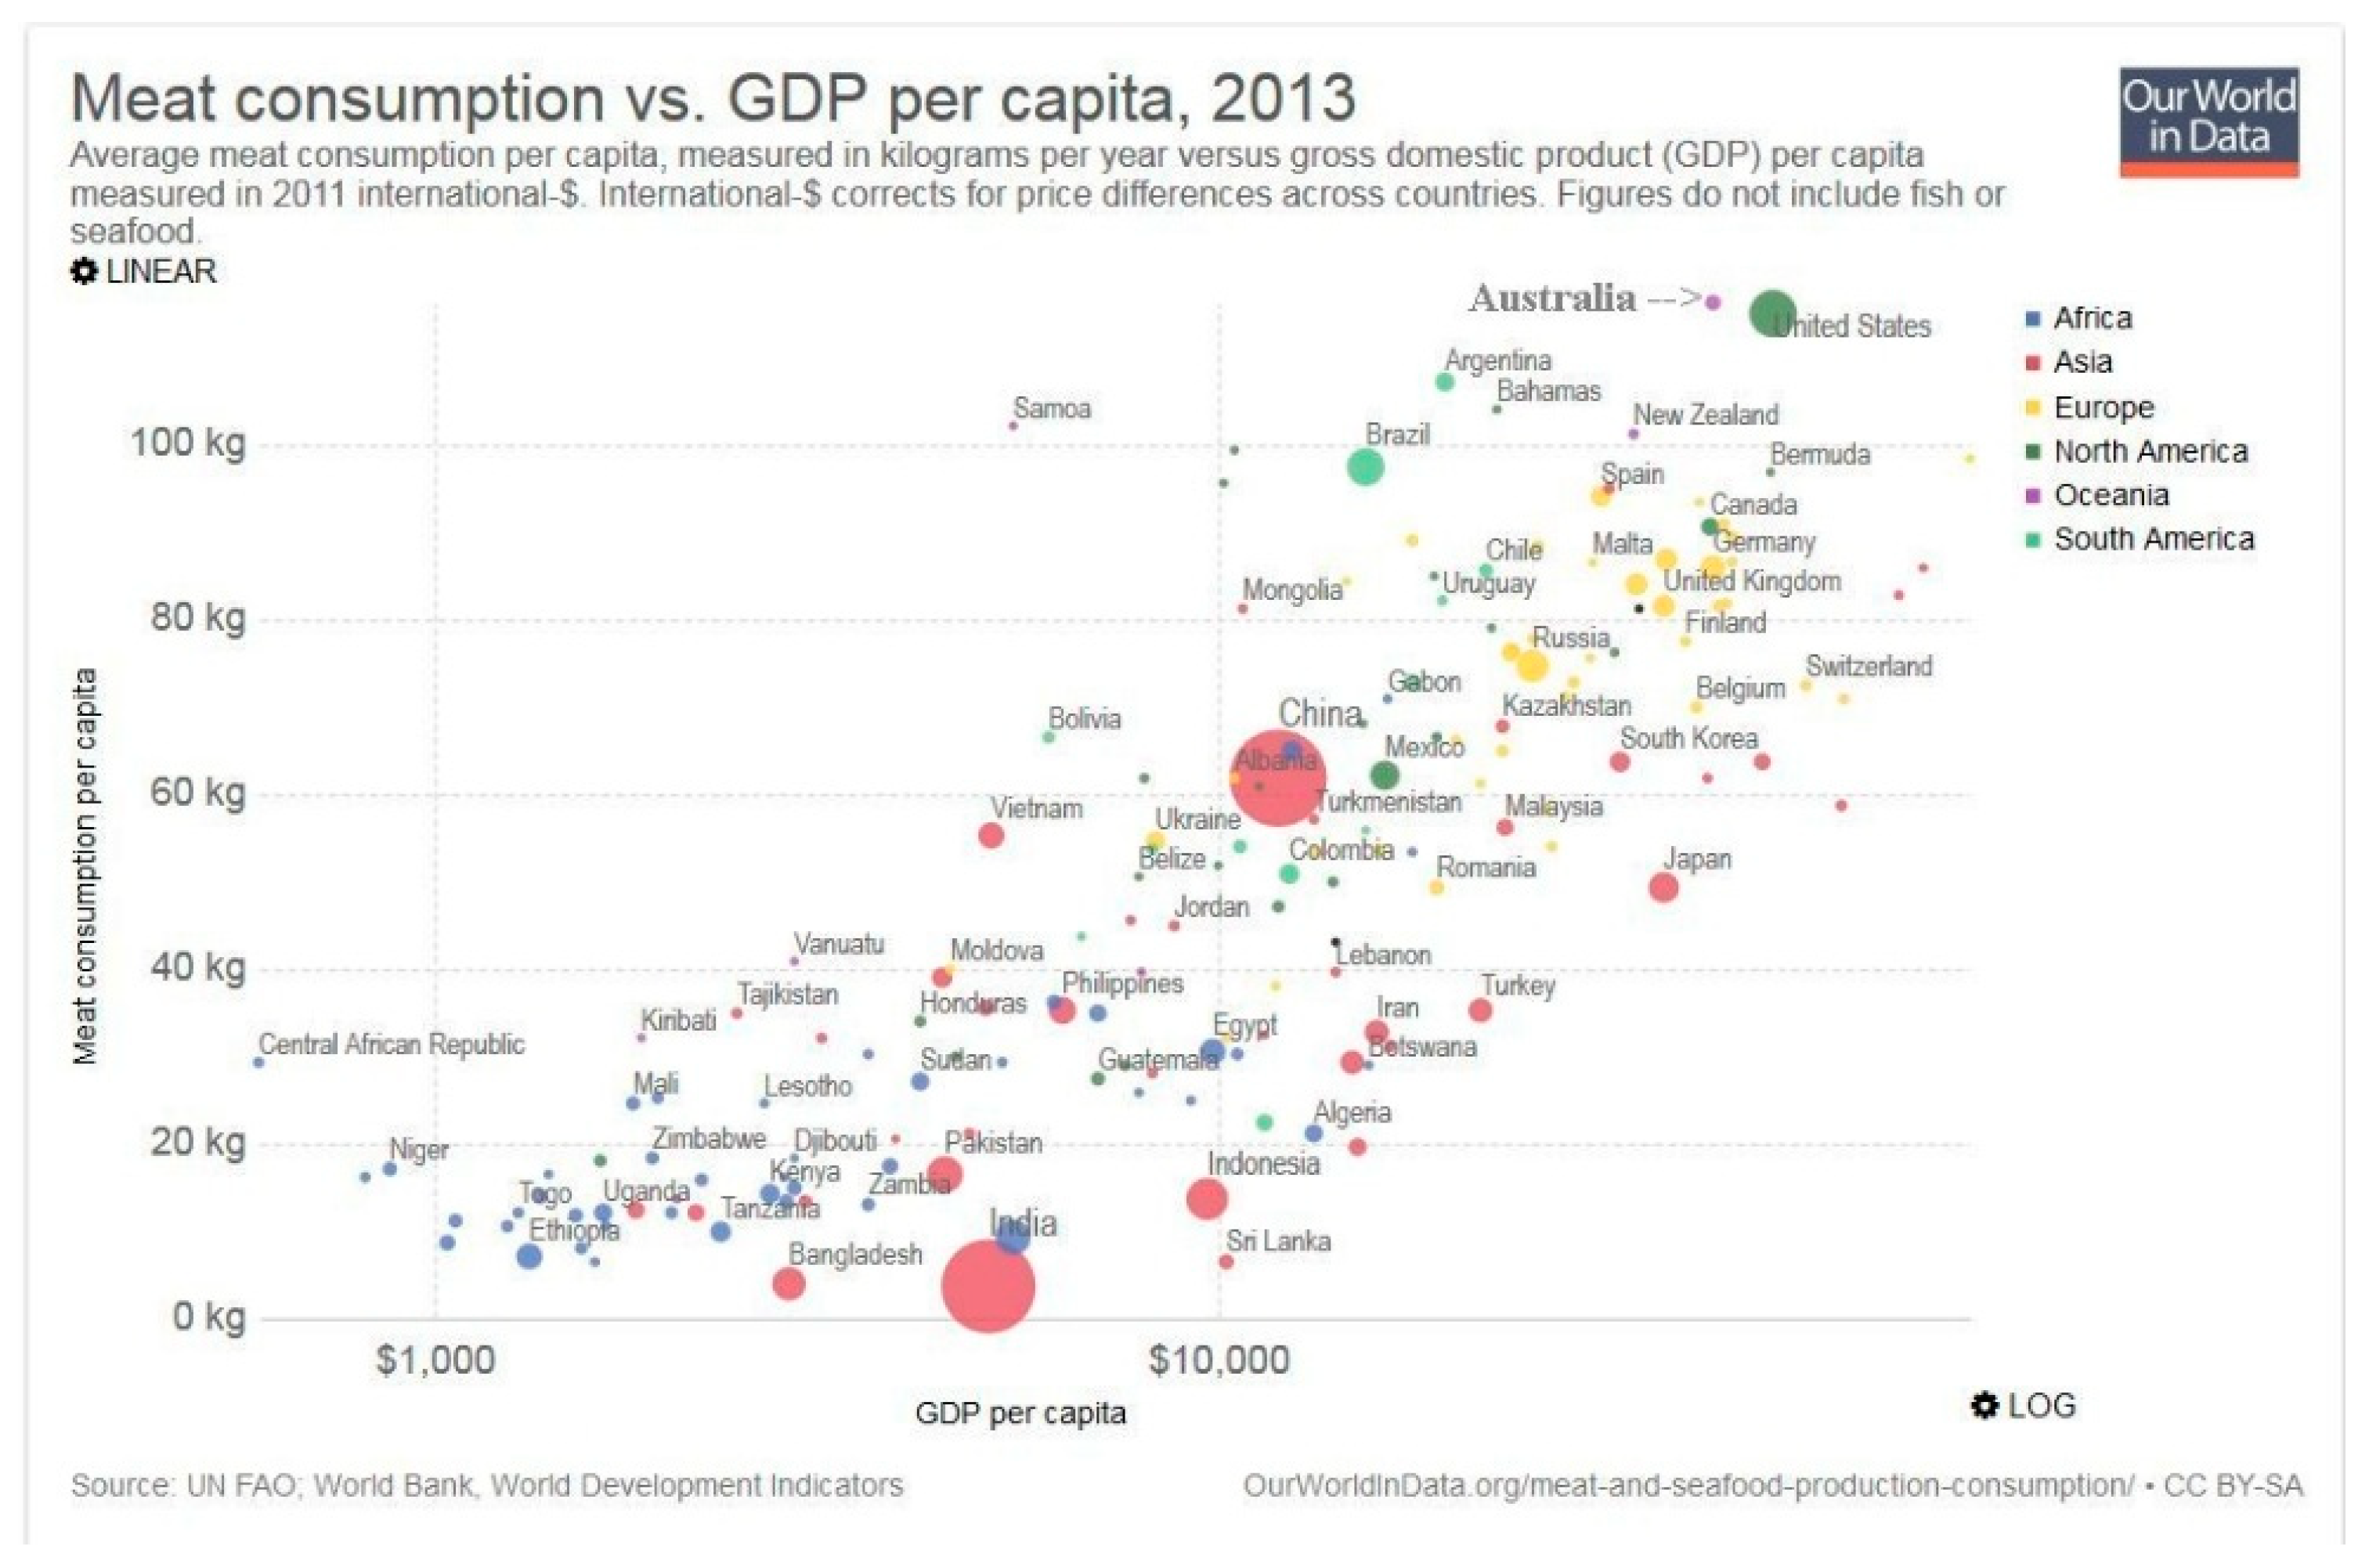
Figure 16.
Cancer rates from OWiD. Source - https://vermecology.wordpress.com/2020/05/27/realms-of-the-soil/.
Figure 16.
Cancer rates from OWiD. Source - https://vermecology.wordpress.com/2020/05/27/realms-of-the-soil/.
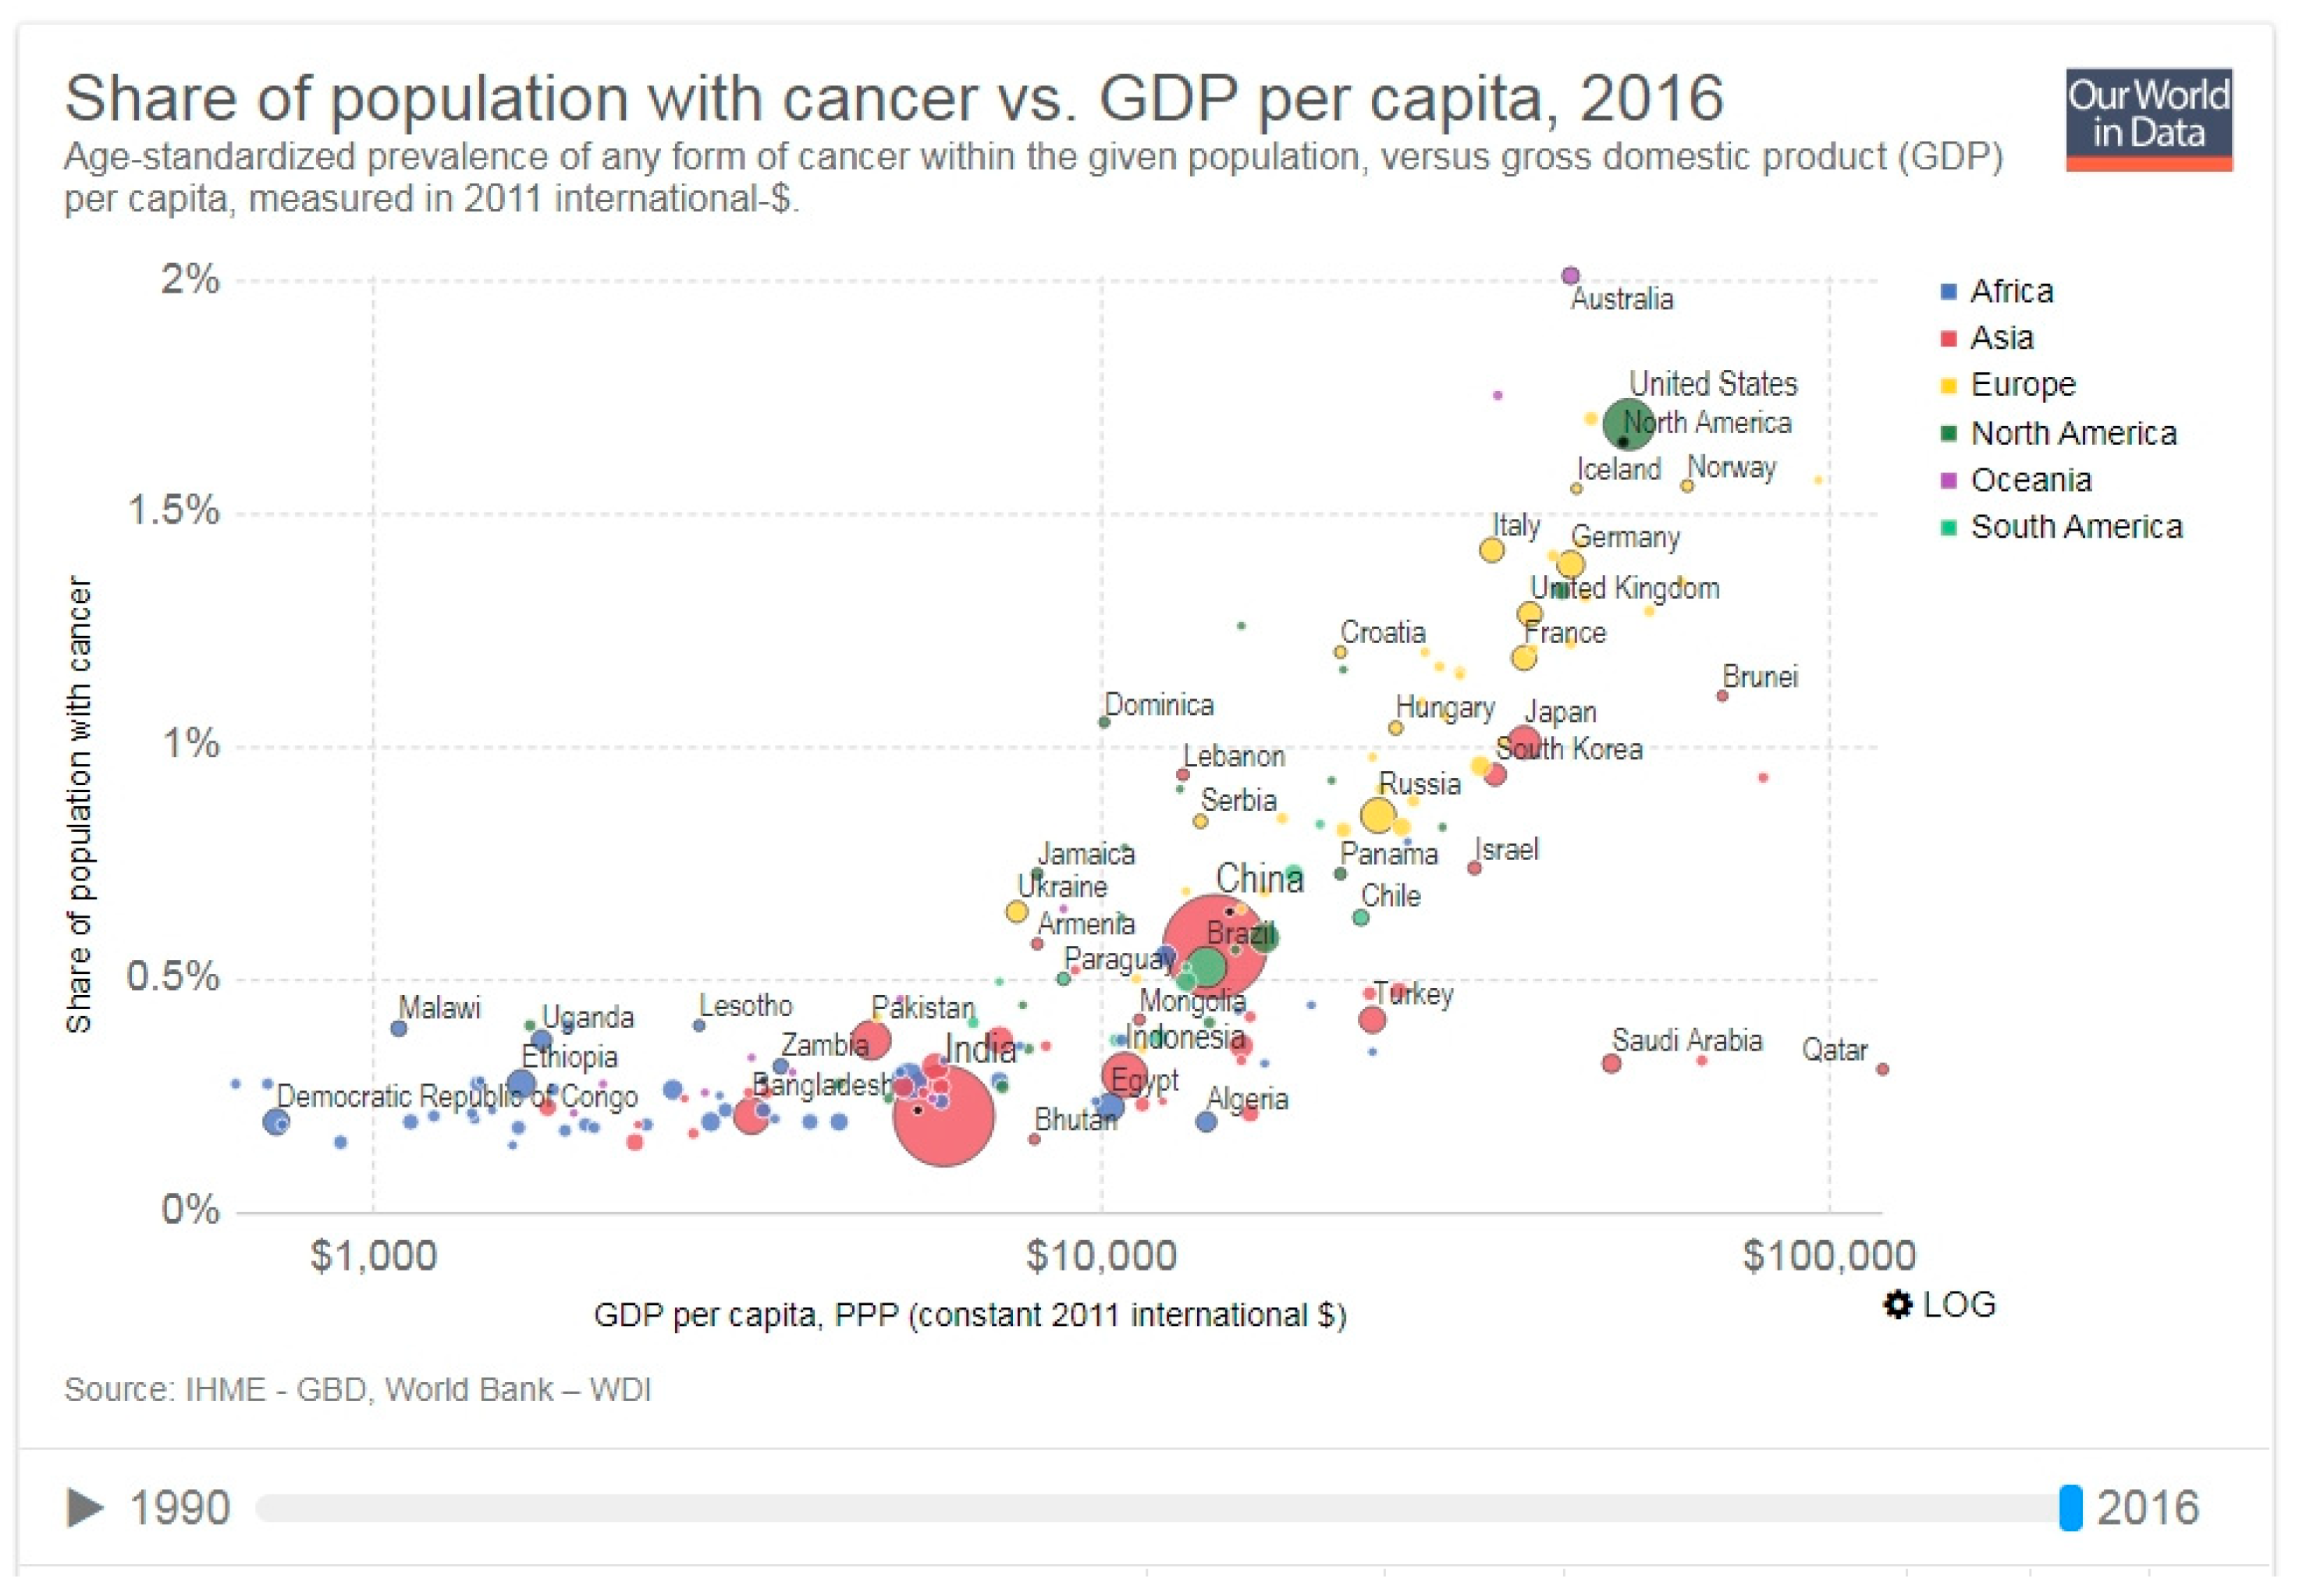
Figure 17.
Conventional global areas and agricultural production from OWiD. Source - https://ourworldindata.org/global-land-for-agriculture.
Figure 17.
Conventional global areas and agricultural production from OWiD. Source - https://ourworldindata.org/global-land-for-agriculture.
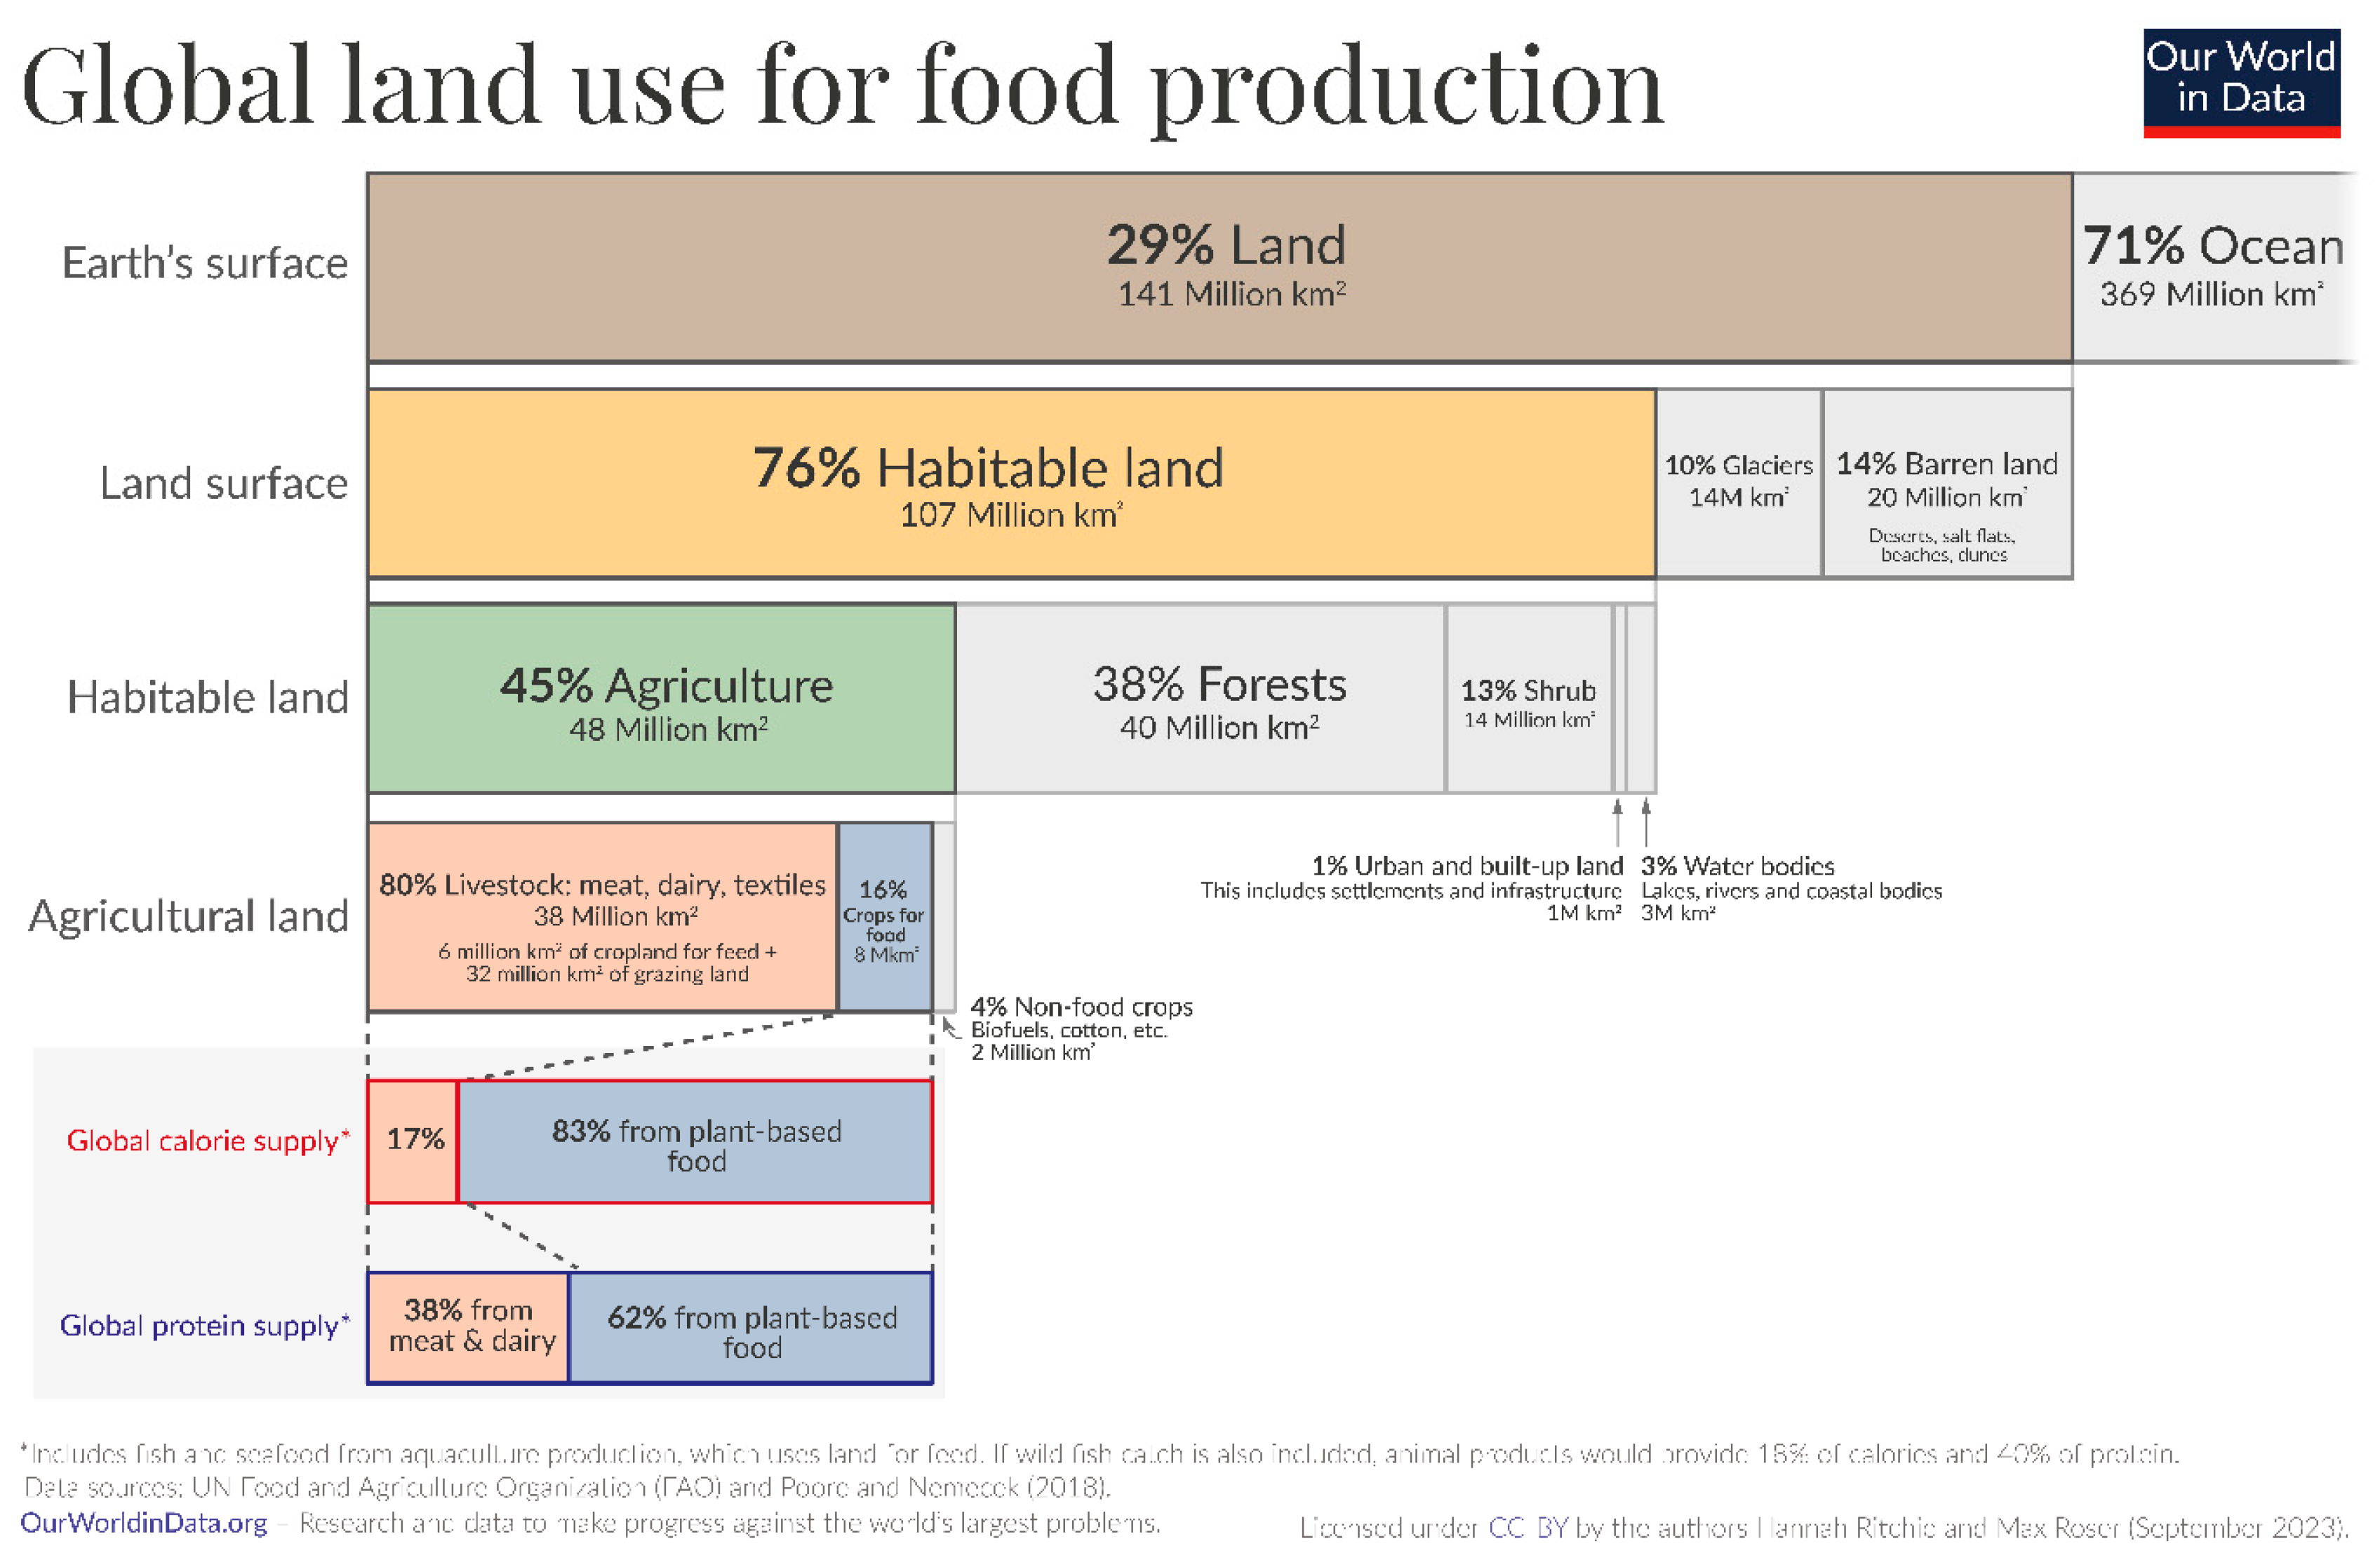
Figure 18.
Fertilizer and biocide use increased dramatically from in 1960s (cf. Figure 10). Source - https://vermecology.wordpress.com/2018/05/27/wormageddon-destruction-in-our-soils/.
Figure 18.
Fertilizer and biocide use increased dramatically from in 1960s (cf. Figure 10). Source - https://vermecology.wordpress.com/2018/05/27/wormageddon-destruction-in-our-soils/.
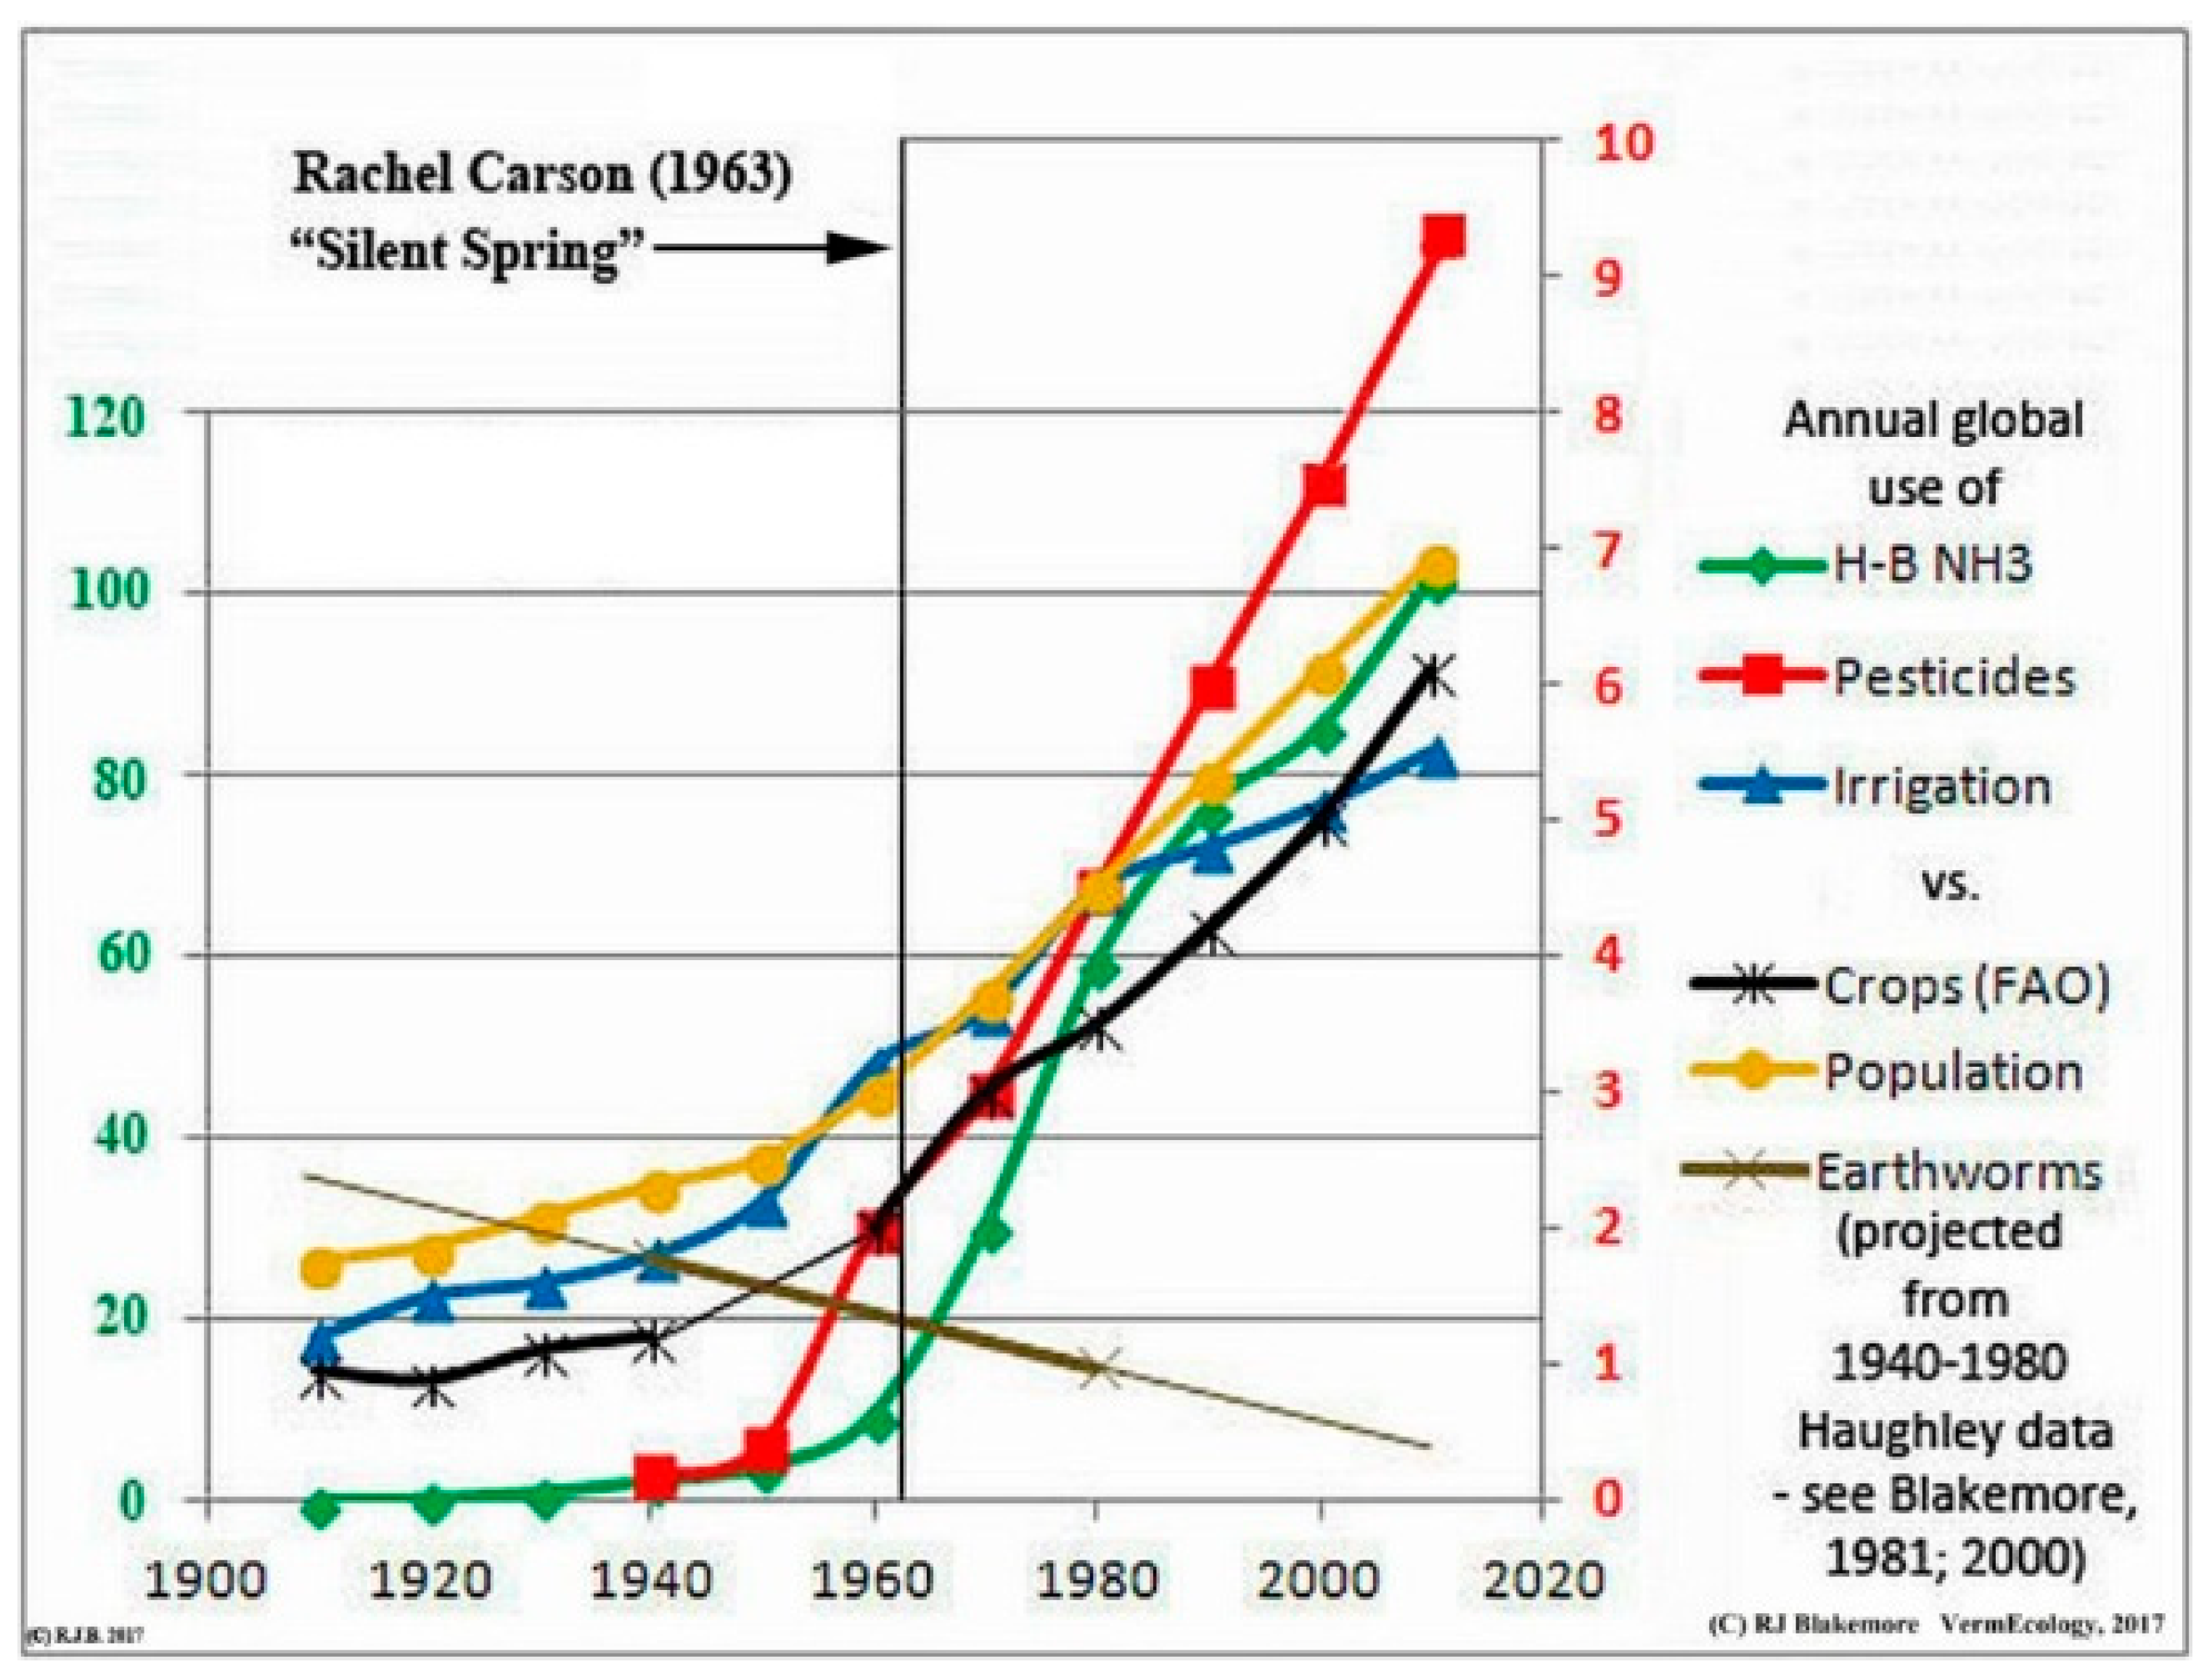
Figure 19.
Tiple yields (+200%) correlate more with doubled irrigation (100%) than 9x synthetic N fertilizer use (and excess biocides). Source - IPCC (2019a: Fig. SPM.1D).
Figure 19.
Tiple yields (+200%) correlate more with doubled irrigation (100%) than 9x synthetic N fertilizer use (and excess biocides). Source - IPCC (2019a: Fig. SPM.1D).
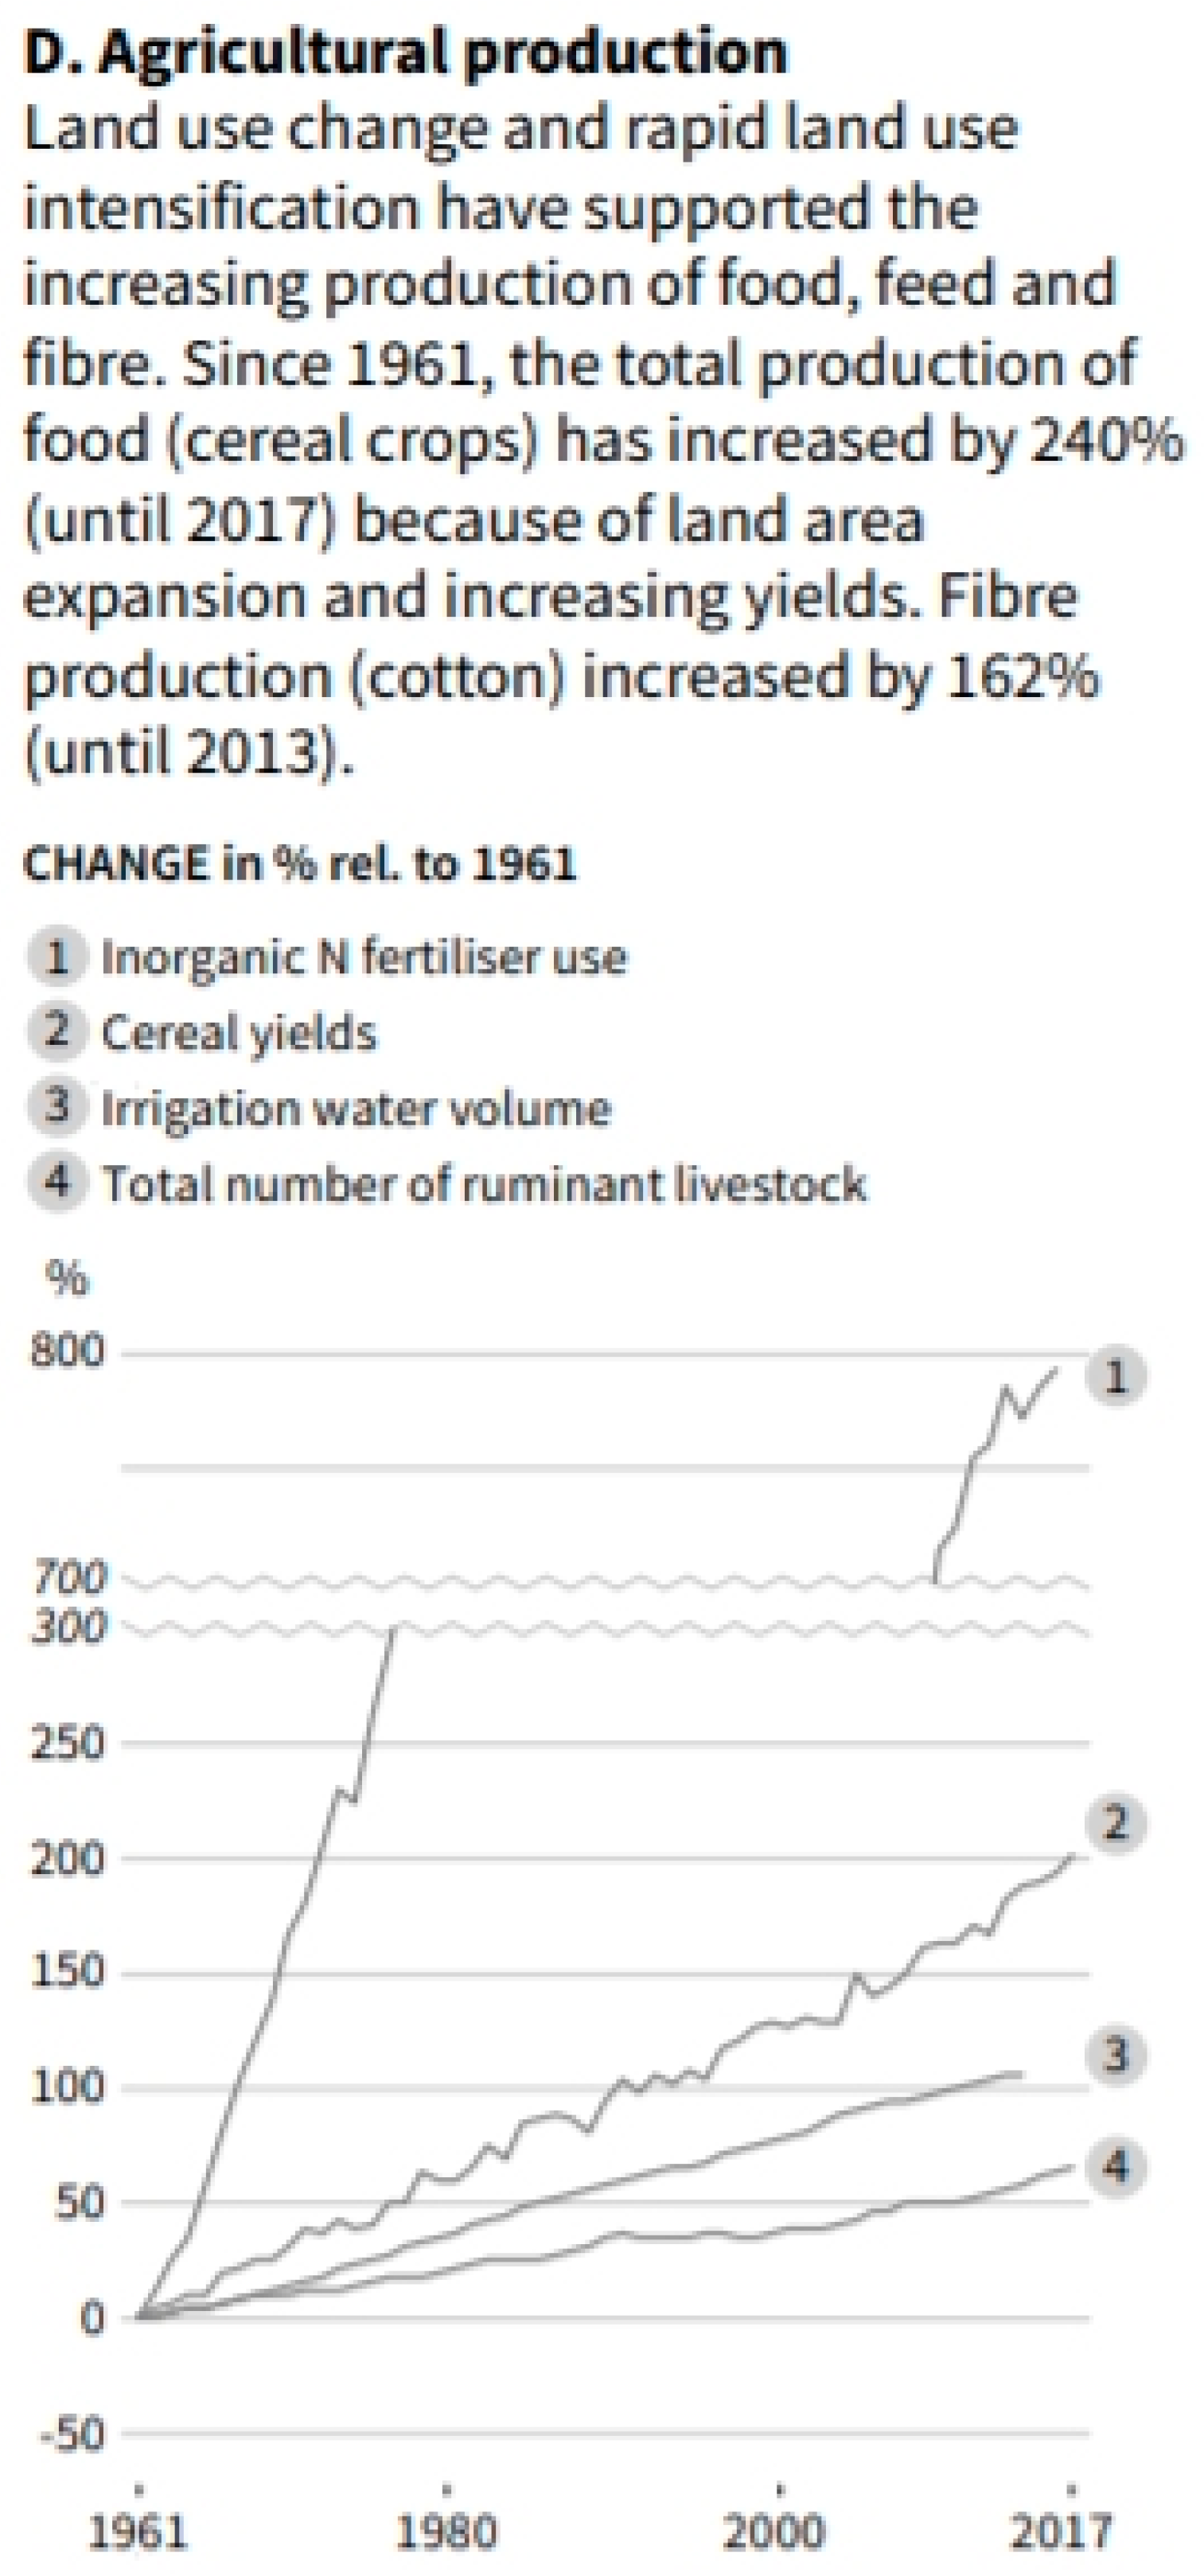
Figure 20.
Source Rodale information booklet - https://web.archive.org/web/20240406000719/https://forainitiative.org/wp-content/uploads/Rodale-Institute-The-Power-of-the-Plate-The-Case-for-Regenerative-Organic-Agriculture-in-Improving-Human-Health.pdf .
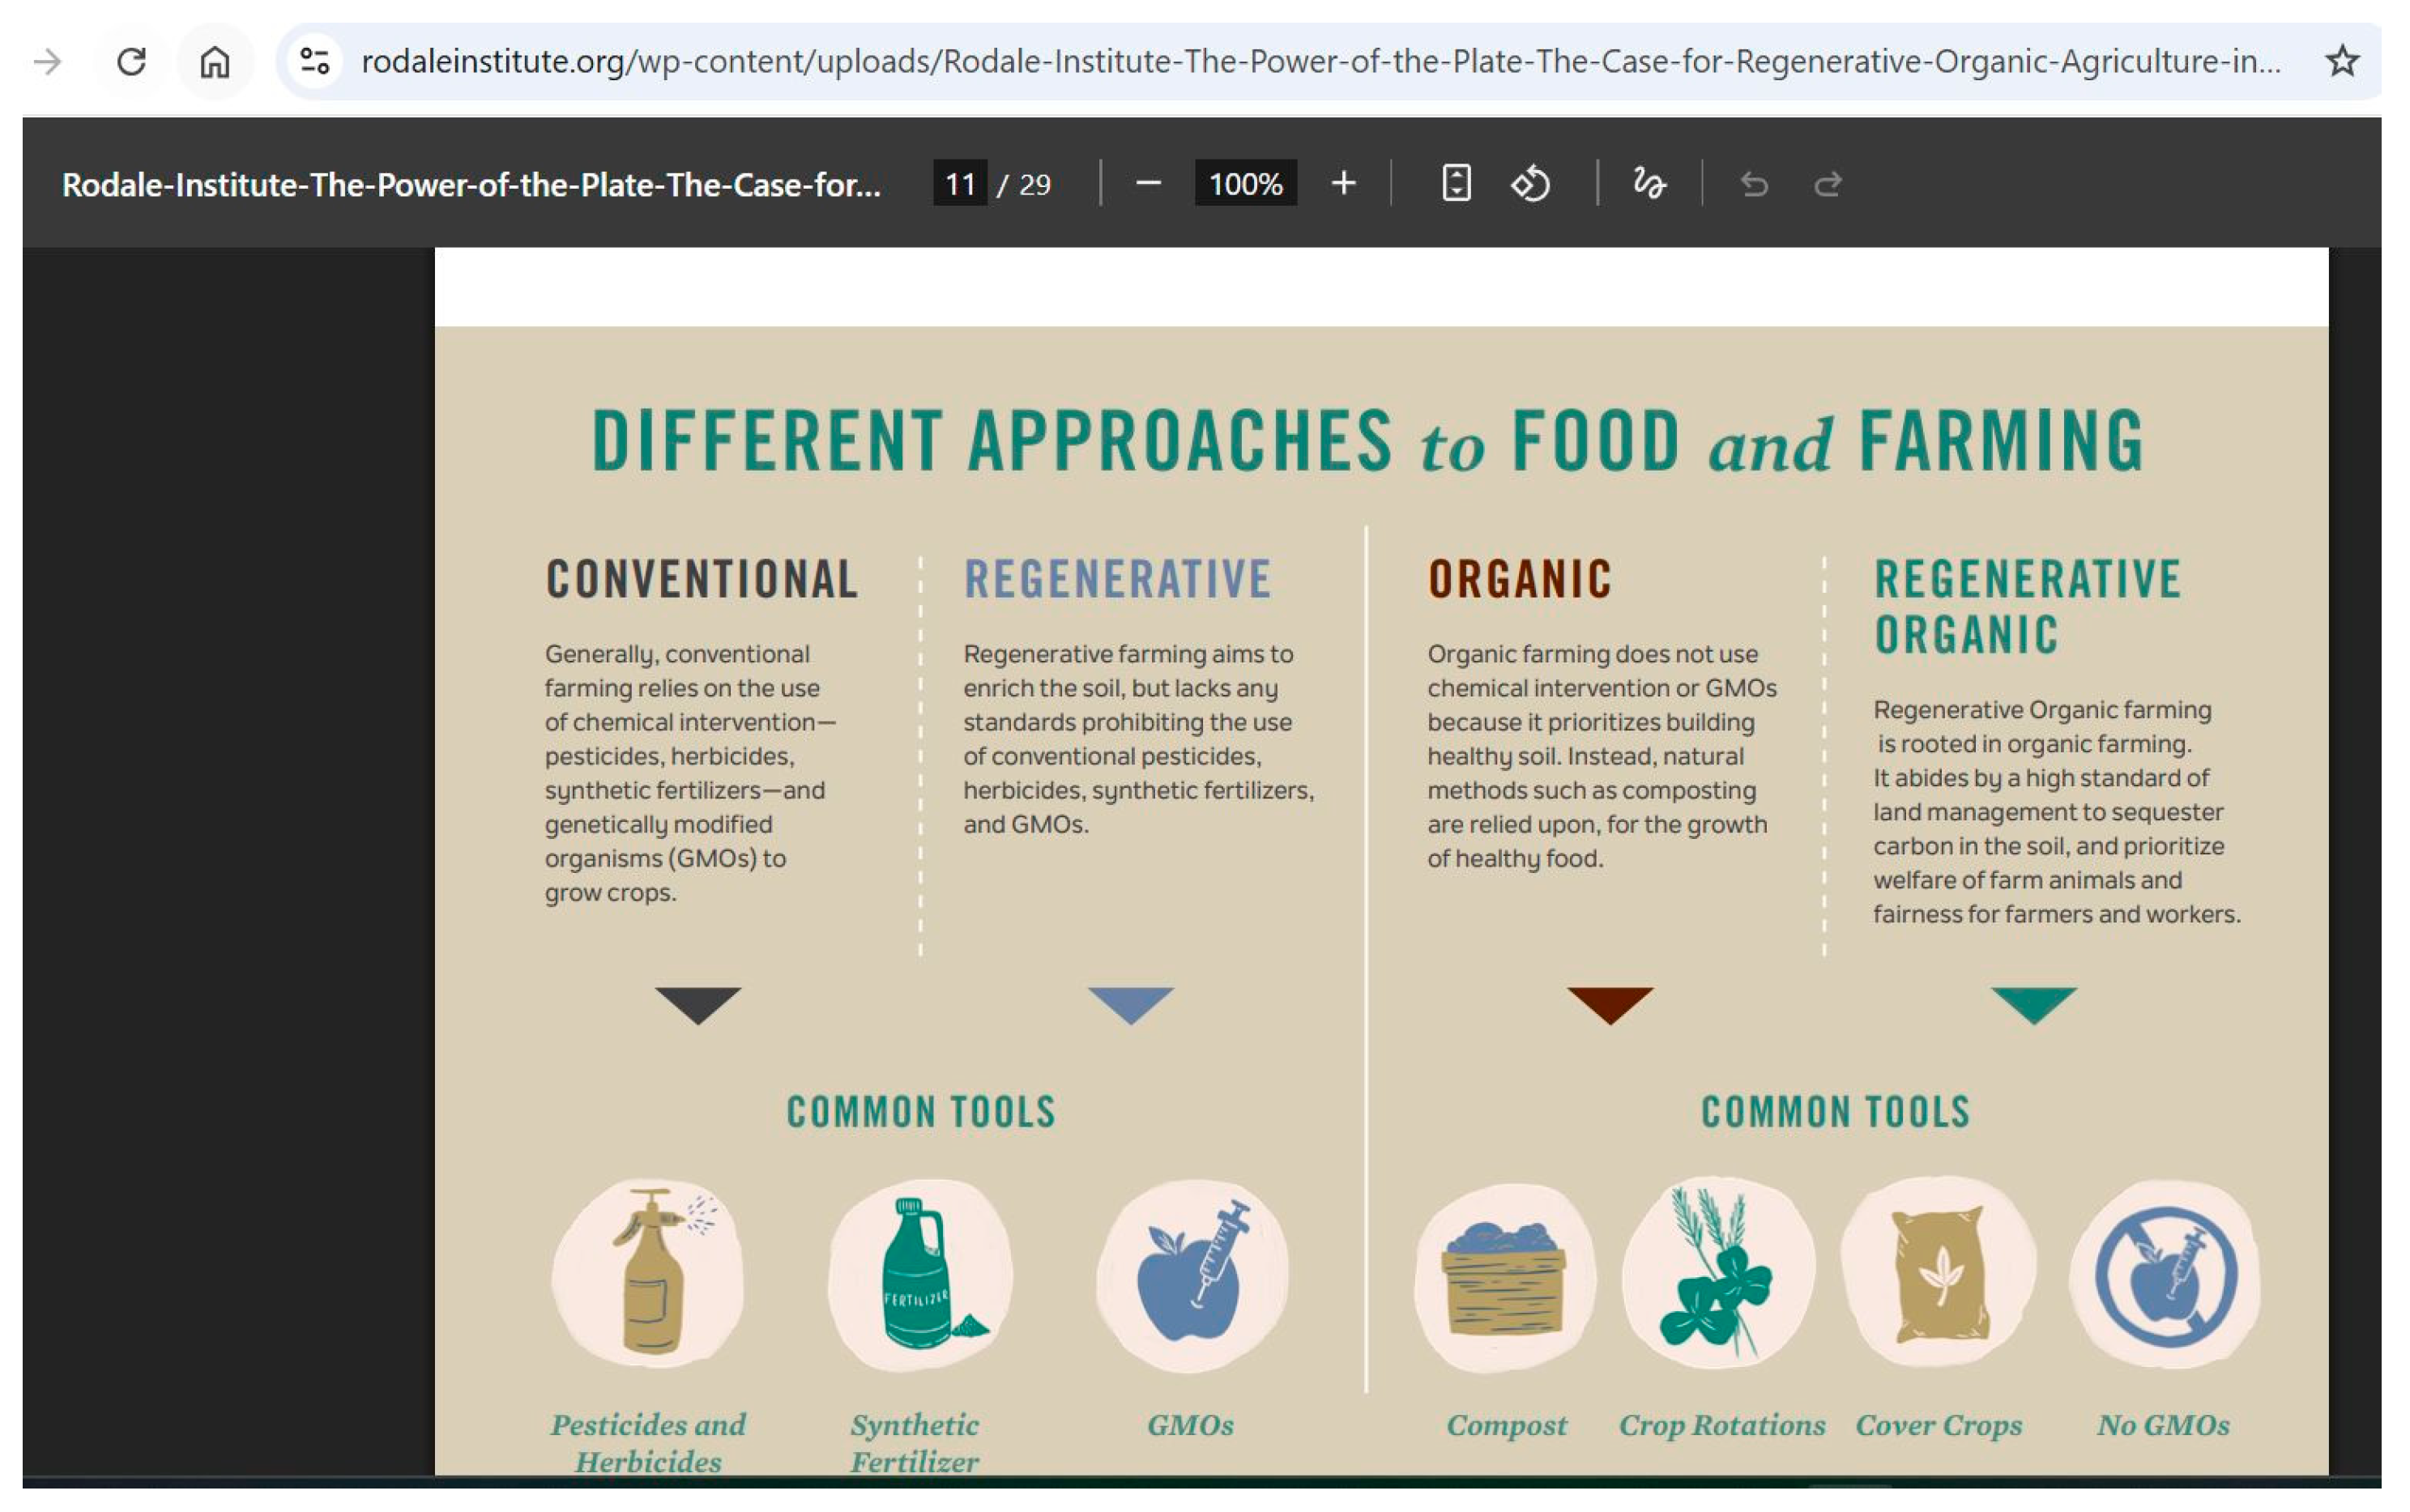
Figure 21.
Fertilizers are “organic” Farmyard Manure (FYM from non-organic stockyards) or chemical N-P-K. FYM at 35 t fresh material per hectare is equivalent to approx. 3.2 t organic C/ha/year. Source - Broadbalk mean long-term yields of winter wheat 1852-2022 Dataset - https://doi.org/10.23637/rbk1/meanWWYields1852-2022-03.
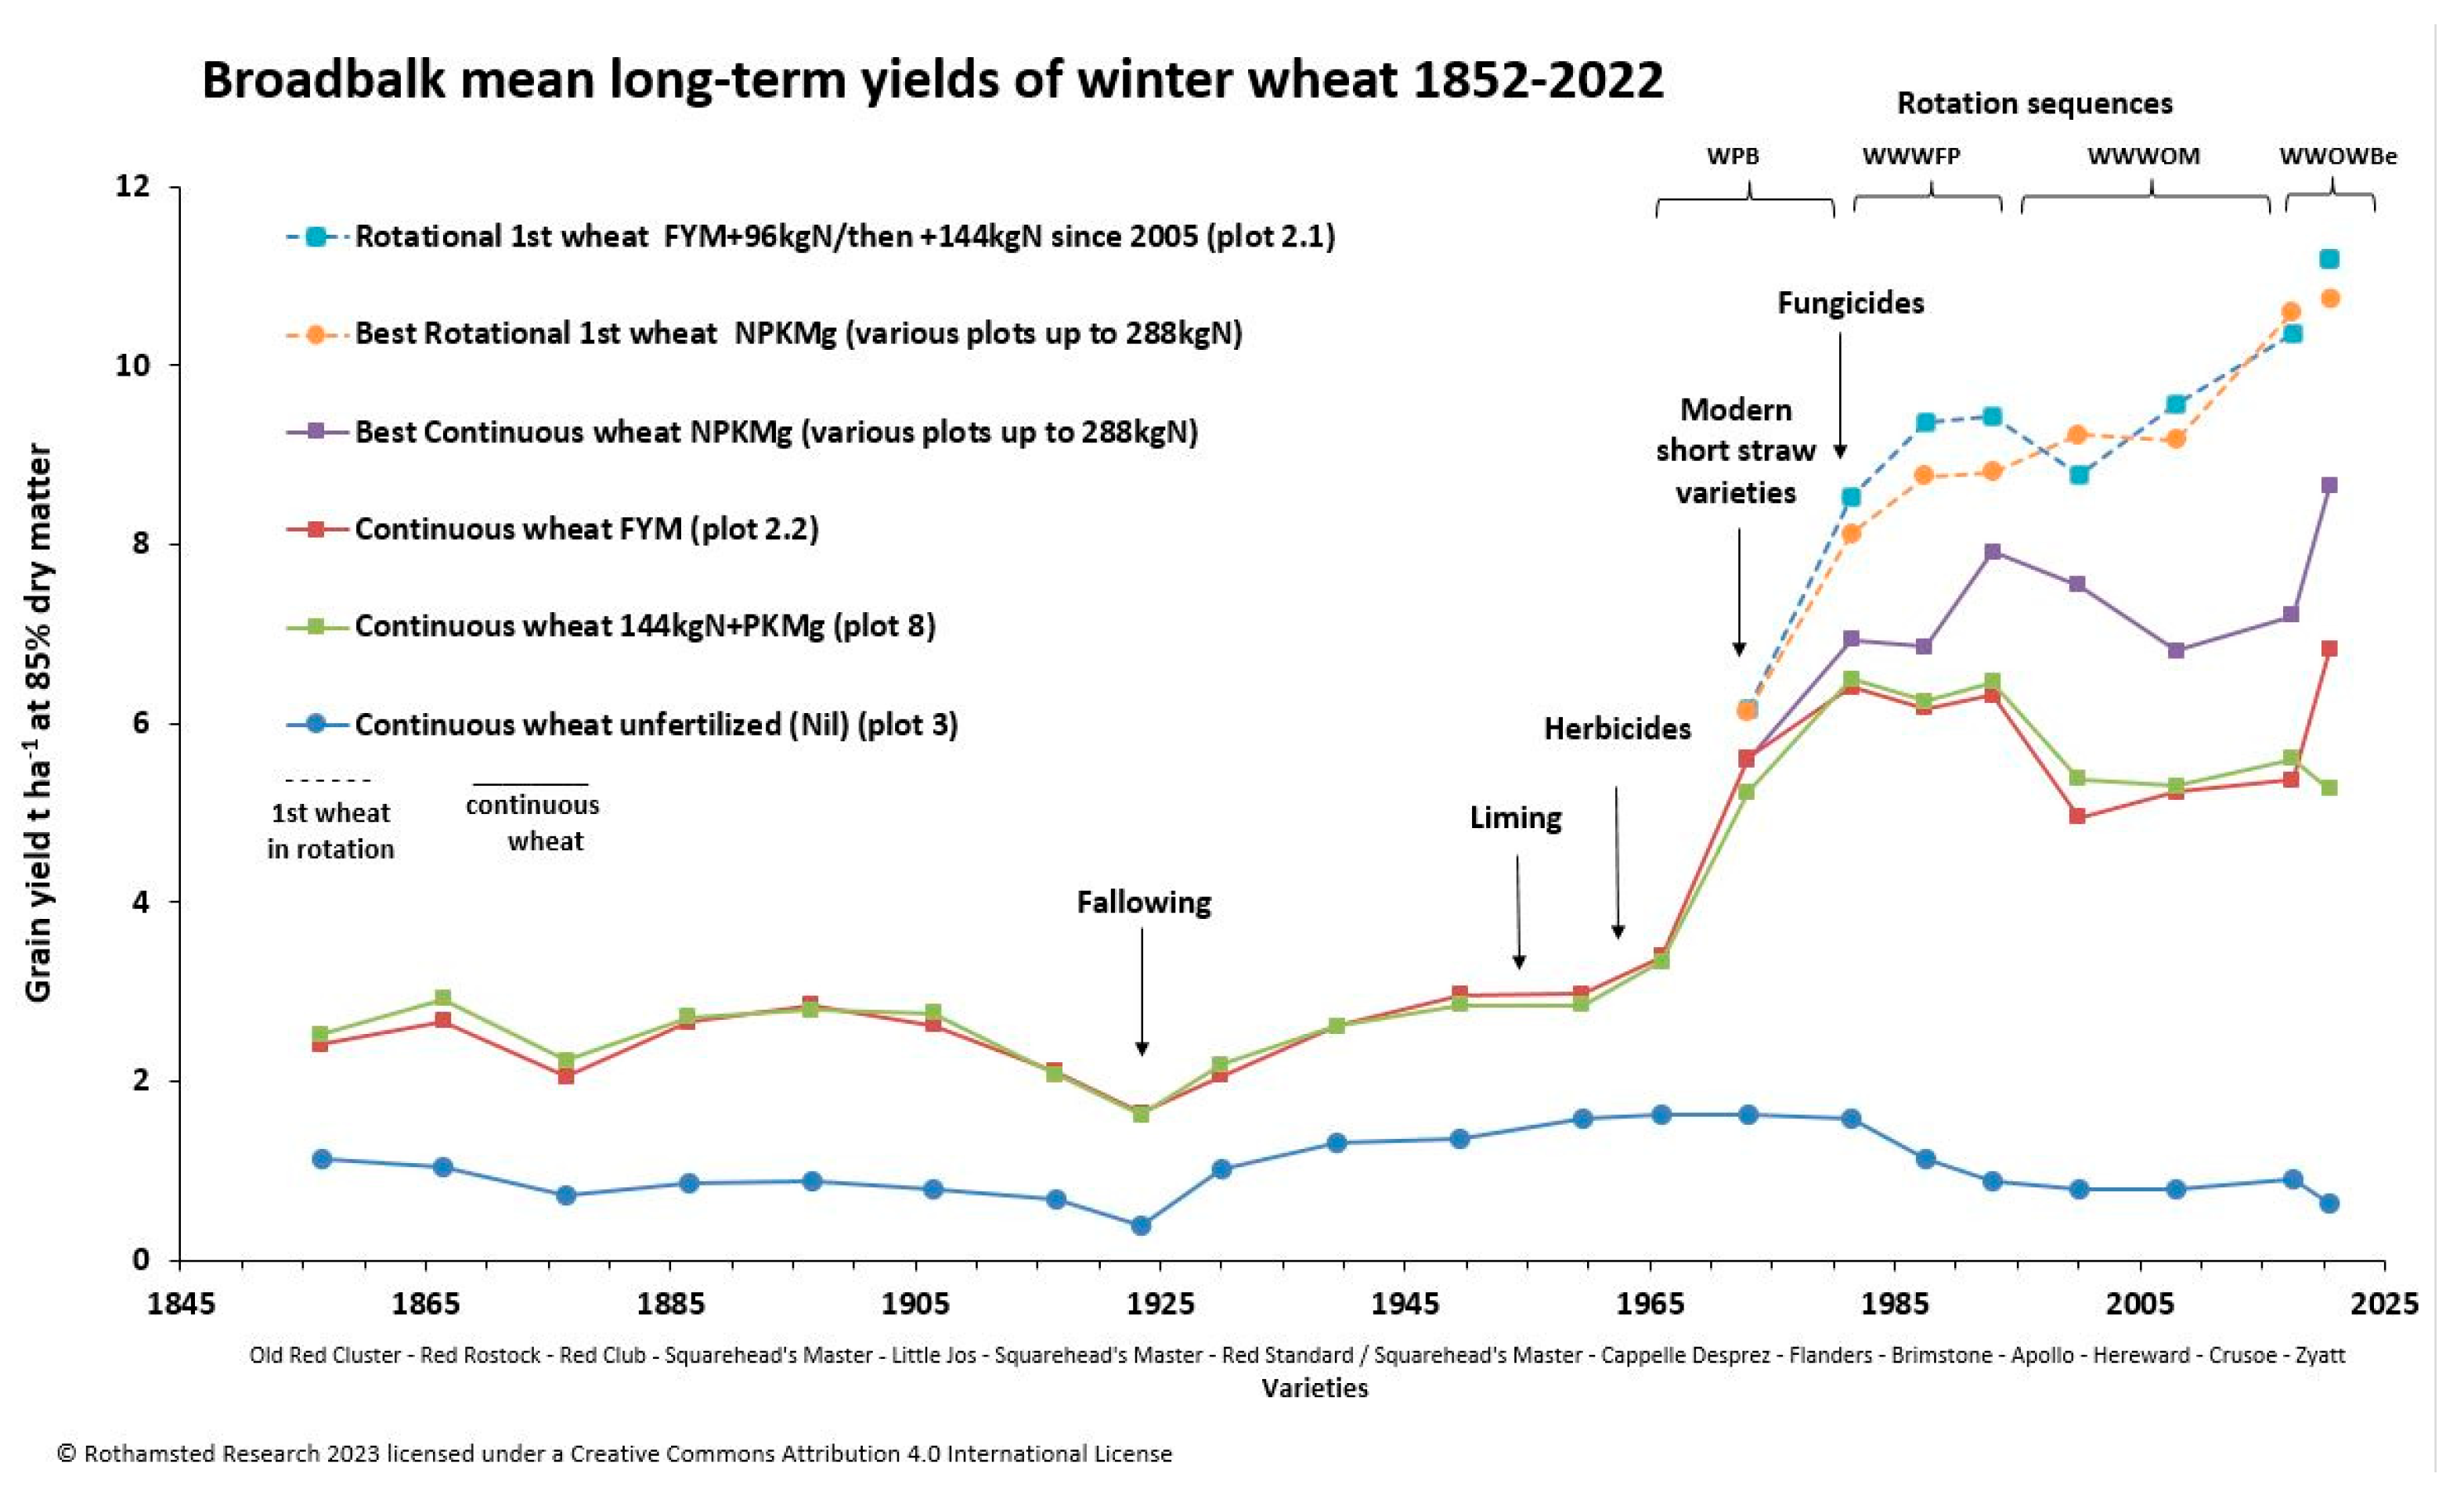
Figure 22.
Soil carbon from the fertilizer trial plots from Rothamsted Research (2021). Source: Broadbalk soil organic carbon content 1843-2015 Electronic Rothamsted Archive, Rothamsted Research, Harpenden, UK https://doi.org/10.23637/KeyRefOABKsoc-02.
Figure 22.
Soil carbon from the fertilizer trial plots from Rothamsted Research (2021). Source: Broadbalk soil organic carbon content 1843-2015 Electronic Rothamsted Archive, Rothamsted Research, Harpenden, UK https://doi.org/10.23637/KeyRefOABKsoc-02.
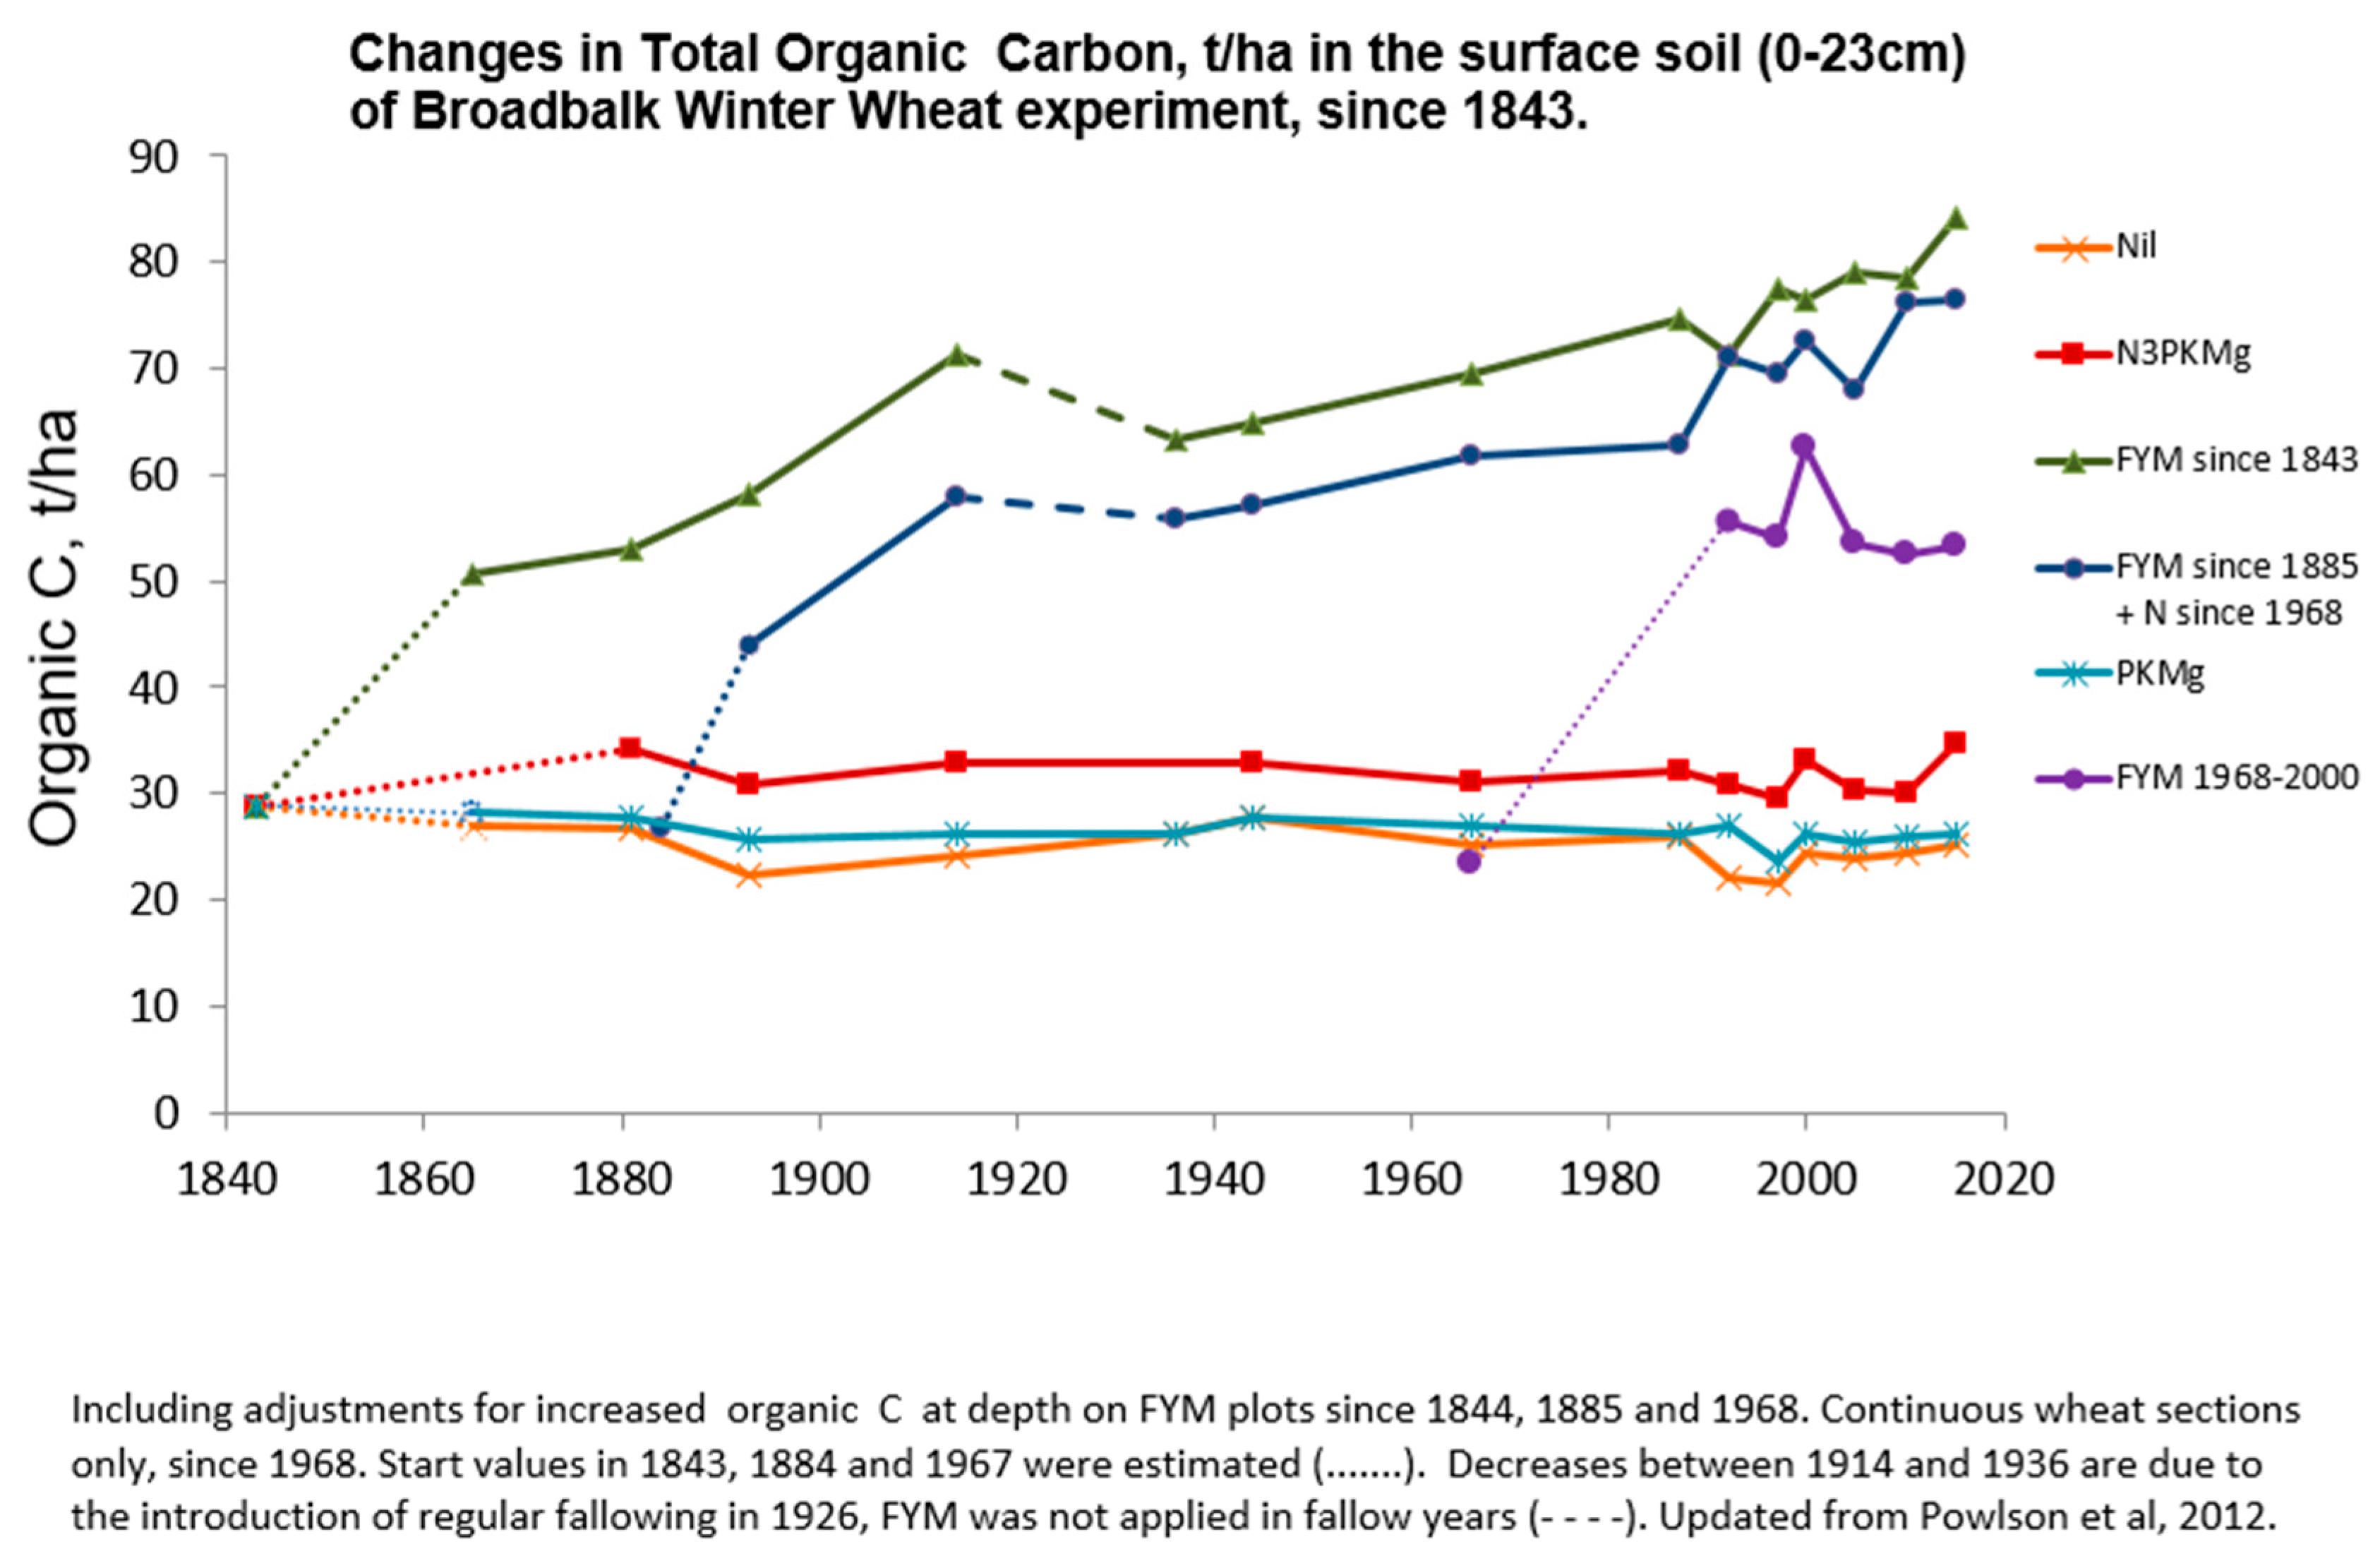
Figure 23.
Rothamsted’s Broadbalk rewilding carbon sequestration. Source – https://www.era.rothamsted.ac.uk/dataset/rbk1w/01-BKWoc.
Figure 23.
Rothamsted’s Broadbalk rewilding carbon sequestration. Source – https://www.era.rothamsted.ac.uk/dataset/rbk1w/01-BKWoc.
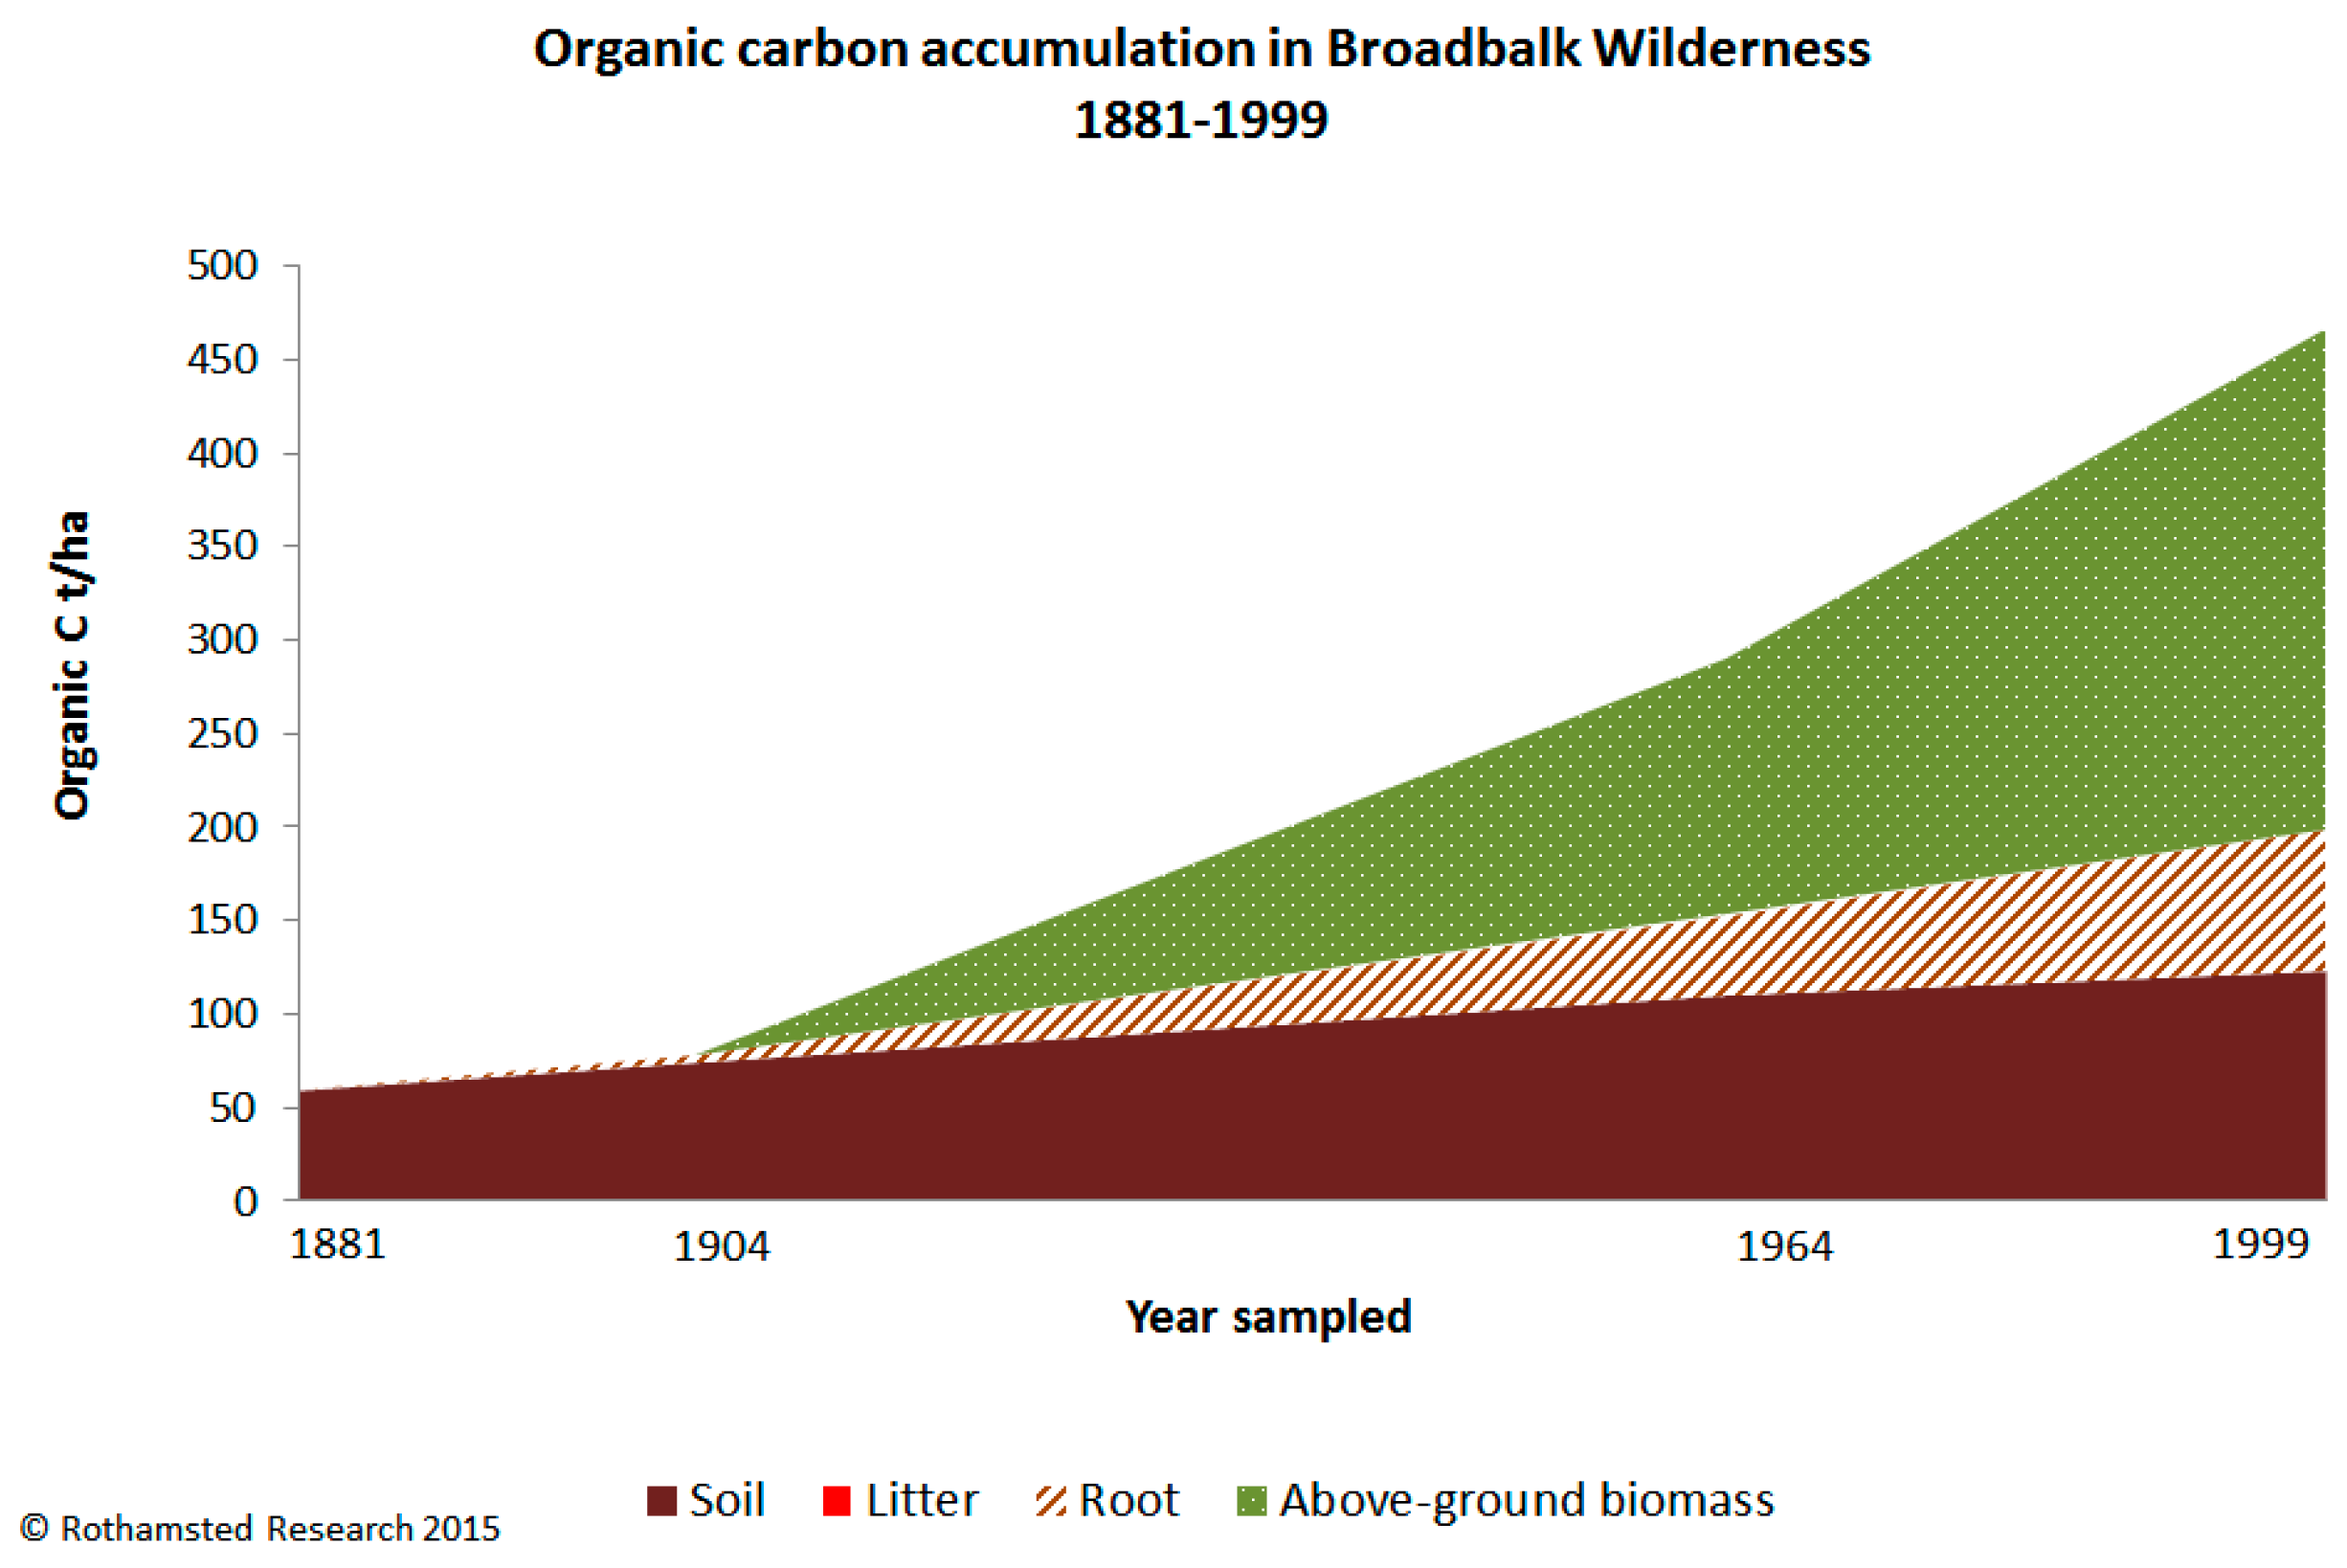
Figure 24.
Mineral decline in grain for three Broadbalk plots (Nil control, plot 3; NPK, plot 7; and FYM plot 2.2 or 2b they list as “22”) with the open circles and black lines for FYM. Source - https://www.rothamsted.ac.uk/article/fact-or-fake-news-our-food-becoming-less-nutritious .
Figure 24.
Mineral decline in grain for three Broadbalk plots (Nil control, plot 3; NPK, plot 7; and FYM plot 2.2 or 2b they list as “22”) with the open circles and black lines for FYM. Source - https://www.rothamsted.ac.uk/article/fact-or-fake-news-our-food-becoming-less-nutritious .
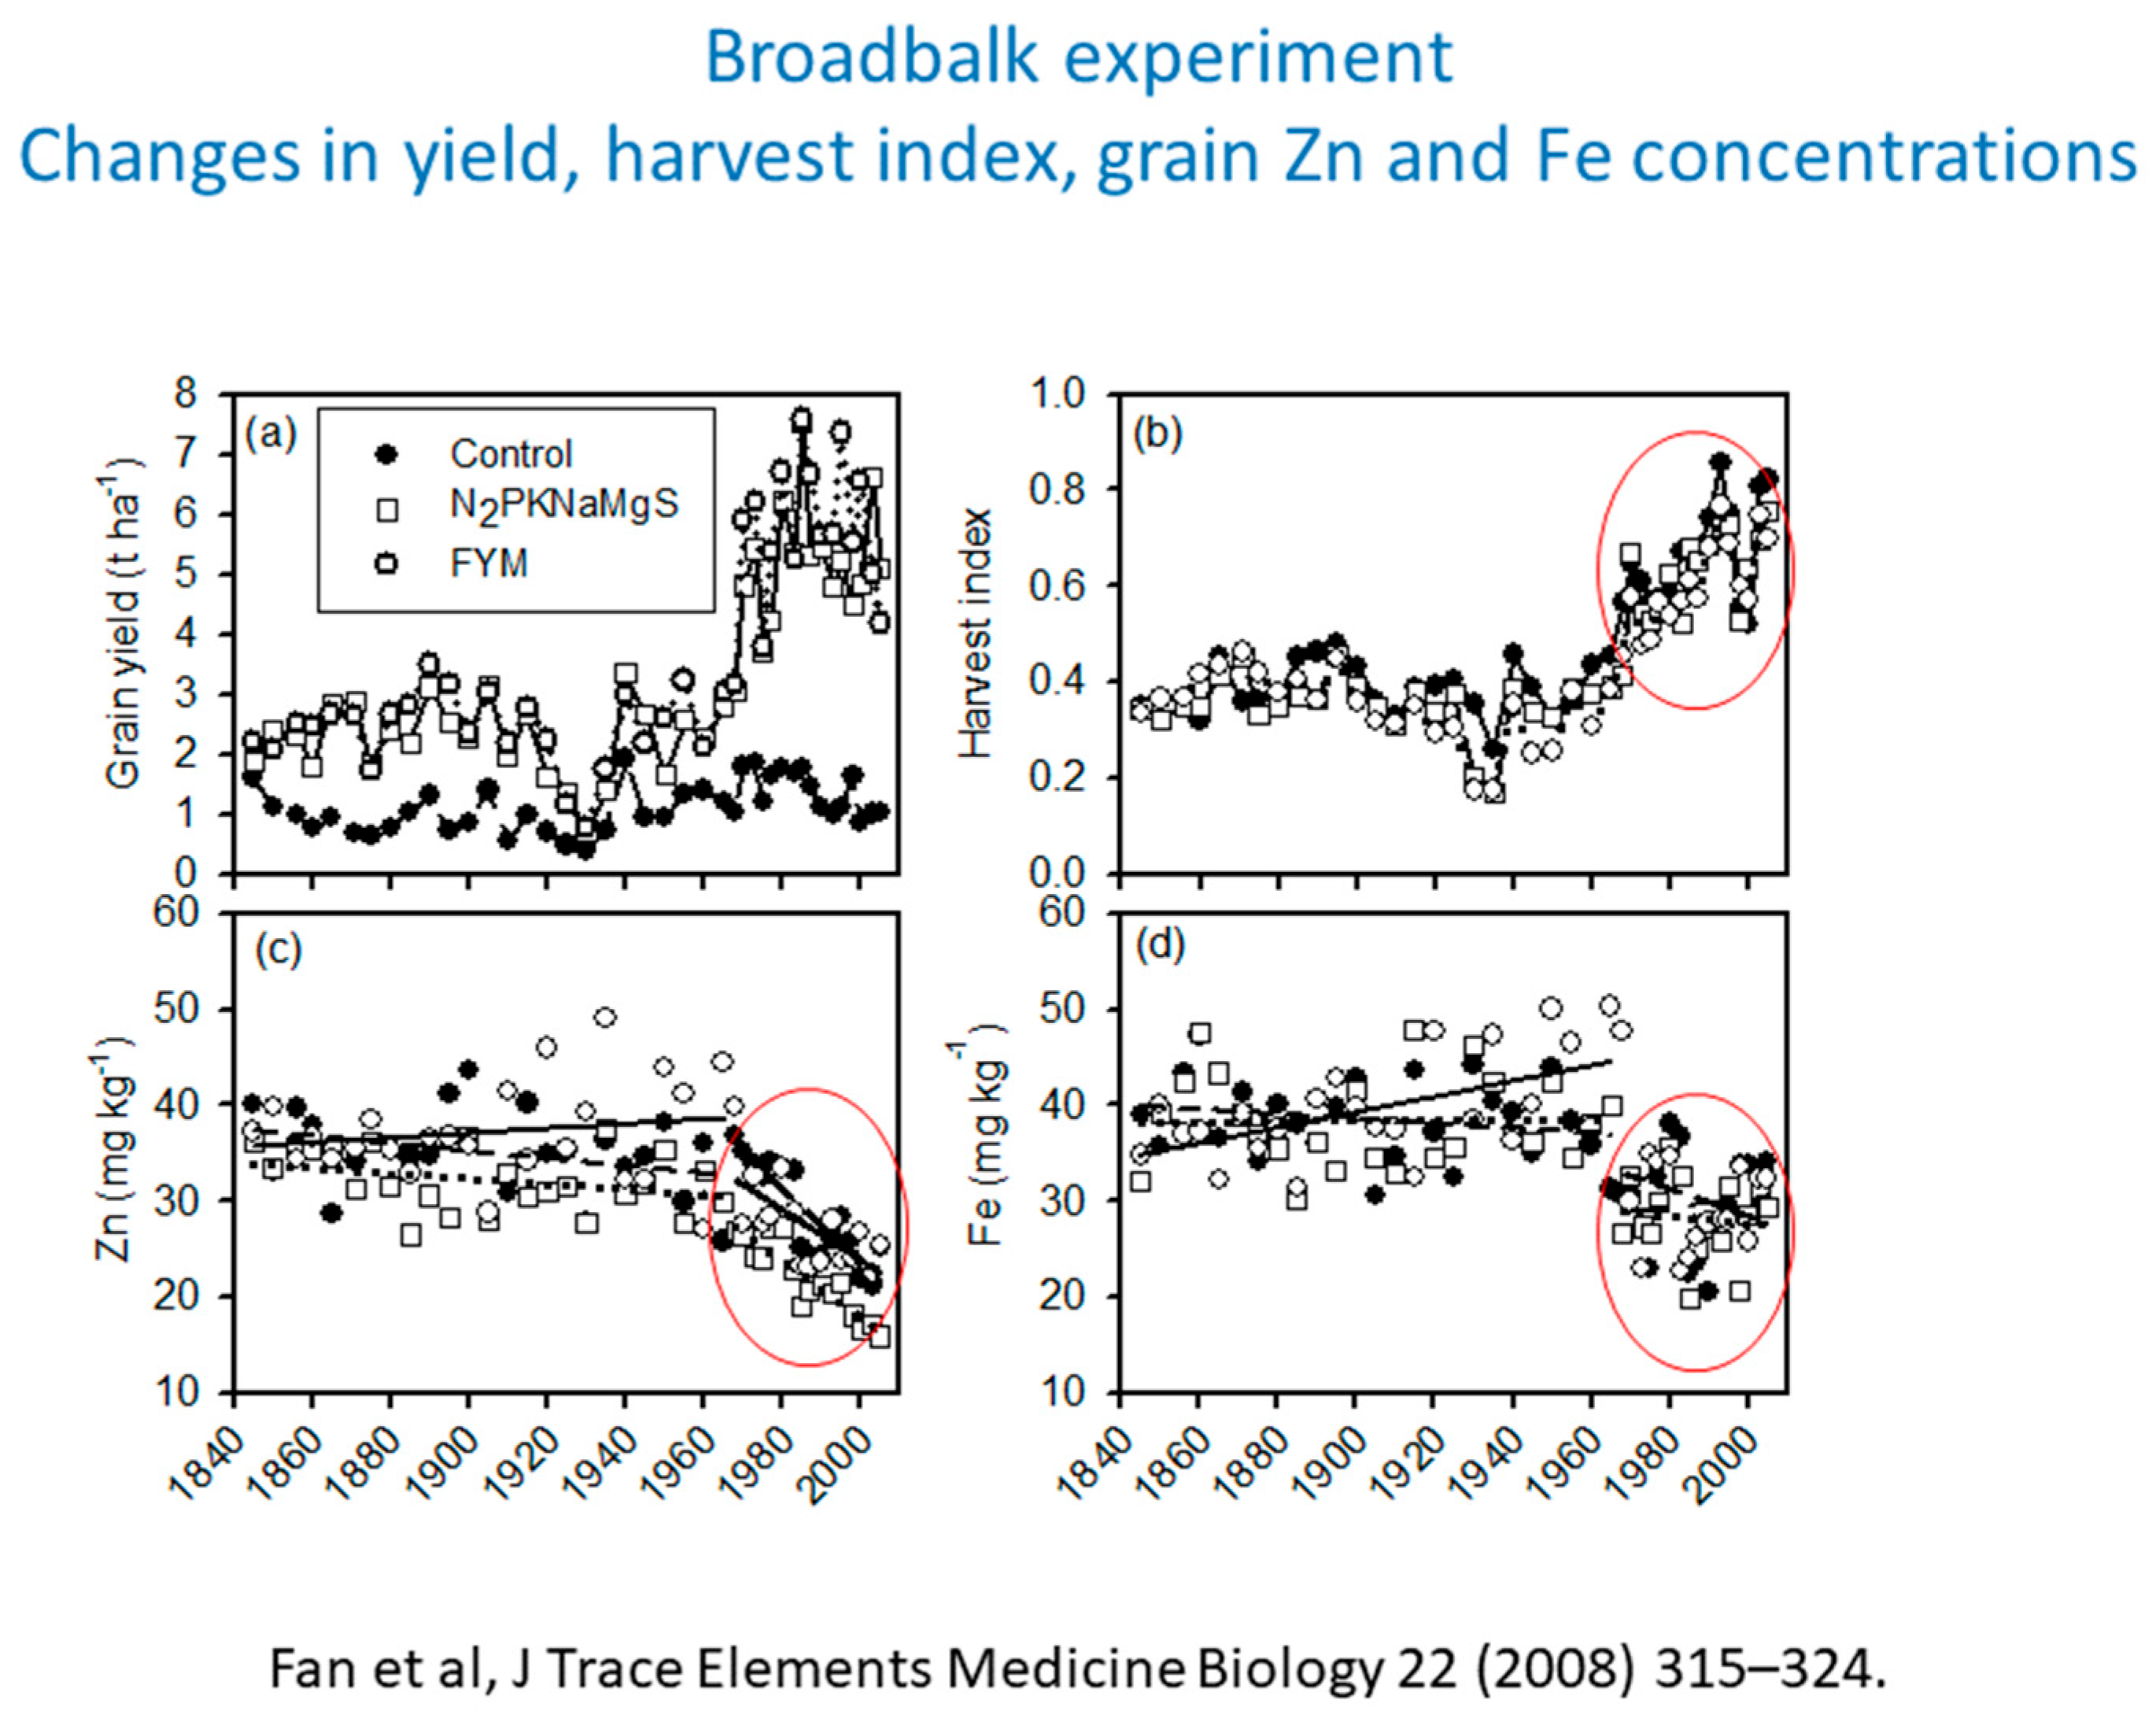
Figure 25.
Rothamsted temperatures with trend lines. Source - Blakemore (2018: Figure 11).
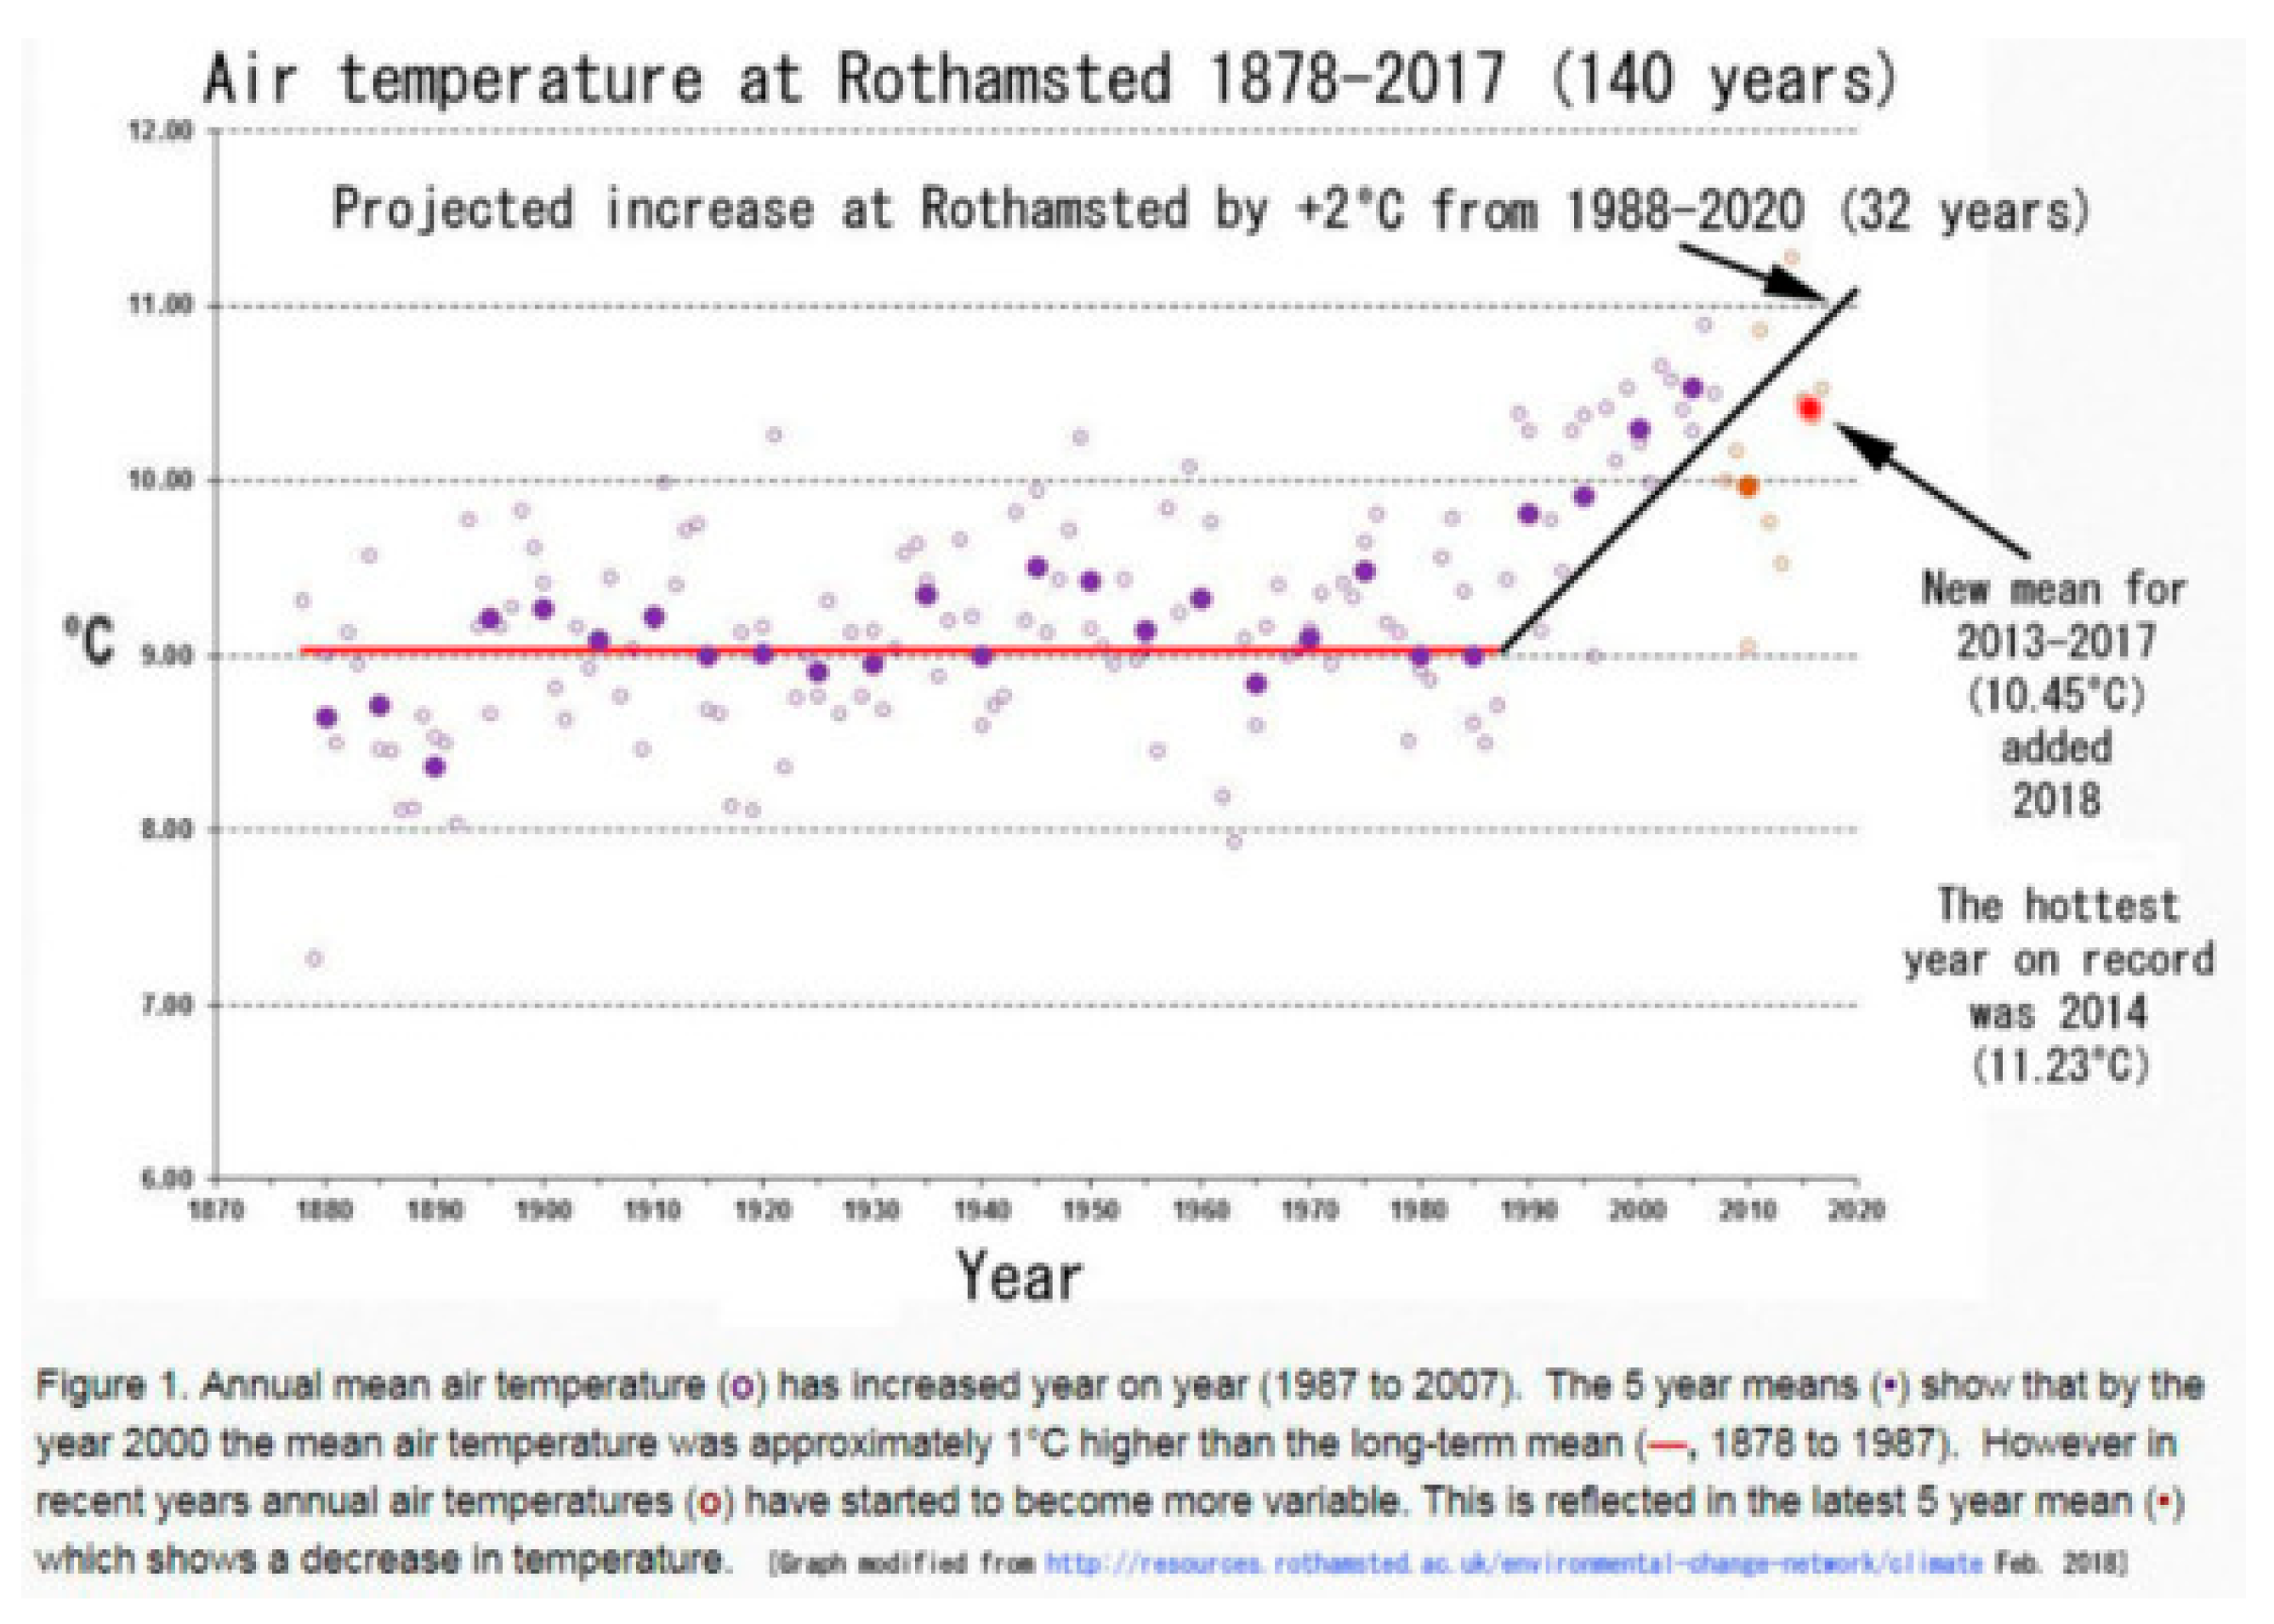
Figure 26.
Status of invertebrates and earthworms (Oligochaeta). From Morris (1927).
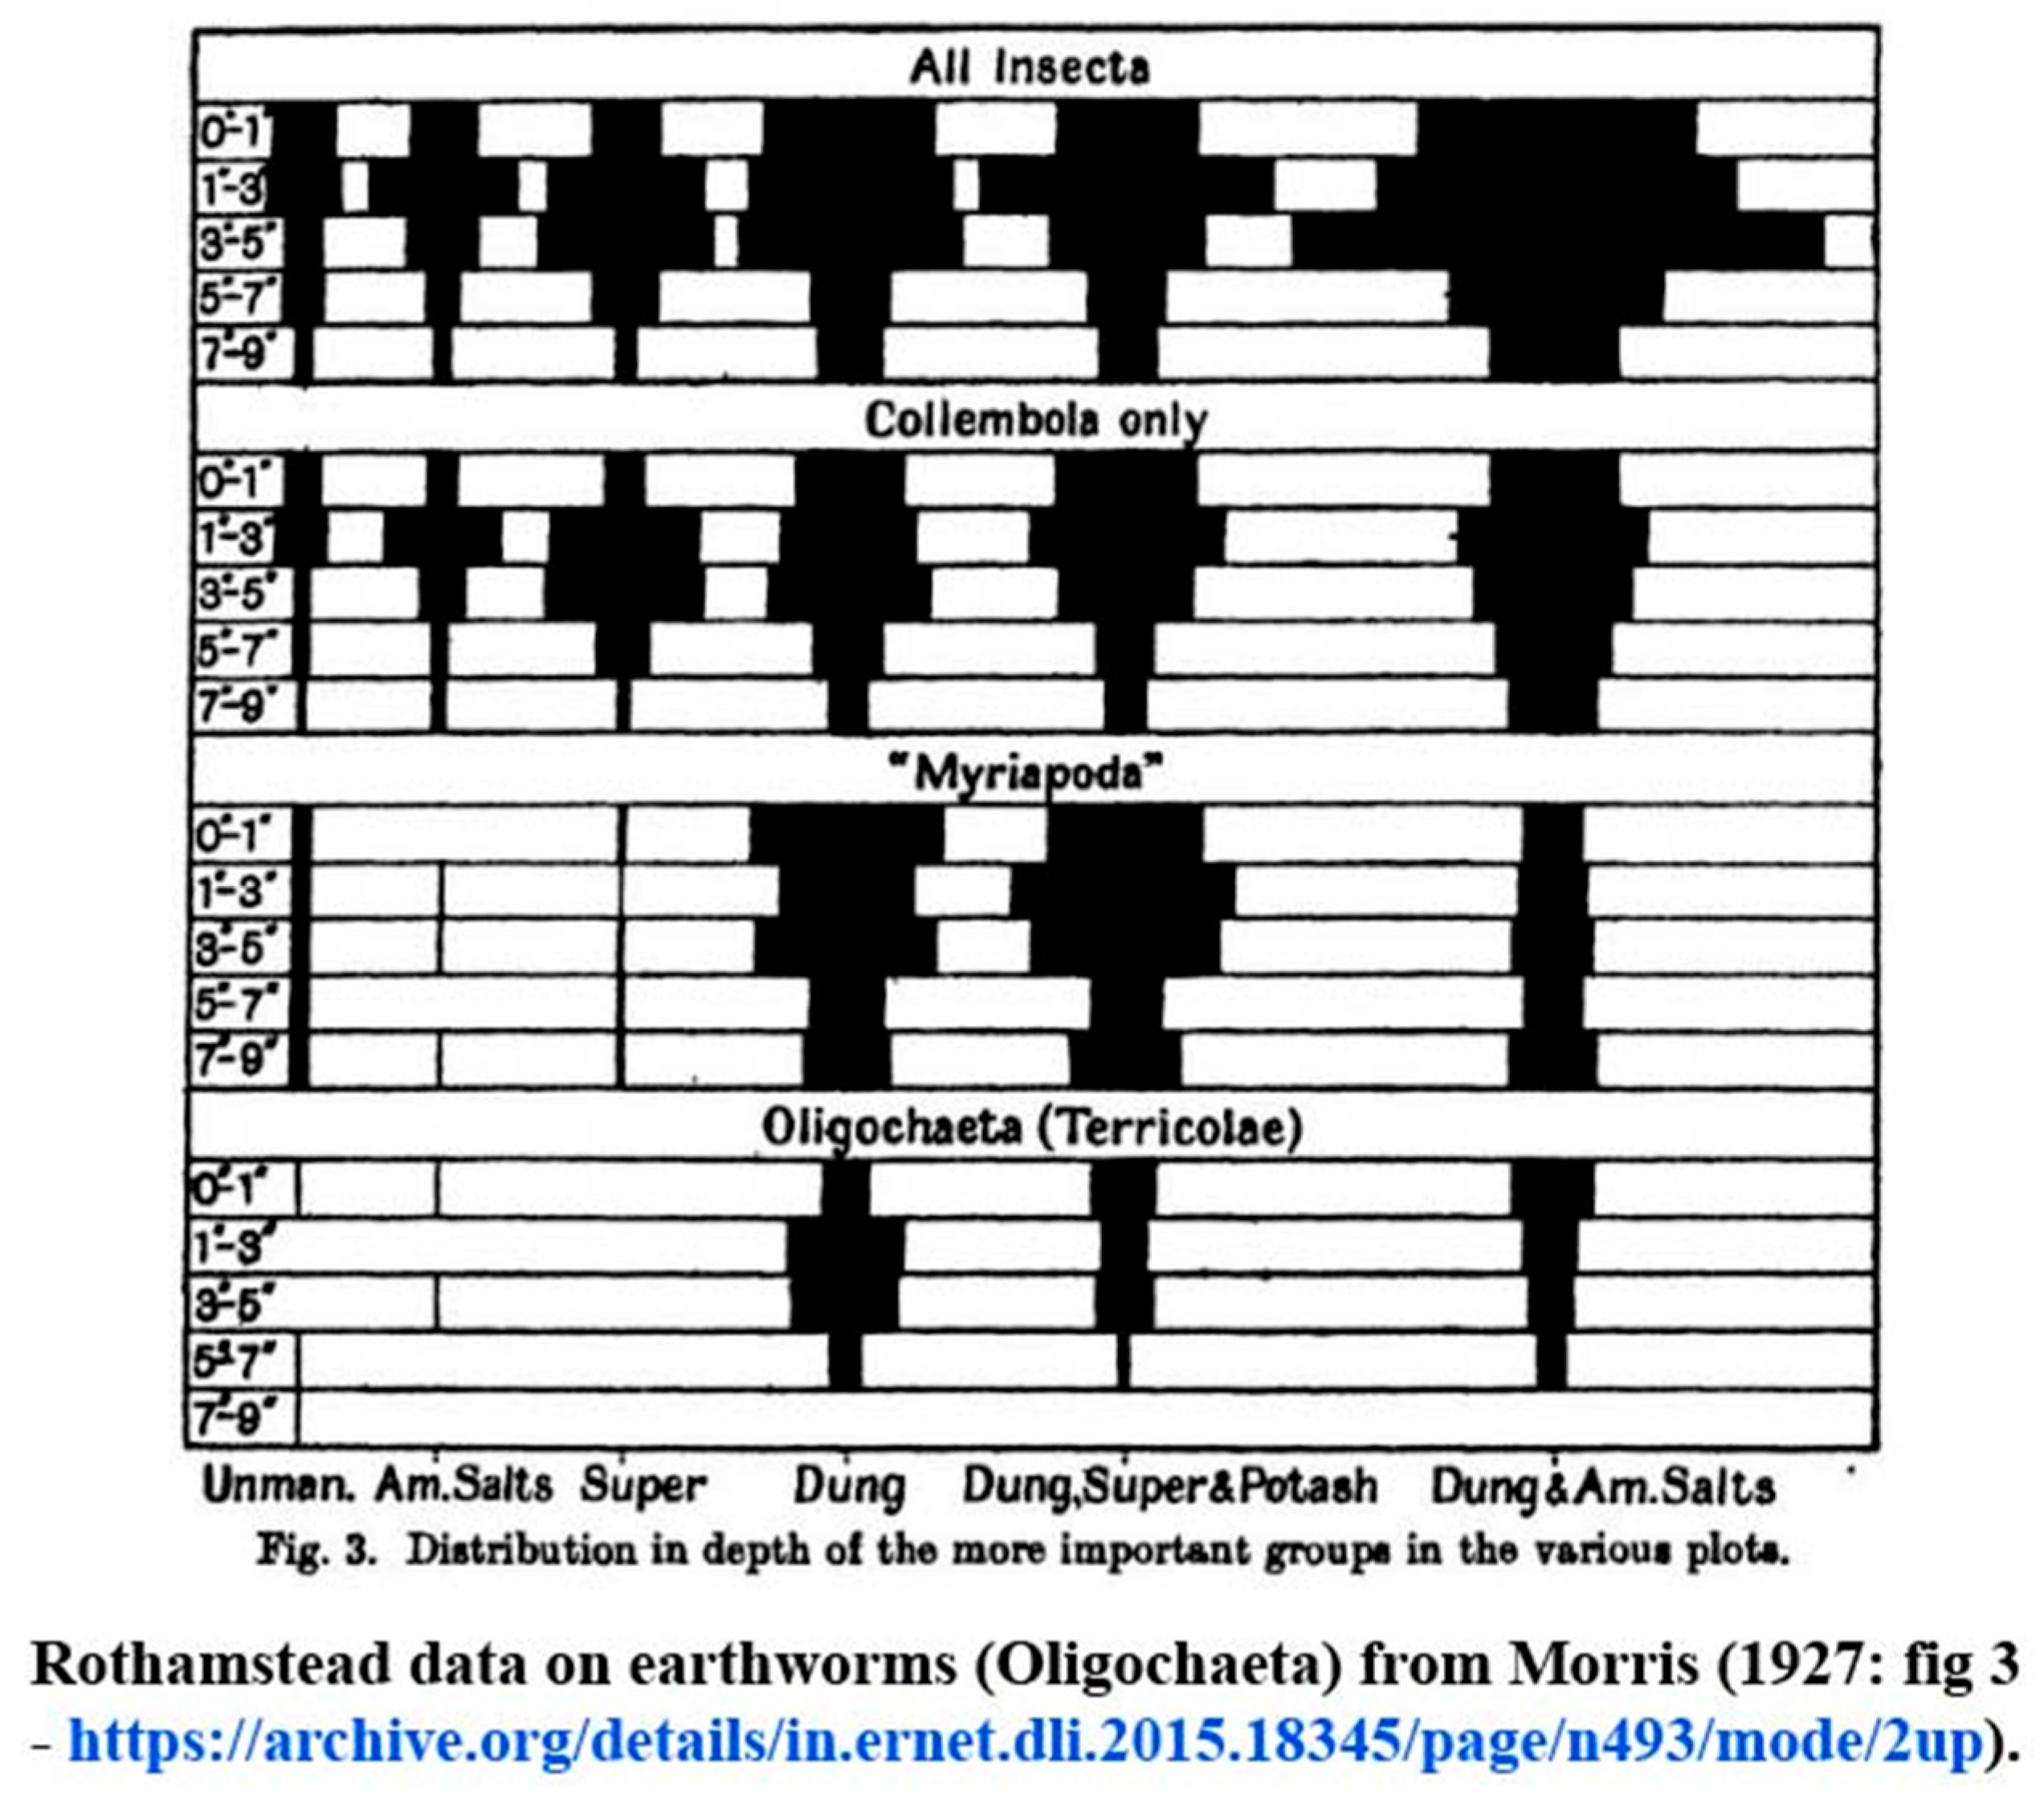
Figure 27.
pH decline in Australia. The upper curve is for untreated and natural pasture plots, the lower curve for adjacent for P treatment plots. Source - Schefe et al. (2015).
Figure 27.
pH decline in Australia. The upper curve is for untreated and natural pasture plots, the lower curve for adjacent for P treatment plots. Source - Schefe et al. (2015).
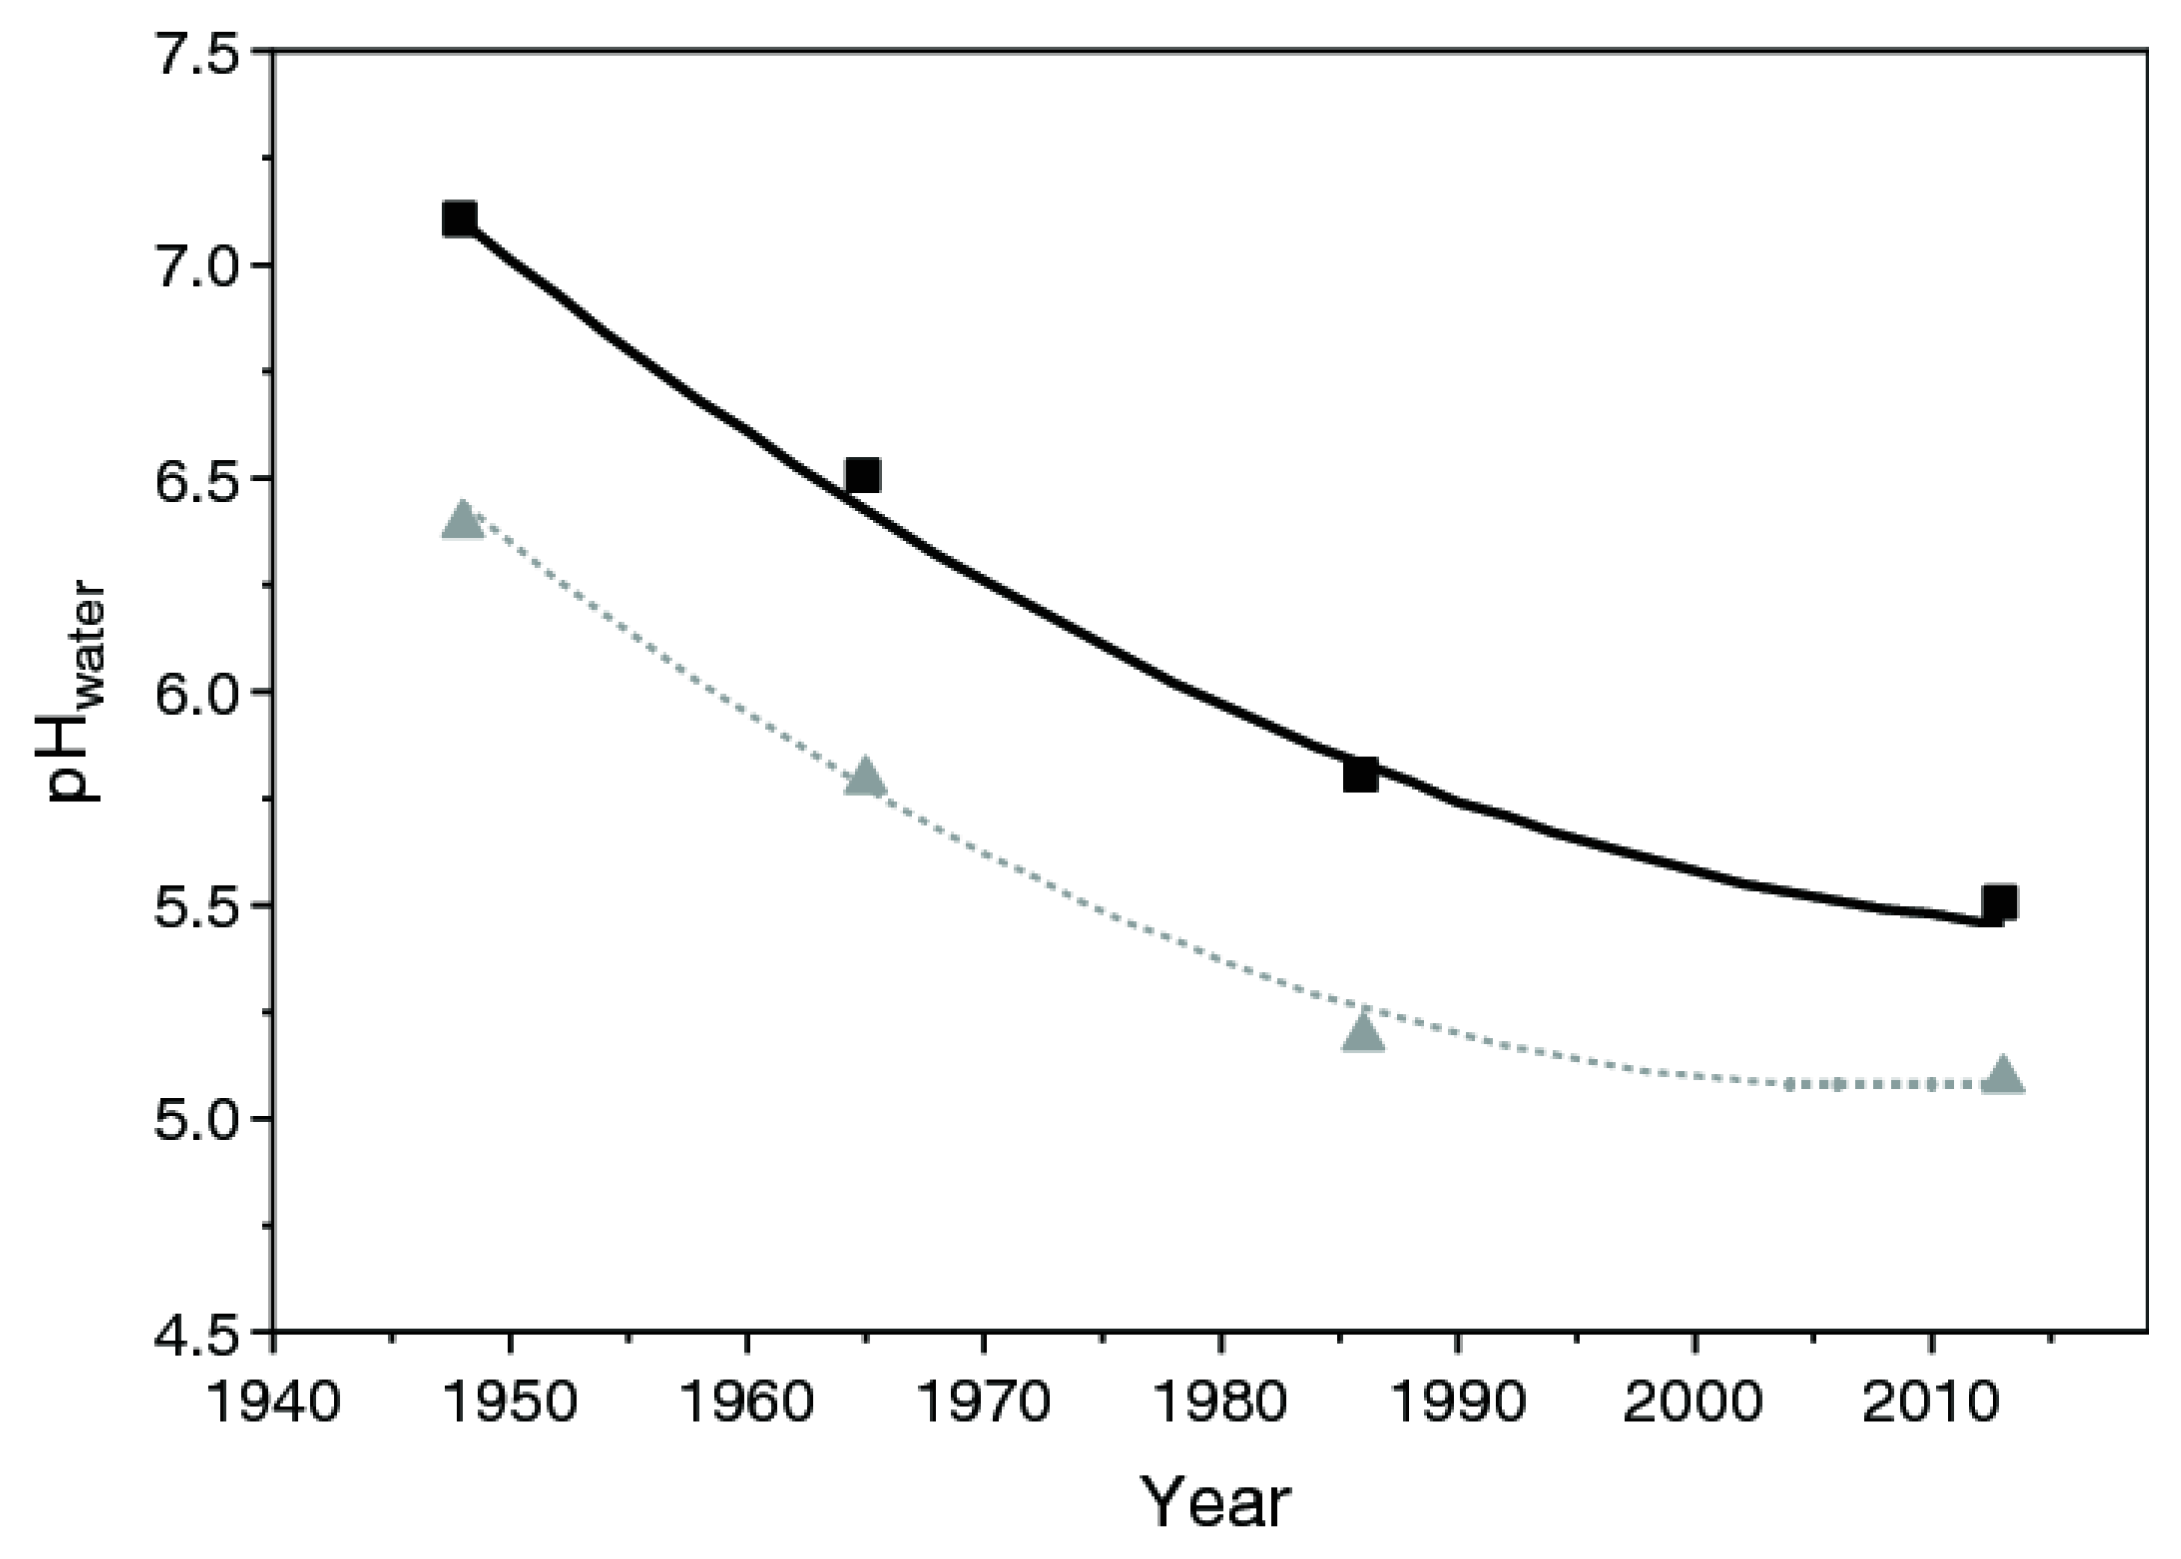
Figure 28.
Global Carbon Cycle from Blakemore (2024: Figure 14). CCS is the black dot.
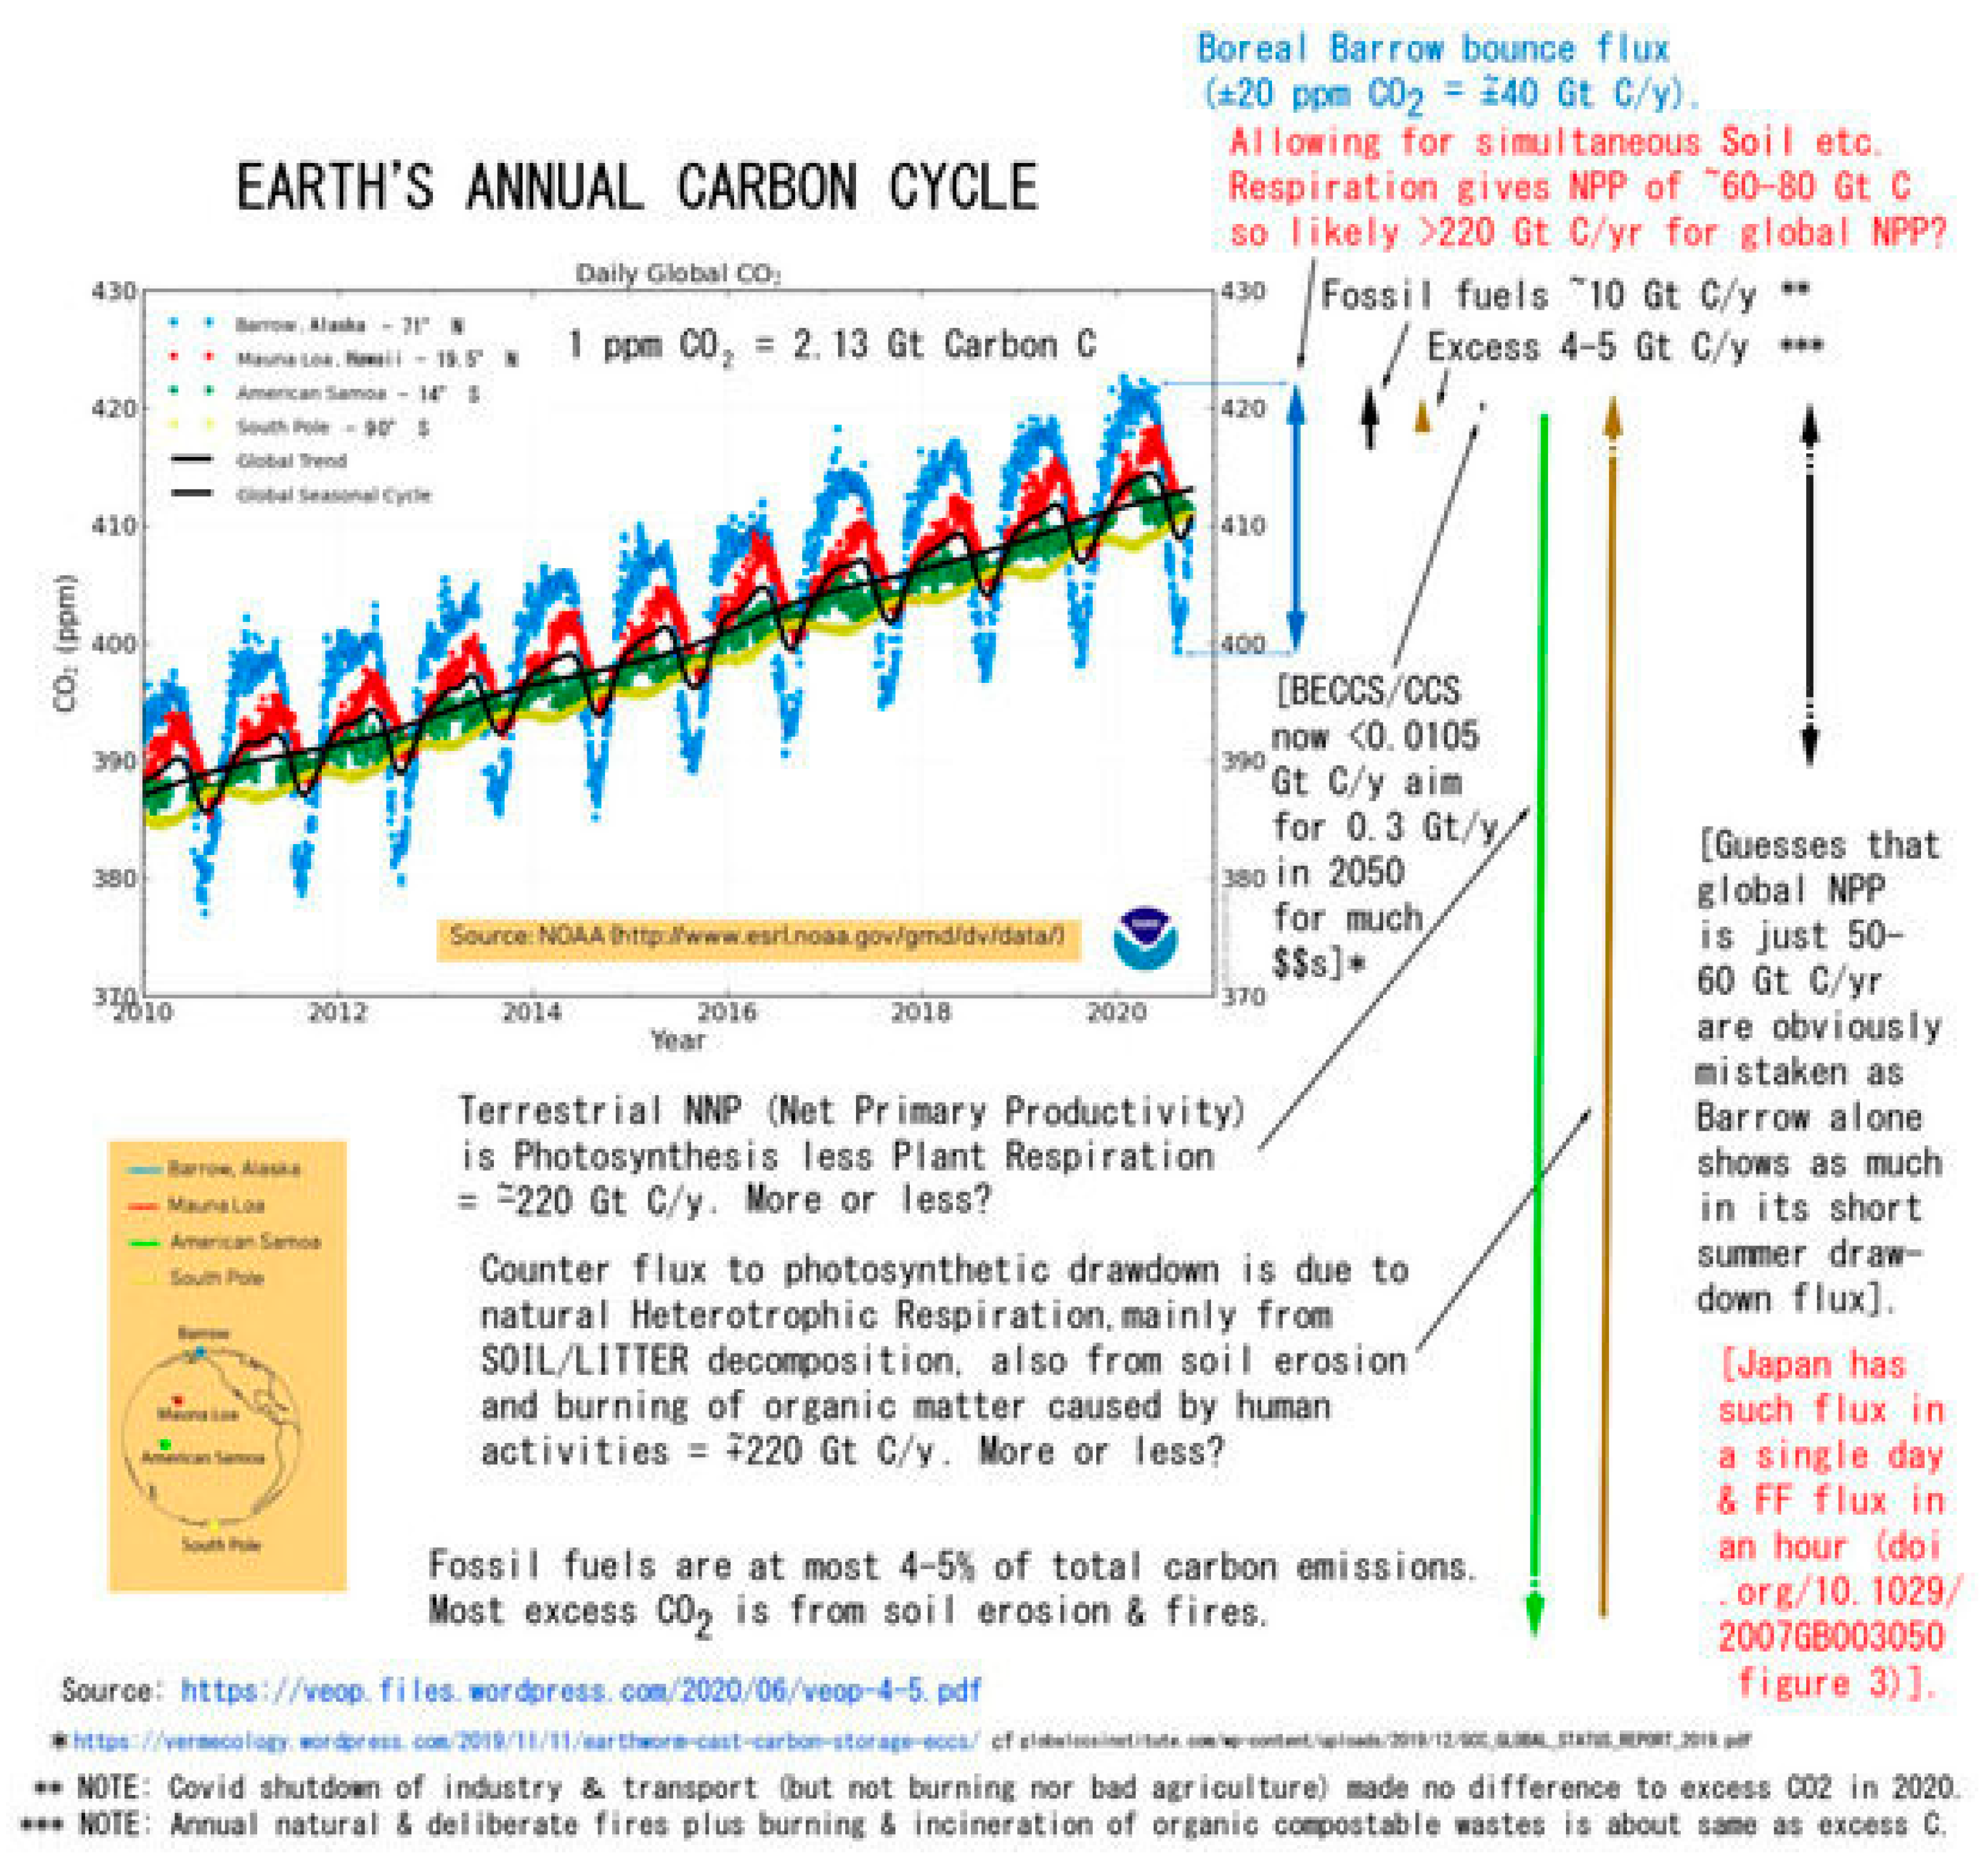
Figure 29.
Planetary Boundaries revised. Source - https://vermecology.wordpress.com/2021/03/11/transgression/ ; see also response to Rockstrom et al. (2023) - https://vermecology.wordpress.com/2023/11/08/comment-on-new-planetary-boundaries/.
Figure 29.
Planetary Boundaries revised. Source - https://vermecology.wordpress.com/2021/03/11/transgression/ ; see also response to Rockstrom et al. (2023) - https://vermecology.wordpress.com/2023/11/08/comment-on-new-planetary-boundaries/.
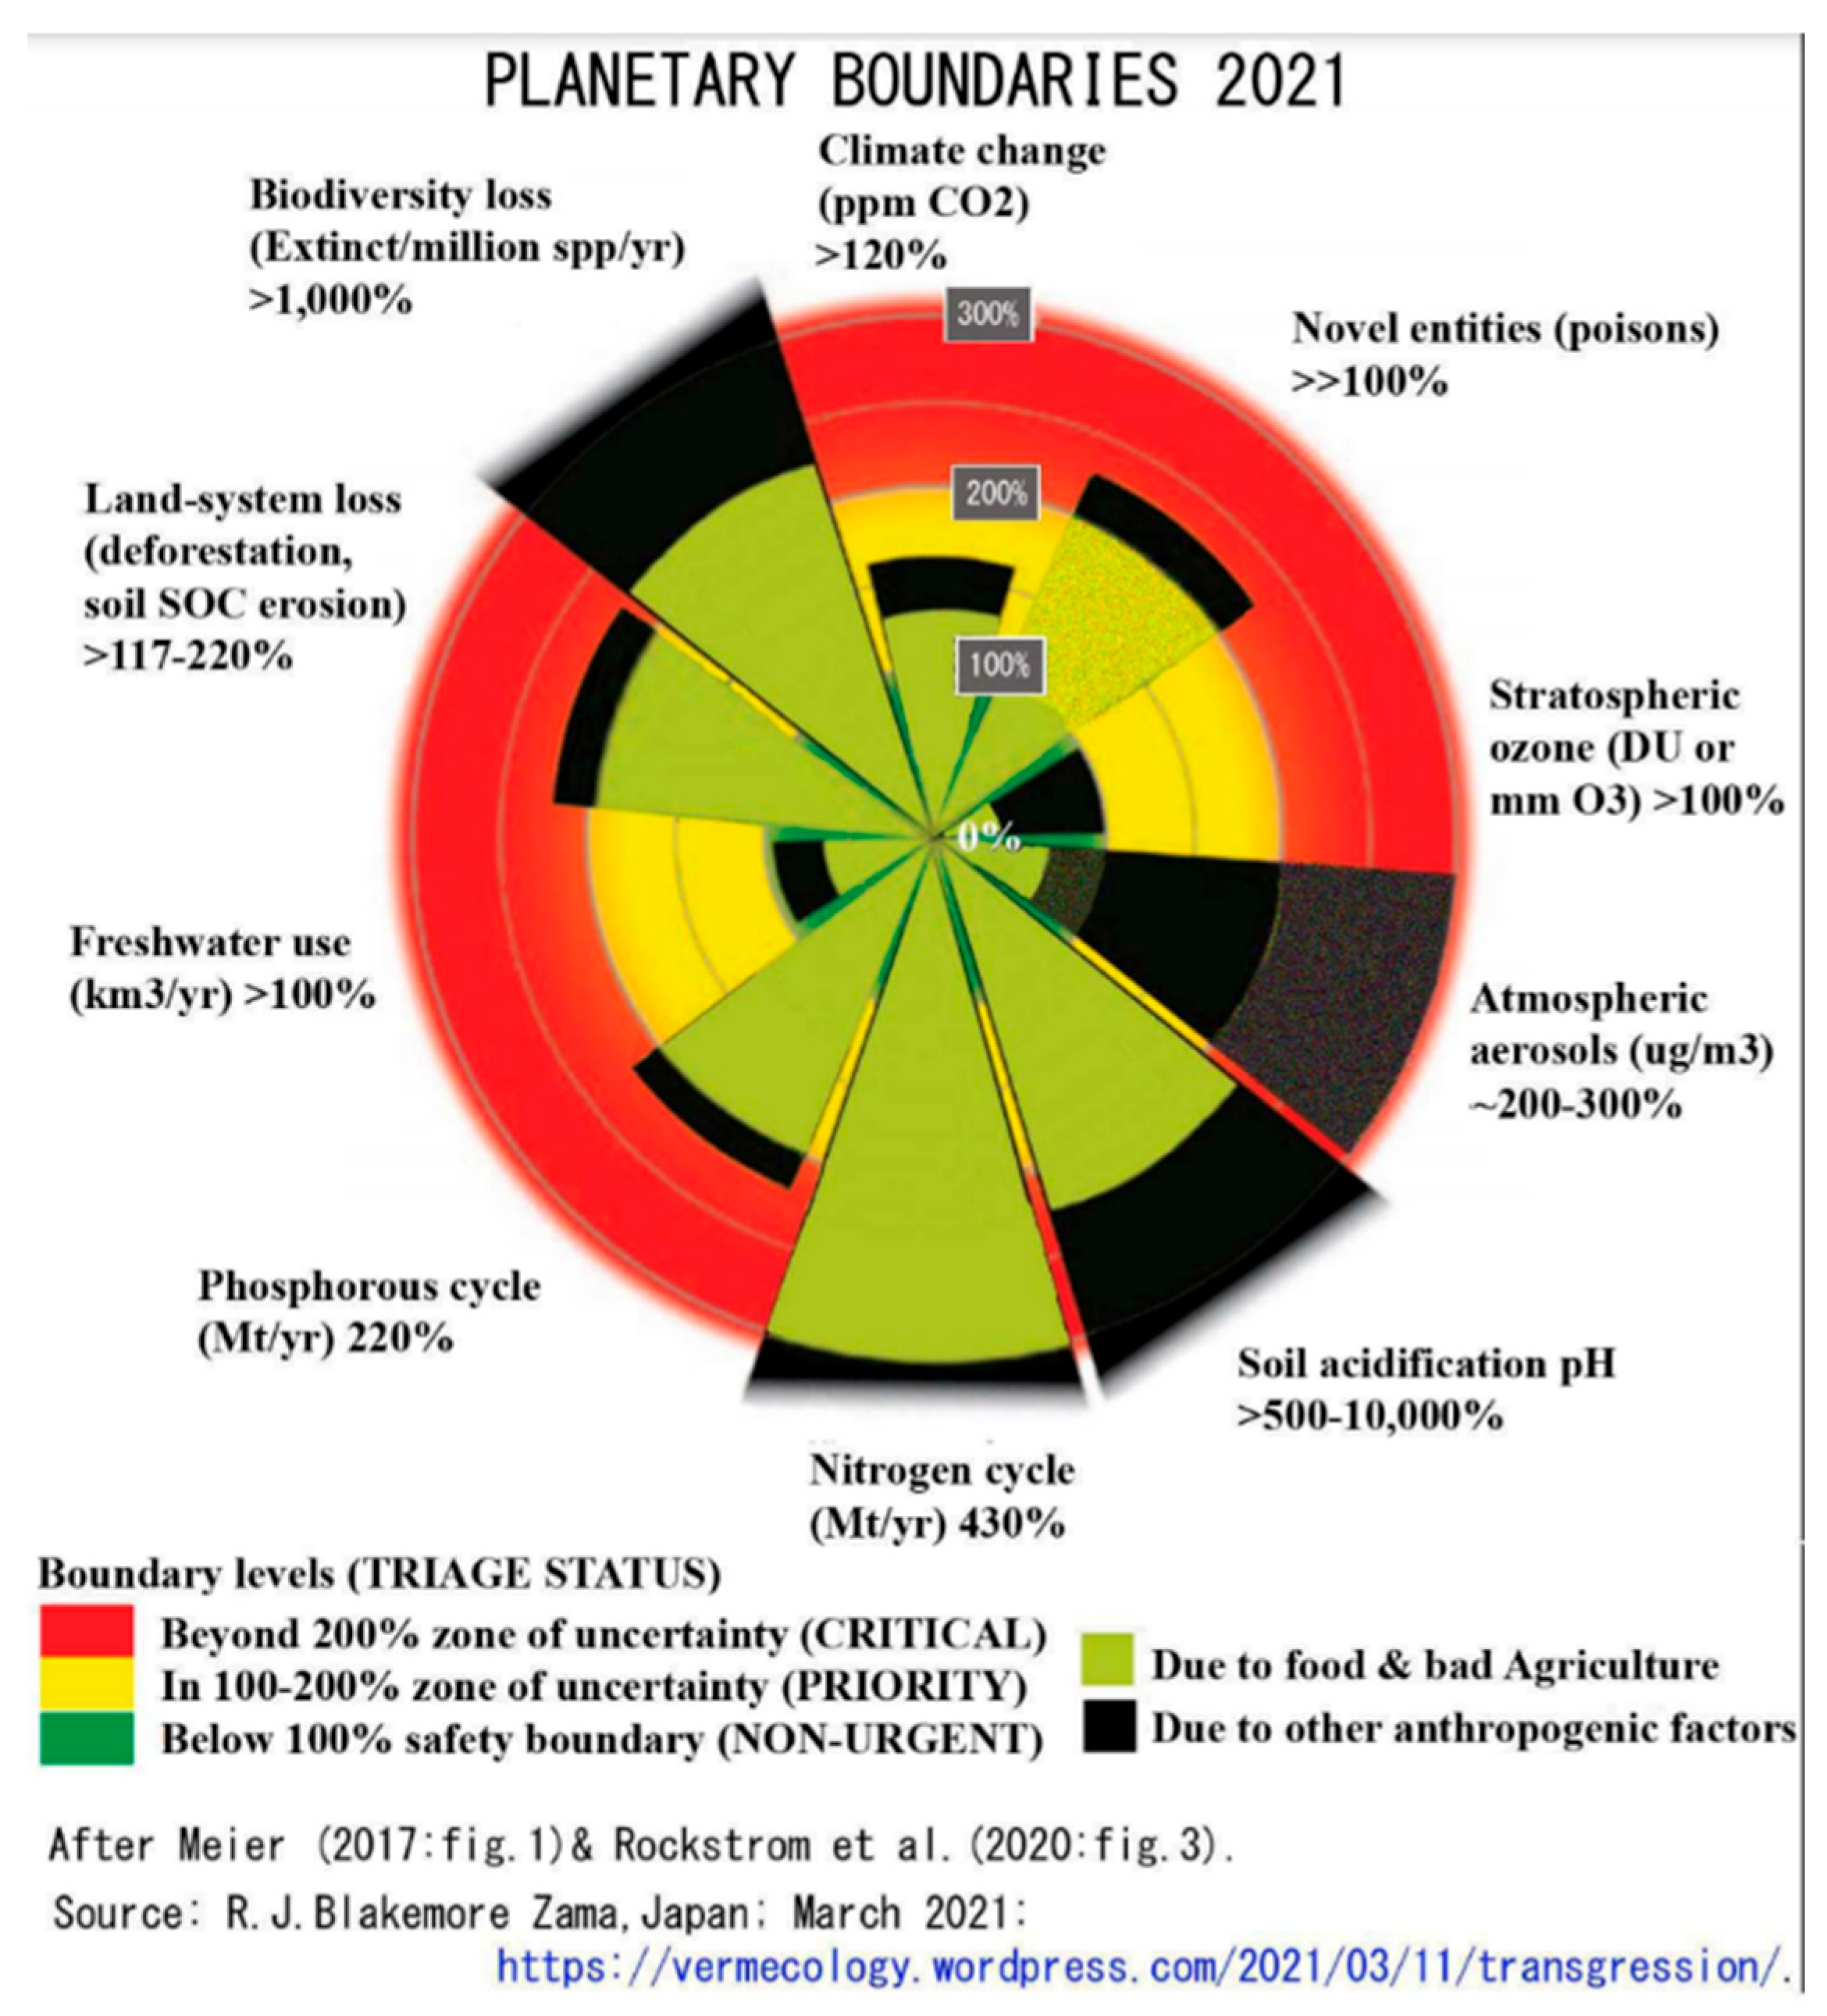
Figure 30.
SDGs in need of fundamental redrafting for a more solid soil foundation. Source - https://vermecology.wordpress.com/2021/03/30/soil-nexus/ .
Figure 30.
SDGs in need of fundamental redrafting for a more solid soil foundation. Source - https://vermecology.wordpress.com/2021/03/30/soil-nexus/ .
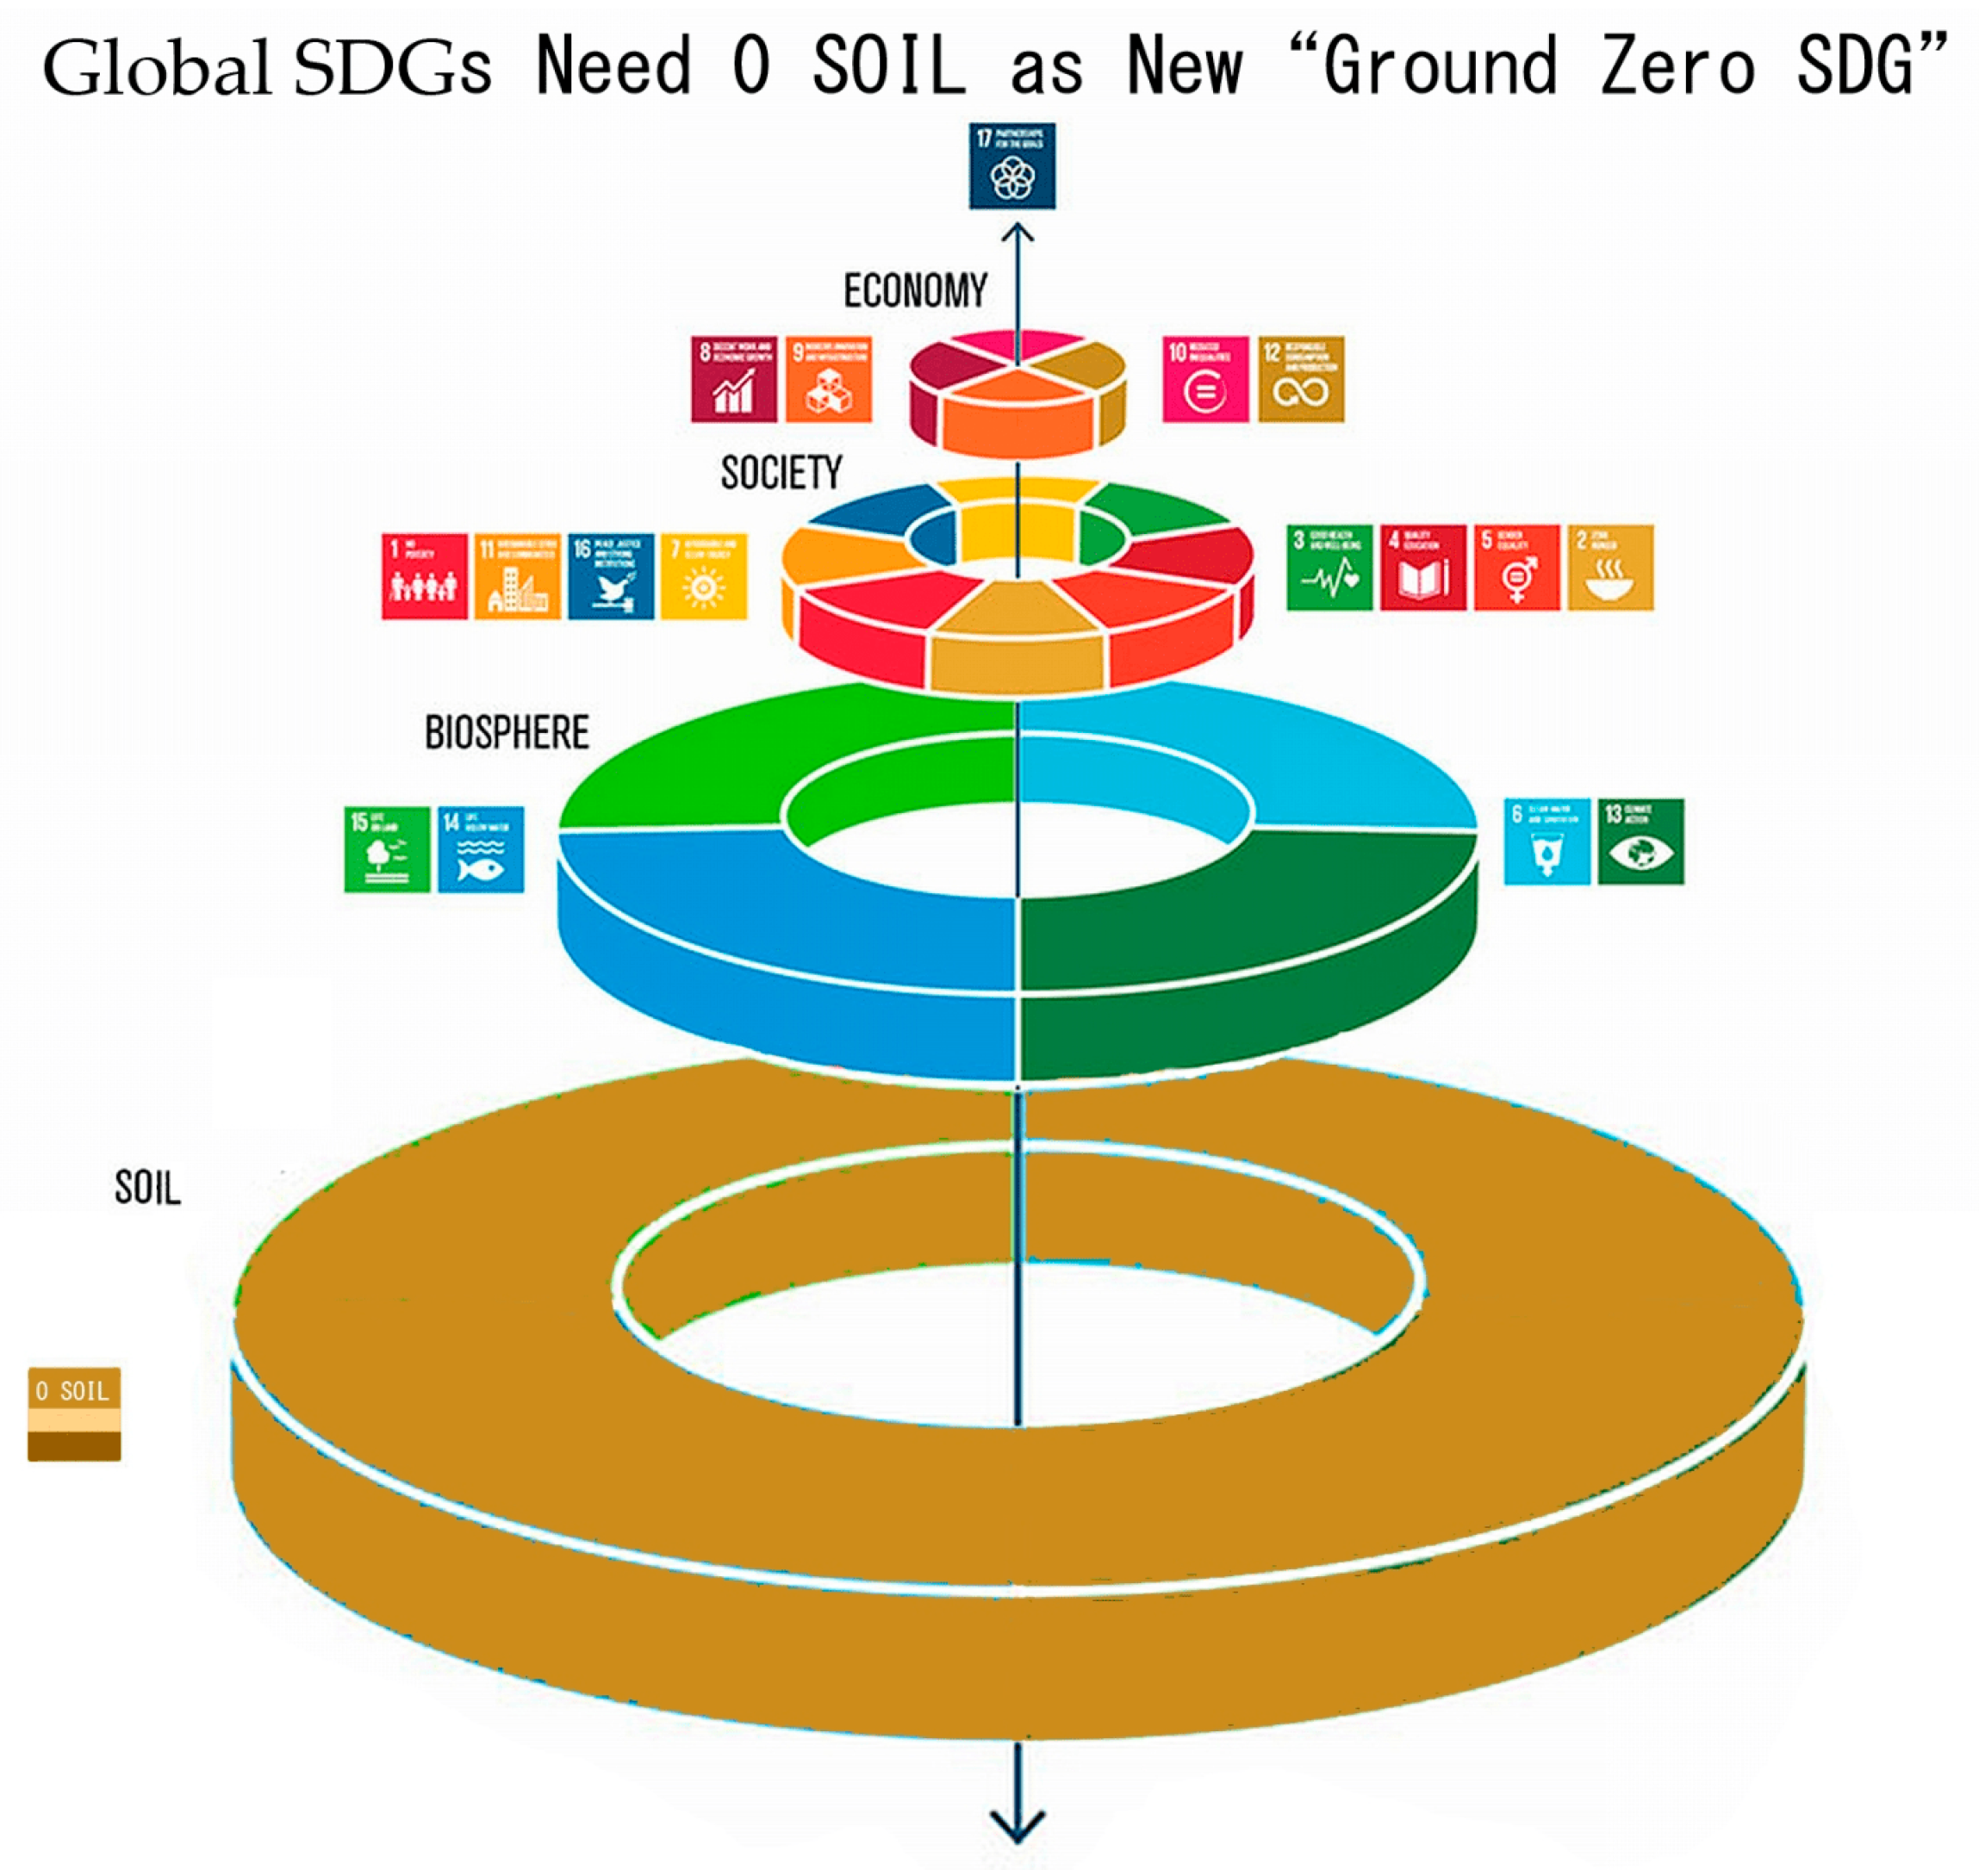
Figure 31.
Options in global policy in perspective. Soil is optimal, CCS is minor and Ocean miniscule. Ratios of maximal Gt CO2eq to sequester in 2020-2050 are Soil: 392 (98.5%), CCS: 4.4 (1%), and Ocean: 1.5 (0.4%), respectively. Source – Drawdown Review 2020 - https://drawdown.org/sites/default/files/pdfs/TheDrawdownReview%E2%80%932020%E2%80%93Download.pdf.
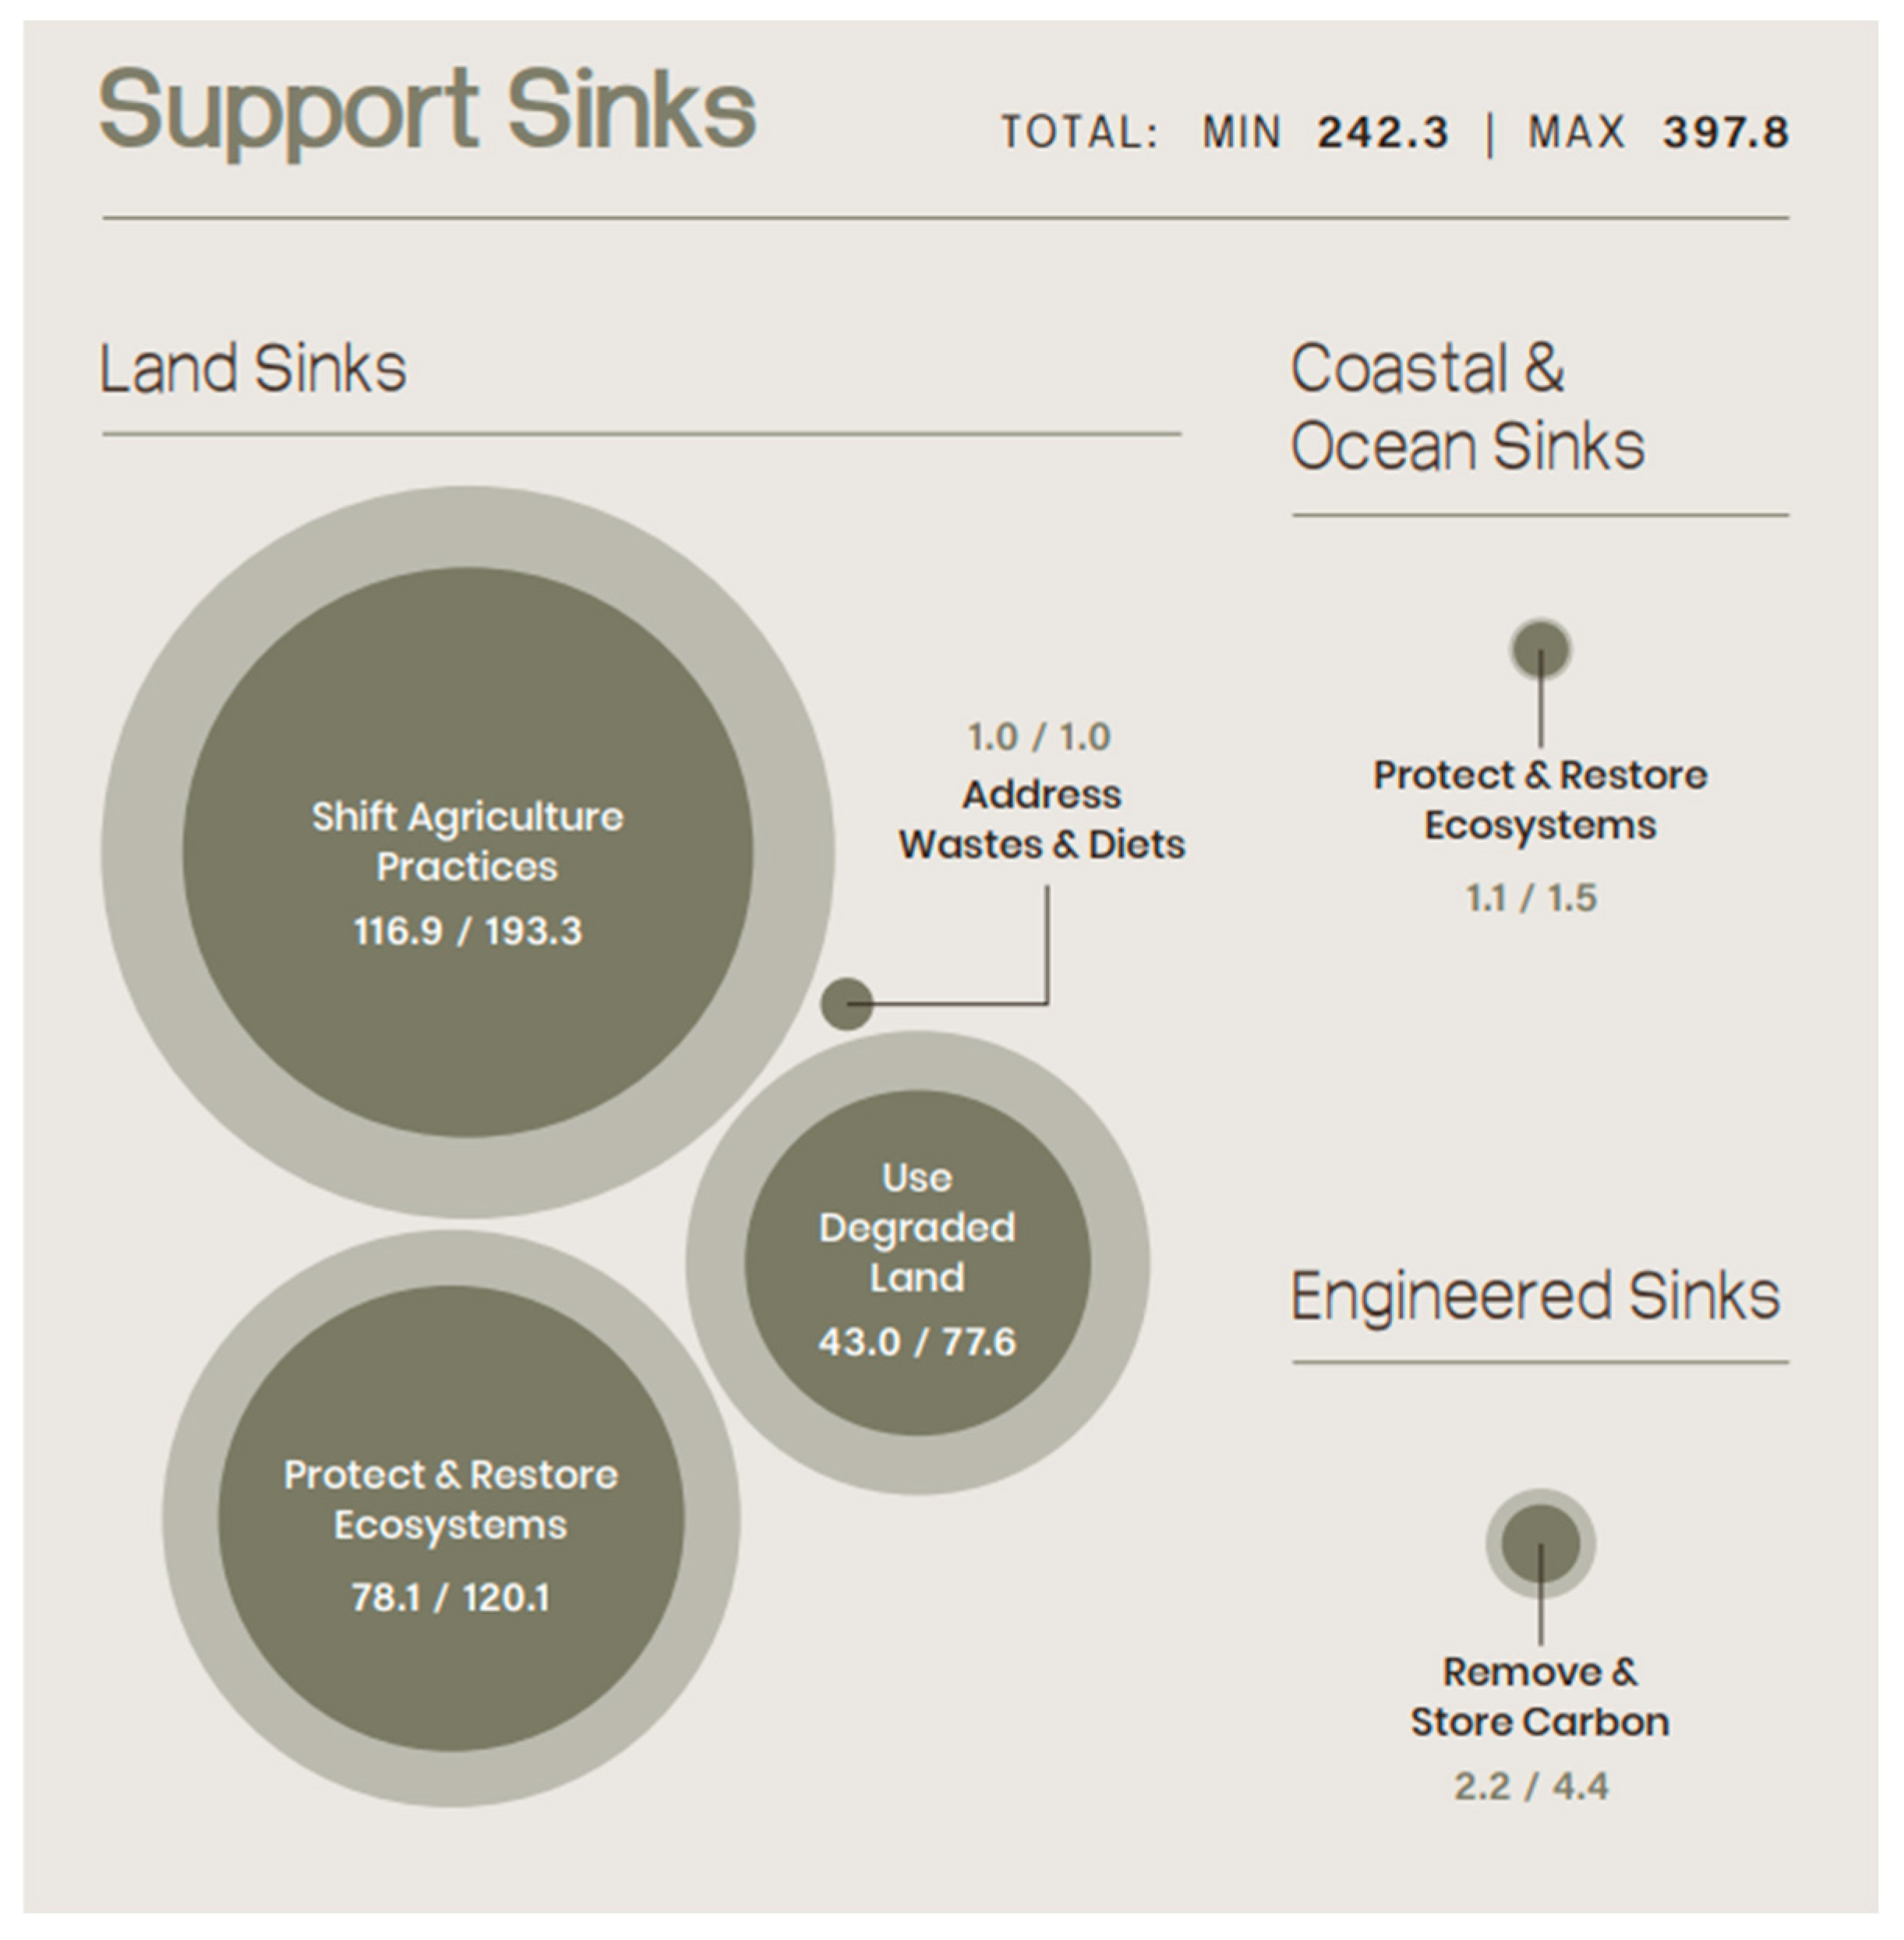
Figure 32.
Relative effectiveness of individual actions – most beneficial condense to composting of all food “wastes” and to reducing excessive red-meat. Source –https://drawdown.org/insights/the-powerful-role-of-household-actions-in-solving-climate-change .
Figure 32.
Relative effectiveness of individual actions – most beneficial condense to composting of all food “wastes” and to reducing excessive red-meat. Source –https://drawdown.org/insights/the-powerful-role-of-household-actions-in-solving-climate-change .
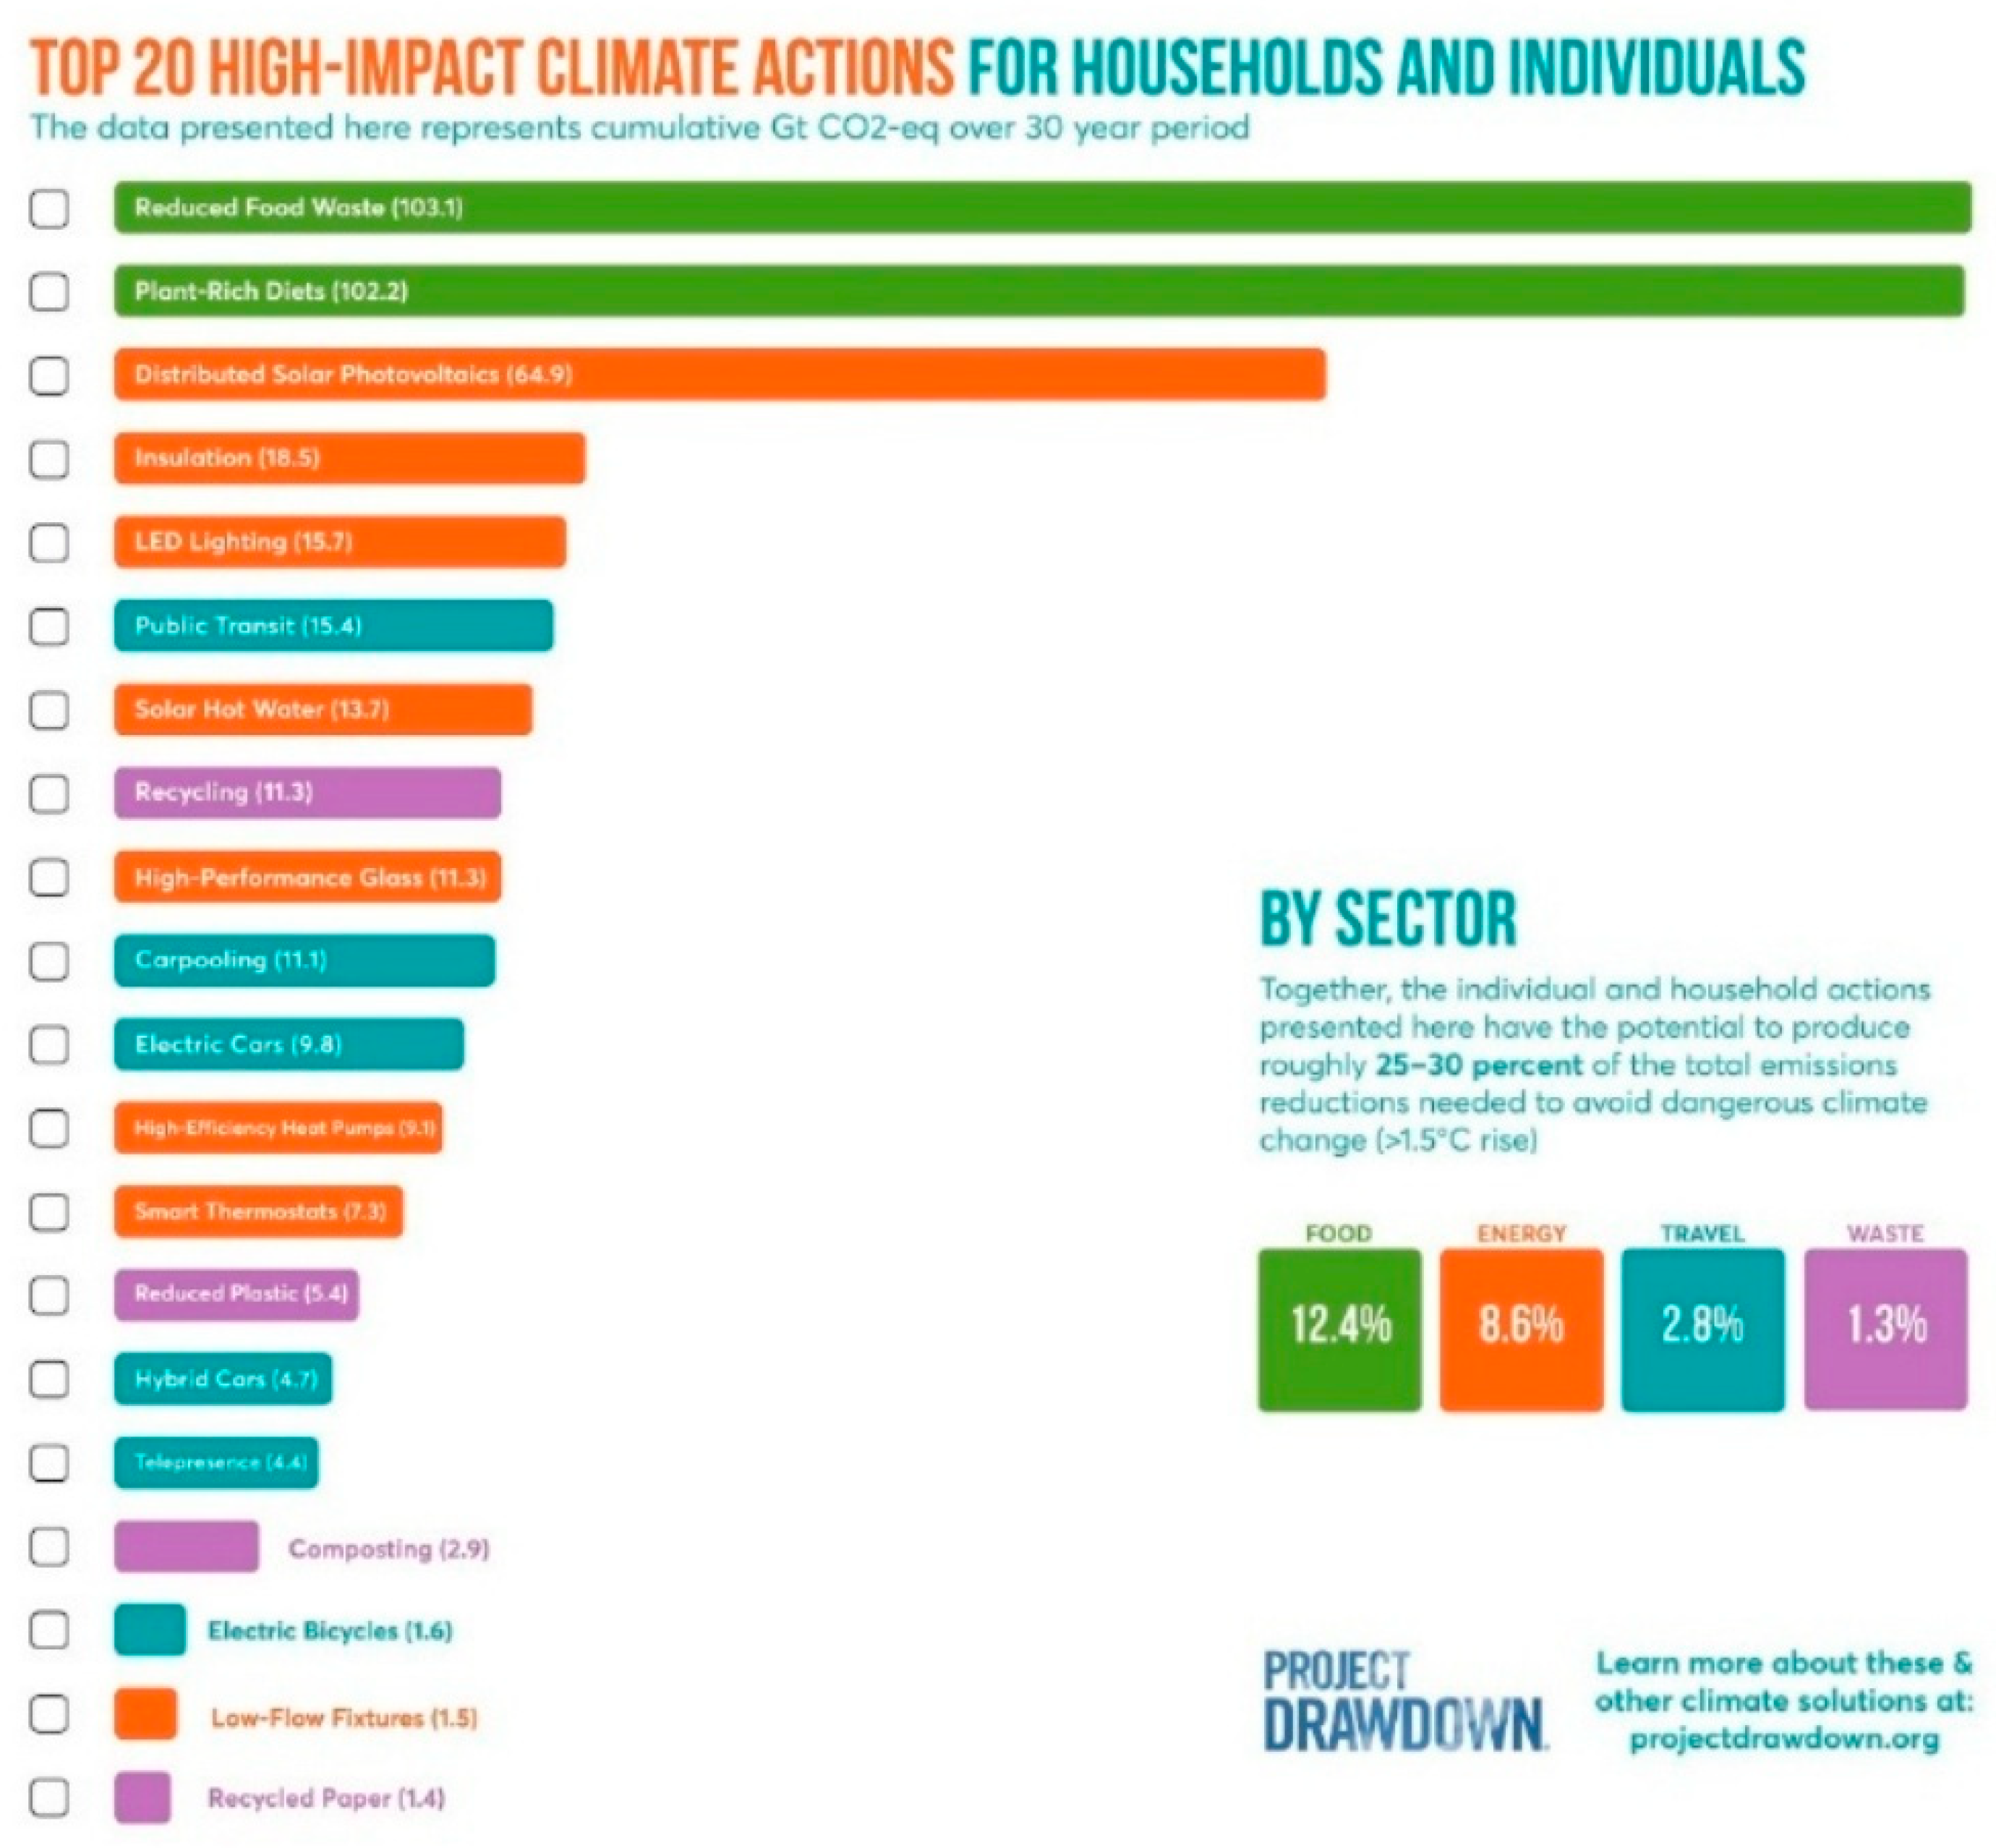
Figure 33.
Earthworm benefits that no chemist nor physicist could possibly emulate. Unfortunately for commerce, earthworms work for free and are unpatentable for profit. Source - https://vermecology.wordpress.com/2017/02/22/food-for-thought-ii/.
Figure 33.
Earthworm benefits that no chemist nor physicist could possibly emulate. Unfortunately for commerce, earthworms work for free and are unpatentable for profit. Source - https://vermecology.wordpress.com/2017/02/22/food-for-thought-ii/.
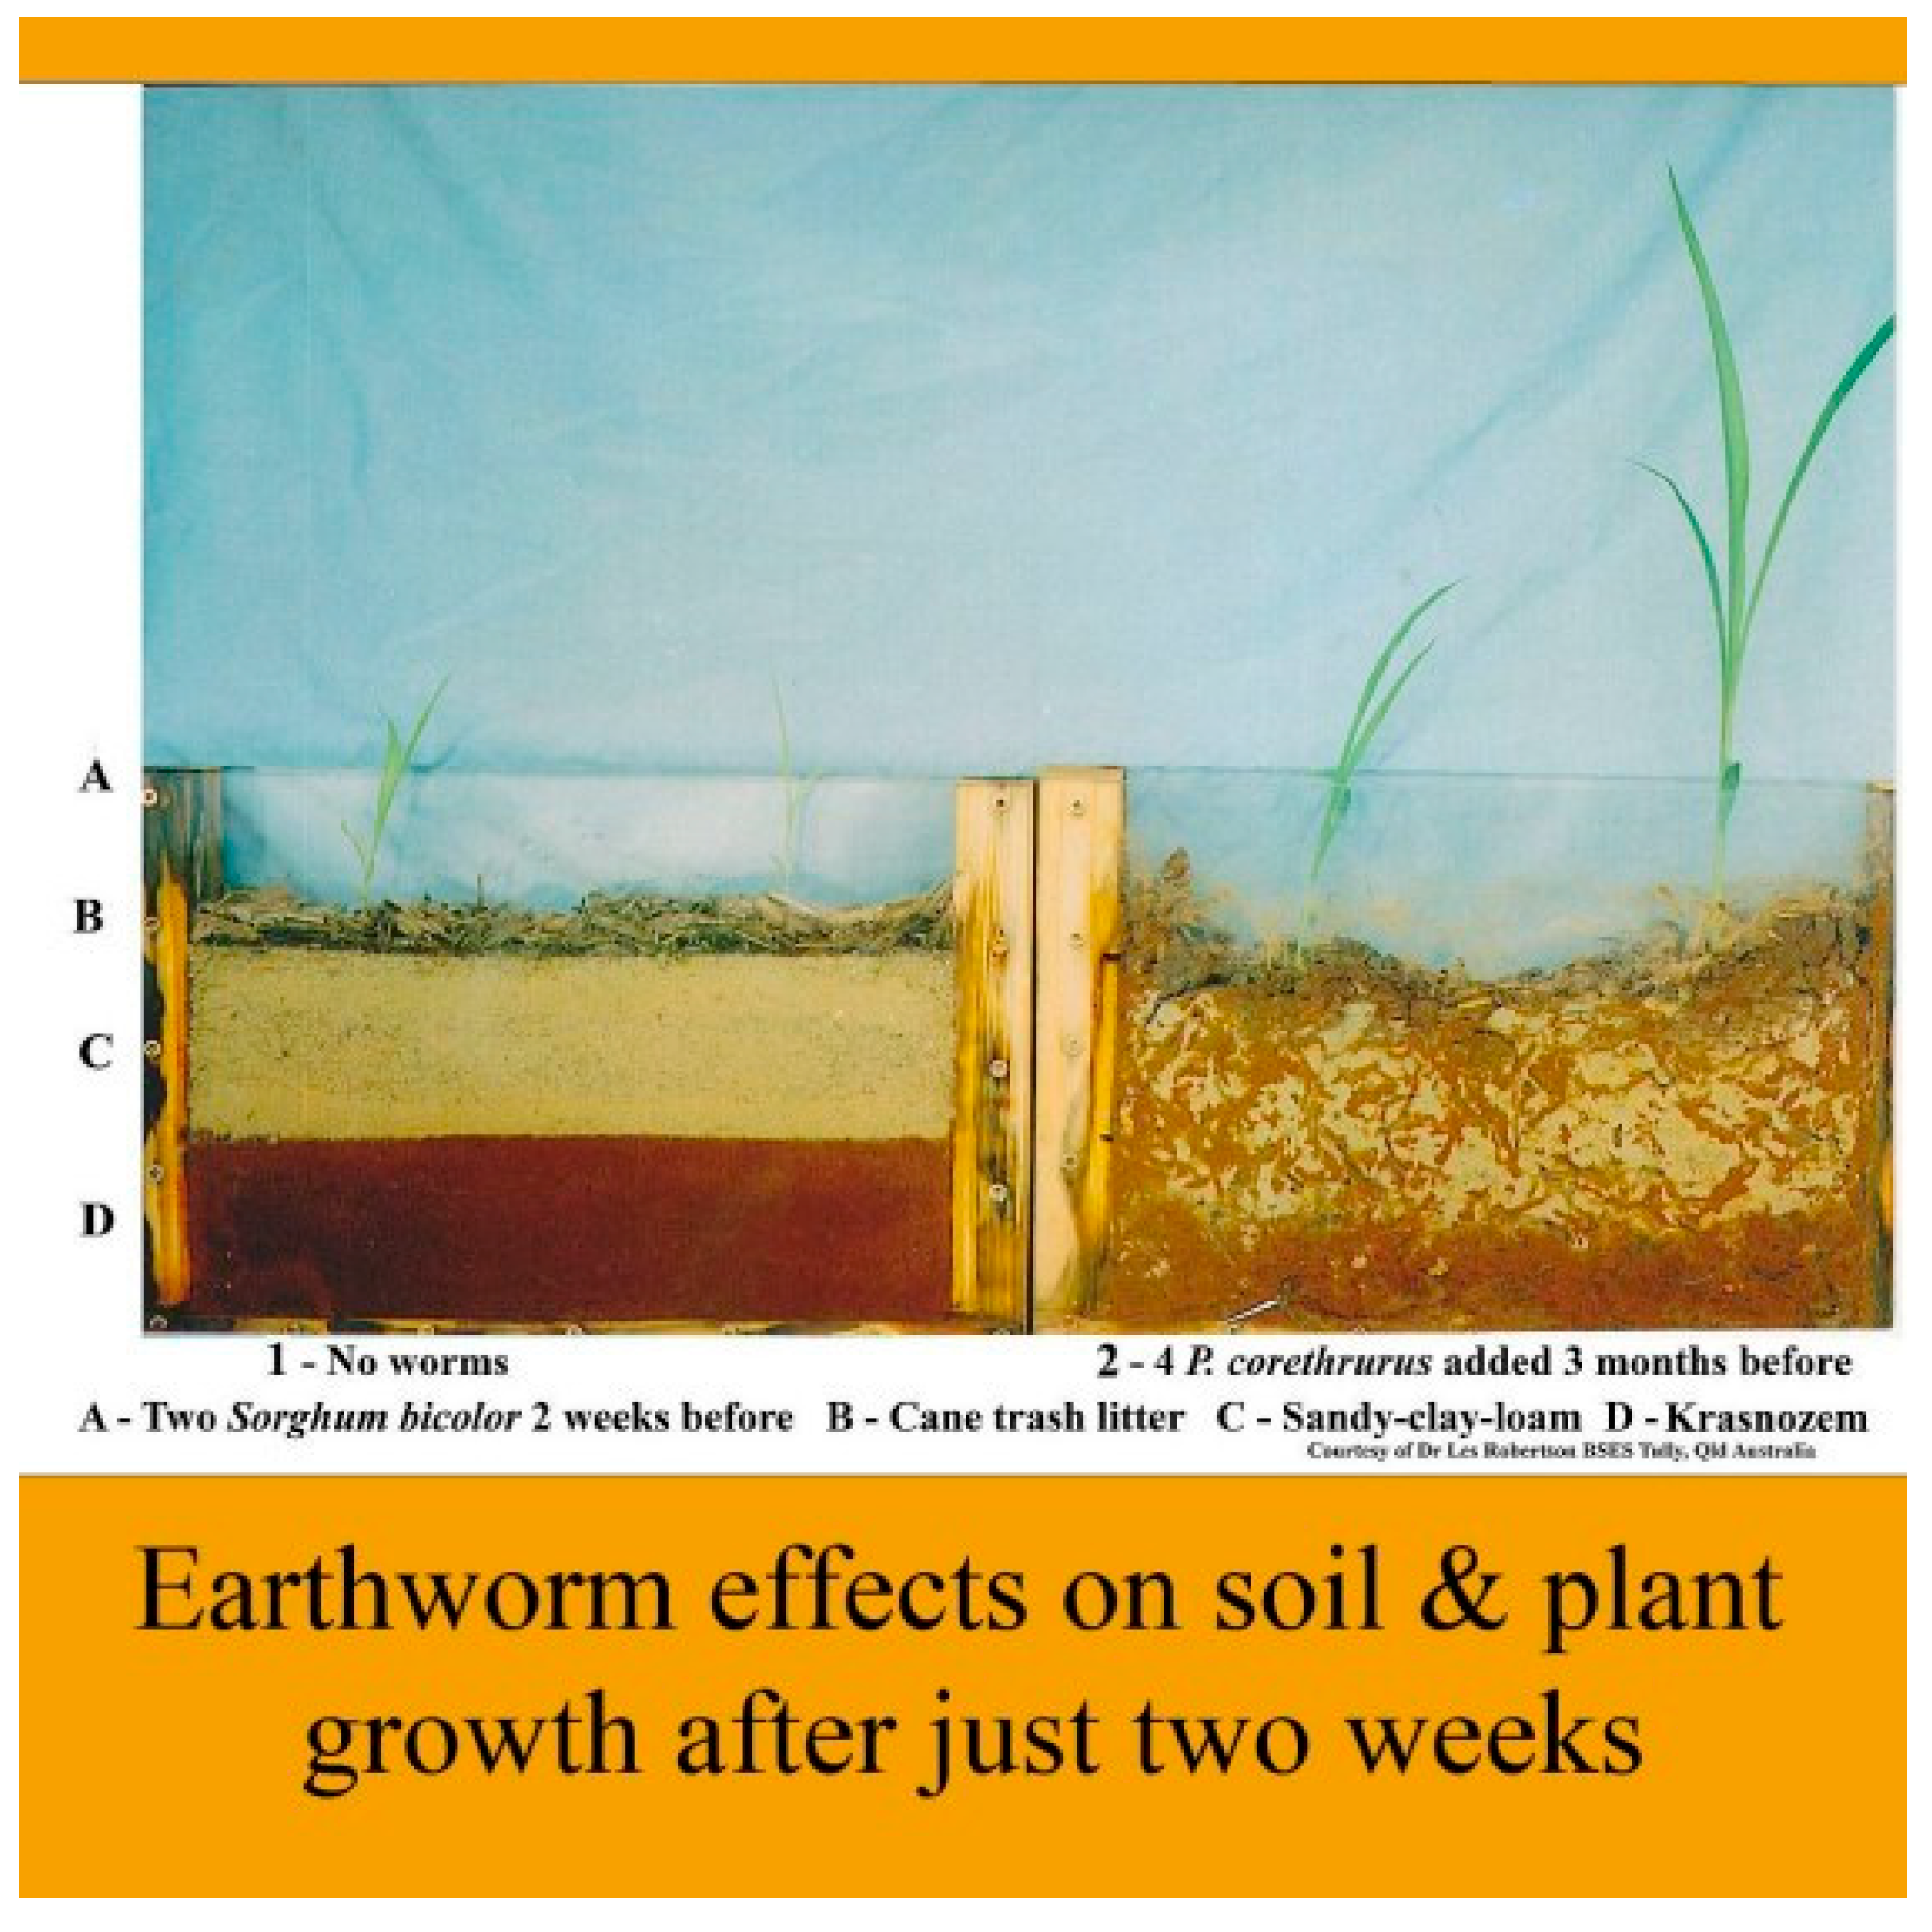
Table 1.
Liang et al. (2023) estimates show agreement across studies of 1–2-year turnover time (τ) and GPP raised up to (290 + 30 =) 320 Gt C/yr (NPP 160 Gt C/yr?), but these are likely underestimations and may be doubled for terrain and other factors as noted herein.
Table 1.
Liang et al. (2023) estimates show agreement across studies of 1–2-year turnover time (τ) and GPP raised up to (290 + 30 =) 320 Gt C/yr (NPP 160 Gt C/yr?), but these are likely underestimations and may be doubled for terrain and other factors as noted herein.
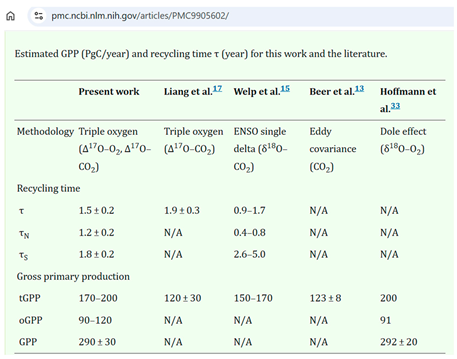 |
Table 3.
Major Discrepancies or Deficiency Errors in IPPC Data.
| Factor | IPCC 2021 | Latest | Difference |
| Terrestrial GPP Gt C/yr | 142 | 550 | 3.9 |
| Terrestrial NPP Gt C/yr | 71 | 220 | 3.1 |
| Soil organic C Gt C | 1,700 | 10,000 | 5.9 |
| Permafrost (+ Peat?) Gt C | 1,200 | 11,500 | 9.6 |
| Total soil organic C Gt C | 2,900 | 21,500 | 7.4 |
| Vegetation Gt C | 450 | 2,400 | 5.3 |
| LUC Total Gt C | -25 | -240->500 | 9.6-20.0 |
| Mean Error x Factor | 6.4-8.0 |
Disclaimer/Publisher’s Note: The statements, opinions and data contained in all publications are solely those of the individual author(s) and contributor(s) and not of MDPI and/or the editor(s). MDPI and/or the editor(s) disclaim responsibility for any injury to people or property resulting from any ideas, methods, instructions or products referred to in the content. |
© 2025 by the authors. Licensee MDPI, Basel, Switzerland. This article is an open access article distributed under the terms and conditions of the Creative Commons Attribution (CC BY) license (http://creativecommons.org/licenses/by/4.0/).
Copyright: This open access article is published under a Creative Commons CC BY 4.0 license, which permit the free download, distribution, and reuse, provided that the author and preprint are cited in any reuse.


