
Submitted:
26 November 2025
Posted:
28 November 2025
You are already at the latest version
Abstract
Background: Visualization (motor imagery) is used in sports to enhance performance. Fencing relies on point control and lunge distance, yet little is known about how visualization affects these skills across experience levels. Objective: To examine the effects of brief visualization on point control and lunge distance in fencers of different experience levels. Methods: Nineteen fencers (age 10–56) completed pre- and post-tests of point control (10 hits) and lunge distance (maximum reach). Between tests, the experimental group performed a 1-minute guided visualization, while the control group (n = 20) repeated the tests without visualization. Results: Visualization significantly improved point control (+1.4 hits, 25.5%; p = 0.0078). Lunge distance increased (+15.6 cm, 11.1%) but was not significant (p = 0.0830). Less experienced fencers improved more in point control (39.0% vs. 14.8%), while experienced fencers improved more in lunge distance (12.8% vs. 7.2%). Control participants showed no meaningful gains, and between-group comparisons confirmed significant advantages for visualization in both skills (p < 0.01). Conclusion: Even a short visualization exercise improved fencing performance, with novices benefiting most in accuracy and experienced fencers in explosive reach. Visualization offers a low-cost, adaptable supplement to fencing training.
Keywords:
visualization
; mental imagery
; fencing
; point control
; lunge distance
1. Introduction
Visualization, or mental imagery, is a well-established technique in sports psychology that involves rehearsing movements mentally without physical execution. Research has shown that imagery can enhance accuracy, strength, reaction time, confidence, and overall performance by engaging neural pathways similar to those activated during actual movement [1,2]. Importantly, these benefits extend beyond elite athletes; novices also gain from mental imagery, which can accelerate skill acquisition and support motor learning [3,4]. Bibliometric analyses confirm the growing importance of psychological skills training, including visualization, within sports and exercise medicine [5]. Moreover, visualization is increasingly recognized as a core element of psychological skills training across athletic disciplines [6,14,15].
Despite broad application across sports, fencing remains underexplored in this context. Fencing demands a combination of precision and explosiveness, requiring fine control of the weapon tip and rapid execution of dynamic movements, such as the lunge. Both point control and lunge distance are central to successful performance, yet few studies have directly examined whether visualization can improve these fundamental skills in fencers. This is a notable gap, as fencing provides a unique model to study visualization’s effects on both fine motor accuracy and gross motor coordination [7].
The present study addresses this gap by testing the impact of a brief visualization exercise on point control and lunge distance in fencers. Additionally, it evaluates whether athletes with varying levels of experience respond differently to imagery. By combining controlled testing with subgroup comparisons, this study aims to clarify the role of visualization in fencing performance and provide practical insights for tailoring mental training across stages of athlete development.
2. Materials and Methods
The experiment consisted of two testing phases — pre-test and post-test — separated by a visualization exercise. Both phases included evaluation of point control and lunge distance.
Participants
Nineteen fencers aged 10 to 56 years participated in the experimental group. Participants were recruited from local fencing clubs and represented a diverse range of skill levels and years of training experience. All received a standardized explanation of the study procedures before testing [8,9]. A separate control group (n = 20) completed the same pre- and post-tests under identical conditions but did not perform the visualization exercise. This distinguished natural improvements during a retest versus visualization-specific effects.
Grouping
Participants were divided into two categories for subgroup analyses based on training history: less experienced fencers with <4 years of formal fencing training and more experienced fencers with ≥4 years of formal fencing training. This classification allowed investigation of whether visualization effects differed by training experience.
Pre-Test Procedures
Pre-Test procedures include point control test, lunge distance test and visualization exercise.
Point Control Test
Before the test, fencers were given one minute of practice to strike a target mounted on a wall. Four predetermined target locations were selected, each progressively increasing in difficulty [10,11]. During testing, participants attempted 10 hits on their designated target. The number of successful hits was recorded, and video recordings were used to verify accuracy. To avoid ceiling or floor effects, target difficulty was adjusted for subsequent attempts if necessary [8,12].
Lunge Distance Test
Participants began in the standard en garde position and executed a forward lunge as far as possible while maintaining balance and correct fencing form. The distance from the initial front foot position to the landing position was measured in centimeters. Each fencer performed three lunges, and the maximum distance was recorded for analysis [20,25].
Visualization Exercise
Following the pre-tests, participants in the experimental group engaged in a guided visualization session lasting approximately five minutes in a quiet environment. They were instructed to close their eyes and mentally rehearse both tasks: point control and lunge imagery. In the point control imagery, fencers were asked to imagine extending the arm, aligning the blade, and striking the center of the target with precision. In the lunge imagery, fencers were asked to imagine pushing explosively off the back leg, extending the front leg forward, and maintaining balance through the landing position.
Participants were encouraged to use a first-person perspective, as this vantage point has been shown to provide behavioral advantages for motor learning [21]. Both kinesthetic (bodily sensations, muscle activation) and visual (seeing oneself perform successfully) imagery were emphasized. The exercise was standardized and led by the same instructor to ensure consistency.
Post-Test Procedures
Immediately after the visualization exercise, participants in the experimental group repeated the point control test and lunge distance test under identical conditions. Control group participants also repeated the tests, but without any visualization between sessions. This design allowed for direct within-group comparisons (pre vs. post) and between-group comparisons (experimental vs. control) [18,19].
Statistical Analysis
Data were analyzed using descriptive and inferential statistics. Pre- and post-test results for point control and lunge distance were compared within each group using paired-sample t-tests. Differences between the experimental and control groups were evaluated using independent-sample t-tests. Subgroup analyses compared less experienced (<4 years) and more experienced (≥4 years) fencers using the same approach. Results are reported as means ± standard deviations, with percentage change calculated for each measure. Statistical significance was set at p < 0.05. All analyses were performed using Microsoft Excel 365 and verified with SPSS v29 (IBM Corp.).
3. Results
Demographics
Nineteen fencers from the LEO Fencing Club participated in the study, ranging from age 10 to 56 years. Years of fencing varied from none to 22 years of competitive practice. Of the participants, 78.9% were men and 21.1% were women. According to USA Fencing Age Classification, the distribution was: Y10 (5.3%), Y12 (10.5%), Y14 (15.8%), Cadet (26.3%), Junior (10.5%), Senior (15.8%), and Vet-50 (15.8%) (Figure 1) [26].
Overall Effects of Visualization
Across all participants, visualization training improved performance in both tasks.
Point Control: The average number of successful hits increased from 5.3 (pre-test) to 6.7 (post-test), representing an improvement of 1.4 hits (25.5%). This effect was statistically significant (p = 0.0078) (Figure 2; Table 1). Prior research has emphasized the importance of attentional focus and tip accuracy in fencing performance [8,10].
Lunge Distance: The mean distance increased from 130.7 cm to 146.3 cm, corresponding to an improvement of 15.6 cm (11.1%). This difference did not reach statistical significance (p = 0.0830) (Figure 3; Table 1). Previous biomechanical studies suggest that improvements in lunge distance reflect coordination and lower-limb power [20,25].
Effects of Training Experience
When fencers were divided by training history, additional patterns emerged.
- Point Control: Fencers with <4 years of experience showed greater improvement, increasing from 5.1 to 7.1 hits (39.0%) (Table 2, Figure 4a). Those with ≥4 years of experience improved from 5.5 to 6.2 hits (14.8%) (Table 4, Figure 5a). These differences are consistent with evidence that novices benefit most from visualization in skill acquisition [3,4].
- Lunge Distance: Fencers with <4 years of experience improved by 8.9 cm (7.2%) (Table 3, Figure 4b). Fencers with ≥4 years of experience, improved by 18.1 cm (12.8%) (Table 5, Figure 5b). This aligns with previous findings that experienced fencers use imagery to refine explosive actions, such as lunges [16,25].
Figure 4.
(a) Point Control Analysis in Fencers with Less than Four Years of Training. (b) Lunge Distance Analysis in Fencers with Less than Four Years of Training.
Figure 4.
(a) Point Control Analysis in Fencers with Less than Four Years of Training. (b) Lunge Distance Analysis in Fencers with Less than Four Years of Training.
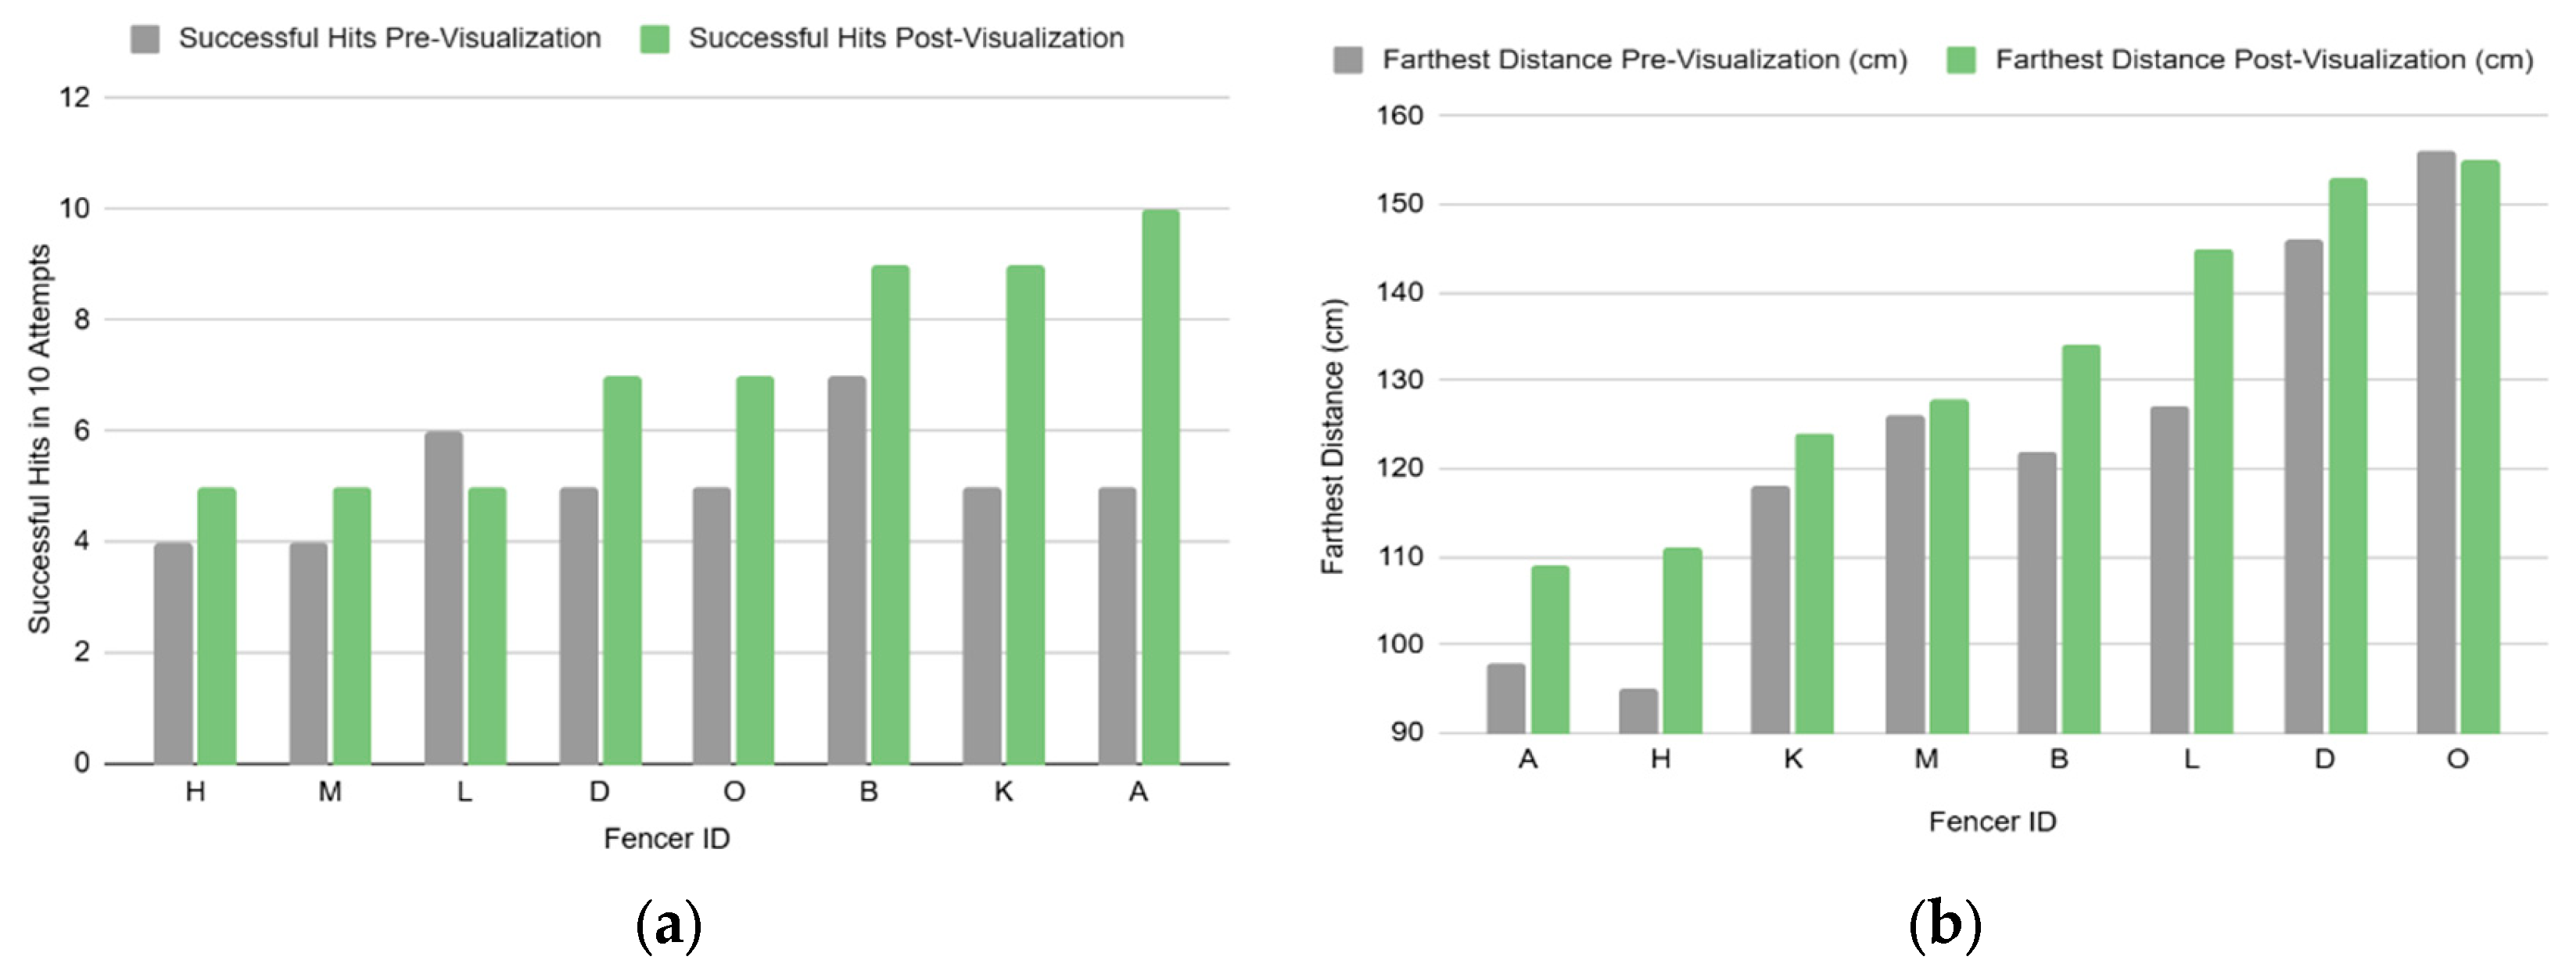
Figure 5.
(a) Point Control Analysis in Fencers with More than Four Years of Training. (b) Lunge Distance Analysis in Fencers with More than Four Years of Training.
Figure 5.
(a) Point Control Analysis in Fencers with More than Four Years of Training. (b) Lunge Distance Analysis in Fencers with More than Four Years of Training.
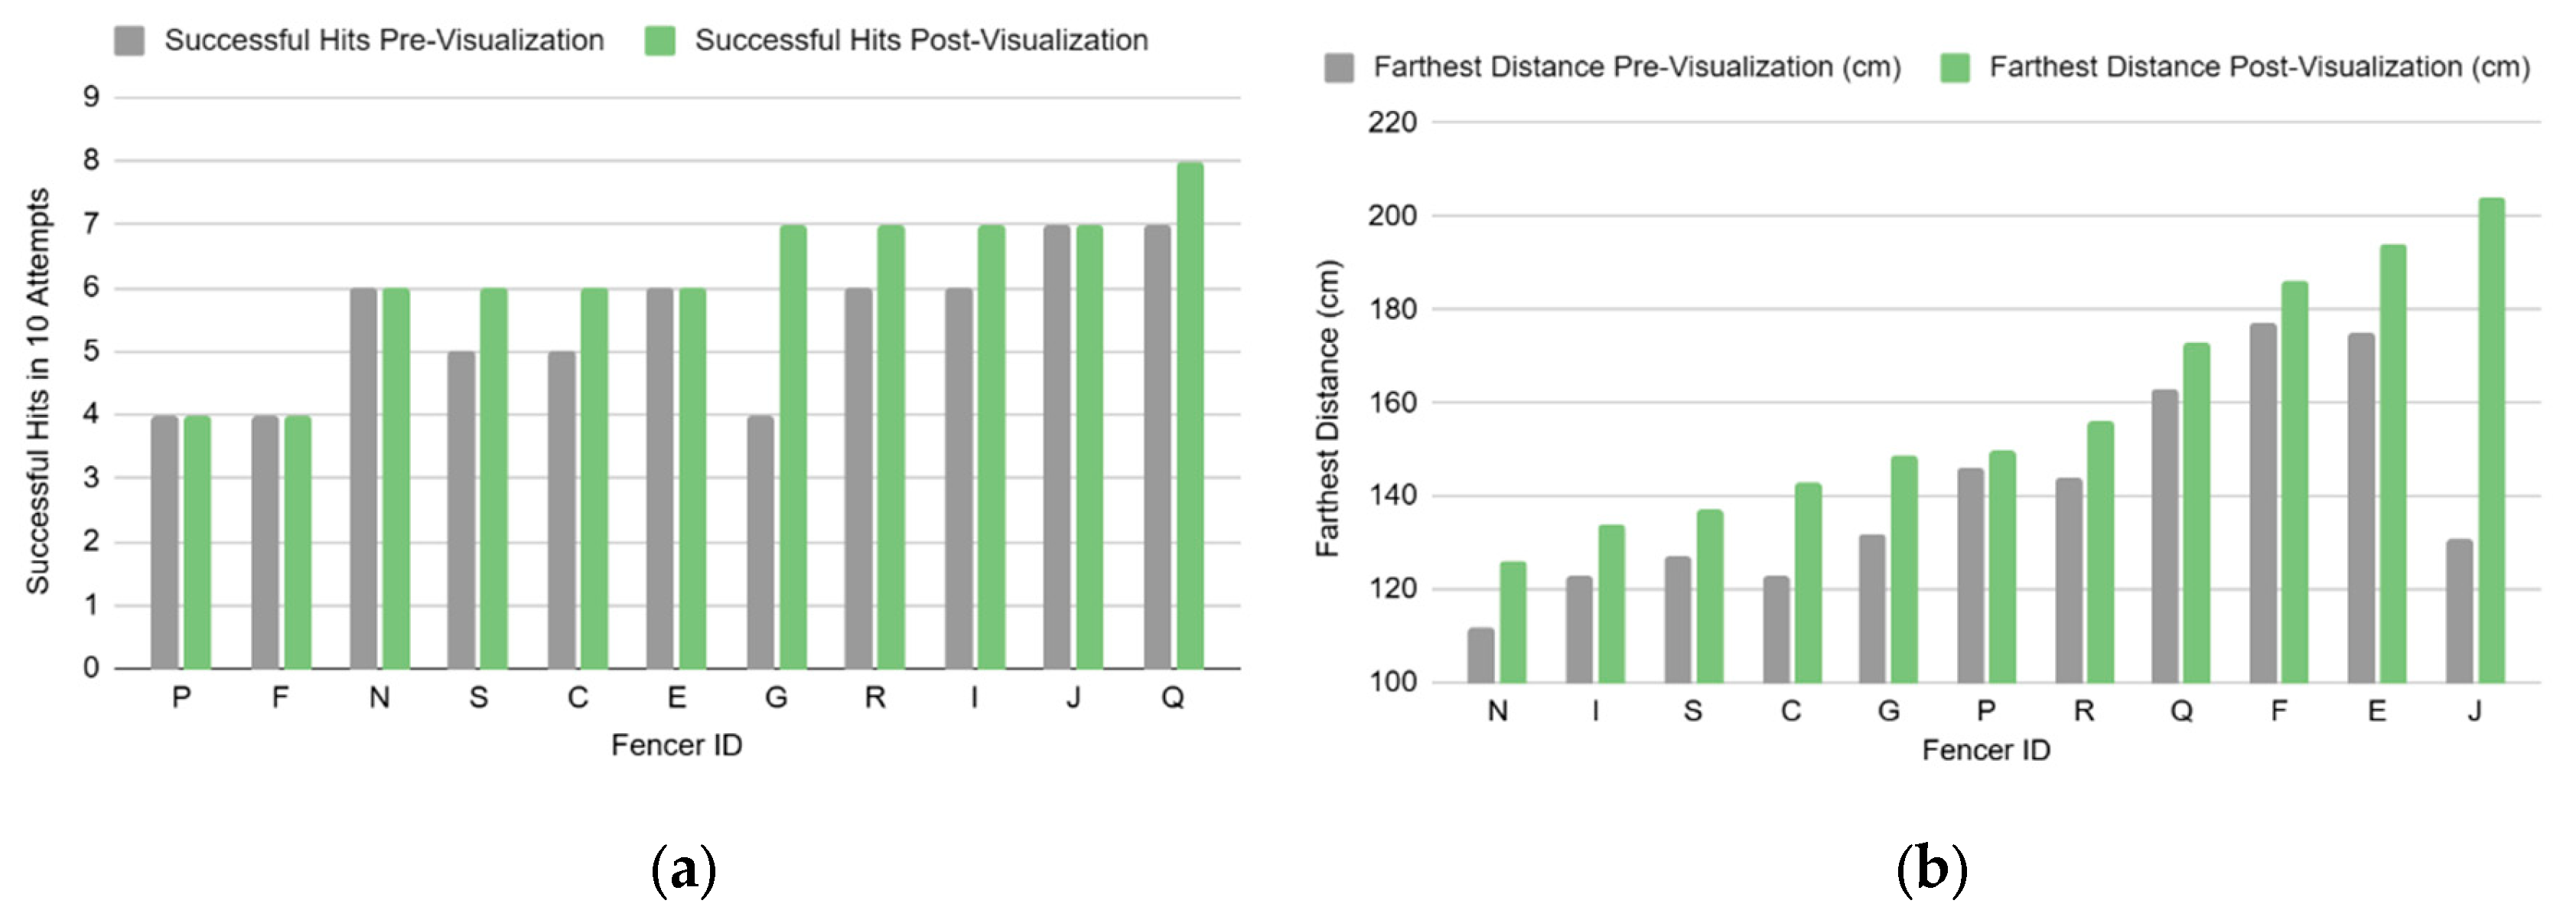

Table 2.
Point Control Data for Fencers with Less than Four Years of Training.
| Fencer ID | Pre | Post | Difference | Percent Improvement |
|---|---|---|---|---|
| Fencer H | 4 | 5 | 1 | 25.00% |
| Fencer M | 4 | 5 | 1 | 25.00% |
| Fencer L | 6 | 5 | -1 | -16.67% |
| Fencer D | 5 | 7 | 2 | 40.00% |
| Fencer O | 5 | 7 | 2 | 40.00% |
| Fencer B | 7 | 9 | 2 | 28.57% |
| Fencer K | 5 | 9 | 4 | 80.00% |
| Fencer A | 5 | 10 | 5 | 100.00% |
| Average | 5.1 | 7.1 | 2.0 | 39.0% |
Table 3.
Lunge Distance Data for Fencers with Less than Four Years of Training.
| Fencer ID | Pre | Post | Difference | Percent Improvement |
|---|---|---|---|---|
| Fencer A | 98 | 109 | 11 | 11.22% |
| Fencer H | 95 | 111 | 16 | 16.84% |
| Fencer K | 118 | 124 | 6 | 5.08% |
| Fencer M | 126 | 128 | 2 | 1.59% |
| Fencer B | 122 | 134 | 12 | 9.84% |
| Fencer L | 127 | 145 | 18 | 14.17% |
| Fencer D | 146 | 153 | 7 | 4.79% |
| Fencer O | 156 | 155 | -1 | -0.64% |
| Average | 123.5 | 132.4 | 8.9 | 7.2% |
Table 4.
Point Control Data for Fencers with More than Four Years of Training.
| Fencer ID | Pre | Post | Difference | Percent Improvement |
|---|---|---|---|---|
| Fencer P | 4 | 4 | 0 | 0.00% |
| Fencer F | 4 | 4 | 0 | 0.00% |
| Fencer N | 6 | 6 | 0 | 0.00% |
| Fencer S | 5 | 6 | 1 | 20.00% |
| Fencer C | 5 | 6 | 1 | 20.00% |
| Fencer E | 6 | 6 | 0 | 0.00% |
| Fencer G | 4 | 7 | 3 | 75.00% |
| Fencer R | 6 | 7 | 1 | 16.67% |
| Fencer I | 6 | 7 | 1 | 16.67% |
| Fencer J | 7 | 7 | 0 | 0.00% |
| Fencer Q | 7 | 8 | 1 | 14.29% |
| Average | 5.5 | 6.2 | 0.7 | 14.8% |
Table 5.
Lunge Distance Data for Fencers with More than Four Years of Training
| Fencer ID | Pre | Post | Difference | Percent Improvement |
|---|---|---|---|---|
| Fencer N | 112 | 126 | 14 | 12.50% |
| Fencer I | 123 | 134 | 11 | 8.94% |
| Fencer S | 127 | 137 | 10 | 7.87% |
| Fencer C | 123 | 143 | 20 | 16.26% |
| Fencer G | 132 | 149 | 17 | 12.88% |
| Fencer P | 146 | 150 | 4 | 2.74% |
| Fencer R | 144 | 156 | 12 | 8.33% |
| Fencer Q | 163 | 173 | 10 | 6.13% |
| Fencer F | 177 | 186 | 9 | 5.08% |
| Fencer E | 175 | 194 | 19 | 10.86% |
| Fencer J | 131 | 204 | 73 | 55.73% |
| Average | 141.2 | 159.3 | 18.1 | 12.8% |
Control Group
The control group performed the same pre- and post-tests without visualization training. Results showed minimal or negative changes:
Between Group Comparisons
Comparisons between the visualization and control groups showed significant differences (Figure 6).
- Lunge Distance: Improvements in the visualization group were also significantly greater than those in the control group (p = 0.0078).
4. Discussion
This study investigated whether a brief visualization exercise could enhance two key fencing skills—point control and lunge distance—and whether these effects varied by level of training experience. The findings indicate that visualization enhances fencing performance, but the nature of these benefits depends on both the fencer’s level of expertise and the type of technical skill.
Visualization and Point Control
Visualization significantly improved point control, with fencers increasing their average number of successful strikes by 25.5%. This effect was most pronounced in less experienced athletes (<4 years), who improved by 39.0% compared to only 14.8% in more experienced athletes. These results support the idea that novices, who are still forming stable motor representations unique to sport, gain more from mental rehearsal of fine motor skills. Imagery strengthens neural pathways associated with precision movements, enabling athletes to consolidate technical accuracy even without physical practice [3,4,13].
Visualization and Lunge Distance
Unlike point control, improvements in lunge distance were greater among more experienced fencers. While novices showed modest gains (7.2%), experienced fencers improved their reach by an average of 12.8%. These findings align with prior research suggesting that athletes with well-established motor schemas can utilize imagery to refine explosive movements by enhancing proprioceptive awareness, muscular coordination, and timing [5,16].
Comparison with Control Group
The inclusion of a control group confirmed that the observed benefits were not due to natural improvements from repeated testing. Control participants showed no meaningful gains in point control and only minimal improvement in lunge distance, in contrast to the significant improvements in the visualization group. This strengthens the conclusion that visualization was the key factor in driving performance gains. Similar patterns have been observed in other sports, where even brief imagery interventions led to measurable improvements in skill performance [7,17].
Practical Applications
These findings highlight the value of tailoring visualization exercises to the athlete’s developmental stage. For novices, emphasizing imagery of precise blade control may accelerate the acquisition of technical skills. For experienced athletes, focusing on explosive and dynamic actions such as the lunge may refine already well-developed motor patterns. Importantly, visualization requires no equipment and is time-efficient, making it an accessible tool for daily training sessions.
Limitations and Future Directions
Several limitations should be acknowledged. The sample size was modest, and while point control improvements reached statistical significance, lunge distance did not achieve significance across all participants. Visualization sessions were standardized and brief, which may not fully account for individual differences in imagery ability. Previous research has shown that interference during imagery can influence outcomes, highlighting the importance of considering imagery quality and cognitive load [23]. Furthermore, as with all small-sample experimental designs, results must be interpreted cautiously in light of potential biases and analytic challenges [24]. Future research should explore longer-term interventions, personalized imagery scripts, and interactions with psychological variables such as confidence and attentional control. Neuroimaging studies could further clarify the neural mechanisms of visualization in fencing, building on past research that demonstrates sport-specific brain adaptations [9,12].
5. Conclusions
Overall, this study provides evidence that even short visualization exercises can improve fencing performance. The specific benefits vary with training experience—point control gains being most prominent in novices and lunge distance gains in experienced athletes. By integrating targeted visualization into practice routines, coaches may be able to accelerate skill acquisition, optimize performance, and complement traditional physical training methods.
Author Contributions
First Author: Troy Song is affiliated with Brain Peace Science Foundation, New Haven, CT, USA. Troy Song’s contributions include conceptualization, methodology development, experiment design and data collection, data analysis, and the manuscript drafting. Second Author: Adam Liu is affiliated with the Brain Peace Science Foundation, New Haven, CT, USA. Adam Liu’s contributions include assisting with data collection, manuscript figure preparation, and manuscript drafting. Third Author (Corresponding Author): Kun Liu, PhD, is affiliated with Yale School of Medicine, Department of Psychiatry; Brain Peace Science Foundation, New Haven, CT, USA. Dr. Liu conceived and supervised the study, guided data analysis, and revised the manuscript. Correspondence: Kun Liu, PhD, Department of Psychiatry, Yale School of Medicine, Brain Peace Science Foundation, 178 Cold Spring Street, New Haven, CT 06511, USA, Email: kun.liu@yale.edu.
Data Availability Statement
The datasets generated and analyzed during the current study are available from the corresponding author on reasonable request. Due to privacy considerations, individual fencer identifiers have been anonymized.
Acknowledgments
We gratefully acknowledge LEO Fencing Club and Rogue Fencing Academy providing access to fencing facilities and equipment used in this study. We also thank the Brain Peace Science Foundation (BPSF) for the institutional support. All authors (Troy Song, Adam Liu, and Kun Liu) are affiliated with BPSF. Their roles in study design, data collection, analysis, and manuscript preparation were conducted as part of their research activities within BPSF.
Conflict of Interest
All authors are affiliated with the Brain Peace Science Foundation (BPSF), which also provided funding for this study. The authors affirm that this dual role of BPSF as funder and institutional home does not constitute a conflict of interest. No commercial or financial relationships influenced the study outcomes.
Ethics Statement
This study involved non-invasive testing of fencing skills in voluntary participants. All participants, or their legal guardians in the case of minors, provided informed consent before taking part. No personal identifying information was collected, and all data were anonymized for analysis. As the study did not involve medical intervention, biological sampling, or sensitive personal information, formal institutional review board (IRB) approval was not required under prevailing guidelines.
References
- Guillot A, Moschberger K, Collet C. Coupling movement with imagery as a new perspective for motor imagery practice. Behav Brain Res. 2018;336:121–32. [CrossRef]
- MacIntyre T, Moran A, Collet C, Guillot A. An emerging paradigm: A strength-based approach to exploring mental imagery in sport. J Appl Sport Psychol. 2008;20(4):459–71.
- Simonsmeier BA, Buecker S, Schneider M, Stricker J. The effects of mental imagery on skill acquisition and performance: A meta-analysis. Psychol Bull. 2025;151(1):25–46. [CrossRef]
- Rolstad LA, Giske R, Sigmundsson H. Mental imagery and skill acquisition in novice athletes: A longitudinal perspective. Front Sports Act Living. 2022;4:873421.
- Khatra O, Shadgan A, Taunton J, Pakravan A, Shadgan B. A bibliometric analysis of the top cited articles in sports and exercise medicine. Orthop J Sports Med. 2021;9(1). [CrossRef]
- Park I, Jeon J. Psychological skills training for athletes in sports: Web of Science bibliometric analysis. Healthcare. 2023;11(2):259. [CrossRef]
- Hall C, Mack D, Paivio A, Hausenblas H. Imagery use by athletes: Development of the Sport Imagery Questionnaire. Int J Sport Psychol. 2008;29(1):73–89.
- Hijazi MM. Attention, visual perception and their relationship to sport performance in fencing. J Hum Kinet. 2013;39:195–201. [CrossRef]
- Cordani C, Preziosa P, Gatti R, Castellani C, Filippi M, Rocca MA. Mapping brain structure and function in professional fencers: A model to study training effects on central nervous system plasticity. Hum Brain Mapp. 2022;43(11):3375–85. [CrossRef]
- Williams LR, Walmsley A. Response amendment in fencing: Differences between elite and novice subjects. Percept Mot Skills. 2000;91(1):131–42. [CrossRef]
- Witkowski M, Bojkowski Ł, Karpowicz K, Konieczny M, Bronikowski M, Tomczak M. Effectiveness and durability of transfer training in fencing. Int J Environ Res Public Health. 2020;17(3):849. [CrossRef]
- Feng Y, Zhou C-L, Zhang J-C, Tian M-L. Neural mechanisms of intuitive tactical decision-making predominance of high-level fencing athletes. J Med Biol Eng. 2010;30(1):47–56.
- Jose J, Joseph M, Matha M. Imagery: Its effects and benefits on sports performance and psychological variables: A review study. Int J Physiol. 2018;3(2):190–3.
- Milley KR, Ouellette GP. Putting attention on the spot in coaching: Shifting to an external focus of attention with imagery techniques to improve basketball free-throw shooting performance. Front Psychol. 2021;12:645676. [CrossRef]
- Prasomsri J, Thueman B, Yuenyong P, Thongnoon C, Khophongphaibun N, Ariyawatcharin S. Effectiveness of motor imagery on sports performance in football players: A randomized control trial. Hong Kong Physiother J. 2024;44(1):29–37. [CrossRef]
- Schack T, Essig K, Frank C, Koester D. Mental representation and motor imagery training. Front Hum Neurosci. 2014;8:328. [CrossRef]
- Di Corrado D, Guarnera M, Guerrera CS, Maldonato NM, Di Nuovo S, Castellano S, et al. Mental imagery skills in competitive young athletes and non-athletes. Front Psychol. 2020;11:633. [CrossRef]
- Mulder T. Motor imagery and action observation: Cognitive tools for rehabilitation. J Neural Transm. 2007;114(10):1265–78. [CrossRef]
- Pearson DG, Deeprose C, Wallace-Hadrill SM, Burnett Heyes S, Holmes EA. Assessing mental imagery in clinical psychology: A review of imagery measures and a guiding framework. Clin Psychol Rev. 2013;33(1):1–23. [CrossRef]
- Turner A, Marshall G, Phillips J, Noto A, Buttigieg C, Chavda S, et al. Physical characteristics underpinning repetitive lunging in fencing. J Strength Cond Res. 2016;30(11):3134–9. [CrossRef]
- Watanabe R, Takahiro H. Behavioral advantages of the first-person perspective model for imitation. Front Psychol. 2016;7:701. [CrossRef]
- Isaac AR, Marks DF. Individual differences in mental imagery experience: Developmental changes and specialization. Br J Psychol. 1994;85(4):479–500. [CrossRef]
- Quinn JG, McConnell J. The interval for interference in conscious visual imagery. Memory. 2006;14(2):241–52. [CrossRef]
- Brown AW, Kaiser KA, Allison DB. Issues with data and analyses: Errors, underlying themes, and potential solutions. Proc Natl Acad Sci USA. 2018;115(11):2563–70. [CrossRef]
- USA Fencing. Age classification eligibility. USA Fencing. Published September 13, 2025. Accessed September 13, 2025. https://www.usafencing.org/age-classification-eligibility.
Figure 1.
(a) Distribution of Age Among Tested Fencers. (b) Distribution of Years of Fencing Experience Among Tested Fencers. (c) Distribution of Gender among Tested Fencers. (d) Distribution of USA Fencing Age Classification among Tested Fencers [22].
Figure 1.
(a) Distribution of Age Among Tested Fencers. (b) Distribution of Years of Fencing Experience Among Tested Fencers. (c) Distribution of Gender among Tested Fencers. (d) Distribution of USA Fencing Age Classification among Tested Fencers [22].
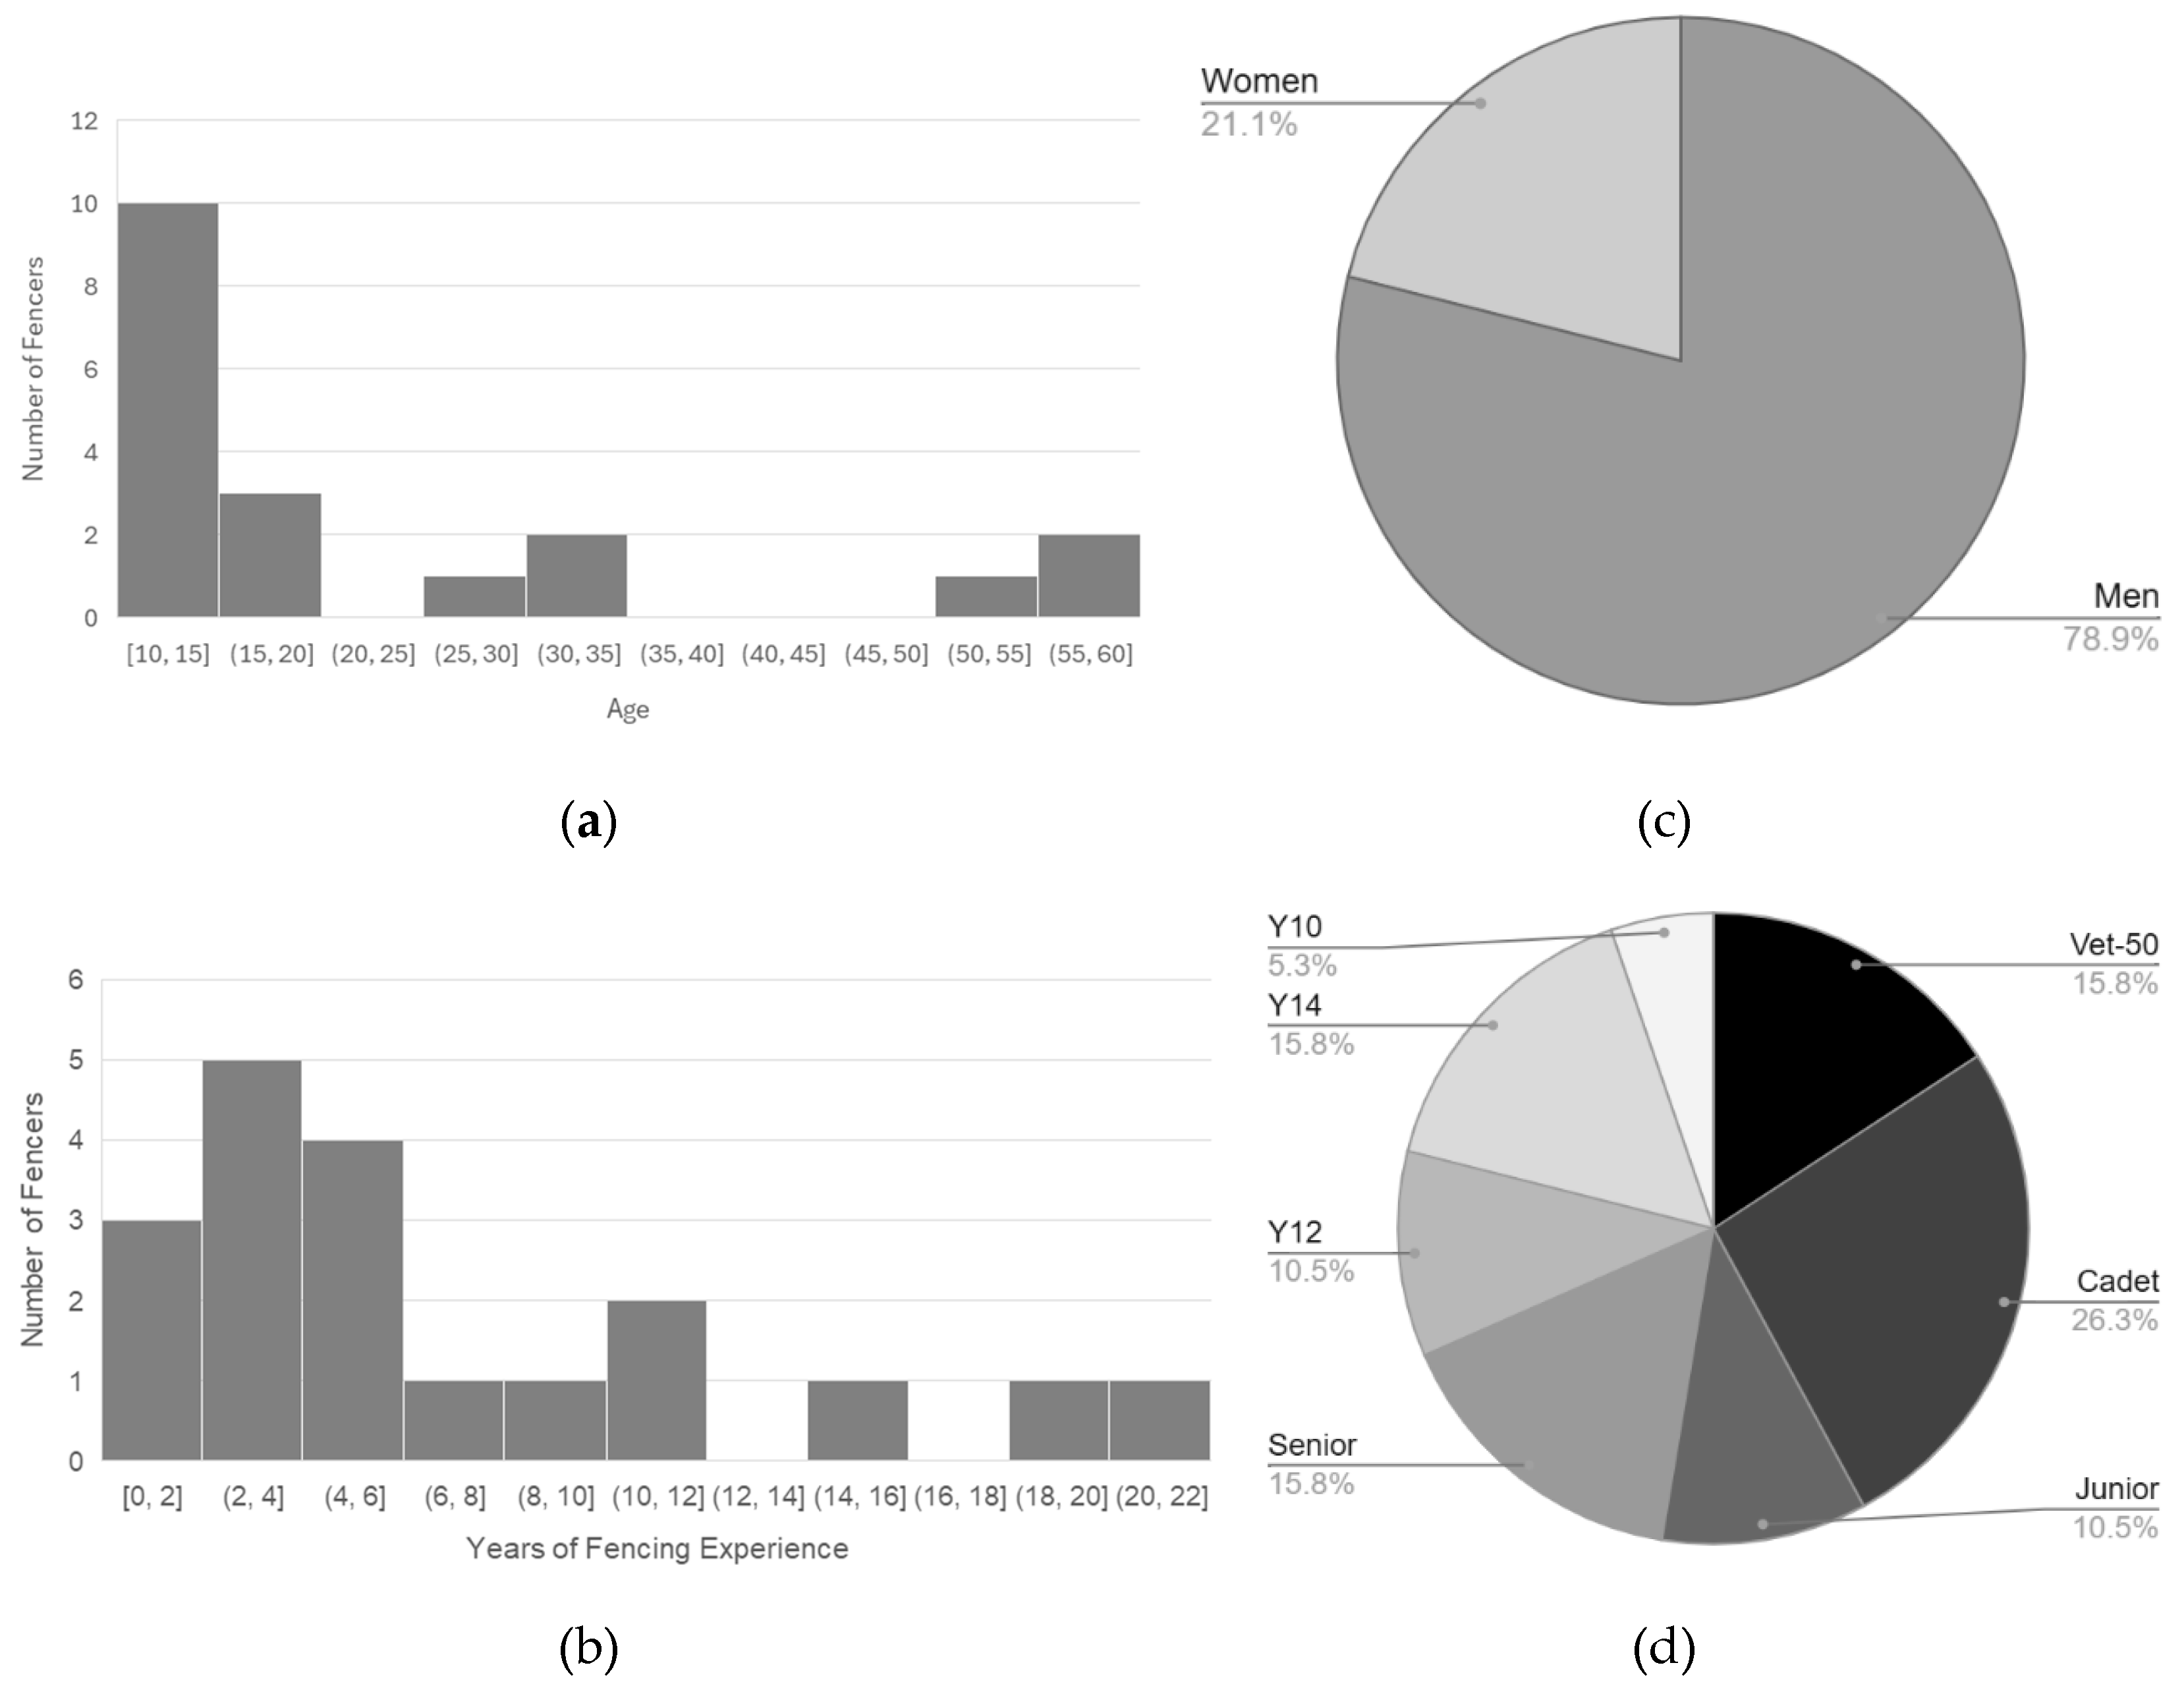
Figure 2.
Average successful hits among 19 fencers. The left bar represents the results from pre-visualization, while the right bar represents the results from post-visualization. Error bars are the standard deviation. t-test (p-value: 0.00780924).
Figure 2.
Average successful hits among 19 fencers. The left bar represents the results from pre-visualization, while the right bar represents the results from post-visualization. Error bars are the standard deviation. t-test (p-value: 0.00780924).
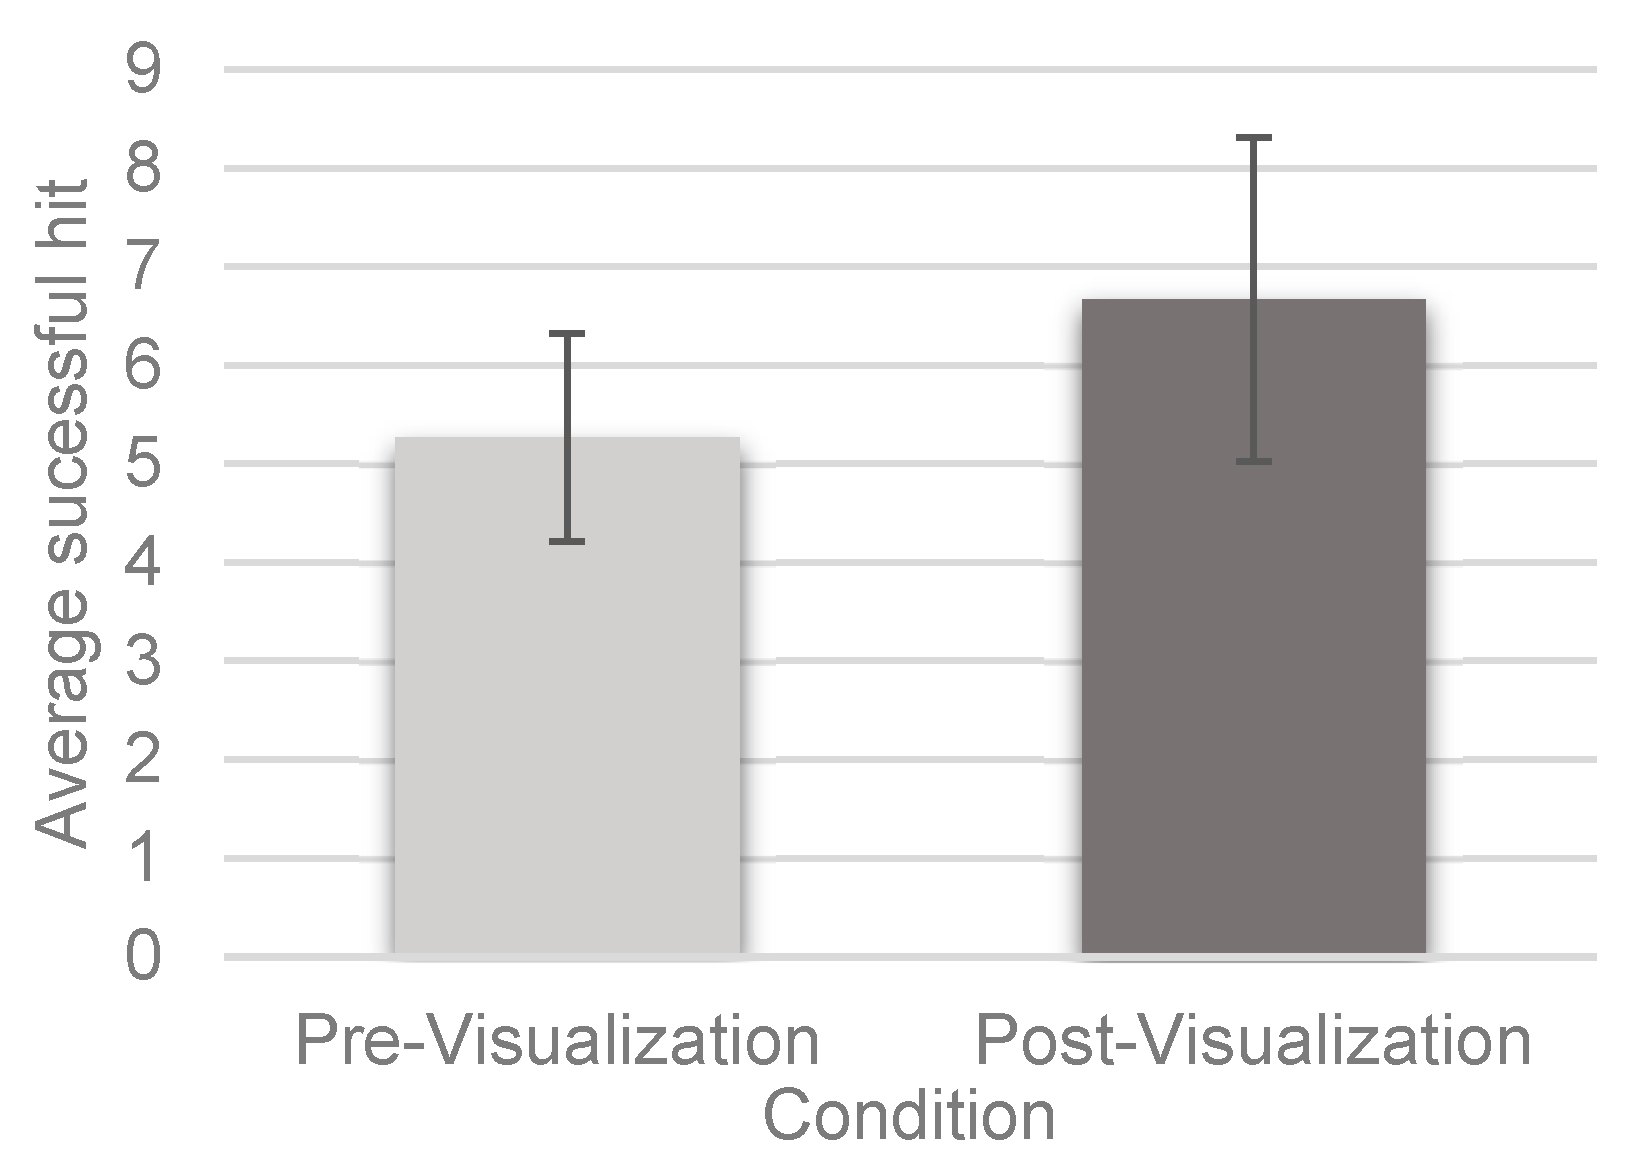
Figure 3.
Average distance among 19 fencers. The left bar represents the results from pre-visualization, while the right bar represents the results from post-visualization. Error bars are the standard deviation. t-test (p-value: 0.08299625).
Figure 3.
Average distance among 19 fencers. The left bar represents the results from pre-visualization, while the right bar represents the results from post-visualization. Error bars are the standard deviation. t-test (p-value: 0.08299625).
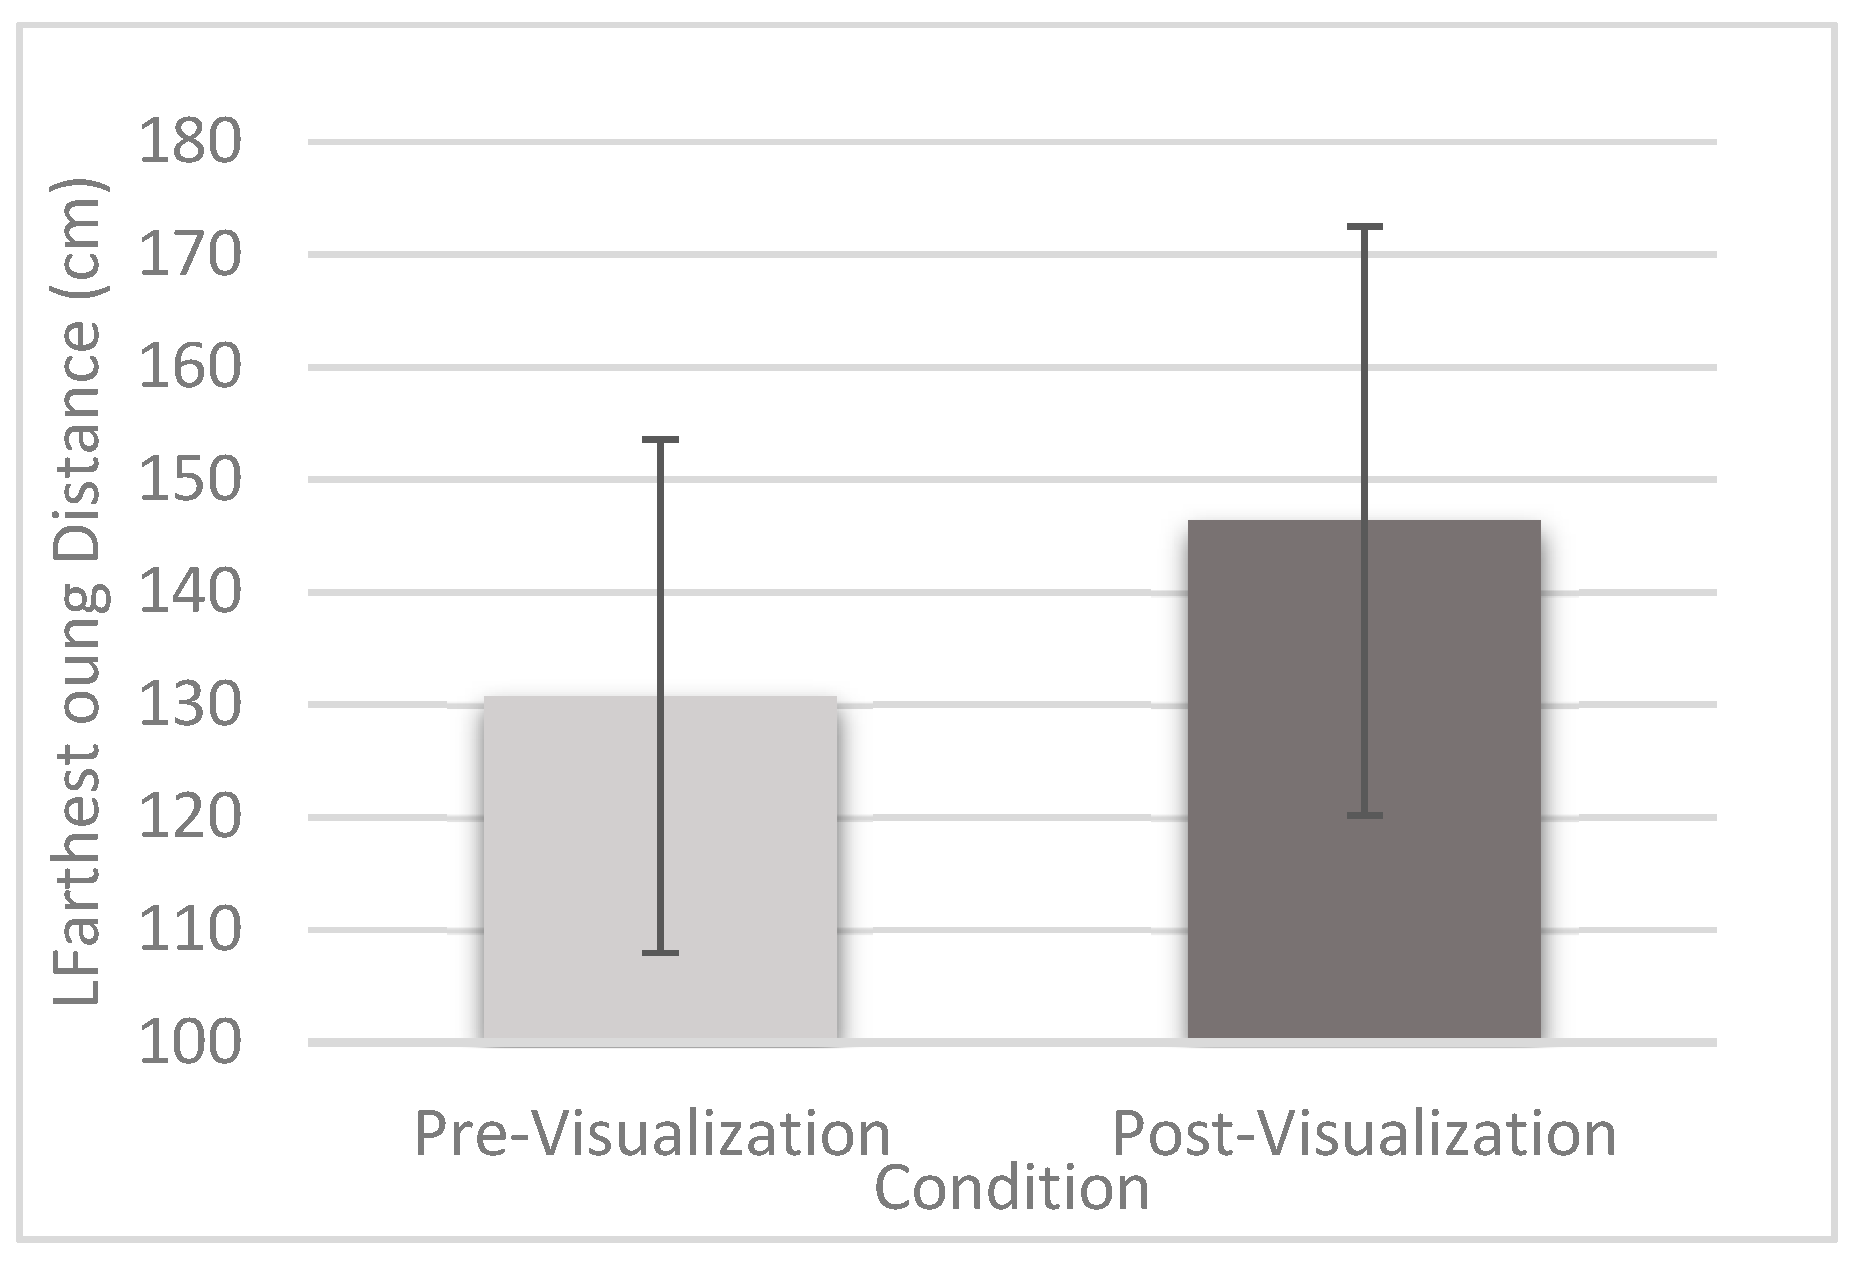
Figure 6.
The Test group shows a much higher average improvement in both metrics: point control and lunge distance. The red lines in the box plots represent the median; Blue Xs represent the mean, and gray boxes represent the interquartile range (IQR). (a) The percentage improvement between the Control Group and Test Group in the Point Control test. The Control group has wide variability and several negative performances in Point Control. t-test (p-value: 0.00267). (b) Average percent improvement between the Control Group and Test Group in the Lunge Distance test. t-test (p-value: 0.00783).
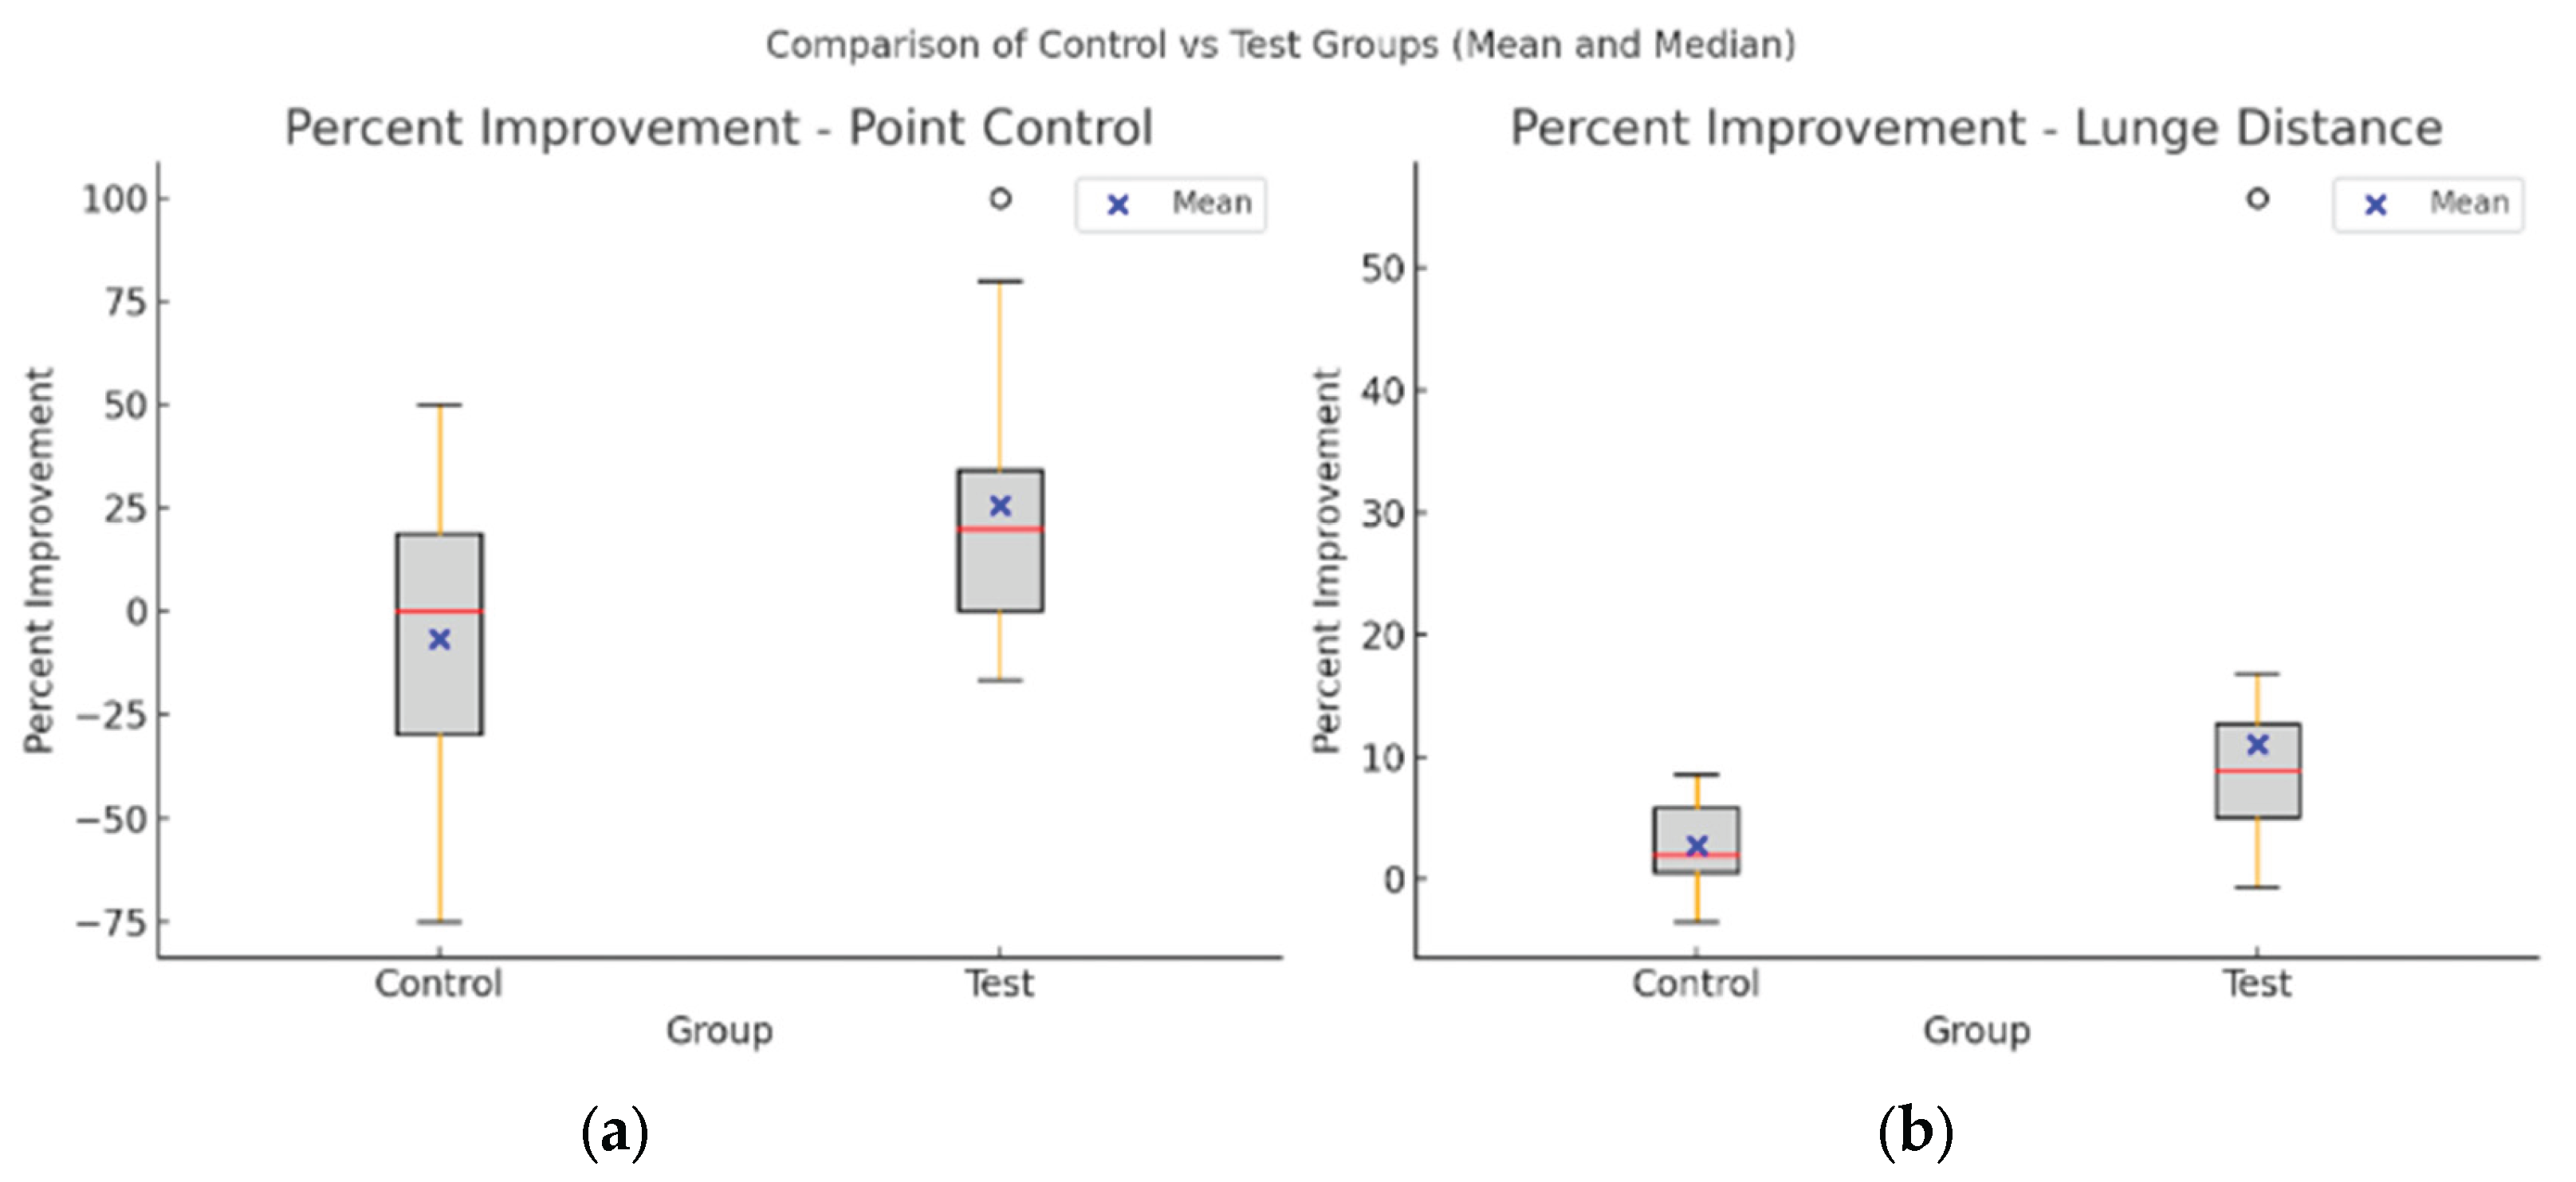
Table 1.
Results of point control and lunge distance tests before and after visualization. The actual names of fencers are not shown for privacy reasons. The calculated averages are shown at the bottom. The difference is the post-data minus pre-data. The definition of the “%” in the table is the percent improvement between “pre” and “post.”.
| Fencer ID | Point Control | Lunge Distance (cm) | ||||||
|---|---|---|---|---|---|---|---|---|
| Pre | Post | Difference | % | Pre | Post | Difference | % | |
| A | 5 | 10 | 5 | 100.00% | 98 | 109 | 11 | 11.22% |
| B | 7 | 9 | 2 | 28.57% | 122 | 134 | 12 | 9.84% |
| C | 5 | 6 | 1 | 20.00% | 123 | 143 | 20 | 16.26% |
| D | 5 | 7 | 2 | 40.00% | 146 | 153 | 7 | 4.79% |
| E | 6 | 6 | 0 | 0.00% | 175 | 194 | 19 | 10.86% |
| F | 4 | 4 | 0 | 0.00% | 177 | 186 | 9 | 5.08% |
| G | 4 | 7 | 3 | 75.00% | 132 | 149 | 17 | 12.88% |
| H | 4 | 5 | 1 | 25.00% | 95 | 111 | 16 | 16.84% |
| I | 6 | 7 | 1 | 16.67% | 123 | 134 | 11 | 8.94% |
| J | 7 | 7 | 0 | 0.00% | 131 | 204 | 73 | 55.73% |
| K | 5 | 9 | 4 | 80.00% | 118 | 124 | 6 | 5.08% |
| L | 6 | 5 | -1 | -16.67% | 127 | 145 | 18 | 14.17% |
| M | 4 | 5 | 1 | 25.00% | 126 | 128 | 2 | 1.59% |
| N | 6 | 6 | 0 | 0.00% | 112 | 126 | 14 | 12.50% |
| O | 5 | 7 | 2 | 40.00% | 156 | 155 | -1 | -0.64% |
| P | 4 | 4 | 0 | 0.00% | 146 | 150 | 4 | 2.74% |
| Q | 7 | 8 | 1 | 14.29% | 163 | 173 | 10 | 6.13% |
| R | 6 | 7 | 1 | 16.67% | 144 | 156 | 12 | 8.33% |
| S | 5 | 6 | 1 | 20.00% | 127 | 137 | 10 | 7.87% |
| Average | 5.3 | 6.7 | 1.4 | 25.50% | 130.7 | 146.3 | 15.6 | 11.06% |
Table 6.
Results of point control and lunge distance tests in the control group. The actual names of fencers are not shown for privacy reasons. The calculated averages are shown at the bottom. The difference is the post data minus pre data. The definition of the “%” in the table is the percent improvement between “pre” and “post.”.
| Control ID | Point Control | Lunge Distance (cm) | ||||||
|---|---|---|---|---|---|---|---|---|
| First | Second | Difference | % | First | Second | Difference | % | |
| A | 5 | 3 | -2 | -40.00% | 129 | 132 | 3 | 2.33% |
| B | 6 | 5 | -1 | -16.67% | 156 | 165 | 9 | 5.77% |
| C | 7 | 6 | -1 | -14.29% | 122 | 124 | 2 | 1.64% |
| D | 7 | 5 | -2 | -28.57% | 128 | 131 | 3 | 2.34% |
| E | 4 | 1 | -3 | -75.00% | 146 | 157 | 11 | 7.53% |
| F | 3 | 3 | 0 | 0.00% | 130 | 131 | 1 | 0.77% |
| G | 7 | 4 | -3 | -42.86% | 110 | 109 | -1 | -0.91% |
| H | 4 | 4 | 0 | 0.00% | 140 | 148 | 8 | 5.71% |
| I | 4 | 2 | -2 | -50.00% | 102 | 101 | -1 | -0.98% |
| J | 3 | 4 | 1 | 33.33% | 119 | 120 | 1 | 0.84% |
| K | 6 | 7 | 1 | 16.67% | 139 | 141 | 2 | 1.44% |
| L | 6 | 9 | 3 | 50.00% | 141 | 143 | 2 | 1.42% |
| M | 6 | 4 | -2 | -33.33% | 101 | 108 | 7 | 6.93% |
| N | 4 | 5 | 1 | 25.00% | 81 | 86 | 5 | 6.17% |
| O | 7 | 9 | 2 | 28.57% | 120 | 119 | -1 | -0.83% |
| P | 10 | 9 | -1 | -10.00% | 61 | 63 | 2 | 3.28% |
| Q | 8 | 8 | 0 | 0.00% | 45 | 48 | 3 | 6.67% |
| R | 8 | 8 | 0 | 0.00% | 35 | 38 | 3 | 8.57% |
| S | 8 | 10 | 2 | 25.00% | 58 | 56 | -2 | -3.45% |
| T | 9 | 9 | 0 | 0.00% | 39 | 39 | 0 | 0.00% |
| Average | 6.1 | 5.75 | -0.35 | -6.61% | 105.1 | 107.95 | 2.85 | 2.76% |
Disclaimer/Publisher’s Note: The statements, opinions and data contained in all publications are solely those of the individual author(s) and contributor(s) and not of MDPI and/or the editor(s). MDPI and/or the editor(s) disclaim responsibility for any injury to people or property resulting from any ideas, methods, instructions or products referred to in the content. |
© 2025 by the authors. Licensee MDPI, Basel, Switzerland. This article is an open access article distributed under the terms and conditions of the Creative Commons Attribution (CC BY) license (http://creativecommons.org/licenses/by/4.0/).
Copyright: This open access article is published under a Creative Commons CC BY 4.0 license, which permit the free download, distribution, and reuse, provided that the author and preprint are cited in any reuse.


